vacuum pyrolysis process for remediation of hydrocarbon-contaminated soils
TRANSCRIPT

Vacuum Pyrolysis Process for Remediation of Hydrocarbon- Contaminated Soils
Christian Roy Bruno de Caumia Daniel Blanchette Hooshang Pakdel Genevihe Couture Annette E. Schwerdfger
Cbtistian Roy, Pb.A, is a W f e s s o r of cbemicol engineHng at U n i w s i t d
a d is a 1994 nciphnt of tbe Natural sclcmcs and Engineering Reseancb Coundl G#ahc E W.R Steacie A w a d atuno de Caumia, M.ScA, and Duniel&hncbetrc, RScA, areprocess engineers at
U r J h W M -
Pyrovac InsHtute Im, h sraery,aucbcc Hoarbang P-4 Pb.A, Cenevi&e Cortun, M.Sc., andAnnette Skbwerdfegw, Pb.A, a m cbendsts witb Pyrovac Insntnte.
A vacuumpymlysisprocess was used for the remediiation of hydrocar- bo-contaminated soils from "Les Vidangeun & Montrgal" site in Mascouche in the province of Q&bec, near Montdal. Ten samples were tested on a laboratoty scale batch reactor, and onesampk was tested on a pmto&Depmcess deYelopment unit. Theprocess issimpk, e m fent, reliable, andeconomically competitive with OtherexWng technologies. nevacuum pyt'olysfsprocess eDck?ntly mated soils contaminated with a varlery of pollution levels and types, i-ective of the soil maffx, pnnJiding mated soils meeting the A criterion (noncontaminated, residentiul h e 0 of the Ministry of Environment Qu@bec ( M W @ . Thepy?vlytic oil and the noncondenr;ablepyrolyticgases can be used as makeupjkl in theprocess, because they have a high calorijic value and their combtlstion should not pweanyemlssionproblm. The waterphaseefluentmust be treated before discharge.
Around the world, hazardous wastes and contaminated soils have become a major environmental concern. Over the last five years, the traditional treatment of contaminated soils by incineration has been challenged by thermal separation techniques, which frequently involved a rotary kiln or a conveyor kiln. In these thermal pyrolytic processes, the contaminants may be removed by vaporization at high temperature a n d or by a continuous stream of hot inert gas. An extensive review of North American demonstration and commercial cleanup methods for hazardous waste sites can be found in the literamre (U.S. EPA, 1992; Centre Saint- Laurent, 1993). A few examples of thermal pyrolytic processes for the treatment of contaminated soils are given below.
Rotary kilns were initially used for incineration, but have since been used in less destructive thermal techniques. Some of the North American processes operating with a rotary kiln since 1992 are described here. The anaerobic thermal processor (U.S. EPA, 1992; Air and Waste Management Association, 1993) treats soils at 600" C in a 25 tonshrunit. In the X ' W process (US. EPA, 1992), the contaminants are volatilized by a continuous N, stream at 500" C in a 7 tonshr unit. The low temperature thermal aeration process ( U S . EPA, 1992; Air and Waste Management Association,
CCC 1051-5658/94/0501111-20 0 1994 John Wiley & Sons. Inc.
111

1393) uses a continuous stream of hot air to volatilize the contaminants. Some European methods also use a rotary kiln. In the Babcock process
(Deutsche Babcock Anlagen), the volatilized contaminants are burned and 50 percent of the gas is recycled as makeup fuel. The Ecotechniek BV (Reintjes, 1985) and the Siemens process (Bege and Meininger, 1989) both use two kilns. In the Ecotechniek BV, the combustion of the gases produced in the first reactor is used to heat the second reactor. In addition, a part of the hot soil exiting the second reactor is reintroduced into the frrst reactor to heat the soils entering the system. In the second kiln used in the Siemens process, organic compounds are oxidized by a stream of hot gas consisting of N,, CO, and 0,. In the NBM process (De Leur, 1988), the amount of oxygen in the kiln’s atmosphere is controlled. The reactor walls are heated to a temperature that will cause spontaneous combustion of the pyrolytic products to consume the oxygen that is present. These four European methods all use temperatures as high as 1000° C.
The use of conveyor kilns is not as widespread as that of the rotary kiln. Two examples of North American processes were demonstrated in 1991. The low temperature thermal treatment L’PR (U.S. EPA, 1992; Air and Waste Management Association, 1993) uses a system of parallel screws to move the weakly contaminated soils forward. The amount of oxygen in the kiln’s atmosphere is controlled to prevent explosions. The solid waste desorp- tion process (U.S. EPA, 1992) uses superheated steam as a continuous conveying and stripping gas. The contaminated water phase is subse- quently treated.
One of the main advantages of the rotary kiln is its ability to treat a large variety of wastes, both solid and liquid. Conveyor kilns using screws and paddles are used to treat sludges and relatively solid material. A limitation of some of these reactors is the need to attain rather high temperatures for efficient treatment. The use of a carrier gas is also inconvenient, as it necessitates a subsequent treatment or separation of the particles and contaminants contained in the carrier gas.
Thus, it would be advantageous to design a reactor that combines the strong points of both systems-i.e, treats a large variety of wastes, permits a rather precise control of temperature and pressure, does not require a high operating temperature or a carrier gas, and is more energy-efficient.
In this article, we would like to describe a reactor with a new configura- tion, specially developed for the treatment of soils contaminated with organic material. However, the kiln’s inside configuration cannot be revealed at this point, as a patent describing the reactor has been claimed by the developing company, Pyrovac International Inc., in. Quebec, Canada.
The cunount of ozygen in the kiln’s atmosphere is controzZed topreuenf explosions.
THEEXPERIMENT Eleven soil samples were collected at the Mascouche site “Les
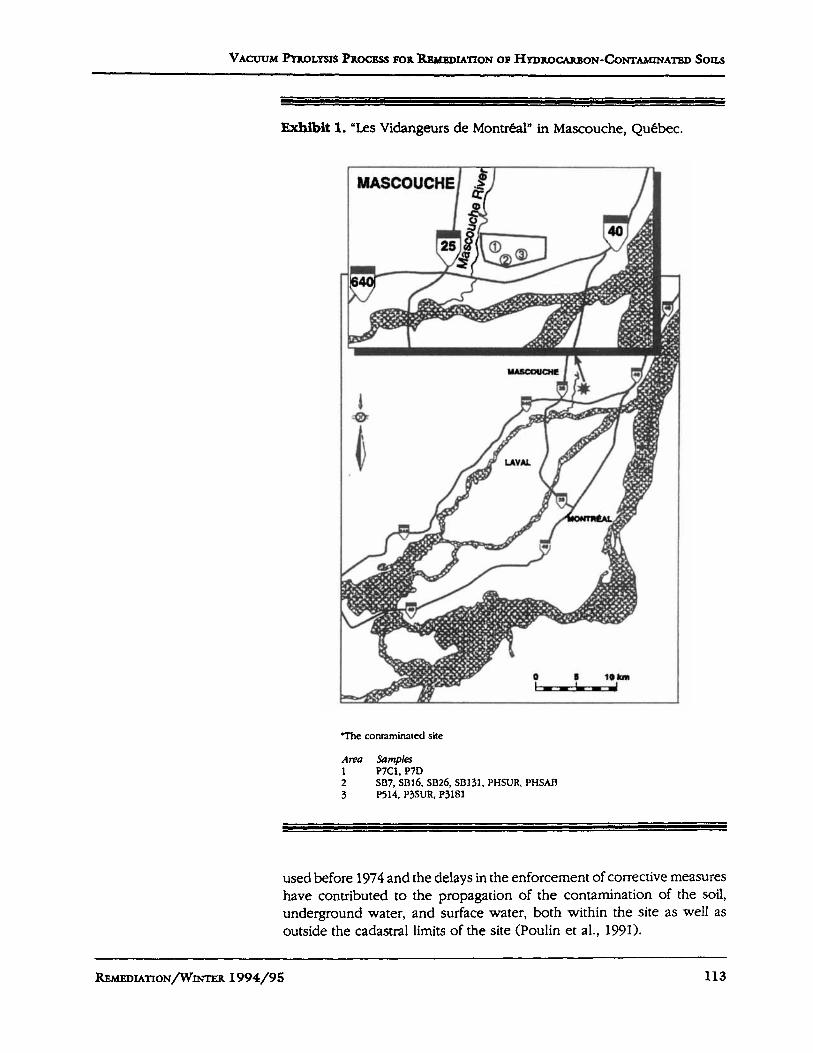
Vidangeurs de Montreal,” located 30 krn northeast of Montreal (see Exhibit 1). The site has a total surface area of about 603,000 mz, of which 1,200 m2 is covered by tar slabs. The burial, storage, and incineration of wastes that took place at this site between 1955 and 1974 seriously affected the quality of the site’s soil and water. The inadequate operating techniques
112 R.EMEDIATION/WINTER 1994/95
VACUUM PY~OLYSIS PROCESS FOR RBMEDUTION OF HYDROCAREON-CONTAMINATED Sons
-it 1. "Les Vidangeurs de Montreal" in Mascouche, Quebec.
The conraminited site
Area Samples 1 P7C1, P7D 2 3 P514, P%SLJR, P3181
SB7, SD16, SBZ6, SB131. PHSUR, PHSAD
used before 1974 and the delays in the enforcement of corrective measures have contributed to the propagation of the contamination of the soil, underground water, and surface water, both within the site as well as outside the cadastral limits of the site (Poulin et al., 1991).
REMEDIATION/~INTER 1994/95 113

Exhibit 2. Identifcation and Description of the Contaminated Soil Samples.
Code Sample* Characteristics
SB7
P3181
PHSAB
P7C1
Black sand, homogeneous, pieces of glass, roots, hydrocarbon odor. Depth: 1.7 - 2.0 m
Brown oily sand, humid, weak odor. Depth: 0.9 - 1.2 m
Dark sand, homogeneous, some roots, odor differing from that of hydrocarbons. Depth: ?
Blue-grey sand, some clay, copious surface water, weak odor. Depth: ?
SBl31 Soil with roots, glass, strong odor. Depth: 0.6 - 0.8 m
SB16
P514
P7D
Large blocks of clay, Cut into small pieces. Tar blotches apparent on the inside. Depth: 2.0 m
Dark brown sand with some yellow sand. Rather homogeneous mixture. Depth: 1.0 - 1.3 m
Brown sand, homogeneous, some surface water. Depth: 1.1 - 1.4 m
PHSUR Surface slabs, sometimes hard, sometimes rubbery, sawed. Very strong odor. Depth: surface
PSSUR Black blocks, hard, dry, cut into small pieces. Strong odor. Depth: surface
SB26 (prototype) Black sand, homogeneous. Strong hydrocarbon odor. Depth: 1.0 - 1.3 m
5 gallons of each sample were collected. with the exception of SB26, of which 4 x 14 gallons were collected.
Samples of Contaminated Soils A series of contaminated soil samples were chosen to represent a
variety of concentrations and compositions of contaminants (oils, grease, PCBs) as well as a variety of different types of soils present at the Mascouche site (sand, earth, clay). This was accomplished by examining the characterization studies carried out to date by the Ministry of Environment Quebec (MENVIQ) and A D S (Poulin et al., 1991) and by selecting samples from different geological site locations. Exhibit 1 and Exhibit 2 provide the location, identification code provided by ADS (Poulin et al., 19911, and a brief description of the samples selected.
114 REMEDIATION/~INTER 1994/95

VACUUM ~ O L Y S I S PROCESS FOR RHM~DU~ON OF HYDROCARBON-CONTAMDJATED Sons
The process involves the thermal vacuum demrption of volatile pollutants present in the contaminated soil&
About 5 gallons of each sample were collected in plastic high-density polyethylene (HDPE) containers with the exception of sample SB26, of which 4 x 14 gallons were collected. The containers were brought to Lava1 University, where they were refrigerated at 4" C. Each sample was then placed in piles onto a disposable piece of plastic and mixed until completely homogeneous. The 5 gallons of each laboratory sample were divided into two containers: 5 kg to undergo vacuum pyrolysis and 5 kg to be submitted to chemical analysis. The samples were refrigerated until used.
Bench-Scale Study The first ten tests were carried out in a laboratory-scale stainless steel
batch reactor with a usable volume of 10 liters. The reactor has a height of 30 cm with a 25 cm diameter and is heated by means of external electrical elements.
The reactor was filled with 4 to 8 liters of contaminated soils, depending on the volumetric mass of the sample concerned. Soils SB7, P3181, PHSAB, and P3SUR were pyrolyzed at 5500 C and soils P7C1 and P514 were pyrolyzed at 500" C. For soils SB131, SBl6, P7D, and PHSUR, the reactor temperature was 450' C. For all soils except PSSUR, the reactor total pressure was maintained between 0.5 and 1.0 kPa. For soil P3SUR the total pressure was 4.5 H a .
The resulting vapors were condensed into five traps arranged in series. The first of the four stainless steel cold traps had dimensions of 20 cm (height) x 8.5 cm (diameter) and the next three traps had dimensions of 40 cm (height) x 16 cm (diameter). The fifth trap was made of Pyrex, with dimensions 31 cm (height) x 5 cm (diameter). The temperatures of the cold traps were maintained at 50" C, 0' C, -78" C, -78' C, and -78" C, respectively. The noncondensable gases were pumped into a 150-liter stainless steel container by means of a mechanical pump.
Process Development Unit Study The process was then tested in a 3 m (length) by 0.6 m (diameter)
reactor. This horizontal cylindrical oven was heated by external electrical elements and equipped with a novel mechanism in which the soil bed is transported and irradiated inside the reactor. The design throughput capacity for this continuous reactor is 500 kg/h. For the test reported herein, the treatment capacity was set at 75 kg/h for sample SB26.
The process involves the thermal vacuum desorption of volatile pollutants present in the contaminated soils. Thermal destruction of the organic compounds present in the soils abo accompanies the desorption process. At the exit of the reactor, the inert soils are obtained together with the heavy, nonvolatilized organic compounds, which formed charcoal. Exhibit 3 provides a sketch of the equipment used.
The contaminated soils are first led to the sieve-grinder, which ensures a relatively homogeneous particle size of the soils by removing solid wastes such as large metallic pieces and crushing rocks or other similar objects. Next, the soil encounters the pre-feeding system, which ensures a regular
WEDIATION/WINTER 1994/95 115

C. ROY B. DE C A U ~ D. BLANCHEITB H. PAKDEL G. COUTURE A.E. SCHWB~DTFEGER
Exhibit 3. Schematic of the Vacuum pVrolysis Process.
Feedstock
77 Scrubber 11 t To Gas Burner
and continuous supply for the feeding system. The feeding system relies on specific engineering that requires a constant supply of material; in the vertical feeder as well as in the endless screw feeder, the soils form a "plug" as they enter the reactor. The combination of this "plug" and the vacuum pump at the exit of the reactor is indispensable for the maintenance of the low pressure in the reactor, which is necessary for a smooth operation of the system.
The soils are heated to 500" C in the absence of oxygen and air. The pressure is maintained at approximately 35 kPa (absolute). The organic matter is vaporized and/or decomposed into vapors. A conveyor, devel- oped especially for this project, permits the continuous flow and mixing of the soils. Thus, the heat transfer efficiency is increased, permitting an increase in the treatment capacity. When the soil reaches the end of the conveyor system, the pyrolysis is complete. The soils fall into a cooling vessel from which they are swept out by cold water and a pump. The water is then separated from the decontaminated soils by means of a fine grid. The water is collected, cooled, and recycled back into the cooling vessel. The treated soils can be directly replaced onto the site.
In the reactor, as the pyroiytic vapors form, they are rapidly pumped into a system of two condensers operating in series. The first condensor operates at approximately 80" C and the second condensor operates at approximately 30" C, allowing for the condensing of the vapors into two phases: the oily phase (containing the heavy oils), followed by the aqueous phase (containing a small proportion of light oils which, together with the water, form a two-phase mixture).
The noncondensable gas is removed by means of a vacuum pump, burned in a gas burner, and recycled as a source of energy.
116 R.EMEDIATION/WINTER 1994/95

VACUUM PYROLYSIS PROCESS FOR &MEDIATION OF HYDROCARBON-CONTAMINATED Sons
~ ~~~~
Exhibit 4. Methods of Chemical Analysis.
Contaminant MethodofAnalys is Reference
Petroleum hydrocarbons (PH)
~~ ~
Ontario Ministry of Environment 1983 Handbook
OME, 1983
Halogenated hydrocarbons (HH) Monocyclic aromatic hydrocarbons (MAH)
EPA # 3810, # 5030, # 8240 U.S. EPA, 1986
Polychlorinated biphenyls (PCB) Polycyclic aromatic hydrocarbons (PAHI
P A # 3510, # 3540, # 3630, +P 8270 U.S. EPA, 1986
ASTM D123-64 ASTM, 1990, Vol. 05.01 Sulfur (S)
Calorific value of pyrolytic oils ASTM D240-87 ASTM, 1990, Vol. 05.01
Methods of Chemical Analyses The following methods were used to analyze the soil samples and the
pyrolytic condensates. A detailed description of these methods can be found elsewhere (Pakdel et al., 1992; Roy et al., 1993).
Total Organic Mat ter (Nonvolatik) Q O M S For a soil sample, 30 g of the as-received sample were extracted with
1O:l to1uene:methanol in a Soxhlet extractor for 48 hours. For a water sample, 250 ml of the sample were extracted with dichloromethane (4 x 15 ml). The extract was then filtered through 30 g of anhydrous Na,SO, and concentrated to a residue, whose weight provides the TOM, content.
The other analytical procedures are listed in Exhibit 4. Details concerning the analysis of samples on gas chromatograph and GUMS are given below.
Hydrocarbon Analysis Samples were analyzed for petroleum hydrocarbon (PH) content on a
Varian 6000 gas chromatograph equipped with a flame ionization detector (FID). The samples were injected at 290" C in the splitless mode onto a 0.2 mm x 50 m (0.33p.m film thickness) HP-5 capillav column at an initial temperature of 50" C, temperature programmed at 4" C/min to 150" C, then at 10" C/min to 300" C, and held at the final temperature for 20 minutes.
Samples were analyzed for halogenated hydrocarbons (HH) and monocyclic aromatic hydrocarbons (MAH) on an HP 5890 gas chromato- graph coupled to an HP 5970 mass spectrometer. The samples were injected at 250" C in the splitless mode onto a 0.32 mm x 60 m (1.8-pn film thickness) DB624 (J 82 W Scientific) capillary column at an initial tempera- ture of 50" C, temperature programmed at 30" C/min to 140" C, then at 30"
R.EMEDIATION/~INTER 1994/95 117

C. ROY B. DB C A U ~ D. B L A N C H E ~ H. P ~ E L G. ( ~ ~ T . J R E A.E. -GBR
Exhibit 5. Summary of Chemical Analyses Performed on the Contami- nated Soil Samples (mgkg, anhydrous basis).
SB7 11,750 NIL 29 0.2 15 P3181 68, loo 6 0.5 traces 13 PHSAB '16,700 40 8 0.8 29 P7C1 930 150 24 20 traces 0.1 SBl3l SB16 1,300 230 NIL 14 1 0.1 P514 2,000 790 ML 2 traces 0.3 P7D 16,300 0.2 11 traces 1 PHSUR*** 670,000 23,688 3,572 10 3,704 P3SUR"* 1,OOO,OOO 49,000 98 60 traces 482 SB26 15,800 5 35 1.8 27
'Ihe contvnination exceeds the C criterion (doesn't apply to PHSm and P3SUR tu slab samples).
'Ihe pollution levels are defmed by global guide values (example HH t d ) .
-* Tas slabs The gukie values for this category apply to each individual product.
Omin to 240" C, held at 240" C for 5 minutes, temperature programmed at 30" C/min to 250" C, and held at the final temperature for 10 minutes.
For polychlorinated biphenyl (PCB) and polycyclic aromatic hydrocar- bon (PAH) analysis, the GC/MS described above was used. For PCB analysis, samples were injected at 290" C in the splitless mode onto a 0.25 mm x 30 m (0.25-pm film thickness) Supelco PTE 5 capillary column at an initial temperature of 50" C, temperature programmed at 30" C/min to 150" C, then at 5" C/min to 290" C, held at 290" C for 10 minutes, temperature programmed at 30" C/min to 300" C, and held at the final temperature for 5 minutes. For the PAH analysis, sampIes were injected at 290" C in the split mode onto the same column at an initial temperature of 80" C, temperature programmed at 30" Umin to 100' C, then at 5" C/min to 290" C, held at 290" C for 15 minutes, temperature programmed at 30" C/min to 300" C, and held at the final temperature for 5 minutes.
Each set of analyses (MOT,, PH, HH, MAH, PCB, PAH, and S) for each of the materials analyzed (Contaminated soils, treated soils, condensates) was accompanied by at least two method blanks. For the analysis of the contaminated soils, two surrogate standards were included in the HAP analysis program, and six synthetic samples (containing known quantities of known contaminants) were included in both the MOT, and the PH analysis programs. Duplicate analyses were carried out for 30 percent of the samples.
118 RJWDXATION/WINTER 1994/95

VACUUM ~Y~OLYSXS PROCESS FOR REMEDIATION OF HYDROCM~BON-CONTAMINATED SOILS
~ ~~
Exhibit 6. Defrnition of MENVIQ Criteria for Soil Contamination.
Concentration Ranges ( m e of soil on an anhydrous basis)
Contaminant A B C
PH HH MAH
benzene ethylbenzene toluene dichlorobenzene xylene
PCB PAH
< 100 < 0.3
< 0.1 < 0.1 < 0.1 < 0.1 < 0.1 < 0.1 < 1
5 150 1 7
10.5 1 5 I 3 I1 1 5 11 I20
I800 5 70
1 5 5 50 5 30 5 10 I 50 5 10 I200
RESULTS AND DISCUSSION Exhibit 5 provides a summary of all the chemical analyses carried out
on the contaminated soil samples. With respect to the concentration of the various contaminants, MENVIQ has defined three categories for soils: A, B, and C (see Exhibit 6) (MENVIQ, 1990). Category C corresponds to contaminated soils (industrial level) and category B corresponds to the contamination level found at commercial sites, whereas category A soils are considered noncontazninated (residential level). The shaded areas in Table 3 indicate which values exceed contamination level C. This symbolism does not apply to the TOM,, column or the MAH column: The TOM, values are not part of the criteria governed by Quebec law; the MAH criteria are considered individually, whereas the results presented here are those of the total MAH contents. For all details concerning the contents of the individual PH, HH, MAH, PCB, and PAH compounds, some of which are mentioned below, the reader is referred to Roy et al. (1993).
The chemical analyses outlined in Exhibit 5 and the characterization of the soil samples given in Exhibit 2 indicate that four of the samples (P3181, SBl31, PHSUR, P3SUR) originated from "highly contaminated" soils (hydrocarbon concentration of 5 percent or more). Two of these samples (P3SUR, PHSUR) contain concentrated hydrocarbon and tar slabs on their surface, thus not corresponding to the official definition of "soils," but they were nevertheless integrated into the program. The remaining seven samples (SB7, PHSAB, P7C1, ssib, P514, P7D, and SS26) originated from the "weakly contaminated" soils (hydrocarbon concentration less than 2 percent).
Both the TOM, values (ranging from 930 to 1,000,000 mg/kg) and the petroleum hydrocarbon contents (ranging from 150 to 51,000 mag)
REMEDIATION/WINTZR 1994/95 119

C. Roy B. DB G u m D. BLANCHET~E H. PAKDEL G. CoUTuaE AE. -GER
The PAH content of the soils wises mainly from the presence of pyrene, chrysene, and naphthalene.
indicate that the contaminated soil samples cover a wide range of pollutant concentrations. The petroleum hydrocarbon contents of all samples, with the exception of P7C1, sB16 and P514, exceed the MENVIQ C criterion (800 mg/kg). Soil samples SB7, PHSAB, and ~ ~ 2 6 , as well as tar sample PHSUR, contain roughly a 1:l mixture of diesel and motor oil, whereas the other samples contain at least 65 percent motor oil.
The HH values given in Exhibit 5 indicate that samples SB7, SB16, P514, and P7D meet the A criterion (c0.3 mg/k@. The HH in tar sample PHSUR consists of a 3:2 mixture of 1,1,2-uichloroethane and 1,2-dichloroethane; in soil sample PHSAB, 40 percent of the HH are due to 1,1,2-t.richloroethane; and in soil samples SB131 and SB26,20 to 45 percent of the HH are due to 1,1,2,2- tetrachloroethane. In all of the other samples, 60 to 100 percent of the HH contamination is due to dichloromethane. Samples P3181 and SB26 meet the B criterion (7 m@@, whereas samples PHSAB, P7C1, and SBl3l fall within the C criterion (50 mdkg). The tar samples PHSUR and P3SUR, of course, contain high percentages of organic contaminants.
If one considers the MAH concentrations, all of the samples contain toluene. The MAH contamination of samples SB16, P514, P7C1, and P7D is made up entirely of toluene. The remaining samples contain a mixture of toluene, dichlorobenzene, xylenes, and ethylbenzene. The major MAH contaminant of soil samples SB7 and P3181 and tar sample PHSUR is toluene, whereas for samples PHSAB and SBl31 it is dichlorobenzene. The major MAH contaminant of soil sample SB26 and tar sample P3SUR is xylenes.
From the PCBvalues presented in Exhibit 5 , it is evident that soil sample SBl31 contains by far the most PCBs. Its PCB content of 128 mg/kg (principally due to a 1:l mixture of trichloro and tetrachloro congeners) largely exceeds the C criterion (10 mdkg). The PCB content of soil sample PHSAB and tar sample PHSUR consists of at least 60 percent tetrachloro congener, whereas the PCB content of soil samples SB7 and SB26 consists of a 3:2 mixture of pentachloro and hexachloro congeners and the PCB content of sample ssi6 is due to a 4:3 mixture of hexachloro and heptachloro congeners. Soil sample SB26 meets the C criterion (10 mg/kg), whereas samplesSB7, PHSAB, and ss16 meet the B criterion (1 mg/kg) and all of the other samples meet the A criterion (C 0.1 mdkg). The tar sample PHSUR contained 10 mdkg of PCBs.
The PAH content of the soils arises mainly from the presence of pyrene, chrysene, and naphthalene. However, soil samples SB7, PHSAB, SB131, and SB26 and the two tar samples P3SUR and PHSUR also contain appreciable amounts of some or all of the following: phenanthrene, fluoranthene, fluorene, anthracene, and acenaphthylene. Tar samples P3SUR and PHSUR are by far the most contaminated. On the other hand, the PAH content of samples P7C1, S316, and P514 falls within the A criterion (1 rndkg). The other soils meet either the B criterion (20 mg/kg) or the C criterion (200 mg/ks>.
The soil samples can be classified according to the percent of contamination by examining the pyrolysis oil yields in Exhibit 7 and the TOM, values in Exhibit 5:
120 REMEDMTION/WINTER 1994/95

VACUUM PYROLYSIS PROCESS POR RBMEDIATTON OF HYDROW~BON-~ONTAMINATED Sons
Exhibit 7. Mass Balance and Yields for Pyrolysis Tests.
Yield on as-received sample basis (% mass)
Sample MassBalance TreatedSoil Oils Gas Humidity Pyro€yt.icWater
SB7 P3181 PHSAB P7C1 SB131
P514 P7D PHSUR" P3SUR** SB26 (prototype)
ss16
100.1 100.0 100.0 99.9
100.0 99.9 99.9
100.0 99.9 98.8 98.8
80.6 73.7 81.1 76.7 69.4 58.6 79.3 80.2 33.1 15.8 84.5
0.8 0.5 7.4 1.4 1.5 0.4 0.1 0.2 3.4 2.0 0.8 0.4 0.3 0.5 1.6 0.1
51.2 2.2 39.7 6.8
1.1
~ ~~~~ ~
17.8 17.0 16.7 20.6 25.0 39.3 17.5 17.3 13.4 36.8 10.2
The sum of the oils and pyrolytic water is 4.2 percent. It was not possible to isolate one phase from the other. ** Surface sample composed of tar slabs.
0.3 0.5 0.3 2.4 0.2 0.9 2.4 0.8 0.1 0.9
*
Strongly contaminated: P3SUR > PHSUR (the tar samples) Moderately contaminated: P3181 > SB131 Weakly contaminated: P7D > PHSAB > SB26 > SBl6 > SB7 > P514 > P7C1
Treated Soils Exhibit 7 below shows the results obtained following the vacuum
pyrolysis of the contaminated soils. The mass balance is excellent for all of the samples, including the prototype trial SB26. Nine of the samples reached a mass balance of 99.9 to 100 percent. The tar sample P3SUR and the prototype trial sample SB26 reached a mass balance of 98.8 percent. The small observed error is padally due to the noncondensable gas determination method (by gas chromatography).
With the exception of the tar samples (PSSUR and PHSUR), the products obtained are primarily solids; i.e., the treated soils consist mainly of inert matter to which the pyrolytic residue (in the form of char) has been added. In all cases, only a small quantity of pyrolytic gas was produced, this being one of the main characteristics of the vacuum pyrolysis process. Water, together with some oil, are the only important effluents of the process. Each of the materials (solid, organic phase, and aqueous phase) obtained after pyrolysis was subjected to chemical analyses.
Exhibits 8 and 9 summarize the chemical analyses (TOM,, PHI and PCB) carried out on the treated soil samples, in addition to providing a comparison between the TOM,, PH, and PCB values of the original contaminated soil samples before vacuum pyrolysis treatment and the

C. ROY B. DE G u m D. B L A N ~ H. PAKDEL G. COUTURE 0 A.E. SCHWERDTFEGER
Exhibit 8. Comparative Analyses of TOM, and PH in Soils Before and After Treatment (mg/kg of soil on an anhydrous basis).
TOY, PH
Sample Before After Before Level* After Level+
SB7 P3181 PHSAB P7C1 SB131
P514 P7D PHSUR" P3SUR*+ SB26 (prototype)
ss16
11,750 68,100 16,700
930 32,500
1,900 2,OOo
16,300 670,000
1,000,000 15,800
230 39
114 24 50 68 39 84
51 1 208 87
3,000 19,770 2,050 150
290 790
4,600 51,000 49,000 7,470
6,100
>C >C >C B
>C C C
>C 1..
**+
6.8 2.9 7.7 4.1 4.9 5.0 3.1 2.5
12.2 236.0 21.7
A A A A A A A A
*+* *+* A
Level according to the Ministry of Environment Quebec (MENVIQ) classification: A = residential; D - comniercial; C - contaminated. " Surface sample composed of tar slabs.
Irrelevant.
Exhibit 9. Comparative Analyses of the PCB Content of the Soils Before and After Treatment (mg/kg of soil on an anhydrous basis).
Sample Before Level* After Level*
SB7 0.2 B co.01 A SB26 (prototype) 1.8 C Nil A
* Level according to the MENVrQ classification: A, B, or C (see Exhibit 6).
values of the same samples following the vacuum pyrolysis. It is remarkable to see how the TOM, concentrations for the soils have
dropped to 20 to 230 mg/kg (see Exhibit 8). It is interesting to note that the treated soil samples with the least proportion of residual organics' do not necessarily correspond to the originally least contaminated soil samples (prior to treatment). For example, P3181 and P514 both have the same TOM, content following vacuum pyrolysis. Prior to treatment, however, P3181 was 34 times more contaminated than P514. Thus, in addition to determining the degree of contamination, one must also consider the type of soil and the nature of the contaminants in order to evaluate the relative efficiency of the thermal treatment.
122 REMEDIATION/WINTER 1994/95

VACUUM PYROLYSIS Pmmm FOR REMEDIATION OF HYDROCAREON-CONTAMINATED Sons
The treated soils contain only traces of petroleum hydrocarbons (see Exhibit 8). Thus, after vacuum pyrolysis, all of the soils meet the MENVIQ A criterion (400 mg/kg).
The tar samples P3SUR and PHSUR have been remarkably modified. The TOM, concentration of the treated samples P3SUR and PHSUR are now only 208 and 511 mg/kg, respectively, down from l,OOO,OOO and 670,000 mg/kg. Their petroleum hydrocarbon (PHI content has been reduced to 236 and 12.2 mgkg, respectively.
The criteria for PH and PCB contents of soils are governed by MENVIQ regulations. According to these, the treated soils SB7 and SB26 have PH and PCB contents less than those defined for the lowest contamination level, A (see Exhibits 8 and 9). Thus, after vacuum.pyrolysis, the soil has been completely restored. It should be noted that the prototype run provided results that were as good as those obtained on a laboratory scale.
Condensates The condensates formed during the vacuum pyrolysis process consist
of two phases: an organic phase containing mainly the hydrocarbons (oil and grease) initially present in the contaminated soils, and an aqueous phase consisting mainly of the moisture initially present in the contami- nated soils. The process simply separates the volatile contaminants and moisture from the soil by desorption and vaporization, which is accompa- nied by a mild thermal destruction of the heaviest contaminants present in the soil. The organic vapors are condensed and recovered as an oil; the steam is recovered as an aqueous phase.
The reduced pressure of the process results in a reduction of the vaporization temperature (of the order of 50" C to 75" C). Thus, the organic pollutants can be extracted from the soils (by vaporization) at lower temperatures than those used under atmospheric pressure conditions. This lower operating temperature reduces the energy consumption.
For the chemical analysis of the condensates, three samples, represen- tative of all the laboratory samples, were selected: one of the weakly contaminated soils (SB7), one of the moderately contaminated soils (P3181), and one of the tar samples (P3SUR). The condensates of the prototype sample SB26 were also analyzed. The results of the analyses, summarized in Exhibit 10, confirm the fact that the contaminants originally present in the soils are concentrated mainly in the condensates, especially in the organic phase. The HH and MAH (as well as the PCB) levels are, respectively, up to 200 times and 10,OOO times greater in the organic condensates than in the corresponding aqueous phases.
Surprisingly, sample SB7, whose soil was the least contaminated before treatment, gives rise to the largest concentration of PH in both the pyrolytic organic and aqueous phases. The pyrolytic organic phase of sample SB7 is composed of 80 percent diesel oil and 20 percent motor oil. The petroleum hydrocarbons of the aqueous phase of sample SB7 and the condensates of the other samples consist of 80 percent motor oil and 20 percent diesel oil.
For the laboratory scale samples, the MAH contamination in the
The organic vapors are condensed and recovered as an oil; the steam is mam?mt-Z (L8 queoua phase* r
REMEDIATION/WINTER 1994/95 123

Exhibit 10. Analyses of the Condensates. CalorUlc Value
Sample TOY, PH HH MAH PCB Sulfur (O/O) (cavs)
Organic Phase (mg/kg of product on an anhydrous basis)
SB7 P3181 P3SuR
14,800 1,220 10 1.2 10,400 n.m. 158,000 13
n.m. 74,000 347 729 2 2.7 10,400
n.m. 385,000 459 13,469 39 1 .o
A ~ u e o u s Phase (pg/l of product)
SB7 487 950 12 56 4 n.a. n.a. P3181 87 1 81 22 12 traces n.a. n.a. P3SUR 441 19 3 7 traces n.a. n.a. SB26‘ prototype 265 111 traces < 0.1 n.m. n.a. n.a.
n.m.: not measured n.a.: not applicable
combined organic and aqueous phases (see Exhibit 7)
organic phase is composed of roughly a 2:l mixture of xylenes and toluene, and in the aqueous phase it is composed of almost entirely toluene. However, sample SB7 also has an appreciable ethylbenzene, benzene, dichlorobenzene, and xylene content in both the organic and aqueous phases. The HH contamination in the organic phases of samples SB7 and P3181 involves an appreciable amount of dichloromethane, 1,1,2- trichloroethane, and 1,1,2,2-teuachloroethane. The HH contamination in the aqueous phase of sample SB7 is due mainly to dichloromethane and 1,l-dichloroethane. For sample P3181, the main HH contaminants in the aqueous phase are dichloromethane, chloroform, and carbon tetrachlo- ride.
The PCB content of the condensates essentially consists of tetrachloro and pentachloro congeners. As expected, the contaminants are found mainly in the pyrolytic oils. Sample SB7’s pyrolytic oil, for example, contains 10,000 times more PCBs than the aqueous phase of the same sample. The PCB analysis of the pyrolytic condensates indicates that, during the vacuum thermal treatment, most of the PCBs were extracted from the soils and are mainly found in the pyrolytic oils. Nevertheless, to ensure the validity of the preceding statement, two soil samples, SB7 (original PCB content: 0.20 mg/kg) and SB26 (original PCB content: 1.8 mg/kg), were selected to undergo PCB analysis following pyrolysis treatment. Indeed, both soils are well within the A level (<0.1 mg/kg) of contamination (see Exhibit 9).
The condensates of tar sample P3SUR give rise to surprisingly low
124 REMEDIATION/WINTER 1994/95
VACUUM PYROLYSIS PnocBss FOR -UTION OF HYDROCABEON-CWWXI"TTSD SOIL3
Some treartment possibilitb are floatation, centrifugation, filtration, chemical coagulation, vapor phase membrane separation, wet oxidation, CD-
incineration, and biological treatment.
concentrations of PH, HH, and MAH when compared to those obtained for the soil samples; but one must recall that the vacuum pyrolysis of tar sample P3SUR gave rise to 39.7 percent oil on an as-received basis (62.9 percent oil on an anhydrous basis), whereas the vacuum pyrolysis of soil samples SB7 and P3181 gave rise to only 0.8 percent and 7.4 percent oil, respectively, on an as-received basis (only 1 .O percent and 8.9 percent oil, respectively, on an anhydrous basis; see Exhibit 7). Thus, the concentration of the contaminants in the P3SUR condensates is low, because the contaminants are diluted in a large volume of condensates. The actual amount of contaminants present in the tar sample P3SUR condensates is much greater than the quantity of contaminants present in the condensates of the soil samples SB7 and P3181.
The calorific value was determined for the pyrolytic oils of the three representative laboratory soil samples in order to determine whether it would be possible to use them as heating fuel for the vacuum pyrolysis process. Thevalues listed in Exhibit 10 indicate that the pyrolytic oils would make excellent combustible liquids in terms of heat content. Their PCB content is within the Quebec regulated threshold of SO ppm for an oil to be burned in a conventional cement kiln. The sulfur content of the condensates of the soil samples SB7 and P3181 meets the maximum sulfur level permitted in Quebec for an intermediate oil (1 percent). The sulfur level of the condensates of tar sample P3SUR approaches the maximum sulfur content permitted in Quebec for a heavy oil (2 percent).
For the prototype sample SB26, the combined condensates were analyzed (see note in Exhibit 7, which states that it was not possible to separate the two phases). Exhibit 10 indicates that the combined conden- sates provide an aqueous phase that, like the aqueous phase of the condensates of the other soil samples, will require a further treatment before its disposal. Some treatment possibilities are floatation, centrifuga- tion, fdtration, chemical coagulation, vapor phase membrane separation, wet oxidation, co-incineration, and biological treatment.
Gases The unburnt noncondensable gases were analyzed following pyrolysis
and the results are presented for the major gases in Exhibit 11. In general, the gases have a high calorific value. The combustion of these gases should not pose any emission problems, thus reinforcing the idea of recycling these gases as makeup heat fuel in the process itself.
For the test conducted on the prototype, there was a marked increase in the proportion of nitrogen and oxygen in the gas produced by the process. This can be attributed to an air leak chat occurred at the feedstock airlock during the test, resulting in an infiltration of oxygen, which presumably reacted with the pyrolytic charcoal and the volatile gas. Nevertheless, the total amount of gas produced is probably very small. Once the proportion of air in the mixture has been subtracted, the composition of the pyrolytic gas produced during the runs on the prototype is similar to that produced during the laboratory tests.
From a technical point of view, vacuum pyrolysis is unique with ~~
REMEDXATION/~INTER 1994/95 125

Exhibit 11. Composition and Calorific Value of Pyrolysis Gases.
Cuncentration (46 vdume) a 4
< $ 5 $ $ $ e a s g $ on X X s, 8 i i w p k $ S s " d U
SB7 50.58 4.74 37.04 2.89 0.52 0.44 0.58 0.18 0.46 0.26 0.10 0.25 - 1.96 21.7 2,900 P3181 45.87 8.15 30.43 6.97 1.68 1.07 1.59 0.36 0.77 0.42 - 0.04 - 2.65 21.9 3,300
3.25 22.3 4,700 PHSAB 45.97 8.12 27.17 6.95 1.59 1.15 1.62 0.44 2.83 0.52 0.10 0.29 -
SB131 44.27 7.24 39.04 4.44 0.64 0.57 0.74 0.24 0.52 0.35 0.23 0.47 - 1.25 23.2 2,800 P7Cl 55.10 9.27 25.95 2.61 0.44 0.23 0.78 0.36 0.43 0.50 - 0.10 2.84 1.39 18.8 4,200
SSI6 20.46 8.22 66.99 1.64 0.32 0.12 0.60 0.05 0.32 0.21 0.04 0.01 - 1.02 33.9 1,Ooo P514 17.76 15.48 58.27 3.39 0.58 0.39 0.76 0.13 0.28 0.22 - 0.13 1.20 1.41 33.3 1,500 P7D 61.99 4.77 19.18 5.80 1.14 0.87 1.89 0.27 0.93 0.67 - 0.13 - 2.36 16.1 5,800 PHSUR 36.63 3.92 31.49 6.78 3.79 1.63 1.97 0.71 3.36 0.74 0.43 2.77 0.07 5.71 27.3 4,600 P3SUR 17.32 1.49 2.95 31.95 1.62 4.51 - 34.12 0.91 1.54 - - 0.26 3.33 27.9 11,100 s826 3.03 1.51 9.75 0.21 0.29 - - - - - - - - 0.37 29.2 1,071 Prototype
'The gas alsoconfains7.53 percent oxygenand77.31 percent nitrogen for sample 3326. The average molecular weight and G.C.V. calculations included oxygen and nitrogen.
respect to conventional pyrolysis in two ways: It achieves a maximum condensation of the pyroiytic vapors and it operates at reduced pressure. These two distinctions have the following consequences.
The gas produced during vacuum pyrolysis is composed of molecules that are noncondensable at room temperanire. Thus, the gas is only composed of "simple" molecules (e.g., CO, CO,, H,, CHJ which will readily undergo combustion, providing clean gas emission. The noncondensable gas can thus be used as a makeup heat source for the process. Other thermal treatment procedures often require expensive purification equipment for the control and treatment of emissions. In addition, particle emission is almost nonexistent, because the gas is produced in almost negligible quantities and is passed through a washing system in the liquid phase. Furthermore, the fact that no carrier gas is used in the process limits the amount of particles and dust in the pyrolytic gas.
Because the process is carried out under reduced pressure, the organic vapors and steam are rapidly evacuated from the reactor and directed toward the condensers. This rapid condensation also reduces the amount of gas produced.
FEAsmmsTuDy An economic evaluation was performed by first evaluating the capital
cost of a 5 tons/hr treatment unit using the method and data available in
126 REMEDIATION/WINTER 1994/95

VACUUM pyaoLysrs Paoc~ss FOR RBMGDIATION OF HYDROCARBON-C~WCWINATFSD Sons
Peters and Timmerhaus (1991) and Garrett (1989). Based on this cost, a subsequent estimation of the operating costs was made, which then allowed for the preliminary evaluation of the treatment cost per ton. The following hypotheses for the feasibility study of the process are based on the results of the test performed on the prototype:
1.
2.
3.
4.
5.
6 .
7.
8. 9. I
The treatment of one ton of contaminated soils containing roughly 10 percent water requires 540 MJ (150 kWh) of energy. In general, the list of equipment that will be required for the commercial unit is similar to that used for the prototype, except that the material will be more robust. The plant is moved once a year. The time required for transporting the movable unit on-site, installing it, and loading it again on a tractor-trailer at the end of the project has been evaluated at one month. For this case study, a 5 tons/hr unit has been selected that operates 24 hours a day, 305 days a year. The quantity of treated soils corresponds to the maximum capacity for the time period in question. Thus, in this case: 5 tons/hr x 24 hrs/day x 305 days/year = 36,600 tondyear. Depreciation is assumed to be straight-line over ten years (with no residual value). The cost for the treatment (or revenue for the oil) of the resulting liquids, water, and oil has not been taken into consideration. The evaluation of this cost is in progress. The annual loan interest is 15 percent. Because the unit operates 24 hours a day, four crews are required. Each shift is composed of one supervisor and one technician. One engineer is added during the day shift. The overall average daily labor cost is $1,000, excluding overhead.
10. Whatever heating system is used, the energy consumption of the unit will be similar. However, the energy source can have an influence on the cost. The estimated energy cost per ton of treated soil is as follows: electricity, $8.80/ton; propane gas, $7.60/ton; natural gas, $5.20/ton; and # 2 oil, $5.50/ton. For this case study, natural gas was selected. A cost of $0.10/1,000 gallons of cooling water was selected for the evaluation of this expenditure.
Treatment of the aqueous phase and ueage or of the oil phcree have not been taken into account.
Exhibit 12 outlines the details of the investment costs for a 5 tonsfir vacuum pyrolysis unit based on the hypotheses listed above. The capital investment for a 5 tons/hr treatment unit is estimated at $9SO,OOO. This price does not include the cost associated with the purchase of the tractor-trailer and loader for the transportable unit. The precision of this preliminary feasibility study is estimated to be f30 percent.
Exhibit 13 provides a detailed summary for the estimated prime cost for the decontamination of one ton of contaminated soils. This treatment cost is estimated to be $37 per ton. Treatment of the aqueous phase and usage or treatment of the oil phase have not been taken into account. The
~~
RBMBDIATIoN/WM=J~K 1994/95 127

C. ROY B. DE CAUMIA D. BLANCHHITB H. PAKDBL G. COVIVRB A.E. SCHWERDTEBGBR
Exhibit 12. Investment (5 tonshr unit, in $ CDN).
Direct costs Equipment? $530,000 Building for the transportable plant 70,000
Indirect costs Engineering and supervision 90,000 Construction 90,000 Contingencies 80,000
Fixed Capital 860,000
Operating Capital 30,000
Total Investment $950,000
(a) Indudes instrummution and control, plumbing, electricity, insulktion, replament puU. Excludes uaaor-rrailu, loader and excavationlausher equipment.
Exhibit 13. Treatment Cost (for a 5 tonshr unit in .$ CDN).
Variable costs Mobilization and transportation Supervision Manpower Maintenance Treatment of the aqueous effluent Laboratory analyses Power and utilities
Methane Cooling water
Total
Fixed costs Depreciation Taxes and insurances Overheads Safety, storage Financial costs Administration expenses
Total
Variable costs plus fixed costs
Treatment cost per ton
(a) Not induded in the costs.
$ 100,000 65,000
365,000 54,000
(a) 35,000
250 000 7,000
$876,000
$86,000 22,000 86,000 35,000
150,000 100,000
$479,000
$1,355,000
$37.00
128 REMEDIATIoN/W~R 1994/95

VACUUM PYaD~rsxs P~o<33ss POR RBMEDIATION OF H Y D ~ N - C O " A T E D Sons
value shown excludes any numbers for the payment of royalties, profit, and taxes. This cost compares very favorably with the prime cost of the thermal techniques such as those described earlier. This operating cost is also expected to decrease with an increase of the system throughput capacity.
CONCLUSION The contaminated soil samples collected at the Mascouche site
presented a wide range of contamination levels. All samples were efficiently treated in both the laboratory and prototype reactors, providing treated soils meeting the A criterion (residential level) of the Ministry of Environment Quebec. The soils originated from different matrices, which did not pose any problem to the vacuum pyrolysis process. The process is economically competitive with other existing technologies and is easy to implement because the treatment units are mobile. The pyrolytic oil can be reused as makeup heating fuel in the process itself, or it can be used by an external user (e.g., a cement company). The pyrolysis gases can also be used as a makeup heat source in the process, and their combustion should not pose any emission problems. W
ACKNOWLEDGMENTS
The financial support provided by the Ministry of Environment Quebec and St. Lawrence Centre (DESRT: Development and Demonstration of Site Remediation Technol- ogy Program) has made this project possible. The technical and financial participation of Les Industries Pyrox Inc. (Ancierkbreue, Quebec) is gratefully acknowledged. The authors alsoappreciate the input of Dr. Diane Germain, as well as the technical contribution of Miss C. Blais, Mr. P. Hwaire, Mrs. J. Lagace, Mr. D. Lapointe, Mr. J-M. Roy, and Mr. H. Tremblay.
REFERENCES
Air and Waste Management Association. 1993. Thermal 1. Thermally Enhanced Volatiliza- tion,' a live satellite seminar, Pittsburgh, PA, Feb. 18.
Amerian Society for Testing and Materials. 1990. AnnualBook OfASIuStandards, Sec. 5, Petroleum Products, Lubricants and Fossil Fuels, Vol. 05.01, Easton, MD.
Bege, D. and S. Meininger. 1989. "Verfahren zur pyrolytischen Behandlung von AbfalC oder Schadstoffen," German Patent DE 3728487 Al.
Centre Saint-Laurent. 1993. Guide pour l'&aIuation et le choir des technologies de traitement des sddimentr contaminks. By J.-R. Michaud, Direction du Dkveloppement Technologique. Catalogue no. En4M50/1993F.
De Leur, L. C. 1988. "Method For Cleaning u p Contaminated Soil," European Patent 284,156.
Deutsche Babcock Anlagen GmBH. "Destruction of Hazardous Waste and Clean-up Of
Contaminated Soils by Pyrolysis," Krefeld, Germany (brochure).
Garrett, D. E. 1989. Chemical Engineering Economics, New York: Van Nostrand Reinhold.
MENVIQ. 1990. "Guide des rnethodes de conservation et &analyses des echantillons d'em et de sol," Envirodaq EN900080.
Ontario Ministry of Environment. 1983. Handbook ofAnalytica1Merhod.s for Environmental sampk.
REMBDIATION/~IMXR 1994/95 129

C. ROY B. DB CAWMIA D. BLAN- H. PAKDEL G. COUTURE A.E. SCHWERDTFIGER
Pakdel, H., G. Gouture, C. Roy, A. Mwon, J. Locat. P. GBinas, and S. Lesage. 1992. "Developing Methods for the Analysis of Toxic Chemicals in Soil and Groundwater: The Case of Ville Merckr, Qukbec, Canada," in S. Lesage and K. E. Jackson, eds., Grounduater Contamination pnddnalysis atHmrdous Waste Sim. New York: Marcel Dekker Inc., pp. 381-421.
Peters, M. S. and K. D. Timmerhaus. 1991. Plant Design and EconomicS for CbemiCa! Engineen. New York: McGraw-Hill Books.
Poulin, M., G. Bachmd, D. Rivard, and L. Labrie. 1991. 'CaracGrktion du site 'Le Vidangeur de Montrhl' 1 Mascouche," Vol. 1, ADS Associ& L&5e Project 17-362 93, submitted to the Ministry of Environment QuBbec.
Reintjes, R C. 195. 'Process and Apparatus for Cleaning Soil Polluted With Toxic Substances," European Patent 155,022.
Roy, C., H. Pakdel, G. Couture, D. Blanchette, 8. de Caumia, and P. Haxaire. 1993. "Evaluation du proc6di5 Pyrovac de pyrolyse sous vide pour la restauration des sols contamin& avec des matieres organiques dangereuses," Final Report MENVIQ 3332-51- 9046 (Centre Saint-Laurent, CSL: 4954- 19L-1-1) Submitted to the Ministry of Environ- ment Quebec.
U.S. Environmental Protection Agency. 1986. "Test Methods for Evaluationof Solid Waste- PhysicaVChemial Methods SW-846."
U.S. Environmental Protection Agency. 1992. "The Superfund Innovative Technology Evaluation Program: Technology Profiles," 5th ed., Report No. EPA/540/R-92/077.
130 REMEDIATION/WINTER 1994/95