ux and data visualisation
TRANSCRIPT
Using UX and Visualization to
give you an edge?
Paula de Matos
Jason Dykes
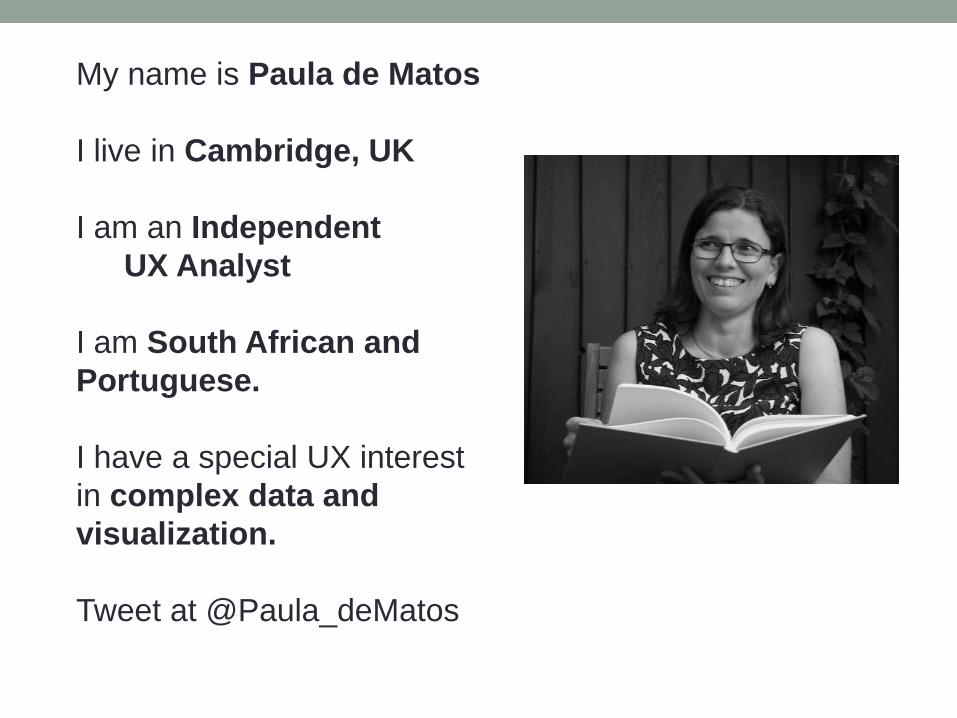
My name is Paula de Matos
I live in Cambridge, UK
I am an Independent
UX Analyst
I am South African and
Portuguese.
I have a special UX interest
in complex data and
visualization.
Tweet at @Paula_deMatos
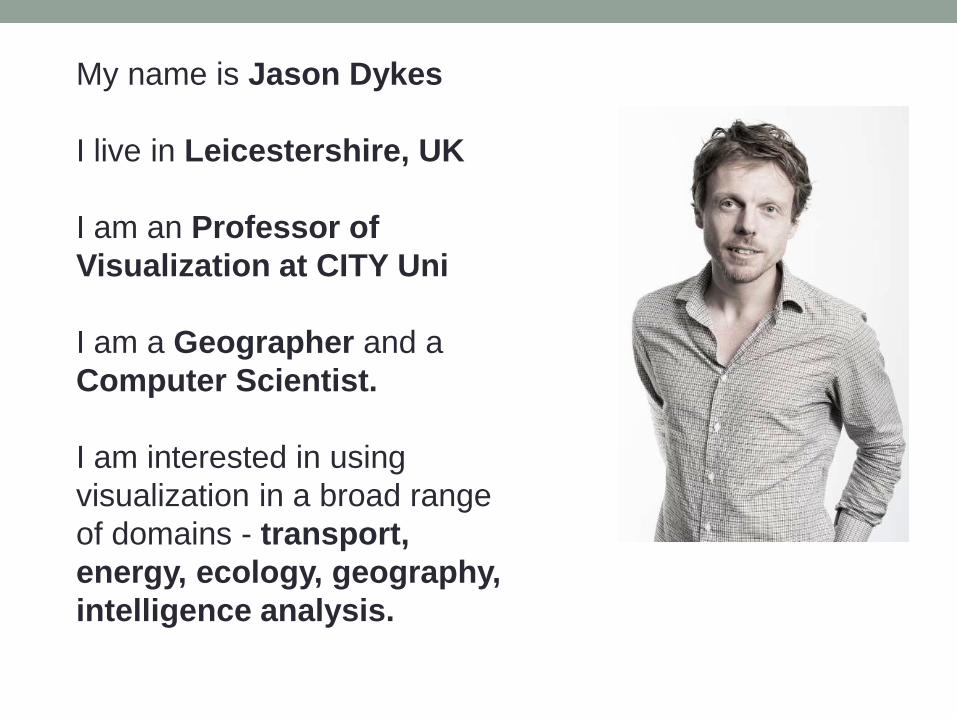
My name is Jason Dykes
I live in Leicestershire, UK
I am an Professor of
Visualization at CITY Uni
I am a Geographer and a
Computer Scientist.
I am interested in using
visualization in a broad range
of domains - transport,
energy, ecology, geography,
intelligence analysis.
Flickr: Doritweber
Design scenarioLibrary visualization
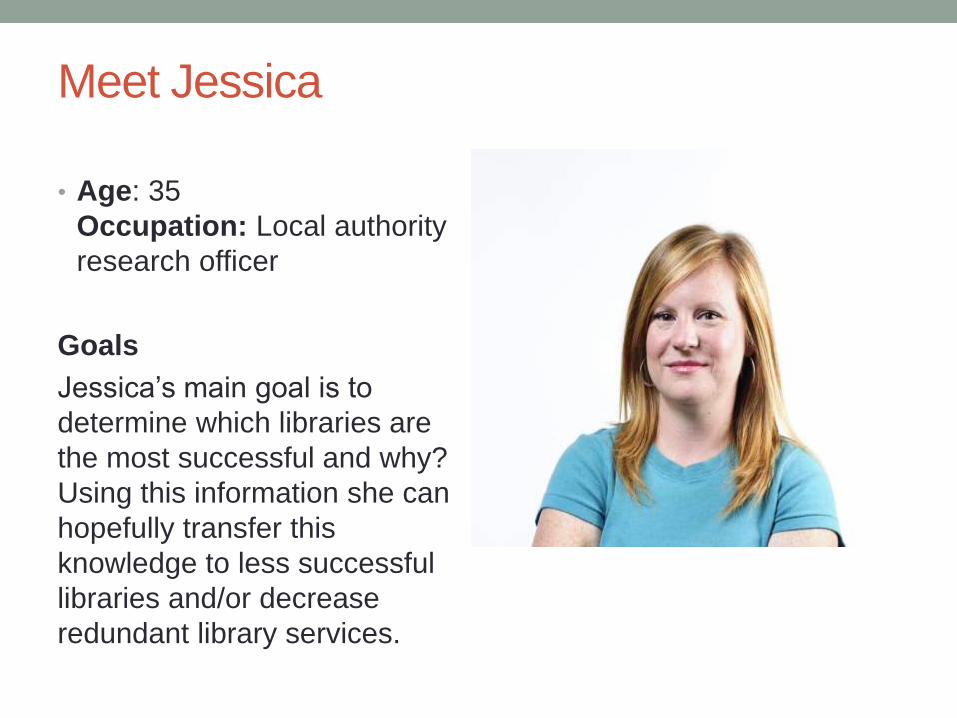
Meet Jessica
• Age: 35
Occupation: Local authority
research officer
Goals
Jessica’s main goal is to
determine which libraries are
the most successful and why?
Using this information she can
hopefully transfer this
knowledge to less successful
libraries and/or decrease
redundant library services.
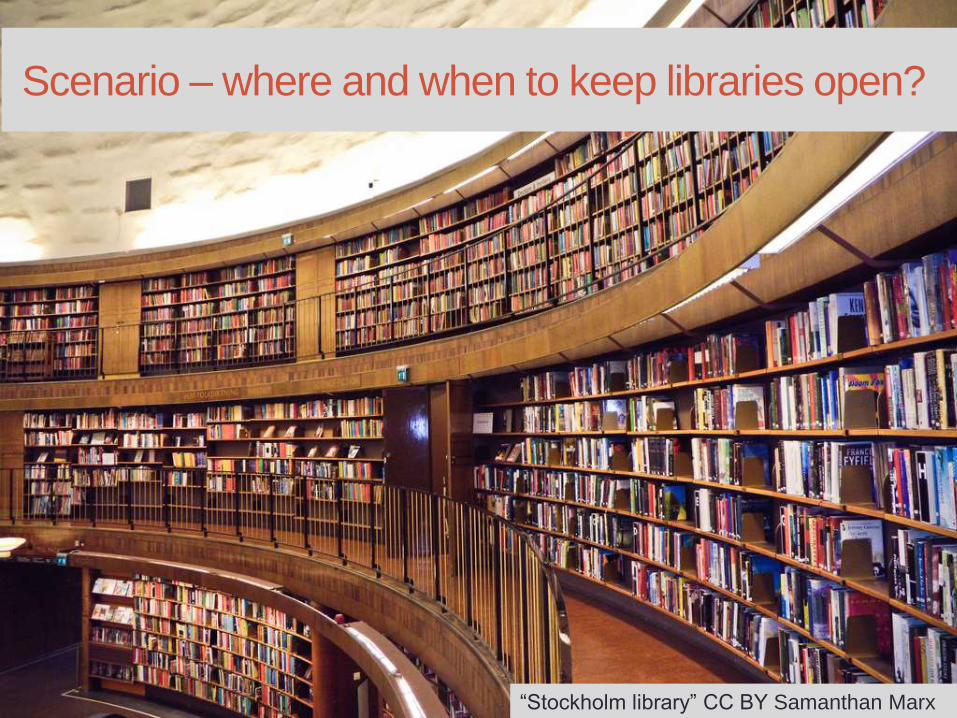
Scenario – where and when to keep libraries open?
“Stockholm library” CC BY Samanthan Marx
Your task
Sketch a visualization that will help Jessica gain some
insight into allocating library resources?
“Darts” CC BY Richard Matthews
Read and discuss the task
• Read the persona and task.
• Find somebody else with the same coloured dot sticker.
• Introduce yourself and discuss the task.
UX and complex dataPaula de Matos
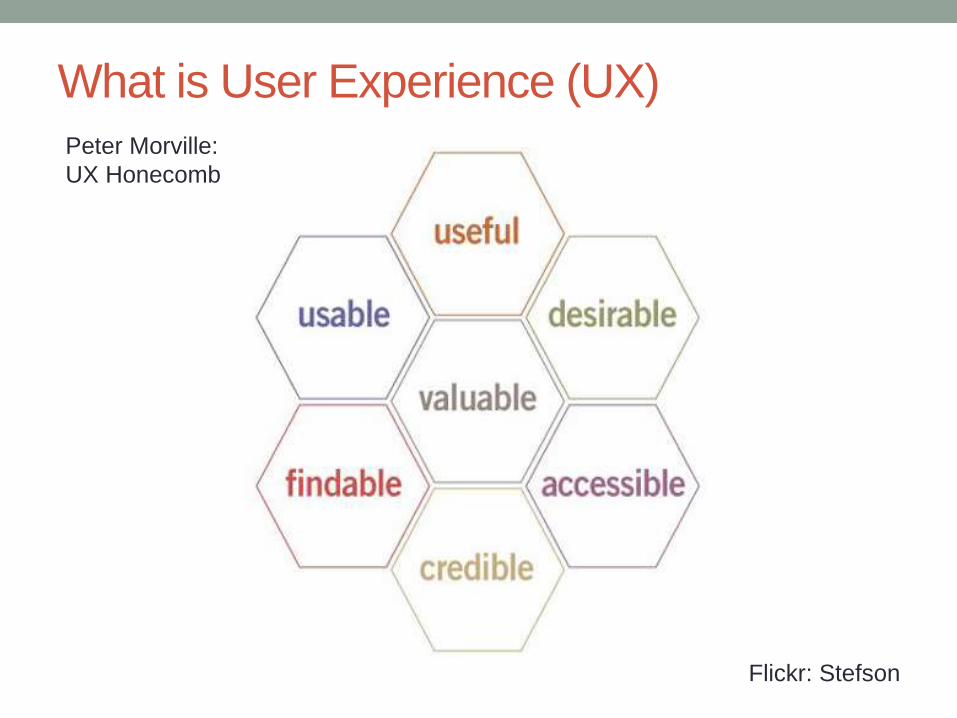
Flickr: Stefson
Peter Morville:
UX Honecomb
What is User Experience (UX)
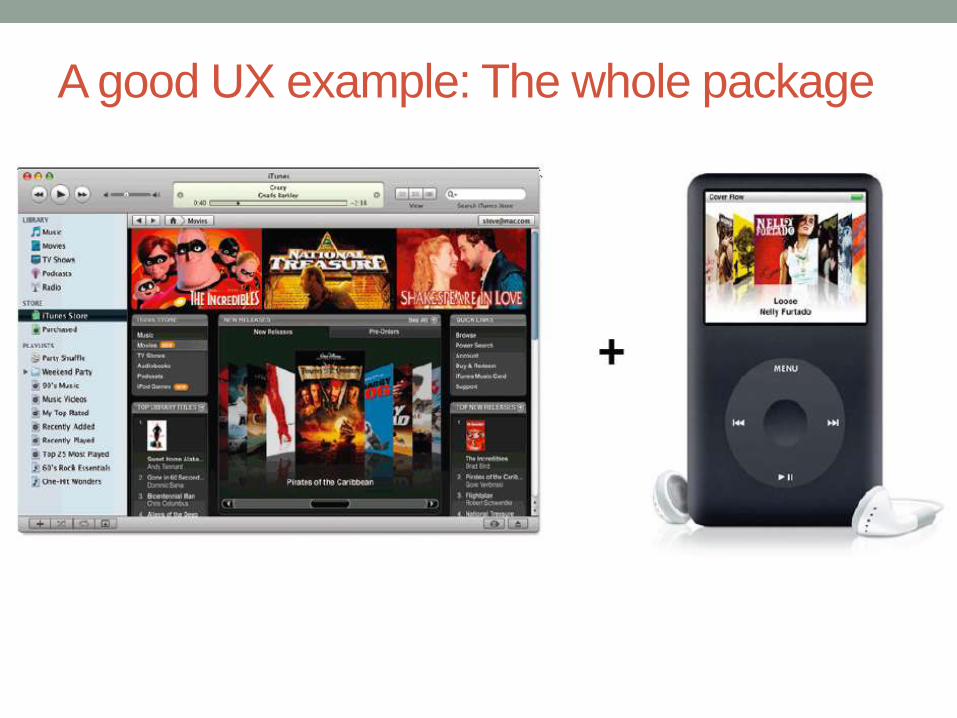
A good UX example: The whole package
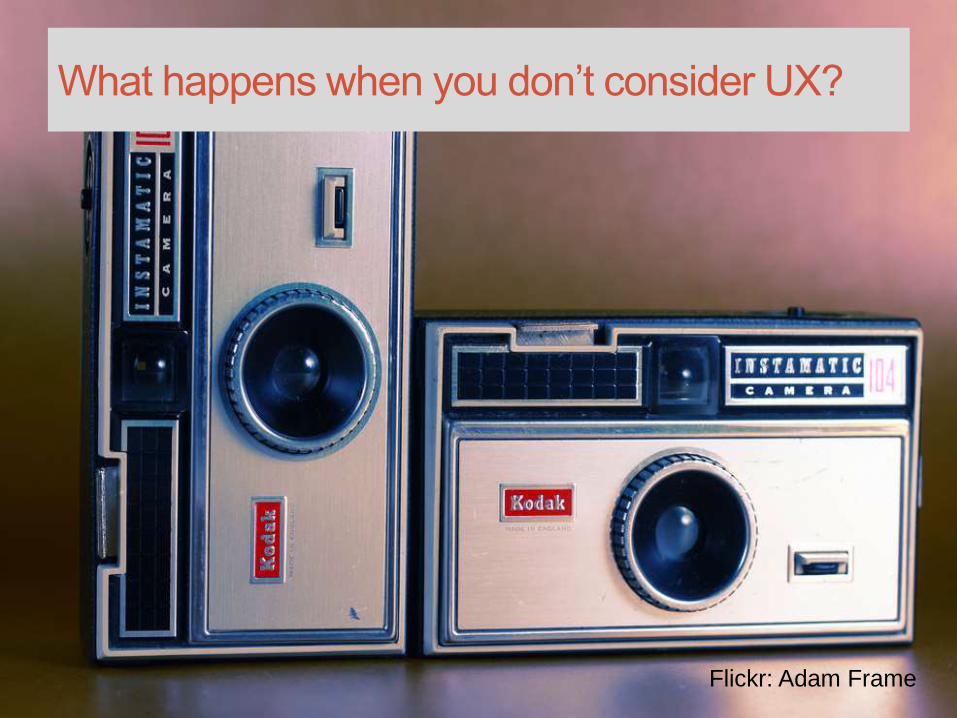
What happens when you don’t consider UX?
Flickr: Adam Frame
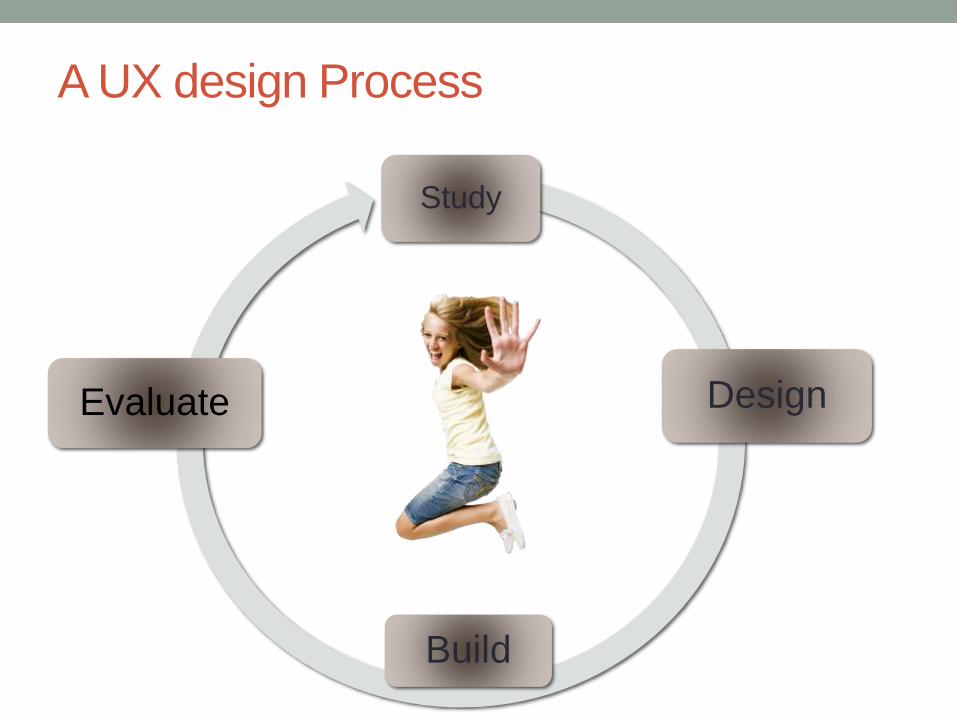
A UX design Process
Study
Design
Build
Evaluate

UX in complex data environments
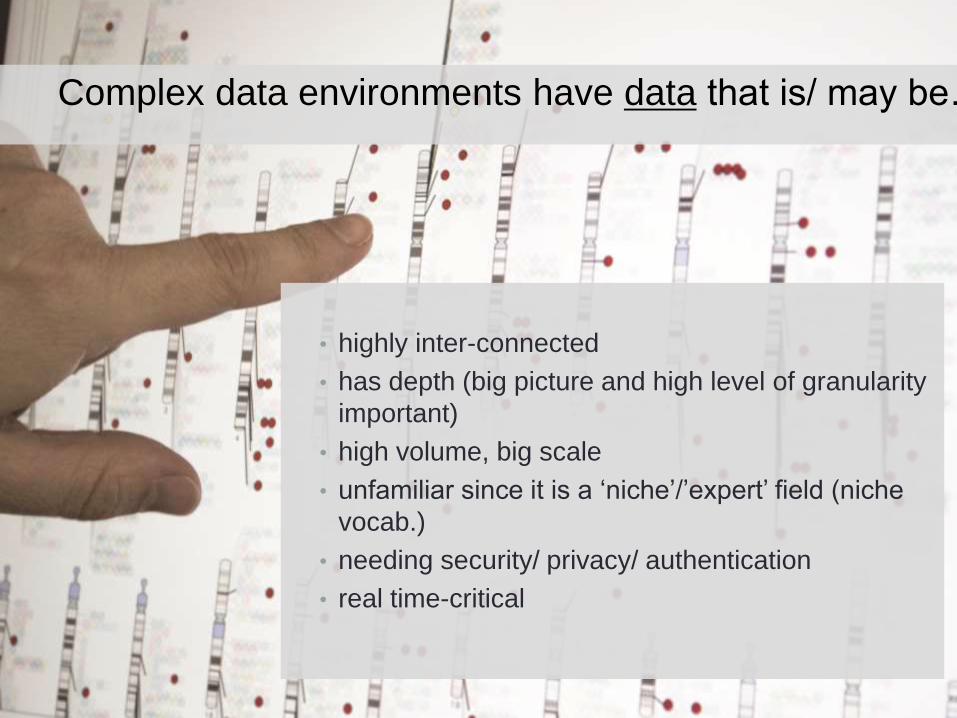
• highly inter-connected
• has depth (big picture and high level of granularity
important)
• high volume, big scale
• unfamiliar since it is a ‘niche’/’expert’ field (niche
vocab.)
• needing security/ privacy/ authentication
• real time-critical
Complex data environments have data that is/ may be…
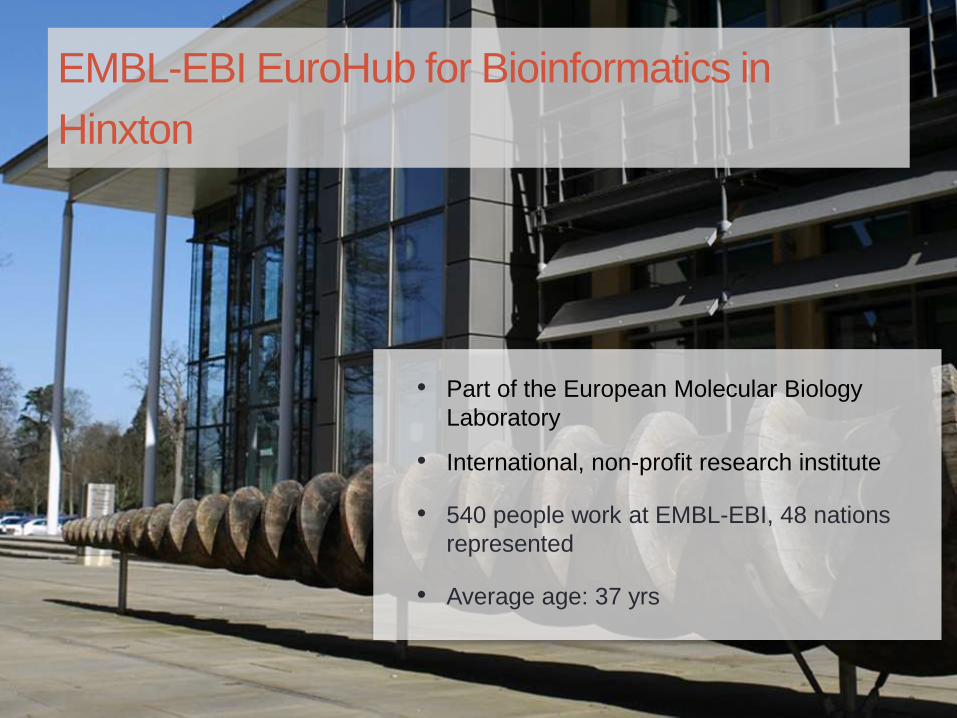
EMBL-EBI EuroHub for Bioinformatics in
Hinxton
• Part of the European Molecular Biology
Laboratory
• International, non-profit research institute
• 540 people work at EMBL-EBI, 48 nations
represented
• Average age: 37 yrs
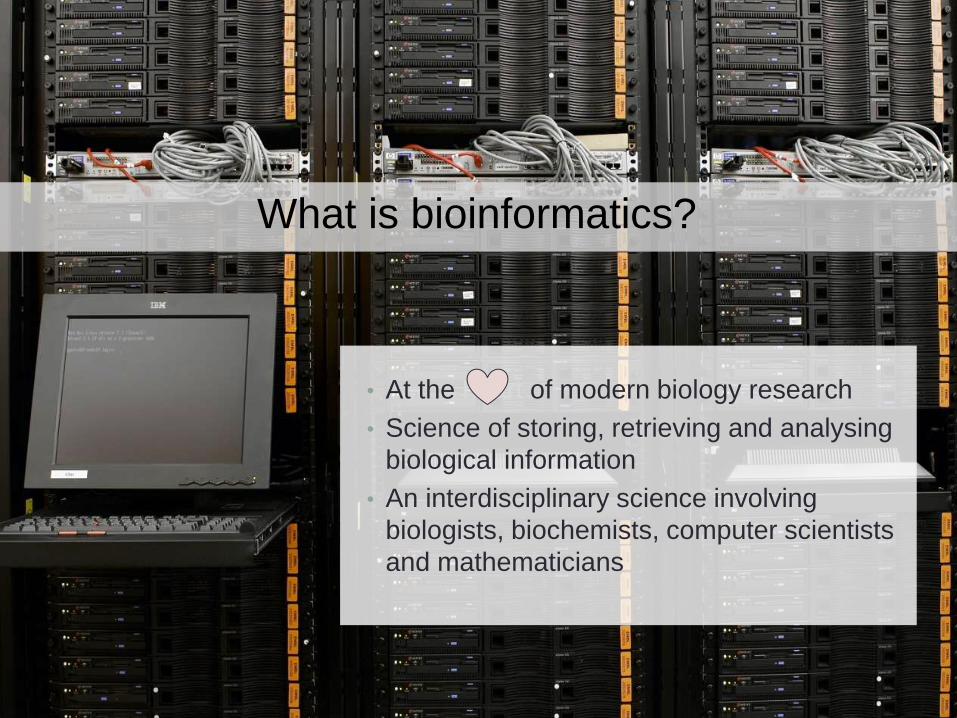
• At the heart of modern biology research
• Science of storing, retrieving and analysing
biological information
• An interdisciplinary science involving
biologists, biochemists, computer scientists
and mathematicians
What is bioinformatics?
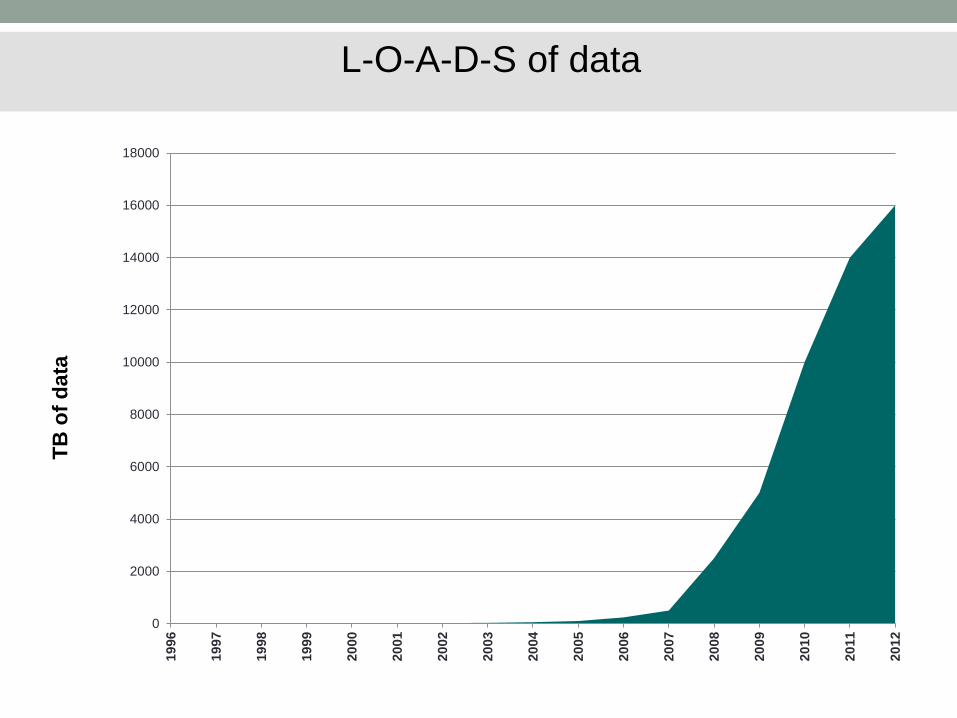
L-O-A-D-S of data
0
2000
4000
6000
8000
10000
12000
14000
16000
18000
19
96
19
97
19
98
19
99
20
00
20
01
20
02
20
03
20
04
20
05
20
06
20
07
20
08
20
09
20
10
20
11
20
12
TB
of
data
The UX design process and
complex data
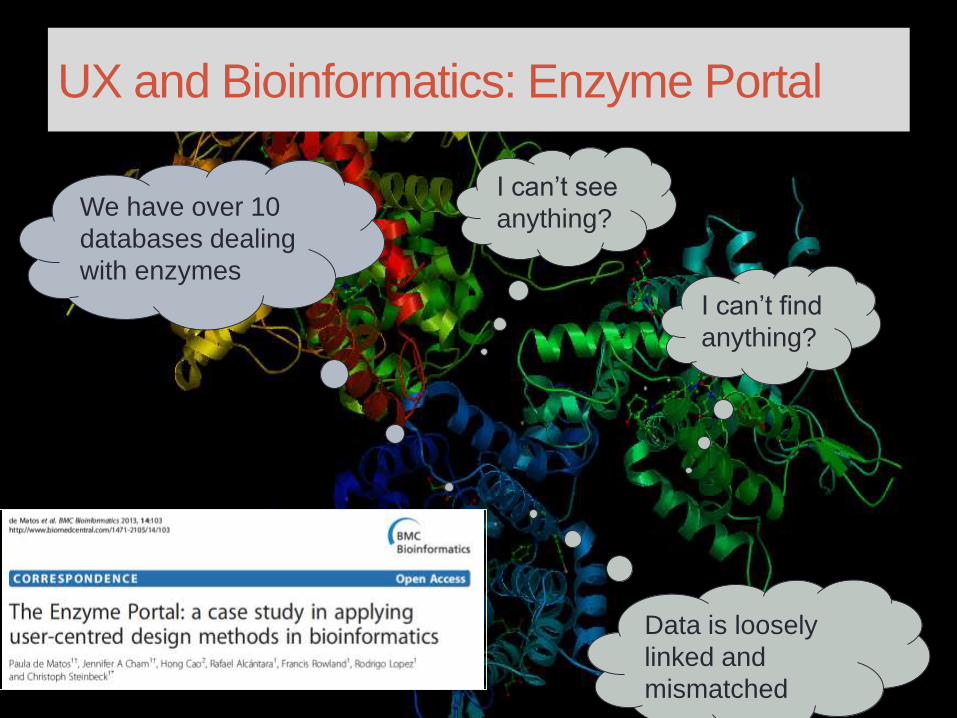
UX and Bioinformatics: Enzyme Portal
I can’t find
anything?
We have over 10
databases dealing
with enzymes
Data is loosely
linked and
mismatched
I can’t see
anything?
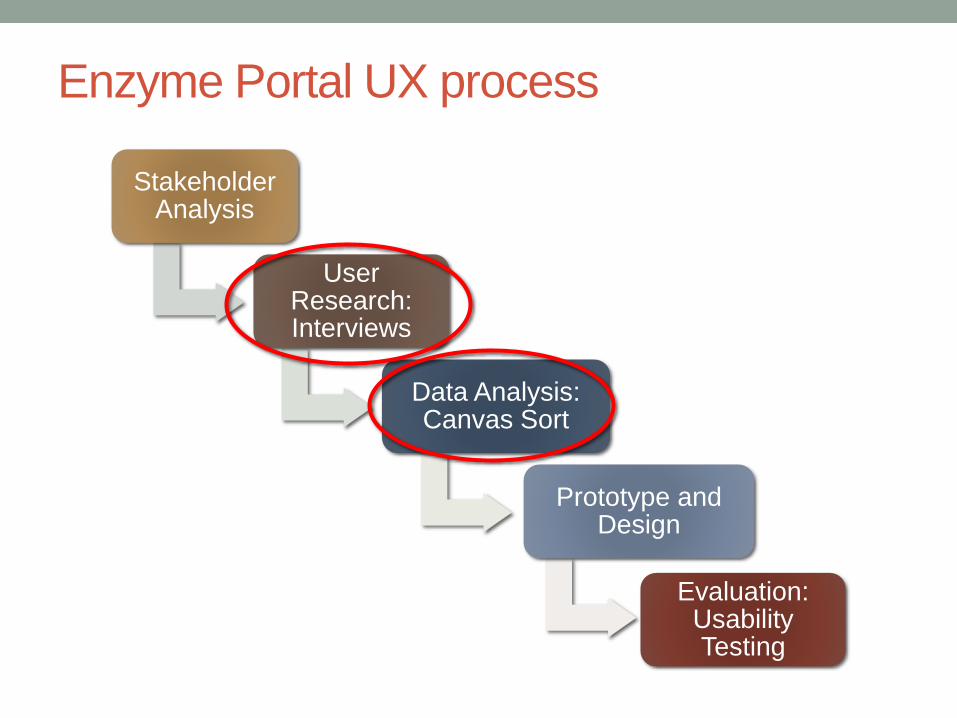
Enzyme Portal UX process
Stakeholder Analysis
User Research: Interviews
Data Analysis: Canvas Sort
Prototype and Design
Evaluation: Usability Testing
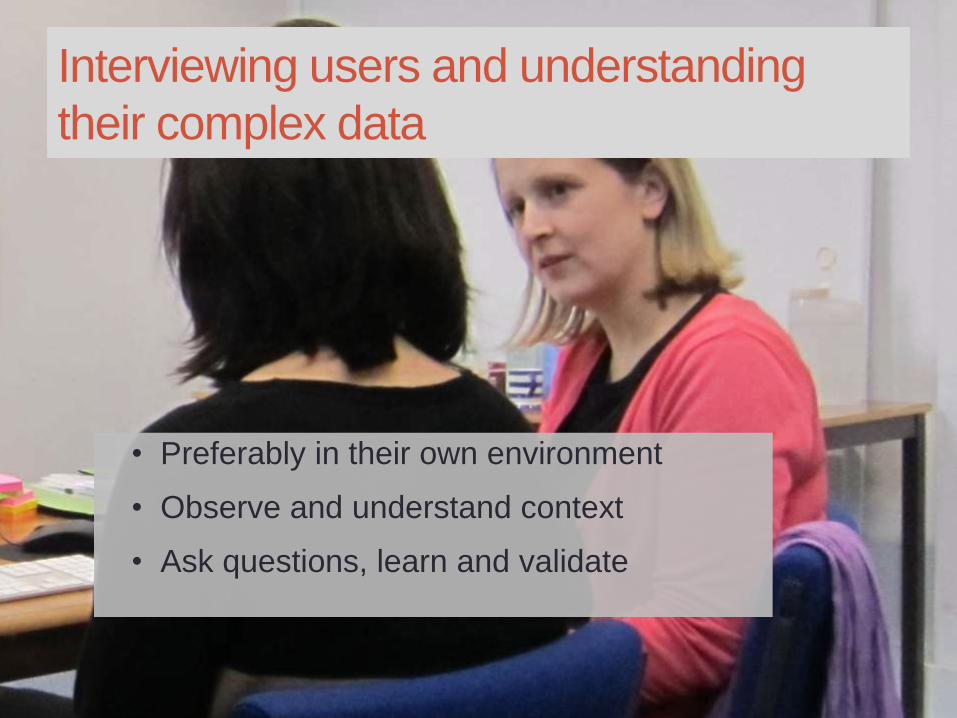
• Preferably in their own environment
• Observe and understand context
• Ask questions, learn and validate
Interviewing users and understanding
their complex data
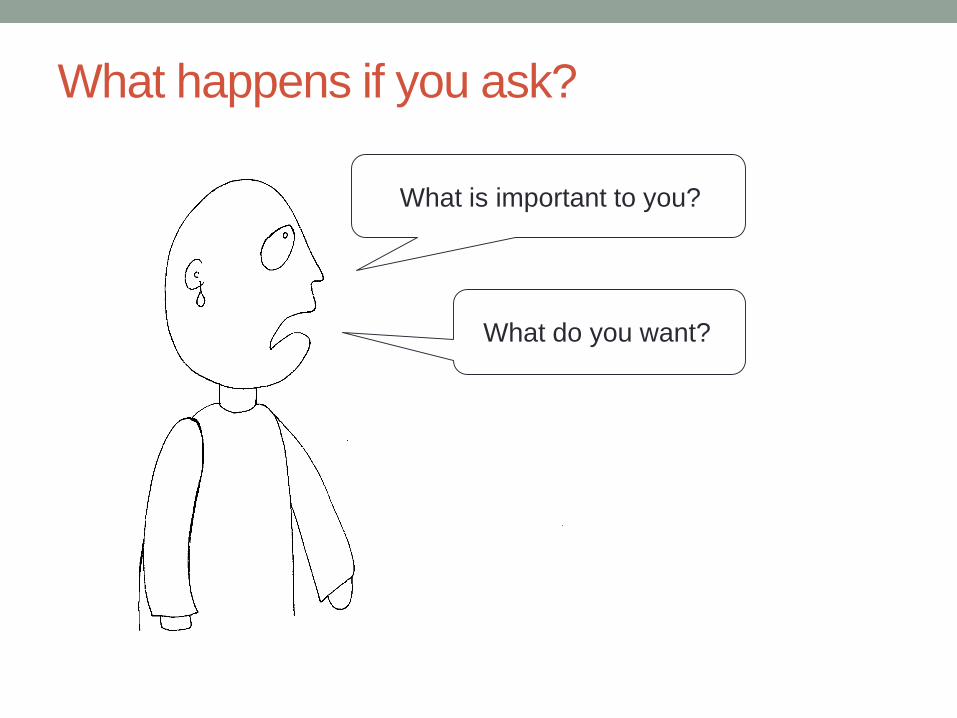
What is important to you?
What do you want?
What happens if you ask?
Interviewing with complex data
• Learn some of the basics in advance.
• Asking participants to remember “critical incidents”.
• Ask open ended questions to help participants discover
the data?
• Don’t make assumptions – data is complex!
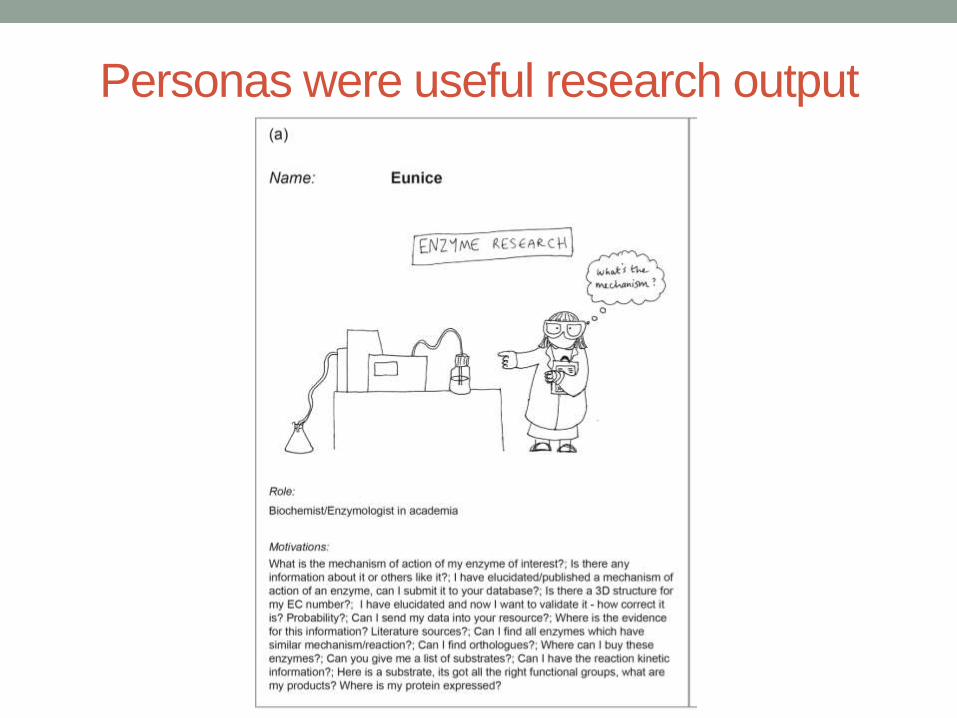
Personas were useful research output
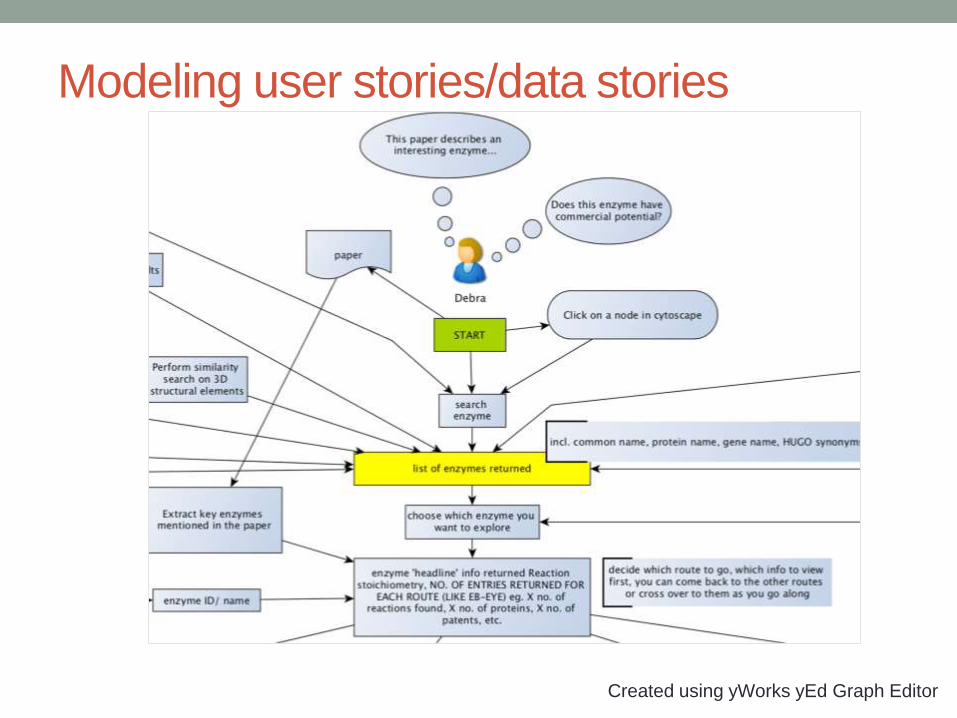
Modeling user stories/data stories
Created using yWorks yEd Graph Editor
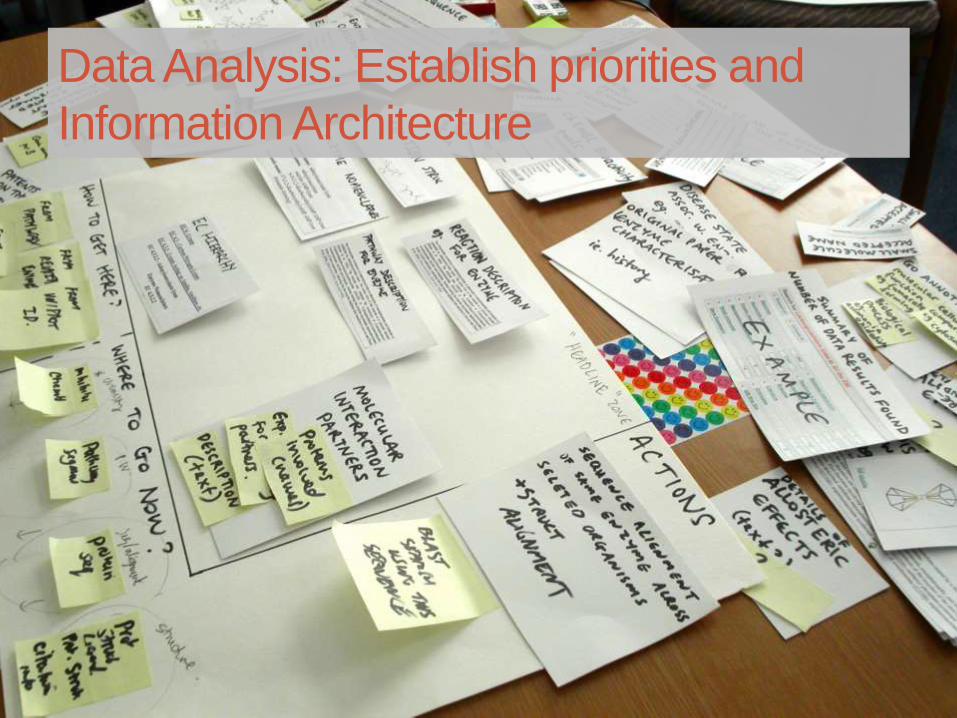
Data Analysis: Establish priorities and
Information Architecture
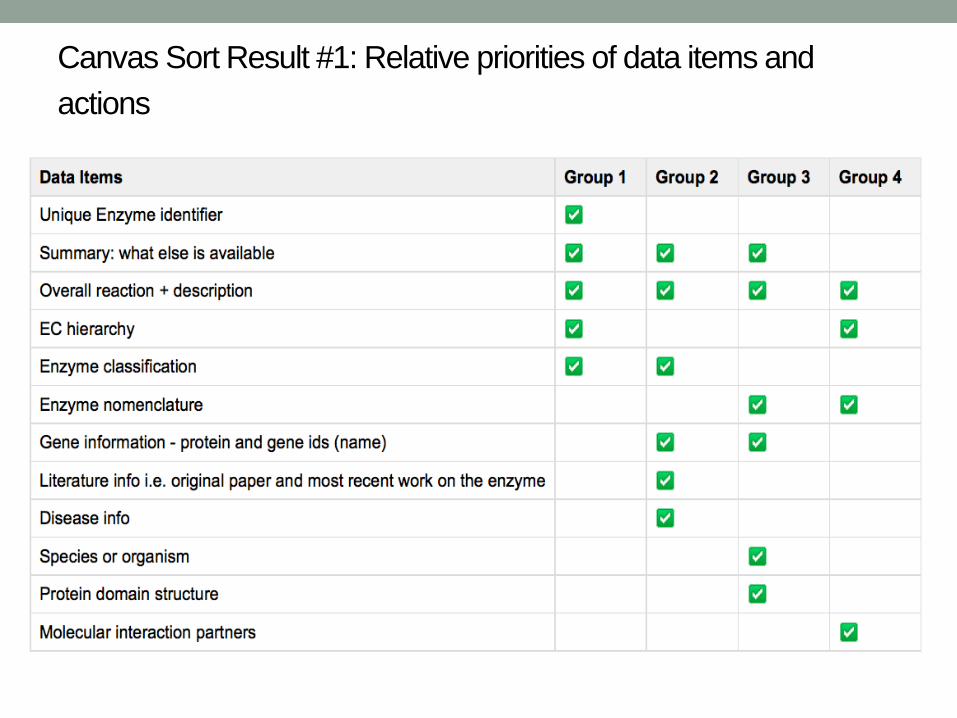
Canvas Sort Result #1: Relative priorities of data items and
actions

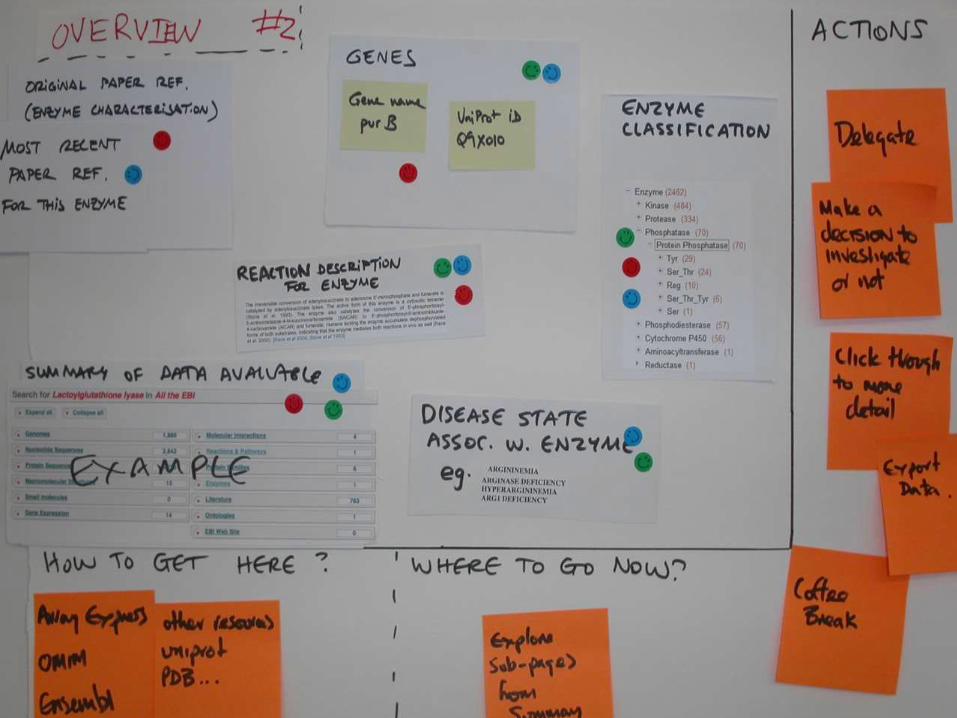
Result #2: Model of the users mental model
UX and information
visualization
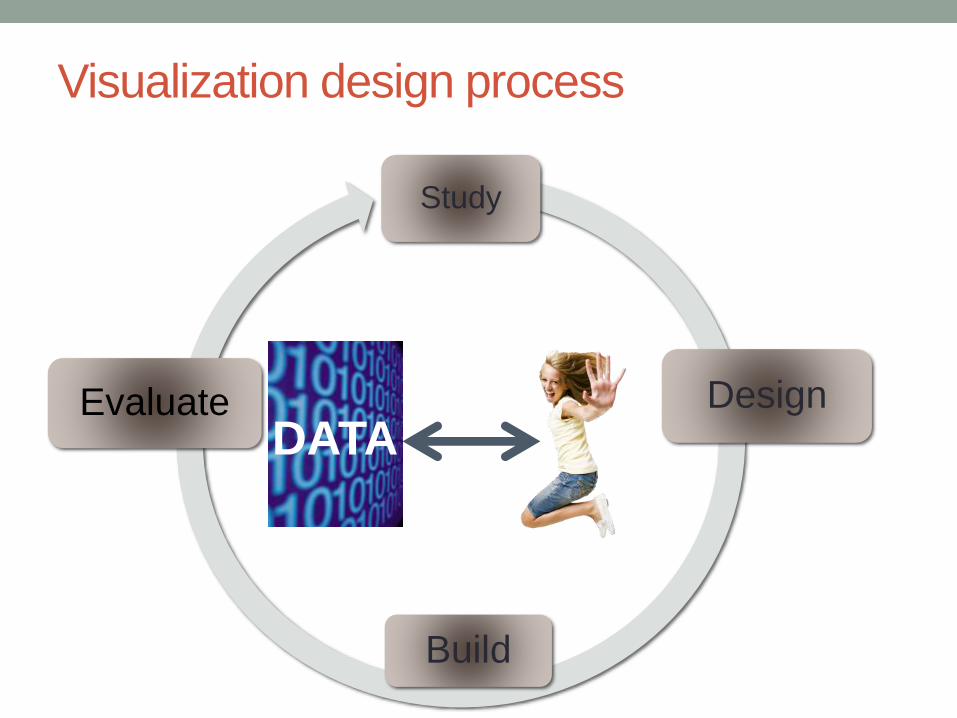
Study
Design
Build
Evaluate
Visualization design process
DATA
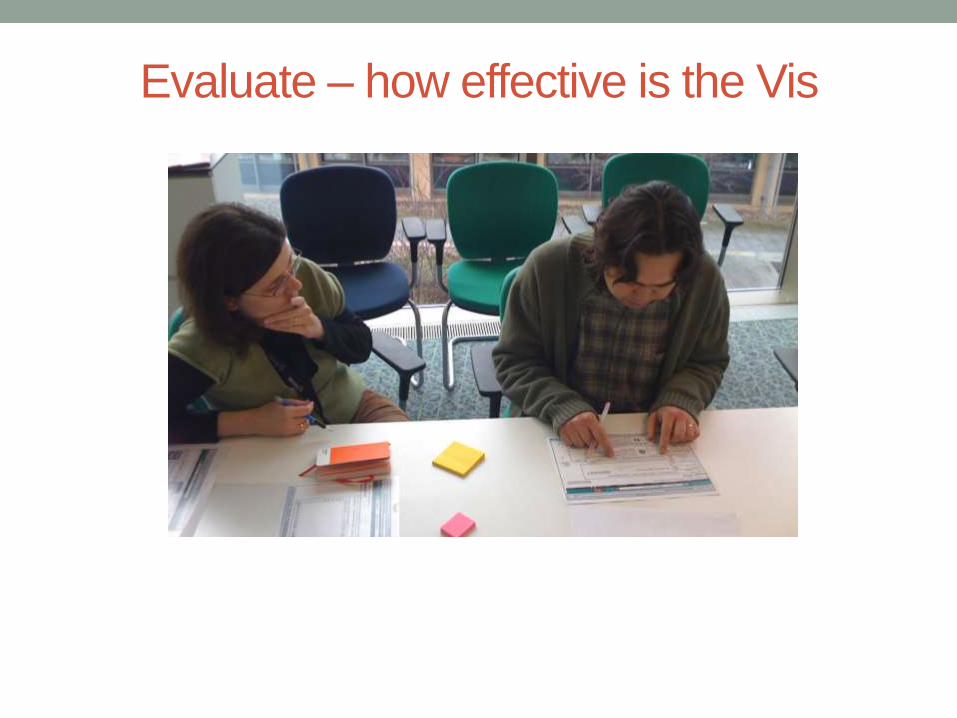
Evaluate – how effective is the Vis
Task 1: User research
Pair up and interview each other for 5 minutes.
Goal: try to uncover further success measures in library
usage.
Use open ended research questions such as
• “Can you describe the last time you used a library?”
• “Why did you go to the library?”
“Crosshairs - success” CC BY www.flazingo.com
Task 2: Sketching a design
Sketch a visualization design to help Jessica uncover
which are the most successful libraries.
Task 3: Design evaluation
• Groups or about 4 or 5.
• Group facilitator needed to control timings.
• Each group member spends 1 minute describing their
design.
• As a group try to find one positive, one limitation and one
enhancement for each design in your group.