utilizing our strengths, aiming at further growth report 2016 utilizing our strengths, aiming at...
TRANSCRIPT

Da
iDo
Ste
el C
o., lt
D. U
TILIzIN
g O
UR
STR
EN
gTH
S, A
IMIN
g AT FU
RTH
ER
gR
Ow
TH a
nn
ua
l r
ep
or
t 2
016
Utilizing oUr strengths, aiming at fUrther growth
Year ended march 31, 2016
annual report 2016

DAIDO STEEL CO., LTD. ranks among the world’s largest manufacturers of specialty steel. with a history
dating back to 1916, the Company has accumulated extensive skills in combining steel scrap with other
materials to achieve the strength, workability and other characteristics to match exacting requirements.
Along with the manufacture of value-added steel, the Company offers many services that leverage its
technological resources. Most services target high-end market sectors that demand the highest levels of
quality and specialization. Daido Steel is one of the leading players worldwide in the manufacture of critical
steel components where nothing less than absolute reliability is acceptable. These components include
automobile transmissions and engine parts as well as components used in ships, aircraft and electric
generators. Daido Steel shares are traded on the First Section of the Tokyo Stock Exchange under the
securities code 5471.
FORwARD-LOOKINg STATEMENTSthis annual report contains forward-looking statements
concerning DaiDo steel Co., ltD.’s and its group
companies’ current plans, projections, strategies and
performance. these forward-looking statements are not
historical facts. rather, they represent the assumptions
and beliefs of Daido steel’s management based on infor-
mation currently available.
they should therefore not be relied upon as the sole
basis for evaluating the Company. Daido steel also
wishes to caution readers that actual results may differ
materially from expectations, and that forward-looking
statements are subject to a number of risks and
uncertainties.
01 FINANCIAL HIgHLIgHTS
02 MESSAgE FROM MANAgEMENT
04 AT A gLANCE
06 REvIEw OF OPERATIONS
10 RESEARCH AND DEvELOPMENT
12 CSR AND THE ENvIRONMENT
13 CORPORATE gOvERNANCE
14 OFFICERS
15 FINANCIAL SECTION
54 DAIDO NETwORK
the Company
ContentS

DaiDo steel Co., ltD. anD ConsoliDateD sUBsiDiariesYears enDeD marCh 31
201620152014201320120
40,000
30,000
20,000
10,000
201620152014201320120
25,000
20,000
15,000
10,000
5,000
OPErATINg INCOmEYears ended march 31
NET INCOmE ATTrIbuTAbLE TO OwNErS OF ThE PArENTYears ended march 31
millions of Yenthousands of U.s. Dollars
2016 2015 2014 2013 2012 2016
for the Year:
net sales 460,578 483,633 457,731 440,428 489,155 4,075,911
operating income 24,432 20,409 18,977 15,426 31,534 216,212
net income attributable to owners of the parent 6,746 10,886 12,616 10,983 22,718 59,699
r&D expenses 5,766 5,301 5,160 4,560 4,360 51,027
Capital expenditures 23,205 30,296 44,404 25,400 39,700 205,354
Depreciation and amortization 22,454 22,437 20,052 19,229 20,464 198,708
at Year-end:
total assets 535,676 588,590 557,522 511,159 512,969 4,740,496
total equity 268,346 292,406 232,152 211,921 198,654 2,374,744
interest-Bearing Debt 136,114 146,208 143,085 146,999 156,336 1,204,549
number of employees (Consolidated) 11,040 10,855 10,709 10,447 10,365 –
number of Consolidated subsidiaries 34 34 33 32 33 –
per share of Common stock (Yen and U.s. Dollars):
Basic net income 15.62 25.10 29.09 25.32 52.37 0.14
Cash Dividends applicable to the Year 7.50 6.50 5.00 4.50 7.50 0.07
roa (%) 4.5 3.8 3.8 3.2 6.3 –
roe (%) 2.8 4.5 5.7 5.4 12.1 –
note: the translation of Japanese yen amounts into U.s. dollar amounts is included solely for the convenience of readers outside Japan and has been made at the rate of ¥113 to $1, the approximate rate of exchange at march 31, 2016.
500,000
400,000
300,000
200,000
100,000
201620152014201320120
NET SALES Years ended march 31
(millions of yen) (millions of yen) (millions of yen)
01
fin
an
Cia
l h
igh
lig
ht
s
FinanCial highlightS

Overview of results for Fiscal 2015
in fiscal 2015, the Japanese economy continued to tread
water amid strong uncertainties for the future, stemming
from slowing growth in the Chinese economy, a steep drop
in natural resource prices, stronger signs of deceleration in
emerging economies from the dollar appreciating against
their currencies as a result of an interest rate hike in the
U.s., and growing geopolitical risks.
Under these economic circumstances, the Daido steel
group readied itself to address changes in the market as
they arose, collaborated with its customers, focused on
growth fields and strengthened its quality, cost and delivery
(QCD) competitiveness with the aim of achieving the tar-
gets in its medium-term business plan.
as a result, the group’s net sales decreased by ¥23,055
million year on year to ¥460,578 million, reflecting a decline
in sales volume and lower sales prices due to a drop in raw
material prices. ordinary income increased ¥3,378 million to
¥25,108 million due in part to a fall in scrap steel prices and
lower energy costs. net income attributable to owners of the
parent declined by ¥4,140 million to ¥6,746 million, owing to
the posting of ¥5,586 million in extraordinary losses for dis-
continuing software development and ¥5,308 million in pro-
visions for environmental remediation.
Outlook for Fiscal 2016
the outlook for the Japanese economy in fiscal 2016 is
clouded with increasing uncertainty with concerns about
slowing growth in China and its ripple effects on the econ-
omies of neighboring asian countries, stagnant growth in
resource-rich countries due to the fall in crude oil and other
commodity prices, currency fluctuation risk due to a variety
of factors including a growing risk-off mentality, and
increasing geopolitical risk. in the steel industry, excess
production capacity in China has materialized as a serious
problem. we recognize the risks entailed by these con-
cerns, and their potential impact on the group.
in this business environment, the Daido steel group is
constantly monitoring trends in markets and at its custom-
ers, and is prepared to respond to any changes. the
group will steadily implement measures for expanding
sales overseas, a target of its medium-term business plan.
we are working diligently to strengthen QCD competitive-
ness as the foundation of our business, with measures to
further improve quality, continuously reduce costs, and
strengthen the delivery system.
given these conditions, our segment forecasts for the
coming fiscal year are as follows.
02
meSSage From managementm
es
sa
ge
fr
om
ma
na
ge
me
nt

SPECIALTY STEEL
we expect demand for structural steel to decline for industrial machin-
ery in tandem with slower growth in the Chinese economy. however,
we project that sales volume will increase slightly on account of mod-
erate growth in global demand for automobiles and a slight increase in
the ratio of domestic production at Japanese automakers. meanwhile,
we anticipate a softening in overseas steel markets amid a global
supply glut caused mainly by China. in addition, steel scrap prices
have begun to increase recently. Under these circumstances, the
Daido steel group will strive to reduce costs further, finish construction
on the secondary melting facility at the Chita plant, and thoroughly
prepare to improve the product mix in the future.
hIgh PErFOrmANCE mATErIALS AND mAgNETIC
mATErIALS
we forecast a minor decline in sales volume of stainless steel due to
weaker demand for hDD applications. aiming to expand sales over-
seas, the Daido steel group is working to increase sales of products in
which it excels by obtaining certifications in europe and the U.s. in
magnetic products, we are focusing on automotive applications amid
the increasing use of electric motors and electronics in cars. we are
concentrating on increasing sales of titanium products in the medical
and biomaterial fields, which are likely to continue growing.
PArTS FOr AuTOmObILE AND INDuSTrIAL EQuIPmENT
in free forgings, Daido steel aims to complete construction of one of
the world’s largest vacuum induction melting (Vim) on schedule in
anticipation of growth in demand over the longer term amid continued
robust demand for commercial aircraft applications. in die forgings, we
are committed to launching operations at our thailand subsidiary that
was established to be a production base for southeast asia in the
future. in turbo-related products, demand is likely to expand as the
ratio of gasoline engines with turbos installed increases, so we will take
steps to increase production of stainless steel turbine housing and
other related products. in engine valves, we are preparing to launch
operations at a new plant in mexico and expand our supply capacity in
north america.
ENgINEErINg
the Daido steel group aims to expand sales of premium stC® (short
time Cycle), which is its mainstay stC® annealing furnace with a new
combustion system installed, as well as increasing sales of vacuum
carburizing furnaces to auto parts makers, and of vacuum sintering
furnaces to magnet product makers.
TrADINg AND SErVICE
in the trading and service segment, demand should generally remain
around the same as in the year under review.
Based on the above, for fiscal 2016 Daido steel fore-
casts consolidated net sales of ¥450.0 billion, operating
income of ¥22.0 billion, ordinary income of ¥23.0 billion
and net income attributable to owners of the parent of
¥15.0 billion. although demand conditions and raw mate-
rial prices are somewhat challenging, the Daido steel
group is making steady progress on measures for future
growth, such as launching large-scale production facilities,
while preparing for sales growth and improvement in the
product mix over the medium and long term.
medium- to Long-Term management Strategy
During the current medium-term business plan that contin-
ues through fiscal 2017, we are likely to see continued
growth in emerging markets despite concerns about
slower economic growth in China. Demand is therefore
likely to strengthen over the medium and long term from
the automobile, natural resource and energy sectors.
Despite customers shifting more production offshore and
increasing local procurement, among other factors that
depress demand, we project that demand for specialty
steel will continue to increase moderately overall.
meanwhile, customers may also demand higher per-
formance from specialty steel. for example, customers
may demand unprecedented performance in terms of the
heat resistance and thinness of specialty steel in order to
maximize combustion efficiency in internal combustion
engines amid tightening carbon dioxide regulations to
combat global warming. the Daido steel group intends
to work more closely with its customers to solve these
challenging issues.
Daido steel is celebrating its 100th anniversary in 2016.
we aim to contribute to the development of the world over
the next 100 years by continuing to produce new types of
specialty steel while collaborating with our customers.
June, 2016
takeshi ishiguro
president
03
me
ss
ag
e f
ro
m m
an
ag
em
en
t

300,000
200,000
100,000
2015 20160
8,000
4,000
2,000
6,000
2015 20160
300,000
200,000
100,000
2015 20160
15,000
10,000
5,000
2015 20160
150,000
100,000
50,000
2015 20160
2,000
1,500
1,000
500
2015 20160
PArTS FOr AuTOmObILE AND INDuSTrIAL EQuIPmENT
hIgh PErFOrmANCE mATErIALS AND mAgNETIC mATErIALS
SPECIALTY STEEL
at a glanCe
NET SALES Years ended march 31(millions of yen)
NET SALES Years ended march 31(millions of yen)
NET SALES Years ended march 31(millions of yen)
ShArE OF NET SALES(%)
ShArE OF NET SALES(%)
ShArE OF NET SALES(%)
OPErATINg INCOmE Years ended march 31(millions of yen)
OPErATINg INCOmE Years ended march 31(millions of yen)
OPErATINg INCOmE Years ended march 31(millions of yen)
21.6%37.0% 33.7%
MAIN PRODUCTSspecialty steel for automotive parts, indus-trial machinery parts, electrical machinery parts, construction, tool steel, etc.specialty steel products and materials manufacturing, distribution, raw materials sales, transportation and logistics
MAIN PRODUCTSstainless steel, nickel-based alloys, electri-cal and electronics parts, magnetic material products (oa·fa motors, automotive meters, sensors, measuring device components, etc.), alloy powder (magnetic powder for heV), titanium products (medical titanium alloys, shape-memory alloys), welding wire
MAIN PRODUCTSDie forging, precise hot forging, welded parts (automotive parts and bearing races) / open die forging (parts for boats and ships, industrial machines, heavy electric machines, steel making equipment, chemical equipment, oil drilling rigs, and spacecraft and aircraft) / Casting (manga-nese railway rails, components for automobiles, industrial machines, electric machines and furnaces, advanced cast steel products, etc.) / precision casting (automotive, industrial machines, electric machines, telecommunications equipment, etc.) / engine valves, compressors, hydraulic equipment, machine tool parts
04
at
a g
la
nC
e

30,000
20,000
10,000
2015 20160
3,000
1,000
2,000
2015 20160
15,000
5,000
10,000
2015 20160
1,500
500
1,000
2015 20160
ENgINEErINg TrADINg AND SErVICE
NET SALES Years ended march 31(millions of yen)
NET SALES Years ended march 31(millions of yen)
ShArE OF NET SALES(%)
ShArE OF NET SALES(%)
OPErATINg INCOmE Years ended march 31(millions of yen)
OPErATINg INCOmE Years ended march 31(millions of yen)
5.7% 2.0%
MAIN PRODUCTSsteel making equipment, industrial furnaces and facilities, environmental equipment (for drain, exhaust, waste disposal and treat-ment facilities), machine tools, machine maintenance
MAIN PRODUCTSsale of group company products, welfare services, real estate and insurance businessgolf course management, analysis busi-ness, outside software sales business
05
at
a g
la
nC
e
Overview of businessspecialty steel, the Company’s core business, generates
approximately 37% of consolidated net sales. specialty steel is
made by combining steel with alloys to add value in the form of
properties such as resistance to heat, abrasions or rust.
Because a range of special properties can be achieved by vary-
ing the type and amount of alloy, one of the special features of
the business is that products are developed to meet the specific
applications required by the user. the automobile and industrial
machinery sectors are the primary users of specialty steel,
accounting for about 80% of sales in this business segment.
results of Operationsorders for mechanical construction steel started to recover
gradually from the third quarter after inventory adjustments
that began early on in the fiscal year in the automotive sector,
a major source of demand for this steel, ran their course in the
fall. however, due mainly to a decline in use of this steel in
industrial and construction machinery from the summer
onward, caused by the economic slowdown in China, sales
volume declined from the previous fiscal year. sales in tool
steel remained robust, particularly from the automotive indus-
try in Japan.
meanwhile, the cost of steel scrap, the main raw material,
declined substantially from the summer onward as overseas
demand for steel scrap declined, particularly in south Korea,
after an oversupply of steel drove China to ramp up its exports
of cheaply priced intermediate steel.
as a result, the specialty steel segment’s net sales in fiscal
2015 fell 9.8% year on year to ¥170,514 million, due primarily to
a decline in sales volume and sales prices, which were driven
down by the falling raw material costs. in contrast, operating
income increased by ¥4,382 million to ¥7,561 million, with
falling steel scrap prices and lower energy costs contributing to
the increase.
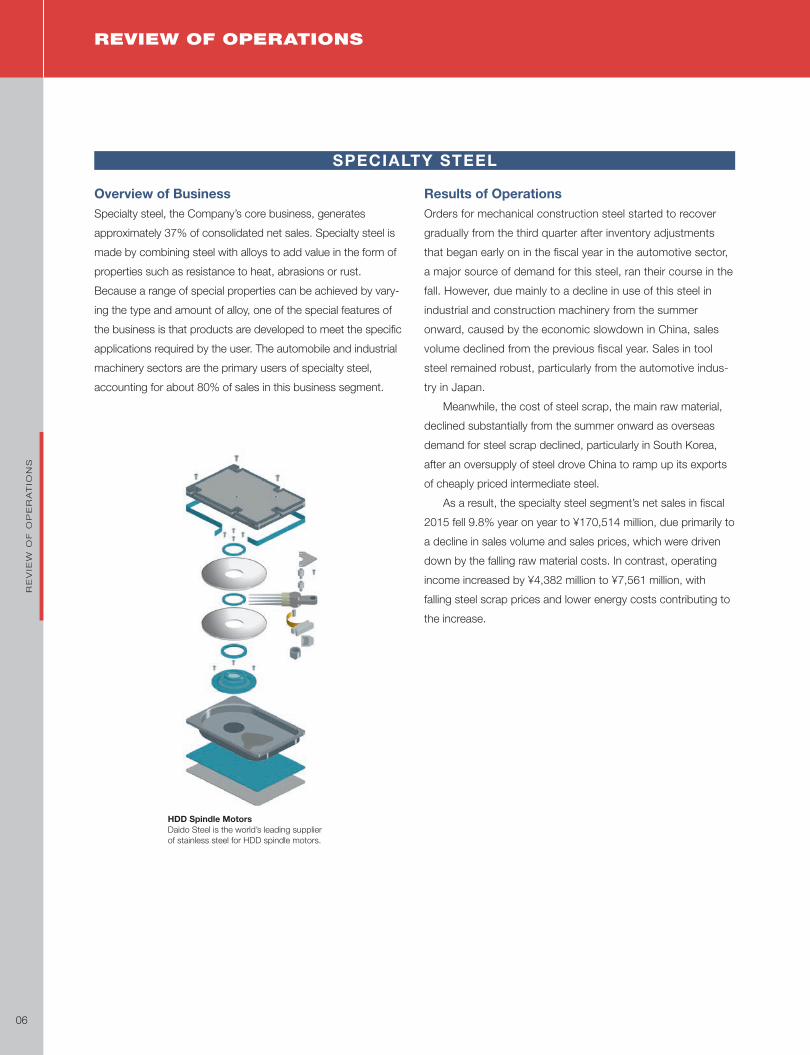
hDD Spindle motorsDaido steel is the world’s leading supplier of stainless steel for hDD spindle motors.
SPECIALTY STEEL
review oF operationS
06
re
Vie
w o
f o
pe
ra
tio
ns

Overview of businessthis segment, which accounts for roughly 34% of consolidated
net sales, manufactures and sells high performance materials
and magnetic materials used chiefly in computers, automobiles,
mobile phones and consumer electronics. notably, Daido steel
holds the world’s largest market share as a supplier of magnets
for spindle motors* for hard disk drives (hDD).
Key products include rare earth magnets (used in spindle
motors for hDD and other products), high alloys, titanium
products and high performance powder metal products, and
electromagnetic materials.
* spindle motor: the motor used to rotate hard disk drives installed in computers.
results of Operationssales volume of stainless steel products declined year on year
as demand was reduced by a decline in demand for hDDs in
response to sluggish sales of pCs and expectations for lower
nickel prices. on the other hand, net sales of electromagnetic
materials increased, driven by robust demand for use in motors
for electric power steering systems in automobiles, and strong
sales of in titanium products for medical application in Japan
and overseas. another contributing factor was the consolidation
of intermetallics Japan Corporation as a subsidiary at the end of
the previous fiscal year. meanwhile, net sales of high alloys
declined year on year. this was due mainly to persistently slug-
gish demand for use as lead frames for semiconductors. other
factors weighing on sales included a slump overseas in powder
metal products for use in the automotive industry and lower
sales prices driven down by a fall in the price of nickel and other
raw materials.
as a result, net sales for high performance materials and
magnetic materials in fiscal 2015 decreased 4.0% year on year
to ¥155,250 million, while operating income decreased by
¥1,186 million to ¥12,331 million.
NEOQuENCh-P (NdFeb Polymer-bonded magnets)magnets for precision, high-speed motors used in mobile phones, office automation (oa) equipment and other products; currently the world’s most popular magnet for hDD spindle motors.
hIgh PErFOrmANCE mATErIALS AND mAgNETIC mATErIALS
07
re
Vie
w o
f o
pe
ra
tio
ns

Overview of businessthis segment contributes around 22% of consolidated net
sales. it manufactures die forged parts such as crankshafts
using specialty steel, precision cast parts for use in gears and
turbochargers (used in diesel engines to improve fuel efficiency
and reduce exhaust gases), as well as engine valves, jet engine
shafts and parts for gas turbines. most of the auto parts sold in
this segment use materials that were developed through joint
projects with automakers to meet their exacting requirements.
these parts can therefore lower processing expenses at cus-
tomers’ factories as well as contribute to reducing the weight of
finished products.
many products in this segment are leading products in
their respective market categories, such as aircraft jet engine
shafts and marine diesel engine valves. Daido steel also has a
high market share in numerous other product categories,
including automobile engine valves and turbine disks. we will
continue to develop and launch new products that differentiate
us from competitors and support our position as a provider of
advanced products.
in addition to specialty steel supplied by the specialty steel
segment of the group, some steel materials used in this seg-
ment are manufactured in-house.
results of Operationsnet sales of free forged products decreased year on year. slug-
gish demand for use in oil rigs and plants caused by falling oil
prices absorbed strong demand for use in civilian aircraft.
meanwhile, sales volume of die forged products declined,
mainly as a result of sluggish truck sales in the emerging mar-
kets. on the other hand, net sales of engine valves increased
year on year. this was attributable to a boost in orders received
atop strong sales of automobiles in north america. sales of
engine-related castings and precision cast products rose, driven
by an increase in turbo charger-related demand.
as a result, net sales in the parts for automobile and indus-
trial equipment segment for fiscal 2015 rose 0.3% year on year
to ¥99,679 million, while operating income increased by ¥274
million to ¥1,298 million.
hot, high-speed Precision ForgingsDaido steel is one of the largest manufacturers of hot, high-speed precision forgings.
PArTS FOr AuTOmObILE AND INDuSTrIAL EQuIPmENT
08
re
Vie
w o
f o
pe
ra
tio
ns

Overview of businessthis segment generates about 6% of consolidated net sales.
major activities include the manufacture of steelmaking equip-
ment, industrial furnaces, and associated equipment. this seg-
ment also manufactures environmental equipment for the
treatment of wastewater, gas emissions and waste materials
(mainly to public-sector clients with incinerated ash melting
systems for urban waste) and machine tools.
with respect to environmental equipment in particular, the
operation and engineering technologies we have fostered over
the years support our cutting-edge engineering business, in
which we constantly maintain a grasp of current market needs.
the many new types of equipment and technologies that this
segment has created contribute to environmental preservation
and energy reduction in a wide variety of settings. operations
also include maintenance and management of this machinery
and equipment.
Daido Arc Process (DAP)
results of Operationsengineering segment sales for fiscal 2015 rose 14.0% year
on year to ¥26,104 million, while operating income increased
by ¥419 million to ¥2,071 million. this was mainly attribut-
able to strong overseas sales of stC® (short time Cycle)
annealing furnaces, a main product for the segment, as well
as an increase in sales of vacuum carburizing furnaces for
automobile manufacturers and vacuum sintering furnaces for
magnet manufacturers.
Overview of businessthe major activities of this segment, which accounts for approx-
imately 2% of consolidated net sales, include the sale of prod-
ucts made by group companies, employee benefits services,
real estate and insurance services, golf course management,
analytics, and sales of software to external customers.
results of Operationsnet sales in the trading and service segment for fiscal 2015 fell
13.7% year on year to ¥9,029 million, while operating income
increased by ¥129 million to ¥1,173 million. the decline in
sales was mainly attributable to a fall in information system-
related revenues.
TrADINg AND SErVICE
ENgINEErINg
09
re
Vie
w o
f o
pe
ra
tio
ns

reSearCh anD Development
the Daido steel group’s basic management policy is to leverage its advanced tech-nology capabilities in specialty steel to “foster a corporate culture of creativity and originality that contributes to the 21st century society.” Based on this policy, the group conducts a proactive program of research and development (r&D) to expand new products and businesses and strengthen the foundations for existing businesses.
we are pursuing r&D for new products, materials and technologies, primarily through the Daido Corporate research & Development Center, which houses the special steel research lab, electromagnetic material research lab, and process technology research lab. we employ a total of 275 researchers throughout the Daido steel group.
r&D expenses for the Daido steel group during the fiscal year under review amounted to ¥5,766 million. an explanation of our r&D efforts by segment, including purpose, major achievements, and expenditures follows.
(1) Specialty Steelin this segment, r&D includes basic material development, such as automotive structural materials and tool steel, and process innovations ranging from steelmaking, refining and solidification to quality assurance.
r&D costs for the fiscal year under review in this segment totaled ¥1,459 million. the following is one of our major achievements in this area.• Development of bearing steel that resists hydrogen
embrittlementearly-flaking contact fatigue of bearings used in automotive engine electrical components and continuously variable trans-missions (CVt) is thought to be caused by the diffusion of hydrogen from the lubricant oil, and has been problematic in recent years. Carbonitriding is known to be effective for improv-ing resistance to rolling contact fatigue caused by hydrogen embrittlement. at first, it was thought that minute nitride par-ticles were behaving like a hydrogen trap site, and there were reports that durability could be improved by adding more chro-mium or manganese to the alloys. however, very little was known about the details of the hydrogen trap mechanism.
Daido steel clarified the mechanism of this life-extending process by extracting data on the surface nitrides, on the hydrogen evolution curve, on the relationship between the volume of surface nitrides and resistance to rolling contact fatigue caused by hydrogen embrittlement, and on the hydro-gen evolution curve of the nitride hydrogen trap site itself.
we aim to leverage this knowledge to commercialize bear-ing steel that resists hydrogen embrittlement.
(2) high Performance materials and magnetic materials
in this segment the Daido steel group conducts r&D focusing on developing materials that resist corrosion and heat, high-grade strip steel, welding materials, magnetic materials and electronic devices.
r&D costs for the fiscal year under review in this segment totaled ¥2,695 million. the following are some of our major achievements in this area.• Enhancement of technology for mass producing
ultra-high performance PLP magnets with low levels of heavy rare-earth elements
having developed the technology for mass producing plp (pressless process) magnets, which provide both high magne-tism and ultra-high thermal resistance with substantially reduced levels of heavy rare-earth elements, we began their manufacture in 2013 at intermetallics Japan Corporation, a joint venture established with mitsubishi Corporation and molycorp, inc. of the United states. intermetallics Japan was consolidated as our wholly owned subsidiary in march 2015 and brought under new management, we improved the mass production technology to maximize yield and broaden the scope of application for the magnets.• Development of STArmESh as a copper-alloy target
for producing metal meshwe developed a copper-alloy target material called starmesh for producing metal mesh with excellent conductivity and a low reflectance ratio, for use as a wiring substrate in touch panels. at present, indium tin oxide (ito) is the most commonly used transparent conductive film in the industry. however, materials with higher conductivity are now needed as the panels have begun to grow larger. one idea was to replace ito using exist-ing metal mesh technology that offers higher conductivity, but the characteristic reflective glare of metal mesh had to be reduced before this idea could work.
r&D ExPENDITurESYears ended march 31
(millions of yen)
201520142013 20160
6,000
2,000
4,000
10
re
se
ar
Ch
an
D D
eV
el
op
me
nt

Daido steel’s solution, starmesh offers a number of advantages. first, it can be used as a target material in the same sputtering process used to produce ito films. second, it has a reflectance ratio as low as 10% that can be used, without much modification to the process, to produce wiring with double-digit conductivity and good adhesion to glass and polyethylene terephthalate (pet) resin. third, it is a copper-based alloy that can be etched easily with thin circuit lines.
however, the biggest advantage of all is that starmesh can be used to produce touch panels at a lower cost than ito because it contains no indium or other rare metals.
(3) Parts for Automobile and Industrial Equipmentr&D in this segment concentrates on development of turbo-chargers, engine valves and other automotive parts, as well as parts for various types of industrial machinery.
r&D costs for the fiscal year under review in this segment totaled ¥1,453 million. the following is one of our major achievements in this area.• Development of marine engine exhaust valves made
with DSA760—a highly corrosion resistant nickel-based alloy that remains very hard at high temperatures
Daido steel developed the nickel based superalloy Dsa760 possessing a high degree of hardness and high corrosion resis-tance as a material for variable mechanism components in diesel turbo chargers. we recently upgraded the manufacturing technology and heat treatment method of Dsa760 to enable even larger mechanical products to obtain a benefit from its hardness at high temperatures and corrosion resistance. in demonstration trials conducted with a diesel engine manufac-turer in Japan, we confirmed that marine engine exhaust valves made from this Dsa760 reduced the speed of wear from high temperature corrosion compared to other conventional nickel-based alloys. after receiving evaluation that Dsa760 was capa-ble of extending the durability of the exhaust valves by approximately 2.5 times compared to conventional nickel-based alloys, we decided to commercialize Dsa760 as a material for marine engine exhaust valves. a large-scale vacuum induction melting (25 t Vim) facility is scheduled to go into operation at our shibukawa plant in fiscal 2016, giving us the capacity to respond to an increase in demand for Dsa760 ranging from small components to large components.
(4) Engineeringengineering r&D focuses on the development of environmental conservation and recycling equipment, and a variety of energy-saving industrial furnaces.
r&D expenditures in this segment during the fiscal year under review amounted to ¥157 million. the following is one of our major achievements in this area.• Development and launch of DINCS, our new
combustion systemour machinery Division has been working to develop a line of clean-burning industrial furnaces in response to the increasing need to reduce greenhouse gas emissions. in 2012, the division began developing the Daido innovative neo Combustion system (DinCs). the goal behind DinCs was to acquire the manufacturing knowhow and establish the basic specifications for developing a new generation of radiant tube combustion systems as fuel efficient as the regenerative burners currently in use in our mainstay stC® furnaces.
DinCs is equipped with a heat exchanger manufactured using silicon carbide 3D printing technology. this heat exchanger is used to efficiently recover the sensible heat from combustion exhaust for conversion as preheated combustion air. the system will dramatically improve the fuel efficiency of our stC® furnaces while reducing their greenhouse gas emissions. with the aim of completing the development and launch of DinCs in fiscal 2015, we tested the new system in furnaces to obtain data on combustion performance. we also confirmed that DinCs was substantially less costly to maintain than regen-erative burners and that it also contributed to improving the temperature distribution within the furnace. the tests confirmed that DinCs is more than sufficient for addressing market needs.
looking ahead, we aim to protect the global environment and contribute to the sustainable growth of our customers through the further popularization of DinCs.
11
re
se
ar
Ch
an
D D
eV
el
op
me
nt

1,000 tons CO2/year
Kg of CO2/ ton of production
(Forecast)161514131211100908070605040302010099
0
500
1,000
1,500
2,000
0
200
400
600
800
–5.4%
–25.1%
–19.0%–18.1% –25.0%
–22.9% –26.8%–27.8%
–23.6%–33.8%
basic Policythe Daido steel group considers it extremely important for contemporary corporations to take on a role that extends beyond economic activities and to contribute to the sus-tainable development of society through environmentally conscious activities and involvement in the resolution of social issues.
the Daido steel group is playing a part in helping to create a recycling-oriented economy and society through its primary business operations: the manufacture and sale of specialty steel largely created from recycled scrap steel. Daido steel is also engaged in a broad range of initiatives, including developing a variety of environmental activities, abiding firmly by our corporate ethics, striving for disclosure to increase the transparency of management, and creating a safe and pleasant place for employees to work.
major InitiativesPreventing Global Warmingthe first commitment period for the Kyoto protocol ran from 2008 to 2012. in that time frame, Daido steel aimed to reduce its Co2 emissions volume by 10% compared to the 1990 level in accordance with the guidelines of the Japan iron and steel federation. we worked to achieve this goal by expanding the use of exhaust heat recovery in heating furnaces, shifting our fuel source from heavy oil to natural gas, and improving the yield ratio through an increase in the ratio of production by continuous casters. Due to the effects of cumulative investments of ¥5.0 billion made from 2006 to 2012, operational improvements and changes in production levels, annual Co2 emissions from 2008 to 2012 decreased by 24.7% on average. in addition, in fiscal 2014 a cutting-edge, energy-efficient electric arc furnace was
ENErgY CONSumPTION AND CArbON DIOxIDE EmISSIONS VOLumE
Co2 emissions volume (left scale)Co2 emissions per ton of production (right scale)
Co2 emissions coefficient for electric power: 0.374 kg of Co2 /kwh
installed at the Chita plant at a cost of ¥19.8 billion with rationalizing effects evident throughout the year, resulting in a 3% improvement in Co2 emissions per ton of production with the same level maintained in fiscal 2015. going for-ward, in accordance with the objectives of the Commitment to a low Carbon society ongoing plan for fiscal 2013 to fiscal 2020 formulated by the Japan iron and steel federa-tion and Japan Business federation (Keidanren), we will continue implementing further reform measures, such as introduction of energy-saving advanced technologies, reductions in the number of heat exchangers, improve-ments in the yield ratio, and production in optimal areas.
Strengthening the CSR Promotion Frameworkthe Daido steel group has responded to the needs of our various stakeholders by establishing the human resources labor Committee and various other committees as parent organizations to support Csr activities, such as the environ-ment and energy Committee. with a view to further strength-ening this framework, in fiscal 2007, the Csr Committee was established to supervise general Csr activities. mem-bers of the Csr Committee formulate group-wide policies and action plans with the aim of unifying and expanding Csr activities across all group companies and divisions.
starting January 2013, the environment and energy Committee was split into two independent committees (namely, the environment Committee and the energy Com-mittee) to promote Csr activities in a more fulfilling way.
for details, please refer to the annually issued Csr report.Url: http://www.daido.co.jp/csr/data/report.html(Japanese only)
CSr anD the environment
12
Cs
r

Corporate governanCe
basic PolicyDaido steel views corporate governance as one of the key
issues for management in today’s rapidly changing business
environment. we strive to increase management efficiency,
accelerate and improve decision-making, and ensure man-
agement transparency.
in addition, in order to clarify our responsibilities as a com-
pany contributing to society, Daido steel has established a
risk management Committee. the Company has also imple-
mented the Daido steel Corporate Code of ethics, and is
working to improve its basic structure as a company open to
society. in order to ensure the reliability of its financial report-
ing, the Company has set up an internal Control Committee.
governance SystemDaido steel uses an audit & supervisory Board system. By
using a system that supervises and oversees business execu-
tion through a Board of Directors, including two external
directors, and an audit & supervisory Board, including two
external audit & supervisory Board members, Daido steel
enhances its corporate governance, optimizes and acceler-
ates decision-making and secures fair and transparent
management.
at the 91st shareholders’ meeting held on June 26, 2015,
the Company also instituted an executive officer system to
clearly distinguish the responsibilities of strategy formulation
and management oversight functions and business
execution.
Internal Control SystemRisk Management Initiatives
Daido steel emphasizes risk management and legal compli-
ance in its management. to this end, the Company has set
out basic points for risk management in the risk manage-
ment regulations. in addition, the risk management Commit-
tee discusses management of projected upcoming and latent
risks within the group. the Company has appointed a direc-
tor who is responsible for the Company-wide supervision of
risk management and compliance.
in preparation for a major accident or other problem,
relevant information is shared with all concerned people, and
speedy and smooth countermeasures are formulated. the
Company has also formulated regulations for emergency
countermeasures in the event of a major accident, aimed at
minimizing the impact of the accident or other problem on
business activities, and disseminated the regulations to all
employees and group companies.
furthermore, in response to any major share-purchase
activity (for example, purchases of the Company’s shares
aimed at increasing the voting rights of a specific sharehold-
ers’ group to over 20%), Daido steel will implement takeover
defense measures from the perspective of ensuring and
improving corporate value and, by extension, the shared
beneficial interests of all shareholders.
Efforts to Enhance Compliance
Daido steel has established the Daido steel Corporate Code
of ethics and the Daido steel Code of Conduct, and works to
disseminate them to all employees and group companies.
the Company also maintains a hotline for consultation and
reporting by employees regarding compliance, as well as
directors in charge of compliance and risk management,
divisions in charge and outside attorneys.
Efforts to Ensure the Reliability of Financial Reporting
in order to ensure the reliability of financial reporting and
enhance the level of response of the Company and group
companies to J-soX, the Daido steel group prescribes the
basic points for system improvement and operation in the
internal Control regulations and has established an internal
Control Committee.
13
Co
rp
or
at
e g
oV
er
na
nC
e

ExECuTIVE OFFICErS
hajime amano
Yoshiaki mori
hirotaka Yoshinaga
Yuji Kamiya
tomoki hanyuda
Kimihiko seki
hiroshi matsui
Kunihito Kawanishi
tadashi shimao
ChAIrPErSON OF ThE bOArD OF DIrECTOrS, rEPrESENTATIVE ExECuTIVE DIrECTOr
PrESIDENT & CEO, rEPrESENTATIVE ExECuTIVE DIrECTOr
rEPrESENTATIVE ExECuTIVE DIrECTOrS, ExECuTIVE VICE PrESIDENTS
mANAgINg ExECuTIVE OFFICEr
DIrECTOr, mANAgINg ExECuTIVE OFFICEr
mANAgINg ExECuTIVE OFFICErSDIrECTOrS (OuTSIDE DIrECTOrS)
STANDINg COrPOrATE AuDITOrS
toshinori Koike
shigenobu tokuoka
COrPOrATE AuDITOr
Yukichi ozawa
oFFiCerS
hajime takahashi
akira miyajima
Kazuto tachibana
michio okabe tsukasa nishimura
satoshi tsujimoto
takeshi ishiguro
susumu shimura takeshi muto Kazuhiko hirabayashi tadashi imai hitoshi tanemura
mEChANISm FOr buSINESS ExECuTION, AuDIT, SuPErVISION AND INTErNAL CONTrOL (as of June 28, 2016)
Executive Board
Election and dismissal
Election and dismissal
Election and dismissal
Advises and supports
Election and dismissal
Reports
Reports
Audits
Audits
Audits
Accounting audit
board of Directors 9 directors including 2 external directors
Management Meeting
Committees• Risk Management
Committee• Internal Control
Committee, etc.Executive Officers
President and Chief Executive Officer
Each business division
group companies
Auditing Department (internal audits)
Accounting Auditor(independent auditor)
Audit & Supervisory board
3 auditors including 2 external auditors
Shareholders’ meeting
takaaki taketsuru
tetsuya shimizu
DIrECTOrS, mANAgINg ExECuTIVE OFFICErS
14
Co
rp
or
at
e g
oV
er
na
nC
e
of
fiC
er
s
16 ManageMent’s discussion and analysis of operations
20 consolidated Balance sheet
22 consolidated stateMent of incoMe
23 consolidated stateMent of coMprehensive incoMe
24 consolidated stateMent of changes in equity
26 consolidated stateMent of cash flows
27 notes to consolidated financial stateMents
53 independent auditor’s report
Contents
15
FinanCial seCtion

OVERVIEW OF OPERATING ENVIRONMENT AND PERFORMANCEIn fiscal 2015, ended March 31, 2016, the Japanese economy
continued to tread water amid strong uncertainties for the future
stemming from concerns about slowing growth in the Chinese
economy, a steep drop in natural resource prices, stronger signs
of deceleration in emerging economies from the dollar appreciat-
ing against their currencies as a result of an interest rate hike in
the U.S., and growing geopolitical risks.
Under these economic circumstances, the Daido Steel
Group readied itself to address changes in the market as they
arose. The Group collaborated with its customers, focused on
growth fields, and strengthened its quality, cost and delivery
(QCD) competitiveness with the aim of achieving the targets in
its medium-term management plan.
As a result, the Group’s net sales in fiscal 2015 decreased
by ¥23,055 million year on year to ¥460,578 million, mainly due
to a decline in sales volume and lower sales prices due to the
drop in raw material prices. Ordinary income rose ¥3,378 million
to ¥25,108 million due in part to a fall in the price of steel scrap,
a key raw material, and lower energy costs. Net income attribut-
able to owners of the parent declined by ¥4,140 million to
¥6,746 million, owing to the posting of ¥5,586 million in extraor-
dinary losses for discontinuing software development and
¥5,308 million in provisions for environmental remediation.
BUSINESS SEGMENT PERFORMANCESpecialty SteelWith regard to structural steel, inventory adjustments in the
automobile sector, our key source of demand for specialty steel,
that had continued since the beginning of the fiscal year slowed
around autumn, before orders gradually recovered from the third
quarter. However, the sales volume in the specialty steel seg-
ment decreased year on year, partly due to decreased demand
for industrial machinery and construction machinery led by
China’s economic deceleration since the summer. Tool steel
remained strong, centered on the domestic automobile sector.
Meanwhile, the price of steel scrap, a key raw material,
declined substantially from the summer onward as overseas
demand for steel scrap as a raw material declined, particularly
in South Korea, after an oversupply of steel drove China to
ramp up its exports of cheaply priced intermediate steel.
As a result, the specialty steel segment’s net sales in fiscal
2015 fell 9.8% year on year to ¥170,514 million, due primarily to
a decline in sales volume and sales prices, which were driven
down by the falling raw material prices. In contrast, operating
income increased by ¥4,382 million to ¥7,561 million, with
falling steel scrap prices and lower energy costs contributing to
the increase.
net salesYears ended March 31
(millions of yen)
operating incoMeYears ended March 31
(millions of yen)
net incoMe attriButaBle to owners of the parentYears ended March 31(millions of yen)
Fin
an
cia
l s
ec
tio
n
16
ManaGeMent’s DisCUssion anD analYsis oF oPeRations
20152014 20160
150,000
300,000
450,000
600,000
20152014 20160
10,000
30,000
20,000
40,000
20152014 20160
5,000
15,000
10,000
20,000

High Performance Materials and Magnetic MaterialsSales volume of stainless steel products declined year on year
due to a reduced demand for HDDs in response to sluggish
sales of PCs and expectations for lower nickel prices. On the
other hand, net sales of electromagnetic materials increased,
driven by robust demand for use in motors for electric power
steering systems in automobiles, the consolidation of Inter-
metallics Japan Corporation at the end of the previous fiscal
year, and strong sales of titanium products for use in medical
services in Japan and overseas. Meanwhile, net sales of high
alloys declined year on year. This was due mainly to persistently
sluggish demand for use as lead frames for semiconductors,
as well as a slump overseas in powder metal products for use
in the automotive industry and lower sales prices driven down
by a fall in the price of nickel and other raw materials.
As a result, net sales for high performance materials and
magnetic materials in fiscal 2015 decreased 4.0% year on year
to ¥155,251 million, while operating income decreased by
¥1,186 million to ¥12,331 million.
Parts for Automobile and Industrial EquipmentNet sales of free forged products decreased year on year.
Sluggish demand for use in oil rigs and plants caused by falling
oil prices absorbed strong demand for use in civilian aircraft.
Meanwhile, sales volume of die forged products declined, mainly
as a result of sluggish truck sales in emerging markets. On the
other hand, net sales of engine valves increased year on year,
mainly due to a boost in orders received atop strong sales of
automobiles in North America. Sales of engine-related castings
and precision cast products rose, driven by an increase in turbo
charger-related demand.
As a result, net sales in the Parts for Automobile and
Industrial Equipment segment for fiscal 2015 rose 0.3% year on
year to ¥99,680 million, while operating income increased by
¥274 million to ¥1,299 million.
Fin
an
cia
l s
ec
tio
n
17

capital expenditures By segMentYears ended March 31
Millions of Yen
2016 2015 Change (%)
Specialty Steel ¥ 7,670 ¥ 9,173 –16,4
High Performance Materials and Magnetic Materials 6,906 9,162 –24.6
Parts for Automobile and Industrial Equipment 7,044 9,514 –26.0
Engineering 245 450 –45.6
Trading and Service 1,340 1,997 –32.9
Total ¥23,205 ¥30,296 –23.4
capital expendituresYears ended March 31
(millions of yen)
EngineeringThe Engineering segment saw strong overseas sales of STC®
(Short Time Cycle) annealing furnaces, a main product for the
segment, as well as an increase in sales of vacuum carburizing
furnaces for automobile manufacturers and vacuum sintering
furnaces for magnet manufacturers. As a result, engineering
segment sales for fiscal 2015 rose 14.0% year on year to
¥26,104 million, while operating income increased by ¥419
million to ¥2,071 million.
Trading and ServiceNet sales in the trading and service segment for fiscal 2015 fell
13.7% year on year to ¥9,029 million, while operating income
increased by ¥129 million to ¥1,173 million. The decline in
sales was mainly attributable to a fall in information system-
related revenues.
CAPITAL EXPENDITURESCapital expenditures by business segment during the fiscal year
under review are shown in the table below.
Figures in the table include intangible fixed assets in addition
to property, plant and equipment.
RESEARCH AND DEVELOPMENTR&D costs for the entire Daido Steel Group during the fiscal
year under review totaled ¥5,766 million. The research objec-
tives, main achievements and R&D costs in each business
segment were as follows:
(1) Specialty SteelDaido Steel bears the principal responsibility for carrying out
specialty steel R&D. Research areas include basic material
development, such as automotive structural steel and tool steel.
Other areas of emphasis are development of process innova-
tions ranging from steelmaking, refining and solidification to
quality assurance for finished products.
Specialty steel R&D costs during the fiscal year under review
totaled ¥1,459 million.
(2) High Performance Materials and Magnetic Materials
Development of materials that resist corrosion and heat, high-
grade strip steel, welding materials, electromagnetic materials,
and other basic materials, as well as R&D of electronic devices
is conducted mainly by Daido Steel. R&D costs in this segment
during the fiscal year under review amounted to ¥2,695 million.
Fin
an
cia
l s
ec
tio
n
18
50,000
40,000
30,000
20,000
10,000
20152014 20160

interest-Bearing deBtYears ended March 31
(millions of yen)
(3) Parts for Automobile and Industrial EquipmentMainly the responsibility of Daido Steel, R&D in this segment
concentrates on development of turbo chargers, engine valves
and other automotive parts, and parts for various types of
industrial machinery. R&D costs for the fiscal year under review
in this segment totaled ¥1,453 million.
(4) EngineeringEngineering R&D is carried out primarily by Daido Steel, focused
on development of environmental conservation and recycling
equipment and a variety of energy-saving industrial furnaces.
Engineering R&D costs during the fiscal year under review were
¥157 million.
(5) Trading and ServiceThere are no R&D activities in this segment.
FINANCIAL POSITIONCash FlowsCash and cash equivalents as of March 31, 2016, amounted
to ¥33,774 million, representing an increase of ¥1,997 million
year on year.
Cash Flows from Operating Activities
Net cash provided by operating activities amounted to ¥45,731
million, increasing by ¥19,992 million from the previous fiscal
year. This mainly reflected income before income taxes of
¥14,980 million and a ¥12,444 million decrease in inventories.
Cash Flows from Investing Activities
Net cash used in investing activities totaled ¥23,165 million,
decreasing by ¥9,013 million from the previous fiscal year. The
major cash outflows included ¥21,057 million in purchases of
property, plant, and equipment.
Cash Flows from Financing Activities
Net cash used in financing activities was ¥20,164 million, increas-
ing by ¥17,371 million from the previous year. This was chiefly
due to recording ¥20,000 million for the redemption of bonds.
The indicators related to the Group’s cash flows are
shown below. Fin
an
cia
l s
ec
tio
n
19
20152014 20160
50,000
100,000
150,000
200,000

Fin
an
cia
l s
ec
tio
n
20
ConsoliDateD BalanCe sHeet
DAIDO STEEL CO., LTD. AND CONSOLIDATED SUBSIDIARIESMARCH 31, 2016
Millions of Yen
Thousands of U.S. Dollars
(Note 1)
ASSETS 2016 2015 2016
CURRENT ASSETS:Cash and cash equivalents (Note 16) ¥ 33,774 ¥ 31,776 $ 298,885Time deposits (Notes 8 and 16) 1,155 851 10,221Receivables:
Trade (Note 16) 98,800 105,007 874,336Other 1,656 1,928 14,655Total receivables 100,456 106,935 888,991
Inventories (Note 4) 95,131 108,562 841,867Deferred tax assets (Note 12) 4,277 4,900 37,850Prepaid expenses and other current assets 3,814 3,324 33,752Allowance for doubtful accounts (139) (166) (1,230)
Total current assets 238,468 256,182 2,110,336
PROPERTY, PLANT, AND EQUIPMENT:Land (Notes 5, 6 and 8) 35,302 35,139 312,407Buildings and structures (Notes 5, 6 and 8) 164,903 162,766 1,459,319Machinery and equipment (Note 8) 456,501 450,951 4,039,832Construction in progress 9,916 6,772 87,752
Total 666,622 655,628 5,899,310Accumulated depreciation (477,844) (466,253) (4,228,708)
Net property, plant, and equipment 188,778 189,375 1,670,602
INVESTMENTS AND OTHER ASSETS:Investment securities (Notes 3, 8, and 16) 53,433 72,846 472,858Investments in unconsolidated subsidiaries and associated companies (Note 16) 20,387 17,910 180,416
Asset for employees’ retirement benefits (Note 9) 26,239 39,208 232,204Deferred tax assets (Note 12) 1,002 1,058 8,867Other investments and assets (Note 5) 7,369 12,011 65,213
Total investments and other assets 108,430 143,033 959,558
TOTAL ¥ 535,676 ¥ 588,590 $ 4,740,496

Fin
an
cia
l s
ec
tio
n
21
Millions of Yen
Thousands of U.S. Dollars
(Note 1)
LIABILITIES AND EQUITY 2016 2015 2016
CURRENT LIABILITIES:Short-term bank loans (Notes 7 and 16) ¥ 18,545 ¥ 22,656 $ 164,115Current portion of long-term debt (Notes 7 and 16) 24,648 25,702 218,124Payables:
Trade (Notes 8 and 16) 68,153 78,040 603,124Acquisitions of property, plant, and equipment 8,354 7,294 73,929Total payables 76,507 85,334 677,053
Income taxes payable (Note 16) 2,752 3,883 24,354Accrued expenses 11,053 10,995 97,814Other current liabilities (Note 8) 9,982 10,812 88,336
Total current liabilities 143,487 159,382 1,269,796
LONG-TERM LIABILITIES:Long-term debt (Notes 7 and 16) 92,423 97,850 817,903Liability for employees’ retirement benefits (Note 9) 8,999 8,003 79,637Retirement allowance for directors and Audit & Supervisory Board members 910 957 8,053Provision for environmental measures 5,720 1,247 50,620Asset retirement obligations (Note 10) 432 426 3,823Deferred tax liabilities (Note 12) 12,862 25,099 113,823Other long-term liabilities 2,497 3,220 22,097
Total long-term liabilities 123,843 136,802 1,095,956
COMMITMENTS AND CONTINGENT LIABILITIES (Note 18)
EQUITY (Note 11):Common stock:
Authorized: 1,160,000 thousand shares
Issued: 434,488 thousand shares in 2016 and 2015 37,172 37,172 328,956Capital surplus 28,722 28,542 254,177Retained earnings 155,251 152,131 1,373,903Treasury stock, at cost:
7,473 thousand shares in 2016 and 805 thousand shares in 2015 (3,560) (382) (31,504)Accumulated other comprehensive income:
Unrealized gain on available-for-sale securities 13,826 25,129 122,354Deferred gain on derivatives under hedge accounting 0 1 0Land revaluation surplus 1,821 1,758 16,115Foreign currency translation adjustments 2,044 3,236 18,088Defined retirement benefit plans (2,443) 8,435 (21,619)Total 232,833 256,022 2,060,470
Noncontrolling interests 35,513 36,384 314,274Total equity 268,346 292,406 2,374,744
TOTAL ¥535,676 ¥588,590 $4,740,496
See notes to consolidated financial statements.

Fin
an
cia
l s
ec
tio
n
22
ConsoliDateD stateMent oF inCoMe
DAIDO STEEL CO., LTD. AND CONSOLIDATED SUBSIDIARIESYEAR ENDED MARCH 31, 2016
Millions of Yen
Thousands of U.S. Dollars
(Note 1)
2016 2015 2016
NET SALES ¥460,578 ¥483,633 $4,075,911COST OF SALES (Note 13) 386,145 413,536 3,417,212
Gross profit 74,433 70,097 658,699SELLING, GENERAL, AND ADMINISTRATIVE EXPENSES (Notes 13 and 14) 50,001 49,688 442,487
Operating income 24,432 20,409 216,212
OTHER INCOME (EXPENSES):Interest and dividend income 2,259 2,181 19,991Interest expense (1,309) (1,462) (11,584)Equity in earnings of associated companies 418 716 3,699Gain on sales of investment securities and investments in unconsolidated subsidiaries and associated companies—net 1,595 2,624 14,115
Foreign exchange (loss) gain (570) 799 (5,044)Provision for environmental measures (Note 2 (n)) (5,736) (877) (50,761)(Loss) gain on sales and disposals of property, plant, and equipment—net (884) 1,254 (7,823)Investment rents received 547 547 4,841Loss on support for a consolidated subsidiary – (907) –Write-down of investment securities and investments in unconsolidated subsidiaries and associated companies (Note 3) (34) (4,030) (301)
Loss on discontinued software development (Note 5) (5,586) – (49,434)Impairment loss on long-lived assets (436) (2,461) (3,858)Other—net 284 677 2,513
Other expenses—net (9,452) (939) (83,646)
INCOME BEFORE INCOME TAXES 14,980 19,470 132,566
INCOME TAXES (Note 12):Current 6,377 7,052 56,434Deferred (500) (334) (4,425)
Total income taxes 5,877 6,718 52,009
NET INCOME 9,103 12,752 80,558
NET INCOME ATTRIBUTABLE TO NONCONTROLLING INTERESTS 2,357 1,866 20,858
NET INCOME ATTRIBUTABLE TO OWNERS OF THE PARENT ¥ 6,746 ¥ 10,886 $ 59,699
Yen U.S. Dollars
PER SHARE OF COMMON STOCK (Note 2 (w)):Basic net income ¥ 15.62 ¥ 25.10 $ 0.14Cash dividends applicable to the year 7.50 6.50 0.07
Thousands
WEIGHTED-AVERAGE NUMBER OF OUTSTANDING SHARES OF COMMON STOCK 431,829 433,692
See notes to consolidated financial statements.

Fin
an
cia
l s
ec
tio
n
23
ConsoliDateD stateMent oF CoMPReHensiVe inCoMe
DAIDO STEEL CO., LTD. AND CONSOLIDATED SUBSIDIARIESYEAR ENDED MARCH 31, 2016
Millions of Yen
Thousands of U.S. Dollars
(Note 1)
2016 2015 2016
NET INCOME ¥ 9,103 ¥12,752 $ 80,558
OTHER COMPREHENSIVE (LOSS) INCOME (Note 19):Unrealized (loss) gain on available-for-sale securities (11,482) 8,612 (101,611)Deferred (loss) gain on derivatives under hedge accounting (2) 1 (18)Land revaluation surplus 62 104 549Foreign currency translation adjustments (1,699) 2,357 (15,035)Defined retirement benefit plans (11,114) 7,184 (98,354)Share of other comprehensive (loss) income in associates (81) 101 (717)
Total other comprehensive (loss) income (24,316) 18,359 (215,186)
COMPREHENSIVE (LOSS) INCOME ¥(15,213) ¥31,111 $(134,628)
TOTAL COMPREHENSIVE (LOSS) INCOME ATTRIBUTABLE TO:Owners of the parent ¥(16,707) ¥28,715 $(147,849)Noncontrolling interests 1,494 2,396 13,221
See notes to consolidated financial statements.

Fin
an
cia
l s
ec
tio
n
24
ConsoliDateD stateMent oF CHanGes in eQUitY
DAIDO STEEL CO., LTD. AND CONSOLIDATED SUBSIDIARIESYEAR ENDED MARCH 31, 2016
Thousands Millions of Yen
Accumulated Other Comprehensive Income
Outstanding Number of Shares of
Common StockCommon
StockCapital Surplus
Retained Earnings
Treasury Stock
Unrealized Gain on
Available-for-Sale Securities
Deferred Gain on Derivatives under Hedge Accounting
BALANCE, APRIL 1, 2014 (as previously reported) 433,704 ¥37,172 ¥28,542 ¥146,079 ¥ (370) ¥ 16,642 ¥ 1
Cumulative effect of accounting change (Note 2 (m)) – – – (2,448) – – –
BALANCE, APRIL 1, 2014 (as restated) 433,704 37,172 28,542 143,631 (370) 16,642 1
Net income attributable to owners of the parent – – – 10,886 – – –
Cash dividends, ¥5.5 per share – – – (2,386) – – –
Purchase of treasury stock (26) – – – (13) – –
Net change in treasury stock due to change in ownership of an associated company 5 – – – 1 – –
Net change in the year – – – – – 8,487 0
BALANCE, MARCH 31, 2015 433,683 37,172 28,542 152,131 (382) 25,129 1
Net income attributable to owners of the parent – – – 6,746 – – –
Cash dividends, ¥8.5 per share – – – (3,687) – – –
Purchase of treasury stock (6,671) – – – (3,179) – –
Disposal of treasury stock 2 – (0) – 1 – –
Adjustment of retained earnings for changes in the scope of consolidation – – – 61 0 – –
Change in the parent’s ownership interest due to transactions with noncontrolling interests – – 180 – – – –
Net change in the year – – – – – (11,303) (1)
BALANCE, MARCH 31, 2016 427,014 ¥37,172 ¥28,722 ¥155,251 ¥(3,560) ¥ 13,826 ¥ 0
Millions of Yen
Accumulated Other Comprehensive Income
Land Revaluation
Surplus
Foreign Currency
Translation Adjustments
Defined Retirement
Benefit Plans TotalNoncontrolling
InterestsTotal
Equity
BALANCE, APRIL 1, 2014 (as previously reported) ¥1,654 ¥ 1,229 ¥ 1,203 ¥232,152 ¥35,472 ¥267,624
Cumulative effect of accounting change (Note 2 (m)) – – – (2,448) (101) (2,549)
BALANCE, APRIL 1, 2014 (as restated) 1,654 1,229 1,203 229,704 35,371 265,075
Net income attributable to owners of the parent – – – 10,886 – 10,886
Cash dividends, ¥5.5 per share – – – (2,386) – (2,386)
Purchase of treasury stock – – – (13) – (13)
Net change in treasury stock due to change in ownership of an associated company – – – 1 – 1
Net change in the year 104 2,007 7,232 17,830 1,013 18,843
BALANCE, MARCH 31, 2015 1,758 3,236 8,435 256,022 36,384 292,406
Net income attributable to owners of the parent – – – 6,746 – 6,746
Cash dividends, ¥8.5 per share – – – (3,687) – (3,687)
Purchase of treasury stock – – – (3,179) – (3,179)
Disposal of treasury stock – – – 1 – 1
Adjustment of retained earnings for changes in the scope of consolidation – – – 61 – 61
Change in the parent’s ownership interest due to transactions with noncontrolling interests – – – 180 – 180
Net change in the year 63 (1,192) (10,878) (23,311) (871) (24,182)
BALANCE, MARCH 31, 2016 ¥1,821 ¥ 2,044 ¥ (2,443) ¥232,833 ¥35,513 ¥268,346

Fin
an
cia
l s
ec
tio
n
25
Thousands of U.S. Dollars (Note 1)
Accumulated Other Comprehensive Income
Common Stock
Capital Surplus
Retained Earnings
Treasury Stock
Unrealized Gain on
Available-for-Sale Securities
Deferred Gain on Derivatives under Hedge Accounting
BALANCE, MARCH 31, 2015 $328,956 $252,584 $1,346,292 $ (3,380) $ 222,381 $ 9
Net income attributable to owners of the parent – – 59,699 – – –
Cash dividends, $0.08 per share – – (32,628) – – –
Purchase of treasury stock – – – (28,133) – –
Disposal of treasury stock – (0) – 9 – –
Adjustment of retained earnings for changes in the scope of consolidation – – 540 – – –
Change in the parent’s ownership interest due to transactions with noncontrolling interests – 1,593 – – – –
Net change in the year – – – – (100,027) (9)
BALANCE, MARCH 31, 2016 $328,956 $254,177 $1,373,903 $(31,504) $ 122,354 $ 0
Thousands of U.S. Dollars (Note 1)
Accumulated Other Comprehensive Income
Land Revaluation
Surplus
Foreign Currency
Translation Adjustments
Defined Retirement
Benefit Plans TotalNoncontrolling
InterestsTotal
Equity
BALANCE, MARCH 31, 2015 $15,558 $ 28,637 $ 74,646 $2,265,683 $321,982 $2,587,665
Net income attributable to owners of the parent – – – 59,699 – 59,699
Cash dividends, $0.08 per share – – – (32,628) – (32,628)
Purchase of treasury stock – – – (28,133) – (28,133)
Disposal of treasury stock – – – 9 – 9
Adjustment of retained earnings for changes in the scope of consolidation – – – 540 – 540
Change in the parent’s ownership interest due to transactions with noncontrolling interests – – – 1,593 – 1,593
Net change in the year 557 (10,549) (96,265) (206,293) (7,708) (214,001)
BALANCE, MARCH 31, 2016 $16,115 $ 18,088 $(21,619) $2,060,470 $314,274 $2,374,744
See notes to consolidated financial statements.

Millions of Yen
Thousands of U.S. Dollars
(Note 1)
2016 2015 2016OPERATING ACTIVITIES:
Income before income taxes ¥ 14,980 ¥ 19,470 $ 132,566Adjustments for:
Income taxes paid (7,781) (6,506) (68,858)Depreciation and amortization 22,454 22,437 198,708Loss on discontinued software development 5,586 – 49,434Impairment loss on long-lived assets 436 2,461 3,858Loss (gain) on sales and disposals of property, plant, equipment, and other—net 842 (607) 7,451Gain on sales of investment securities and investments in unconsolidated subsidiaries and associated companies (1,553) (2,624) (13,743)
Write-down of investment securities and investments in unconsolidated subsidiaries and associated companies 38 4,030 336
Equity in earnings of associated companies (418) (717) (3,699)Changes in assets and liabilities:
Decrease (increase) in notes and accounts receivable 6,103 (3,114) 54,008Decrease in allowance for doubtful accounts (39) (45) (345)Decrease (increase) in inventories 12,444 (9,286) 110,124Decrease in notes and accounts payable (9,929) (28) (87,867)Increase in provision for environmental measures 4,473 843 39,584Increase in asset for retirement benefits (2,510) (3,336) (22,212)Decrease in liability for employees’ retirement benefits 246 160 2,177
Other—net 360 2,602 3,186Total adjustments 30,752 6,270 272,142Net cash provided by operating activities 45,732 25,740 404,708
INVESTING ACTIVITIES:Payments for time deposits (963) (1,093) (8,522)Repayments from time deposits 592 1,160 5,239Purchases of property, plant, and equipment (21,057) (36,035) (186,345)Proceeds from sales of property, plant and equipment 204 1,811 1,805Purchases of investment securities and investments in unconsolidated subsidiaries (3,377) (3,139) (29,885)Proceeds from sales of investment securities and investments in associated companies 4,175 4,712 36,947Proceeds from redemption of investment securities – 3,000 –Proceeds from purchase of shares of a consolidated subsidiary – 184 –Disbursements for originating loans (1,659) (703) (14,681)Proceeds from collection of loans 212 637 1,876Other—net (1,292) (2,712) (11,434)
Net cash used in investing activities (23,165) (32,178) (205,000)
FINANCING ACTIVITIES:Net decrease in short-term bank loans (3,777) (1,256) (33,425)Proceeds from long-term debt 19,264 21,400 170,478Repayments of long-term debt (5,496) (18,894) (48,637)Redemption of long-term debt (20,000) – (176,991)Acquisition of treasury stock (3,179) (13) (28,133)Acquisition of treasury stock by a subsidiary (881) (858) (7,796)Dividends paid, including payments to noncontrolling shareholders of subsidiaries (4,170) (2,919) (36,903)Liquidating dividends to noncontrolling shareholders of a subsidiary (1,122) – (9,929)Payments for transactions with noncontrolling interests (562) – (4,973)Other—net (241) (253) (2,133)
Net cash used in financing activities (20,164) (2,793) (178,442)
FOREIGN CURRENCY TRANSLATION ADJUSTMENTS ON CASH AND CASH EQUIVALENTS (650) 1,102 (5,752)NET INCREASE (DECREASE) IN CASH AND CASH EQUIVALENTS 1,753 (8,129) 15,514CASH AND CASH EQUIVALENTS OF NEWLY CONSOLIDATED SUBSIDIARY, BEGINNING OF YEAR 790 – 6,991CASH AND CASH EQUIVALENTS OF DECONSOLIDATED SUBSIDIARY (545) – (4,823)CASH AND CASH EQUIVALENTS, BEGINNING OF YEAR 31,776 39,905 281,203CASH AND CASH EQUIVALENTS, END OF YEAR ¥ 33,774 ¥ 31,776 $ 298,885
See notes to consolidated financial statements.
ConsoliDateD stateMent oF CasH FloWs
DAIDO STEEL CO., LTD. AND CONSOLIDATED SUBSIDIARIESYEAR ENDED MARCH 31, 2016
Fin
an
cia
l s
ec
tio
n
26

notes to ConsoliDateD FinanCial stateMents
DAIDO STEEL CO., LTD. AND CONSOLIDATED SUBSIDIARIESYEAR ENDED MARCH 31, 2016
1. BASIS OF PRESENTATION OF CONSOLIDATED FINANCIAL STATEMENTSThe accompanying consolidated financial statements have been prepared in accordance with the provisions set forth in the Japanese
Financial Instruments and Exchange Act and its related accounting regulations and in accordance with accounting principles generally
accepted in Japan (“Japanese GAAP”), which are different in certain respects as to the application and disclosure requirements of
International Financial Reporting Standards.
In preparing these consolidated financial statements, certain reclassifications and rearrangements have been made to the consolidated
financial statements issued domestically in order to present them in a form which is more familiar to readers outside Japan. In addition,
certain reclassifications have been made in the 2015 consolidated financial statements to conform to the classifications used in 2016.
The consolidated financial statements are stated in Japanese yen, the currency of the country in which DAIDO STEEL CO., LTD. (the
“Company”) is incorporated and operates. The translations of Japanese yen amounts into U.S. dollar amounts are included solely for the
convenience of readers outside Japan and have been made at the rate of ¥113 to $1, the approximate rate of exchange at March 31, 2016.
Such translations should not be construed as representations that the Japanese yen amounts could be converted into U.S. dollars at that or
any other rate.
2. SUMMARY OF SIGNIFICANT ACCOUNTING POLICIES(a) ConsolidationThe Company had 67 (64 in 2015) subsidiaries and 17 (17 in 2015) associated companies at March 31, 2016. The consolidated financial
statements as of March 31, 2016, include the accounts of the Company and 34 (34 in 2015) significant subsidiaries (together, the “Group”).
Under the control and influence concepts, those companies in which the Company, directly or indirectly, is able to exercise control over
operations are fully consolidated and those companies over which the Group has the ability to exercise significant influence are accounted
for by the equity method.
Investments in six associated companies were accounted for by the equity method for the years ended March 31, 2016 and 2015.
Investments in other unconsolidated subsidiaries and associated companies are stated at cost. If the equity method of accounting had
been applied to the investments in these companies, the effect on the accompanying consolidated financial statements would not have
been material.
The fiscal years of the subsidiaries are not necessarily the same as that of the Company. Accounts of those subsidiaries which have
different fiscal years have been adjusted for significant transactions to properly reflect their financial position at March 31 of each year and
the results of operations for the year then ended.
The difference between the cost of acquisition and the fair value of the net assets of the acquired subsidiary at the date of acquisition is
being amortized on a straight-line basis over five years.
All significant intercompany balances and transactions have been eliminated in consolidation. All material unrealized profit included in
assets resulting from transactions within the Group is also eliminated.
(b) Unification of Accounting Policies Applied to Foreign Subsidiaries for the Consolidated Financial Statements
In May 2006, the Accounting Standards Board of Japan (ASBJ) issued ASBJ Practical Issues Task Force (PITF) No. 18, “Practical Solution
on Unification of Accounting Policies Applied to Foreign Subsidiaries for the Consolidated Financial Statements” which was subsequently
revised in February 2010 and March 2015 to reflect revisions of the relevant Japanese GAAP or accounting standards in other jurisdictions.
PITF No. 18 prescribes that the accounting policies and procedures applied to a parent company and its subsidiaries for similar transactions
and events under similar circumstances should in principle be unified for the preparation of the consolidated financial statements. However,
financial statements prepared by foreign subsidiaries in accordance with either International Financial Reporting Standards or the accounting
principles generally accepted in the United States of America (Financial Accounting Standards Board Accounting Standards Codification)
tentatively may be used for the consolidation process, except for the following items which should be adjusted in the consolidation process
so that net income is accounted for in accordance with Japanese GAAP unless they are not material: a) amortization of goodwill; b) sched-
uled amortization of actuarial gain or loss of pensions that has been recorded in equity through other comprehensive income; c) expensing
capitalized development costs of research and development; and d) cancellation of the fair value model accounting for property, plant, and
equipment and investment properties and incorporation of cost model accounting.
Fin
an
cia
l s
ec
tio
n
27

(c) Business CombinationsIn October 2003, the Business Accounting Council issued a Statement of Opinion, “Accounting for Business Combinations,” and in
December 2005, the ASBJ issued ASBJ Statement No. 7, “Accounting Standard for Business Divestitures” and ASBJ Guidance No. 10,
“Guidance for Accounting Standard for Business Combinations and Business Divestitures.”
In December 2008, the ASBJ issued a revised accounting standard for business combinations, ASBJ Statement No. 21, “Accounting
Standard for Business Combinations.” Major accounting changes under the revised accounting standard are as follows: (1) The revised
standard requires accounting for business combinations only by the purchase method. As a result, the pooling-of-interests method of
accounting is no longer allowed. (2) The previous accounting standard required research and development costs to be charged to income
as incurred. Under the revised standard, in-process research and development costs (IPR&D) acquired in the business combination are
capitalized as an intangible asset. (3) The previous accounting standard provided for a bargain purchase gain (negative goodwill) to be
systematically amortized over a period not exceeding 20 years. Under the revised standard, the acquirer recognizes the bargain purchase
gain in profit or loss immediately on the acquisition date after reassessing and confirming that all of the assets acquired and all of the
liabilities assumed have been identified after a review of the procedures used in the purchase price allocation. The revised standard was
applicable to business combinations undertaken on or after April 1, 2010.
In September 2013, the ASBJ issued revised ASBJ Statement No. 21, “Accounting Standard for Business Combinations,” revised ASBJ
Guidance No. 10, “Guidance on Accounting Standards for Business Combinations and Business Divestitures,” and revised ASBJ Statement
No. 22, “Accounting Standard for Consolidated Financial Statements.” Major accounting changes are as follows:
(a) Transactions with noncontrolling interests—A parent’s ownership interest in a subsidiary might change if the parent purchases or sells
ownership interests in its subsidiary. The carrying amount of noncontrolling interest is adjusted to reflect the change in the parent’s
ownership interest in its subsidiary while the parent retains its controlling interest in its subsidiary. Under the previous accounting stan-
dard, any difference between the fair value of the consideration received or paid and the amount by which the noncontrolling interest is
adjusted is accounted for as an adjustment of goodwill or as profit or loss in the consolidated statement of income. Under the revised
accounting standard, such difference is accounted for as capital surplus as long as the parent retains control over its subsidiary.
(b) Presentation of the consolidated balance sheet—In the consolidated balance sheet, “minority interest” under the previous accounting
standard is changed to “noncontrolling interests” under the revised accounting standard.
(c) Presentation of the consolidated statement of income—In the consolidated statement of income, “income before minority interest”
under the previous accounting standard is changed to “net income” under the revised accounting standard, and “net income” under the
previous accounting standard is changed to “net income attributable to owners of the parent” under the revised accounting standard.
(d) Provisional accounting treatments for a business combination—If the initial accounting for a business combination is incomplete by the
end of the reporting period in which the business combination occurs, an acquirer shall report in its financial statements provisional
amounts for the items for which the accounting is incomplete. Under the previous accounting standard guidance, the impact of adjust-
ments to provisional amounts recorded in a business combination on profit or loss is recognized as profit or loss in the year in which the
measurement is completed. Under the revised accounting standard guidance, during the measurement period, which shall not exceed
one year from the acquisition, the acquirer shall retrospectively adjust the provisional amounts recognized at the acquisition date to reflect
new information obtained about facts and circumstances that existed as of the acquisition date and that would have affected the mea-
surement of the amounts recognized as of that date. Such adjustments shall be recognized as if the accounting for the business combi-
nation had been completed at the acquisition date.
(e) Acquisition-related costs—Acquisition-related costs are costs, such as advisory fees or professional fees, which an acquirer incurs to
effect a business combination. Under the previous accounting standard, the acquirer accounts for acquisition-related costs by including
them in the acquisition costs of the investment. Under the revised accounting standard, acquisition-related costs shall be accounted for
as expenses in the periods in which the costs are incurred.
The above accounting standards and guidance for (a) transactions with noncontrolling interest, (b) presentation of the consolidated
balance sheet, (c) presentation of the consolidated statement of income, and (e) acquisition-related costs are effective for the beginning of
annual periods beginning on or after April 1, 2015. Earlier application is permitted from the beginning of annual periods beginning on or after
April 1, 2014, except for (b) presentation of the consolidated balance sheet and (c) presentation of the consolidated statement of income. In
the case of earlier application, all accounting standards and guidance above, except for (b) presentation of the consolidated balance sheet
and (c) presentation of the consolidated statement of income, should be applied simultaneously.
Fin
an
cia
l s
ec
tio
n
28

Either retrospective or prospective application of the revised accounting standards and guidance for (a) transactions with noncontrolling
interest and (e) acquisition-related costs is permitted. In retrospective application of the revised standards and guidance, the accumulated
effects of retrospective adjustments for all (a) transactions with noncontrolling interest and (e) acquisition-related costs which occurred in the
past shall be reflected as adjustments to the beginning balance of capital surplus and retained earnings for the year of the first-time applica-
tion. In prospective application, the new standards and guidance shall be applied prospectively from the beginning of the year of the
first-time application.
The revised accounting standards and guidance for (b) presentation of the consolidated balance sheet and (c) presentation of the
consolidated statement of income shall be applied to all periods presented in financial statements containing the first-time application of the
revised standards and guidance.
The revised standards and guidance for (d) provisional accounting treatments for a business combination are effective for a business
combination which occurs on or after the beginning of annual periods beginning on or after April 1, 2015. Earlier application is permitted for
a business combination which occurs on or after the beginning of annual periods beginning on or after April 1, 2014.
The Company applied the revised accounting standards and guidance for (a) transactions with noncontrolling interest, (b) presentation of
the consolidated balance sheet, (c) presentation of the consolidated statement of income, and (e) acquisition-related costs above, effective
April 1, 2015, and (d) provisional accounting treatments for a business combination above for a business combination which occurred on or
after April 1, 2015. The revised accounting standards and guidance for (a) transactions with noncontrolling interest and (e) acquisition-related
costs were applied prospectively.
With respect to (b) presentation of the consolidated balance sheet and (c) presentation of the consolidated statement of income, the
applicable line items in the 2015 consolidated financial statements have been accordingly reclassified and presented in line with those in 2016.
The effect of the application of the revised accounting standards and guidance was immaterial to the consolidated financial statements
for the year ended March 31, 2016.
(d) Cash and Cash EquivalentsCash equivalents are short-term investments that are readily convertible into cash and that are exposed to insignificant risk of changes in
value. Cash equivalents include time deposits and short-term investments which mature or become due within three months of the date of
acquisition.
(e) Investment SecuritiesInvestment securities are classified and accounted for, depending on management’s intent, as follows:
Available-for-sale securities are reported at fair value, with unrealized gains and losses, net of applicable taxes, reported as a separate
component of equity.
A limited partnership investment is accounted for by the equity method.
Non-marketable securities are stated at cost, determined by the moving-average method. For other-than-temporary declines in fair
value, investment securities are reduced to net realizable value by a charge to income.
(f) InventoriesInventories are stated at the lower of cost, mainly determined by the weighted average method for each period of a year, or net selling value.
Write-down of inventories in the amounts of ¥604 million ($5,345 thousand) and ¥63 million for the years ended March 31, 2016 and 2015,
respectively, were included in cost of sales.
(g) Allowance for Doubtful AccountsTo provide for the loss from doubtful accounts, an allowance for doubtful accounts is made using the historical rate of actual losses for normal
receivables and the estimated irrecoverable amount for specific doubtful receivables after considering the recoverability of each account.
Fin
an
cia
l s
ec
tio
n
29

(h) Property, Plant, and EquipmentProperty, plant, and equipment are stated at cost, less gains on grant receipts, etc. Under certain conditions, such as government grant
receipt, exchanges of fixed assets of similar kinds, and sales and purchases resulting from expropriation, Japanese tax laws permit compa-
nies to defer the profit arising from such transactions by reducing the cost of the assets acquired or by providing a special reserve in the
equity section. The acquisition costs of property, plant, and equipment were reduced in the amounts of ¥4,678 million ($41,398 thousand)
and ¥2,708 million at March 31, 2016 and 2015, respectively.
Depreciation of certain plants of the Company and certain domestic and foreign subsidiaries is computed by the straight-line method.
Depreciation of other plants of the Company and other subsidiaries is computed by the declining-balance method, while the straight-line
method is applied to buildings acquired after April 1, 1998, for domestic companies.
Depreciation of leased assets is computed by the straight-line method over the lease period.
The range of useful lives is from five to 75 years for buildings and structures and from four to 17 years for machinery and equipment.
(i) Land RevaluationUnder the “Law of Land Revaluation,” Nippon Drop Forge Co., Ltd., a consolidated subsidiary, elected a one-time revaluation of its own-use
land to a value based on real estate appraisal information at March 31, 1999. The resulting land revaluation surplus represented unrealized
appreciation of land and was stated, net of income taxes, as a component of equity. There was no effect on the consolidated statement of
income. Continuous readjustment is not permitted, unless the land value subsequently declines significantly such that the amount of the
decline in value should be removed from the land revaluation surplus account and related deferred tax liabilities. At March 31, 2016, the carry-
ing amount of the land after the above one-time revaluation and impairment exceeded the market value by ¥943 million ($8,345 thousand).
(j) Long-Lived AssetsThe Group reviews its long-lived assets for impairment whenever events or changes in circumstances indicate the carrying amount of an
asset or asset group may not be recoverable. An impairment loss would be recognized if the carrying amount of an asset or asset group
exceeds the sum of the undiscounted future cash flows expected to result from the continued use and eventual disposition of the asset or
asset group. The impairment loss would be measured at the amount by which the carrying amount of the asset exceeds its recoverable
amount, which is the higher of the discounted cash flows from the continued use and eventual disposition of the asset or the net selling
price at disposition.
(k) Other AssetsIntangible assets are amortized by the straight-line method. Software costs are amortized over five years.
(l) Bond Issue CostsBond issue costs are charged to income as incurred.
(m) Retirement and Pension PlansThe Company and its domestic consolidated subsidiaries have defined retirement benefit plans and unfunded pension plans. Certain con-
solidated subsidiaries have defined contribution pension plans, multiemployer contributory funded pension plans and smaller enterprise
retirement allowance mutual aid plans.
Effective April 1, 2000, the Group adopted a new accounting standard for retirement benefits and accounted for the liability for
employees’ retirement benefits based on the projected benefit obligations and plan assets at the balance sheet date. The projected benefit
obligations had been attributed to periods on a straight-line basis. Actuarial gains and losses are amortized on a straight-line basis over 10
years. Past service costs are amortized on a straight-line basis over 10 years. Certain small consolidated subsidiaries apply the simplified
method to state the liability based on the amount which would be paid if employees retired at the consolidated balance sheet date.
In May 2012, the ASBJ issued ASBJ Statement No. 26, “Accounting Standard for Retirement Benefits” and ASBJ Guidance No. 25,
“Guidance on Accounting Standard for Retirement Benefits,” which replaced the accounting standard for retirement benefits that had been
issued by the Business Accounting Council in 1998 with an effective date of April 1, 2000, and the other related practical guidance, and
were followed by partial amendments from time to time through 2009.
Fin
an
cia
l s
ec
tio
n
30
(a) Under the revised accounting standard, actuarial gains and losses and past service costs that are yet to be recognized in profit or loss
are recognized within equity (accumulated other comprehensive income), after adjusting for tax effects, and any resulting deficit or
surplus is recognized as a liability (liability for employees’ retirement benefits) or asset (asset for employees’ retirement benefits).
(b) The revised accounting standard does not change how to recognize actuarial gains and losses and past service costs in profit or loss.
Those amounts are recognized in profit or loss over a certain period no longer than the expected average remaining service period of the
employees. However, actuarial gains and losses and past service costs that arose in the current period and have not yet been recog-
nized in profit or loss are included in other comprehensive income, and actuarial gains and losses and past service costs that were
recognized in other comprehensive income in prior periods and then recognized in profit or loss in the current period, are treated as
reclassification adjustments (see Note 19).
(c) The revised accounting standard also made certain amendments relating to the method of attributing expected benefit to periods, the
discount rate, and expected future salary increases.
This accounting standard and the guidance for (a) and (b) above are effective for the end of annual periods beginning on or after April 1,
2013, and for (c) above are effective for the beginning of annual periods beginning on or after April 1, 2014, or for the beginning of annual
periods beginning on or after April 1, 2015, subject to certain disclosure in March 2015, all with earlier application being permitted from the
beginning of annual periods beginning on or after April 1, 2013. However, no retrospective application of this accounting standard to
consolidated financial statements in prior periods is required.
The Company applied the revised accounting standard and guidance for retirement benefits for (a) and (b) above, effective March 31,
2014, and for (c) above, effective April 1, 2014.
With respect to (c) above, the Company changed the method of attributing the expected benefit to periods from a straight-line basis to
a benefit formula basis, and the method of determining the discount rate from using the period which approximates the expected average
remaining service period to using a single weighted average discount rate reflecting the estimated timing and amount of benefit payment,
and recorded the effect of (c) above as of April 1, 2014, in retained earnings in the amount of ¥2,448 million. The effects on the statement
of income and net income per share were immaterial.
Retirement benefits to directors and Audit & Supervisory Board members of certain subsidiaries are provided at the amount that would
be required if all directors and Audit & Supervisory Board members retired at the consolidated balance sheet date.
(n) Provision for Environmental MeasuresProvision for environmental measures is provided to accrue the estimated costs of PCB (Polychlorinated Biphenyl) waste disposals and the
estimated costs of removal of steel slag products sold in reserve for future expenses. For the year ended March 31, 2016, the estimated
costs of removal of steel slag products used in construction projects by Ministry of Land, Infrastructure, Transport and Tourism, Gunma
Prefecture, and municipalities in Gunma were accrued in the amount of ¥5,308 million ($46,973 thousand) and included in the provision for
environmental measures in the consolidated statement of income.
(o) Asset Retirement ObligationsIn March 2008, the ASBJ issued ASBJ Statement No. 18, “Accounting Standard for Asset Retirement Obligations,” and ASBJ Guidance No.
21, “Guidance on Accounting Standard for Asset Retirement Obligations.” Under this accounting standard, an asset retirement obligation is
defined as a legal obligation imposed either by law or contract that results from the acquisition, construction, development, and the normal
operation of a tangible fixed asset and is associated with the retirement of such tangible fixed asset. The asset retirement obligation is recog-
nized as the sum of the discounted cash flows required for the future asset retirement and is recorded in the period in which the obligation is
incurred if a reasonable estimate can be made. If a reasonable estimate of the asset retirement obligation cannot be made in the period the
asset retirement obligation is incurred, the liability should be recognized when a reasonable estimate of asset retirement obligation can be
made. Upon initial recognition of a liability for an asset retirement obligation, an asset retirement cost is capitalized by increasing the carrying
amount of the related fixed asset by the amount of the liability. The asset retirement cost is subsequently allocated to expense through
depreciation over the remaining useful life of the asset. Over time, the liability is accreted to its present value each period. Any subsequent
revisions to the timing or the amount of the original estimate of undiscounted cash flows are reflected as an adjustment to the carrying
amount of the liability and the capitalized amount of the related asset retirement cost.
Fin
an
cia
l s
ec
tio
n
31

(p) Research and Development CostsResearch and development costs are charged to income as incurred.
(q) Bonuses to Directors and Audit & Supervisory Board MembersBonuses to directors and Audit & Supervisory Board members are accrued at the year-end to which such bonuses are attributable.
(r) Construction ContractsIn December 2007, the ASBJ issued ASBJ Statement No. 15, “Accounting Standard for Construction Contracts,” and ASBJ Guidance No.
18, “Guidance on Accounting Standard for Construction Contracts.” Under this accounting standard, construction revenue and construction
costs should be recognized by the percentage-of-completion method if the outcome of a construction contract can be estimated reliably.
When total construction revenue, total construction costs, and the stage of completion of the contract at the balance sheet date can be
reliably measured, the outcome of a construction contract can be estimated reliably. If the outcome of a construction contract cannot be
reliably estimated, the completed-contract method should be applied. When it is probable that the total construction costs will exceed total
construction revenue, an estimated loss on the contract should be immediately recognized by providing for a loss on construction contracts.
(s) Income TaxesThe provision for income taxes is computed based on the pretax income included in the consolidated statement of income. The asset and
liability approach is used to recognize deferred tax assets and liabilities for the expected future tax consequences of temporary differences
between the carrying amounts and the tax bases of assets and liabilities. Deferred taxes are measured by applying currently enacted tax
laws to the temporary differences.
(t) Foreign Currency TransactionsAll short-term and long-term monetary receivables and payables denominated in foreign currencies are translated into Japanese yen at the
exchange rates at the consolidated balance sheet date. The foreign exchange gains and losses from translation are recognized in the
consolidated statement of income to the extent that they are not hedged by forward exchange contracts.
(u) Foreign Currency Financial StatementsThe consolidated balance sheet accounts, and revenue and expense accounts of the consolidated foreign subsidiaries are translated into
Japanese yen at the current exchange rate as of the consolidated balance sheet date except for equity, which is translated at the historical
rate. Differences arising from such translation are shown as “Foreign currency translation adjustments” under accumulated other compre-
hensive income in a separate component of equity.
(v) Derivatives and Hedging ActivitiesThe Group uses derivative financial instruments to manage its exposure to fluctuations in foreign exchange and interest rates. Foreign cur-
rency forward contracts, currency swaps and interest rate swaps are utilized by the Group to reduce foreign currency exchange and interest
rate risks. The Group does not enter into derivatives for trading or speculative purposes.
Derivative financial instruments and foreign currency transactions are classified and accounted for as follows: a) all derivatives are recog-
nized as either assets or liabilities and measured at fair value, and, except for those derivatives which qualify for hedge accounting, gains or
losses are recognized in the consolidated statement of income and b) for derivatives used for hedging purposes, if such derivatives qualify
for hedge accounting because of high correlation and effectiveness between the hedging instruments and the hedged items, gains or losses
are deferred until maturity of the hedged transactions.
Foreign currency forward contracts are measured at fair value, and the unrealized gains (losses) are recognized in the consolidated
statement of income. Forward contracts used to hedge forecasted (or committed) transactions are also measured at fair value, but the
unrealized gains (losses) are deferred until the underlying transactions are completed.
Long-term debt denominated in foreign currencies for which currency swaps are used to hedge the foreign currency fluctuations is
translated at the contracted rate if the forward contracts qualify for hedge accounting.
Interest rate swaps which qualify for hedge accounting and meet specific matching criteria are not remeasured at market value but the
differential paid or received under the swap agreements is recognized and included in interest expense.
Fin
an
cia
l s
ec
tio
n
32

(w) Per Share InformationNet income per share is computed by dividing net income attributable to common shareholders by the weighted-average number of
common shares outstanding for the period.
Diluted net income per share is not disclosed because the Group had no dilutive shares at March 31, 2016 and 2015.
Cash dividends per share presented in the accompanying consolidated statement of income are dividends applicable to the respective
years including dividends to be paid after the end of year.
(x) Changes in Presentations(Consolidated statement of income)
Prior to April 1, 2015, the provision for environmental measures was included in the other long-term liabilities among the long-term liabilities
section of the consolidated balance sheet. Since during this fiscal year ended March 31, 2016, the materiality of the amount increased
significantly and such amount is disclosed separately in the long-term liabilities section of the consolidated balance sheet as of March 31,
2016. ¥4,467 million of the other long-term liabilities as of March 31, 2015, was reclassified to the provision for environmental measures of
¥1,247 million and to the other long-term liabilities of ¥3,220 million.
(Consolidated statement of cash flows)
Prior to April 1, 2015, the provision for environmental measures was included in the other—net among operating activities section of the
consolidated statement of cash flows. Since during this fiscal year ended March 31, 2016, the materiality of the amount increased signifi-
cantly and such amount is disclosed separately in the operating activities section of the consolidated statement of cash flows for the year
ended March 31, 2016. ¥3,445 million of other—net for the year ended March 31, 2015 was reclassified to provision for environmental
measures of ¥843 million and to other—net of ¥2,602 million.
Prior to April 1, 2015, the acquisition of treasury stock and the acquisition of treasury stock by a subsidiary were included in other—net
among the financing activities section of the consolidated statement of cash flows. Since during this fiscal year ended March 31, 2016, the
materiality of the amounts increased significantly and such amounts are disclosed separately in the operating activities section of the con-
solidated statement of cash flows for the year ended March 31, 2016. ¥1,124 million of other—net for the year ended March 31, 2015 was
reclassified to the acquisition of treasury stock and the acquisition of treasury stock by a subsidiary, and other—net in the amounts of ¥13
million, ¥858 million and ¥253 million, respectively.
(y) Accounting Changes and Error CorrectionsIn December 2009, the ASBJ issued ASBJ Statement No. 24, “Accounting Standard for Accounting Changes and Error Corrections” and
ASBJ Guidance No. 24, “Guidance on Accounting Standard for Accounting Changes and Error Corrections.” Accounting treatments under
this standard and the guidance are as follows: (1) Changes in Accounting Policies—When a new accounting policy is applied with a revision
of accounting standards, the new policy is applied retrospectively, unless the revised accounting standards include specific transitional
provisions. When the revised accounting standards include specific transitional provisions, an entity shall comply with the specific transitional
provisions. (2) Changes in Presentation—When the presentation of financial statements is changed, prior-period financial statements are
reclassified in accordance with the new presentation. (3) Changes in Accounting Estimates—A change in an accounting estimate is
accounted for in the period of the change if the change affects that period only and is accounted for prospectively if the change affects both
the period of the change and future periods. (4) Corrections of Prior-Period Errors—When an error in prior-period financial statements is
discovered, those statements are restated.
3. INVESTMENT SECURITIESInvestment securities at March 31, 2016 and 2015, consisted of the following:
Millions of Yen Thousands of U.S. Dollars
2016 2015 2016
Noncurrent:Equity securities ¥53,433 ¥72,846 $472,858
Total ¥53,433 ¥72,846 $472,858
Fin
an
cia
l s
ec
tio
n
33
The costs and aggregate fair values of investment securities at March 31, 2016 and 2015, were as follows:
Millions of Yen
March 31, 2016 CostUnrealized
GainsUnrealized
Losses Fair Value
Available-for-sale:Equity securities ¥32,383 ¥20,701 ¥1,596 ¥51,488
Millions of Yen
March 31, 2015 CostUnrealized
GainsUnrealized
Losses Fair Value
Available-for-sale:Equity securities ¥34,438 ¥36,817 ¥387 ¥70,868
Thousands of U.S. Dollars
March 31, 2016 CostUnrealized
GainsUnrealized
Losses Fair Value
Available-for-sale:Equity securities $286,575 $183,195 $14,124 $455,646
Information for available-for-sale securities that were sold during the years ended March 31, 2016 and 2015, was as follows:
Millions of Yen Thousands of U.S. Dollars
March 31, 2016 ProceedsRealized
GainsRealized Losses Proceeds
Realized Gains
Realized Losses
Available-for-sale:Equity securities ¥2,503 ¥467 ¥52 $22,150 $4,133 $460
March 31, 2015
Millions of Yen
ProceedsRealized
GainsRealized Losses
Available-for-sale:Equity securities ¥3,873 ¥1,971 ¥1
Impairment losses on equity securities and investments in associated companies for the years ended March 31, 2016 and 2015, were
¥34 million ($301 thousand) and ¥4,030 million, respectively.
4. INVENTORIESInventories held by the Group at March 31, 2016 and 2015, consisted of the following:
Millions of YenThousands of U.S. Dollars
2016 2015 2016
Merchandise ¥18,764 ¥ 19,779 $166,053Finished products 11,803 12,380 104,451Semifinished products 15,976 22,695 141,380Work in process 21,738 24,823 192,372Raw materials 16,207 18,688 143,425Supplies 10,643 10,197 94,186
Total ¥95,131 ¥108,562 $841,867
Fin
an
cia
l s
ec
tio
n
34

5. LONG-LIVED ASSETSThe Group reviewed its long-lived assets for impairment as of March 31, 2016 and 2015. As a result, the Group recognized an impairment
loss of ¥436 million ($3,858 thousand) as other expense for property, plant and equipment in Nagano due to devaluation and the carrying
amount of the relevant assets was written down to the recoverable amount for the year ended March 31, 2016. Also, the Group recognized
an impairment loss of ¥5,162 million ($45,681 thousand) as other expense for discontinued software development costs for internal use and
the carrying amount of the relevant assets was written down to the recoverable amount for the year ended March 31, 2016. Such amount is
included in loss on discontinued software development of ¥5,586 million ($49,434 thousand).
The Group recognized an impairment loss of ¥2,461 million as other expense for unused land and certain property, plant and equipment
in Nagano due to the devaluation of land and the carrying amount of the relevant assets was written down to the recoverable amount for the
year ended March 31, 2015. The recoverable amount of the assets in Nagano was measured at its value in use and the discount rate used
for computation of present value of future cash flows was 6.5%.
6. INVESTMENT PROPERTYIn November 2008, the ASBJ issued ASBJ Statement No. 20, “Accounting Standard for Investment Property and Related Disclosures,” and
ASBJ Guidance No. 23, “Guidance on Accounting Standard for Investment Property and Related Disclosures.”
The Company holds some rental properties, such as office buildings and land in Aichi and other areas. The net amounts of rental income
and operating expenses for those rental properties were ¥892 million ($7,894 thousand) and ¥846 million for the years ended March 31,
2016 and 2015, respectively.
The carrying amounts, changes in such balances and market prices of such properties at March 31, 2016 and 2015, were as follows:
Millions of Yen Thousands of U.S. Dollars
Carrying Amount Fair Value Carrying Amount Fair Value
April 1, 2015 Increase, net March 31, 2016 March 31, 2016 April 1, 2015 Increase, net March 31, 2016 March 31, 2016
¥5,197 ¥458 ¥5,655 ¥24,805 $45,991 $4,053 $50,044 $219,513
Millions of Yen
Carrying Amount Fair Value
April 1, 2014 Decrease, net March 31, 2015 March 31, 2015
¥5,910 ¥713 ¥5,197 ¥24,090Notes:1) The carrying amount recognized in the consolidated balance sheet was net of accumulated depreciation and accumulated impairment losses, if any.2) The increase during the fiscal year ended March 31, 2016, primarily represents the acquisition of certain properties of ¥565 million ($5,000 thousand). The
decrease during the fiscal year ended March 31, 2016, primarily represents depreciation of ¥145 million ($1,283 thousand). The increase during the fiscal year ended March 31, 2015, primarily represents the acquisition of certain properties of ¥493 million. The decrease during the
fiscal year ended March 31, 2015, primarily represents the effect of the changes in scope of consolidation of ¥1,057 million and depreciation of ¥123 million.3) The fair value of properties was primarily measured by the Group in accordance with its Real-Estate Appraisal Standard.
7. SHORT-TERM BANK LOANS AND LONG-TERM DEBTShort-term bank loans consisted of notes to banks and bank overdrafts. The weighted-average rates of annual interest applicable to short-
term bank loans at March 31, 2016 and 2015, were 0.78% and 0.81%, respectively.
Long-term debt at March 31, 2016 and 2015, consisted of the following:
Millions of YenThousands of U.S. Dollars
2016 2015 2016
Loans from banks and other financial institutions due serially to 2022 with weighted-average interest rates of 0.68% in 2016 and 0.79% in 2015 ¥ 96,141 ¥ 82,415 $ 850,805
1.08% unsecured bonds due December 18, 2015 – 20,000 –0.68% unsecured bonds due December 1, 2016 10,000 10,000 88,4960.335% unsecured bonds due May 27, 2019 10,000 10,000 88,496Obligations under finance leases 930 1,137 8,230
Total 117,071 123,552 1,036,027Less: Portion due within one year (24,648) (25,702) (218,124)
Total long-term debt ¥ 92,423 ¥ 97,850 $ 817,903
Fin
an
cia
l s
ec
tio
n
35

Annual maturities of long-term debt at March 31, 2016, were as follows:
Year Ending March 31 Millions of Yen Thousands of U.S. Dollars
2017 ¥ 24,648 $ 218,1242018 15,747 139,3542019 26,352 233,2042020 24,926 220,5842021 15,196 134,4782022 and thereafter 10,202 90,283
Total ¥117,071 $1,036,027
The Company and a consolidated subsidiary entered into line-of-credit agreements with 9 banks. The details of the agreements were
as follows:
Millions of Yen Thousands of U.S. Dollars
Line-of-credit amount ¥24,700 $218,584Balance used at March 31, 2016 – –
8. PLEDGED ASSETSThe carrying amounts of assets pledged as collateral for notes and accounts payable of ¥11 million ($97 thousand) and other current
liabilities of ¥8 million ($71 thousand) at March 31, 2016, were as follows:
Millions of YenThousands of U.S. Dollars
Time deposits ¥ 17 $ 150Land 2,179 19,283Buildings and structures 1,696 15,009Machinery and equipment 1,311 11,602Investment securities 239 2,115
Total ¥5,442 $48,159
9. RETIREMENT AND PENSION PLANSThe Company and its consolidated subsidiaries have defined retirement benefit plans and unfunded pension plans. Certain consolidated
subsidiaries have defined contribution pension plans, multiemployer contributory funded pension plans, and smaller enterprise retirement
allowance mutual aid plans.
The Group has employee retirement benefit trusts.
Furthermore, additional severance payments, which are not included in liability for employees’ retirement benefit, are paid in certain cases.
Certain small consolidated subsidiaries apply the simplified method to state the liability based on the amount which would be paid if
employees retired at the consolidated balance sheet date.
Some of subsidiaries participate in multiemployer contributory funded plans, and the plans are accounted for as if the plans were defined
contribution plans in the case that the plan assets attributable to the contributions by the subsidiaries cannot be rationally determined.
Fin
an
cia
l s
ec
tio
n
36

1. the changes in defined benefit obligation for the years ended March 31, 2016 and 2015, were as follows:
Millions of YenThousands of U.S. Dollars
2016 2015 2016
Balance at beginning of year (as previously reported) ¥51,262 ¥47,739 $453,646Cumulative effect of accounting change – 3,925 –
Balance at beginning of year (as restated) 51,262 51,664 453,646Current service cost 1,815 1,745 16,062Interest cost 575 585 5,088Actuarial losses 5,484 1,322 48,531Benefits paid (4,102) (4,069) (36,301)Past service cost 95 – 841Others (6) 15 (53)
Balance at end of year ¥55,123 ¥51,262 $487,814
2. the changes in plan assets for the years ended March 31, 2016 and 2015, were as follows:
Millions of YenThousands of U.S. Dollars
2016 2015 2016
Balance at beginning of year ¥84,671 ¥71,450 $749,301Expected return on plan assets 1,467 1,354 12,982Actuarial (losses) gains (9,171) 12,631 (81,159)Contributions from the employer 798 2,748 7,062Benefits paid (3,112) (3,519) (27,540)Others (3) 7 (27)
Balance at end of year ¥74,650 ¥84,671 $660,619
3. the changes in liability for employees’ retirement benefits for which the simplified method was applied to record the liability for the
years ended March 31, 2016 and 2015, were as follows:
Millions of YenThousands of U.S. Dollars
2016 2015 2016
Balance at beginning of year ¥2,204 ¥2,239 $19,504Pension costs 740 477 6,549Benefits paid (359) (199) (3,177)Contributions to pension funds (295) (317) (2,611)Others (5) 4 (44)
Balance at end of year ¥2,285 ¥2,204 $20,221
4. reconciliation between the liability recorded in the consolidated balance sheet and the balances of defined benefit obligation and
plan assets:
Millions of YenThousands of U.S. Dollars
2015 2014 2015
Funded defined benefit obligation ¥ 55,043 ¥ 51,506 $ 487,106Plan assets (77,536) (87,397) (686,159)
Total (22,493) (35,891) (199,053)Unfunded defined benefit obligation 5,253 4,686 46,486Net asset arising from defined benefit obligation ¥(17,240) ¥(31,205) $(152,567)
Fin
an
cia
l s
ec
tio
n
37

5. the components of net periodic benefit costs for the years ended March 31, 2016 and 2015, were as follows:
Millions of YenThousands of U.S. Dollars
2016 2015 2016
Service cost ¥ 1,815 ¥ 1,745 $ 16,062Interest cost 575 585 5,088Expected return on plan assets (1,467) (1,354) (12,982)Amortization of prior service benefit (1,432) (661) (12,672)Recognized actuarial gains (54) (157) (478)Retirement benefits for which simplified method was applied 740 478 6,549Additional severance payments 92 115 814
Net periodic benefit costs ¥ 269 ¥ 751 $ 2,381
6. amounts recognized in other comprehensive income (before income tax effect) in respect of defined retirement benefit plans for the
years ended March 31, 2016 and 2015:
Millions of YenThousands of U.S. Dollars
2016 2015 2016
Prior service cost ¥ (149) ¥ (157) $ (1,319)Actuarial (losses) gains (16,087) 10,648 (142,362)
Total ¥(16,236) ¥10,491 $(143,681)
7. amounts recognized in accumulated other comprehensive income (before income tax effect) in respect of defined retirement benefit
plans as of March 31, 2016 and 2015:
Millions of YenThousands of U.S. Dollars
2016 2015 2016
Unrecognized prior service cost ¥ 305 ¥ 453 $ 2,699Unrecognized actuarial (losses) gains (4,349) 11,738 (38,487)
Total ¥(4,044) ¥12,191 $(35,788)
8. plan assets:
(1) Components of plan assets
Plan assets consisted of the following:
2016 2015
Debt investments 15% 12%Equity investments 65 69Assets in an insurer’s general account 19 16Others 1 3
Total 100% 100%
(2) Method of determining the expected rate of return on plan assets
The expected rate of return on plan assets is determined considering the long-term rates of return which are expected currently and in the
future from the various components of the plan assets.
Fin
an
cia
l s
ec
tio
n
38

9. assumptions used for the years ended March 31, 2016 and 2015, are set forth as follows:
2016 2015
Discount rate 0.3% 1.1%Expected rate of return on plan assets 2.0 2.0
Some consolidated subsidiaries participate in a multi-employer plan for which the Company cannot reasonably calculate the amount of
plan assets corresponding to the contributions made by the subsidiaries. Therefore, it is accounted for using the same method as a defined
contribution plan.
The contributions to such multi-employer plan, which are accounted for using the same method as a defined contribution plan, were
¥317 million ($2,805 thousand) and ¥353 million for the years ended March 31, 2016 and 2015, respectively.
(1) The funded status of the multi-employer plan as of March 31, 2016 and 2015, was as follows:
Millions of YenThousands of U.S. Dollars
2016 2015 2016
Plan assets ¥263,436 ¥238,997 $2,331,292Sum of actuarial liabilities of pension plan and minimum actuarial reserve 268,703 255,077 2,377,903
Net balance ¥ (5,267) ¥ (16,080) $ (46,611)
(2) The contribution ratio of the Group in the multi-employer plan for the years ended March 31, 2016 and 2015, was as follows:
2016 2015
The contribution ratio of the Group in the multi-employer plan 2.28% 2.38%
10. ASSET RETIREMENT OBLIGATIONSThe changes in asset retirement obligations for the years ended March 31, 2016 and 2015, were as follows:
Millions of YenThousands of U.S. Dollars
2016 2015 2016
Balance at beginning of year ¥426 ¥426 $3,770Additional provisions associated with the change in the estimated costs of PCB waste disposal 6 – 53
Reconciliation associated with passage of time 0 – –Balance at end of year ¥432 ¥426 $3,823
11. EQUITYJapanese companies are subject to the Companies Act of Japan (the “Companies Act”). The significant provisions in the Companies Act
that affect financial and accounting matters are summarized below:
(a) DividendsUnder the Companies Act, companies can pay dividends at any time during the fiscal year in addition to the year-end dividend upon resolu-
tion at the shareholders’ meeting. Additionally, for companies that meet certain criteria, such as (1) having a Board of Directors, (2) having
independent auditors, (3) having an Audit & Supervisory Board, and (4) the term of service of the directors being prescribed as one year
rather than the normal two-year term by its articles of incorporation, the Board of Directors may declare dividends (except for dividends-in-
kind) at any time during the fiscal year if the company has prescribed so in its articles of incorporation. However, the Company cannot do so
because it does not meet all the above criteria. The Companies Act permits companies to distribute dividends in kind (noncash assets) to
shareholders subject to certain limitations and additional requirements.
Fin
an
cia
l s
ec
tio
n
39

Semiannual interim dividends may also be paid once a year upon resolution by the Board of Directors if the articles of incorporation of
the company so stipulate. The Companies Act provides certain limitations on the amounts available for dividends or the purchase of treasury
stock. The limitation is defined as the amount available for distribution to the shareholders, but the amount of net assets after dividends must
be maintained at no less than ¥3 million.
(b) Increases/Decreases and Transfer of Common Stock, Reserve, and SurplusThe Companies Act requires that an amount equal to 10% of dividends must be appropriated as a legal reserve (a component of retained
earnings) or as additional paid-in capital (a component of capital surplus) depending on the equity account charged upon the payment of
such dividends until the total of the aggregate amount of the legal reserve and additional paid-in capital equals 25% of common stock.
Under the Companies Act, the total amount of additional paid-in capital and legal reserve may be reversed without limitation. The Companies
Act also provides that common stock, legal reserve, additional paid-in capital, other capital surplus, and retained earnings can be transferred
among the accounts under certain conditions upon resolution of the shareholders.
(c) Treasury Stock and Treasury Stock Acquisition RightsThe Companies Act also provides for companies to purchase treasury stock and dispose of such treasury stock by resolution of the Board
of Directors. The amount of treasury stock purchased cannot exceed the amount available for distribution to the shareholders which is
determined by a specific formula. Under the Companies Act, stock acquisition rights are presented as a separate component of equity. The
Companies Act also provides that companies can purchase both treasury stock acquisition rights and treasury stock. Such treasury stock
acquisition rights are presented as a separate component of equity or deducted directly from stock acquisition rights.
12. INCOME TAXESThe Company and its domestic subsidiaries are subject to Japanese national and local income taxes which, in the aggregate, resulted in
normal effective statutory tax rates of approximately 33% and 35% for the years ended March 31, 2016, and 2015, respectively.
The tax effects of significant temporary differences and loss carryforwards, which resulted in deferred tax assets and liabilities at March
31, 2016 and 2015, were as follows:
Millions of YenThousands of U.S. Dollars
2016 2015 2016
Deferred tax assets:Accrued bonuses ¥ 2,079 ¥ 2,090 $ 18,398Liability for employees’ retirement benefits 2,763 2,550 24,451Allowance for doubtful accounts 53 77 469Write-down of securities and other assets 2,663 1,944 23,566Net loss carryforwards 2,996 2,325 26,513Elimination of unrealized gain on inventories 883 943 7,814Provision for environmental measures 1,737 407 15,372Enterprise tax 285 377 2,522Other 4,542 4,839 40,195Less valuation allowance (7,727) (6,805) (68,380)
Total deferred tax assets 10,274 8,747 90,920Deferred tax liabilities:
Deferred gain on property, plant, and equipment 1,830 1,978 16,195Land revaluation surplus 1,230 1,293 10,885Unrealized gain on securities 5,774 11,634 51,097Asset for employees’ retirement benefits 6,215 10,868 55,000Unrealized gain on lands resulting from consolidation of a subsidiary 1,057 1,116 9,354Other 1,751 999 15,495
Total deferred tax liabilities 17,857 27,888 158,026Net deferred tax liabilities ¥ 7,583 ¥19,141 $ 67,106
Fin
an
cia
l s
ec
tio
n
40

A reconciliation between the normal effective statutory tax rates and the actual effective tax rates reflected in the accompanying consoli-
dated statement of income for the year ended March 31, 2016, with the corresponding figures for 2015 is as follows:
2016 2015
Normal effective statutory tax rates 33.0% 35.0%Expenses not deductible for income tax purposes 1.9 3.2Revenues not recognized for income tax purposes (9.9) (7.1)Per capita tax 0.7 0.6Net change in valuation allowance 9.0 6.6Effects of elimination of dividends for consolidation purposes 6.9 4.0Effect of accounting by the equity method (0.9) (1.3)Lower income tax rates applicable to income in certain foreign countries (0.9) (1.1)Tax credit (4.8) (2.9)Effect of change in statutory tax rate (0.8) (1.9)Investments in subsidiaries 4.2 –Other – net 0.8 (0.6)
Actual effective tax rates 39.2% 34.5%
New tax reform laws enacted in 2016 in Japan changed the normal effective statutory tax rate for the fiscal year beginning on or after
April 1, 2016, to approximately 31% and for the fiscal year beginning on or after April 1, 2018, to approximately 30%. The effect of these
changes was to decrease deferred tax liabilities, net of deferred tax assets, by ¥414 million ($3,664 thousand), accumulated other compre-
hensive income for defined retirement benefit plan by ¥74 million ($655 thousand) in the consolidated balance sheet as of March 31, 2016
and income taxes—deferred in the consolidated statement of income for the year then ended by ¥125 million ($1,106 thousand), and to
increase accumulated other comprehensive income for unrealized gain on available-for-sale securities by ¥363 million ($3,212 thousand).
13. RESEARCH AND DEVELOPMENT COSTSResearch and development costs charged to income were ¥5,766 million ($51,027 thousand) and ¥5,301 million for the years ended
March 31, 2016 and 2015, respectively.
14. SELLING, GENERAL, AND ADMINISTRATIVE EXPENSESSelling, general, and administrative expenses for the years ended March 31, 2016 and 2015, consisted of the following:
Millions of YenThousands of U.S. Dollars
2016 2015 2016
Freight expenses ¥12,948 ¥13,290 $114,584Salaries and welfare expenses 21,944 21,419 194,195Provision for bonuses to employees 2,340 2,231 20,708Provision for bonuses to directors and Audit & Supervisory Board members 159 271 1,407Net periodic retirement benefit costs 154 377 1,363Depreciation 1,227 1,377 10,858Other 11,229 10,723 99,372
Total ¥50,001 ¥49,688 $442,487
15. LEASES(As lessor)
Expected revenues from noncancelable operating leases at March 31, 2016 and 2015, were as follows:
Millions of YenThousands of U.S. Dollars
2016 2015 2016
Due within one year ¥ 507 ¥ 497 $ 4,487Due after one year 3,116 3,516 27,575
Total ¥3,623 ¥4,013 $32,062
Fin
an
cia
l s
ec
tio
n
41
16. FINANCIAL INSTRUMENTS AND RELATED DISCLOSURES(1) Group Policy for Financial InstrumentsThe Group uses financial instruments, mainly short-term and long-term debt including bank loans and bonds, based on its capital financing
plan. Cash surpluses, if any, are invested in low-risk financial assets. Derivatives are used, not for speculative purposes, but only for the
purpose of reducing exposure to financial risks as described in (2) below.
(2) Nature and Extent of Risks Arising from Financial InstrumentsReceivables—trade, such as trade notes and accounts, and electronically recorded monetary claims, are exposed to customer credit risk.
Although receivables in foreign currencies are exposed to the market risk of fluctuation in foreign currency exchange rates, those risks are
netted against the balance of payables denominated in the same currency, of which positions are almost equal. In addition, foreign currency
receivables of certain consolidated subsidiaries are hedged by using forward foreign currency contracts. Investment securities, mainly equity
instruments of customers and suppliers of the Group and for alliance purposes, are exposed to the risk of market price fluctuations.
Payment terms of payables—trade, such as trade notes and accounts, and electronically recorded obligations, are less than one year.
Although payables in foreign currencies are exposed to the risk of fluctuation in foreign currency exchange rates, those risks are netted
against the balance of receivables denominated in the same foreign currency, of which positions are almost equal, as noted above. In addi-
tion, foreign currency trade payables in certain consolidated subsidiaries are exposed to risk resulting from fluctuations in foreign currency
exchange rates. The risk is hedged by using forward foreign currency contracts.
Short-term bank loans and commercial paper are mainly used for general operating purposes, and long-term bank loans and bonds are
mainly used for investment and strategy. Although a part of such bank loans and commercial paper, excluding bonds, is exposed to risk of
changes in variable interest rates, that risk is mitigated by using interest rate swaps. Bonds are not exposed to risk of changes in interest
rates as interest rates are fixed.
Derivatives mainly include forward foreign currency contracts, which are used to manage future cash flows, currency swaps and interest
rate swaps, which are used to manage risks from changes in interest rates of bank loans. Please see Note 17 for more detail about derivatives.
(3) Risk Management for Financial InstrumentsCredit risk management
Credit risk is the risk of economic loss arising from a counterparty’s failure to repay or service debt according to the contractual terms. The
Group manages its credit risk from receivables on the basis of internal guidelines, which include monitoring of payment terms and balances
of major customers by each business administration department to identify the default risk of customers at an early stage. To reduce the
counterparty risk, the Group enters into derivative transactions only with highly rated financial institutions. Please see Note 17 for detail
about derivatives.
The maximum credit risk exposure of financial assets is limited to their carrying amounts as of March 31, 2016.
Market risk management (foreign exchange risk and interest rate risk)
Foreign currency trade receivables and payables are exposed to market risk resulting from fluctuations in foreign currency exchange rates.
Such foreign exchange risk is netted against the balance of receivables and payables, of which positions are almost equal. In addition,
certain consolidated subsidiaries hedge such risk principally by using forward foreign currency contracts.
Interest rate swaps and currency swaps are used to manage exposure to risks of changes in interest rates of loan payables.
Investment securities are managed by monitoring market values and the financial position of issuers on a regular basis.
Derivative transactions of the Company are undertaken by the finance and accounting department and the procurement center and
reported to directors or the Board of Directors based on internal regulations that prescribe the authority and maximum amount for each
transaction. Derivative transactions of consolidated subsidiaries are undertaken by the finance and accounting department based on
internal regulation.
Liquidity risk management
The Group manages its liquidity risk by establishing a cash management plan according to reports from each department.
Fin
an
cia
l s
ec
tio
n
42

(4) Fair Values of Financial InstrumentsFair values of financial instruments are based on quoted prices in active markets. If quoted prices are not available, other rational valuation
techniques are used instead. Please see Note 17 for the details of the fair value of derivatives.
(a) Fair value of financial instruments
March 31, 2016
Millions of Yen Thousands of U.S. Dollars
Carrying Amount Fair Value
Unrealized Loss
Carrying Amount Fair Value
Unrealized Loss
Cash and cash equivalents ¥ 33,774 ¥ 33,774 – $ 298,885 $ 298,885 –Time deposits 1,155 1,155 – 10,221 10,221 –Receivables—trade 98,800 98,800 – 874,336 874,336 –Investment securities 51,488 51,488 – 455,646 455,646 –Investment in associates 4,414 2,447 ¥(1,967) 39,062 21,655 $(17,407)
Total ¥189,631 ¥187,664 ¥(1,967) $1,678,150 $1,660,743 $(17,407)
Short-term bank loans ¥ 18,545 ¥ 18,545 – $ 164,115 $ 164,115 –Current portion of long-term debt 24,648 24,683 ¥ (35) 218,124 218,434 $ (310)Payables—trade 68,153 68,153 – 603,124 603,124 –Income taxes payable 2,752 2,752 – 24,354 24,354 –Long-term debt 92,423 92,845 (422) 817,903 821,638 (3,735)
Total ¥206,521 ¥206,978 ¥ (457) $1,827,620 $1,831,665 $ (4,045)
March 31, 2015
Millions of Yen
Carrying Amount Fair Value
Unrealized Loss
Cash and cash equivalents ¥ 31,776 ¥ 31,776 –Time deposits 851 851 –Receivables—trade 105,007 105,007 –Investment securities 70,868 70,868 –Investment in associates 4,419 3,620 ¥(799)
Total ¥212,921 ¥212,122 ¥(799)
Short-term bank loans ¥ 22,656 ¥ 22,656 –Current portion of long-term debt 25,702 25,832 ¥(130)Payables—trade 78,040 78,040 –Income taxes payable 3,883 3,883 –Long-term debt 97,850 98,216 (366)
Total ¥228,131 ¥228,627 ¥(496)
Cash and Cash Equivalents, Time Deposits, Receivables—trade, Short-Term Bank Loans, Current Portion of Long-Term Debt with Variable
Interest Rates, Payables—trade, and Income Taxes Payable
The carrying values of cash and cash equivalents, time deposits, receivables—trade, short-term bank loans, current portion of long-term
debt with variable interest rates, payables—trade, and income taxes payable, approximate fair value because of their short maturities. The
fair values of receivables—trade, payables—trade, and short-term bank loans include the fair values of foreign currency forward contracts
and interest rate swaps.
Investment Securities
The fair values of investment securities are measured at the quoted market price of the stock exchange for equity instruments and at the
quoted price obtained from the financial institution for certain debt instruments. Fair value information for investment securities by classifica-
tion is included in Note 3.
Fin
an
cia
l s
ec
tio
n
43

Long-Term Debt with Fixed Interest Rates
The fair values of long-term debt with fixed interest rates are determined by discounting the cash flows related to the debt at the risk-free
rate plus credit spread or at the Group’s assumed corporate borrowing rate.
Derivatives
Fair value information for derivatives is included in Note 17.
(b) Carrying amount of financial instruments whose fair value cannot be reliably determined
Millions of YenThousands of U.S. Dollars
2016 2015 2016
Securities that do not have a quoted market price in an active market:Investment securities ¥ 1,945 ¥ 1,978 $ 17,212Investments in unconsolidated subsidiaries and associated companies 15,973 13,491 141,354
(5) Maturity Analysis for Financial Assets and Securities with Contractual Maturities
March 31, 2016
Millions of Yen
Due in One Year or Less
Due after One Year through
Five Years
Due after Five Years through
10 YearsDue after 10 Years
Cash and cash equivalents ¥ 33,774 – – –Time deposits 1,155 – – –Receivable—trade 98,800 – – –Total ¥133,729 – – –
March 31, 2016
Thousands of U.S. Dollars
Due in One Year or Less
Due after One Year through
Five Years
Due after Five Years through
10 YearsDue after 10 Years
Cash and cash equivalents $ 298,885 – – –Time deposits 10,221 – – –Receivable—trade 874,336 – – –Total $1,183,442 – – –
Please see Note 7 for annual maturities of long-term debt and the current portion of long-term debt.
17. DERIVATIVESThe Group enters into foreign currency forward contracts, interest rate swaps, and currency swaps. The Group does not hold or issue deriv-
atives for trading or speculative purposes. Derivative transactions entered into by the Group have been made in accordance with internal
policies, which regulate hedging policy, authorization, credit limit, and reporting to management. Each derivative transaction is periodically
reported to management, which evaluates and analyzes the derivatives. To reduce the counterparty risk, the Group enters into the derivative
transactions only with highly rated financial institutions. The contract amounts of derivatives which are shown in the following table do not
measure the Group’s exposure to market risk.
Fin
an
cia
l s
ec
tio
n
44

(a) Derivative transactions to which hedge accounting is not applied at march 31, 2016 and 2015
At March 31, 2016
Millions of Yen
Contract Amount
Contract Amount Due after One Year
Fair Value
Unrealized Gain/(Loss)
Foreign currency forward contracts:Buying:
U.S. dollar ¥ 198 – ¥ (5) ¥ (5)Euro 211 – (1) (1)Yen 480 – 5 5Thai Baht 0 – (0) (0)RMB 49 – (3) (3)
Selling:U.S. dollar 3,502 – 36 36Euro 185 – (1) (1)Thai Baht 271 – 4 4RMB 74 – 0 0
At March 31, 2015
Millions of Yen
Contract Amount
Contract Amount Due after One Year
Fair Value
Unrealized Gain/(Loss)
Foreign currency forward contracts:Buying:
U.S. dollar ¥ 239 – ¥ (1) ¥ (1)Euro 139 – (7) (7)Yen 385 – (15) (15)Thai Baht 0 – 0 0H.K. dollar 0 – (0) (0)RMB 0 – 0 0
Selling:U.S. dollar 5,970 – (49) (49)Euro 113 – 3 3Thai Baht 146 – (5) (5)RMB 86 – (2) (2)
At March 31, 2016
Thousands of U.S. Dollars
Contract Amount
Contract Amount Due after One Year
Fair Value
Unrealized Gain/(Loss)
Foreign currency forward contracts:Buying:
U.S. dollar $ 1,752 – $ (44) $ (44)Euro 1,867 – (9) (9)Yen 4,248 – 44 44Thai Baht 0 – (0) (0)RMB 434 – (27) (27)
Selling:U.S. dollar 30,991 – 319 319Euro 1,637 – (9) (9)Thai Baht 2,398 – 35 35RMB 655 – 0 0
Fin
an
cia
l s
ec
tio
n
45

(b) Derivative transactions to which hedge accounting is applied at march 31, 2016 and 2015
At March 31, 2016
Millions of Yen
Hedged ItemContract Amount
Contract Amount Due after One Year
Fair Value
Foreign currency forward contracts:Hedge accounting:
Selling:U.S. dollar Receivables—trade ¥ 3 – ¥ 0Euro Receivables—trade 0 – (0)
Qualified for hedge accounting not remeasured at market value:Selling:
See Note on the
following page
U.S. dollar Receivables—trade 1 –Euro Receivables—trade 10 –
Currency swaps:
Short-term bank loans and long-term debt
Yen payment, U.S. dollar receipt 2,000 ¥ 2,000Interest rate swaps:
Fixed rate payment, floating rate receipt 37,300 33,900
At March 31, 2015
Millions of Yen
Hedged ItemContract Amount
Contract Amount Due after One Year
Fair Value
Foreign currency forward contracts:Hedge accounting:
Buying:U.S. dollar Payables—trade ¥ 303 – ¥ 23Pound Sterling Payables—trade 54 – 2
Selling:U.S. dollar Receivables—trade 169 – (22)
Qualified for hedge accounting not remeasured at market value:Buying:
See Note on the
following page
U.S. dollar Payables—trade 45 –Pound Sterling Payables—trade 46 –
Selling:U.S. dollar Receivables—trade 102 –
Currency swaps:Yen payment, U.S. dollar receipt 2,000 ¥ 2,000
Interest rate swaps: Short-term bank loans and long-term debtFixed rate payment, floating rate receipt 37,300 37,300
Fin
an
cia
l s
ec
tio
n
46

At March 31, 2016
Thousands of U.S. Dollars
Hedged ItemContract Amount
Contract Amount Due after One Year
Fair Value
Foreign currency forward contracts:Hedge accounting:
Selling:U.S. dollar Receivables—trade $ 27 – $0Euro Receivables—trade 0 – (0)
Qualified for hedge accounting not remeasured at market value:Selling:
See Note below
U.S. dollar Receivables—trade 9 –Euro Receivables—trade 88 –
Currency swaps:
Short-term bank loans and long-term debt
Yen payment, U.S. dollar receipt 17,699 $ 17,699Interest rate swaps:
Fixed rate payment, floating rate receipt 330,088 300,000
Note: Fair values of derivatives qualified for hedge accounting, which are not remeasured at market value, are included in the fair values of hedged items in Note 16.
18. COMMITMENTS AND CONTINGENT LIABILITIESAt March 31, 2016, the Group was contingently liable for ¥5,838 million ($51,664 thousand) for guarantees of loans and payables of
unconsolidated subsidiaries, associated and other companies and employees, including borrowings of ¥3,600 million ($31,858 thousand)
by Yugen Kaisha Takakura Founding Corporation (“Takakura”).
The Company had an obligation to invest additionally in Takakura via an anonymous association contract with an upper limit of ¥524
million ($4,637 thousand) in the event that buildings owned by Takakura are destroyed or impaired by natural disaster.
Fin
an
cia
l s
ec
tio
n
47

19. OTHER COMPREHENSIVE (LOSS) INCOMEThe components of other comprehensive (loss) income for the years ended March 31, 2016 and 2015, were as follows:
Millions of YenThousands of U.S. Dollars
2016 2015 2016
Unrealized gain on available-for-sale securities:(Loss) gains arising during the year ¥(17,029) ¥13,353 $(150,699)Reclassification adjustments to profit or loss (318) (1,816) (2,814)Amount before income tax effect (17,347) 11,537 (153,513)Income tax effect 5,865 (2,925) 51,902Total (11,482) 8,612 (101,611)
Deferred gain on derivatives under hedge accounting:(Loss) gains arising during the year (3) 2 (27)Reclassification adjustments to profit or loss – (1) –Amount before income tax effect (3) 1 (27)Income tax effect 1 (0) 9Total (2) 1 (18)
Land revaluation surplus:Income tax effect 62 104 549Total 62 104 549
Foreign currency translation adjustments:Adjustments arising during the year (1,699) 2,357 (15,035)Total (1,699) 2,357 (15,035)
Defined retirement benefit plans:Adjustments arising during the year (14,750) 11,308 (130,531)Reclassification adjustments to profit or loss (1,486) (817) (13,150)Amount before income tax effect (16,236) 10,491 (143,681)Income tax effect 5,122 (3,307) 45,327Total (11,114) 7,184 (98,354)
Share of other comprehensive (loss) income in associates:Gain arising during the year (81) 101 (717)Reclassification adjustments to profit or loss (0) – (0)Total (81) 101 (717)
Total other comprehensive (loss) income ¥(24,316) ¥18,359 $(215,186)
20. SUBSEQUENT EVENTa. appropriations of retained earnings
The following appropriation of retained earnings at March 31, 2016, was approved at the Company’s shareholders’ meeting held on June
28, 2016:
Millions of YenThousands of U.S. Dollars
Year-end cash dividends, ¥2.5 ($0.02) per share ¥1,067 $9,442
b. share exchange with noncontrolling shareholders of daido Kogyo
On May 31, 2016, the Board of Directors approved a plan for acquisition of shares of Daido Kogyo Co., Ltd. (“Daido Kogyo”), a consolidated
subsidiary of the Company, by issuing the Company’s shares to all the shareholders of Daido Kogyo in exchange for the shares of Daido
Kogyo. The Company entered into the share exchange agreement with Daido Kogyo on the same day.
The share exchange is planned on October 1, 2016 based on the assumption that the share exchange is approved by the shareholders’
meeting of Daido Kogyo on June 29, 2016. This share exchange is made in order to strengthen the marketing initiatives in foreign countries
and to establish efficient business models for turbo materials business, magnetic and high alloy business.
Fin
an
cia
l s
ec
tio
n
48

The exchange ratio will be determined by the following formula:
Exchange ratio = ¥696 yen ($6.16) / the average of daily volume weighted average price of the Company during the period from August
22, 2016 to September 16, 2016.
As a result of the transactions, the Company will own 100% of issued shares of Daido Kogyo.
c. acquisition of treasury stocks
On May 31, 2016, the Board of Directors approved a plan for the acquisition of common stocks of the Company up to 10,000 thousand
shares in the amount of ¥5,000 million ($44,248 thousand) maximum, which represent 2.34% of the Company’s issued stocks (excluding
treasury stock), during the period from June 1, 2016 to August 19, 2016. The Company is to acquire shares from Tokyo Stock Exchange.
21. SEGMENT INFORMATIONUnder ASBJ Statement No. 17, “Accounting Standard for Segment Information Disclosures,” and ASBJ Guidance No. 20, “Guidance on
Accounting Standard for Segment Information Disclosures,” an entity is required to report financial and descriptive information about its
reportable segments. Reportable segments are operating segments or aggregations of operating segments that meet specified criteria.
Operating segments are components of an entity about which separate financial information is available and such information is evaluated
regularly by the chief operating decision maker in deciding how to allocate resources and in assessing performance. Generally, segment
information is required to be reported on the same basis as is used internally for evaluating operating segment performance and deciding
how to allocate resources to operating segments.
1. Description of Reportable SegmentsThe Group’s reportable segments are those for which separate financial information is available and regular evaluation by the Company’s
management is being performed in order to decide how resources are allocated among the Group.
The Group has business divisions based on the nature of its products and services. Each division draws up strategies and operates its
own business.
The Group consists of five industries: “Specialty Steel,” “High Performance Materials and Magnetic Materials,” “Parts for Automobile and
Industrial Equipment,” “Engineering,” and “Trading and Service.” “Specialty Steel” industry consists of manufacturing of specialty steel for
automotive and industrial machinery parts.
“High Performance Materials and Magnetic Materials” industry consists of manufacturing of stainless steel, high alloy and magnetic
materials, titanium products and powder metals for automotive and industrial machinery, and electrical and electronic parts.
“Parts for Automobile and Industrial Equipment” industry consists of manufacturing of die-forged parts, forging products, and other
products for automotive and industrial machinery parts.
“Engineering” industry consists of manufacturing and maintenance of steelmaking and environmental equipment, industrial furnaces,
and associated equipment.
“Trading and Service” industry consists of real estate-related services and welfare and other services.
2. Methods of Measurement for the Amounts of Sales, Profit, Assets, and Other Items for Each Reportable Segment
The accounting policies of each reportable segment are consistent with those disclosed in Note 2, “SUMMARY OF SIGNIFICANT
ACCOUNTING POLICIES.”
Reportable segment profit represents operating income.
Fin
an
cia
l s
ec
tio
n
49

3. Information about Sales, Profit, Assets, and Other Items is as Follows:
2016
Millions of Yen
Reportable Segment
Reconciliations ConsolidatedSpecialty
Steel
High Performance Materials and
Magnetic Materials
Parts for Automobile
and Industrial Equipment Engineering
Trading and Service Total
Sales
Sales to external customers ¥170,514 ¥155,251 ¥ 99,680 ¥26,104 ¥ 9,029 ¥460,578 – ¥460,578
Intersegment sales or transfers 83,637 17,535 31,399 2,506 10,583 145,660 ¥(145,660) –
Total ¥254,151 ¥172,786 ¥131,079 ¥28,610 ¥19,612 ¥606,238 ¥(145,660) ¥460,578
Segment profit ¥ 7,561 ¥ 12,331 ¥ 1,299 ¥ 2,071 ¥ 1,173 ¥ 24,435 ¥ (3) ¥ 24,432
Segment assets 184,569 164,708 126,795 17,956 16,575 510,603 25,073 535,676
Other:
Depreciation and amortization 7,811 6,763 6,472 336 1,072 22,454 – 22,454
Investments in associated companies accounted for by the equity method 4,839 4,648 408 84 – 9,979 378 10,357
Increase in property, plant, and equipment and intangible assets 7,670 6,906 7,044 245 1,340 23,205 – 23,205
2015
Millions of Yen
Reportable Segment
Reconciliations ConsolidatedSpecialty
Steel
High Performance Materials and
Magnetic Materials
Parts for Automobile
and Industrial Equipment Engineering
Trading and Service Total
Sales
Sales to external customers ¥189,125 ¥161,758 ¥ 99,386 ¥22,904 ¥10,460 ¥483,633 – ¥483,633
Intersegment sales or transfers 73,313 16,756 30,907 2,532 10,630 134,138 ¥(134,138) –
Total ¥262,438 ¥178,514 ¥130,293 ¥25,436 ¥21,090 ¥617,771 ¥(134,138) ¥483,633
Segment profit ¥ 3,178 ¥ 13,518 ¥ 1,024 ¥ 1,652 ¥ 1,043 ¥ 20,415 ¥ (6) ¥ 20,409
Segment assets 199,313 185,699 119,238 19,249 17,799 541,298 47,292 588,590
Other:
Depreciation and amortization 7,831 7,213 6,037 351 1,005 22,437 – 22,437
Investments in associated companies accounted for by the equity method 4,612 4,753 366 78 – 9,809 330 10,139
Increase in property, plant, and equipment and intangible assets 9,173 9,162 9,514 450 1,997 30,296 – 30,296
Fin
an
cia
l s
ec
tio
n
50
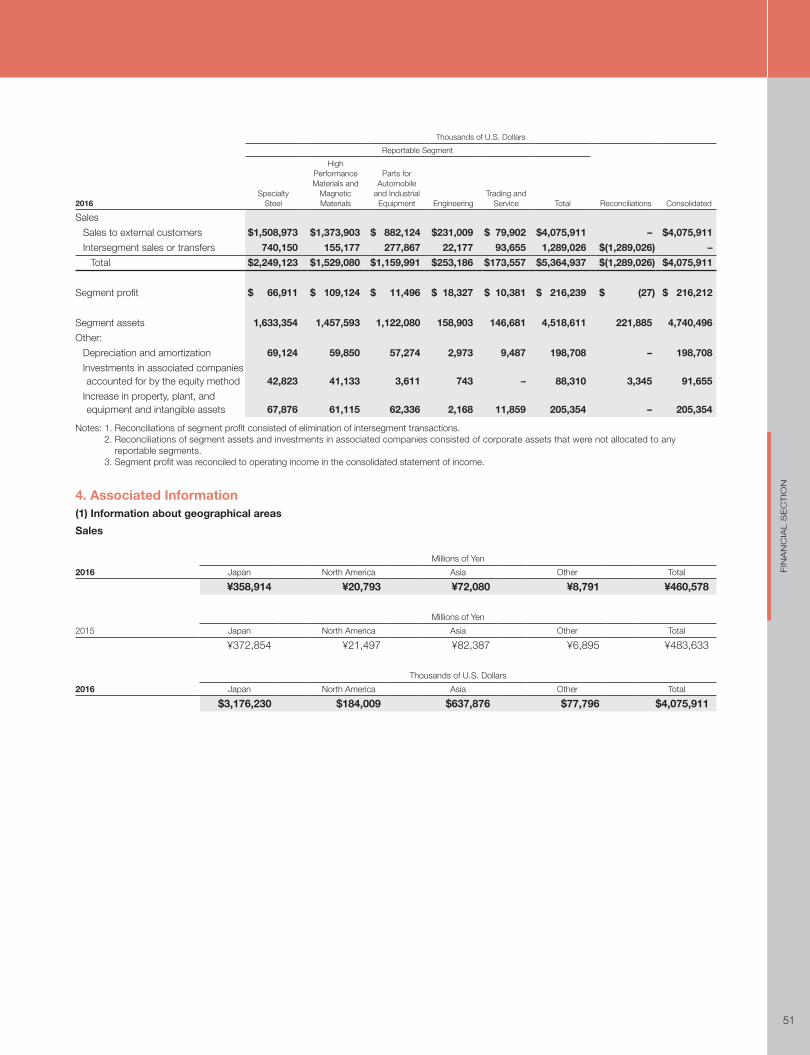
2016
Thousands of U.S. Dollars
Reportable Segment
Reconciliations ConsolidatedSpecialty
Steel
High Performance Materials and
Magnetic Materials
Parts for Automobile
and Industrial Equipment Engineering
Trading and Service Total
Sales
Sales to external customers $1,508,973 $1,373,903 $ 882,124 $231,009 $ 79,902 $4,075,911 – $4,075,911
Intersegment sales or transfers 740,150 155,177 277,867 22,177 93,655 1,289,026 $(1,289,026) –
Total $2,249,123 $1,529,080 $1,159,991 $253,186 $173,557 $5,364,937 $(1,289,026) $4,075,911
Segment profit $ 66,911 $ 109,124 $ 11,496 $ 18,327 $ 10,381 $ 216,239 $ (27) $ 216,212
Segment assets 1,633,354 1,457,593 1,122,080 158,903 146,681 4,518,611 221,885 4,740,496
Other:
Depreciation and amortization 69,124 59,850 57,274 2,973 9,487 198,708 – 198,708
Investments in associated companies accounted for by the equity method 42,823 41,133 3,611 743 – 88,310 3,345 91,655
Increase in property, plant, and equipment and intangible assets 67,876 61,115 62,336 2,168 11,859 205,354 – 205,354
Notes: 1. Reconciliations of segment profit consisted of elimination of intersegment transactions. 2. Reconciliations of segment assets and investments in associated companies consisted of corporate assets that were not allocated to any
reportable segments. 3. Segment profit was reconciled to operating income in the consolidated statement of income.
4. Associated Information(1) Information about geographical areas
Sales
Millions of Yen
2016 Japan North America Asia Other Total
¥358,914 ¥20,793 ¥72,080 ¥8,791 ¥460,578
Millions of Yen
2015 Japan North America Asia Other Total
¥372,854 ¥21,497 ¥82,387 ¥6,895 ¥483,633
Thousands of U.S. Dollars
2016 Japan North America Asia Other Total
$3,176,230 $184,009 $637,876 $77,796 $4,075,911
Fin
an
cia
l s
ec
tio
n
51
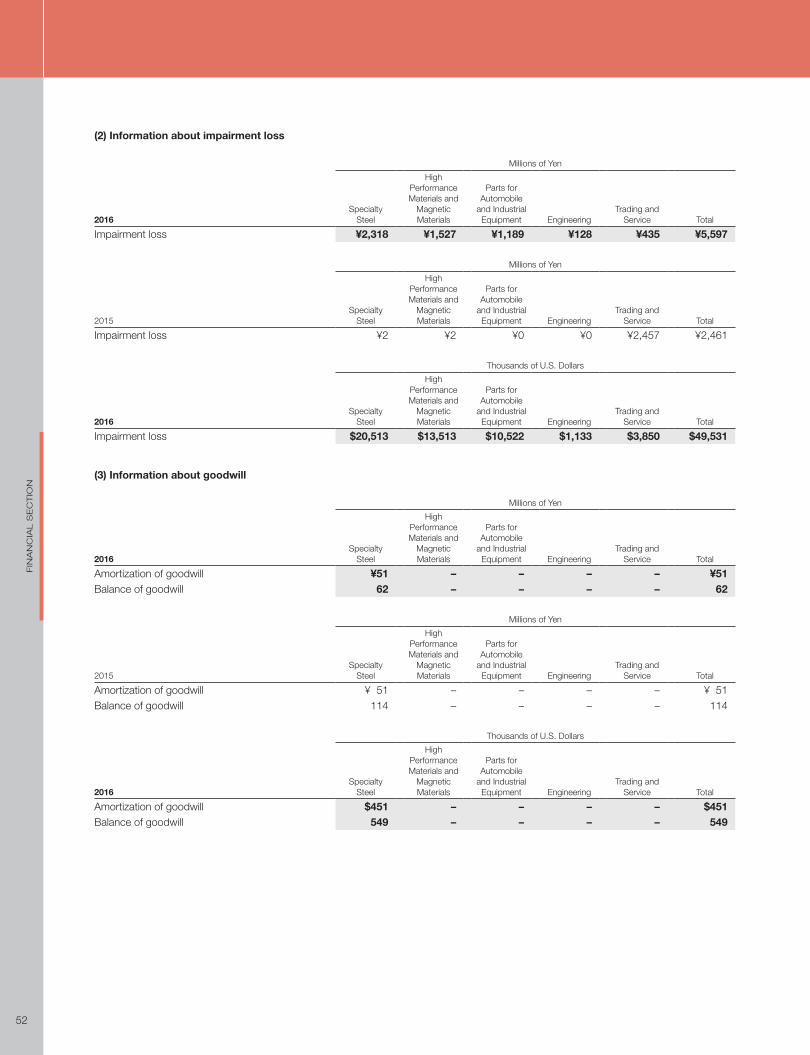
(2) Information about impairment loss
2016
Millions of Yen
Specialty Steel
High Performance Materials and
Magnetic Materials
Parts for Automobile
and Industrial Equipment Engineering
Trading and Service Total
Impairment loss ¥2,318 ¥1,527 ¥1,189 ¥128 ¥435 ¥5,597
2015
Millions of Yen
Specialty Steel
High Performance Materials and
Magnetic Materials
Parts for Automobile
and Industrial Equipment Engineering
Trading and Service Total
Impairment loss ¥2 ¥2 ¥0 ¥0 ¥2,457 ¥2,461
2016
Thousands of U.S. Dollars
Specialty Steel
High Performance Materials and
Magnetic Materials
Parts for Automobile
and Industrial Equipment Engineering
Trading and Service Total
Impairment loss $20,513 $13,513 $10,522 $1,133 $3,850 $49,531
(3) Information about goodwill
2016
Millions of Yen
Specialty Steel
High Performance Materials and
Magnetic Materials
Parts for Automobile
and Industrial Equipment Engineering
Trading and Service Total
Amortization of goodwill ¥51 – – – – ¥51Balance of goodwill 62 – – – – 62
2015
Millions of Yen
Specialty Steel
High Performance Materials and
Magnetic Materials
Parts for Automobile
and Industrial Equipment Engineering
Trading and Service Total
Amortization of goodwill ¥ 51 – – – – ¥ 51Balance of goodwill 114 – – – – 114
2016
Thousands of U.S. Dollars
Specialty Steel
High Performance Materials and
Magnetic Materials
Parts for Automobile
and Industrial Equipment Engineering
Trading and Service Total
Amortization of goodwill $451 – – – – $451Balance of goodwill 549 – – – – 549
Fin
an
cia
l s
ec
tio
n
52

inDePenDent aUDitoR’s RePoRt
•
Fin
an
cia
l s
ec
tio
n
53

DaiDo netWoRk
offices & BranchesAddress Phone (Facsimile)
Head Office Urbannet Nagoya Building,1-10,
Higashisakura 1-chome,
Higashi-ku, Nagoya, Aichi
461-8581, Japan
81-52-963-7501
(81-52-963-4386)
Tokyo Head Office Daido Shinagawa Building, 6-35,
Konan 1-chome, Minato-ku,
Tokyo 108-8478, Japan
81-3-5495-1253
(81-3-5495-6733)
Osaka Branch Kogin Building, 1-1, Koraibashi
4-chome, Chuo-ku, Osaka 541-
0043, Japan
81-6-6229-6530
(81-6-6202-8663)
Fukuoka Sales Office 13-2, Tenjin 1-chome, Chuo-ku, Fukuoka 810-0001, Japan
81-92-771-4481
(81-92-771-9384)
research institute & plantsDaido Corporate
Research &
Development Center
30, Daido-cho 2-chome,
Minami-ku, Nagoya, Aichi
457-8545, Japan
81-52-611-2522
(81-52-611-9004)
Chita Plant 39, Motohama-machi, Tokai, Aichi
477-0035, Japan
81-562-33-3101
(81-562-33-1570)
Chita
Forging Plant
81-562-33-7461
(81-562-33-1550)
Chita Steel
Strip Plant
81-562-33-7465
(81-562-33-1019)
Hoshizaki Plant 30, Daido-cho 2-chome,
Minami-ku, Nagoya, Aichi
457-8545, Japan
81-52-611-2512
(81-52-614-2492)
Shibukawa Plant 500, Ishihara, Shibukawa, Gunma
377-0007, Japan
81-279-25-2000
(81-279-25-2040)
Kawasaki Techno
Center
4-1, Yako 2-chome,
Kawasaki-ku, Kawasaki,
Kanagawa 210-0863, Japan
81-44-266-3760
(81-44-266-3768)
Tsukiji Techno Center 10, Ryugu-cho, Minato-ku,
Nagoya, Aichi 455-0022, Japan
81-52-691-5181
(81-52-691-5212)
Metal Powder Plant 81-52-691-5186
(81-52-691-5195)
Oji Plant 9-3, Kamiya 3-chome, Kita-ku,
Tokyo 115-0043, Japan
81-3-3901-4161
(81-3-3901-8211)
Kimitsu Plant 1, Kimitsu, Kimitsu, Chiba
299-1141, Japan
81-439-52-1541
(81-439-54-1280)
Takiharu Techno
Center
9, Takiharu-cho, Minami-ku,
Nagoya, Aichi 457-8712, Japan
81-52-613-6801
(81-52-613-6840)
Nakatsugawa
Techno Center
1642-144, Nasubigawa,
Nakatsugawa, Gifu
509-9132, Japan
81-573-68-6171
(81-573-68-6188)
specialty steelDAIDO PDM (Thailand) CO., LTD.
Daido Die & Mold Solutions Co., Ltd.
Daido Tienwen Steel Co., Ltd.
DAIDO AMISTAR (M) SDN. BHD.
DAIDO AMISTAR (S) PTE LTD
Daido Shizai Service Co., Ltd.
Daido Technica Co., Ltd.
Daido EcoMet Co., Ltd.
Riken Seiko Co., Ltd.
Tohoku Steel Co., Ltd.
Maruta Transport Co., Ltd.
Sakurai Kosan Co., Ltd.
Izumi Denki Kogyo Co., Ltd.
Kawaichi Sangyo Co., Ltd.
high performance Materials and Magnetic MaterialsNippon Seisen Co., Ltd.
THAI SEISEN Co., Ltd.
Daido Electronics Co., Ltd.
Daido Electronics (Suzhou) Co., Ltd.
Daido Electronics (Thailand) Co., Ltd.
Shimomura Tokushu Seiko Co., Ltd.
Intermetallics Japan Corporation
Nissei Seiko Co., Ltd.
parts for automobile and industrial equipmentDaido Castings Co., Ltd.
Fuji OOZX Inc.
FUJI VALVE (GUANGDONG) CORPORATION
Japan Drop Forge Co., Ltd.
Toyo Sangyo Co., Ltd.
Daido Star Techno Co., Ltd
Daido Precision Industries Ltd.
OHIO STAR FORGE CO.
engineeringDaido Machinery Co., Ltd.
Daido Environment Engineering Co., Ltd.
Daido Plant Industries Co., Ltd.
trading and serviceDaido Kogyo Co., Ltd.
Daido Life Service Co., Ltd.
Daido Bunseki Research Inc.
Star Info Tech Co., Ltd.
Life Support Co., Ltd.
Kisokoma Heights Co., Ltd.
Daido Steel (America) Inc.
(As of March 31, 2016)
54
DA
IDO
NE
TW
OR
K

Corporate Data (As of March 31, 2016)
Corporate Name: Daido Steel Co., Ltd.
Founded: August 19, 1916
Incorporated: February 1, 1950
Office: (Head Office)
Urbannet Nagoya Building, 1-10, Higashisakura 1-chome,
Higashi-ku, Nagoya, Aichi 461-8581, Japan
Phone: 81-52-963-7501
Facsimile: 81-52-963-4386
(Tokyo Head Office)
Daido Shinagawa Building, 6-35, Konan 1-chome,
Minato-ku, Tokyo 108-8478, Japan
Phone: 81-3-5495-1253
Facsimile: 81-3-5495-6733
Internet Address: http://www.daido.co.jp/en/index.html
Number of Employees
(Non-Consolidated: 3,210
Common Stock: ¥37,172 million
Number of Authorized Shares: 1,160,000,000
Number of Issued Shares: 434,487,693
Number of Shareholders: 23,425
Independent Auditor: Deloitte Touche Tohmatsu LLC
Stock Exchange Listings: Tokyo, Nagoya
Transfer Agent of Common Stock: The Chuo Mitsui Trust and Banking Company, Limited
Principal Shareholders: NIPPON STEEL & SUMITOMO METAL CORPORATION
Meiji Yasuda Life Insurance Company
Japan Trustee Services Bank, Ltd. (Trust Account)
Mizuho Bank, Ltd.
NHK Spring Co., Ltd.
The Bank of Tokyo-Mitsubishi UFJ, Ltd.
HONDA MOTOR CO., LTD.
TOYOTA MOTOR CORPORATION
The Master Trust Bank of Japan, Ltd. (Trust Account)
DENSO CORPORATION
For Further Information,
Please Contact: Investor Relations
(Head Office)
Phone: 81-52-963-7516
Facsimile: 81-52-963-4386
Co
rp
or
at
e D
at
a
55
Printed in JapanThis annual report is printed on recycled paper.
Da
iDo
Ste
el C
o., lt
D. U
TILIzIN
g O
UR
STR
EN
gTH
S, A
IMIN
g AT FU
RTH
ER
gR
Ow
TH a
nn
ua
l r
ep
or
t 2
016