utilization of ggbfs blended cement pastes in …etd.lib.metu.edu.tr/upload/12614683/index.pdf ·...
TRANSCRIPT
UTILIZATION OF GGBFS BLENDED CEMENT PASTES IN WELL CEMENTING
A THESIS SUBMITTED TO THE GRADUATE SCHOOL OF NATURAL AND APPLIED SCIENCES
OF MIDDLE EAST TECHNICAL UNIVERSITY
BY
BARIŞ ALP
IN PARTIAL FULFILLMENT OF THE REQUIREMENTS FOR
THE DEGREE OF MASTER OF SCIENCE IN
CEMENT ENGINEERING
SEPTEMBER 2012
Approval of the thesis:
UTILIZATION OF GGBFS BLENDED CEMENT PASTES IN WELL CEMENTING
submitted by BARIŞ ALP in partial fulfillment of the requirements for the degree of Master of Science in Cement Engineering Department, Middle East Technical University by,
Prof. Dr. Canan ÖZGEN ________________________ Dean, Graduate School of Natural and Applied Science
Asst. Prof. Dr. Sinan. Turhan ERDOĞAN _______________________ Head of Department, Cement Engineering
Prof. Dr. İsmail Özgür YAMAN _______________________ Supervisor, Civil Engineering Dept., METU
Prof. Dr. Serhat AKIN _______________________ Co-Supervisor, Petroleum and Natural Gas Eng. Dept., METU
Examining Committee Members: Prof. Dr. Mustafa TOKYAY ________________________ Civil Engineering Dept., METU Prof. Dr. İsmail Özgür YAMAN ________________________ Civil Engineering Dept., METU Prof. Dr. Serhat AKIN ________________________ Petroleum and Natural Gas Eng. Dept., METU Prof. Dr. Asuman G. TÜRKMENOĞLU ________________________ Geological Engineering Dept., METU Asst. Prof. Dr. Sinan Turhan ERDOĞAN ________________________ Civil Engineering Dept., METU
Date: 07.09.2012
iii
I hereby declare that all information in this document has been obtained and presented in accordance with academic rules and ethical conduct. I also declare that, as required by these rules and conduct, I have fully cited and referenced all material and results that are not original to this work.
Name, Last name: BARIŞ ALP Signature :
iv
ABSTRACT
UTILIZATION OF GGBFS BLENDED CEMENT PASTES IN WELL
CEMENTING
Alp, Barış
M. Sc., Department of Cement Engineering
Supervisor: Prof. Dr. İsmail Özgür Yaman
Co-Supervisor: Prof. Dr. Serhat Akın
September 2012, 120 pages
In well cementing, the cement slurry is exposed to the conditions far different than
those of ordinary Portland cement (PC) used in construction. After placement,
hardened cement paste should preserve integrity and provide zonal isolation through
the life of the well. American Petroleum Institute (API) Class G cement is the most
common cement type used in various well conditions. Class G cement has a high
degree of sulfate resistance which makes it more stable than PC when subjected to
the compulsive well conditions. Ground granulated blast furnace slag (GGBFS)
blended cement has a long history of use in the construction industry, but is not
extensively used in well cementing applications.
This study presents an experimental program to investigate the applicability of CEM
I and GGBFS blended cement pastes in the well cementing industry. Class G cement
and blends of CEM I and GGBFS with the proportions (80:20), (60:40), (40:60) and
(20:80) are prepared with same water/cement ratio (0.44) as restricted for Class G
cement in API Specification 10A to be tested. The cement pastes are cured for ages
of 1 day, 7 days and 28 days at 80 ˚C which represents the condition of medium-
depth oil wells.
v
The presence of an adequate amount of GGBFS in the blend improves properties of
the cement paste especially in the long term and at elevated temperatures. They are
comparable to and under some conditions more preferable to the neat Class G cement
paste. However, the physical properties of cement pastes prepared with neat Class G
cement develop within the first day and negligible change is observed later. In order
to get better hydration for the blended cement paste, the amount of CEM I must be
kept more than GGBFS in the blend to provide sufficient alkalinity for the hydration
of GGBFS. The conclusions obtained from this study indicate that GGBFS blended
CEM I produces high quality well cementing material when compared to Class G
cement.
Keywords: well cementing, API Class G cement, Ground Granulated Blast Furnace
Slag, Slag blended Portland cement, hydrothermal conditions
vi
ÖZ
ÖĞÜTÜLMÜŞ GRANÜLE YÜKSEK FIRIN CÜRUF KARIŞIMLI ÇİMENTO
HAMURLARININ KUYU ÇİMENTOLAMADA DEĞERLENDİRİLMESİ
Alp, Barış
Yüksek Lisans, Çimento Mühendisliği Bölümü
Tez Yöneticisi: Prof. Dr. İsmail Özgür Yaman
Ortak Tez Yöneticisi: Prof. Dr. Serhat Akın
Eylül 2012, 120 sayfa
Kuyu çimentolamada, çimento karışımının maruz kaldığı koşullar, yapı sektöründe
kullanılan Portland çimentosunun (PC) maruz kaldığı koşullardan oldukça farklılık
gösterir. Yerleştirildikten sonra sertleşen çimento hamuru kuyunun bütünlüğünü
korumalı ve bölgesel izolasyon sağlamalıdır. Amerikan Petrol Enstitüsünün (API) G
sınıfı çimentosu farklı kuyu koşullarında kullanılan en yaygın türdür. G sınıfı
çimentonun yüksek sülfat direncine sahip olması onu zorlayıcı kuyu koşullarında
PC’den daha kararlı yapar. Öğütülmüş granüle yüksek fırın cüruf (GGBFS) karışımlı
çimentolar yapı endüstrisinde uzun bir geçmişine sahipken, kuyu çimentolamada
yaygın olarak kullanılmamaktadır.
Bu çalışma CEM I ve GGBFS karışımı ile hazırlanan çimento hamurlarının kuyu
çimentolamadaki uygunluğunu araştıran deneysel bir program sunmaktadır. G sınıfı
çimento ve (80:20), (60:40), (40:60) ve (20:80) oranları ile hazırlanan CEM I ve
GGBFS karışımları G sınıfı çimentonun API Specification 10A’da belirtilen
su/çimento oranına (0.44) göre hazırlanmıştır. Çimento hamurları 1 gün, 7 gün ve 28
gün süreyle orta derinlikteki petrol kuyularındaki koşulları temsil eden 80 ˚C’da küre
tabi tutulmuştur.

vii
Çimento karışımında uygun miktarda GGBFS bulunması çimento hamurunun
özelliklerine uzun vadede ve yüksek sıcaklıkta katkı sağlamaktadır. Bu karışımlar G
sınıfı çimento ile hazırlanan çimento hamuru ile benzer hatta bazı koşullarda daha
tercih edilebilir özellik göstermektedir. Buna karşın, G sınıfı çimento ile hazırlanan
çimento hamurunun fiziksel özellikleri birinci günde belirginleşmekte ve sonrasında
fazla değişiklik göstermemektedir. GGBFS karışımlı çimento hamurlarında daha
fazla hidratasyon elde etmek amacıyla, GGBFS hidratasyonunda gerekli alkalinitenin
sağlanabilmesi için karışımdaki CEM I oranı GGBFS’den fazla olmalıdır. Bu
çalışmanın sonucu; GGBFS ve CEM I karışımlı çimentonun, G sınıfı çimento ile
karşılaştırıldığında yüksek kalitede bir kuyu çimentolama malzemesi olduğunu
göstermektedir.
Anahtar Kelimeler: Kuyu çimentolama, API G Sınıfı çimento, öğütülmüş granüle
yüksek fırın cürufu, cüruf katkılı Portland çimentosu, hidrotermal kür

viii
To My Wife…
ix
ACKNOWLEDGEMENTS
I would like to express great appreciation to both Prof. Dr. İsmail Özgür Yaman and
Prof. Dr. Serhat Akın for their thorough supervision, guidance and continuous
suggestions throughout this research and preparation of this thesis.
I appreciate the help provided by Research Center of Turkish Petroleum Corporation
(TPAO). I would like to thank to both the departments of Reservoir Technology,
Sedimentology and Reservoir Geology, and also express my special thanks to the
department of Drilling Technology.
My sincere thanks are extended to OYAK Bolu Cement plant for supplying all the
materials that I used in my thesis study.
I appreciate close assistance of the Materials of Construction Laboratory personnel in
Civil Engineering Department at METU.
I am grateful to my parents for their patience, encouragement and support.
Finally, I would like to thank my wife Güldeniz for her immortal love and inimitable
moral help in the hard times of my thesis study.
x
TABLE OF CONTENTS
ABSTRACT.................................................................................................................iv
ÖZ................................................................................................................................vi
ACKNOWLEDGMENTS...........................................................................................ix
TABLE OF CONTENTS..............................................................................................x
LIST OF TABLES.....................................................................................................xiii
LIST OF FIGURES....................................................................................................xv
NOMENCLETURE.................................................................................................xviii
CHAPTERS
1. CHAPTER 1 ....................................................................................................... 1
1.1. General ................................................................................................... 1
1.2. Objective ................................................................................................ 4
1.3. Scope ...................................................................................................... 5
2. CHAPTER 2 ....................................................................................................... 6
2.1. Portland Cement ..................................................................................... 6
2.1.1. Raw Materials and Manufacture ............................................................ 6
2.1.2. Clinker Phases ........................................................................................ 7
2.1.3. Calcium Sulfates .................................................................................... 9
2.1.4. Pozzolans ............................................................................................. 10
2.1.5. Classification of Portland Cements ...................................................... 10
2.1.6. Hydration of Portland Cement ............................................................. 11
2.2. Oil Well Cement .................................................................................. 21
2.2.1. Hydration of Portland Cement at Elevated Temperatures ................... 25
2.3. Blast Furnace Slag................................................................................ 28
2.3.1. Raw Materials and Manufacture .......................................................... 28
xi
2.3.2. Slag Types ............................................................................................ 28
2.3.3. Pozzolanic Reaction ............................................................................. 31
2.3.4. Characteristics of GGBFS .................................................................... 32
2.3.5. Hydration of Slag Blended Cement ..................................................... 40
3. CHAPTER 3 ..................................................................................................... 46
3.1. Materials ............................................................................................... 46
3.1.1. Portland Cement ................................................................................... 47
3.1.2. API Class G Cement ............................................................................ 48
3.1.3. Ground Granulated Blast Furnace Slag................................................ 49
3.1.4. Water .................................................................................................... 49
3.1.5. Cement Slurry Compositions ............................................................... 49
3.2. Experimental Procedures ..................................................................... 50
3.2.1. Slurry Preparation ................................................................................ 50
3.2.2. Free Fluid ............................................................................................. 51
3.2.3. Compressive Strength .......................................................................... 53
3.2.4. Porosity ................................................................................................ 53
3.2.5. Permeability ......................................................................................... 56
3.2.6. Mercury Intrusion ................................................................................ 57
3.2.7. Ultrasonic Cement Analyzer ................................................................ 60
3.2.8. Ultrasonic Velocity .............................................................................. 62
3.2.9. Core Scanner ........................................................................................ 63
3.2.10.XRD Analysis ..................................................................................... 64
3.2.11.SEM Analysis ...................................................................................... 65
3.3. Determination of Outliers .................................................................... 65
4. CHAPTER 4 ..................................................................................................... 67
4.1. Characterization of Materials ............................................................... 67
4.2. Free Fluid Content ............................................................................... 68
xii
4.3. Compressive Strength .......................................................................... 71
4.4. Ultrasonic Analysis .............................................................................. 76
4.5. Porosity and Pore Size Distribution ..................................................... 79
4.6. Density ................................................................................................. 83
4.7. Permeability ......................................................................................... 84
4.8. XRD ..................................................................................................... 89
4.9. SEM ..................................................................................................... 91
5. CHAPTER 5 ..................................................................................................... 96
6. CHAPTER 6 ..................................................................................................... 99
6.1. Recommendations ................................................................................ 99
6.2. Future Studies ...................................................................................... 99
REFERENCES ...................................................................................................... 101
APPENDICES
A. ESTIMATED COMPRESSIVE STRENGTH OF CEMENT PASTES BY
UCA .......................................................................................................... 112
B. XRD PATTERNS OF CEMENT PASTES .............................................. 115
C. MERCURY SATURATION OF CEMENT PASTES ............................. 118
xiii
LIST OF TABLES
TABLES
Table 2-1 Typical composition of Portland cement ..................................................... 7 Table 2-2 Crystal structure of various C-S-H phases ................................................ 18 Table 2-3 Chemical requirements of API cement types ............................................ 23 Table 2-4 Physical requirements of API cement types .............................................. 24 Table 2-5 Typical composition and wagner fineness of API cement types ............... 24 Table 2-6 Chemical composition of various BFS types............................................. 32 Table 2-7 Possible crystalline minerals of BFS ......................................................... 34 Table 2-8 Slag activity index requirements ............................................................... 34 Table 2-9 Formulas proposed for assessment of hydraulicity of GGBFS ................. 36 Table 2-10 Free lime content in slag blended cement pastes by wt % ...................... 42 Table 3-1 Chemical composition of materials ........................................................... 46 Table 3-2 Mineralogical composition of the Portland cement and Class G cement
clinker ................................................................................................................. 47 Table 3-3 Physical properties of Portland cement and Class G cement .................... 47 Table 3-4 Requirements for API Class G cement with HSR grade ........................... 48 Table 3-5 Physical properties of GGBFS .................................................................. 49 Table 3-6 Material proportion of cement slurries ...................................................... 50 Table 3-7 Critical values for Dixon (Q) Test ............................................................. 66 Table 4-1 Free Fluid content of cement pastes .......................................................... 69 Table 4-2 Fineness and residue on 45µ sieves of cement blends ............................... 69 Table 4-3 Compressive strength of the hardened cement pastes ............................... 72
xiv
Table 4-4 C/S molar ratio of cement blends .............................................................. 74 Table 4-5 Primary wave (longitudinal) velocity (Vp) and shear wave velocity (Vs) of
hardened cement pastes ...................................................................................... 77 Table 4-6 Porosity of the hardened cement pastes ..................................................... 79 Table 4-7 Solid and bulk density of the hardened cement pastes .............................. 83 Table 4-8 Air permeability of the hardened cement pastes ........................................ 84
xv
LIST OF FIGURES
FIGURES
Figure 1-1 Primary cementing ..................................................................................... 2 Figure 1-2 Squeeze cementing ..................................................................................... 3 Figure 2-1 Rate of heat evolution during hydration of Portland cement ................... 16 Figure 2-2 Effect of curing temperature on sulfoaluminate phases ........................... 27 Figure 2-3 Left to right, air-cooled BFS, expanded BFS and GGBFS ...................... 29 Figure 2-4 a) Effects of curing age on the calcium hydroxide content of a cement-
sand mortar made with a Portland-pozzolan cement. b) Effects of curing age and proportion of slag on the lime content of the portland-slag cement paste. ........ 31
Figure 2-5 Ternary diagram of CaO-SiO2-Al2O3 for indicating composition of PC
and BFS .............................................................................................................. 33 Figure 2-6 Influence of Al2O3 on the strength development for a hydraulic modulus
(C+M)/S = 1.4 .................................................................................................... 36 Figure 2-7 Compressive strength of mortars: cements CEM III/B with 75 percent
slag of specific surface areas (a) 3000 and (b) 4000 cm2/g................................ 38 Figure 2-8 Effect of glass content of slag in compressive strength development of the
mortars ............................................................................................................... 39 Figure 2-9 Distribution of hydration products of slag in the hydrating blended cement
paste. .................................................................................................................. 44 Figure 3-1 Cement slurry preparation with multi-speed mixer .................................. 50 Figure 3-2 Cement slurry conditioning in the atmospheric consistometer ................ 51 Figure 3-3 Measuring free fluid content .................................................................... 52 Figure 3-4 Coring and smoothing the edges of specimens ........................................ 53 Figure 3-5 Dehydration of core specimens at temperature-controlled oven .............. 54 Figure 3-6 Measuring dimensions and mass of each core specimen ......................... 54
xvi
Figure 3-7 Helium porosimeter .................................................................................. 55 Figure 3-8 Steady state gas permeameter .................................................................. 56 Figure 3-9 Micromeritics Autopore IV 9520 ............................................................. 58 Figure 3-10 Capillary action of a wetting and non-wetting liquid relative to the walls
of a capillary ....................................................................................................... 59 Figure 3-11 Ultrasonic cement analyzer .................................................................... 61 Figure 3-12 Sonicviewer SX ...................................................................................... 62 Figure 3-13 DMT Corescan II ................................................................................... 64 Figure 3-14 Left to right SEM and XRD instrument ................................................. 65 Figure 4-1 Free fluid content vs. fineness of the GGBFS blended cement pastes ..... 70 Figure 4-2 Rate of strength development of the hardened cement pastes .................. 73 Figure 4-3 Time dependant compressive strength of the hardened cement pastes
measured by UCA .............................................................................................. 75 Figure 4-4 Ultrasonic velocity of the cement pastes .................................................. 76 Figure 4-5 Modulus of elasticity of the cement pastes .............................................. 77 Figure 4-6 Elastic and Shear modulus of the hardened cement pastes ...................... 78 Figure 4-7 Ratio of porosity reduction of the hardened cement pastes ...................... 80 Figure 4-8 Pore size distribution of the cement pastes .............................................. 82 Figure 4-9 Total pore volume of the cement pastes at specified pore sizes ............... 82 Figure 4-10 Images of 1-day, 7-days and 28-days aged core samples, left to right
order of the cement pastes are G, S20, S40, S60 and S80. ................................ 86 Figure 4-11 Magnified view of the hardened cement pastes, from up to bottom the
order of cement pastes are G, S20, S40, S60 and S80. ...................................... 87 Figure 4-12 Permeability and threshold pressure of the hardened cement pastes ..... 88 Figure 4-13 XRD patterns of the hardened cement pastes at 28-days ....................... 90 Figure 4-14 SEM micrograph of G ............................................................................ 91
xvii
Figure 4-15 SEM micrograph of S20 ......................................................................... 92 Figure 4-16 SEM micrograph of S40 ......................................................................... 93 Figure 4-17 SEM micrograph of S60 ......................................................................... 94 Figure 4-18 SEM micrograph of S80 ......................................................................... 95
xviii
NOMENCLATURE
ACI American Concrete Institute
AFm Alumina, ferric oxide, mono-sulfate
AFt Alumina, ferric oxide, tri-sulfate
API American Petroleum Institute
ASTM American Society for Testing Materials
BFS Blast Furnace Slag
CL Confidence Level
C-S-H Calcium Silicate Hydrate
DTM Destructive Test Method
EN European Standards
GGBFS Ground Granulated Blast Furnace Slag
HM Hydraulic Modulus
HSR High Sulfate Resistance
ICDD International Center for Diffraction Data
ICSD Inorganic Crystal Structure Database
MSR Medium Sulfate Resistance
OPC Ordinary Portland Cement
PC Portland Cement
PSD Particle Size Distribution
RP Recommended Practice
RPM Revolutions Per Minute
SAI Slag Activity Index
SEM Scanning Electron Microscope
SRC Sulfate Resistant Cement
TPAO Turkish Petroleum Corporation
TS Turkish Standards
XRD X-Ray Diffraction
UCA Ultrasonic Cement Analyzer
1
1. CHAPTER 1
CHAPTER 1
INTRODUCTION
1.1. General
Well cementing is one of the most important operations performed on a gas or oil
well. In well cementing, cement slurry is primarily used for filling up the annular
space between protective pipes (casing) and the wellbore. As a second application, it
can also be used for squeeze cementing to plug the wellbore and/or casing. Casing is
a large diameter pipe that is assembled and inserted into a recently drilled section of
a borehole and typically held into place with cement slurry.
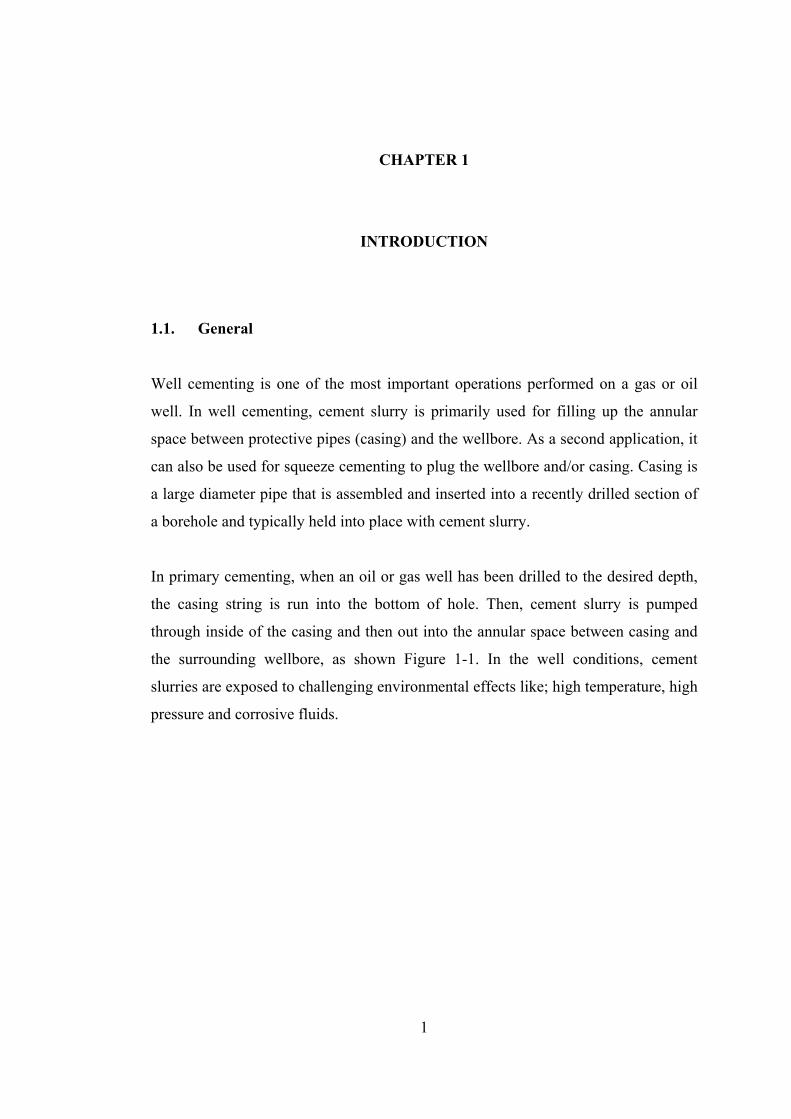
In primary cementing, when an oil or gas well has been drilled to the desired depth,
the casing string is run into the bottom of hole. Then, cement slurry is pumped
through inside of the casing and then out into the annular space between casing and
the surrounding wellbore, as shown Figure 1-1. In the well conditions, cement
slurries are exposed to challenging environmental effects like; high temperature, high
pressure and corrosive fluids.
2
Figure 1-1 Primary cementing (World Oil, 2007)
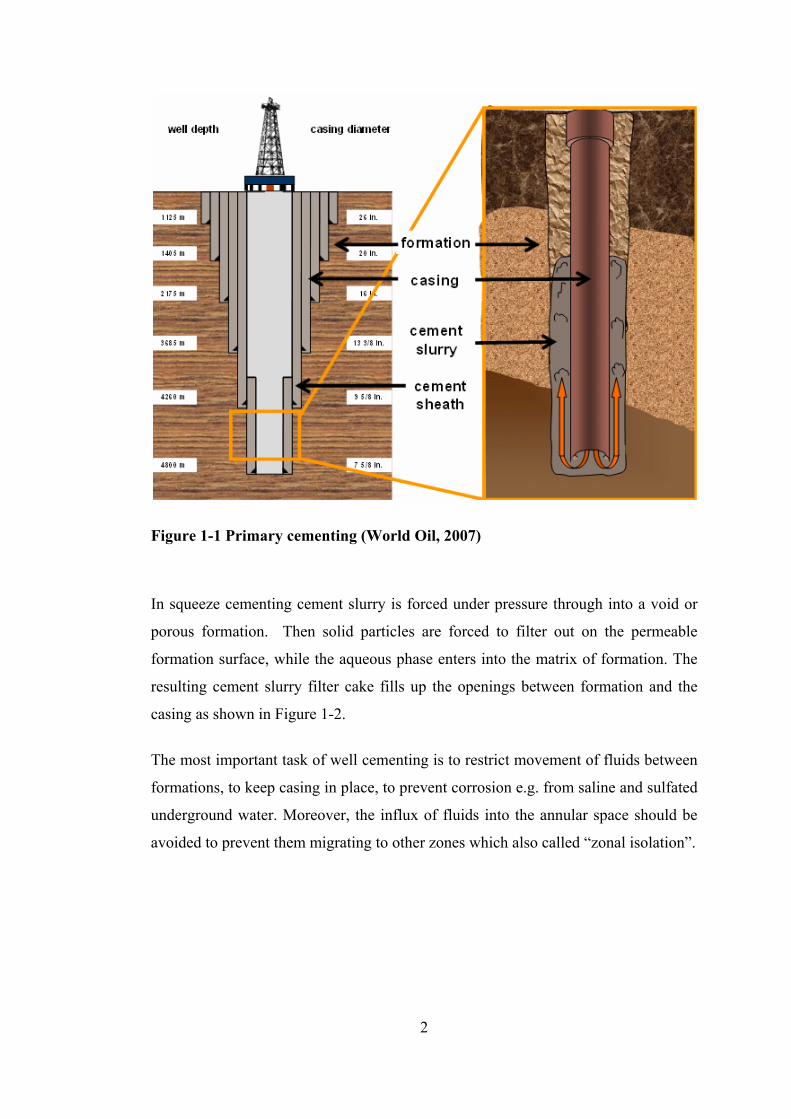
In squeeze cementing cement slurry is forced under pressure through into a void or
porous formation. Then solid particles are forced to filter out on the permeable
formation surface, while the aqueous phase enters into the matrix of formation. The
resulting cement slurry filter cake fills up the openings between formation and the
casing as shown in Figure 1-2.
The most important task of well cementing is to restrict movement of fluids between
formations, to keep casing in place, to prevent corrosion e.g. from saline and sulfated
underground water. Moreover, the influx of fluids into the annular space should be
avoided to prevent them migrating to other zones which also called “zonal isolation”.
3
Figure 1-2 Squeeze cementing (Advanced cementing seminar, 2011)
American Petroleum Institute designates the physical and chemical properties of oil
well cements. There are 8 classes of API cement types which are labeled from A to
H. Among them, the most widely used one is Class G which possesses enhanced
resistance against sulfate attack. It is adapted to various well conditions from surface
to 2440 m, even deeper when used deeper with additives. It is more stable than other
classes when subjected to high temperature and pressure. Beside the advantageous
properties of API Class G cement, it is not widely available. It can be produced by
the manufacturers only with API monogram and the prices are relatively higher than
those of the cement types in EN 197-1.
GGBFS is a by-product of the iron industry obtained by quenching molten iron slag
from a blast furnace in water or steam. It is a type of mineral additive that can be
used as a supplementary cementitious material. It is mainly used for three purposes;
to enhance the properties of fresh and hardened cement pastes, for environmental
aspects due to utilization of industrial waste to reduce CO2 emissions in cement
manufacturing and lastly for economical reasons.
4
It has become industry practice that, substitution of GGBFS to CEM I provides
resistance against sulfate attack. For moderate sulfate resistance (MSR) 15-25
percent of slag whereas for high sulfate resistance (HSR) 35-50 percent of slag
replacement is required based on ASTM C989. Class G cement used in this study is
produced with HSR grade and therefore 35-50 percent slag substitution is expected
to have comparable resistance against sulfate attack. The sulfate resistance of the
cement pastes is kept out of the scope of this study as the literature mentioned above.
The hydration rate of CEM I is high at early periods but slows down soon at later
periods, on the contrary, GGBFS has a lower hydration rate at early periods but
gradually increase at later periods. Therefore, the resulting hydration rate of GGBFS-
CEM I blended cement paste will be in between CEM I and GGBFS. In addition,
Ca(OH)2, which is a hydration product of Portland cement, is also an activator for the
hydration of slag. As a result of this, it can be used as a supplementary material of
cement. According to ASTM C595, slag content in the slag-cement blend can be
used up to 70 percent (in mass), while, EN 197-1 makes limitation of GGBFS in
slag-cement blend up to 95 percent (in mass).
1.2. Objective
The objective of this study is to investigate the applicability of the blends of CEM I
and GGBFS as oil well cement. Further to investigate whether these blends would be
an alternative to the most widely used API Class G cement. For that purpose, five
different cement slurries are prepared to be tested; one of them is neat API Class G
cement and the remaining are the blends of GGBFS and CEM I with different
proportions. The GGBFS blended cement is prepared by mixing them separately.
The resulting cement slurries are tested in terms of free fluid content, compressive
strength, ultrasonic cement analyzer, porosity, permeability, mercury injection,
mineralogical and micro morphological analysis. (XRD and SEM). All cement
slurries are tested under conditions similar to well conditions.
5
1.3. Scope
This thesis consists of six chapters,
Chapter 1 presents the introduction, briefly explaining major aspects of oil well
cement and Portland cement and gives objective and scope of this thesis.
Chapter 2 presents the literature review to put a general background on properties of
Portland cement, API cement types, slag and their hydration mechanism.
Chapter 3 presents the experimental study, briefly describing the test materials and
the procedures of the analysis.
Chapter 4 presents the results and discussion, briefly gives the test results and
discussion of the results.
Chapter 5 presents the main conclusion and gives the recommendations for future
researchers.
Chapter 6 presents the recommendations for future studies.
6
2. CHAPTER 2
CHAPTER 2
LITERATURE REVIEW
2.1. Portland Cement
Portland cement is obtained by inter-grinding industrial produced clinker with a few
percent of calcium sulfate. Among the two, clinker maintains the hydraulic activity
while calcium sulfate controls the setting time of cement paste.
2.1.1. Raw Materials and Manufacture
Clinker is a composition of calcium oxide (CaO), silicon oxide (SiO2), aluminum
oxide (Al2O3) and iron oxide (Fe2O3). Main components, necessary for the
production of clinker, are usually available in the mixture of limestone and clay.
Limestone or marly limestone is the source of CaO, while clay or marly clay is the
source of SiO2, Al2O3 and Fe2O3. These raw materials are mixed in certain
proportions to obtain the required final chemical composition. Therefore, corrective
ingredients are sometimes added during the production process. Pure limestone for
increasing CaO content, quartz sand for increasing SiO2 content, bauxite for
increasing Al2O3 content and hematite or iron ore for increasing Fe2O3 content are
typical examples on the use of corrective ingredients (Labahn, 1983). Table 2-1
shows typical composition of Portland cement.
7
Clinker is produced by burning properly combined raw materials up to a temperature
of 1450 ºC. The first formation of liquid phase signs the starting of the clinkering
also known as sintering period of clinker. After the sintering process, four major
phases are formed, which are Alite (C3S), Belite (C2S), aluminate (C3A) and ferrite
(C4AF). Several compounds, which are alkali sulfates, calcium oxide (CaO),
magnesium oxide (MgO) and other oxides may exist as minor ingredients.
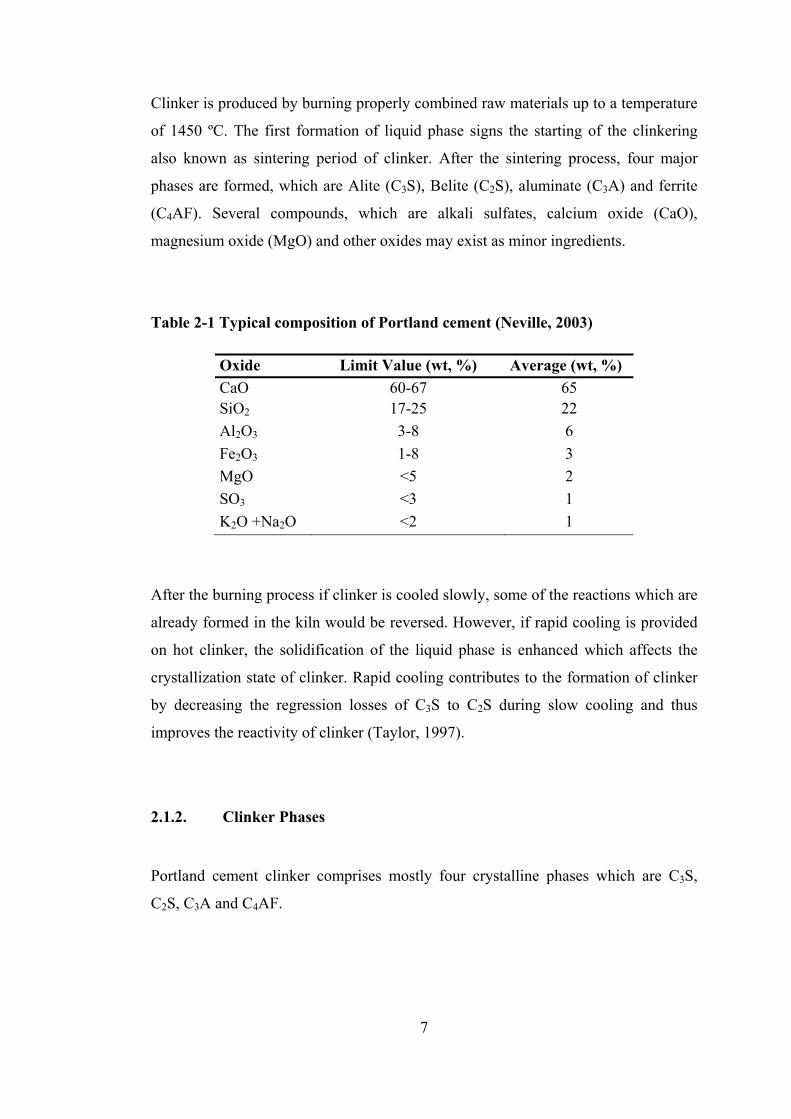
Table 2-1 Typical composition of Portland cement (Neville, 2003)
Oxide Limit Value (wt, %) Average (wt, %) CaO 60-67 65 SiO2 17-25 22 Al2O3 3-8 6 Fe2O3 1-8 3 MgO <5 2 SO3 <3 1 K2O +Na2O <2 1
After the burning process if clinker is cooled slowly, some of the reactions which are
already formed in the kiln would be reversed. However, if rapid cooling is provided
on hot clinker, the solidification of the liquid phase is enhanced which affects the
crystallization state of clinker. Rapid cooling contributes to the formation of clinker
by decreasing the regression losses of C3S to C2S during slow cooling and thus
improves the reactivity of clinker (Taylor, 1997).
2.1.2. Clinker Phases
Portland cement clinker comprises mostly four crystalline phases which are C3S,
C2S, C3A and C4AF.
8
C3S (alite) is the major mineral phase in Portland cement clinker with the chemical
formula 3CaO·SiO2; it constitutes 50-70% of clinker. C3S is thermodynamically
unstable below 1250 °C, but can be preserved in metastable state at room
temperature by rapid cooling (Taylor, 1997).
C2S (belite) is the second important mineral phase in Portland cement clinker and
constitutes of about 15-20% of clinker. The chemical formula of C2S is 2CaO·SiO2
and normally present in clinker as β polymorph. At room temperature it is possible to
change thermodynamically to the more stable γ polymorph, but this form does not
hydrate and should be avoided in Portland cement. Therefore, β polymorph of C2S
can be stabilized at room temperature through rapid cooling (Labahn, 1983).
C3A (tricalcium aluminate) is the most common mineral among aluminates and
constitutes 5-10% of Portland cement clinker. The chemical formula of C3A is
3CaO·Al2O3 and possesses high degree of reactivity. Its hydration is very rapid and
undesirable flash setting may occur if a setting control agent (usually gypsum) is not
used (Domone and Illstone, 2010).
Ferrite constitutes 10-15% of Portland cement clinker and does not have an exact
chemical formula. The chemical composition may vary between C2(A0.7,F0.3) and
C2(A0.3,F0.7), however, more or less the composition corresponds to tetra calcium
aluminoferrite (C4AF) (Odler, 2004; Labahn, 1983). Ferrite has little or negligible
contribution to the compressive strength of the hardened cement paste. Its hydration
is fast if a setting control agent (usually gypsum) is not used and gives its specific
color (grey) to clinker.
Free lime (uncombined CaO) is another important component in Portland cement
clinker. It may occur because of the inhomogenities of raw material or inadequate
burning in the kiln. Free lime has a deleterious effect on the hardened cement paste.
9
Excessive amounts may cause undesirable volume expansion (also known as lime
expansion), and therefore free lime content is limited up 2 percent by mass in most of
the Portland cement clinker (Labahn, 1983).
Free MgO does also have a deleterious effect on hardened cement paste similar to
free lime, because of its tendency to hydrate with the presence of water (Labahn,
1983). EN 197-1 limits the MgO amount to 5 percent by mass in Portland cement
clinker.
Alkalis are may also present in Portland cement clinker. There are two principle
alkali oxides in clinker which are sodium oxide (Na2O) and potassium oxide (K2O).
These two alkalis are treated together and released during early periods of cement
hydration. They combine with sulfates to form alkali sulfates (Taylor, 1997). Alkalis
can cause expansion with certain aggregates, and some specifications limit the alkali
content up to 0.6% equivalent Na2O (Na2O+0.66 K2O) (ASTM C150).
In Portland cement clinker, presence of distinct components is possible. They may
exist in the geochemical nature of the raw material or come from the mineral content
of fuel. These possible components are; TiO2, P2O5, SrO, F, MnO3, Cr2O3, Cs2O,
V2O5, Cl, As2O3, CuO, PbO, CdO, BaO, Tl2O, etc. (Taylor, 1997; Labahn, 1983;
Jackson, 2004).
2.1.3. Calcium Sulfates
Calcium sulfate is added to clinker at a level between 3 and 5 percent to control the
setting of Portland cement. According to EN 197-1, calcium sulfates can be gypsum
(calcium sulfate dihydrate, CaSO4·2H2O), hemihydrates (calcium sulfate
hemihydrates, CaSO4·½H2O) or anhydrite (anhydrous calcium sulfate, CaSO4) or any
mixture of them.

10
2.1.4. Pozzolans
Pozzolans are materials, which exhibit cementitious property when combined with
calcium hydroxide. Pozzolans are commonly used as an additive in Portland cement
to enhance long-term strength and durability. When a mixture of Portland cement
and pozzolan react with water, pozzolanic reaction progresses like an acid-base
reaction. Lime and alkalies released from Portland cement reacts with the oxides
(SiO2 + A12O3 + Fe2O3) of the pozzolan (ACI 232).
Pozzolans can be classified into two; natural pozzolans (e.g., volcanic ashes,
diatomaceous earth, etc.) and artificial pozzolans (e.g., slag, fly ash, etc.). Since the
use of slag is investigated within this thesis; the following section is devoted to its
properties.
2.1.5. Classification of Portland Cements
ASTM C150 defines cement types as;
I Normal
II Moderate sulfate resistance
III High-early strength
IV Low heat of hydration
V High sulfate resistance
Sulfate resistant cement is used with the presence of alkali soil or threat of sulfate
salts found in ground water. This type of cement has a limitation on C3A and C4AF
amount which affects sulfate resistance.

11
2.1.6. Hydration of Portland Cement
In cement chemistry, hydration is the chemical reaction between anhydrous cement
grain and water. Freshly mixed paste is in liquid form and has a plastic structure. As
the reaction proceeds, the hydration products gradually bond together and turn into
solid called “hardened cement paste”. The progress and kinetics of hydration are
affected by a variety of factors (Odler, 2004):
• Composition of the cement and presence of foreign ions
• Fineness of the cement
• Water/cement (w/c) ratio
• Curing temperature
• Presence of chemical admixtures, i.e. dispersants or retarders
• Presence of mineral additives, i.e. GGBFS or pulverized fly ash
It is necessary to look for the four principle clinker phases in the hydration of
Portland cement clinker. In general, the reaction of hydration can be simplified as;
clinker phases (high in energy;
contain no water) + water →
hydrate phases (low in energy; contain water)
+energy (heat of
hydration)
(2.1)
As shown above, the reaction of hydration is exothermic due to the high entropy
energy of the clinker phases.
12
2.1.6.1. Hydration of Pure Clinker Phases
It is better to investigate hydration of clinker phases separately due to the complexity
of hydration mechanism of Portland cement and to avoid from the influence of the
foreign ions released from the hydration of other phases (Odler, 2004).
C3S is the most important component of Portland cement clinker and generally
responsible for the early strength development. The hydration products of C3S at
ambient temperatures are; amorphous C-S-H with a CaO/SiO2 less than 3.0 and
calcium hydroxide as shown in the Equation 2.2.
2 C3S + 6 H → C3S2H3 + 3 CH (2.2)
C2S is the second important component of Portland cement and mostly responsible
for the ultimate strength development. C2S hydration is similar to C3S, however its
hydration is slower, lower heat is generated and lower amount of CH is produced.
The hydration products of C2S at ambient temperatures are; amorphous C-S-H and
CH as shown in the Equation 2.3.
2 C2S + 4 H → C3S2H3 + CH (2.3)
The hydration of C3A is very fast and generates more heat compared to C3S. In the
absence of any additives, C3A reacts with water to form gel-like material on the
surface of C3A. Later, transforms into two meta-stable intermediate hexagonal
crystal phases, C2AH8 and C4AH13 shown in Equation 2.4. Additional precipitation
amounts of these crystals, converts them to cubic C3AH6 as shown in equation 2.5.
This is the only thermodynamically stable calcium aluminate hydrate at ambient
13
temperatures. If the temperature is above 80 °C, C3AH6 can directly be form in the
hydration of C3A (Odler, 2004).
2 C3A + 21 H → C4AH13 + C2AH8 (2.4)
C4AH13 + C2AH8 → 2 C3AH6 + 9 H (2.5)
Gypsum is usually added to the Portland cement to control the rate of reaction. In the
presence of gypsum, C3A solubility decreases and hydration slows down. C3A reacts
with gypsum in the presence of water to form AFt phases (ettringite). AFt phases
then react with C3A to form AFm phases depending on the gypsum/C3A ratio as
shown in Equations 2.6 and 2.7 (Day, 1992).
C3A + 3CSH2 + 26H → C6AS3H32 (2.6)
2C3A + C6AS3H32 + 4H → 3C4ASH12 (2.7)
The hydration products of ferrite are similar to C3A. The initial hydration rate of pure
C4AF is usually faster than C3A but then slows down soon. In the absence of
gypsum, C2(A,F)H8 and/or C4(A,F)Hx is formed and then converts to more stable
iron-containing hydrogarnet phase (C3(A,F)H6). In the presence of gypsum, AFt
phase C6(A,F) S3H32 is formed as an initial hydration product (Chatterji and Jeffrey,
1962). Hydrogarnet phase is formed directly in the hydration at elevated
temperatures (Negro and Steffari, 1979). After all gypsum is consumed AFt phase
convert to AFm phases.
14
Minor ingredients in Portland cement clinker are also affecting hydration. The most
significant ones are; alkalis (Na2O and K2O), MgO, CaO and sulfates. Alkalis are
deleterious for hardened cement paste and affect strength development of cement
paste. It has a positive effect on strength development at early ages, but at later ages
strength retrogression occurs (Jawed and Skalny, 1978).
Free CaO and MgO are exposed to high-temperature (>1400 °C) in kiln and result in
crystalline structures. The highly crystalline CaO and MgO are much less reactive
with water. The delayed hydration of these minerals may cause volume instability in
the hardened cement paste. The reactions are illustrated in Equations 2.8 and 2.9. The
solubility of MgO in water is much less than that of CaO and therefore it is more
deleterious compared to CaO (Mehta, 2006).
CaO + H2O → Ca(OH)2 (2.8)
MgO + H2O → Mg(OH)2 (2.9)
Sulfates in clinker react with CH to form additional gypsum in cement paste.
Excessive amounts of gypsum contribute to the formation of AFt phases which has
also deleterious effect on hardened cement paste.
2.1.6.2. Mechanism of Portland Cement Hydration
The hydration of Portland cement is more complex than the hydration of individual
clinker phases. It is characterized by five stages (Odler, 2004).
15
Pre-induction period (first minutes)
Immediately with the contact of water, highly soluble ionic species in cement
dissolves into liquid phase. Alkali sulfates dissolve in a few seconds and releases K+,
Na+ and SO42- ions. Calcium sulfates dissolve until super saturation and releases Ca2+
and additional SO4-2 ions. In the pre-induction period, 2 to 10 % of C3S is hydrated.
With the hydration of C3S, Ca2+ and OH- are released and C-S-H precipitates on the
cement grains. AFt phases produced and precipitated on the cement surfaces with the
dissolution of C3A and C4(A,F) in Ca2+ and SO4-2 rich solution. Negligible amounts
of C2S hydrates at the pre-induction period.
Induction (dormant) period (first few hours)
After rapid hydration at pre-induction period, hydration slows down significantly.
Ca2+ concentration in the liquid phase increases until it reaches to its critical
supersaturation and then CH starts to precipitate. AFt phases continue to precipitate
but SO4-2 remains constant due to the dissolution of additional calcium sulfates. This
stage is important in concrete technology because cement paste is still workable.
Acceleration stage (3-12 hours after mixing)
In this period C3S hydration accelerates and second stage C-S-H forms and certain
amounts of C2S contributes to hydration. Crystalline CH (portlandite) precipitates
and Ca2+ concentration in the liquid phase gradually declines. SO4-2 concentration in
the liquid phase also declines because of the precipitation of AFt phases. This stage
determines the setting time and early strength development of cement paste.
16
Deceleration period
In this period hydration rate slows down gradually, and SO4-2 concentration in liquid
phase continues to decline. When SO4-2 in liquid phase is depleted, AFt reacts with
C3A and C4(A,F) to form AFm. As a consequence of the deposition of additional
hydrates, strength of hardened cement paste increases while porosity decreases.
Steady state period
In this period hydration rate is relatively slow. Hydrated C-S-H becomes denser and
portlandite crystals continue to grow. The strength of hardened cement paste
increases while rate of heat generation and porosity decreases. However, the duration
of this period is indefinite, total hydration never attained.
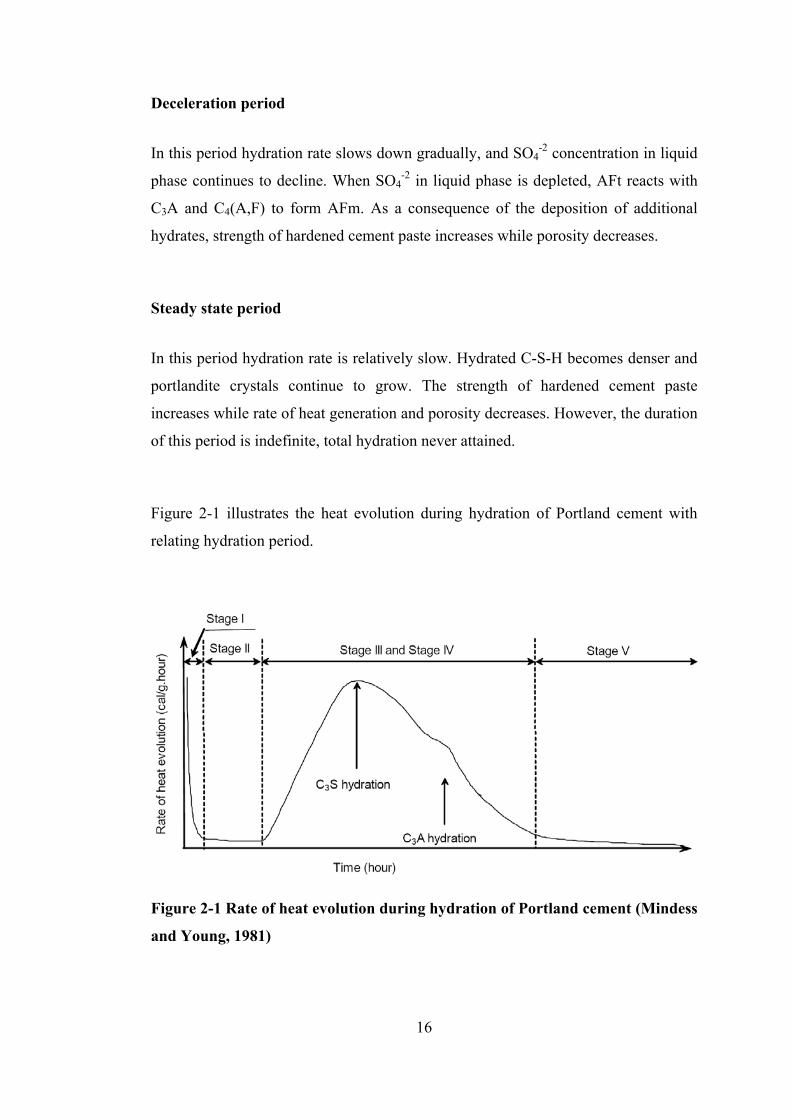
Figure 2-1 illustrates the heat evolution during hydration of Portland cement with
relating hydration period.
Figure 2-1 Rate of heat evolution during hydration of Portland cement (Mindess
and Young, 1981)
17
2.1.6.3. Calcium Sulfate
The solubility of calcium sulfate depends on their form; gypsum is much lower than
anhydrate, and hemihydrate has the highest solubility among them. At early and
middle periods of hydration, calcium sulfate dissolves and reacts with aluminates and
ferrite to form AFt or AFm phases (Nelson, 1990).
2.1.6.4. Heat of Hydration
Portland cement is a product that is formed at high temperatures and therefore
possesses high-energy state. When cement hydrates, energy is liberated and turns to a
low-energy state. The rates of heat liberation from hydration of the individual
compounds can be used as indices of their reactivity. The data from heat of hydration
studies can be used for characterizing the setting and hardening behavior of cement,
or for predicting the temperature rise.
2.1.6.5. Hydration Products
2.1.6.5.1. Calcium Silicate Hydrate
Calcium silicate hydrate (C-S-H) phase is formed as a hydration product of both C3S
and β-C2S. It is almost amorphous in structure and dashes indicate that there is not
any specific chemical composition implied. On the total hydration of both C3S and β-
C2S with stoichiometric calculations, approximate composition of the hydration
product is assumed to be C3S2H3 as shown in Equations 2.2 and 2.3. On complete
hydration of Portland cement, C3S produce 61% C3S2H3 and 39% CH, whereas β-
C2S produce 82% C3S2H3 and 18% CH. Therefore ultimate strength of the hydrated
β-C2S is expected to be more than C3S (Mehta, 2006).
18
The chemical reactions between calcium and silicate ions in aqueous suspensions
bring them together to form amorphous C-S-H gel and intermediate crystalline
phases. There are 30 types of C-S-H phases, the most significant crystalline phases
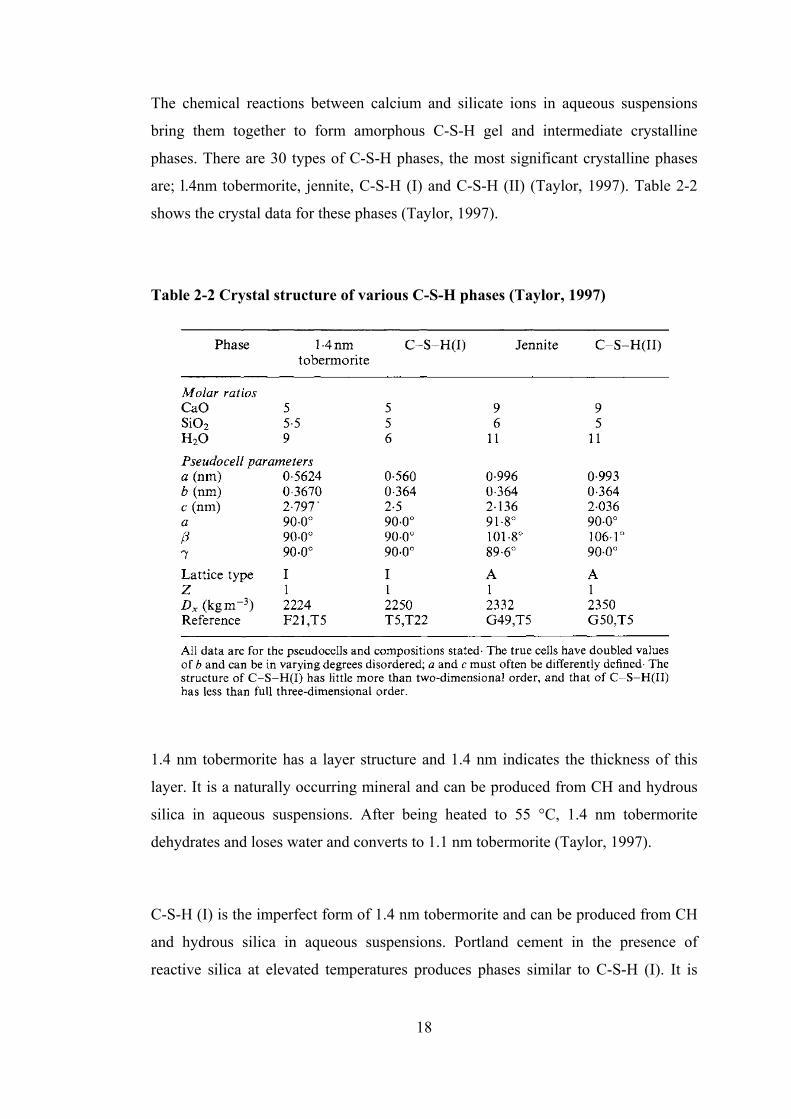
are; l.4nm tobermorite, jennite, C-S-H (I) and C-S-H (II) (Taylor, 1997). Table 2-2
shows the crystal data for these phases (Taylor, 1997).
Table 2-2 Crystal structure of various C-S-H phases (Taylor, 1997)
1.4 nm tobermorite has a layer structure and 1.4 nm indicates the thickness of this
layer. It is a naturally occurring mineral and can be produced from CH and hydrous
silica in aqueous suspensions. After being heated to 55 °C, 1.4 nm tobermorite
dehydrates and loses water and converts to 1.1 nm tobermorite (Taylor, 1997).
C-S-H (I) is the imperfect form of 1.4 nm tobermorite and can be produced from CH
and hydrous silica in aqueous suspensions. Portland cement in the presence of
reactive silica at elevated temperatures produces phases similar to C-S-H (I). It is
19
more ordered than the C-S-H gel formed in Portland cement pastes. Also, C-S-H (I)
is an intermediate product of hydrothermal reactions at temperatures up to 180 °C
and can be detected in pastes made from alkali-activated slag (Taylor, 1997).
Jennite can occur as a natural mineral and has a layer structure similar to 1.4 nm
tobermorite. The main difference is the OH- groups linked to the calcium atoms in
the central region of the individual layers. C-S-H (II) is the imperfect form of jennite
and its Ca/Si ratio is higher than that of jennite. According to Taylor from the
compositional standpoint, jennite and C-S-H (II) are closer to C-S-H gel than 1.4 nm
tobermorite and C-S-H(I). The conditions with high Ca/Si in suspension favor the
formation of C-S-H (II) or jennite at high temperatures (Damidot and Nonat, 1994).
There are four morphological types of C-S-H gel as investigated by SEM analysis of
fractured surfaces of cement paste. Type I is a fibrous material and forms at early
ages of cement paste being up to 2 µm long. Type II C-S-H appears at normal early
ages and forms reticular networks or honeycomb like structures. Type III is
prominent in older pastes and consists of tightly packed equant grains up to 300 nm
across. Type IV is observed in older ages as inner product with featureless and
massive structure (Diamond, 1976).
2.1.6.5.2. Calcium Hydroxide, Ca(OH)2
Calcium hydroxide (CH) crystals (also called as portlandite) are produced from
hydration of mainly C3S and β-C2S. It constitutes 20 to 25 percent of solids by
volume in the hydrated cement paste. In the available pore spaces it tends to form
large hexagonal-prism crystals. The strength contribution of CH is very low or
negligible compared to C-S-H and can be easily removed by the action of water.
Also CH is not chemically stable. It can react with sulfates to form gypsum which is
deleterious in hardened cement paste.
20
2.1.6.5.3. Calcium Sulfoaluminate Hydrates
Calcium sulfoaluminate hydrates (AFm and AFt) occupy 15-20 percent by volume of
the hydrated paste. As mentioned earlier, in fresh cement paste gypsum reacts with
alumina-bearing phase (C3A and C4AF) to form primarily AFt, then it eventually
transforms to AFm by time. Ettringite is by far the most common AFt phase with
needle-shaped prismatic crystal structures present in hydrated cement paste. Massive
growth of ettringite fills the pores and cracks of hardened cement paste. Failure of
hardened cement paste caused by expansion in the presence of sulfate is due to the
formation of ettringite.
Monosulfate is the most common AFm phases in hydrated cement paste. It tends to
occur in the later stages of hydration. It forms hexagonal-plate crystals which are less
deleterious compared to ettringite. At ambient temperatures ettringite is more stable
than monosulfate, and thus existence of monosulfate in the hardened cement paste
make it more vulnerable to sulfate attack (Kelly, 1960).
Both ettringite and monosulfate contain small amounts of Fe3+ which can substitute
aluminum in the crystal structure (Mehta, 2006).
2.1.6.5.4. Carboaluminate
The atmospheric CO2 or carbonates in the cement paste react with CH to produce
calcium carbonate. Calcium carbonates can also be available in the presence of finely
ground limestone. Calcium carbonate is reported to react with the tricalcium
aluminate to form high and low forms of the carboaluminate, C3A • 3CaCO3 • 32H2O
(C6AC3H32) and C3A•CaCO3•12H2O (C4ACH12) respectively. Calcium carbonates
can act as a partial substitute for gypsum in sulfoaluminates (Jackson, 2004).
21
2.2. Oil Well Cement
In the exploration and production of oil and gas wells, there are various applications
of well cementing. The most important well cementing operation is primary
cementing. In primary cementing, the borehole is lined with a protective steel tube,
called casing, from surface through the bottom of hole. Cement slurry is pumped and
then displaced up into the annular space between the casing and the borehole wall
(Bensted, 2006). The aim of primary cementing is to support and protect the casing
from external pressure and corrosive underground fluids and also to prevent the
movement of fluid through the cement sheath. Another important application for
well cementing is squeeze cementing operation (Nelson, 1990; Mehta, 2006). In
squeeze cementing, the slurry is forced to plug the voids of casing or borehole wall at
a specified depth (Taylor, 1997).
The temperature that cement slurry is exposed to is proportional to the depth of
borehole. As the depth of the well increases, the bottom hole temperature rises. The
total pressure that cement slurry is exposed to is the sum of hydrostatic head of
drilling mud and/or cement slurry in the hole and the pumping pressure of cement
slurry (Bensted, 2006). Drilling mud is a fluid used to aid the drilling of boreholes
into the earth.
Specifications for oil well cement are different than that of the Portland cement types
applied in construction industry. API (American Petroleum Institute) designates the
specifications for cement types according to the well conditions. In the well
conditions, cement slurries are exposed to high temperature, high pressure and
corrosive underground fluids. There are eight types of API Portland cements which
are arranged from A to H. These types are defined according to the depth of wells
with varying degrees of sulfate resistance. API specifications do not cover all the
well conditions for cementing including extremely hot and cold well conditions.
These eight types of oil well cements illustrate the chemical and physical
22
requirements that fulfill the most of the well conditions. API describes the cement
types as below;
• Class A: Intended for use from surface to 1830 m depth, when special
properties are not required. Available only in Ordinary type (similar to
ASTM C150 Type I)
• Class B: Intended for use from surface to 1830 m depth, when conditions
require moderate to high sulfate resistance. Available both moderate (similar
to ASTM C 150, Type II) and high sulfate-resistant types.
• Class C: Intended for use from surface to 1830 m depth, when conditions
require high early strength. Available in ordinary and moderate (similar to
ASTM C 150, Type III) and high sulfate-resistant types.
• Class D: Intended for use from surface to 1,830 m to 3050 m depth, under
conditions of moderately high temperatures and pressures. Available in both
moderate and high sulfate-resistant types.
• Class E: Intended for use from surface to 1,830 m to 4270 m depth, under
conditions of high temperatures and pressures. Both moderate and high
sulfate-resistant types available.
• Class F: Intended for use from surface to 1,830 m to 4880 m depth, under
conditions of extremely high temperatures and pressures. Available in both
moderate and high sulfate-resistant types.
• Class G and H: Intended for use as a basic well cement from surface to 2,440
m depth as manufactured, or can be used with accelerators and retarders to
cover a wide range of well depths and temperatures. No additions other than
calcium sulfate or water, or both, shall be interground or blended with the
clinker during manufacture of Class G and Class H cement. It is available
only in moderate and high sulfate-resistant types.
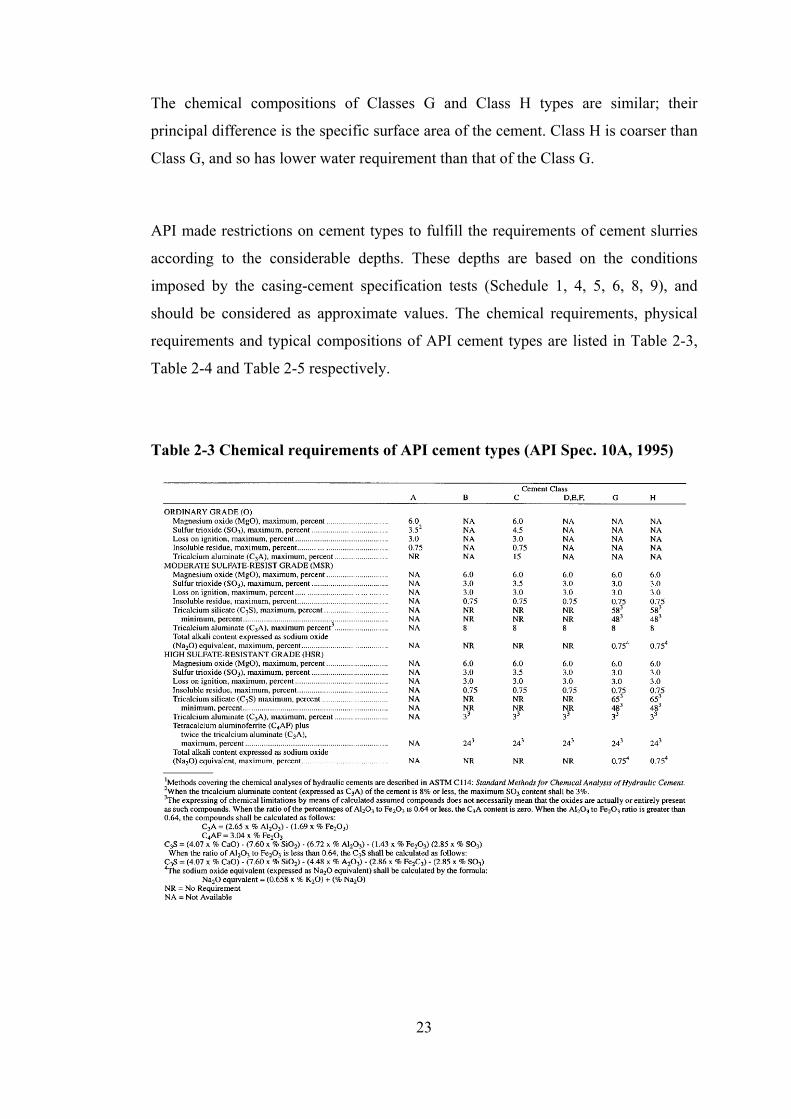
23
The chemical compositions of Classes G and Class H types are similar; their
principal difference is the specific surface area of the cement. Class H is coarser than
Class G, and so has lower water requirement than that of the Class G.
API made restrictions on cement types to fulfill the requirements of cement slurries
according to the considerable depths. These depths are based on the conditions
imposed by the casing-cement specification tests (Schedule 1, 4, 5, 6, 8, 9), and
should be considered as approximate values. The chemical requirements, physical
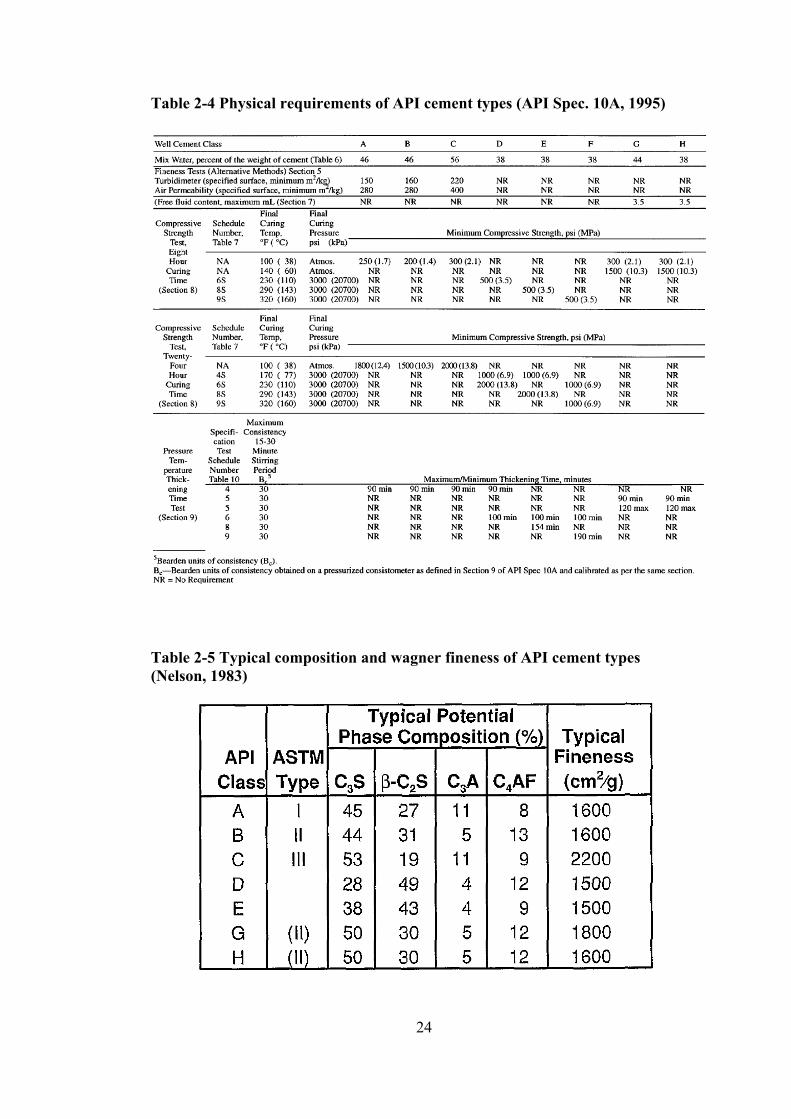
requirements and typical compositions of API cement types are listed in Table 2-3,
Table 2-4 and Table 2-5 respectively.
Table 2-3 Chemical requirements of API cement types (API Spec. 10A, 1995)
24
Table 2-4 Physical requirements of API cement types (API Spec. 10A, 1995)
Table 2-5 Typical composition and wagner fineness of API cement types (Nelson, 1983)
25
2.2.1. Hydration of Portland Cement at Elevated Temperatures
At elevated temperatures, hydration rate of C3S increases at early ages, on the other
hand, hydration rate of C2S increases both at early and later ages (months later)
especially at high temperatures (Odler, 2004). Therefore, the overall hydration rate of
Portland cement increases at elevated temperatures.
C-S-H gel is thermodynamically stable up to 110 °C; at higher temperatures C-S-H
gel metamorphose to more stable structures. Hydration at high temperatures leads to
the formation of highly crystalline silicate hydrates with more Ca/Si ratio. It takes
free lime, which is already available due to C3S and C2S hydration, and converts to
the phases called mainly “alpha dicalcium silicate hydrate” (α-C2SH) and / or Jaffeite
(C3SH1.5) (Andrew et al, 2008). α-C2SH is highly crystalline and much denser than
C-S-H gel. Conversion of C-S-H to α-C2SH occurs with an associated volume
reduction and therefore, is deleterious to the hardened cement paste. As a result,
compressive strength and permeability of the hardened cement paste is adversely
affected by the formation of α-C2SH (Taylor, 1997; Nelson, 1990).
The strength retrogression of cement paste at high temperatures can be prevented by
reducing Ca/Si ratio in the cement paste. It can be reduced to 1.0 with addition of 35-
40 percent silica by weight of cement (Nelson, 1990). In the presence of finely
ground silica, pozzolanic reaction takes place and C-S-H gel tend to form 1.1 nm
tobermorite, (C5S6H5) (Odler, 2004). At temperatures above 150 °C, tobermorite
converts to mainly xonotlite (C6S6H) and gyrolite (C6S3H2). At 250 °C truscotite
begins to appear and both xonotlite and truscottie are stable up to 400 °C (Nelson,
1990).
Among pozzolans α-quartz is the most effective pozzolanic material due to its high
silica content and is frequently used in thermal wells to prevent strength
retrogression (Nelson, 1990).
26
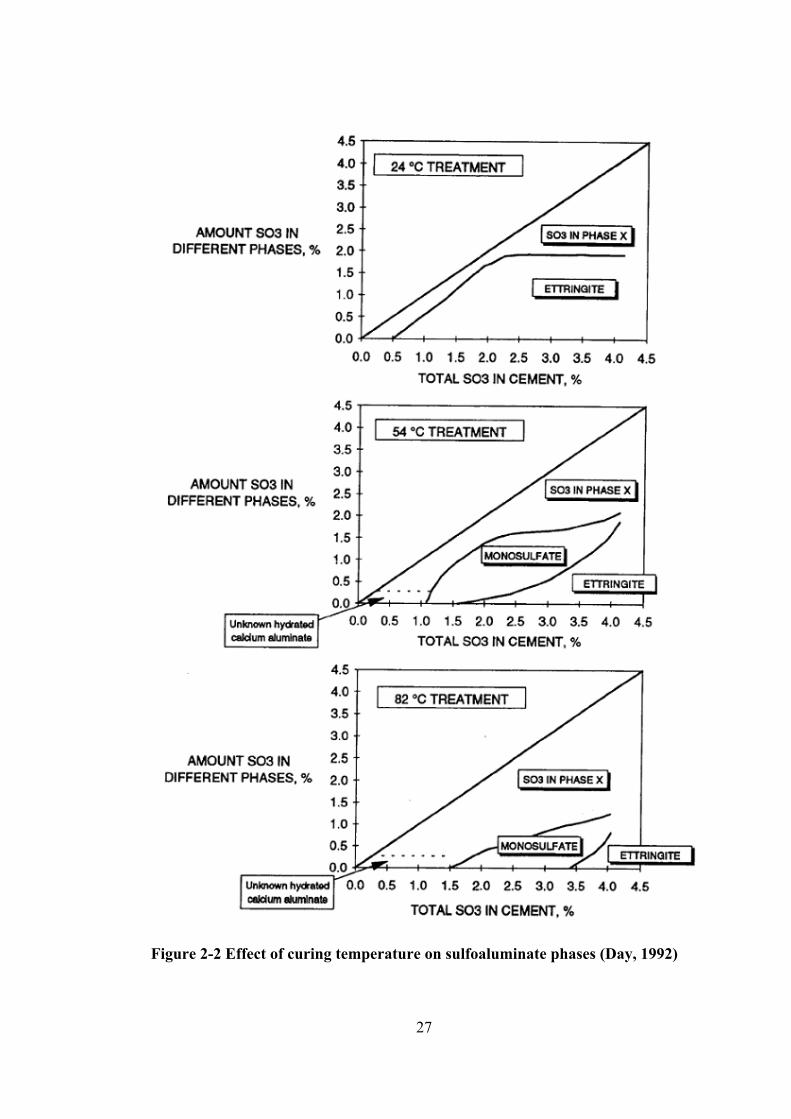
The structure of sulfoaluminate phases are more temperature dependent. After 70 °C
ettringite is no longer thermodynamically stable and decomposes to monosulptates
(Kalousek, 1941; Klemm and Adams, 1990). In contrast to AFt phases, monosulptate
is not deleterious for the hardened cement paste (Day, 1992). Figure 2-2
demonstrates the distribution of sulfate phases at various temperatures (Kalousek,
1965). Boiling at 100 °C for 11 days yields total destruction of monosulphates and
decomposes to gypsum (Day, 1992). Further hydration over 100 °C, C3A and
C2(A,F) turns to hydrogarnet phase (Odler, 2004).
27
Figure 2-2 Effect of curing temperature on sulfoaluminate phases (Day, 1992)
28
2.3. Blast Furnace Slag
2.3.1. Raw Materials and Manufacture
The American Society of Testing and Materials (ASTM) Designation C125
recognizes blast-furnace slag as “the nonmetallic product consisting essentially of
silicates and alumino-silicates of lime and other bases, which is developed
simultaneously with iron in a blast furnace.”
In nature, iron ore is found in an impure state, oxidized and with a mixture of oxides
of silica, alumina and other metals. The chemical reaction occurs by the burning of
coke with the ore, limestone and/or dolomite in the furnace between the temperatures
of 1300oC and 1600oC. The preheated air blown into furnace and carbon of coke
reacts with oxygen to produce heat and carbon monoxide. Carbon monoxide takes
oxygen from iron oxide to form carbon dioxide, and therefore, iron oxide is reduced
to form metallic iron (Lee, 1974).
The remaining fluxing stone is calcined in the furnace by heat and decomposes to
calcium oxide and magnesium oxide. These oxides combine with the silicon and
alumina from the iron ore to form what is called slag. Another function of fluxing
lime is to react with sulfur which comes from coke and keeps the content of iron at a
very low level (Lee, 1974).
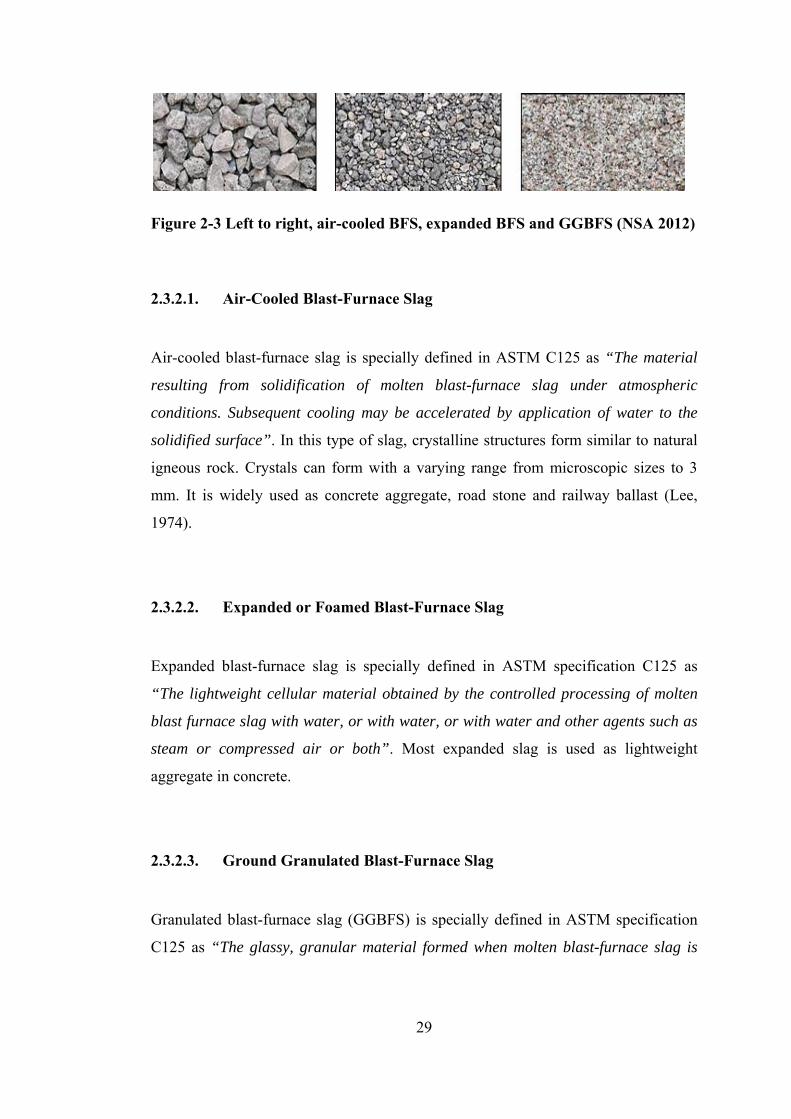
2.3.2. Slag Types
There are three forms of blast-furnace slag (BFS) which are; air-cooled, granulated
and expanded (or foamed) as illustrated in Figure 2-3.
29
Figure 2-3 Left to right, air-cooled BFS, expanded BFS and GGBFS (NSA 2012)
2.3.2.1. Air-Cooled Blast-Furnace Slag
Air-cooled blast-furnace slag is specially defined in ASTM C125 as “The material
resulting from solidification of molten blast-furnace slag under atmospheric
conditions. Subsequent cooling may be accelerated by application of water to the
solidified surface”. In this type of slag, crystalline structures form similar to natural
igneous rock. Crystals can form with a varying range from microscopic sizes to 3
mm. It is widely used as concrete aggregate, road stone and railway ballast (Lee,
1974).
2.3.2.2. Expanded or Foamed Blast-Furnace Slag
Expanded blast-furnace slag is specially defined in ASTM specification C125 as
“The lightweight cellular material obtained by the controlled processing of molten
blast furnace slag with water, or with water, or with water and other agents such as
steam or compressed air or both”. Most expanded slag is used as lightweight
aggregate in concrete.
2.3.2.3. Ground Granulated Blast-Furnace Slag
Granulated blast-furnace slag (GGBFS) is specially defined in ASTM specification
C125 as “The glassy, granular material formed when molten blast-furnace slag is
30
rapidly chilled, as by immersion in water”. Due to the rapid chilling and
solidification of molten slag, it gains more hydraulic (cementitious) property. To
enhance its hydraulic binding property, it is ground to powder and blended with
alkaline activating agent such as alkalis, lime or Portland cement (Lee, 1974).
BFS can be used in three general ways in cement and concrete industry as; a) raw
material for manufacturing Portland cement clinker, b) mineral additive to produce
slag blended cements, c) mineral additive in concrete production.
The first method found for evaluating blast furnace slag by the cement industry is to
use it as a raw material in clinker production. The manufacturing process is similar to
that used conventional raw material; limestone and clay. The slag and limestone are
ground and mixed in the proper ratios and then burned in the rotary kiln. The
resulting clinker is similar to that of prepared with limestone and clay. The color of
the clinker is brownish because of the high magnesia content of slag (ACI 233).
GGBFS itself has hydraulic setting property and can be utilized as a substitute for
Portland cement to produce blended cement. According to ASTM C595, its content
in the slag blended cement can be up to 70 percent (by mass), whereas, EN 197-1
makes limitation of GGBFS in slag-cement blend up to 95 percent by mass (CEM
III/C). GGBFS is the maximum amount of mineral additive that is allowed to use it
in the cement blends according to EN 197-1.
Most of GGBFS blended cement is produced by inter-grinding of slag and clinker
together but also there is toleration for separate grinding. Slag is harder to grind than
clinker and as a result, inter-grinding of GGBFS cement leaves the slag grains
coarser than that of the clinker in cement. Separate grinding of GGBFS cement has
the advantage of grinding GGBFS and clinker on their optimum fineness (ACI 233).
31
2.3.3. Pozzolanic Reaction
ASTM C219 designates a pozzolan as; “A siliceous or siliceous and aluminous
material, which in itself possesses little or no cementitious value, but will, in finely
divided form and in the presence of moisture, chemically react with calcium
hydroxide at ordinary temperatures to form compounds possessing cementitious
properties” The pozolanic reaction is the chemical reaction that occurs between
cement and pozzolans.
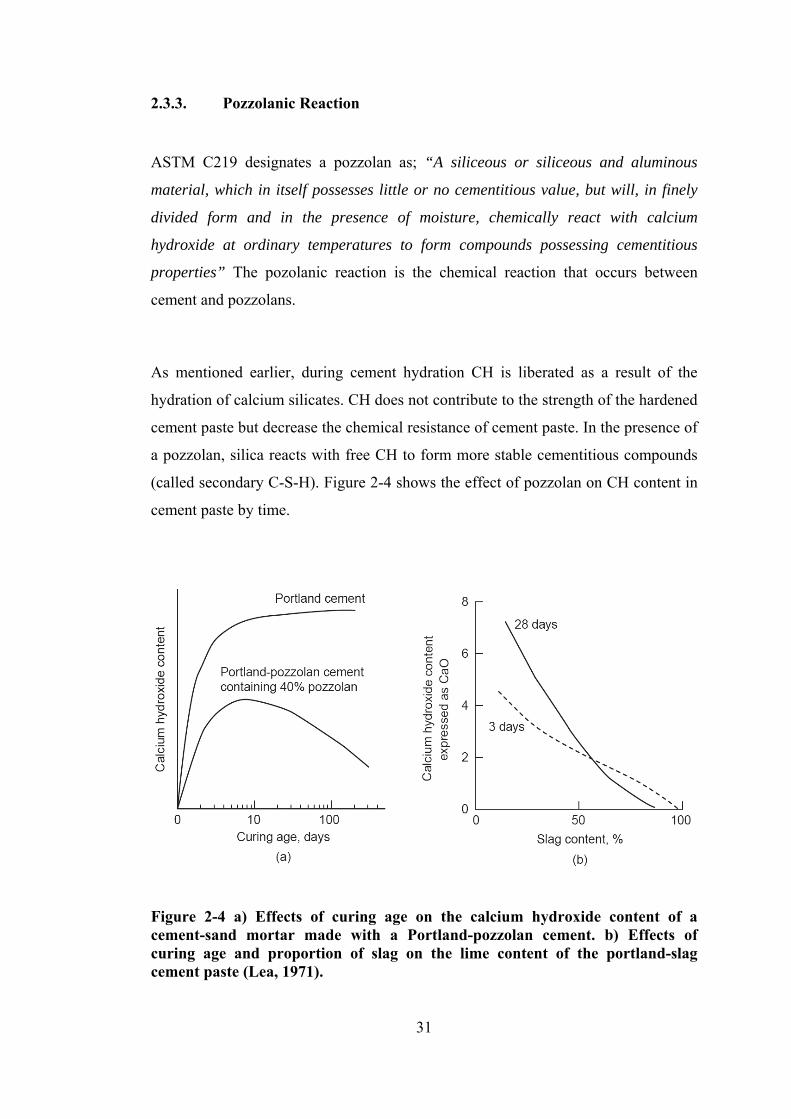
As mentioned earlier, during cement hydration CH is liberated as a result of the
hydration of calcium silicates. CH does not contribute to the strength of the hardened
cement paste but decrease the chemical resistance of cement paste. In the presence of
a pozzolan, silica reacts with free CH to form more stable cementitious compounds
(called secondary C-S-H). Figure 2-4 shows the effect of pozzolan on CH content in
cement paste by time.
Figure 2-4 a) Effects of curing age on the calcium hydroxide content of a cement-sand mortar made with a Portland-pozzolan cement. b) Effects of curing age and proportion of slag on the lime content of the portland-slag cement paste (Lea, 1971).
32
2.3.4. Characteristics of GGBFS
2.3.4.1. Slag Chemistry
There are various broad range of slag types with their chemical composition. Their
chemical composition depends on the ore, coke type and consumption, limestone
flux, burning efficiency and the kind of iron being made. The major constituents of
slag are oxides of lime, silica, alumina and magnesia. The minor constituents are
sulfur, TiO2, alkalis (Na2O and K2O) and, etc. Table 2-6 shows the chemical
composition of blast furnace slag from different countries (Erdoğan, 1997).
Table 2-6 Chemical composition of various BFS types (Erdoğan, 1997)
Compound Turkey U.S. and Canada Australia South Africa CaO 34-41 29-50 39-44 30-40 SiO2 34-36 30-40 33-37 30-36 Al2O3 13-19 7-18 15-18 9-16 Fe2O3 0.3-2.5 0.1-1.5 0-0.7 - MgO 3.5-7 0-19 1-3 8-21 MnO 1-2.5 0.2-1.5 0.1.5 - S 1-2 0-2 0.6-0.8 1-1.6 SO3 - - - -
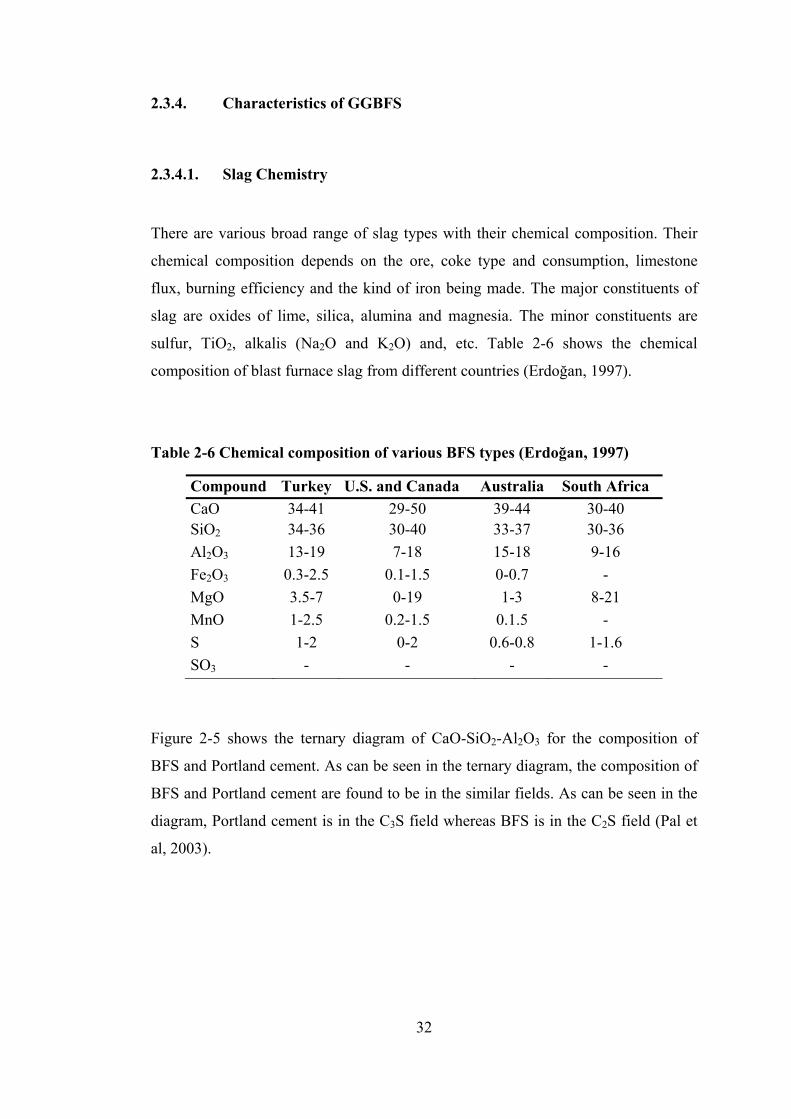
Figure 2-5 shows the ternary diagram of CaO-SiO2-Al2O3 for the composition of
BFS and Portland cement. As can be seen in the ternary diagram, the composition of
BFS and Portland cement are found to be in the similar fields. As can be seen in the
diagram, Portland cement is in the C3S field whereas BFS is in the C2S field (Pal et
al, 2003).
33
Figure 2-5 Ternary diagram of CaO-SiO2-Al2O3 for indicating composition of PC and BFS (Lea, 1971; Bakker, 1983)
2.3.4.2. Crystalline Structure
The crystalline structures inside slag are made up of the compounds of oxides of
calcium and magnesium with silica and alumina. GGBFS has more glassy and
crystalline structure than air cooled slag because of the rapid cooling of molten slag
(Lee, 1974).
According to Lee (1974), the main mineral constituent of the slag is melilite which is
the continuous series of solid phase of akermanite (2CaO·MgO·2SiO2) and gehlenite
(2CaO·Al2O3·2SiO2). In slag if lime to alumina ratio is low anorthite
(CaO·Al2O3·2SiO2) will form, however if lime to alumina ratio is high orthosilicate
also known as belite (C2S) will form. There are four main polymorphs of belite
crystals which are α, ά, β and γ. If rapid cooling is provided β polymorph will occur
which is more desirable for hydraulic reactivity. Magnesium oxide in the slag may
react with the other oxides to form the minerals of merwinite (3CaO·MgO·2SiO2) or
monticellite (CaO·MgO·SiO2). Also some minor components like fortresite
(2MgO·SO4), enstatire (MgO·SO4) or spinel (MgO·Al2O3) may occur (Lee, 1974).
34
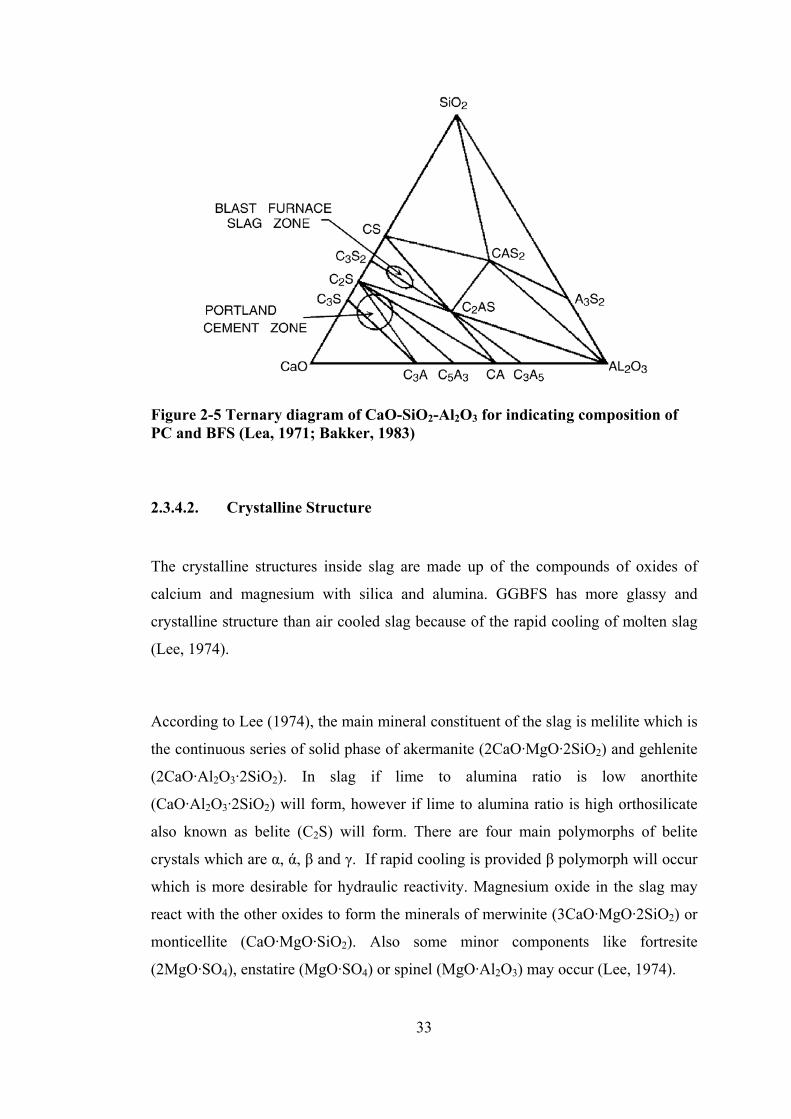
The mineralogical compounds from quaternary system CaO-SiO2-Al2O3-MgO that
can be found after crystallization of blast-furnace slag can be seen in Table 2-7.
Table 2-7 Possible crystalline minerals of BFS (Smolcyzk, 1980; Galibert, 1984)
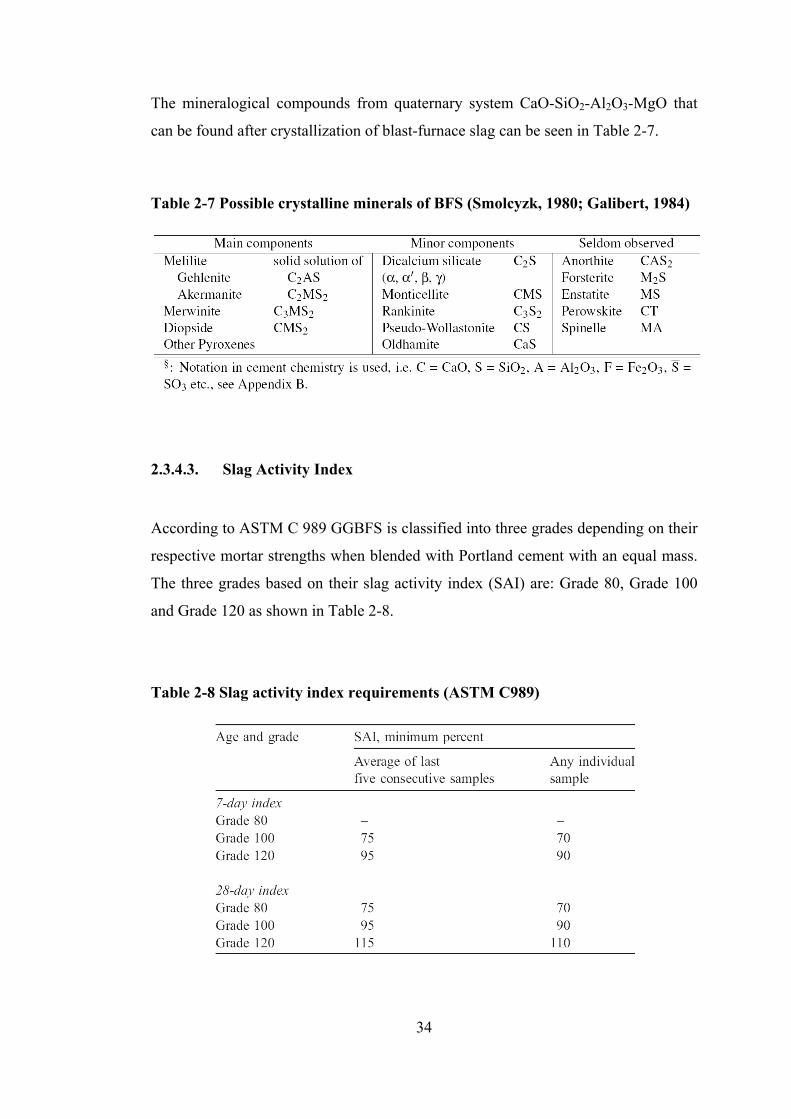
2.3.4.3. Slag Activity Index
According to ASTM C 989 GGBFS is classified into three grades depending on their
respective mortar strengths when blended with Portland cement with an equal mass.
The three grades based on their slag activity index (SAI) are: Grade 80, Grade 100
and Grade 120 as shown in Table 2-8.
Table 2-8 Slag activity index requirements (ASTM C989)
35
2.3.4.4. Hydraulic Reactivity
According to ACI 226, the factors influencing the GGBFS reactivity are: a) chemical
composition of GGBFS; b) alkali concentration of the reacting system; c) glass
content of the GGBFS; d) fineness of the GGBFS; and e) temperature during the
early phases of hydration process. For GGBFS, hydraulic modulus (HM) is used to
make relevance between its chemical composition and potential of hydraulic
reactivity. Many attempts have been made to determine the HM of slag. The simplest
and most widely used module is given in Equation 2.10 (Taylor, 1997):
(CaO + MgO + Al2O3) / SiO2 ≥ 1 (2.10)
HM according to EN 197-1 is;
(CaO + MgO ) / SiO2 ≥ 1 (2.11)
Another more specific module is defined by Cheron and Lardinois (1968)
1.85 ≥ (CaO + 1.4 MgO + 0.56 Al2O3) / SiO2 ≥1.65 (2.12)
Table 2-9 presents the formulas proposed for assesment of hydraulicity of GGBFS.
Generally low values of HM correspond to low hydraulic reactivity but there is not a
certain relation between them. In order to make more accurate relationship, whole
chemical composition of GGBFS must be taken into account including minor
elements. On the other hand, the effect of crystallinity degree on HM of GGBFS
makes it more complicated to evaluate HM (Micheline and Micheline 2004).
36
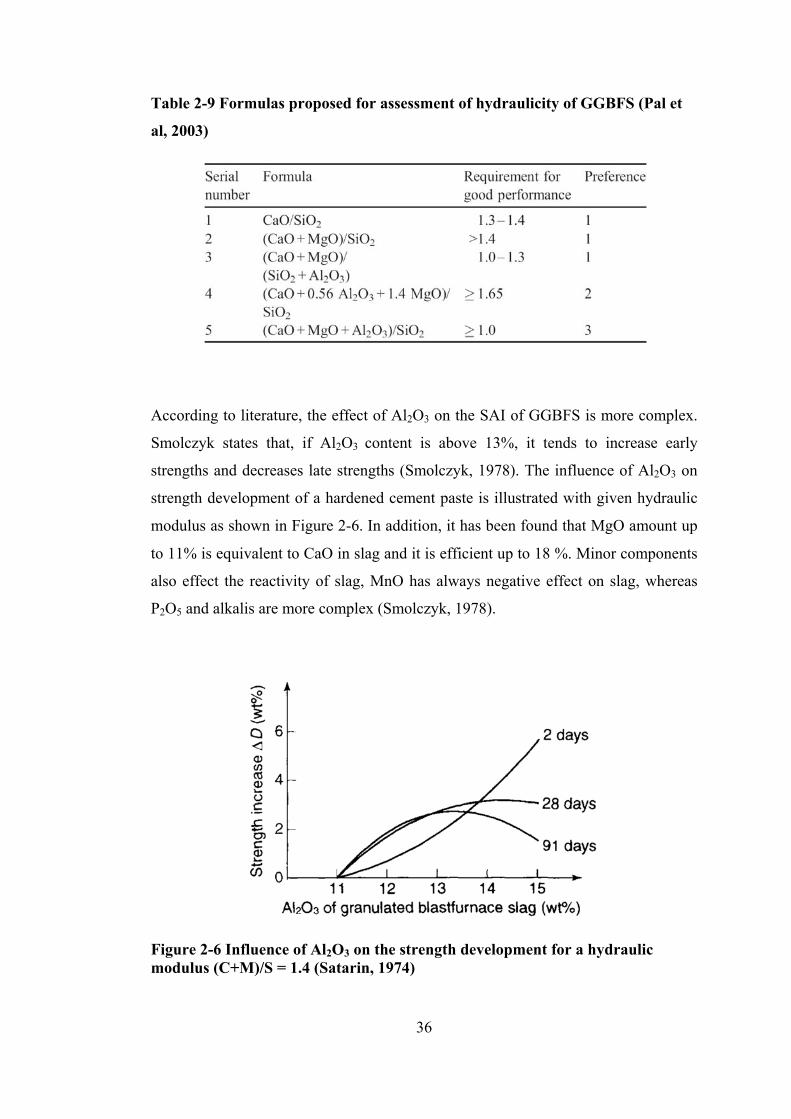
Table 2-9 Formulas proposed for assessment of hydraulicity of GGBFS (Pal et
al, 2003)
According to literature, the effect of Al2O3 on the SAI of GGBFS is more complex.
Smolczyk states that, if Al2O3 content is above 13%, it tends to increase early
strengths and decreases late strengths (Smolczyk, 1978). The influence of Al2O3 on
strength development of a hardened cement paste is illustrated with given hydraulic
modulus as shown in Figure 2-6. In addition, it has been found that MgO amount up
to 11% is equivalent to CaO in slag and it is efficient up to 18 %. Minor components
also effect the reactivity of slag, MnO has always negative effect on slag, whereas
P2O5 and alkalis are more complex (Smolczyk, 1978).
Figure 2-6 Influence of Al2O3 on the strength development for a hydraulic modulus (C+M)/S = 1.4 (Satarin, 1974)
37
2.3.4.5. Physical Properties of Slag
In the molten slag, air bubbles might be trapped inside the slag before it becomes
solid. This is caused due to the pressure in the furnace, and also cooling conditions
and solidification affects the quantity and amount of these bubbles (Lee, 1974).
Therefore, crystal structure, density and porosity of the slag are affected by the
cooling conditions.
The specific gravity of the slag is approximately 2.90 with its bulk density varying in
the range of 1200–1300 kg/m3. The color of GGBFS varies from dark to off-white
but generally off-white color (Pal et al, 2003).
2.3.4.5.1. Fineness
Fineness is generally evaluated by specific surface area and is calculated by Blaine
Air Permeability Method (ASTM C204). Fineness affects the reactivity of slag and
increased fineness improves early strength development of slag (Lumley et al, 1996).
According to Swamy, an increase in the fineness of slag two to three times that of
normal PC contributes in a variety of engineering properties such as bleeding, time
of setting, heat evolution, better strength development and excellent durability
(Swamy, 1998). Therefore, the fineness of GGBFS must be kept higher than that of
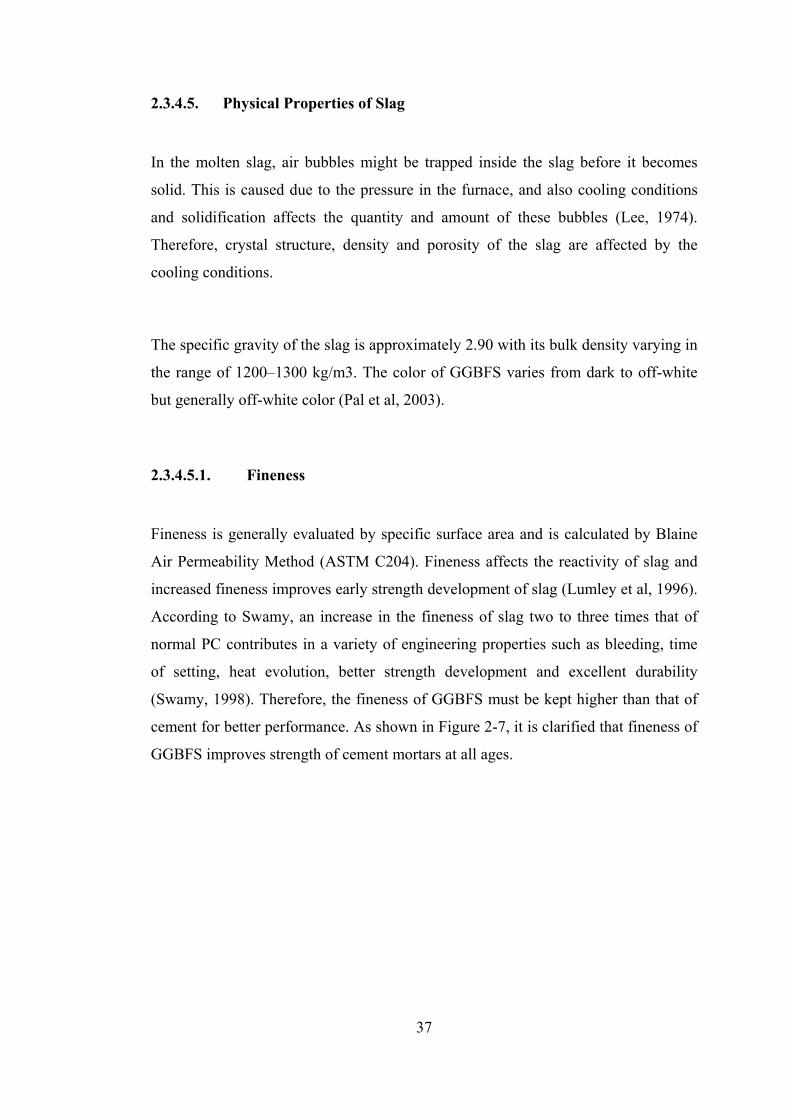
cement for better performance. As shown in Figure 2-7, it is clarified that fineness of
GGBFS improves strength of cement mortars at all ages.
38
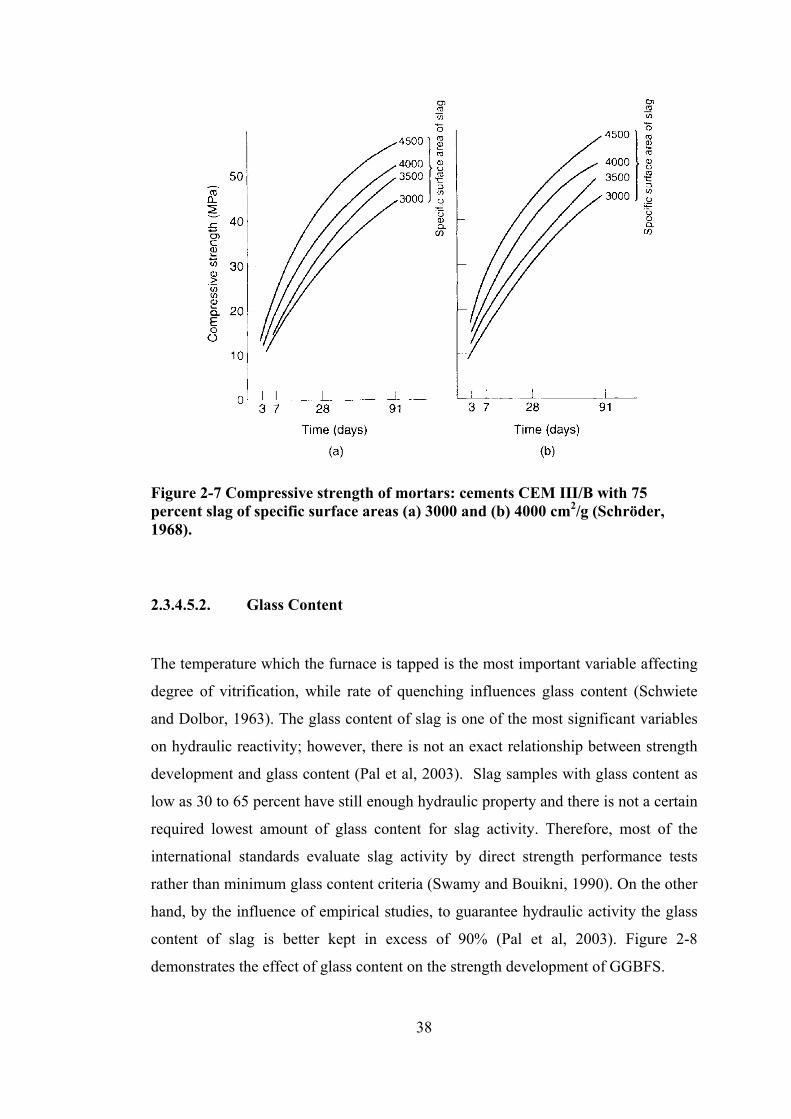
Figure 2-7 Compressive strength of mortars: cements CEM III/B with 75 percent slag of specific surface areas (a) 3000 and (b) 4000 cm2/g (Schröder, 1968).
2.3.4.5.2. Glass Content
The temperature which the furnace is tapped is the most important variable affecting
degree of vitrification, while rate of quenching influences glass content (Schwiete
and Dolbor, 1963). The glass content of slag is one of the most significant variables
on hydraulic reactivity; however, there is not an exact relationship between strength
development and glass content (Pal et al, 2003). Slag samples with glass content as
low as 30 to 65 percent have still enough hydraulic property and there is not a certain
required lowest amount of glass content for slag activity. Therefore, most of the
international standards evaluate slag activity by direct strength performance tests
rather than minimum glass content criteria (Swamy and Bouikni, 1990). On the other
hand, by the influence of empirical studies, to guarantee hydraulic activity the glass
content of slag is better kept in excess of 90% (Pal et al, 2003). Figure 2-8
demonstrates the effect of glass content on the strength development of GGBFS.
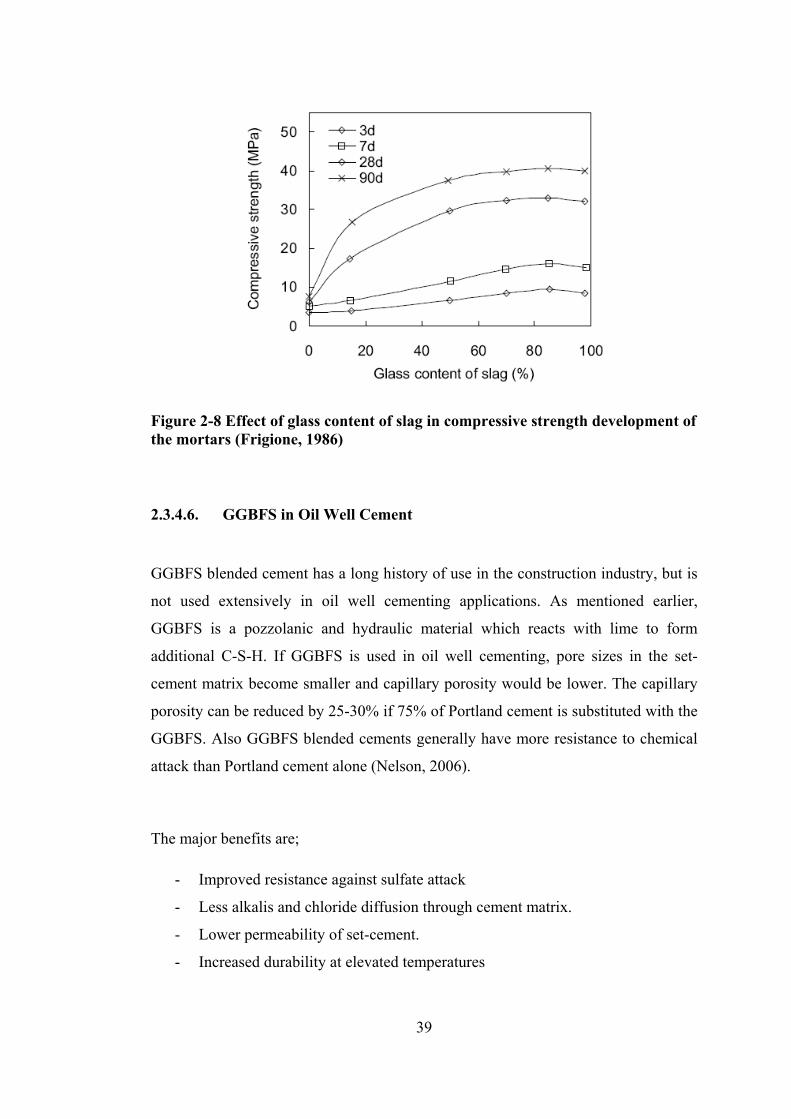
39
Figure 2-8 Effect of glass content of slag in compressive strength development of the mortars (Frigione, 1986)
2.3.4.6. GGBFS in Oil Well Cement
GGBFS blended cement has a long history of use in the construction industry, but is
not used extensively in oil well cementing applications. As mentioned earlier,
GGBFS is a pozzolanic and hydraulic material which reacts with lime to form
additional C-S-H. If GGBFS is used in oil well cementing, pore sizes in the set-
cement matrix become smaller and capillary porosity would be lower. The capillary
porosity can be reduced by 25-30% if 75% of Portland cement is substituted with the
GGBFS. Also GGBFS blended cements generally have more resistance to chemical
attack than Portland cement alone (Nelson, 2006).
The major benefits are;
- Improved resistance against sulfate attack
- Less alkalis and chloride diffusion through cement matrix.
- Lower permeability of set-cement.
- Increased durability at elevated temperatures
40
In addition, GGBFS and GGBFS blended cements are used in the following well
cementing applications (Nelson, 2006).
‐ Squeeze cementing and microfine cements
‐ Salt-saturated cement slurries
‐ CO2 resistant cements
‐ Foamed cement
‐ Improvement of construction grade cements in well cementing
2.3.5. Hydration of Slag Blended Cement
2.3.5.1. Hydration of Slag
As mentioned earlier, in the ternary diagram of CaO-SiO2-Al2O3 GGBFS is in the
C2S field while Portland cement is in the C3S field. (Figure 2-5). Therefore, the
hydration products of GGBFS and GGBFS blended cements are found to be similar
(Smolczyk, 1978).
In the presence of water GGBFS set like Portland cement but it is much slower than
that of Portland cement. Therefore, activators must be used to enhance hydraulic
property of GGBFS. Alkali salts like, sodium hydroxide, sodium carbonate, sodium
silicate, sodium sulfate, calcium sulfate, lime, or even Portland cement (supply of
lime) can be used as an activator (Micheline and Micheline, 2004). In all cases, C-S-
H is formed with incorporation of aluminum, magnesium, iron or sulfate.
2.3.5.2. Hydration of Slag in the Presence of Portland Cement
The hydration of GGBFS blended cement is more complex than that of Portland
cement. In the presence of Portland cement hydration of GGBFS depend on the
dissolution of the glassy slag by the hydroxyl ions released by the hydration of
41
Portland cement and alkali content. GGBFS first reacts with alkalis and then
Ca(OH)2 (from cement hydration) to produce additional C-S-H (ACI 233).
Approximately one mole of slag with an uncertain stoichiometry consumes about 2.6
moles of Ca(OH)2 (Richardson et al, 2002).
In the hydration of slag cement, hydration rims are formed around the slag particles
(Kondo and Oshawa, 1968). C-S-H can accommodate magnesium and aluminum
partially within its micro or nanostructure (Taylor, 1997). Hydrotalcite forms also by
partial accommodation of magnesium and aluminum within the micro or
nanostructure of C-S-H (Harrison et al, 1987) and sulfates possibly uptaken by AFm
phases (Gollop and Taylor, 1996). The stoichiometry of slag blended cement
hydration is approximately defined as follows (Taylor, 1997):
- Magnesium from slag forms hydrotalcite-type phase with an assumption of
Mg/Al ratio 2.5
- SiO2 from slag forms additional C-S-H phase with an assumption of Ca/Si
ratio 1.55 and Al/Ca ratio 0.09
- Remaining Al2O3 found in AFm phase and probably contains the sulfur
released from slag.
- All CaO released from slag is not enough to account for in the C-S-H and
AFm phases and therefore Ca/Si ratio of C-S-H formed lower than that of
Portland cement.
2.3.5.3. Hydration Products
2.3.5.3.1. Calcium-Silicate-Hydrate
The resulting C-S-H formed in the hydration of slag blended cement has lower Ca/Si
ratio than that of Portland cement (Odler, 2000). Moreover, Al/Ca ratio of the C-S-H
increases with the Si/Ca ratio (Richardson et al, 2002). With the contribution of
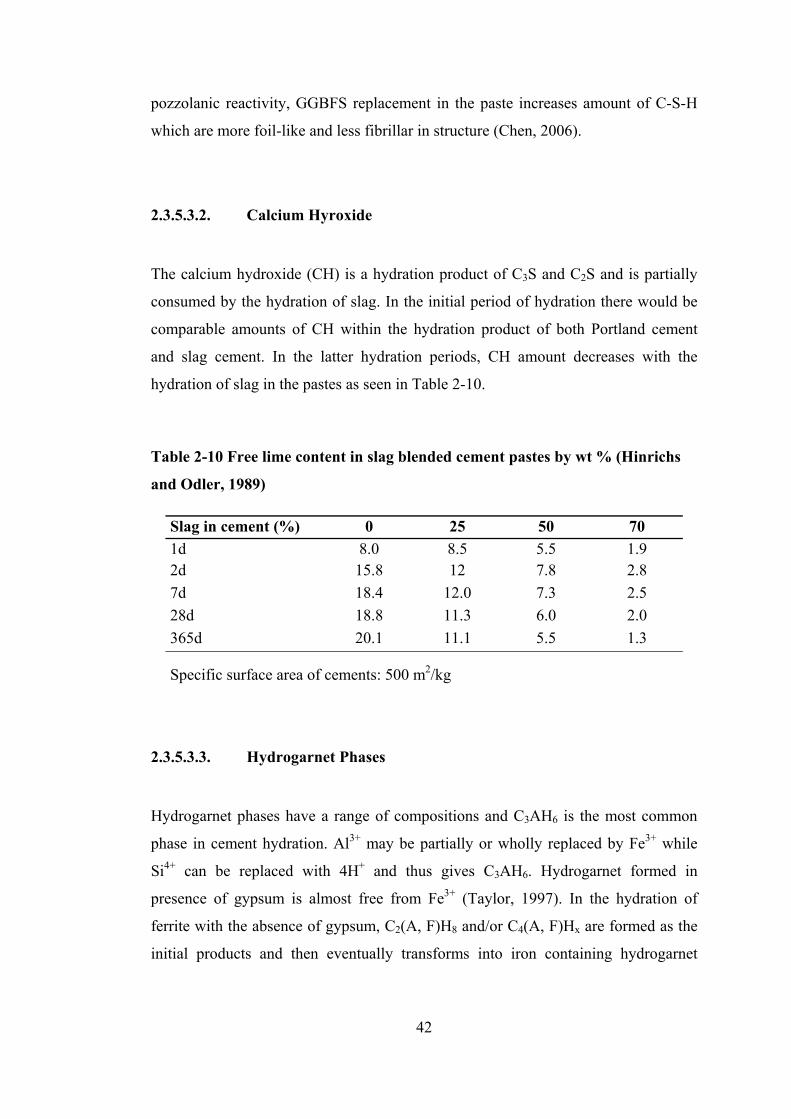
42
pozzolanic reactivity, GGBFS replacement in the paste increases amount of C-S-H
which are more foil-like and less fibrillar in structure (Chen, 2006).
2.3.5.3.2. Calcium Hyroxide
The calcium hydroxide (CH) is a hydration product of C3S and C2S and is partially
consumed by the hydration of slag. In the initial period of hydration there would be
comparable amounts of CH within the hydration product of both Portland cement
and slag cement. In the latter hydration periods, CH amount decreases with the
hydration of slag in the pastes as seen in Table 2-10.
Table 2-10 Free lime content in slag blended cement pastes by wt % (Hinrichs
and Odler, 1989)
Slag in cement (%) 0 25 50 70 1d 8.0 8.5 5.5 1.9 2d 15.8 12 7.8 2.8 7d 18.4 12.0 7.3 2.5 28d 18.8 11.3 6.0 2.0 365d 20.1 11.1 5.5 1.3
Specific surface area of cements: 500 m2/kg
2.3.5.3.3. Hydrogarnet Phases
Hydrogarnet phases have a range of compositions and C3AH6 is the most common
phase in cement hydration. Al3+ may be partially or wholly replaced by Fe3+ while
Si4+ can be replaced with 4H+ and thus gives C3AH6. Hydrogarnet formed in
presence of gypsum is almost free from Fe3+ (Taylor, 1997). In the hydration of
ferrite with the absence of gypsum, C2(A, F)H8 and/or C4(A, F)Hx are formed as the
initial products and then eventually transforms into iron containing hydrogarnet
43
phase, C3(A,F)H6 (Chatterji and Jeffrey, 1962). At elevated temperatures aluminate
and ferrite hydration directly yields hydrogarnet (Negro and Stafferi, 1979). Higher
amounts of aluminum content in the slag enhance hydrogarnet formation in slag
cement hydration. Also, katoite, another hydrogarnet type, is a less documented
hydration product of slag cement (Richardson and Groves, 1992).
2.3.5.3.4. Brucite and Hydrotalcite
The hydration of crystalline MgO (periclase) to magnesium hydroxide (brucite) is a
slow and expansive reaction. Hydrotalcite-type phases are structurally related to
brucite; that some of the Mg2+ ions in brucite are replaced by tripositive ions
(typically Al3+ or Fe3+) and become positively charged. The charge of structure is
balanced by anions and interlayer sites are occupied by H2O molecules. Hydrotalcite
phases occur as minor products on hydration of Portland cements. Hydration
products similar to hydrotalcite phases are commonly formed with hydration of slag
blended cements. Hydrotalcite can also occur as a natural mineral with the
composition of [Mg0.75Al0.25(OH)2] (CO3)0. 125(H2O)0.5 (Taylor, 1997).
2.3.5.4. Microstructure of Slag Blended Cement Pastes
The microstructure of slag blended cement paste is similar to that of Portland cement
except for its denser structure and lower porosity. The porosity of pastes are
comparable at early ages, however decreases with the contribution of slag hydration
at later ages (Siddique and Khan, 2011). The pore sizes in hardened slag cement
paste become finer and also more discontinuous and thin walled (Feldman, 1986).
Therefore, higher contents of GGBFS replacements are reported to enhance the
durability of hardened cement paste (Siddique and Khan, 2011).
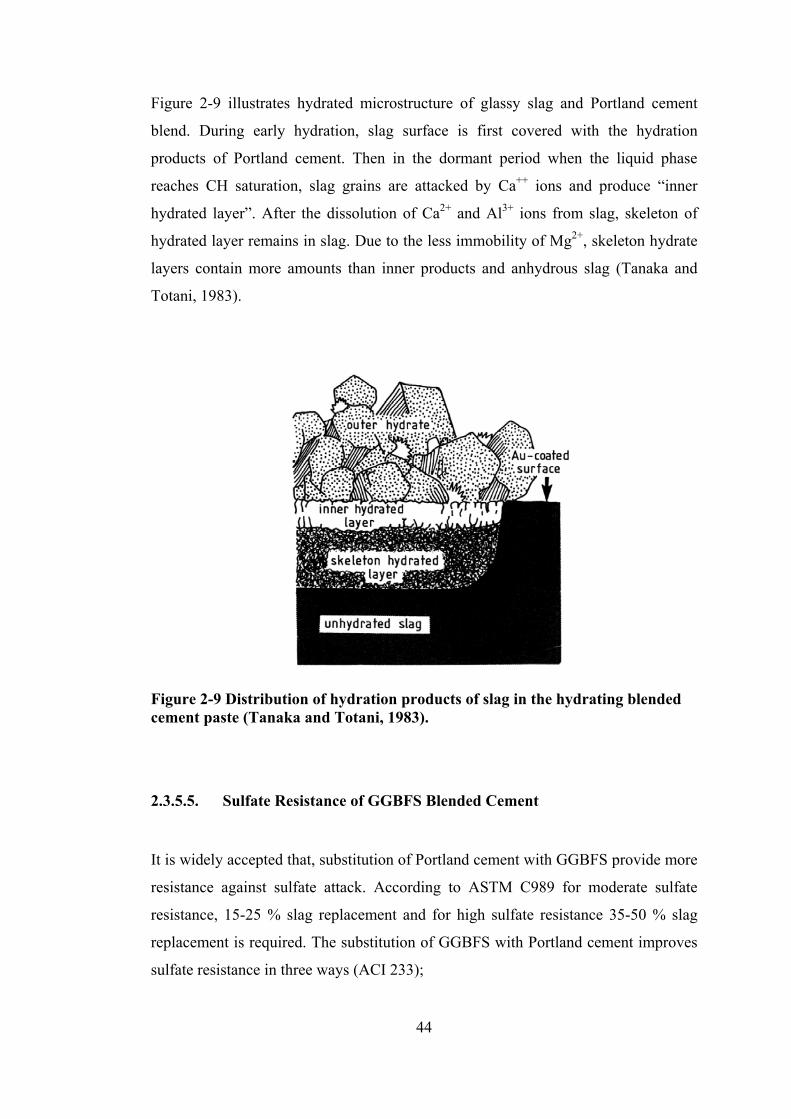
44
Figure 2-9 illustrates hydrated microstructure of glassy slag and Portland cement
blend. During early hydration, slag surface is first covered with the hydration
products of Portland cement. Then in the dormant period when the liquid phase
reaches CH saturation, slag grains are attacked by Ca++ ions and produce “inner
hydrated layer”. After the dissolution of Ca2+ and Al3+ ions from slag, skeleton of
hydrated layer remains in slag. Due to the less immobility of Mg2+, skeleton hydrate
layers contain more amounts than inner products and anhydrous slag (Tanaka and
Totani, 1983).
Figure 2-9 Distribution of hydration products of slag in the hydrating blended cement paste (Tanaka and Totani, 1983).
2.3.5.5. Sulfate Resistance of GGBFS Blended Cement
It is widely accepted that, substitution of Portland cement with GGBFS provide more
resistance against sulfate attack. According to ASTM C989 for moderate sulfate
resistance, 15-25 % slag replacement and for high sulfate resistance 35-50 % slag
replacement is required. The substitution of GGBFS with Portland cement improves
sulfate resistance in three ways (ACI 233);
45
a) GGBFS does not contain C3A and therefore reduces overall proportion of
C3A amount in cement blend.
b) GGBFS reacts with Ca(OH)2 to form additional C-S-H, thus there is a
reduction in the available Ca(OH)2 to form of calcium sulfoaluminate.
c) GGBFS reduces permeability in cement paste which is dependent on sulfate
resistance.
Sulfate resistance depends on not only C3A amount of cement, but also the Al2O3
amount of the GGBFS. If slag with high-alumina (17.7%) content is used in the
blends between the GGBFS amount of 20-50 percent, sulfate resistance decreases.
On the other hand, if GGBFS with low-alumina (11%) content is used, sulfate
resistance increases independently from the C3A amount of cement (Locher, 1966).
The hydration products of alumina in the slag are not clear enough, but C-S-H takes
some of the alumina where it is less open to sulfate attack.
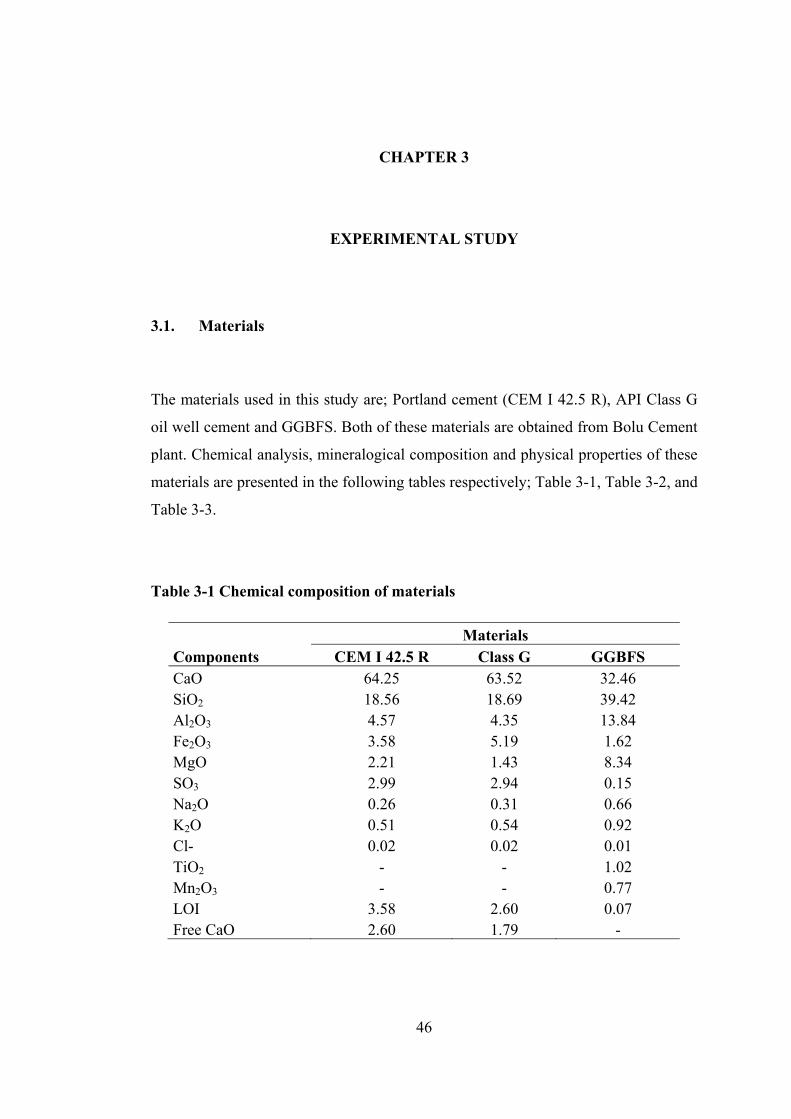
46
3. CHAPTER 3
CHAPTER 3
EXPERIMENTAL STUDY
3.1. Materials
The materials used in this study are; Portland cement (CEM I 42.5 R), API Class G
oil well cement and GGBFS. Both of these materials are obtained from Bolu Cement
plant. Chemical analysis, mineralogical composition and physical properties of these
materials are presented in the following tables respectively; Table 3-1, Table 3-2, and
Table 3-3.
Table 3-1 Chemical composition of materials
Materials Components CEM I 42.5 R Class G GGBFS CaO 64.25 63.52 32.46 SiO2 18.56 18.69 39.42 Al2O3 4.57 4.35 13.84 Fe2O3 3.58 5.19 1.62 MgO 2.21 1.43 8.34 SO3 2.99 2.94 0.15 Na2O 0.26 0.31 0.66 K2O 0.51 0.54 0.92 Cl- 0.02 0.02 0.01 TiO2 - - 1.02 Mn2O3 - - 0.77 LOI 3.58 2.60 0.07 Free CaO 2.60 1.79 -
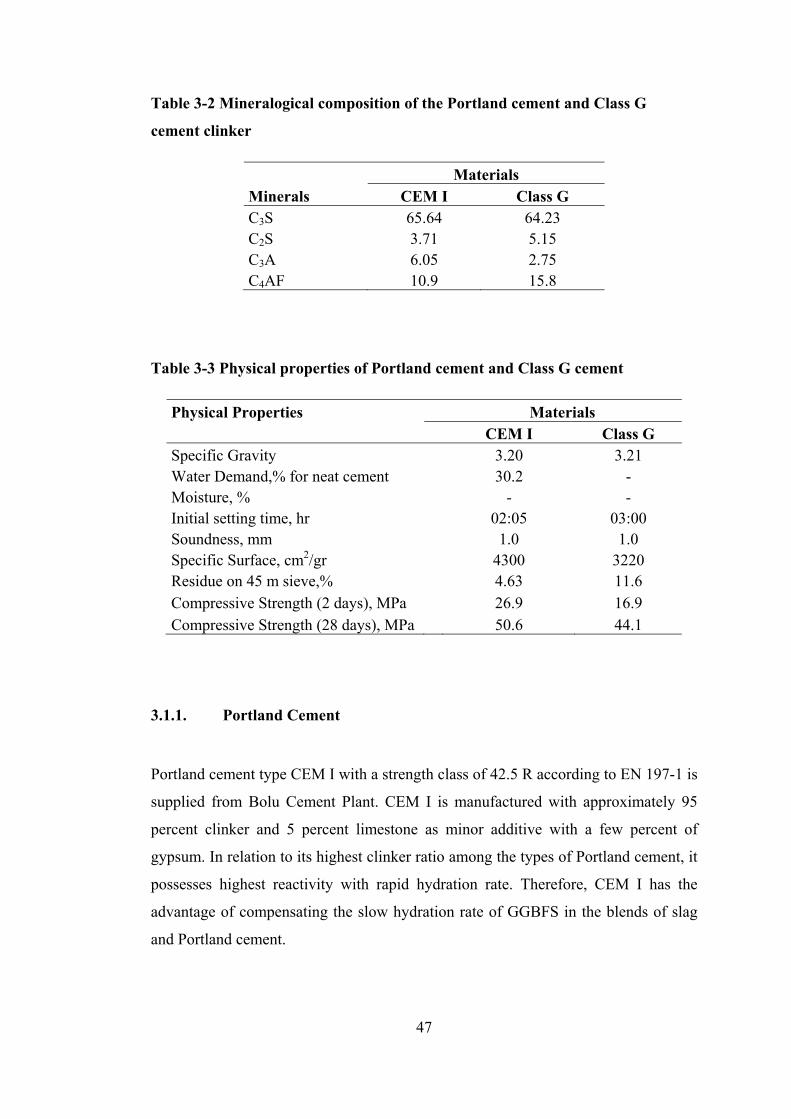
47
Table 3-2 Mineralogical composition of the Portland cement and Class G
cement clinker
Materials Minerals CEM I Class G C3S 65.64 64.23 C2S 3.71 5.15 C3A 6.05 2.75 C4AF 10.9 15.8
Table 3-3 Physical properties of Portland cement and Class G cement
Physical Properties Materials CEM I Class G
Specific Gravity 3.20 3.21 Water Demand,% for neat cement 30.2 - Moisture, % - - Initial setting time, hr 02:05 03:00 Soundness, mm 1.0 1.0 Specific Surface, cm2/gr 4300 3220 Residue on 45 m sieve,% 4.63 11.6 Compressive Strength (2 days), MPa 26.9 16.9 Compressive Strength (28 days), MPa 50.6 44.1
3.1.1. Portland Cement
Portland cement type CEM I with a strength class of 42.5 R according to EN 197-1 is
supplied from Bolu Cement Plant. CEM I is manufactured with approximately 95
percent clinker and 5 percent limestone as minor additive with a few percent of
gypsum. In relation to its highest clinker ratio among the types of Portland cement, it
possesses highest reactivity with rapid hydration rate. Therefore, CEM I has the
advantage of compensating the slow hydration rate of GGBFS in the blends of slag
and Portland cement.
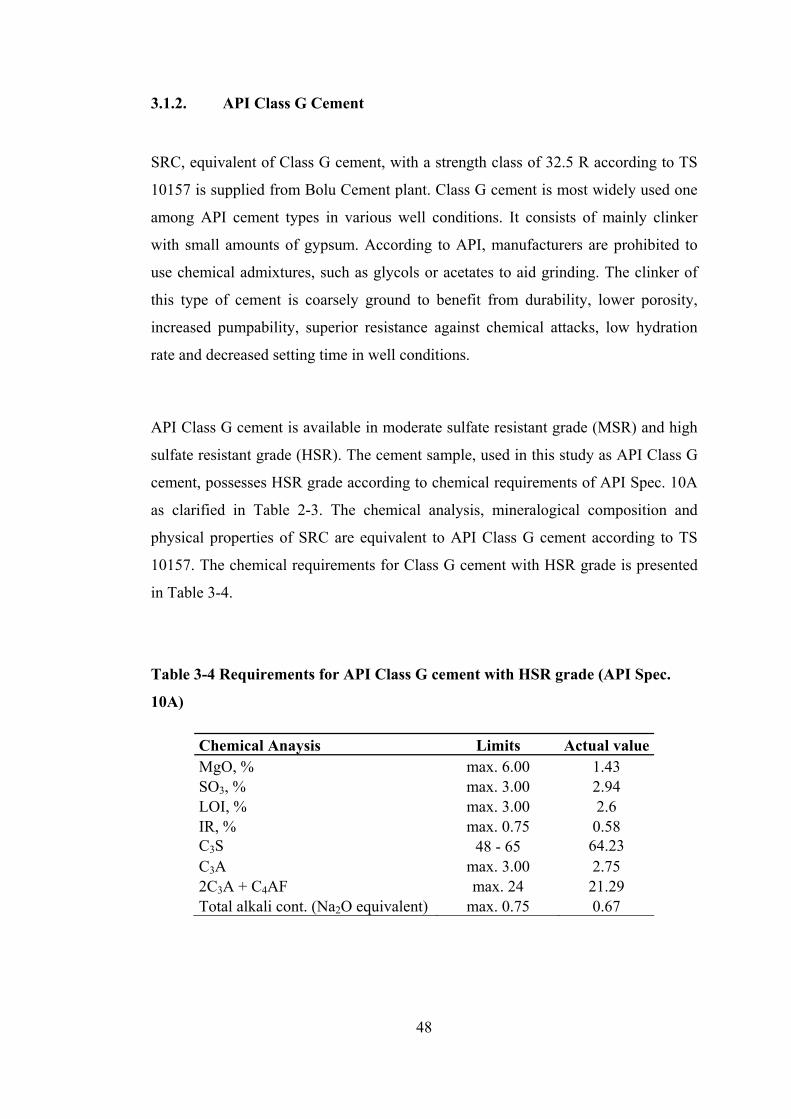
48
3.1.2. API Class G Cement
SRC, equivalent of Class G cement, with a strength class of 32.5 R according to TS
10157 is supplied from Bolu Cement plant. Class G cement is most widely used one
among API cement types in various well conditions. It consists of mainly clinker
with small amounts of gypsum. According to API, manufacturers are prohibited to
use chemical admixtures, such as glycols or acetates to aid grinding. The clinker of
this type of cement is coarsely ground to benefit from durability, lower porosity,
increased pumpability, superior resistance against chemical attacks, low hydration
rate and decreased setting time in well conditions.
API Class G cement is available in moderate sulfate resistant grade (MSR) and high
sulfate resistant grade (HSR). The cement sample, used in this study as API Class G
cement, possesses HSR grade according to chemical requirements of API Spec. 10A
as clarified in Table 2-3. The chemical analysis, mineralogical composition and
physical properties of SRC are equivalent to API Class G cement according to TS
10157. The chemical requirements for Class G cement with HSR grade is presented
in Table 3-4.
Table 3-4 Requirements for API Class G cement with HSR grade (API Spec.
10A)
Chemical Anaysis Limits Actual value MgO, % max. 6.00 1.43 SO3, % max. 3.00 2.94 LOI, % max. 3.00 2.6 IR, % max. 0.75 0.58 C3S 48 - 65 64.23 C3A max. 3.00 2.75 2C3A + C4AF max. 24 21.29 Total alkali cont. (Na2O equivalent) max. 0.75 0.67
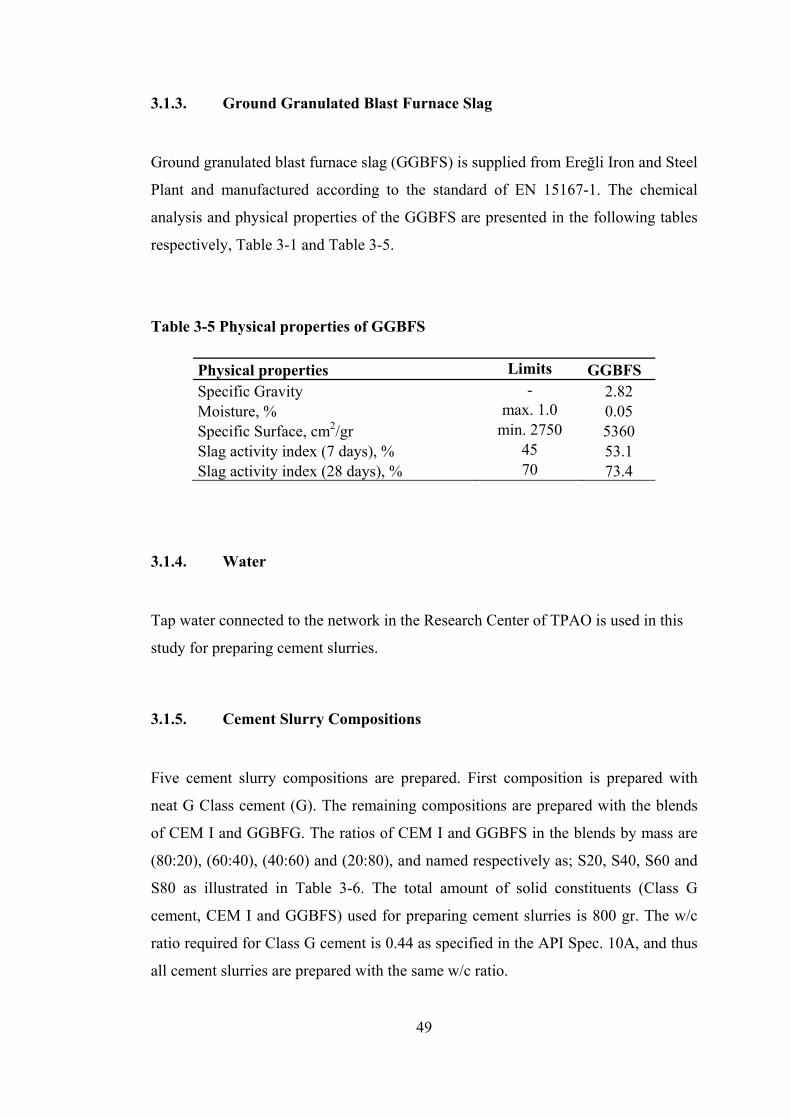
49
3.1.3. Ground Granulated Blast Furnace Slag
Ground granulated blast furnace slag (GGBFS) is supplied from Ereğli Iron and Steel
Plant and manufactured according to the standard of EN 15167-1. The chemical
analysis and physical properties of the GGBFS are presented in the following tables
respectively, Table 3-1 and Table 3-5.
Table 3-5 Physical properties of GGBFS
Physical properties Limits GGBFS Specific Gravity - 2.82 Moisture, % max. 1.0 0.05 Specific Surface, cm2/gr min. 2750 5360 Slag activity index (7 days), % 45 53.1 Slag activity index (28 days), % 70 73.4
3.1.4. Water
Tap water connected to the network in the Research Center of TPAO is used in this
study for preparing cement slurries.
3.1.5. Cement Slurry Compositions
Five cement slurry compositions are prepared. First composition is prepared with
neat G Class cement (G). The remaining compositions are prepared with the blends
of CEM I and GGBFG. The ratios of CEM I and GGBFS in the blends by mass are
(80:20), (60:40), (40:60) and (20:80), and named respectively as; S20, S40, S60 and
S80 as illustrated in Table 3-6. The total amount of solid constituents (Class G
cement, CEM I and GGBFS) used for preparing cement slurries is 800 gr. The w/c
ratio required for Class G cement is 0.44 as specified in the API Spec. 10A, and thus
all cement slurries are prepared with the same w/c ratio.
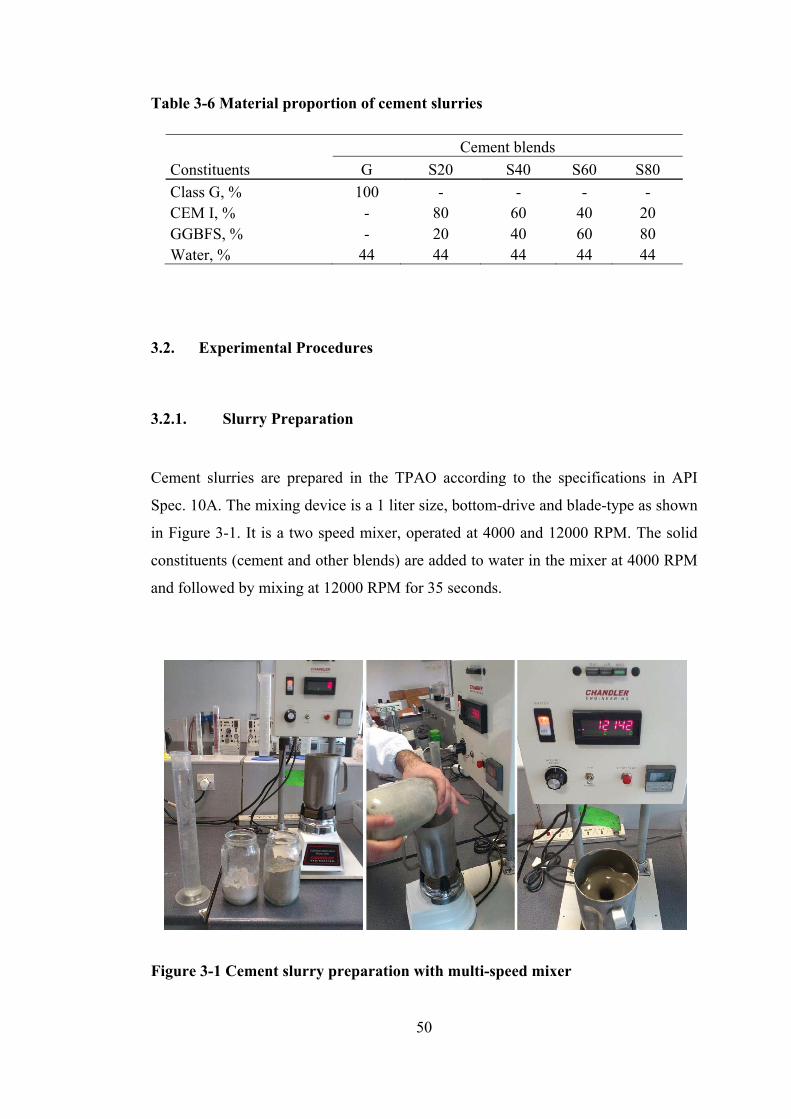
50
Table 3-6 Material proportion of cement slurries
Cement blends Constituents G S20 S40 S60 S80 Class G, % 100 - - - - CEM I, % - 80 60 40 20 GGBFS, % - 20 40 60 80 Water, % 44 44 44 44 44
3.2. Experimental Procedures
3.2.1. Slurry Preparation
Cement slurries are prepared in the TPAO according to the specifications in API
Spec. 10A. The mixing device is a 1 liter size, bottom-drive and blade-type as shown
in Figure 3-1. It is a two speed mixer, operated at 4000 and 12000 RPM. The solid
constituents (cement and other blends) are added to water in the mixer at 4000 RPM
and followed by mixing at 12000 RPM for 35 seconds.
Figure 3-1 Cement slurry preparation with multi-speed mixer
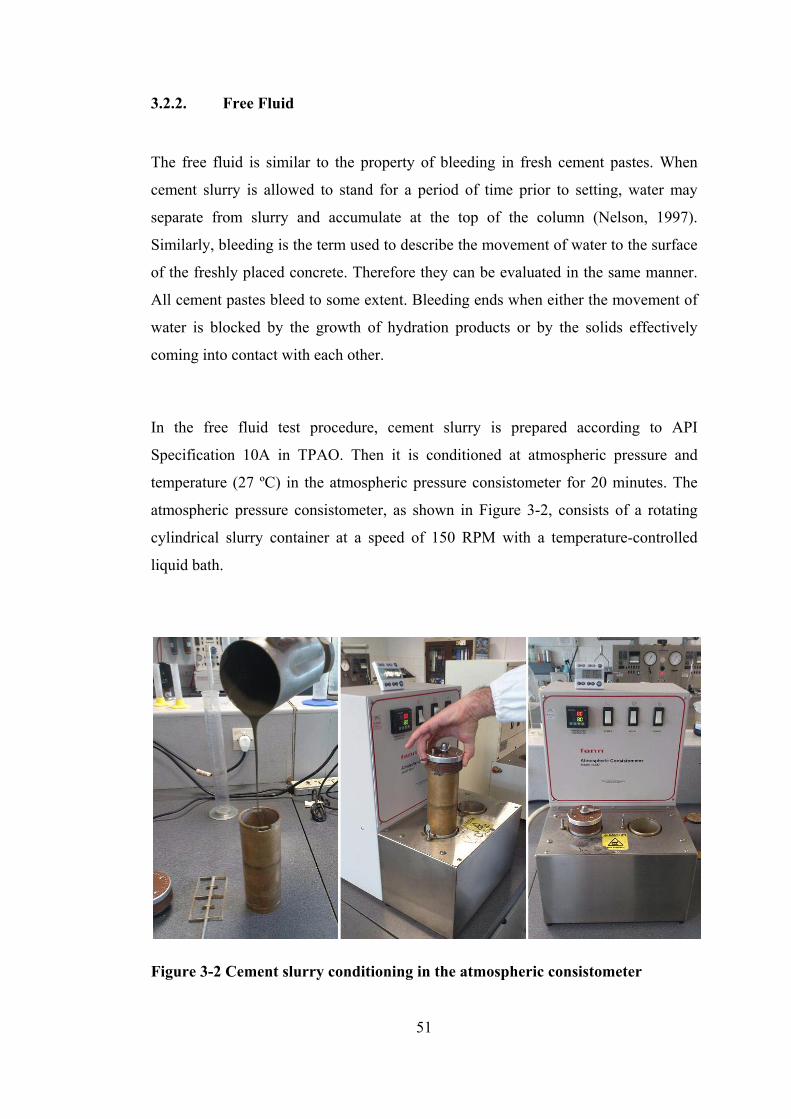
51
3.2.2. Free Fluid
The free fluid is similar to the property of bleeding in fresh cement pastes. When
cement slurry is allowed to stand for a period of time prior to setting, water may
separate from slurry and accumulate at the top of the column (Nelson, 1997).
Similarly, bleeding is the term used to describe the movement of water to the surface
of the freshly placed concrete. Therefore they can be evaluated in the same manner.
All cement pastes bleed to some extent. Bleeding ends when either the movement of
water is blocked by the growth of hydration products or by the solids effectively
coming into contact with each other.
In the free fluid test procedure, cement slurry is prepared according to API
Specification 10A in TPAO. Then it is conditioned at atmospheric pressure and
temperature (27 ºC) in the atmospheric pressure consistometer for 20 minutes. The
atmospheric pressure consistometer, as shown in Figure 3-2, consists of a rotating
cylindrical slurry container at a speed of 150 RPM with a temperature-controlled
liquid bath.
Figure 3-2 Cement slurry conditioning in the atmospheric consistometer
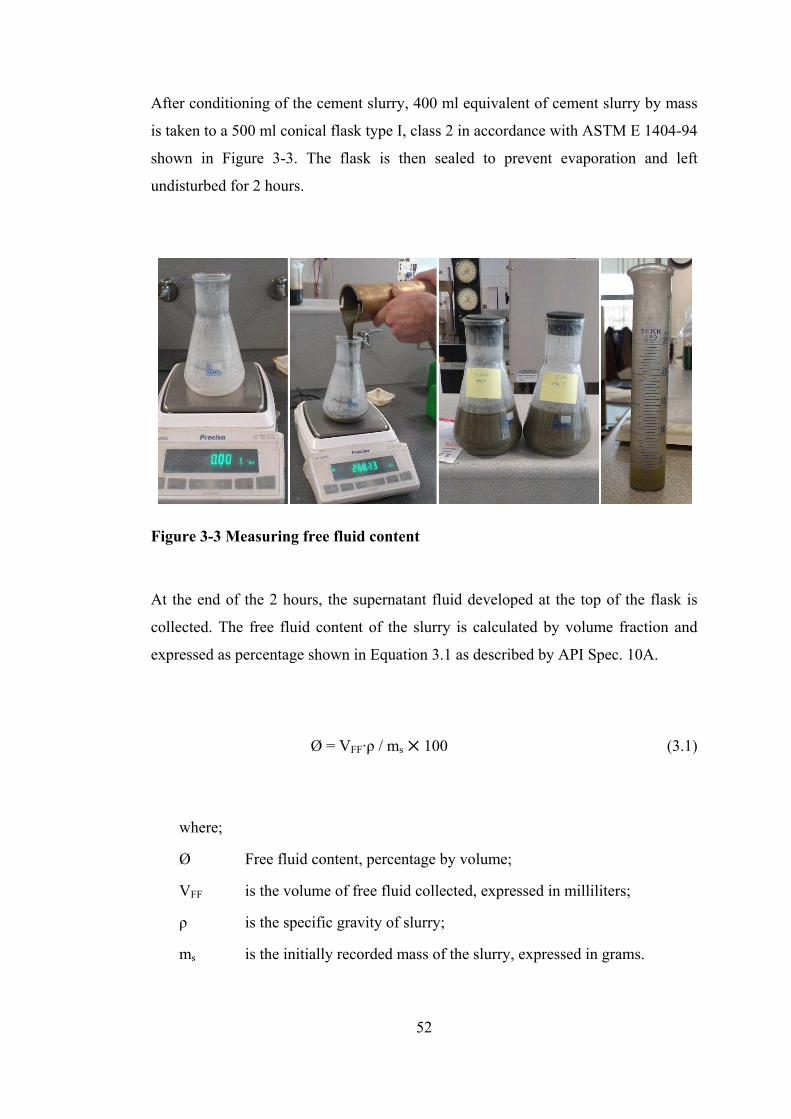
52
After conditioning of the cement slurry, 400 ml equivalent of cement slurry by mass
is taken to a 500 ml conical flask type I, class 2 in accordance with ASTM E 1404-94
shown in Figure 3-3. The flask is then sealed to prevent evaporation and left
undisturbed for 2 hours.
Figure 3-3 Measuring free fluid content
At the end of the 2 hours, the supernatant fluid developed at the top of the flask is
collected. The free fluid content of the slurry is calculated by volume fraction and
expressed as percentage shown in Equation 3.1 as described by API Spec. 10A.
Ø = VFF·ρ / ms 100 (3.1)
where;
Ø Free fluid content, percentage by volume;
VFF is the volume of free fluid collected, expressed in milliliters;
ρ is the specific gravity of slurry;
ms is the initially recorded mass of the slurry, expressed in grams.
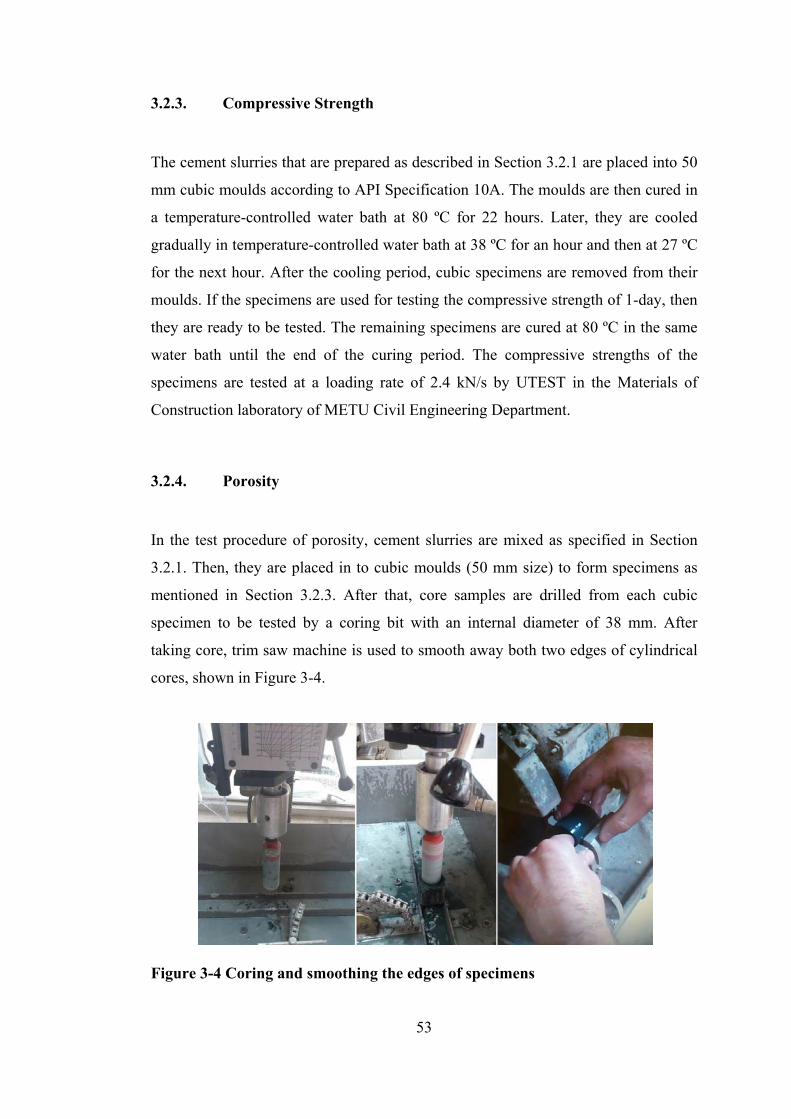
53
3.2.3. Compressive Strength
The cement slurries that are prepared as described in Section 3.2.1 are placed into 50
mm cubic moulds according to API Specification 10A. The moulds are then cured in
a temperature-controlled water bath at 80 ºC for 22 hours. Later, they are cooled
gradually in temperature-controlled water bath at 38 ºC for an hour and then at 27 ºC
for the next hour. After the cooling period, cubic specimens are removed from their
moulds. If the specimens are used for testing the compressive strength of 1-day, then
they are ready to be tested. The remaining specimens are cured at 80 ºC in the same
water bath until the end of the curing period. The compressive strengths of the
specimens are tested at a loading rate of 2.4 kN/s by UTEST in the Materials of
Construction laboratory of METU Civil Engineering Department.
3.2.4. Porosity
In the test procedure of porosity, cement slurries are mixed as specified in Section
3.2.1. Then, they are placed in to cubic moulds (50 mm size) to form specimens as
mentioned in Section 3.2.3. After that, core samples are drilled from each cubic
specimen to be tested by a coring bit with an internal diameter of 38 mm. After
taking core, trim saw machine is used to smooth away both two edges of cylindrical
cores, shown in Figure 3-4.
Figure 3-4 Coring and smoothing the edges of specimens
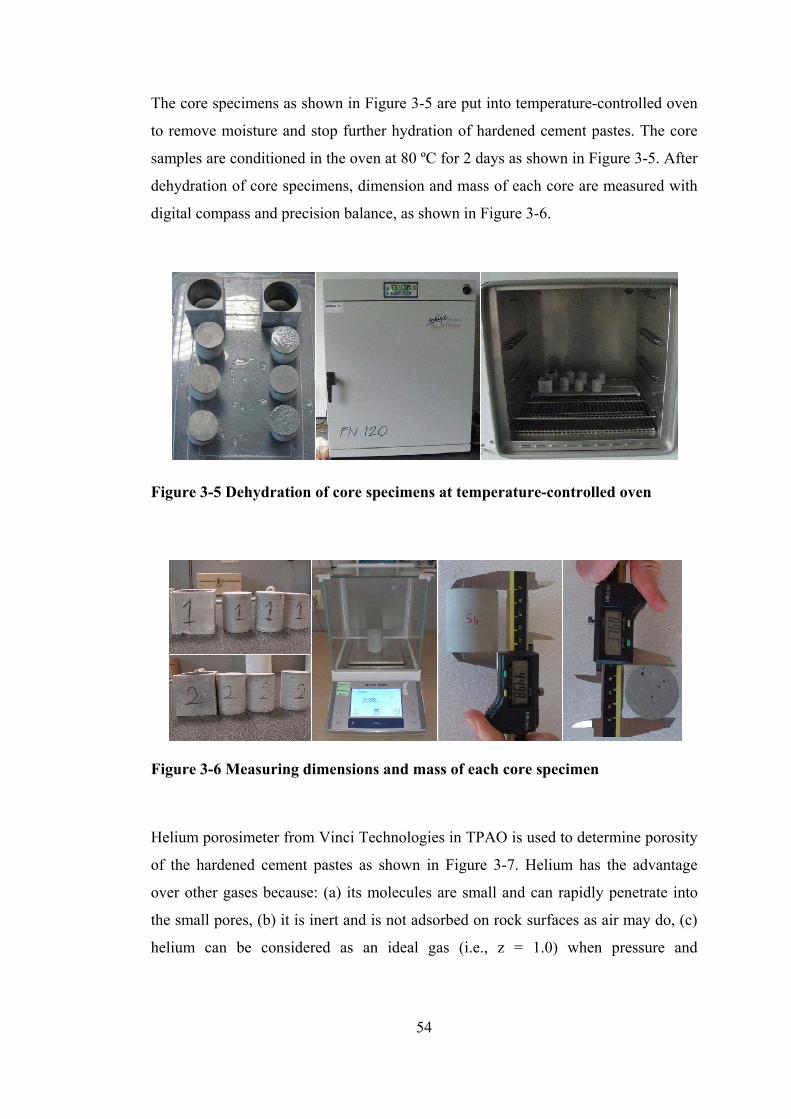
54
The core specimens as shown in Figure 3-5 are put into temperature-controlled oven
to remove moisture and stop further hydration of hardened cement pastes. The core
samples are conditioned in the oven at 80 ºC for 2 days as shown in Figure 3-5. After
dehydration of core specimens, dimension and mass of each core are measured with
digital compass and precision balance, as shown in Figure 3-6.
Figure 3-5 Dehydration of core specimens at temperature-controlled oven
Figure 3-6 Measuring dimensions and mass of each core specimen
Helium porosimeter from Vinci Technologies in TPAO is used to determine porosity
of the hardened cement pastes as shown in Figure 3-7. Helium has the advantage
over other gases because: (a) its molecules are small and can rapidly penetrate into
the small pores, (b) it is inert and is not adsorbed on rock surfaces as air may do, (c)
helium can be considered as an ideal gas (i.e., z = 1.0) when pressure and
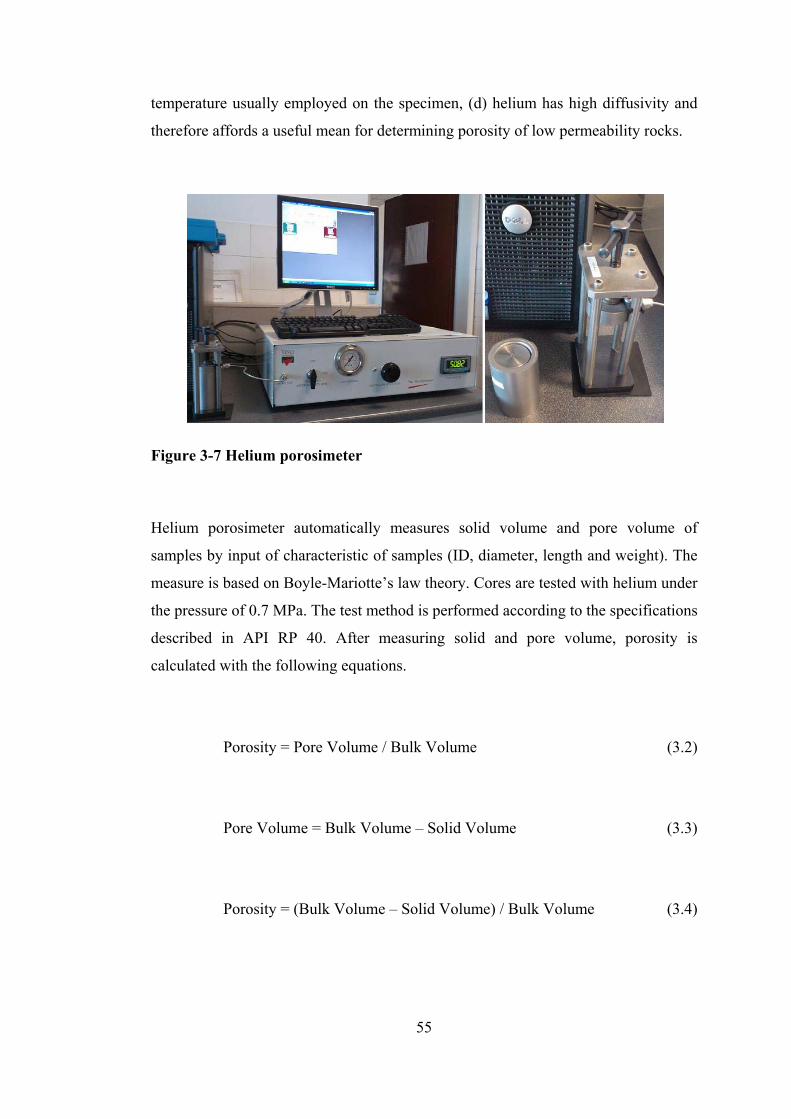
55
temperature usually employed on the specimen, (d) helium has high diffusivity and
therefore affords a useful mean for determining porosity of low permeability rocks.
Figure 3-7 Helium porosimeter
Helium porosimeter automatically measures solid volume and pore volume of
samples by input of characteristic of samples (ID, diameter, length and weight). The
measure is based on Boyle-Mariotte’s law theory. Cores are tested with helium under
the pressure of 0.7 MPa. The test method is performed according to the specifications
described in API RP 40. After measuring solid and pore volume, porosity is
calculated with the following equations.
Porosity = Pore Volume / Bulk Volume (3.2)
Pore Volume = Bulk Volume – Solid Volume (3.3)
Porosity = (Bulk Volume – Solid Volume) / Bulk Volume (3.4)
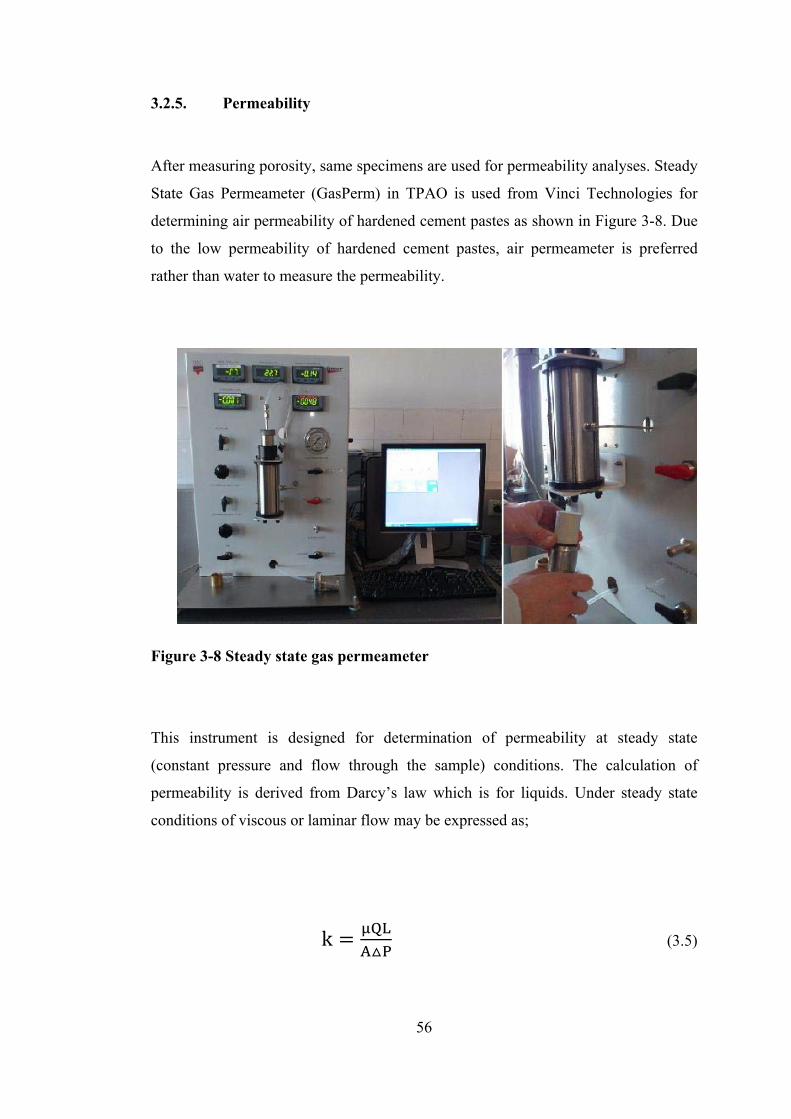
56
3.2.5. Permeability
After measuring porosity, same specimens are used for permeability analyses. Steady
State Gas Permeameter (GasPerm) in TPAO is used from Vinci Technologies for
determining air permeability of hardened cement pastes as shown in Figure 3-8. Due
to the low permeability of hardened cement pastes, air permeameter is preferred
rather than water to measure the permeability.
Figure 3-8 Steady state gas permeameter
This instrument is designed for determination of permeability at steady state
(constant pressure and flow through the sample) conditions. The calculation of
permeability is derived from Darcy’s law which is for liquids. Under steady state
conditions of viscous or laminar flow may be expressed as;
k QLP
(3.5)
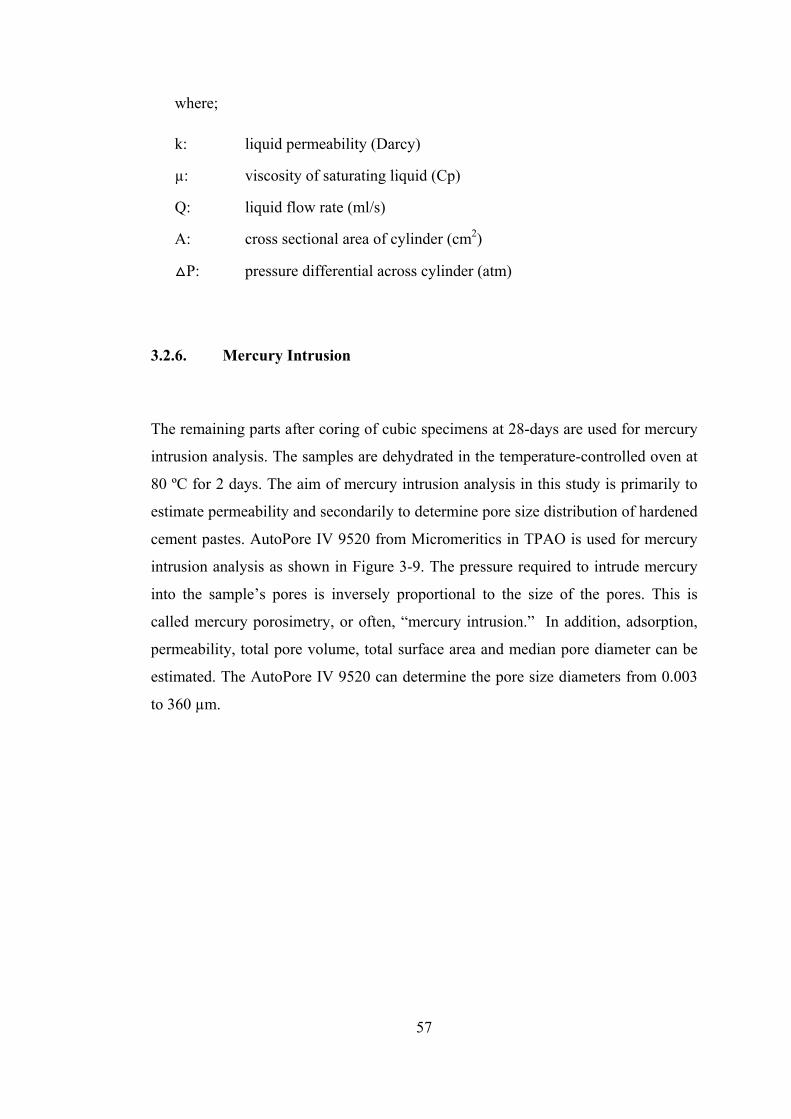
57
where;
k: liquid permeability (Darcy)
µ: viscosity of saturating liquid (Cp)
Q: liquid flow rate (ml/s)
A: cross sectional area of cylinder (cm2)
P: pressure differential across cylinder (atm)
3.2.6. Mercury Intrusion
The remaining parts after coring of cubic specimens at 28-days are used for mercury
intrusion analysis. The samples are dehydrated in the temperature-controlled oven at
80 ºC for 2 days. The aim of mercury intrusion analysis in this study is primarily to
estimate permeability and secondarily to determine pore size distribution of hardened
cement pastes. AutoPore IV 9520 from Micromeritics in TPAO is used for mercury
intrusion analysis as shown in Figure 3-9. The pressure required to intrude mercury
into the sample’s pores is inversely proportional to the size of the pores. This is
called mercury porosimetry, or often, “mercury intrusion.” In addition, adsorption,
permeability, total pore volume, total surface area and median pore diameter can be
estimated. The AutoPore IV 9520 can determine the pore size diameters from 0.003
to 360 µm.
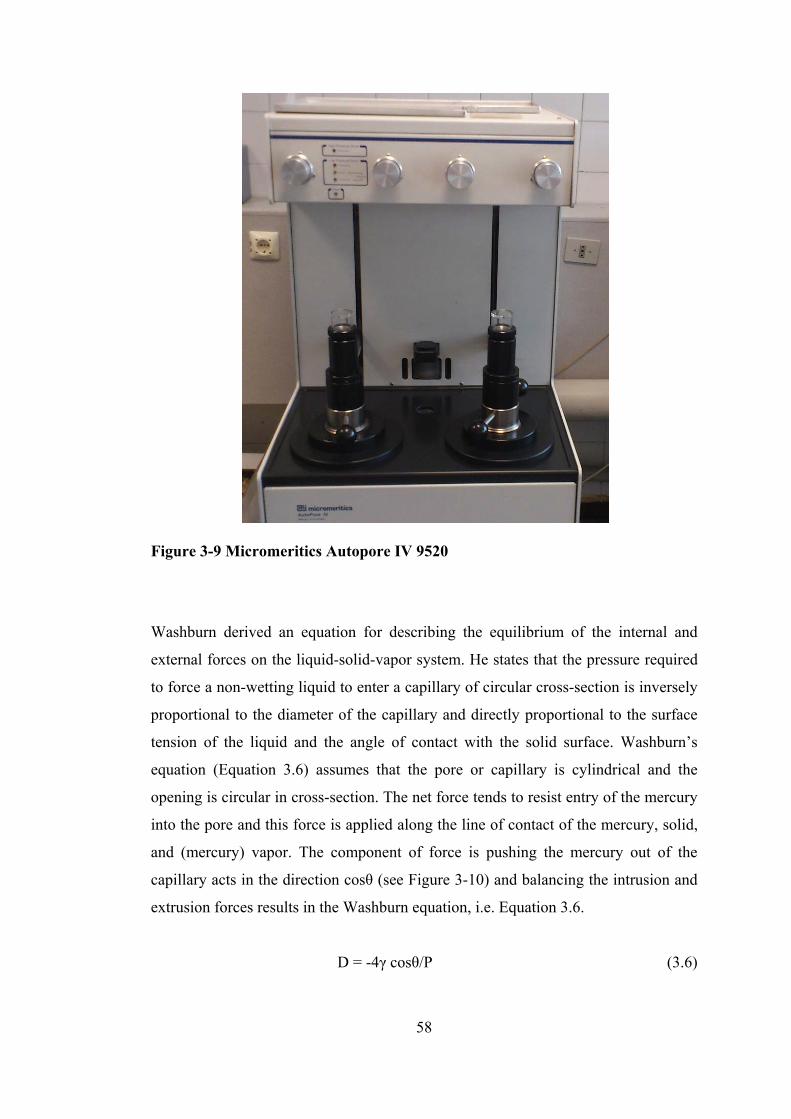
58
Figure 3-9 Micromeritics Autopore IV 9520
Washburn derived an equation for describing the equilibrium of the internal and
external forces on the liquid-solid-vapor system. He states that the pressure required
to force a non-wetting liquid to enter a capillary of circular cross-section is inversely
proportional to the diameter of the capillary and directly proportional to the surface
tension of the liquid and the angle of contact with the solid surface. Washburn’s
equation (Equation 3.6) assumes that the pore or capillary is cylindrical and the
opening is circular in cross-section. The net force tends to resist entry of the mercury
into the pore and this force is applied along the line of contact of the mercury, solid,
and (mercury) vapor. The component of force is pushing the mercury out of the
capillary acts in the direction cosθ (see Figure 3-10) and balancing the intrusion and
extrusion forces results in the Washburn equation, i.e. Equation 3.6.
D = -4γ cosθ/P (3.6)
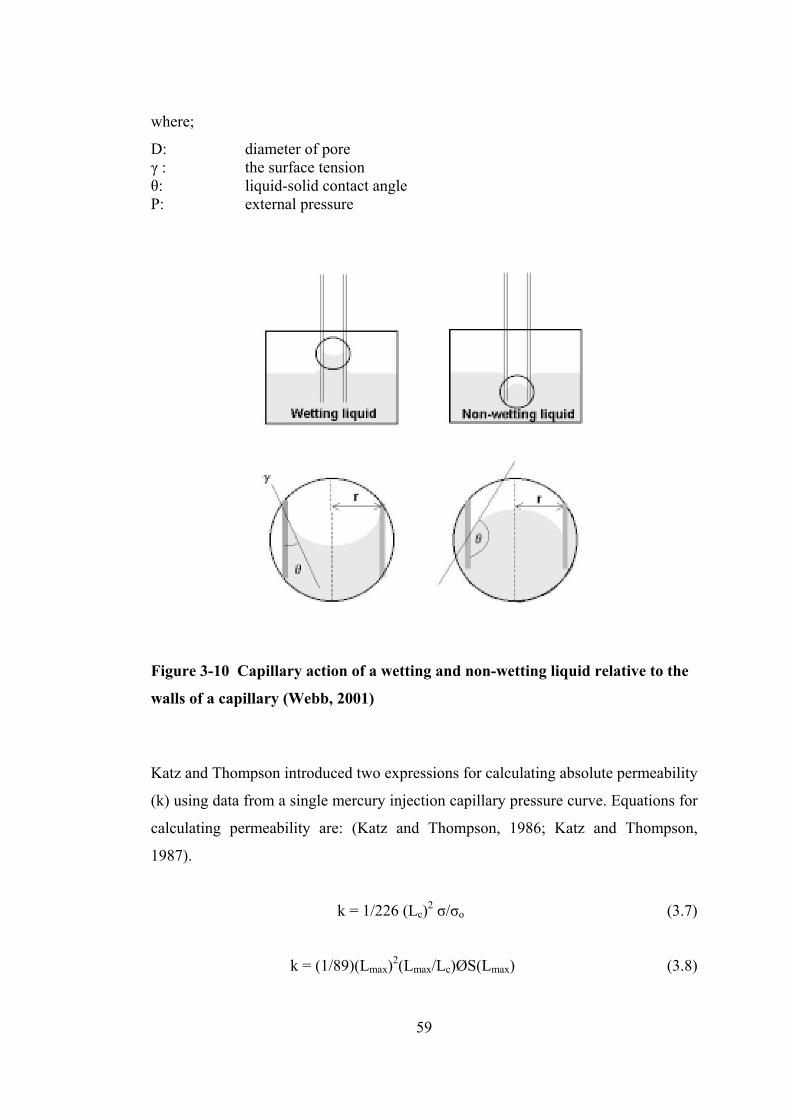
59
where;
D: diameter of pore γ : the surface tension θ: liquid-solid contact angle P: external pressure
Figure 3-10 Capillary action of a wetting and non-wetting liquid relative to the
walls of a capillary (Webb, 2001)
Katz and Thompson introduced two expressions for calculating absolute permeability
(k) using data from a single mercury injection capillary pressure curve. Equations for
calculating permeability are: (Katz and Thompson, 1986; Katz and Thompson,
1987).
k = 1/226 (Lc)2 σ/σo (3.7)
k = (1/89)(Lmax)2(Lmax/Lc)ØS(Lmax) (3.8)
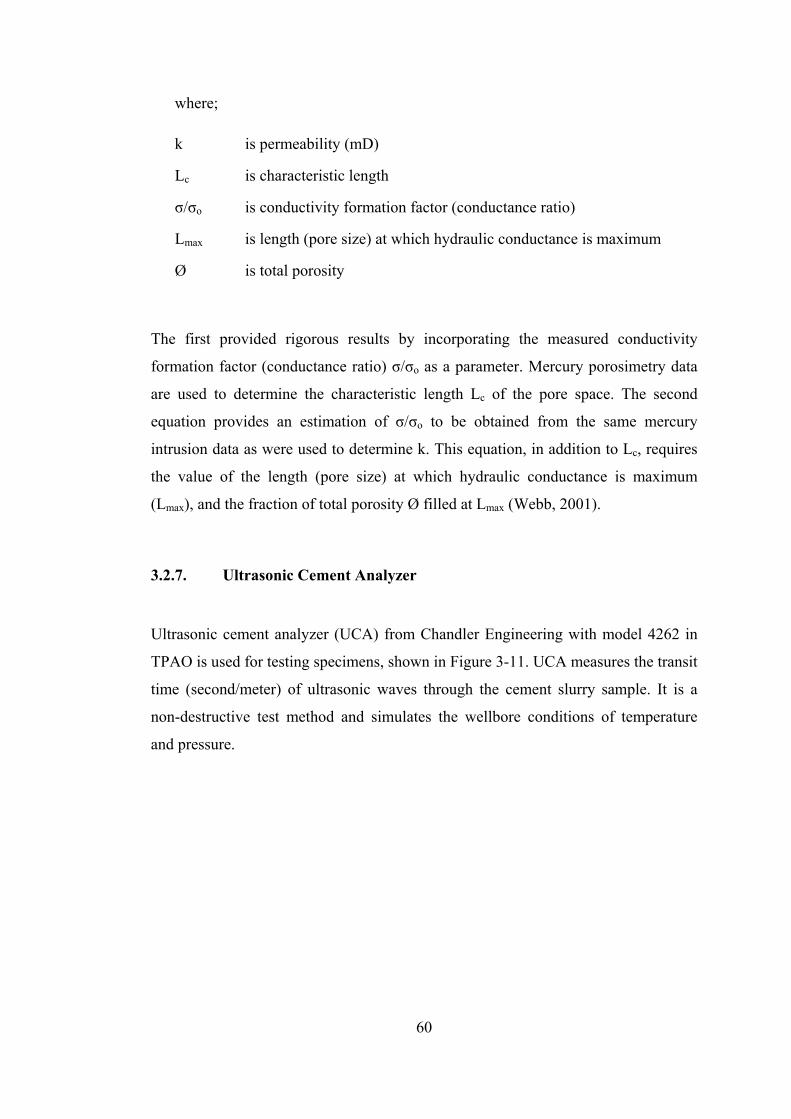
60
where;
k is permeability (mD)
Lc is characteristic length
σ/σo is conductivity formation factor (conductance ratio)
Lmax is length (pore size) at which hydraulic conductance is maximum
Ø is total porosity
The first provided rigorous results by incorporating the measured conductivity
formation factor (conductance ratio) σ/σo as a parameter. Mercury porosimetry data
are used to determine the characteristic length Lc of the pore space. The second
equation provides an estimation of σ/σo to be obtained from the same mercury
intrusion data as were used to determine k. This equation, in addition to Lc, requires
the value of the length (pore size) at which hydraulic conductance is maximum
(Lmax), and the fraction of total porosity Ø filled at Lmax (Webb, 2001).
3.2.7. Ultrasonic Cement Analyzer
Ultrasonic cement analyzer (UCA) from Chandler Engineering with model 4262 in
TPAO is used for testing specimens, shown in Figure 3-11. UCA measures the transit
time (second/meter) of ultrasonic waves through the cement slurry sample. It is a
non-destructive test method and simulates the wellbore conditions of temperature
and pressure.
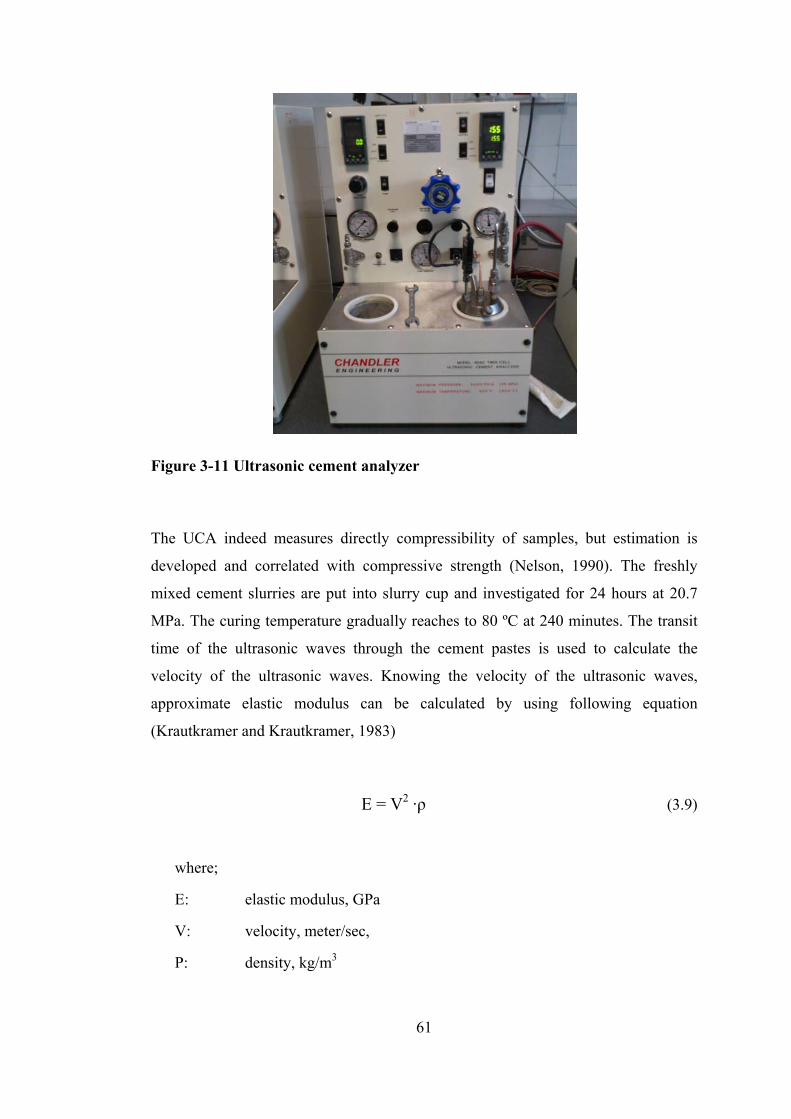
61
Figure 3-11 Ultrasonic cement analyzer
The UCA indeed measures directly compressibility of samples, but estimation is
developed and correlated with compressive strength (Nelson, 1990). The freshly
mixed cement slurries are put into slurry cup and investigated for 24 hours at 20.7
MPa. The curing temperature gradually reaches to 80 ºC at 240 minutes. The transit
time of the ultrasonic waves through the cement pastes is used to calculate the
velocity of the ultrasonic waves. Knowing the velocity of the ultrasonic waves,
approximate elastic modulus can be calculated by using following equation
(Krautkramer and Krautkramer, 1983)
E = V2 ·ρ (3.9)
where;
E: elastic modulus, GPa
V: velocity, meter/sec,
Ρ: density, kg/m3
62
3.2.8. Ultrasonic Velocity
After measuring permeability of the core specimens, they are used for ultrasonic
velocity measurements. Further, ultrasonic velocity measurements are used for
calculating elastic module and shear module of the hardened cement pastes. The core
specimens that are cured at 28-days cannot be measured due to the unavailability.
The Sonicviewer SX from OYO is TPAO as shown in Figure 3-12 is used for
velocity measurements of hardened cement pastes. Pulse velocity (Vp) and shear
velocity (Vs) can be determined by P and S wave propagation.
Figure 3-12 Sonicviewer SX
The primary and shear wave velocity (Vp and Vs) are used to calculate dynamic
elastic constants with the standard equations specified in ASTM D2845 are presented
in 3.10, 3.11 and 3.12.
E V V VV V
(3.10)
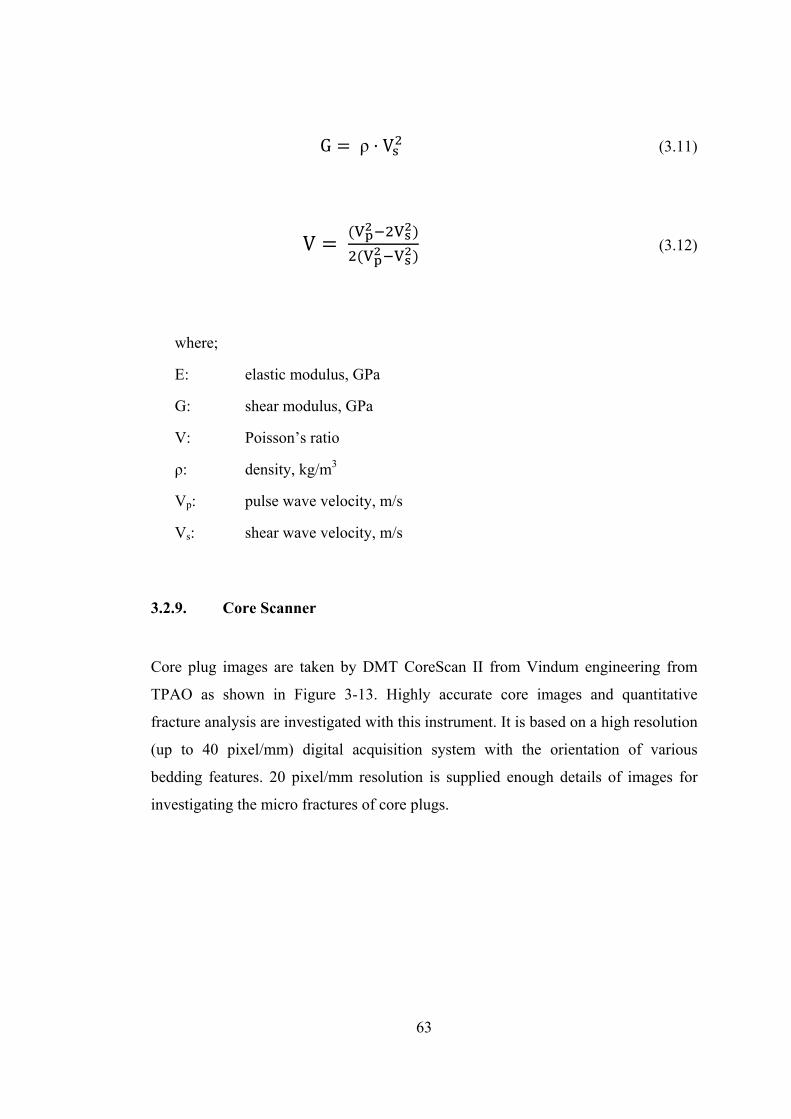
63
G ρ V (3.11)
V V VV V
(3.12)
where;
E: elastic modulus, GPa
G: shear modulus, GPa
V: Poisson’s ratio
ρ: density, kg/m3
Vp: pulse wave velocity, m/s
Vs: shear wave velocity, m/s
3.2.9. Core Scanner
Core plug images are taken by DMT CoreScan II from Vindum engineering from
TPAO as shown in Figure 3-13. Highly accurate core images and quantitative
fracture analysis are investigated with this instrument. It is based on a high resolution
(up to 40 pixel/mm) digital acquisition system with the orientation of various
bedding features. 20 pixel/mm resolution is supplied enough details of images for
investigating the micro fractures of core plugs.
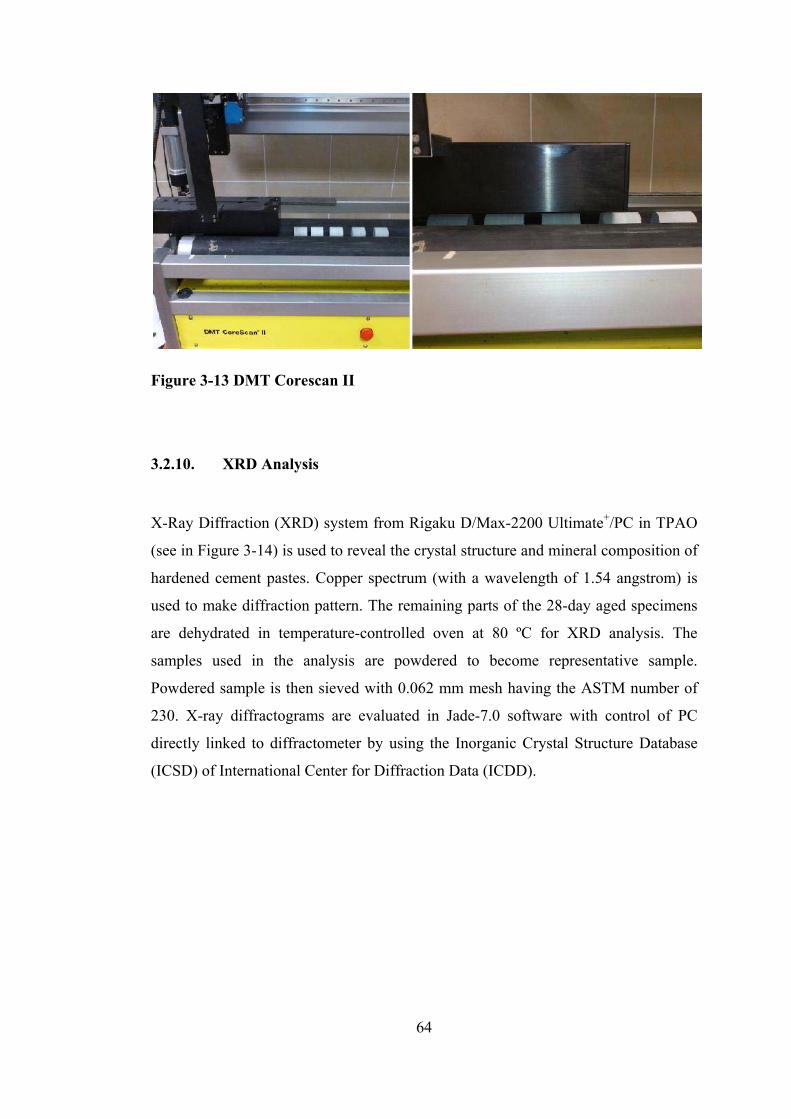
64
Figure 3-13 DMT Corescan II
3.2.10. XRD Analysis
X-Ray Diffraction (XRD) system from Rigaku D/Max-2200 Ultimate+/PC in TPAO
(see in Figure 3-14) is used to reveal the crystal structure and mineral composition of
hardened cement pastes. Copper spectrum (with a wavelength of 1.54 angstrom) is
used to make diffraction pattern. The remaining parts of the 28-day aged specimens
are dehydrated in temperature-controlled oven at 80 ºC for XRD analysis. The
samples used in the analysis are powdered to become representative sample.
Powdered sample is then sieved with 0.062 mm mesh having the ASTM number of
230. X-ray diffractograms are evaluated in Jade-7.0 software with control of PC
directly linked to diffractometer by using the Inorganic Crystal Structure Database
(ICSD) of International Center for Diffraction Data (ICDD).

65
3.2.11. SEM Analysis
The specimens that cured at 80 ºC for 28-days are dehydrated in temperature-
controlled oven at 80 ºC for SEM analysis. Scanning Electron Microscope (SEM)
system from Jeol with Model JSM-6490LV in TPAO (see in Figure 3-14) is used in
high vacuum mode to investigate micro morphology of hardened cement paste. The
samples first dried (2 hours at 60 ºC) prior to analysis and coated with gold using
Polaran E5100 Serie-II.
Figure 3-14 Left to right SEM and XRD instrument
3.3. Determination of Outliers
In a set of measurements, one or more of the values may differ considerably from the
majority. In this situation, rejecting the suspected values, also characterized as
outliers, recovers the overall precision of results. The Dixon’s Q-Test is a simple
method used for eliminating outliers even with three values with the formula is
shown in the following equation.
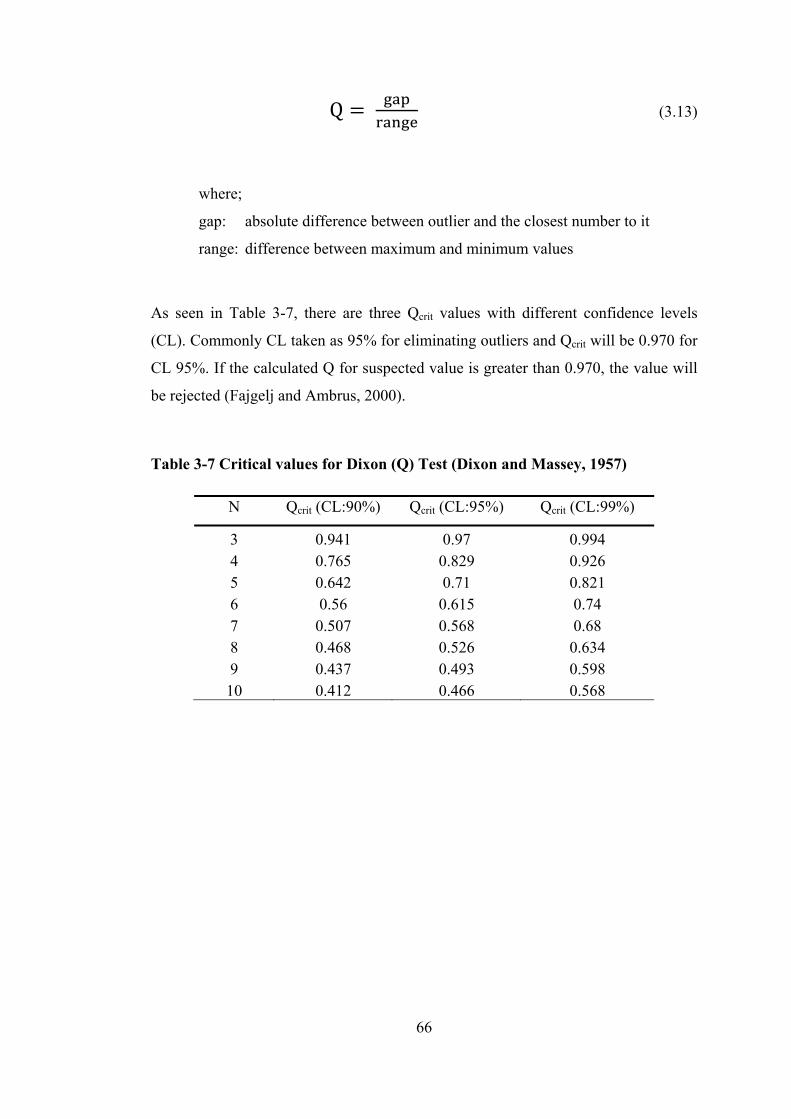
66
Q (3.13)
where;
gap: absolute difference between outlier and the closest number to it
range: difference between maximum and minimum values
As seen in Table 3-7, there are three Qcrit values with different confidence levels
(CL). Commonly CL taken as 95% for eliminating outliers and Qcrit will be 0.970 for
CL 95%. If the calculated Q for suspected value is greater than 0.970, the value will
be rejected (Fajgelj and Ambrus, 2000).
Table 3-7 Critical values for Dixon (Q) Test (Dixon and Massey, 1957)
N Qcrit (CL:90%) Qcrit (CL:95%) Qcrit (CL:99%)
3 0.941 0.97 0.994 4 0.765 0.829 0.926 5 0.642 0.71 0.821 6 0.56 0.615 0.74 7 0.507 0.568 0.68 8 0.468 0.526 0.634 9 0.437 0.493 0.598 10 0.412 0.466 0.568
67
4. CHAPTER 4
CHAPTER 4
RESULTS AND DISCUSSION
4.1. Characterization of Materials
CEM I type cement used in this study has a clinker with a high C3S content (65.64
%) and a low C2S content (3.71 %). In general C3S promotes early hydration while
C2S later hydration (Bogue, 1949). Therefore, early strength of cement pastes
expected to be higher as a result of improved early hydration. The specific surface
area (fineness) of CEM I is 4300 cm2/gr. An increase in the fineness of cement
commonly increases hydration rate and also improves strength development of
cement pastes with same w/c ratio. Another important factor that influences
hydration is C3A amount. The C3A content of the CEM I is 6.05 % which can be
considered as low for OPC. The amount of C3A for medium sulfate resistant (MSR)
cement type is limited to 8 percent according to ASTM C150.
The API Class G cement used in this study has a clinker with a high C3S content
(64.23 %) and a low C2S content (5.15 %) similar to CEM I. The fineness of the
sample is 3220 cm2/gr which is lower than that of CEM I. The coarsely ground API
Class G cement allows reducing hydration rate and delays setting time. The C3A
content of the Class G cement is 2.75% and considered in HSR grade. The limited
amount C3A also promotes to slow down the hydration rate of cement.
68
The GGBFS used in this study has an activity index of 73, even lower than that of
Grade 80 according to ASTM C989. At ambient temperatures, early compressive
strength of hardened cement pastes containing any grades of GGBFS (Grade-80,
Grade-100 and Grade-120) is expected to be lower than that of reference hardened
cement paste. On the other hand, at later ages, grade 120 increases strength, while
grade 80 decreases and grade-100 shows equal or greater in strength (Hogan and
Meusel, 1981; ACI 233). Therefore, the manufacturer increased fineness of the
GGBFS to improve reactivity of slag and compensate for the strength losses.
However, Olorunsogo (1998) introduces another idea that particle size distribution of
GGBFS has little or negligible effect on strength development of cement pastes
(Olorunsogo, 1998).
CEM I is more reactive than API Class G cement due to its chemical composition
and fineness. On the other hand, hydration rate of GGBFS is slower than both
cement types. The resulting hydration rate of GGBFS and CEM I blends will be
mean of them according to their ratios in the blend. Investigations show that in the
GGBFS blended cement pastes by using the clinkers with low C3A content, strength
contribution of the GGBFS clearly increases with an increasing alite content of the
clinker (Muller, 2007). From the point of view of oil well cementing, rapid hydration
rate is not desirable for oil well cements to provide chemical and physical stability of
both fresh and hardened cement paste at high temperatures.
4.2. Free Fluid Content
The maximum allowed amount of free fluid designated in API Specification 10A is
5.9 percent by volume. All slurry compositions are appropriate for oil well cement as
shown in Table 4-1. However, lower amount of free water content is desirable for
various operations in oil well cementing.
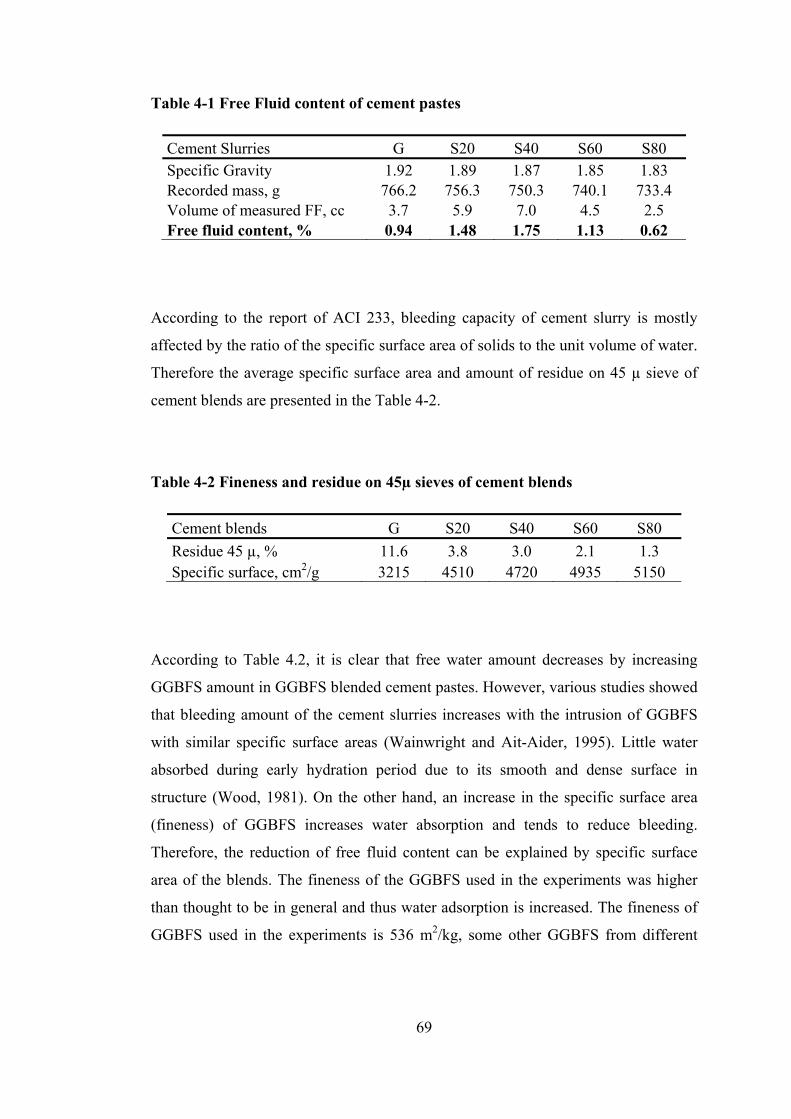
69
Table 4-1 Free Fluid content of cement pastes
Cement Slurries G S20 S40 S60 S80 Specific Gravity 1.92 1.89 1.87 1.85 1.83 Recorded mass, g 766.2 756.3 750.3 740.1 733.4 Volume of measured FF, cc 3.7 5.9 7.0 4.5 2.5 Free fluid content, % 0.94 1.48 1.75 1.13 0.62
According to the report of ACI 233, bleeding capacity of cement slurry is mostly
affected by the ratio of the specific surface area of solids to the unit volume of water.
Therefore the average specific surface area and amount of residue on 45 µ sieve of
cement blends are presented in the Table 4-2.
Table 4-2 Fineness and residue on 45µ sieves of cement blends
Cement blends G S20 S40 S60 S80 Residue 45 µ, % 11.6 3.8 3.0 2.1 1.3 Specific surface, cm2/g 3215 4510 4720 4935 5150
According to Table 4.2, it is clear that free water amount decreases by increasing
GGBFS amount in GGBFS blended cement pastes. However, various studies showed
that bleeding amount of the cement slurries increases with the intrusion of GGBFS
with similar specific surface areas (Wainwright and Ait-Aider, 1995). Little water
absorbed during early hydration period due to its smooth and dense surface in
structure (Wood, 1981). On the other hand, an increase in the specific surface area
(fineness) of GGBFS increases water absorption and tends to reduce bleeding.
Therefore, the reduction of free fluid content can be explained by specific surface
area of the blends. The fineness of the GGBFS used in the experiments was higher
than thought to be in general and thus water adsorption is increased. The fineness of
GGBFS used in the experiments is 536 m2/kg, some other GGBFS from different
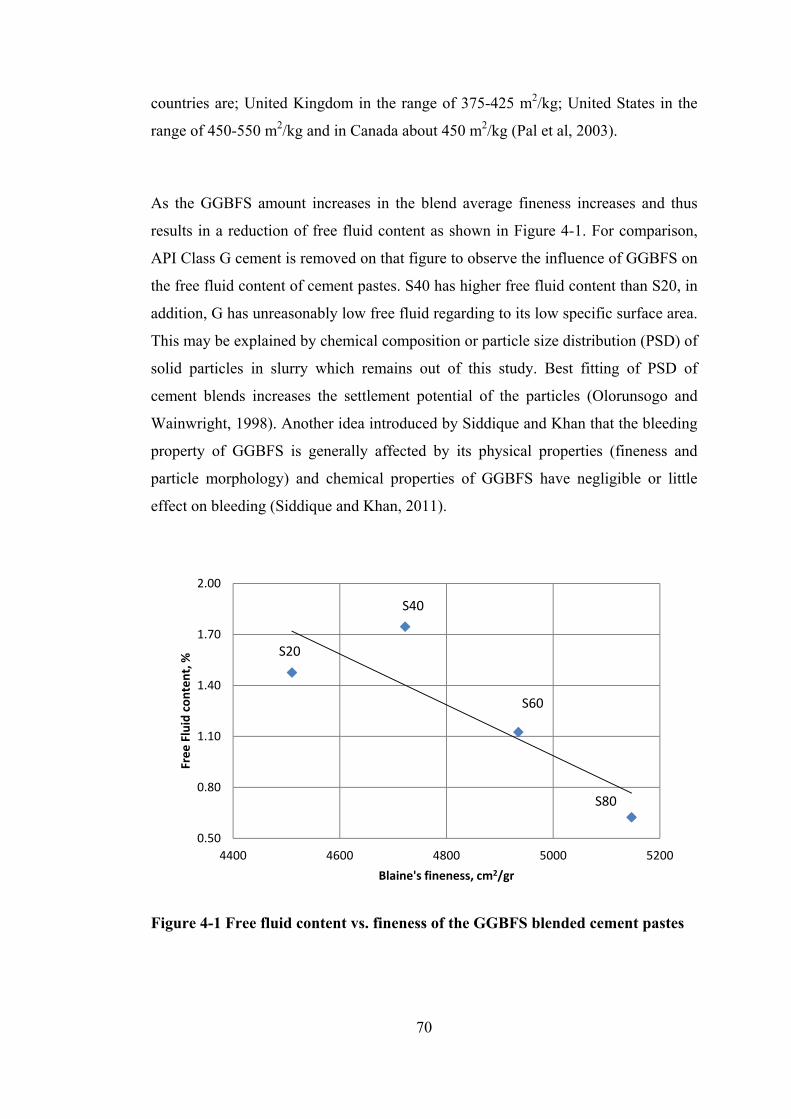
70
countries are; United Kingdom in the range of 375-425 m2/kg; United States in the
range of 450-550 m2/kg and in Canada about 450 m2/kg (Pal et al, 2003).
As the GGBFS amount increases in the blend average fineness increases and thus
results in a reduction of free fluid content as shown in Figure 4-1. For comparison,
API Class G cement is removed on that figure to observe the influence of GGBFS on
the free fluid content of cement pastes. S40 has higher free fluid content than S20, in
addition, G has unreasonably low free fluid regarding to its low specific surface area.
This may be explained by chemical composition or particle size distribution (PSD) of
solid particles in slurry which remains out of this study. Best fitting of PSD of
cement blends increases the settlement potential of the particles (Olorunsogo and
Wainwright, 1998). Another idea introduced by Siddique and Khan that the bleeding
property of GGBFS is generally affected by its physical properties (fineness and
particle morphology) and chemical properties of GGBFS have negligible or little
effect on bleeding (Siddique and Khan, 2011).
Figure 4-1 Free fluid content vs. fineness of the GGBFS blended cement pastes
0.50
0.80
1.10
1.40
1.70
2.00
4400 4600 4800 5000 5200
Free
Fluid con
tent, %
Blaine's fineness, cm2/gr
S20
S40
S80
S60
71
The influence of GGBFS on bleeding of cement pastes is also investigated by
Wainwright and Rey (2000). According to his studies, addition of 55 percent of
GGBFS to the plain OPC increases bleeding of the cement paste while 85 percent of
GGBFS addition has no significant effect on bleeding. Another study showed that
there is not an exact relationship between PSD with bleeding of cement paste at the
same w/c (Wainwright and Ait-Aider, 1995).
The reduced bleeding potential of GGBFS in cement paste is also explained by
hydration mechanism of slag blended cement. The early hydration products of
cement slurry help to block upward water passage to the surface. The GGBFS desires
alkaline rich environment for hydration and reduces early hydration products and
thus allows passage of free fluid (Hwang and Lin, 1986).
4.3. Compressive Strength
Compressive strength of GGBFS included hardened cement pastes can vary over a
wide range. It is highly dependent on temperature; even 10° C increase in curing
temperature accelerates strength development especially at early periods. It is more
significant at higher levels of GGBFS replacement in the paste (Barnett et al, 2006).
In most of the oil wells, cement slurries are exposed to high temperatures and in this
study temperature is kept as 80 °C for curing cement pastes to represent “medium”
range oil wells.
Table 4-3 shows the results of the compressive strength analysis of hardened cement
pastes at ages of 1-day, 7-days and 28-days cured at 80 °C. In order to draw a more
meaningful conclusion from the experimental data, the outliers are eliminated by
using Dixon Q test with a confidence level of 95%.
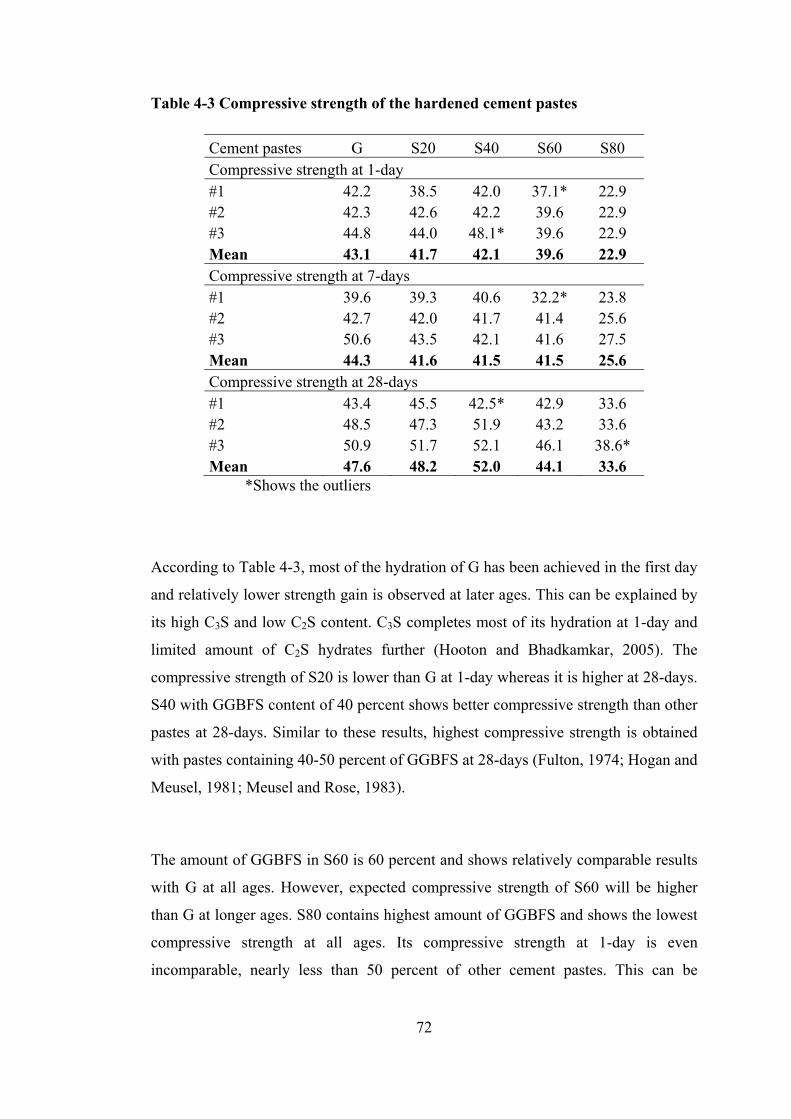
72
Table 4-3 Compressive strength of the hardened cement pastes
Cement pastes G S20 S40 S60 S80 Compressive strength at 1-day #1 42.2 38.5 42.0 37.1* 22.9 #2 42.3 42.6 42.2 39.6 22.9 #3 44.8 44.0 48.1* 39.6 22.9 Mean 43.1 41.7 42.1 39.6 22.9 Compressive strength at 7-days #1 39.6 39.3 40.6 32.2* 23.8 #2 42.7 42.0 41.7 41.4 25.6 #3 50.6 43.5 42.1 41.6 27.5 Mean 44.3 41.6 41.5 41.5 25.6 Compressive strength at 28-days #1 43.4 45.5 42.5* 42.9 33.6 #2 48.5 47.3 51.9 43.2 33.6 #3 50.9 51.7 52.1 46.1 38.6* Mean 47.6 48.2 52.0 44.1 33.6
*Shows the outliers
According to Table 4-3, most of the hydration of G has been achieved in the first day
and relatively lower strength gain is observed at later ages. This can be explained by
its high C3S and low C2S content. C3S completes most of its hydration at 1-day and
limited amount of C2S hydrates further (Hooton and Bhadkamkar, 2005). The
compressive strength of S20 is lower than G at 1-day whereas it is higher at 28-days.
S40 with GGBFS content of 40 percent shows better compressive strength than other
pastes at 28-days. Similar to these results, highest compressive strength is obtained
with pastes containing 40-50 percent of GGBFS at 28-days (Fulton, 1974; Hogan and
Meusel, 1981; Meusel and Rose, 1983).
The amount of GGBFS in S60 is 60 percent and shows relatively comparable results
with G at all ages. However, expected compressive strength of S60 will be higher
than G at longer ages. S80 contains highest amount of GGBFS and shows the lowest
compressive strength at all ages. Its compressive strength at 1-day is even
incomparable, nearly less than 50 percent of other cement pastes. This can be
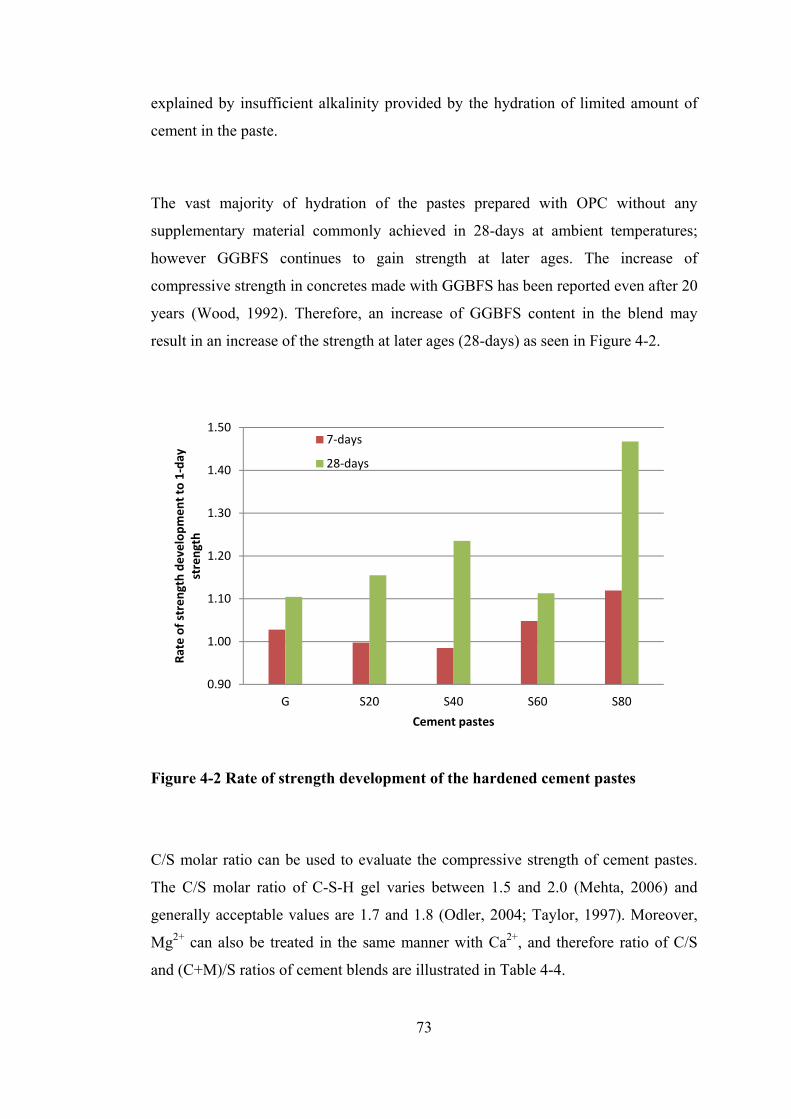
73
explained by insufficient alkalinity provided by the hydration of limited amount of
cement in the paste.
The vast majority of hydration of the pastes prepared with OPC without any
supplementary material commonly achieved in 28-days at ambient temperatures;
however GGBFS continues to gain strength at later ages. The increase of
compressive strength in concretes made with GGBFS has been reported even after 20
years (Wood, 1992). Therefore, an increase of GGBFS content in the blend may
result in an increase of the strength at later ages (28-days) as seen in Figure 4-2.
Figure 4-2 Rate of strength development of the hardened cement pastes
C/S molar ratio can be used to evaluate the compressive strength of cement pastes.
The C/S molar ratio of C-S-H gel varies between 1.5 and 2.0 (Mehta, 2006) and
generally acceptable values are 1.7 and 1.8 (Odler, 2004; Taylor, 1997). Moreover,
Mg2+ can also be treated in the same manner with Ca2+, and therefore ratio of C/S
and (C+M)/S ratios of cement blends are illustrated in Table 4-4.
0.90
1.00
1.10
1.20
1.30
1.40
1.50
G S20 S40 S60 S80
Rate of stren
gth de
velopm
ent to 1‐da
y strength
Cement pastes
7‐days
28‐days
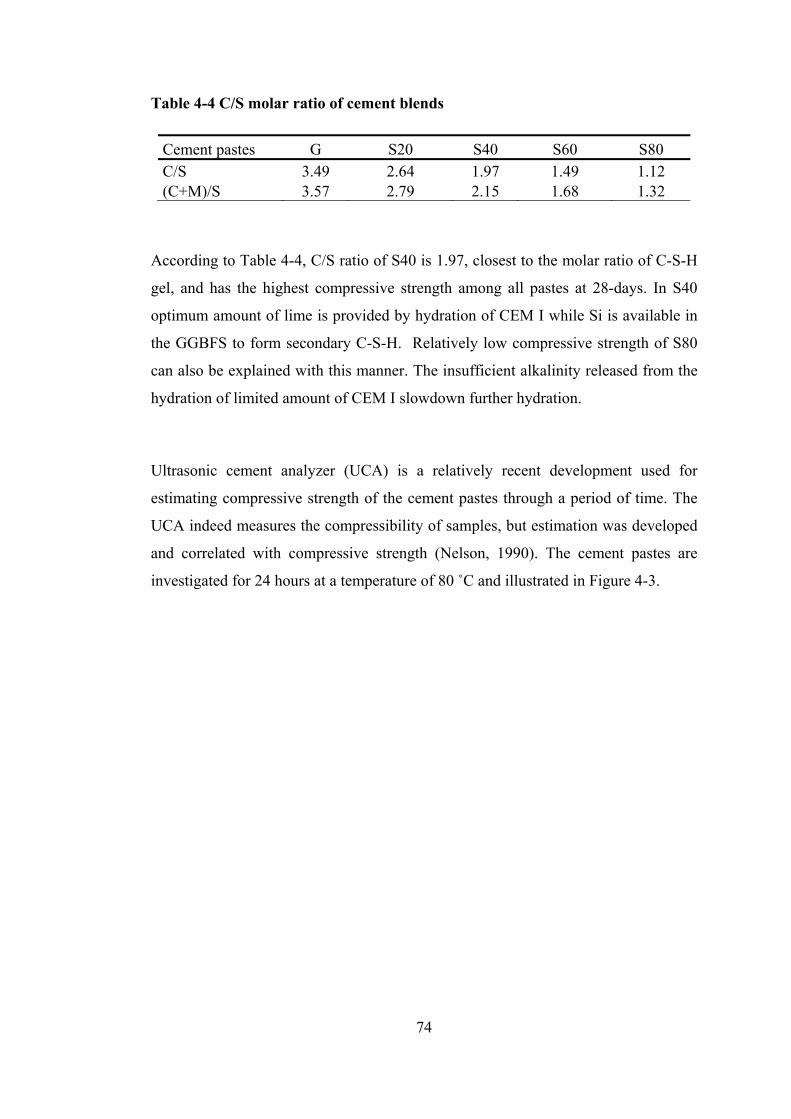
74
Table 4-4 C/S molar ratio of cement blends
Cement pastes G S20 S40 S60 S80 C/S 3.49 2.64 1.97 1.49 1.12 (C+M)/S 3.57 2.79 2.15 1.68 1.32
According to Table 4-4, C/S ratio of S40 is 1.97, closest to the molar ratio of C-S-H
gel, and has the highest compressive strength among all pastes at 28-days. In S40
optimum amount of lime is provided by hydration of CEM I while Si is available in
the GGBFS to form secondary C-S-H. Relatively low compressive strength of S80
can also be explained with this manner. The insufficient alkalinity released from the
hydration of limited amount of CEM I slowdown further hydration.
Ultrasonic cement analyzer (UCA) is a relatively recent development used for
estimating compressive strength of the cement pastes through a period of time. The
UCA indeed measures the compressibility of samples, but estimation was developed
and correlated with compressive strength (Nelson, 1990). The cement pastes are
investigated for 24 hours at a temperature of 80 ˚C and illustrated in Figure 4-3.
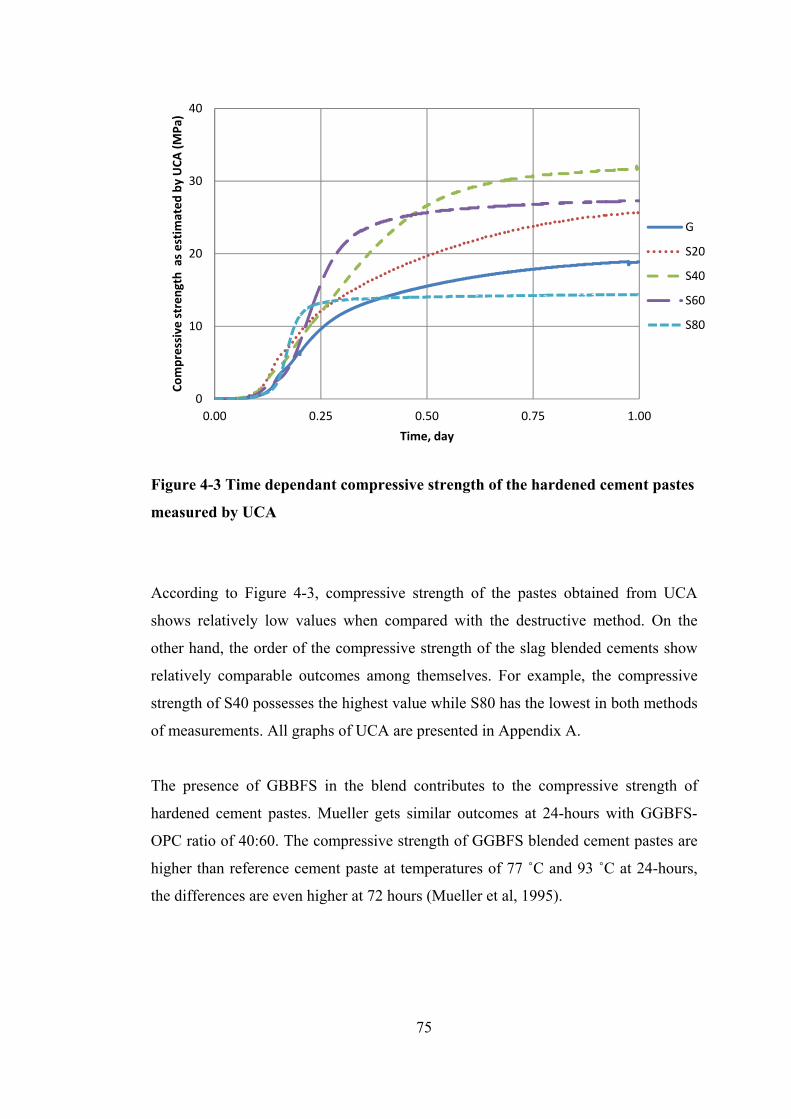
75
Figure 4-3 Time dependant compressive strength of the hardened cement pastes
measured by UCA
According to Figure 4-3, compressive strength of the pastes obtained from UCA
shows relatively low values when compared with the destructive method. On the
other hand, the order of the compressive strength of the slag blended cements show
relatively comparable outcomes among themselves. For example, the compressive
strength of S40 possesses the highest value while S80 has the lowest in both methods
of measurements. All graphs of UCA are presented in Appendix A.
The presence of GBBFS in the blend contributes to the compressive strength of
hardened cement pastes. Mueller gets similar outcomes at 24-hours with GGBFS-
OPC ratio of 40:60. The compressive strength of GGBFS blended cement pastes are
higher than reference cement paste at temperatures of 77 ˚C and 93 ˚C at 24-hours,
the differences are even higher at 72 hours (Mueller et al, 1995).
0
10
20
30
40
0.00 0.25 0.50 0.75 1.00
Compressive
stren
gth as estimated
by UCA
(MPa
)
Time, day
G
S20
S40
S60
S80
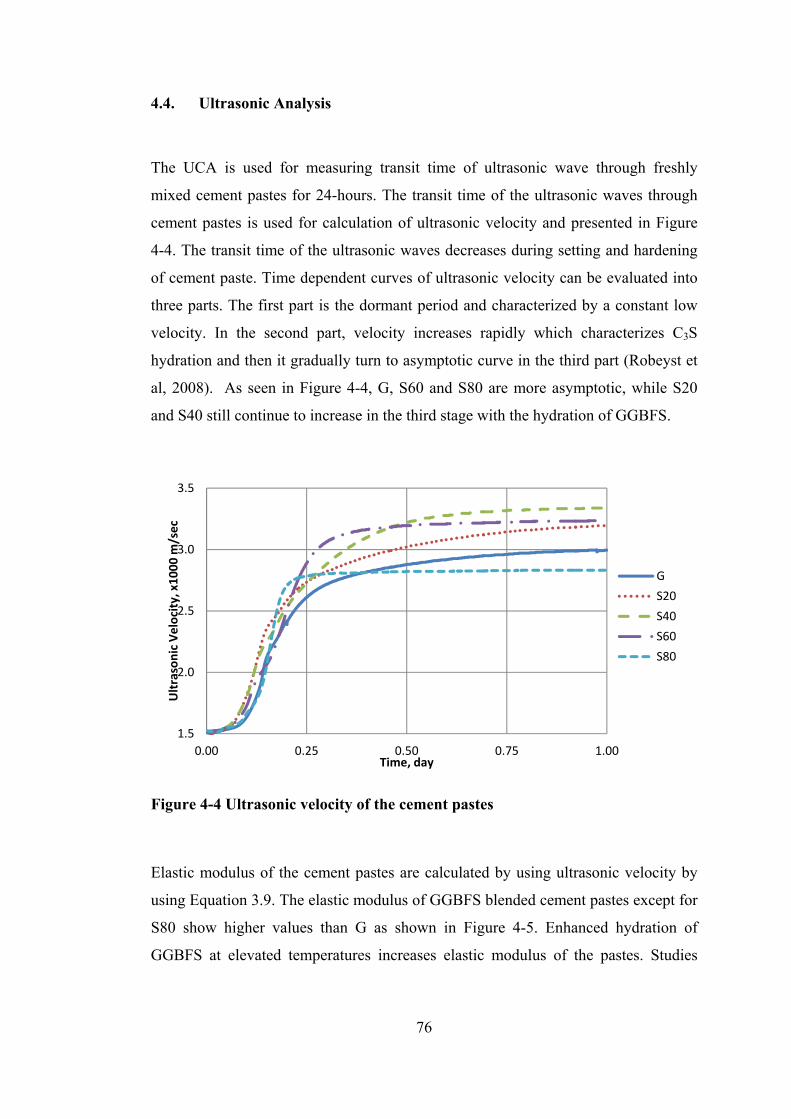
76
4.4. Ultrasonic Analysis
The UCA is used for measuring transit time of ultrasonic wave through freshly
mixed cement pastes for 24-hours. The transit time of the ultrasonic waves through
cement pastes is used for calculation of ultrasonic velocity and presented in Figure
4-4. The transit time of the ultrasonic waves decreases during setting and hardening
of cement paste. Time dependent curves of ultrasonic velocity can be evaluated into
three parts. The first part is the dormant period and characterized by a constant low
velocity. In the second part, velocity increases rapidly which characterizes C3S
hydration and then it gradually turn to asymptotic curve in the third part (Robeyst et
al, 2008). As seen in Figure 4-4, G, S60 and S80 are more asymptotic, while S20
and S40 still continue to increase in the third stage with the hydration of GGBFS.
Figure 4-4 Ultrasonic velocity of the cement pastes
Elastic modulus of the cement pastes are calculated by using ultrasonic velocity by
using Equation 3.9. The elastic modulus of GGBFS blended cement pastes except for
S80 show higher values than G as shown in Figure 4-5. Enhanced hydration of
GGBFS at elevated temperatures increases elastic modulus of the pastes. Studies
1.5
2.0
2.5
3.0
3.5
0.00 0.25 0.50 0.75 1.00
Ultrasonic Velocity, x10
00 m
/sec
Time, day
G
S20
S40
S60
S80
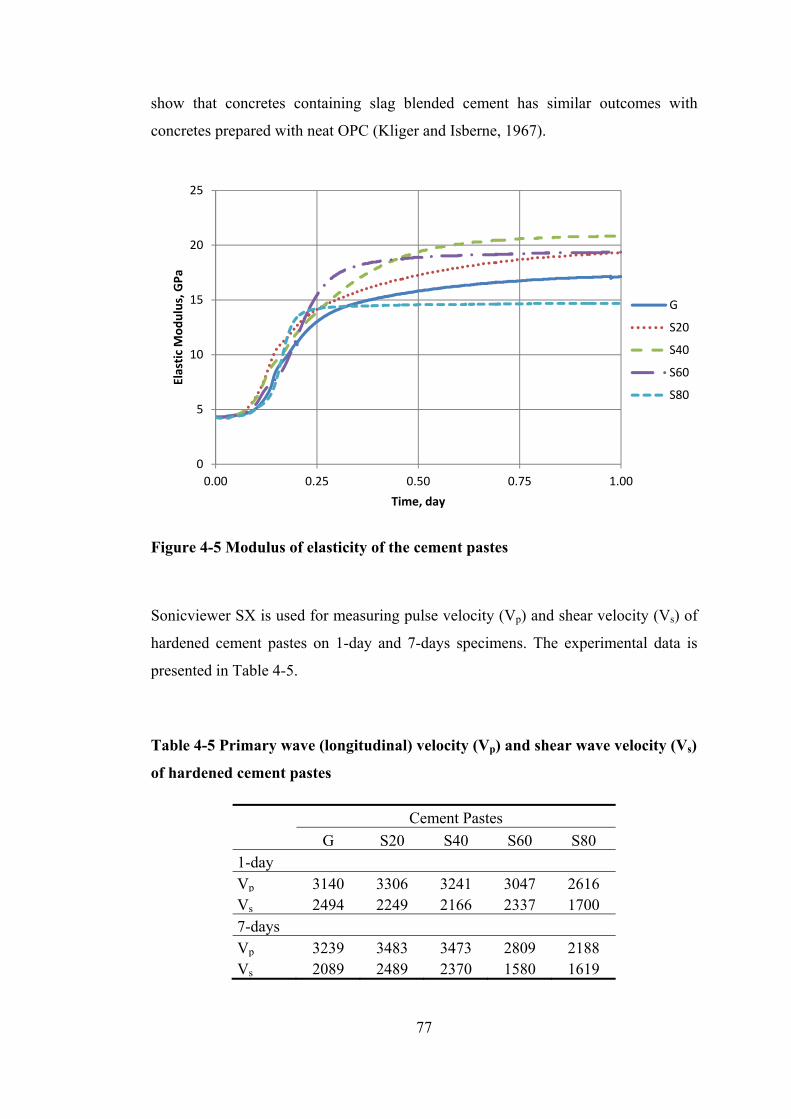
77
show that concretes containing slag blended cement has similar outcomes with
concretes prepared with neat OPC (Kliger and Isberne, 1967).
Figure 4-5 Modulus of elasticity of the cement pastes
Sonicviewer SX is used for measuring pulse velocity (Vp) and shear velocity (Vs) of
hardened cement pastes on 1-day and 7-days specimens. The experimental data is
presented in Table 4-5.
Table 4-5 Primary wave (longitudinal) velocity (Vp) and shear wave velocity (Vs)
of hardened cement pastes
Cement Pastes G S20 S40 S60 S80
1-day Vp 3140 3306 3241 3047 2616 Vs 2494 2249 2166 2337 1700 7-days Vp 3239 3483 3473 2809 2188 Vs 2089 2489 2370 1580 1619
0
5
10
15
20
25
0.00 0.25 0.50 0.75 1.00
Elastic Mod
ulus, G
Pa
Time, day
G
S20
S40
S60
S80
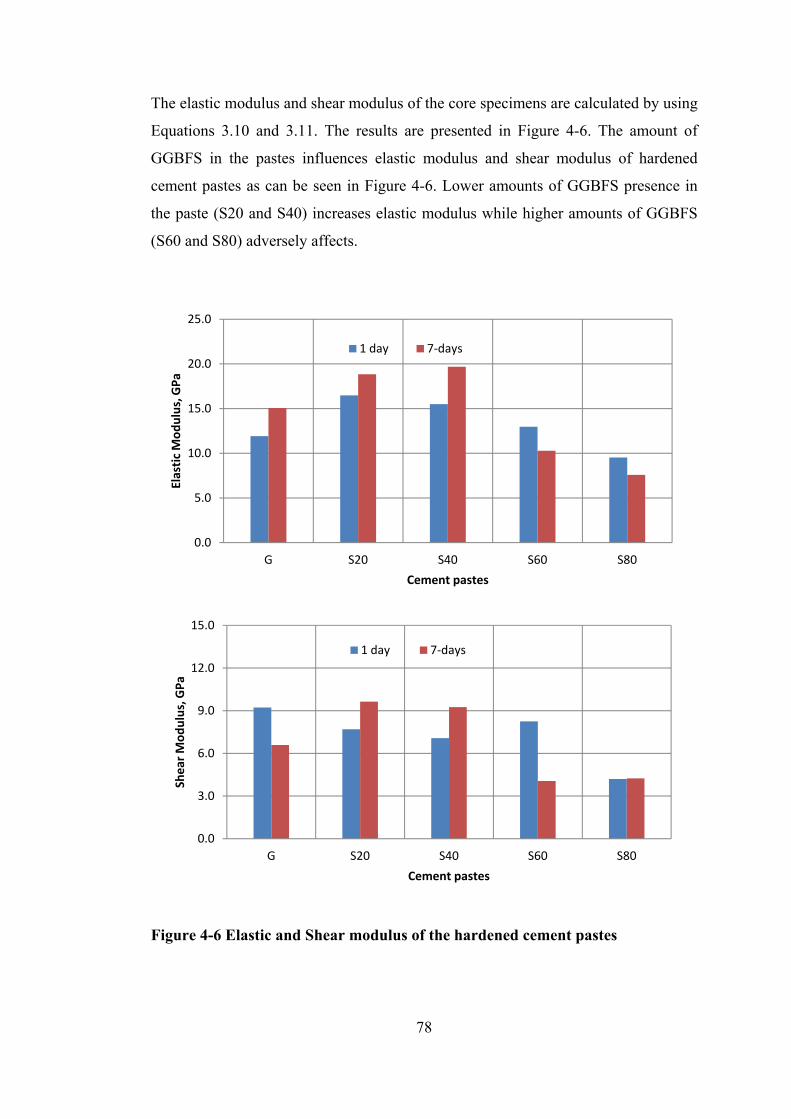
78
The elastic modulus and shear modulus of the core specimens are calculated by using
Equations 3.10 and 3.11. The results are presented in Figure 4-6. The amount of
GGBFS in the pastes influences elastic modulus and shear modulus of hardened
cement pastes as can be seen in Figure 4-6. Lower amounts of GGBFS presence in
the paste (S20 and S40) increases elastic modulus while higher amounts of GGBFS
(S60 and S80) adversely affects.
Figure 4-6 Elastic and Shear modulus of the hardened cement pastes
0.0
5.0
10.0
15.0
20.0
25.0
G S20 S40 S60 S80
Elastic Mod
ulus, G
Pa
Cement pastes
1 day 7‐days
0.0
3.0
6.0
9.0
12.0
15.0
G S20 S40 S60 S80
Shear M
odulus, G
Pa
Cement pastes
1 day 7‐days
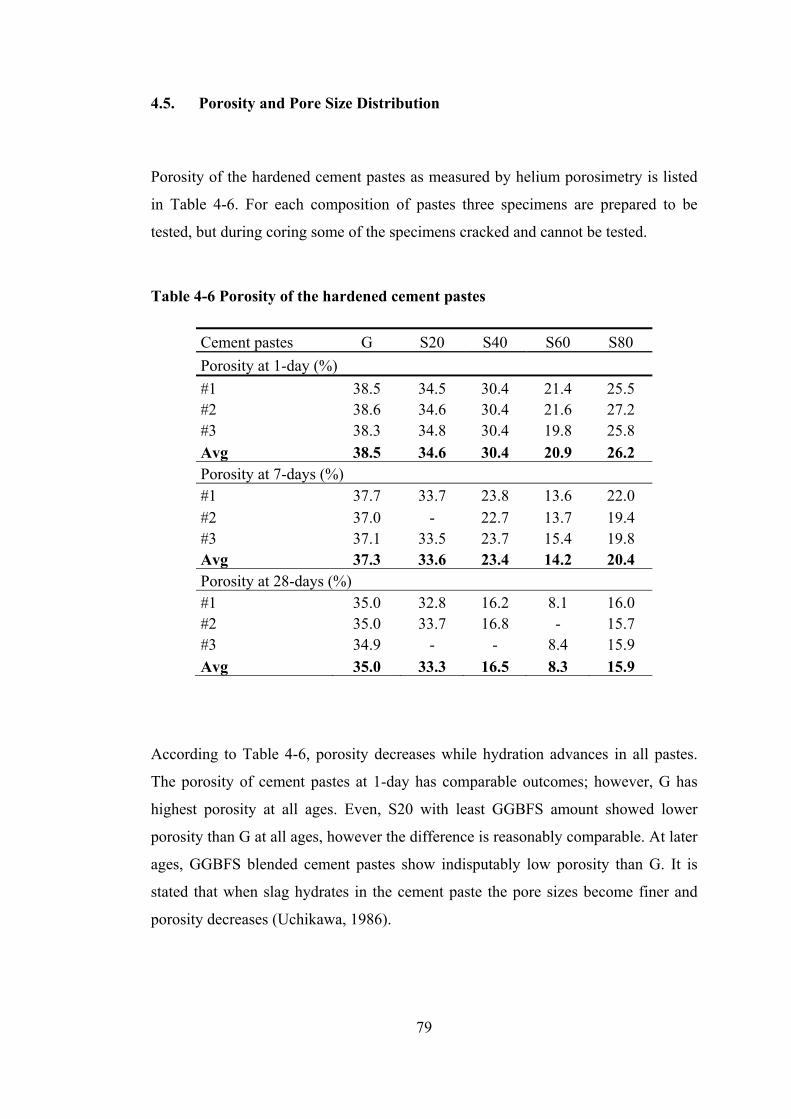
79
4.5. Porosity and Pore Size Distribution
Porosity of the hardened cement pastes as measured by helium porosimetry is listed
in Table 4-6. For each composition of pastes three specimens are prepared to be
tested, but during coring some of the specimens cracked and cannot be tested.
Table 4-6 Porosity of the hardened cement pastes
Cement pastes G S20 S40 S60 S80 Porosity at 1-day (%) #1 38.5 34.5 30.4 21.4 25.5 #2 38.6 34.6 30.4 21.6 27.2 #3 38.3 34.8 30.4 19.8 25.8 Avg 38.5 34.6 30.4 20.9 26.2 Porosity at 7-days (%) #1 37.7 33.7 23.8 13.6 22.0 #2 37.0 - 22.7 13.7 19.4 #3 37.1 33.5 23.7 15.4 19.8 Avg 37.3 33.6 23.4 14.2 20.4 Porosity at 28-days (%) #1 35.0 32.8 16.2 8.1 16.0 #2 35.0 33.7 16.8 - 15.7 #3 34.9 - - 8.4 15.9 Avg 35.0 33.3 16.5 8.3 15.9
According to Table 4-6, porosity decreases while hydration advances in all pastes.
The porosity of cement pastes at 1-day has comparable outcomes; however, G has
highest porosity at all ages. Even, S20 with least GGBFS amount showed lower
porosity than G at all ages, however the difference is reasonably comparable. At later
ages, GGBFS blended cement pastes show indisputably low porosity than G. It is
stated that when slag hydrates in the cement paste the pore sizes become finer and
porosity decreases (Uchikawa, 1986).
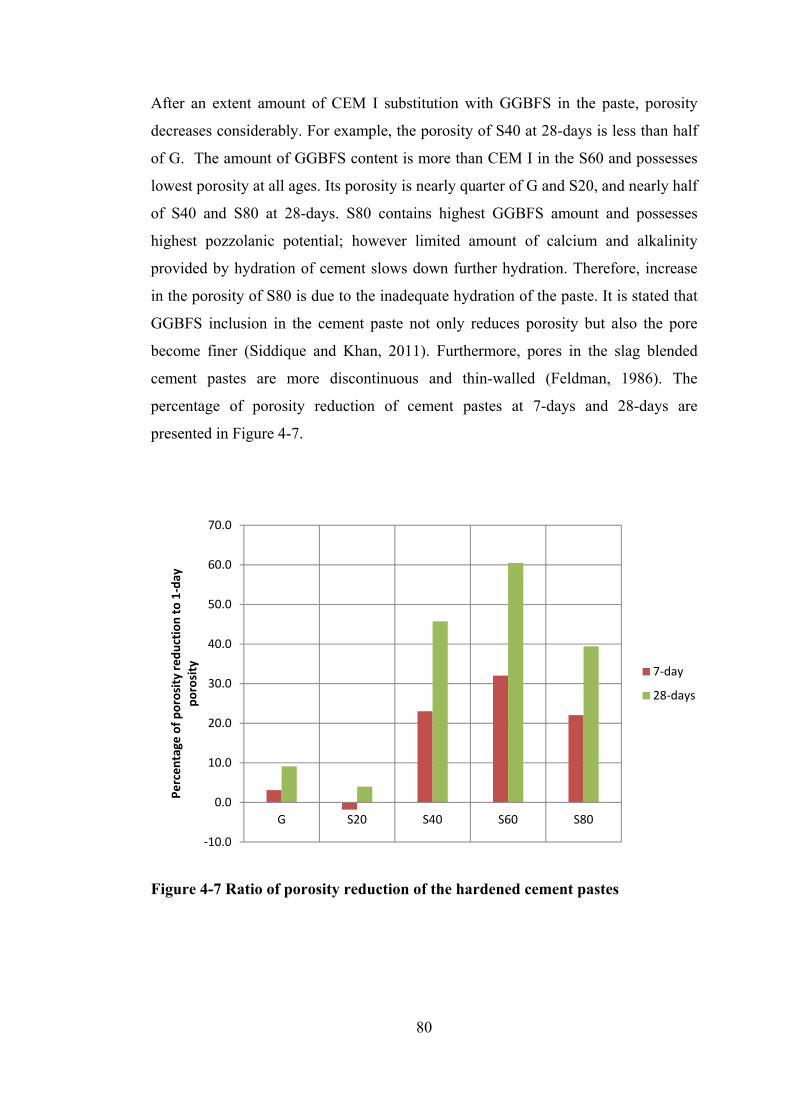
80
After an extent amount of CEM I substitution with GGBFS in the paste, porosity
decreases considerably. For example, the porosity of S40 at 28-days is less than half
of G. The amount of GGBFS content is more than CEM I in the S60 and possesses
lowest porosity at all ages. Its porosity is nearly quarter of G and S20, and nearly half
of S40 and S80 at 28-days. S80 contains highest GGBFS amount and possesses
highest pozzolanic potential; however limited amount of calcium and alkalinity
provided by hydration of cement slows down further hydration. Therefore, increase
in the porosity of S80 is due to the inadequate hydration of the paste. It is stated that
GGBFS inclusion in the cement paste not only reduces porosity but also the pore
become finer (Siddique and Khan, 2011). Furthermore, pores in the slag blended
cement pastes are more discontinuous and thin-walled (Feldman, 1986). The
percentage of porosity reduction of cement pastes at 7-days and 28-days are
presented in Figure 4-7.
Figure 4-7 Ratio of porosity reduction of the hardened cement pastes
‐10.0
0.0
10.0
20.0
30.0
40.0
50.0
60.0
70.0
G S20 S40 S60 S80
Percen
tage
of p
orosity redu
ction to 1‐day
porosity 7‐day
28‐days
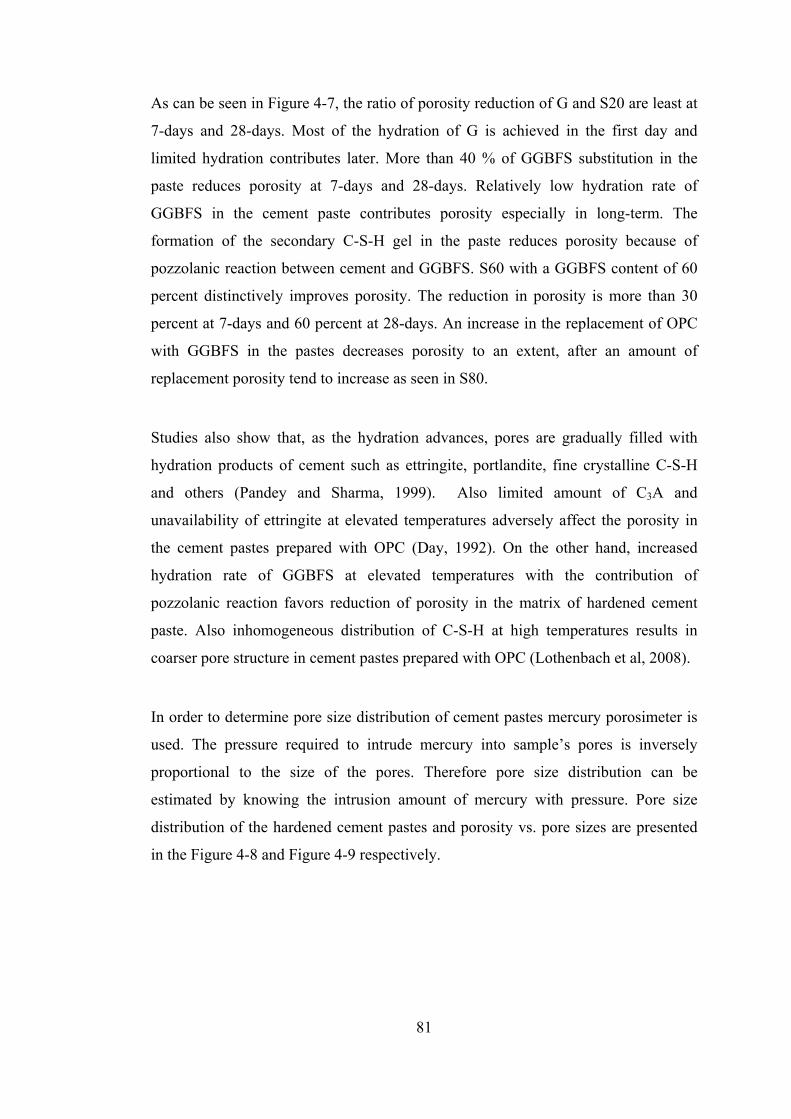
81
As can be seen in Figure 4-7, the ratio of porosity reduction of G and S20 are least at
7-days and 28-days. Most of the hydration of G is achieved in the first day and
limited hydration contributes later. More than 40 % of GGBFS substitution in the
paste reduces porosity at 7-days and 28-days. Relatively low hydration rate of
GGBFS in the cement paste contributes porosity especially in long-term. The
formation of the secondary C-S-H gel in the paste reduces porosity because of
pozzolanic reaction between cement and GGBFS. S60 with a GGBFS content of 60
percent distinctively improves porosity. The reduction in porosity is more than 30
percent at 7-days and 60 percent at 28-days. An increase in the replacement of OPC
with GGBFS in the pastes decreases porosity to an extent, after an amount of
replacement porosity tend to increase as seen in S80.
Studies also show that, as the hydration advances, pores are gradually filled with
hydration products of cement such as ettringite, portlandite, fine crystalline C-S-H
and others (Pandey and Sharma, 1999). Also limited amount of C3A and
unavailability of ettringite at elevated temperatures adversely affect the porosity in
the cement pastes prepared with OPC (Day, 1992). On the other hand, increased
hydration rate of GGBFS at elevated temperatures with the contribution of
pozzolanic reaction favors reduction of porosity in the matrix of hardened cement
paste. Also inhomogeneous distribution of C-S-H at high temperatures results in
coarser pore structure in cement pastes prepared with OPC (Lothenbach et al, 2008).
In order to determine pore size distribution of cement pastes mercury porosimeter is
used. The pressure required to intrude mercury into sample’s pores is inversely
proportional to the size of the pores. Therefore pore size distribution can be
estimated by knowing the intrusion amount of mercury with pressure. Pore size
distribution of the hardened cement pastes and porosity vs. pore sizes are presented
in the Figure 4-8 and Figure 4-9 respectively.
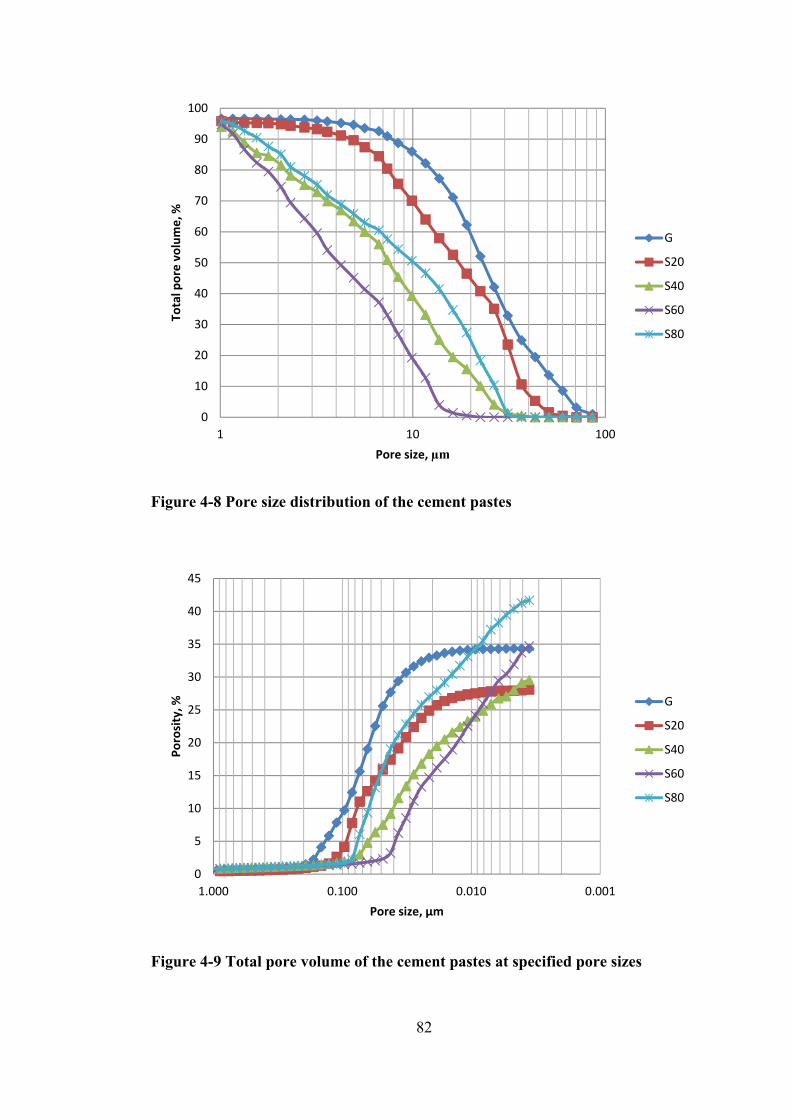
82
Figure 4-8 Pore size distribution of the cement pastes
Figure 4-9 Total pore volume of the cement pastes at specified pore sizes
0
10
20
30
40
50
60
70
80
90
100
1 10 100
Total pore volume, %
Pore size, µm
G
S20
S40
S60
S80
0
5
10
15
20
25
30
35
40
45
0.0010.0100.1001.000
Porosity, %
Pore size, µm
G
S20
S40
S60
S80
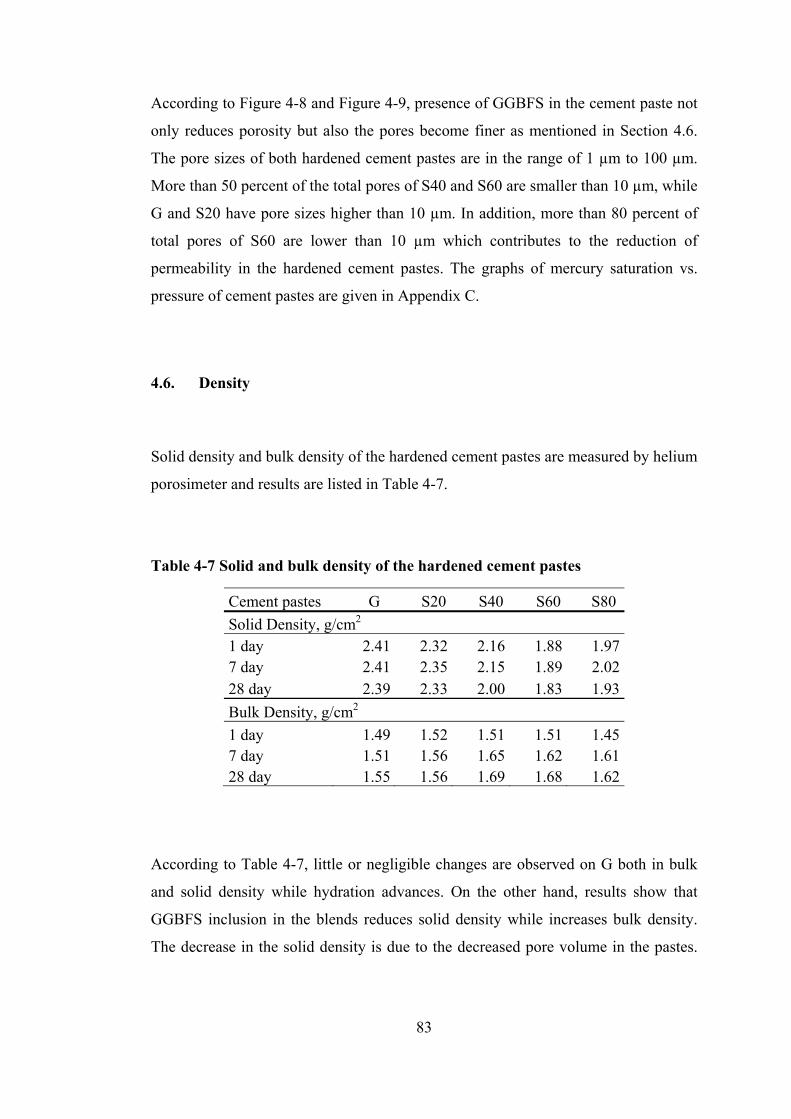
83
According to Figure 4-8 and Figure 4-9, presence of GGBFS in the cement paste not
only reduces porosity but also the pores become finer as mentioned in Section 4.6.
The pore sizes of both hardened cement pastes are in the range of 1 µm to 100 µm.
More than 50 percent of the total pores of S40 and S60 are smaller than 10 µm, while
G and S20 have pore sizes higher than 10 µm. In addition, more than 80 percent of
total pores of S60 are lower than 10 µm which contributes to the reduction of
permeability in the hardened cement pastes. The graphs of mercury saturation vs.
pressure of cement pastes are given in Appendix C.
4.6. Density
Solid density and bulk density of the hardened cement pastes are measured by helium
porosimeter and results are listed in Table 4-7.
Table 4-7 Solid and bulk density of the hardened cement pastes
Cement pastes G S20 S40 S60 S80 Solid Density, g/cm2 1 day 2.41 2.32 2.16 1.88 1.97 7 day 2.41 2.35 2.15 1.89 2.02 28 day 2.39 2.33 2.00 1.83 1.93 Bulk Density, g/cm2 1 day 1.49 1.52 1.51 1.51 1.45 7 day 1.51 1.56 1.65 1.62 1.61 28 day 1.55 1.56 1.69 1.68 1.62
According to Table 4-7, little or negligible changes are observed on G both in bulk
and solid density while hydration advances. On the other hand, results show that
GGBFS inclusion in the blends reduces solid density while increases bulk density.
The decrease in the solid density is due to the decreased pore volume in the pastes.
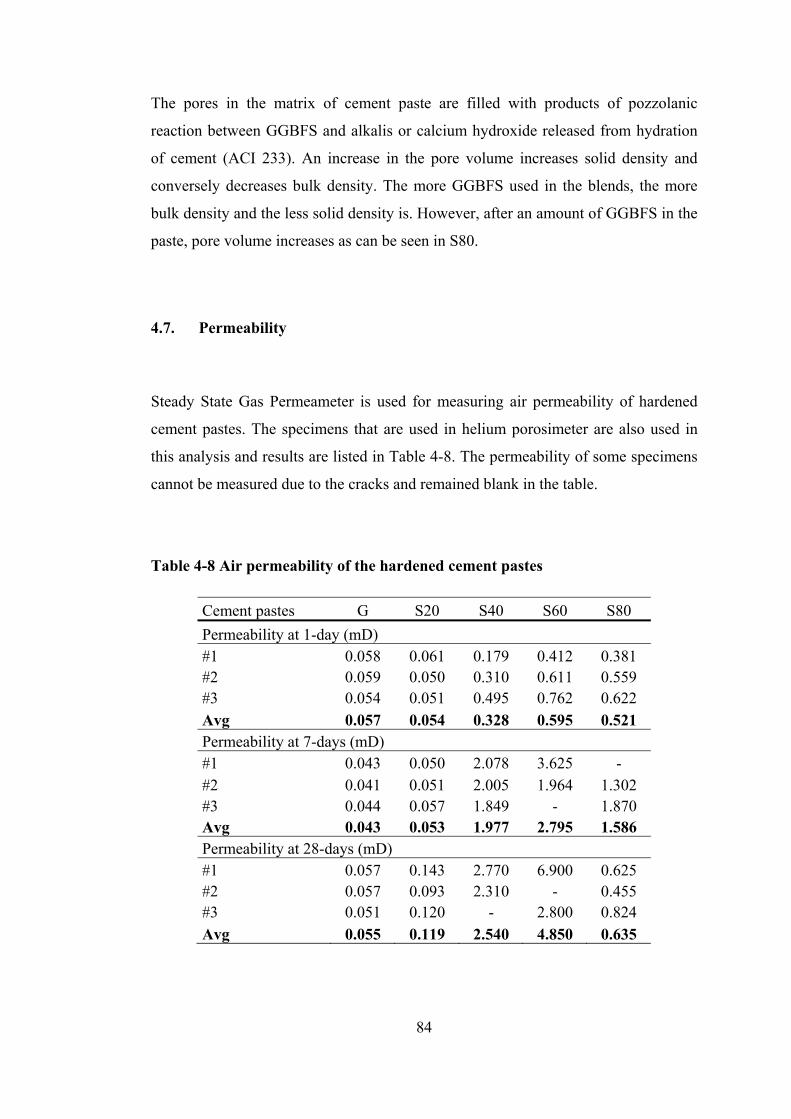
84
The pores in the matrix of cement paste are filled with products of pozzolanic
reaction between GGBFS and alkalis or calcium hydroxide released from hydration
of cement (ACI 233). An increase in the pore volume increases solid density and
conversely decreases bulk density. The more GGBFS used in the blends, the more
bulk density and the less solid density is. However, after an amount of GGBFS in the
paste, pore volume increases as can be seen in S80.
4.7. Permeability
Steady State Gas Permeameter is used for measuring air permeability of hardened
cement pastes. The specimens that are used in helium porosimeter are also used in
this analysis and results are listed in Table 4-8. The permeability of some specimens
cannot be measured due to the cracks and remained blank in the table.
Table 4-8 Air permeability of the hardened cement pastes
Cement pastes G S20 S40 S60 S80 Permeability at 1-day (mD) #1 0.058 0.061 0.179 0.412 0.381 #2 0.059 0.050 0.310 0.611 0.559 #3 0.054 0.051 0.495 0.762 0.622 Avg 0.057 0.054 0.328 0.595 0.521 Permeability at 7-days (mD) #1 0.043 0.050 2.078 3.625 - #2 0.041 0.051 2.005 1.964 1.302 #3 0.044 0.057 1.849 - 1.870 Avg 0.043 0.053 1.977 2.795 1.586 Permeability at 28-days (mD) #1 0.057 0.143 2.770 6.900 0.625 #2 0.057 0.093 2.310 - 0.455 #3 0.051 0.120 - 2.800 0.824 Avg 0.055 0.119 2.540 4.850 0.635
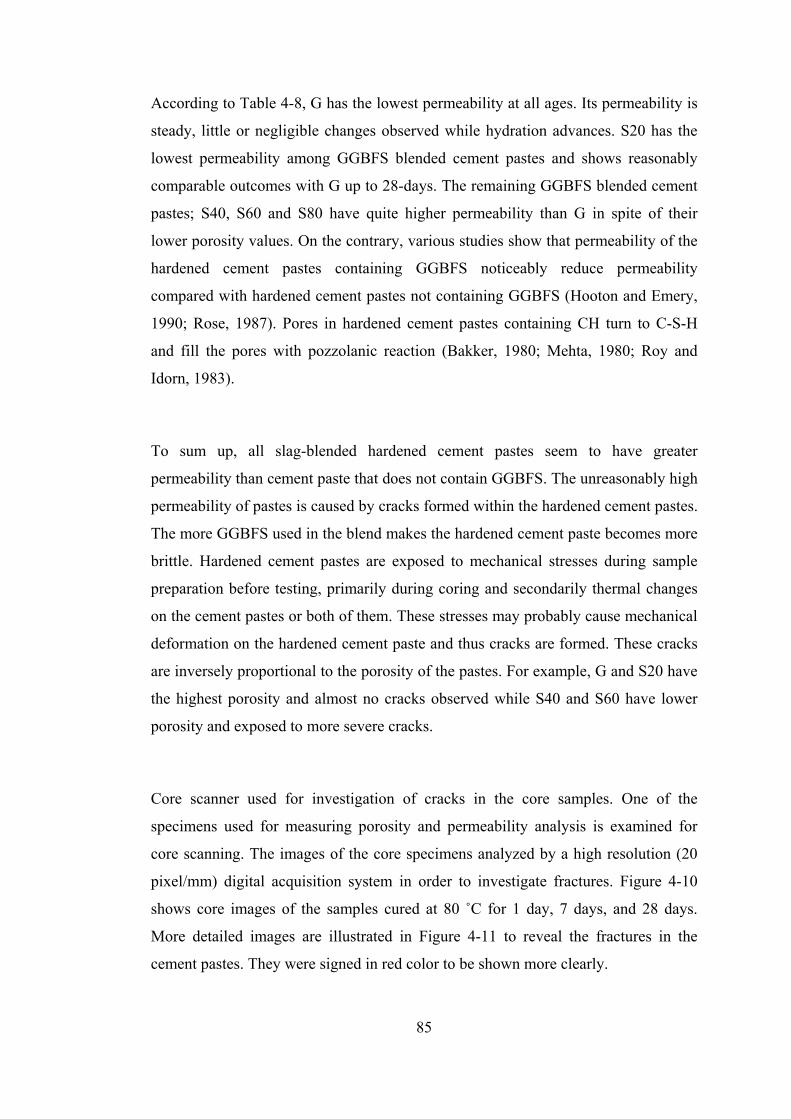
85
According to Table 4-8, G has the lowest permeability at all ages. Its permeability is
steady, little or negligible changes observed while hydration advances. S20 has the
lowest permeability among GGBFS blended cement pastes and shows reasonably
comparable outcomes with G up to 28-days. The remaining GGBFS blended cement
pastes; S40, S60 and S80 have quite higher permeability than G in spite of their
lower porosity values. On the contrary, various studies show that permeability of the
hardened cement pastes containing GGBFS noticeably reduce permeability
compared with hardened cement pastes not containing GGBFS (Hooton and Emery,
1990; Rose, 1987). Pores in hardened cement pastes containing CH turn to C-S-H
and fill the pores with pozzolanic reaction (Bakker, 1980; Mehta, 1980; Roy and
Idorn, 1983).
To sum up, all slag-blended hardened cement pastes seem to have greater
permeability than cement paste that does not contain GGBFS. The unreasonably high
permeability of pastes is caused by cracks formed within the hardened cement pastes.
The more GGBFS used in the blend makes the hardened cement paste becomes more
brittle. Hardened cement pastes are exposed to mechanical stresses during sample
preparation before testing, primarily during coring and secondarily thermal changes
on the cement pastes or both of them. These stresses may probably cause mechanical
deformation on the hardened cement paste and thus cracks are formed. These cracks
are inversely proportional to the porosity of the pastes. For example, G and S20 have
the highest porosity and almost no cracks observed while S40 and S60 have lower
porosity and exposed to more severe cracks.
Core scanner used for investigation of cracks in the core samples. One of the
specimens used for measuring porosity and permeability analysis is examined for
core scanning. The images of the core specimens analyzed by a high resolution (20
pixel/mm) digital acquisition system in order to investigate fractures. Figure 4-10
shows core images of the samples cured at 80 ˚C for 1 day, 7 days, and 28 days.
More detailed images are illustrated in Figure 4-11 to reveal the fractures in the
cement pastes. They were signed in red color to be shown more clearly.
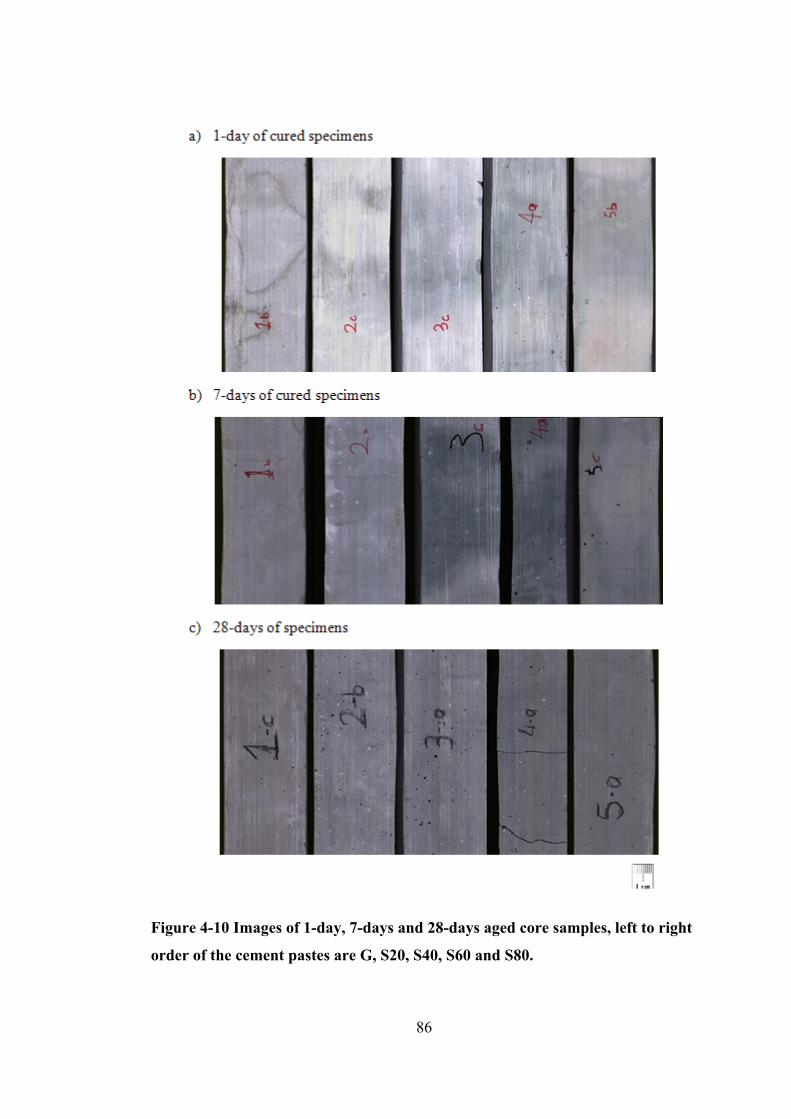
86
Figure 4-10 Images of 1-day, 7-days and 28-days aged core samples, left to right
order of the cement pastes are G, S20, S40, S60 and S80.
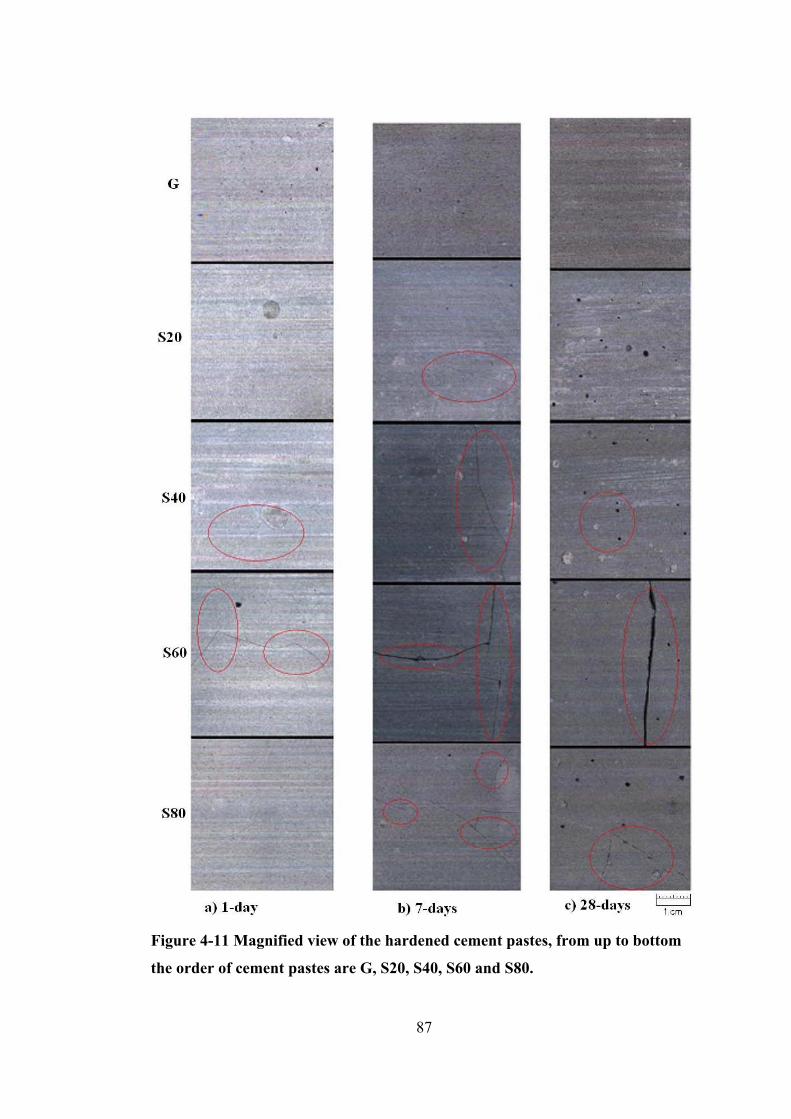
87
Figure 4-11 Magnified view of the hardened cement pastes, from up to bottom
the order of cement pastes are G, S20, S40, S60 and S80.
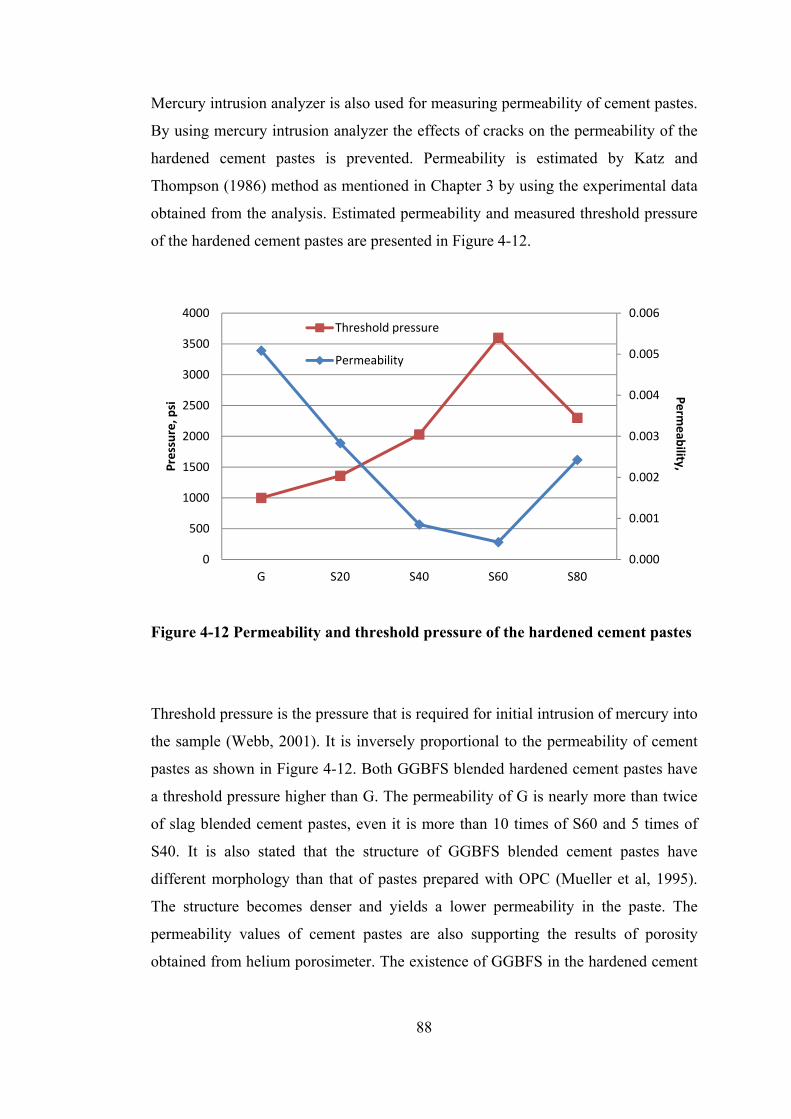
88
Mercury intrusion analyzer is also used for measuring permeability of cement pastes.
By using mercury intrusion analyzer the effects of cracks on the permeability of the
hardened cement pastes is prevented. Permeability is estimated by Katz and
Thompson (1986) method as mentioned in Chapter 3 by using the experimental data
obtained from the analysis. Estimated permeability and measured threshold pressure
of the hardened cement pastes are presented in Figure 4-12.
Figure 4-12 Permeability and threshold pressure of the hardened cement pastes
Threshold pressure is the pressure that is required for initial intrusion of mercury into
the sample (Webb, 2001). It is inversely proportional to the permeability of cement
pastes as shown in Figure 4-12. Both GGBFS blended hardened cement pastes have
a threshold pressure higher than G. The permeability of G is nearly more than twice
of slag blended cement pastes, even it is more than 10 times of S60 and 5 times of
S40. It is also stated that the structure of GGBFS blended cement pastes have
different morphology than that of pastes prepared with OPC (Mueller et al, 1995).
The structure becomes denser and yields a lower permeability in the paste. The
permeability values of cement pastes are also supporting the results of porosity
obtained from helium porosimeter. The existence of GGBFS in the hardened cement
0.000
0.001
0.002
0.003
0.004
0.005
0.006
0
500
1000
1500
2000
2500
3000
3500
4000
G S20 S40 S60 S80
Pressure, psi
Threshold pressure
Permeability
Permeability,
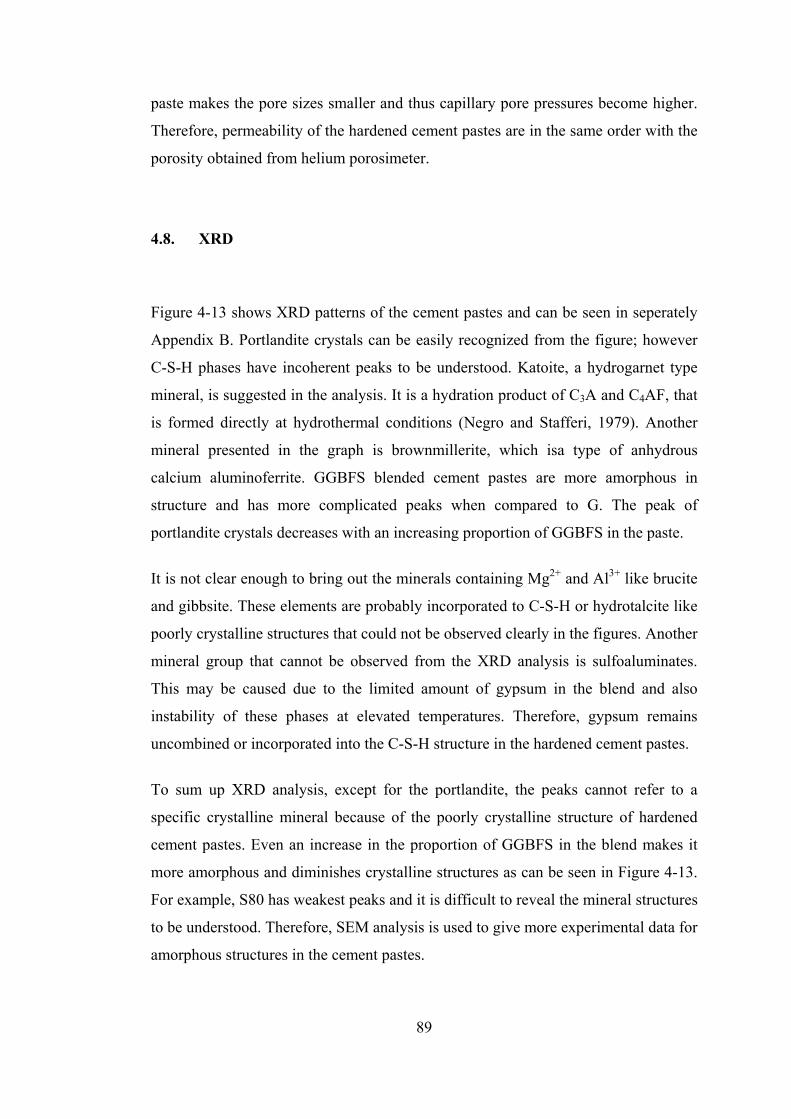
89
paste makes the pore sizes smaller and thus capillary pore pressures become higher.
Therefore, permeability of the hardened cement pastes are in the same order with the
porosity obtained from helium porosimeter.
4.8. XRD
Figure 4-13 shows XRD patterns of the cement pastes and can be seen in seperately
Appendix B. Portlandite crystals can be easily recognized from the figure; however
C-S-H phases have incoherent peaks to be understood. Katoite, a hydrogarnet type
mineral, is suggested in the analysis. It is a hydration product of C3A and C4AF, that
is formed directly at hydrothermal conditions (Negro and Stafferi, 1979). Another
mineral presented in the graph is brownmillerite, which isa type of anhydrous
calcium aluminoferrite. GGBFS blended cement pastes are more amorphous in
structure and has more complicated peaks when compared to G. The peak of
portlandite crystals decreases with an increasing proportion of GGBFS in the paste.
It is not clear enough to bring out the minerals containing Mg2+ and Al3+ like brucite
and gibbsite. These elements are probably incorporated to C-S-H or hydrotalcite like
poorly crystalline structures that could not be observed clearly in the figures. Another
mineral group that cannot be observed from the XRD analysis is sulfoaluminates.
This may be caused due to the limited amount of gypsum in the blend and also
instability of these phases at elevated temperatures. Therefore, gypsum remains
uncombined or incorporated into the C-S-H structure in the hardened cement pastes.
To sum up XRD analysis, except for the portlandite, the peaks cannot refer to a
specific crystalline mineral because of the poorly crystalline structure of hardened
cement pastes. Even an increase in the proportion of GGBFS in the blend makes it
more amorphous and diminishes crystalline structures as can be seen in Figure 4-13.
For example, S80 has weakest peaks and it is difficult to reveal the mineral structures
to be understood. Therefore, SEM analysis is used to give more experimental data for
amorphous structures in the cement pastes.
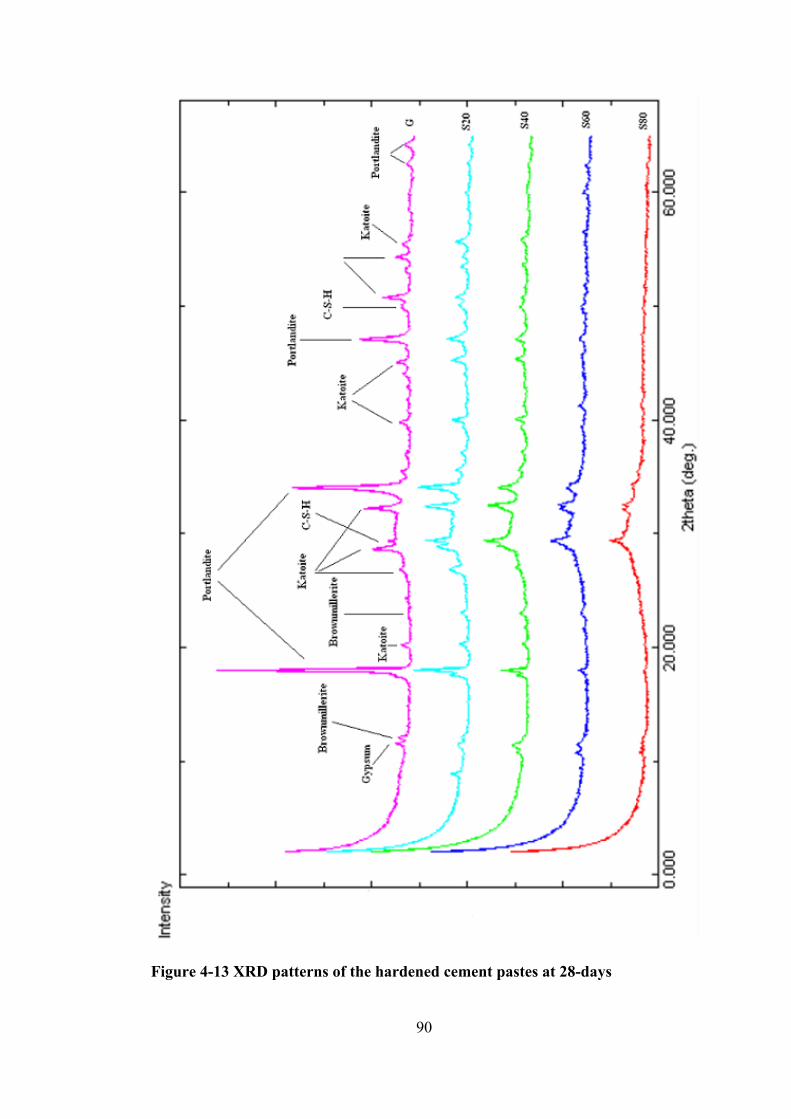
90
Figure 4-13 XRD patterns of the hardened cement pastes at 28-days
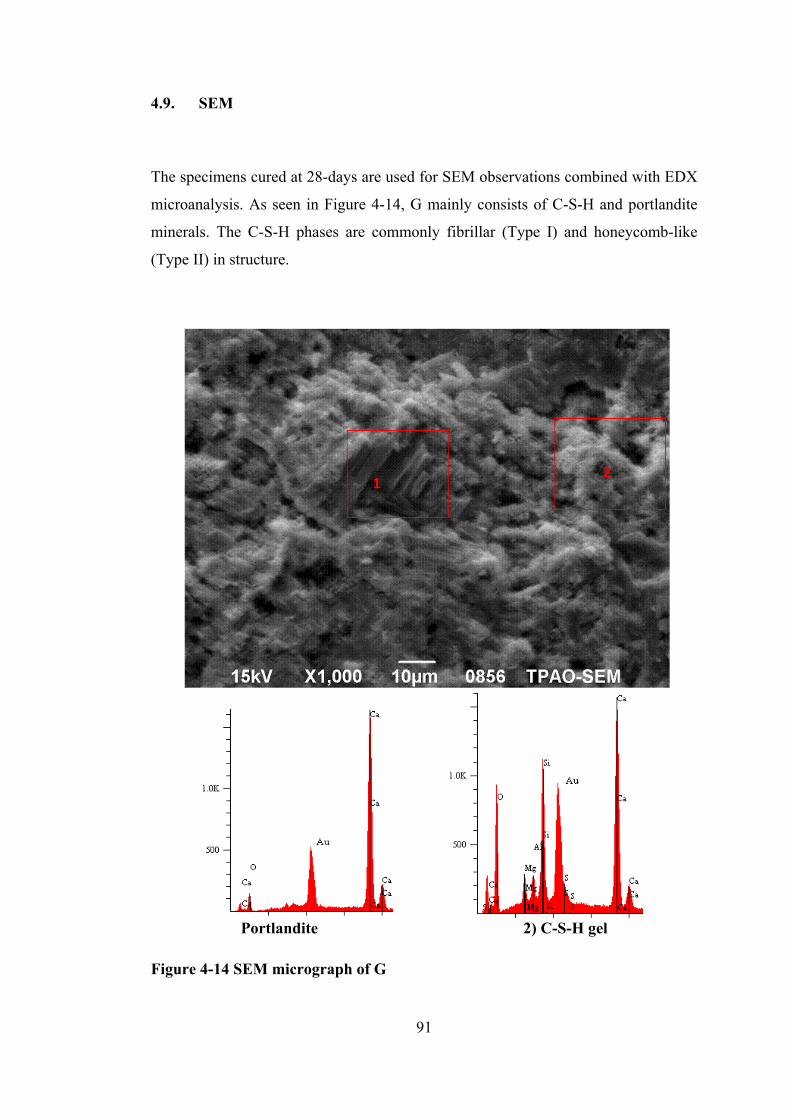
91
4.9. SEM
The specimens cured at 28-days are used for SEM observations combined with EDX
microanalysis. As seen in Figure 4-14, G mainly consists of C-S-H and portlandite
minerals. The C-S-H phases are commonly fibrillar (Type I) and honeycomb-like
(Type II) in structure.
Portlandite 2) C-S-H gel
Figure 4-14 SEM micrograph of G
2 1
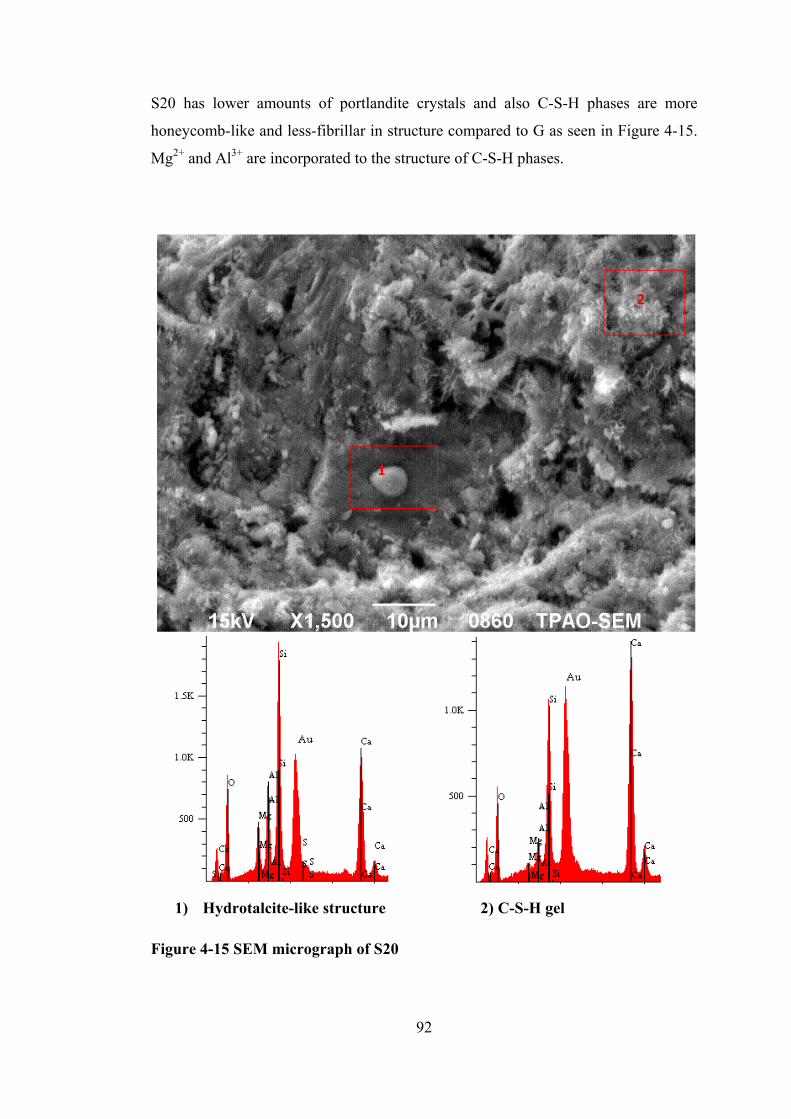
92
S20 has lower amounts of portlandite crystals and also C-S-H phases are more
honeycomb-like and less-fibrillar in structure compared to G as seen in Figure 4-15.
Mg2+ and Al3+ are incorporated to the structure of C-S-H phases.
1) Hydrotalcite-like structure 2) C-S-H gel
Figure 4-15 SEM micrograph of S20
2
1
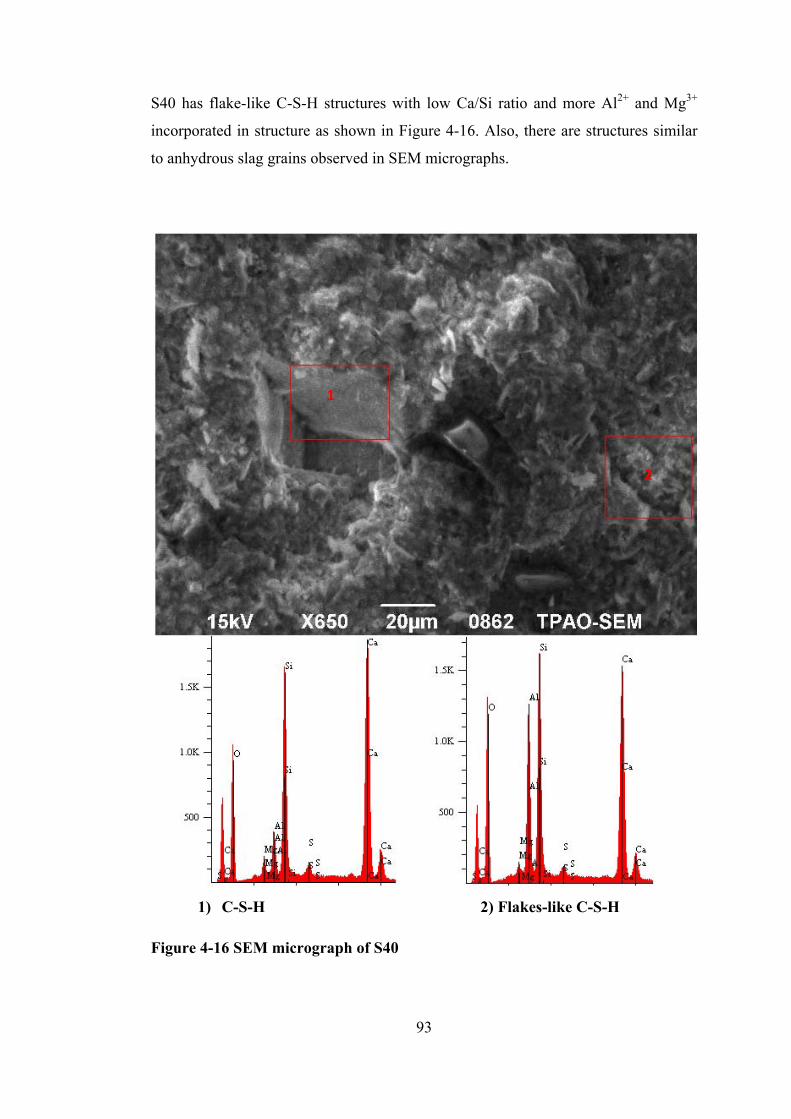
93
S40 has flake-like C-S-H structures with low Ca/Si ratio and more Al2+ and Mg3+
incorporated in structure as shown in Figure 4-16. Also, there are structures similar
to anhydrous slag grains observed in SEM micrographs.
1) C-S-H 2) Flakes-like C-S-H
Figure 4-16 SEM micrograph of S40
2
1
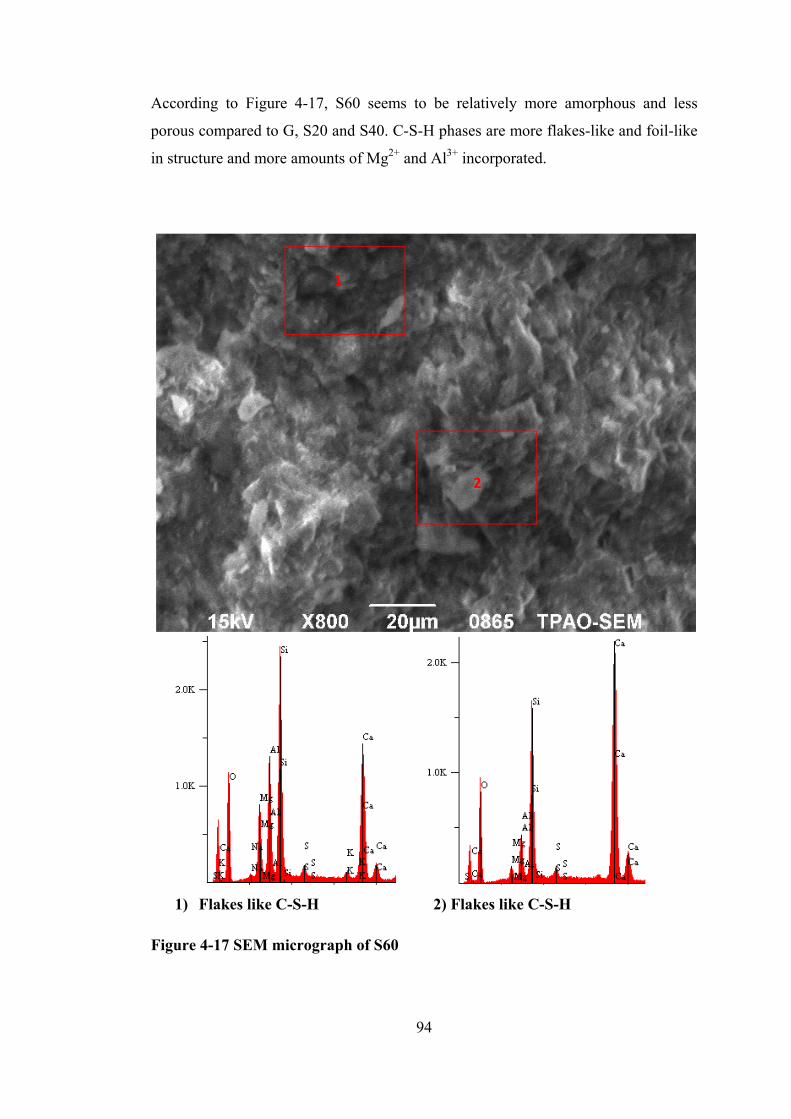
94
According to Figure 4-17, S60 seems to be relatively more amorphous and less
porous compared to G, S20 and S40. C-S-H phases are more flakes-like and foil-like
in structure and more amounts of Mg2+ and Al3+ incorporated.
1) Flakes like C-S-H 2) Flakes like C-S-H
Figure 4-17 SEM micrograph of S60
2
1
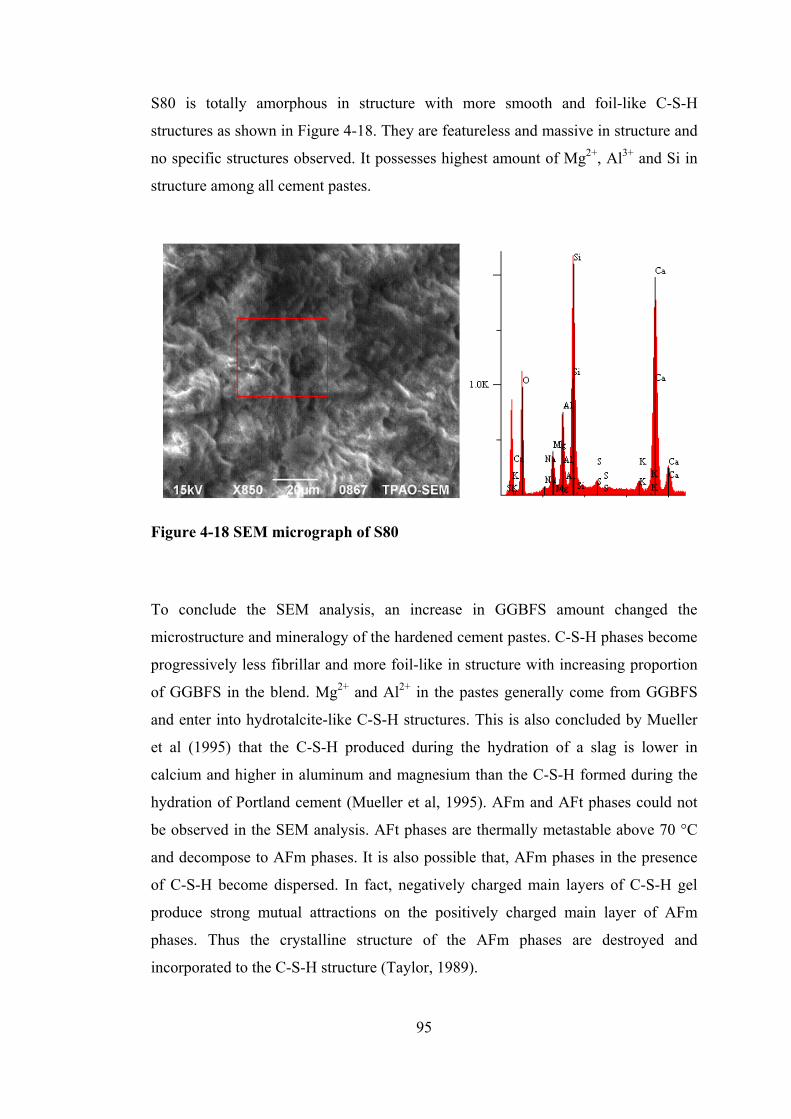
95
S80 is totally amorphous in structure with more smooth and foil-like C-S-H
structures as shown in Figure 4-18. They are featureless and massive in structure and
no specific structures observed. It possesses highest amount of Mg2+, Al3+ and Si in
structure among all cement pastes.
Figure 4-18 SEM micrograph of S80
To conclude the SEM analysis, an increase in GGBFS amount changed the
microstructure and mineralogy of the hardened cement pastes. C-S-H phases become
progressively less fibrillar and more foil-like in structure with increasing proportion
of GGBFS in the blend. Mg2+ and Al2+ in the pastes generally come from GGBFS
and enter into hydrotalcite-like C-S-H structures. This is also concluded by Mueller
et al (1995) that the C-S-H produced during the hydration of a slag is lower in
calcium and higher in aluminum and magnesium than the C-S-H formed during the
hydration of Portland cement (Mueller et al, 1995). AFm and AFt phases could not
be observed in the SEM analysis. AFt phases are thermally metastable above 70 °C
and decompose to AFm phases. It is also possible that, AFm phases in the presence
of C-S-H become dispersed. In fact, negatively charged main layers of C-S-H gel
produce strong mutual attractions on the positively charged main layer of AFm
phases. Thus the crystalline structure of the AFm phases are destroyed and
incorporated to the C-S-H structure (Taylor, 1989).
96
5. CHAPTER 5
CHAPTER 5
CONCLUSIONS
In the free fluid analysis all cement slurries are in the range of required specifications
according to API Specifications 10A. However, GGBFS-CEM I blended cement
slurries expected to be lower than that of neat Class G cement slurry due to their high
Blaine’s fineness value. An increase of GGBFS amount in the blend increases the
fineness of blend and resulting in a reduction of free fluid content among the GGBFS
blended cement slurries. Both particle morphology and chemical composition of
cement and GGBFS has an effect on the free fluid content of cement slurry.
Relatively comparable compressive strength of neat class G cement paste can be
provided by the GGBFS blended cement pastes with same w/c ratio. Intrusion of
GGBFS in the cement paste especially increases the compressive strength at 28-days.
In addition, curing at elevated temperatures favors the compressive strength of
GGBFS blended cement pastes. 20 and 40 percent of GGBFS amount in the paste
shows better compressive strength than neat Class G cement paste at 28-days, while
60 and 80 percent of GGBFS has lower compressive strength at all ages. Among the
GGBFS blended cement pastes, S40 has the optimum compressive strength
development over G.
Compressive strength of the cement pastes at 1-day is also estimated by ultrasonic
cement analyzer (UCA). However, it is far different from destructive test method
(DTM). The differences of compressive strength between cement pastes are
exaggerated. However, the compressive strength of the pastes obtained from UCA is
relatively in the same order with DTM.
97
GGBFS existence in the blend clearly reduces porosity of hardened cement pastes
with the same w/c ratio. All GGBFS blended cement pastes have porosity lower than
neat Class G cement paste at all ages. Hydration products of cement and GGBFS in
the cement paste as a result of pozzolanic reaction filling up the pores and thus
porosity decreases. The decrease of porosity in the cement pastes is more significant
at 28-days due to the slow hydration rate of GGBFS. After an extent amount of CEM
I substitution with GGBFS in the paste, porosity decreases considerably. For
example, the porosity of S40 with 40 percent GGBFS at 28-days is less than half of
G and S60 with 60 percent of GGBFS is less than quarter of G.
The results of air permeability analysis are unconformable with the results obtained
from the helium porosimeter. A reduction in porosity is expected to decrease
permeability of the hardened cement paste. However, GGBFS blended cement pastes
have unacceptably high permeability values in spite of their low porosity. This is
caused due to the uncontrolled fractures on the hardened cement pastes. The fractures
are formed by mechanical stresses on the hardened cement pastes that are thought to
occur primarily during core extraction and secondarily temperature changes on the
specimens during cooling. Generally, the more amounts of GGBFS used in the blend,
the more hardened cement pastes subjected to fractures.
Mercury intrusion analyzer is used for estimating permeability of cement pastes to
prevent from the effects of cracks on the permeability of the hardened cement pastes.
These results of permeability do not conflict with porosity in contrast to the results of
air permeameter. The permeability of G is nearly more than twice of all slag blended
cement pastes, even it is more than 10 times of S60 and 5 times of S40.
The pore sizes of all hardened cement pastes are in the range of 1 µm to 100 µm. The
existence of GGBFS in the paste reduces not only porosity but also the pore sizes.
More than 50 percent of the total pore volume of S40 and S60 are smaller than pore
diameter of 10 µm whereas G and S20 have pore sizes higher than 10 µm.

98
Microstructure of the hardened cement pastes change significantly with the inclusion
of GGBFS in the blend. An increment of GGBFS amount in the blend make the paste
progressively more amorphous in structure and amount of portlandite crystals
decreases. In addition, microstructure of C-S-H becomes less fibrillar and
honeycomb-like but more dense and foil-like in structure.
In order to get adequate hydration for cement paste, the amount of CEM I must be
kept more than GGBFS in the blend to provide sufficient alkalinity. Optimum
amount of GGBFS in the blend is 40 percent to get C/S ratio close to C-S-H
structure. Even small amounts of GGBFS presence in the blend indicates better C/S
ratio compared to the neat Class G cement paste.
GGBFS existence in the blend favors hydration especially at long-term and at
elevated temperatures. However, excessive amounts of utilization of GGBFS in the
blend do not contribute enough to the properties of cement paste. The contribution of
GGBFS hydration improves the physical properties of hardened cement pastes like
compressive strength, porosity and permeability. They are comparable to and under
some conditions more favorable than neat Class G cement paste.
To conclude, 20, 40 and 60 percent of GGBFS replacement in the cement paste has
comparable outcomes against neat Class G cement paste. The cement paste with 20
percent of GGBFS has physical and chemical properties closest to neat Class G
cement paste. However, S60 with 60 percent of GGBFS amount sometimes shows
better and under some conditions worse results compared to G. In the S40 with 40
percent of GGBFS, properties of cement paste are considerably different than G. Its
compressive strength, porosity, permeability, microstructure and chemical properties
are more favorable compared to G.
99
6. CHAPTER 6
CHAPTER 6
RECOMMENDATIONS AND FUTURE STUDIES
6.1. Recommendations
The following recommendations could be made for researchers for future studies.
• The specimens that are used for porosity and permeability analysis are
subjected to fractures. Therefore, cooling and heating rate of the specimens could be
done gradually to prevent fracturing.
• Increased fineness of the CEM I and GGBFS result in difficulties on
preparing cement slurries. Therefore, during slurry preparation dispersants could be
used to get more accurate results.
• In the air permeability analysis, specimens need to be dehydrated to remove
the moisture. However, cement pastes in the oil wells are commonly subjected to
hydrothermal conditions. Therefore, permeability test could be done with water
instead of air to prevent from dehydration of the specimens.
6.2. Future Studies
The following topics could be studied to develop better comprehension of the future
studies on the similar subjects.
100
• In well cementing operations, chemical additives used for designing
properties of fresh and hardened cement pastes. The performance and compatibility
of the chemical additives could be observed on GGBFS blended cement pastes.
• Salts commonly KCl or NaCl are used as an additive in well cementing to
design the properties of fresh and hardened cement pastes or directly come from sea
water used for slurry preperation. The effect of chloride on the properties of GGBFS
blended cement pastes could be investigated.
• The behavior of the cement pastes could be investigated at more elevated
temperatures.
• GGBFS used in this study has an activity grade of 73, even lower than grade
80. Therefore different type of GGBFS with different chemical composition can be
used as experimental material.
• CEM I and GGBFS used in this study have both high fineness and rheological
properties of the GGBFS blended cement pastes are higher than pastes prepared with
neat API class G cement. Therefore, the fineness of the CEM I and GGBFS could be
kept lower for superior rheological properties.
• In addition to GGBFS, fly ash and/or silica fume can be used for preparing
ternary mixes.
• Investigating performance of API Class G and GGBFS blended cement pastes
on sulfate resistance.
• The GGBFS used in this study has a broad range in the blends. As a result of
this study, the range can be taken narrower to discover more accurate amount of
GGBFS in the blend.
• The performance of silica flour and GGBFS as a substitute for cement can be
investigated at temperatures higher than 110 °C.
101
REFERENCES
1. ACI Committee 116R, “Cement and Concrete Terminology”, American Concrete Institute Committee, March, 2000.
2. ACI Committee 232, “Use of Raw or Processed Natural Pozzolans in Concrete”, American Concrete Institute Committee, December, 2000.
3. ACI Committee 233R, “Ground Granulated Blast-Furnace Slag as a Cementitious Constituent in Concrete”, American Concrete Institute Committee, October, 1995.
4. Advanced Cementing Seminar, Halliburton, Dubai, 2011.
5. API Specification 10, “Specification for Materials and Testing for Well Cements”, American Petroleum Institute, January, 1995.
6. API RP 40, “Recommended Practices for Core Analysis”, American Petroleum Institute, February, 1998.
7. Andrew, C. J., Wilkinson, A. P., Luke, K., Funkhouser, G. P., “Class H cement hydration at 180 ˚C and high pressure in the presence of added silica”, Cement and Concrete Research, Volume 38, pp. 660-666, 2008.
8. ANSI/API Specification 10A, “Petroleum and natural gas industries - Cements and materials for well cementing-Part 1: Specification”, American Petroleum Institute, December, 2010.
9. ASTM C125, “Standard Terminology Relating to Concrete and Concrete Aggregates”, American Society for Testing and Materials, December, 2011.
10. ASTM C150, “Specification for Portland cement”, American Society for Testing and Materials, November, 1999.
102
11. ASTM C204, “Standard Test Methods for Fineness of Hydraulic Cement by Air-Permeability Apparatus”, American Society for Testing and Materials, June, 2011.
12. ASTM C219, “Standard Terminology Relating to Hydraulic Cement”, December, American Society for Testing and Materials, 2007.
13. ASTM C595, “Standard Specification for Blended Hydraulic Cements”, January, American Society for Testing and Materials, 2008.
14. ASTM C989, “Specification for Ground Iron Blast-Furnace Slag for Use in Concrete and Mortars”, American Society for Testing and Materials, November, 1999.
15. ASTM D2845, “Standard test method for laboratory determination of pulse velocities and ultrasonic elastic constants of rocks”, American Society for Testing and Materials, 1995.
16. ASTM E 1404-94, “Standard Specification for Laboratory Glass Conical Flasks”, American Society for Testing and Materials, 1994.
17. Bakker, R. F. M., “On the Cause of Increased Resistance of Concrete Made from Blast-Furnace Cement to Alkali Reaction and to Sulfate Corrosion,” Thesis RWTH-Aachen, The Netherlands, 1980.
18. Bakker, R. F. M., “Permeability of Blended Cement Concrete, Fly Ash, Silica Fume, Slag, and Other Mineral By-Products in Concrete”, American Concrete Institute, Detroit, 1983.
19. Barnett, S.J., Soutsot, M. N., Millard, S. G., Bungey, J. H., “Strength development of mortars containing ground granulated blast-furnace slag: Effect of curing temperature and determination of apparent activation energies”, Cement and Concrete Research, Volume 36, pp 434 - 440, 2006.
20. Bensted, J., “Special Cements”, in Lea’s chemistry of cement and concrete, 4th edition, Arnold, London, U.K., 2004.
103
21. Bogue, R. H., Portland Cement, Portland Cement Association Fellowship Paper #53, National Bureau of Standards, Washington, 1949.
22. Brown, P.W., Journal of American Ceramic Society 70, p.487 1987.
23. Chatterji S., Jeffrey J. W., “Studies of Early Stages of Paste Hydration of Cement Compounds, I”, Journal of the American Ceramic Society, Volume 45, pp. 536-543, 1962.
24. Chen, W., “Hydration of Slag Cement Theory, Modeling and Application”, PrintPartners Ipskamp BV, Enschede, 2006.
25. Cheron, M., Lardinois, C., “Proceedings of the 5th International Congress on the Chemistry of Cement”, Volume 4, pp 277–285, Tokyo, 1968.
26. Damidot, D., Nonat, A., “C3S hydration in diluted and stirred suspensions: (I) study of the two kinetic steps”, Advances in Cement Research, Volume 6, Issue 21, 1994.
27. Day, R. L., The effect of secondary etringite formation on the durability of concrete: Literature analyses, Portland cement Association, Illinois, USA, 1992.
28. Diamond, S., in Hydraulic Cement Pastes: Their Structure and Properties, Cement Paste Microstructure – An Overview at Several Levels, Cement and Concrete Association, UK, 1976.
29. W. J. Dixon, F. J. Massey, Introduction to statistical analysis, Mcgraw-Hill, 1957
30. Domone, P, Illstone, J., Construction Materials: Their nature and behavior, 4th edition, Spon Press, New York, 2010.
31. EN 197-1, ‟Cement-Part 1: Compositions and conformity criteria for common cements”, European Standards, June, 2000.
32. EN 15167-1, “Ground granulated blast furnace slag for use in concrete, mortar and grout. Definitions, specifications and conformity criteria.”, European Standards, October, 2006.
104
33. Erdoğan T. Y., “Admixtures for Concrete”, Middle East Technical University Press, Ankara, 1997.
34. Escalante, J. I., Gomez, L. Y., Johal, K. K., Mendoza, G., Mancha, H, Mendez, J., “Reactivity of blast-furnace slag in Portland cement blends hydrated under different conditions”, Cement and Concrete Research, Volume 31, pp. 1403-1409, 2001.
35. Fajgelj A., Ambrus A., Principles and practices of method validation, The Royal Society of Chemistry, 2000.
36. Feldman, R., “Pore structure, permeability and diffusivity as related to durability”, 8th International Congress on the Chemistry of Cement, pp. 336-356, Brazil, 1986.
37. Frigione G., “ Manufacture and characteristics of portland blast furnace slag cements”, ASTM STP 897, American Society for Testing and Materials, Philadelphia, pp. 15-28, 1986.
38. Fulton, F. S., “The Properties of Portland Cement Containing Milled Granulated Blast-Furnace Slag,” Portland Cement Institute, pp. 4-46, Johannesburg, 1974.
39. Galibert, R., “Glass Content Influence upon Hydraulic Potential of Blast-Furnace Slag”, National Slag Association Publications, 1984.
40. Gollop, R. S., Taylor, H. F. W., “Microstructural and Microanalytical studies of sulfate attack. IV. Reactions of a slag cement paste with sodium and magnesium sulfate solutions”, Cement and Concrete Research, Volume 6, pp 1013-1029, 1996.
41. Harrison, A. M., Winter, N. B., Taylor, H. F. W., Microstructure and microchemistry of slag cement pastes, Materials Research Society Symposia Proceedings, 1987.
42. Hewlett P. C., Lea’s Chemistry of Cement and Concrete, Elsevier Ltd., United Kingdom, 2004.
43. Hinrichs, W., Odler, I., “Investigations on the hydration of Portland blast furnace slag cement”, Advances in Cement Research, Volume 2, pp. 9-13, 1989.
105
44. Hogan, F. J., Meusel, J. W., “Evaluation for Durability and Strength Development of a Ground Granulated Blast- Furnace Slag,” Cement, Concrete and Aggregates, Volume 3, pp. 40-52, 1981.
45. Hooton, R. D., Emery, J. J., “Sulfate Resistance of a Canadian Slag,” ACI Materials Journal, Volume 87, pp. 547-555, 1990.
46. Hooton, R. D., Boyd, A. J., Bhadkamkar, D., “Effect of Cement Fineness and C3S Content on Properties of Concrete: A Literature Review”, Portland Cement Association, PCA R&D Serial No. 2871, 2005.
47. Hwang, C. L., Lin C.Y., Proceedings of 2nd International Conference on the Use of Fly Ash, Silica Fume, Slag, and Natural Pozzolans in Concrete, pp. 1323–1340, Madrid, 1986.
48. Jackson, P. J., Portland cement: Classification and Manufacture, in P. Hewlett (ed.), Lea’s chemistry of cement and concrete, 4th edition, London, 2004.
49. Jawed, I., Skalny, J.,”Alkalies in cement: A review: II. Effects of alkalies on hydration and performance of Portland cement”, Cement and Concrete Research, Volume 8, pp. 37-51, 1978.
50. Kalousek, G. L,, “Sulfoaluminates of calcium as stable and metastable phases”, PhD thesis, University of Maryland, 1941.
51. Kalousek, G.L., “Analyzing SO3-bearing phases in hydrating cement”, Materials. Research and Standards, Volume 6, pp. 292-304,1965.
52. Katz, A.J. and Thompson A.H., “A Quantitative Prediction of Permeability in Porous rock”, Phys. Rev. B, 1986.
53. Katz A.J. and Thompson A.H., “Prediction of Rock Electrical Conductivity From Mercury Injection Measurements”, Journal of Geophysical Research, Vol. 92, No. B1, Pages 599-607, January, 1987.
54. Keil, F., Slag cements, Proceedings of the Third International Symposium on the Chemistry of Cements, Cement and Concrete Association, pp. 530–571, London, 1952.
106
55. Kelly, R., Solid-liquid reactions Part 2: Solid-liquid reactions amongst the calcium aluminates and sulphoaluminates, Canadian Journal of Chemistry, Volume 38, pp. 1209-1226, 1960.
56. Klemm, W.A., Adams, L.D., “Investigation of the formation of carboaluminates”, ASTM Special Technical Publications, 1990.
57. Klieger, P. and Isberner, A. W., “Laboratory Studies of Blended Cement-Portland Blast-Furnace Slag Cements,” PCA Research and Development Department Laboratories, Volume 9, No. 3, September, 1967.
58. Kondo. R., Oshawa S., “Studies on method to determine the amount of GGBF slag and rate of hydration in cements,” Proceedings of the 5th International Symposium on the Chemistry of Cement, Tokyo, 1968.
59. Krautkramer, J., Krautkramer, H., Ultrasonic Testing of Materials, Springer-Verlag, 1983.
60. Labahn, O., Cement Engineers’ Handbook, Bauverlag, Berlin, 1983.
61. Lawrence, C. D., The Constitution and Specification of Portland cements, in P. Hewlett (ed.), Lea’s chemistry of cement and concrete, 4th edn, Arnold, London, U.K., 2004.
62. Lea, F. M., The Chemistry of Cement and Concrete, 3rd edition, Chemical Publishing Co., New York, 1971.
63. Lee, A. R., Blast Furnace and Steel Slag, Halsted Press, New York, 1974.
64. Lewis, D., “History of slag cements”, Slag Cement Seminar, Alabama, 1981.
65. Locher, F. W., “The Problem of the Sulfate Resistance of Slag Cements”, Zement-Kalk-Gips, Volume 19, pp. 395-401, Bauverlag, 1966.
66. Lottenbach, B., Matschei, T., Möshner, G., Glasser F. P., “Thermodynamic modeling of the effect of temperature on the hydration and porosity of Portland cement”, Cement and Concrete Research, Volume 38, pp. 1-18, 2008.
107
67. Lumley, J. S., Gallop, R. S., Moir, G. K., Taylor, H. F. W., “Degrees of reaction of slag in some blends with Portland cements”, Cement and Concrete Research, Volume 26, pp. 139-151, 1996.
68. McGarl, H. N., Eggleton, H. K., Barton, W. R., Aggregates – Slag, in Industrial Minerals and Rocks, 1994.
69. Mehta, P. Kumar, “Durability of Concrete in Marine Environment—A Review,” Performance of Concrete in Marine Environment, SP-65, American Concrete Institute, pp. 1-20, Detroit, 1980.
70. Mehta, P. K., Monteiro, P. J. M., Concrete Microstructure, Properties, and Materials, McGraw-Hill Companies, USA, 2006.
71. Meusel, J. W., Rose, J. H., “Production of Granulated Blast Furnace Slag at Sparrows Point, and the Workability and Strength Potential of Concrete Incorporating the Slag,” Fly Ash, Silica Fume, Slag and Other Mineral By-Products in Concrete, SP-79, American Concrete Institute, pp. 867-890, Detroit, 1983.
72. Mindess, S., Young, J. F., Concrete, Prentice-Hall Inc., Englewood Cliffs, NJ, U.S., 1981
73. Micheline M., Micheline, R., Cements Made from Blast Furnace Slag, in P. Hewlett (ed.), Lea’s chemistry of cement and concrete, 4th edition, Arnold, London, U.K., 2004.
74. Mueller, D. T., Gino, D., Hibbeler, J., Kelly, P., BJ Services, “Portland Cement – Blast Furnace Slag Blends in Oilwell Cementing Applications”, SPE Annual Technical Conference and Exhibition, Dallas, 1995.
75. Muller, C., “Ground Granulated Blast Furnace Slag (GGBFS) as a concrete additive”, The Federal Association of the German Ready-Mixed Concrete Industry, Düsseldorf, 2007.
76. Negro, A., Stafferi, N., “The hydration of calcium ferrites and calcium aluminoferrites”, Zement-Kalk-Gips, Volume 32, pp 83-88, 1979.

108
77. Nelson, E. B., “Portland Cements Characterized, Evaluated,” Oil and Gas Journal, pp 73-77. 1983.
78. Nelson, E. B., Well Cementing, Sclumberger Educational Services, Texas, 1990.
79. Nelson, E. B., Guillot, D., Well Cementing, Second Edition, Sclumberger, Texas, 2006.
80. Neville A. M., Properties of Concrete, Fourth Edition, Pearson Education Limited, England, 2003.
81. NSA, National Slag Association, http://www.nationalslag.org/blastfurnace.htm, last accessed date 09.03.2012.
82. Odler, I., Hydration, setting and hardening of portland cement, in P. Hewlett (ed.), Lea’s chemistry of cement and concrete, 4th edition, Arnold, London, U.K., 2004.
83. Odler, I., Special Inorganic Cements, Modern Concrete Technology Series, London, 2000.
84. Olorunsogo, F.T., “Particle size distribution of GGBS and bleeding characteristics of slag cement mortars”, Cement and Concrete Research, Volume 28, pp. 907 – 919, 1998.
85. Olorunsogo, F.T., Wainwright P. J., “Effect of GGBF Particle-size Distribution on Mortar Compressive Strength”, Journal of Materials in Civil Engineering, pp. 180 - 187, USA, 1998.
86. Pal, S. C., Mukherjee A., Pathak S. R., “Investigation of hydraulic activity of ground granulated blast furnace slag in concrete”, Cement and Concrete Research, Volume 33, pp 1481–1486, 2003.
87. Pandey S.P., Sharma R.L., “The influence of mineral additives on the strength and porosity of OPC mortar”, Cement and Concrete Research, Volume 30, pp. 19-23, 2000.
109
88. Powers, T.C., Brownyard, T.L. Studies of the Physical Properties of Hardened Portland Cement Paste, Portland Cement Association, Chicago, 1948.
89. Richardson, I. G., Groves, G. W., “Microstructure and microanalysis of hardened ordinary Portland cement pastes involving ground granulated blast-furnace slag”, Journal of Material Science, Volume 27, pp. 6204-6212, 1992.
90. Richardson, J. M., Biernacki, J. J., Stutzman, P. E., Bentz, D. P., “Stoichiometry of Slag Hydration with Calcium Hydroxide”, Journal of the American Ceramic Society, Volume 85, No. 4, pp 947-953, 2002.
91. Robeyst, N., Gruyaert, E., Grosse, C. U., Belie, N. D., “Monitoring the setting of concrete containing blast-furnace slag measuring the ultrasonic p-wave velocity” Cement and Concrete Research, Volume 38, pp. 1169-1176, 2008.
92. Rogers, M. J., Dillenbeck, R. L., Eid, R. N., BJ Services Company, “Transition Time of Cement Slurries, Definitions and Misconceptions, Related to Annular Fluid Migration”, SPE Annual Technical Conference and Exhibition, Society of Petroleum Engineers, Houston, 2004.
93. Rose, J. H., “The Effects of Cementitious Blast-Furnace Slag on Chloride Permeability of Concrete,” Corrosion, Concrete, and Chlorides, V. M. Malhotra, Ed., SP-102, American Concrete Institute, pp. 107-125, Detroit, 1987.
94. Roy, D. M., Idorn, G. M., “Hydration, Structure, and Properties of Blast Furnace Slag Cements, Mortars, and Concrete,” Proceedings, ACI JOURNAL V. 79, No.6, pp. 445-457, 1983.
95. Satarin, V. I., “Slag Portland cement”, Proceeding of the 6th International Congres on the Chemistry of Cement, Principal Paper, pp 1-55, Moscow, 1974.
96. Schröder, F., “Blastfurnace slag and slag cements”, Proceedings of the 5th International Congress on the Chemistry of Cement, Tokyo, 1968.
97. Schwiete, H. E., Dolbor, F., “The effect of cooling conditions and the chemical composition on the hydraulic properties of the haematitic slags”, Forschungsbericht des Landes, pp. 23– 29, 1963.
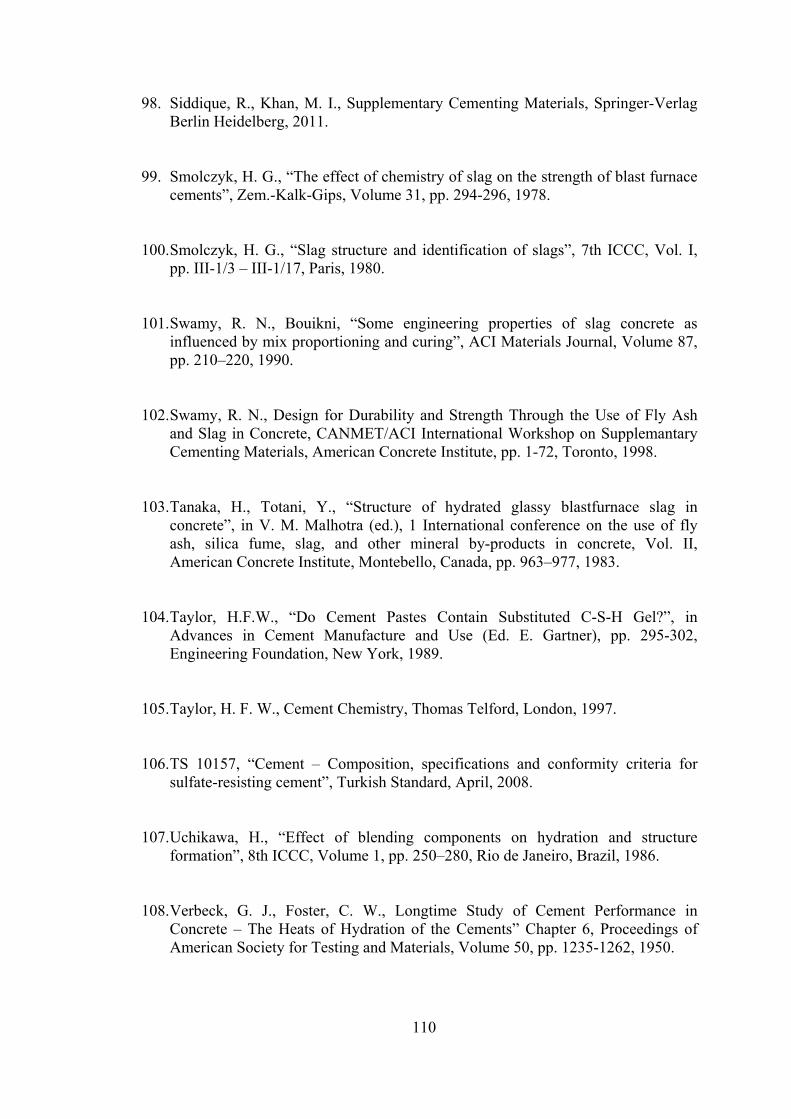
110
98. Siddique, R., Khan, M. I., Supplementary Cementing Materials, Springer-Verlag Berlin Heidelberg, 2011.
99. Smolczyk, H. G., “The effect of chemistry of slag on the strength of blast furnace cements”, Zem.-Kalk-Gips, Volume 31, pp. 294-296, 1978.
100. Smolczyk, H. G., “Slag structure and identification of slags”, 7th ICCC, Vol. I, pp. III-1/3 – III-1/17, Paris, 1980.
101. Swamy, R. N., Bouikni, “Some engineering properties of slag concrete as influenced by mix proportioning and curing”, ACI Materials Journal, Volume 87, pp. 210–220, 1990.
102. Swamy, R. N., Design for Durability and Strength Through the Use of Fly Ash and Slag in Concrete, CANMET/ACI International Workshop on Supplemantary Cementing Materials, American Concrete Institute, pp. 1-72, Toronto, 1998.
103. Tanaka, H., Totani, Y., “Structure of hydrated glassy blastfurnace slag in concrete”, in V. M. Malhotra (ed.), 1 International conference on the use of fly ash, silica fume, slag, and other mineral by-products in concrete, Vol. II, American Concrete Institute, Montebello, Canada, pp. 963–977, 1983.
104. Taylor, H.F.W., “Do Cement Pastes Contain Substituted C-S-H Gel?”, in Advances in Cement Manufacture and Use (Ed. E. Gartner), pp. 295-302, Engineering Foundation, New York, 1989.
105. Taylor, H. F. W., Cement Chemistry, Thomas Telford, London, 1997.
106. TS 10157, “Cement – Composition, specifications and conformity criteria for sulfate-resisting cement”, Turkish Standard, April, 2008.
107. Uchikawa, H., “Effect of blending components on hydration and structure formation”, 8th ICCC, Volume 1, pp. 250–280, Rio de Janeiro, Brazil, 1986.
108. Verbeck, G. J., Foster, C. W., Longtime Study of Cement Performance in Concrete – The Heats of Hydration of the Cements” Chapter 6, Proceedings of American Society for Testing and Materials, Volume 50, pp. 1235-1262, 1950.

111
109. Wainwright, P.J., Ait-Aider, H., “The influence of cement source and slag additions on the bleeding of concrete”, Cement and Concrete Research, Volume 25, pp. 1445–1456, 1995.
110. Wainwright, P.J., Rey, N., “The influence of ground granulated blast furnace slag (GGBS) additions and time delay on the bleeding of concrete”, Cement and Concrete Composites, Volume 22, pp. 253–257, 2000.
111. Webb, P. A., An Introduction To The Physical Characterization of Materials by Mercury Intrusion Porosimetry with Emphasis On Reduction And Presentation of Experimental Data, Micromeritics Instrument Corp., Georgia, 2001.
112. Wood, K, “Twenty Years of Experience with Slag Cement”, Symposium on Slag Cement, University of Alabama, Birmingham, 1981.
113. Wood, S. L., “Evaluation of the Long-Term Properties of Concrete,” RD102, Portland Cement Association, pp. 14-15, 1992.
114. World Oil, Special Focus: Outlook 2007 Worldwide Drilling, in World Oil Magazine, Vol. 228, Houston, 2007.
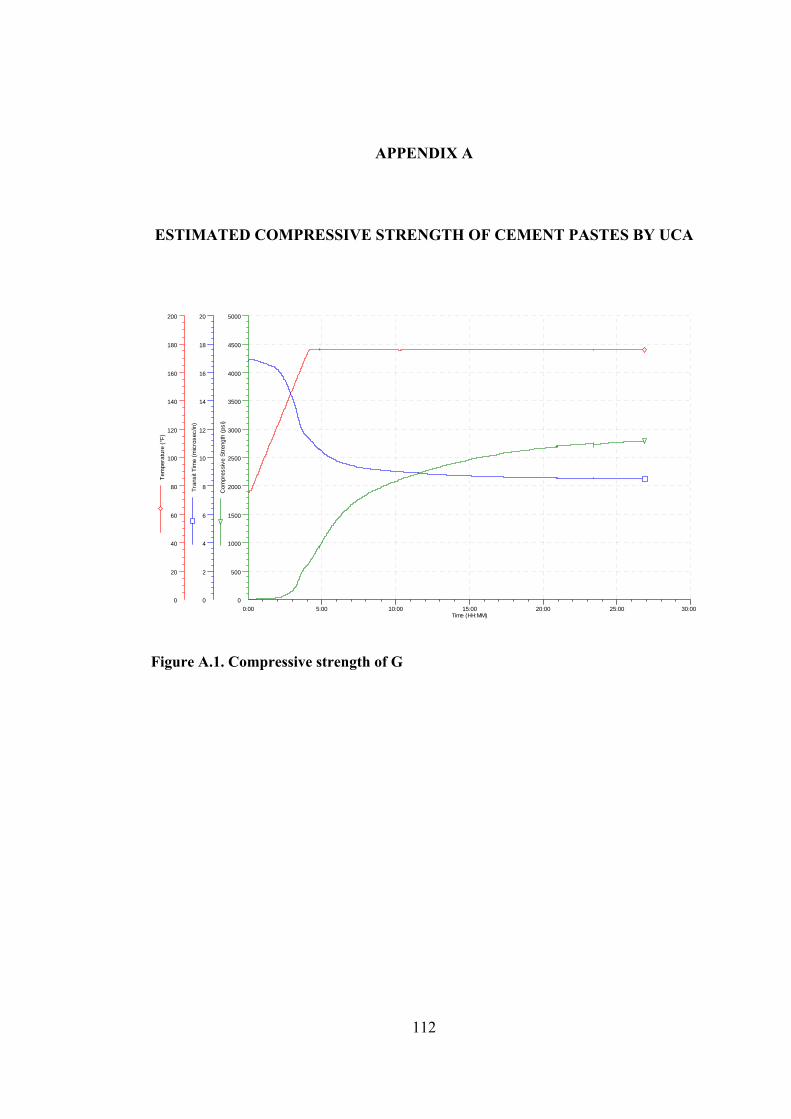
112
APPENDIX A
ESTIMATED COMPRESSIVE STRENGTH OF CEMENT PASTES BY UCA
Figure A.1. Compressive strength of G
0:00 5:00 10:00 15:00 20:00 25:00 30:00Time (HH:MM)
0
20
40
60
80
100
120
140
160
180
200
Tem
pera
ture
(°F)
0
2
4
6
8
10
12
14
16
18
20
Tran
sit T
ime
(mic
rose
c/in
)
0
500
1000
1500
2000
2500
3000
3500
4000
4500
5000
Com
pres
sive
Stre
ngth
(psi
)
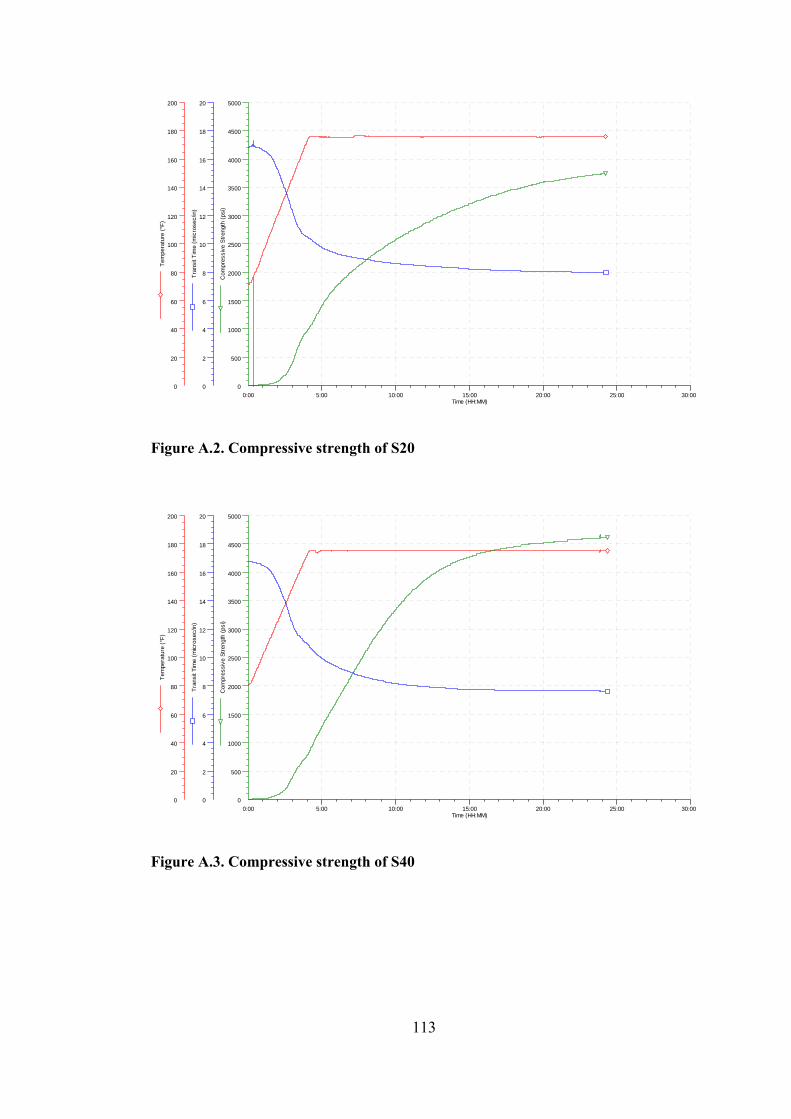
113
Figure A.2. Compressive strength of S20
Figure A.3. Compressive strength of S40
0:00 5:00 10:00 15:00 20:00 25:00 30:00Time (HH:MM)
0
20
40
60
80
100
120
140
160
180
200
Tem
pera
ture
(°F)
0
2
4
6
8
10
12
14
16
18
20
Tran
sit T
ime
(mic
rose
c/in
)
0
500
1000
1500
2000
2500
3000
3500
4000
4500
5000
Com
pres
sive
Stre
ngth
(psi
)
0:00 5:00 10:00 15:00 20:00 25:00 30:00Time (HH:MM)
0
20
40
60
80
100
120
140
160
180
200
Tem
pera
ture
(°F)
0
2
4
6
8
10
12
14
16
18
20
Tran
sit T
ime
(mic
rose
c/in
)
0
500
1000
1500
2000
2500
3000
3500
4000
4500
5000
Com
pres
sive
Stre
ngth
(psi
)
114
Figure A.4. Compressive strength of S60
Figure A.5. Compressive strength of S80
0:00 5:00 10:00 15:00 20:00 25:00 30:00Time (HH:MM)
0
20
40
60
80
100
120
140
160
180
200
Tem
pera
ture
(°F)
0
2
4
6
8
10
12
14
16
18
20
Tran
sit T
ime
(mic
rose
c/in
)
0
500
1000
1500
2000
2500
3000
3500
4000
4500
5000
Com
pres
sive
Stre
ngth
(psi
)
0:00 5:00 10:00 15:00 20:00 25:00 30:00Time (HH:MM)
0
20
40
60
80
100
120
140
160
180
200
Tem
pera
ture
(°F)
0
2
4
6
8
10
12
14
16
18
20
Tran
sit T
ime
(mic
rose
c/in
)
0
500
1000
1500
2000
2500
3000
3500
4000
4500
5000
Com
pres
sive
Stre
ngth
(psi
)
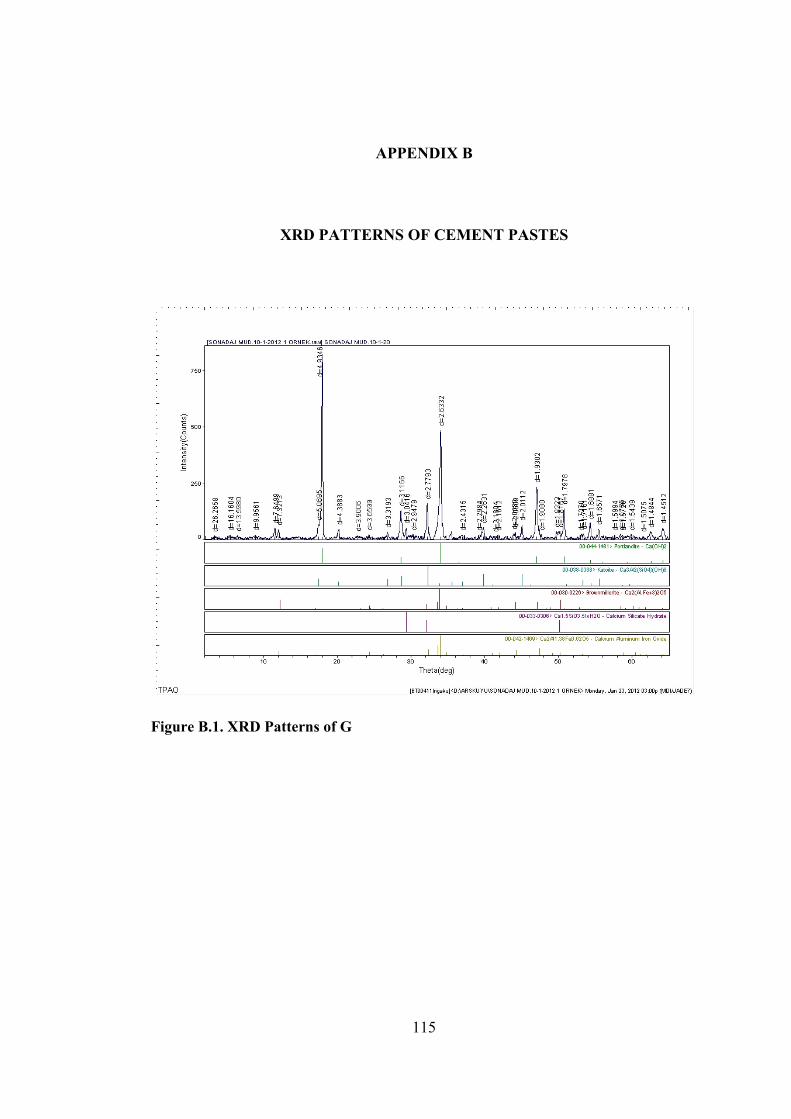
115
APPENDIX B
XRD PATTERNS OF CEMENT PASTES
Figure B.1. XRD Patterns of G
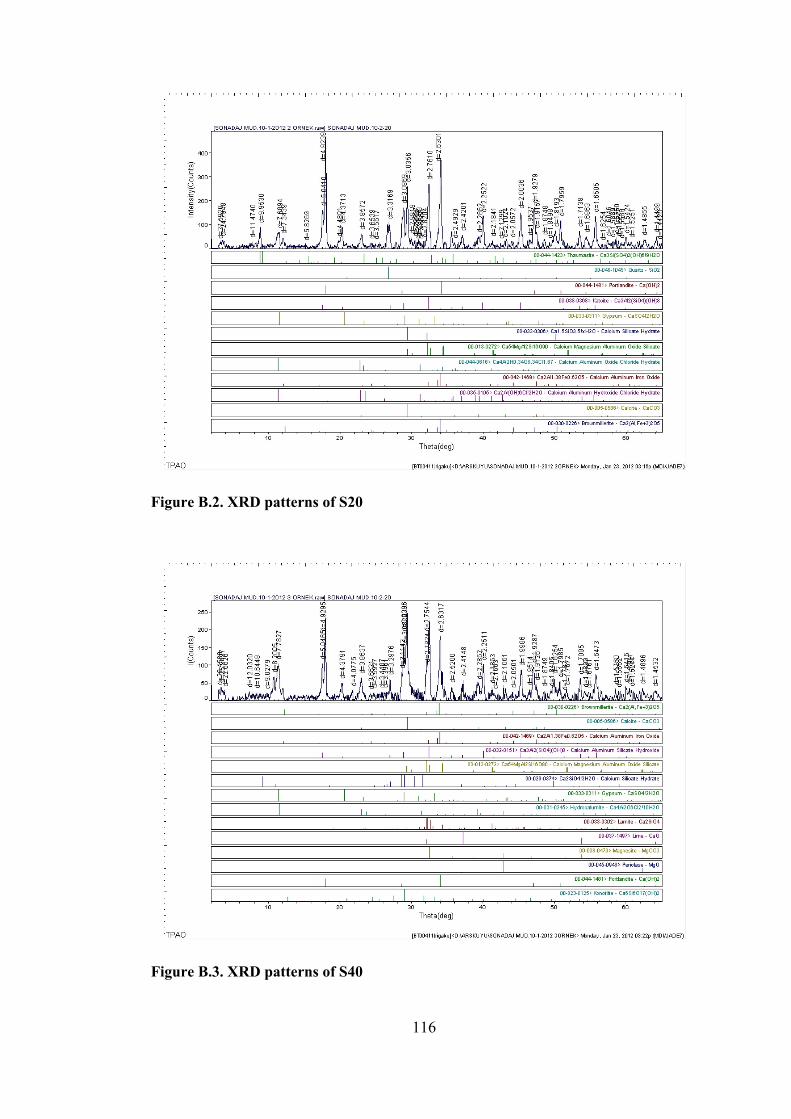
116
Figure B.2. XRD patterns of S20
Figure B.3. XRD patterns of S40
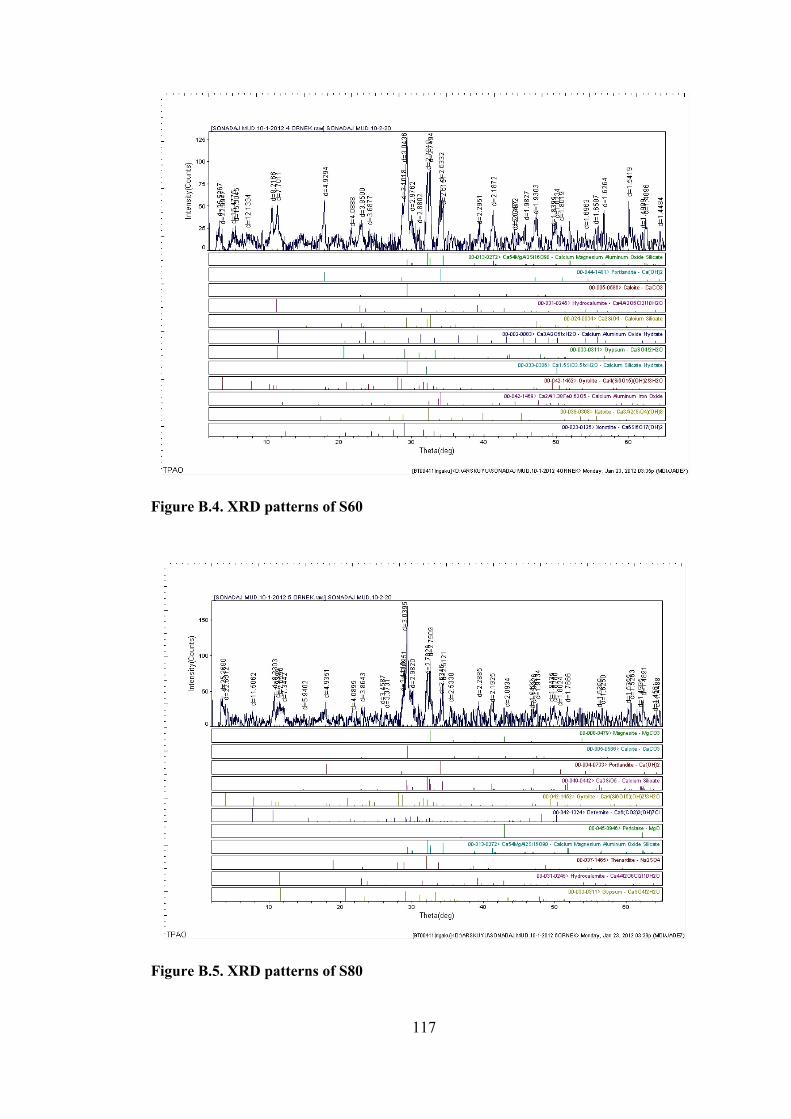
117
Figure B.4. XRD patterns of S60
Figure B.5. XRD patterns of S80
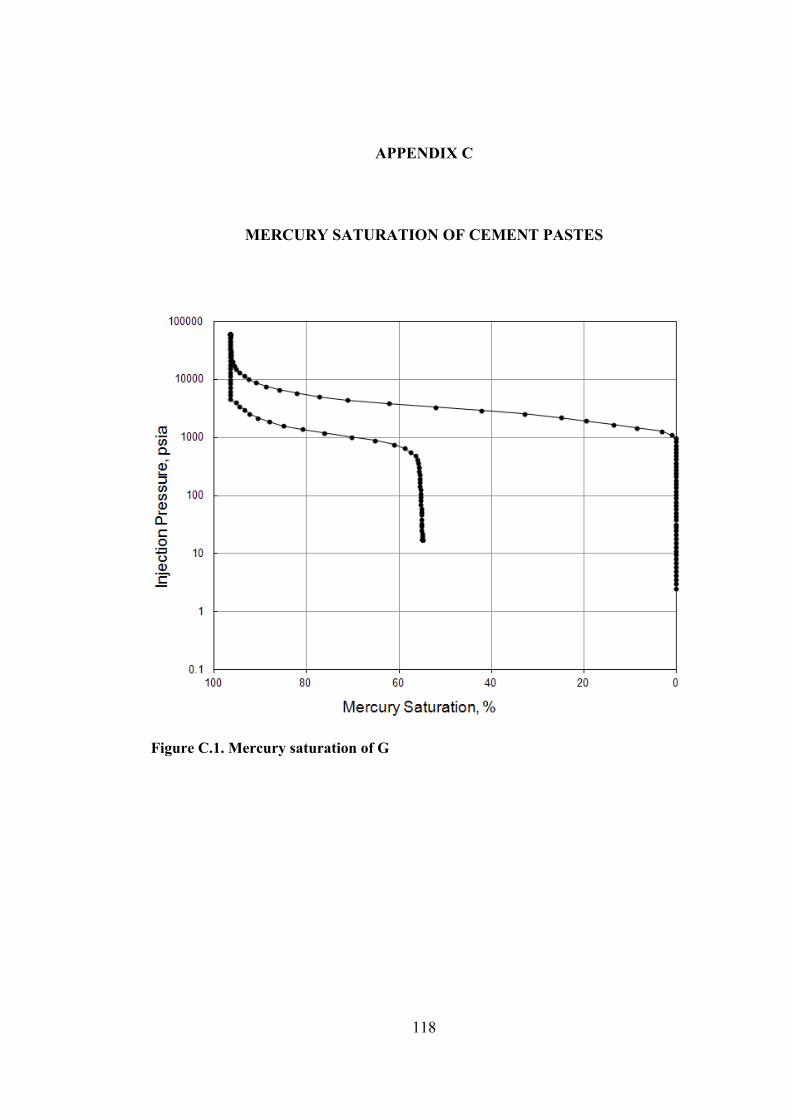
118
APPENDIX C
MERCURY SATURATION OF CEMENT PASTES
Figure C.1. Mercury saturation of G
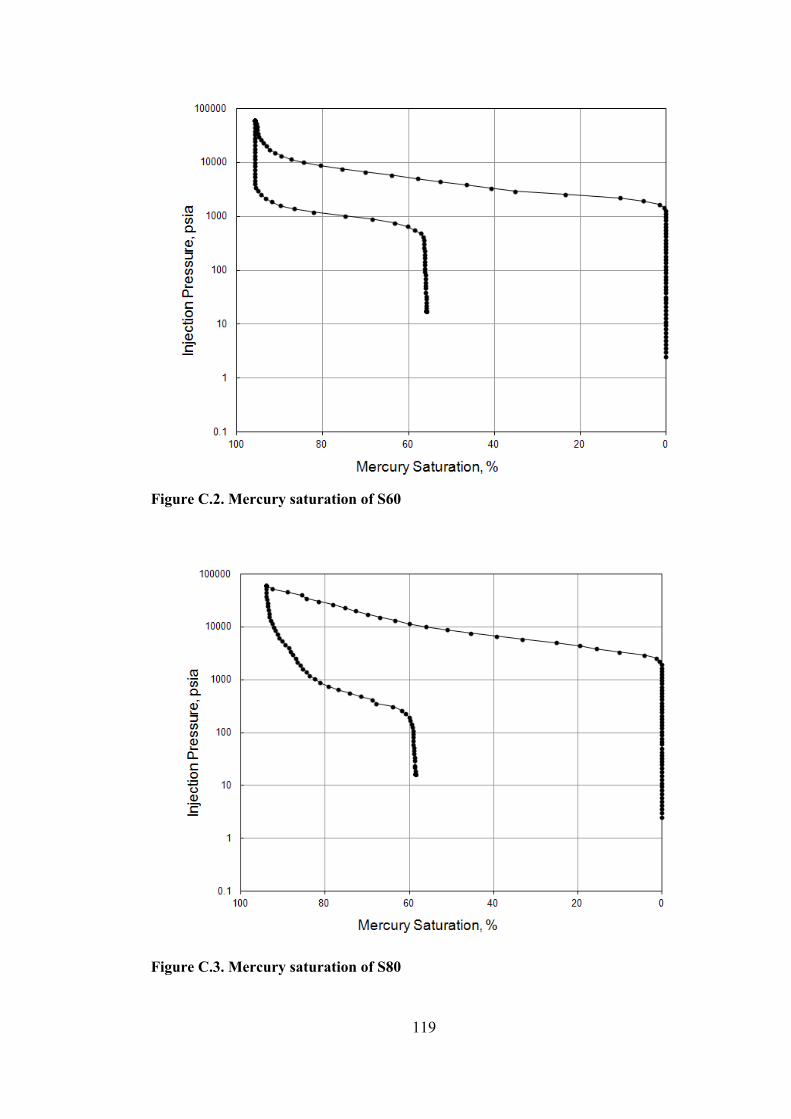
119
Figure C.2. Mercury saturation of S60
Figure C.3. Mercury saturation of S80

120
Figure C.4. Mercury saturation of S60
Figure C.5. Mercury saturation of S80