usingcomputersimulationmethodtoimprove ...mper.org/mper/images/archiwum/2015/nr4/7-klos.pdf ·...
TRANSCRIPT
Management and Production Engineering Review
Volume 6 • Number 4 • December 2015 • pp. 60–69DOI: 10.1515/mper-2015-0037
USING COMPUTER SIMULATION METHOD TO IMPROVE
THROUGHPUT OF PRODUCTION SYSTEMS BY BUFFERS
AND WORKERS ALLOCATION
Sławomir Kłos1, Peter Trebuna2
1 University of Zielona Góra, Institute of Management and Production Engineering, Poland2 Technical University of Kosice, Faculty of Mechanical Engineering, Slovakia
Corresponding author:
Sławomir Kłos
University of Zielona Góra
Institute of Management and Production Engineering
Prof. Szafrana 4, 65-526 Zielona Góra, Poland
phone: (+48) 68 3282464
e-mail: [email protected]
Received: 5 September 2015 Abstract
Accepted: 14 September 2015 This paper proposes the application of computer simulation methods to support decisionmaking regarding intermediate buffer allocations in a series-parallel production line. Thesimulation model of the production system is based on a real example of a manufacturingcompany working in the automotive industry. Simulation experiments were conducted fordifferent allocations of buffer capacities and different numbers of employees. The produc-tion system consists of three technological operations with intermediate buffers betweeneach operation. The technological operations are carried out using machines and every ma-chine can be operated by one worker. Multi-work in the production system is available(one operator operates several machines). On the basis of the simulation experiments, therelationship between system throughput, buffer allocation and the number of employeesis analyzed. Increasing the buffer capacity results in an increase in the average productlifespan. Therefore, in the article a new index is proposed that includes the throughput ofthe manufacturing system and product life span. Simulation experiments were performedfor different configurations of technological operations.
Keywords
computer simulation, series-parallel production line, buffer allocation, throughput analysis,life span of products.
Introduction
The buffer allocation problem is an NP-hard com-binatorial optimization problem well known in theresearch area of industrial engineering [1–3]. On theone hand, the proper allocation of buffer capacitiesin production lines can result in an increase in thetotal effectiveness of the production system. On theother hand, in capital-intensive industries, like theautomotive one, even a simple redistribution of to-tal existing buffer capacities may lead to significantsavings in spending [4, 5]. In this article, computersimulation methods are used to analyze the alloca-tion of buffer capacities in the production system(including three technological operations) and the
relationship between the throughput of the system,buffer capacities and the number of workers. The re-search was performed for a series-parallel productionline which included 9 machines and 2 intermediatebuffers. The material flow was directed to the in-dividual machines on the basis of the round robindispatching rule. The machines performed 3 differ-ent technological operations and each operation wasable to be realized by 3 identical machines simulta-neously. In the system, 4 kinds of products are man-ufactured and the production lot sizes were defined.The simulation model of the system was created onthe basis of part of a real manufacturing system de-signed for the automotive industry. Generally, themain research problem can be formulated as follows:
60
Management and Production Engineering Review
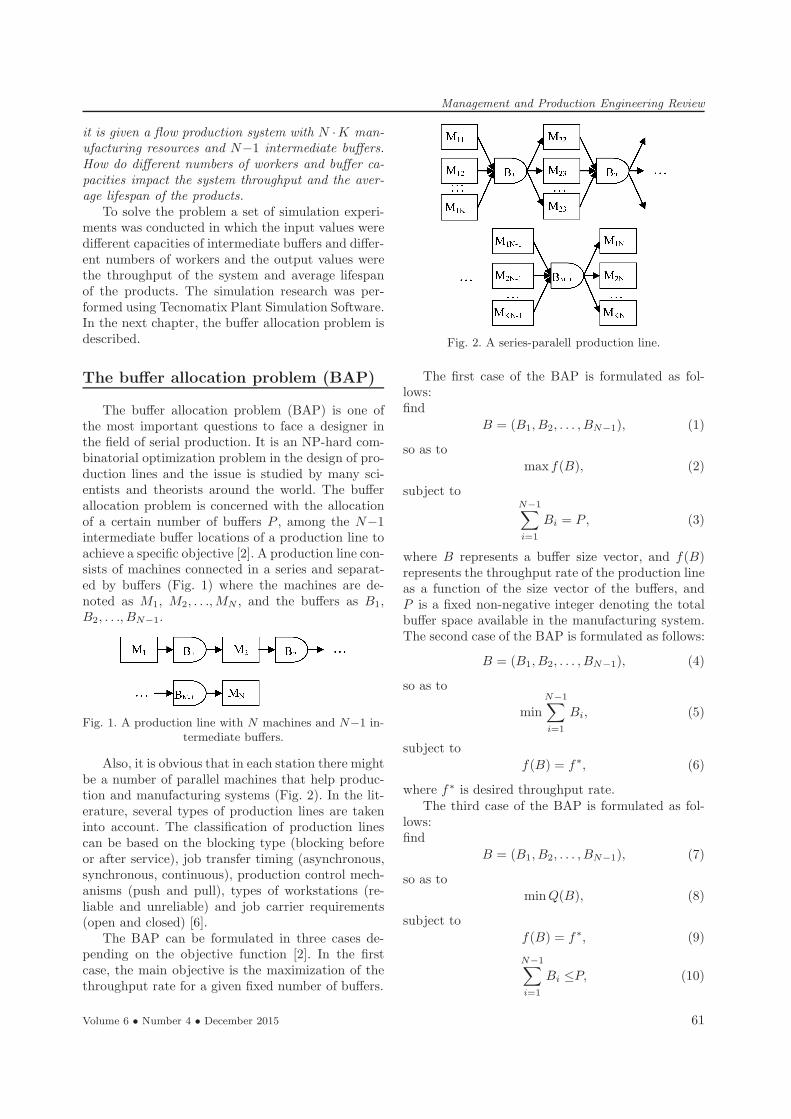
it is given a flow production system with N ·K man-
ufacturing resources and N−1 intermediate buffers.How do different numbers of workers and buffer ca-
pacities impact the system throughput and the aver-
age lifespan of the products.
To solve the problem a set of simulation experi-ments was conducted in which the input values weredifferent capacities of intermediate buffers and differ-ent numbers of workers and the output values werethe throughput of the system and average lifespanof the products. The simulation research was per-formed using Tecnomatix Plant Simulation Software.In the next chapter, the buffer allocation problem isdescribed.
The buffer allocation problem (BAP)
The buffer allocation problem (BAP) is one ofthe most important questions to face a designer inthe field of serial production. It is an NP-hard com-binatorial optimization problem in the design of pro-duction lines and the issue is studied by many sci-entists and theorists around the world. The bufferallocation problem is concerned with the allocationof a certain number of buffers P , among the N−1intermediate buffer locations of a production line toachieve a specific objective [2]. A production line con-sists of machines connected in a series and separat-ed by buffers (Fig. 1) where the machines are de-noted as M1, M2, . . ., MN , and the buffers as B1,B2, . . ., BN−1.
Fig. 1. A production line with N machines and N−1 in-termediate buffers.
Also, it is obvious that in each station there mightbe a number of parallel machines that help produc-tion and manufacturing systems (Fig. 2). In the lit-erature, several types of production lines are takeninto account. The classification of production linescan be based on the blocking type (blocking beforeor after service), job transfer timing (asynchronous,synchronous, continuous), production control mech-anisms (push and pull), types of workstations (re-liable and unreliable) and job carrier requirements(open and closed) [6].The BAP can be formulated in three cases de-
pending on the objective function [2]. In the firstcase, the main objective is the maximization of thethroughput rate for a given fixed number of buffers.
Fig. 2. A series-paralell production line.
The first case of the BAP is formulated as fol-lows:find
B = (B1, B2, . . . , BN−1), (1)
so as to
max f(B), (2)
subject toN−1∑
i=1
Bi = P, (3)
where B represents a buffer size vector, and f(B)represents the throughput rate of the production lineas a function of the size vector of the buffers, andP is a fixed non-negative integer denoting the totalbuffer space available in the manufacturing system.The second case of the BAP is formulated as follows:
B = (B1, B2, . . . , BN−1), (4)
so as to
min
N−1∑
i=1
Bi, (5)
subject to
f(B) = f∗, (6)
where f∗ is desired throughput rate.The third case of the BAP is formulated as fol-
lows:find
B = (B1, B2, . . . , BN−1), (7)
so as to
min Q(B), (8)
subject to
f(B) = f∗, (9)
N−1∑
i=1
Bi ≤P, (10)
Volume 6 • Number 4 • December 2015 61
Management and Production Engineering Review
where Q(B) denotes the average work-in-process in-ventory as a function of the size vector of the buffersand f∗ is the desired throughput rate.
This formulation of the problems expresses themaximization of the throughput rate for a given fixednumber of buffers, achieving the desired throughputrate with the minimum total buffer size or the min-imization of the average work-in-process inventorywhich is subject to the total buffer size and the de-sired throughput rate constraint.
The issue of buffer allocation is the subject of nu-merous scientific publications. The problem of maxi-mizing the throughput of production lines by chang-ing buffer sizes, or locations, using simulation meth-ods was studied by Vidalis et al. [7]. A critical lit-erature overview in the area of buffer allocation andproduction line performance was done by Battini,Persona and Regattieri [1]. Demir, Tunali and Eli-iyi proposed a classification scheme to review thestudies and presented a comprehensive survey on thebuffer allocation problem in production systems [2].Stanley and Kim presented the results of simula-tion experiments carried out for buffer allocationsin closed series-production lines [8]. In a productionline, a single buffer space is the room and the asso-ciated material handling equipment that is neededto store a single job that is a work-in-process, andbuffer allocation is the specific placement of a lim-ited number of buffer spaces in a production line.The authors demonstrated a buffer allocation decom-position result for closed production lines, and alsoprovided evidence that optimal buffer allocations inclosed lines are less sensitive to bottleneck severi-ty than in open production lines. The placement ofbuffers in a production line is an old and well-studiedproblem in industrial engineering research. Vergaraand Kim proposed a new buffer placement methodfor serial production lines [9]. The method is veryefficient and uses information generated in a produc-tion line simulation whose conceptual representationof job flow and workstation interaction can be de-scribed with a network which aims to place buffersin such a way as to maximize throughput. Theycompared the results of the new method against amethod for buffer placement based on a genetic al-gorithm. Yamashita and Altiok [10] proposed an al-gorithm for minimizing the total buffer allocation fordesired throughput in production lines with phase-type processing times. They implemented a dynam-ic programming algorithm that uses a decomposi-tion method to approximate system throughput atevery stage. Shi and Gershwin presented an effec-tive algorithm for maximizing profits through buffersize optimization for production lines [11]. They con-
sidered both buffer space cost and average invento-ry cost with distinct cost coefficients for differentbuffers. To solve the problem, a corresponding un-constrained problem was introduced and a nonlin-ear programming approach was adopted. Joseph andSridharan made an evaluation of the routing flexibil-ity of an FMS with the dynamic arrival of part typesfor processing in the system. A typical FMS config-uration was chosen for detailed study and analysis.The system was set to five different levels of routingflexibility. A discrete-event simulation model was de-veloped to describe the operation of the FMS [12].In the next chapter, a simulation model of
a series-parallel production line is presented.
A simulation modelof a production system
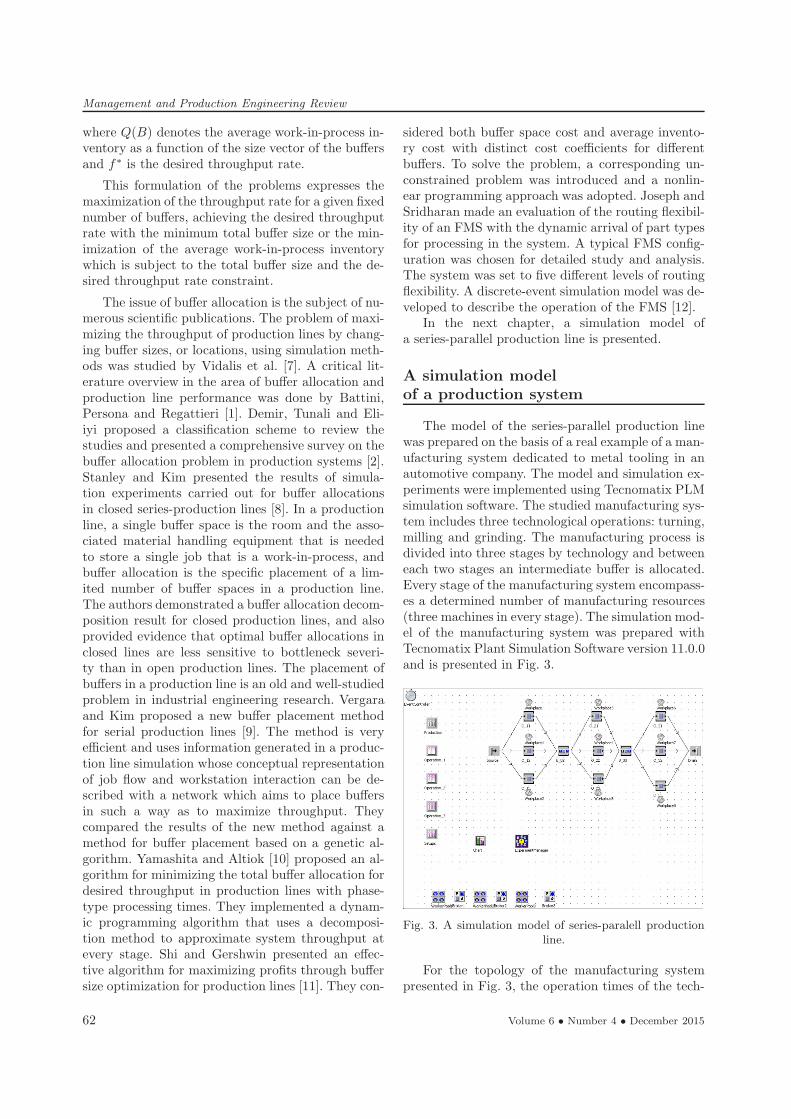
The model of the series-parallel production linewas prepared on the basis of a real example of a man-ufacturing system dedicated to metal tooling in anautomotive company. The model and simulation ex-periments were implemented using Tecnomatix PLMsimulation software. The studied manufacturing sys-tem includes three technological operations: turning,milling and grinding. The manufacturing process isdivided into three stages by technology and betweeneach two stages an intermediate buffer is allocated.Every stage of the manufacturing system encompass-es a determined number of manufacturing resources(three machines in every stage). The simulation mod-el of the manufacturing system was prepared withTecnomatix Plant Simulation Software version 11.0.0and is presented in Fig. 3.
Fig. 3. A simulation model of series-paralell productionline.
For the topology of the manufacturing systempresented in Fig. 3, the operation times of the tech-
62 Volume 6 • Number 4 • December 2015
Management and Production Engineering Review
nological operations are determined for two differ-ent variants. In the first variant, the first operation(turning) is performed with resources O 11, O 12 andO 13, the second operation (milling) is performedwith resources O 21, O 22 and O 23 and the last op-eration (grinding) is done using resources O 31, O 32and O 33. In the system, four different products aremanufactured (A, B, C and D). The first variant ofbatch sizes and operation times is presented in Ta-ble 1.
Table 1The first variant of batch sizes and operation times.
Products
A B C D
Batch size 20 25 15 10
TurningO 11,O 12, O 13
3:00 3:00 3:00 3:00
MillingO 21,O 22, O 23
6:00 6:00 6:00 6:00
GrindingO 31,O 32, O 33
9:00 9:00 9:00 9:00
In the first variant, the first operation (grinding)is performed with resources O 11, O 12 and O 13,the second operation (milling) is performed with re-sources O 21, O 22 and O 23 and the last operation(turning) is done using resources O 31, O 32 andO 33. The second variant of batch sizes and oper-ation times is presented in Table 2.
Table 2The second variant of batch sizes and operation times.
Products
A B C D
Batch size 20 25 15 10
GrindingO 11,O 12, O 13
9:00 9:00 9:00 9:00
MillingO 21,O 22, O 23
6:00 6:00 6:00 6:00
TurningO 31,O 32, O 33
3:00 3:00 3:00 3:00
The changing of a batch requires a setup time.The matrix of setup times is presented in Table 3.
Table 3The matrix of setup times.
A B C D
– 30:00 20:00 10:00 30:00
A 30:00 10:00 30:00 15:00
B 30:00 30:00 20:00 30:00
C 40:00 40:00 30:00 20:00
D 20:00 30:00 30:00 30:00
The numbers presented in the set-up time ma-trix refer to the setup time needed for the changing
of a production batch (for example a batch changefrom product A to product B takes 10 minutes ofsetup time and from product B to product A 30minutes). For each machine a workplace is allocatedand it is assumed that one workplace is dedicated forone worker. The number of workers is allocated onthe basis of the technological operations. It meansthat one operator can operate more than one ma-chine.
Simulation experiments were prepared for differ-ent capacities of buffers and different numbers ofworkers dedicated to the technological operations.In Table 4, the combination of buffer capacities ispresented. Overall, 16 experiments were prepared inwhich the buffer capacity was increased from 1 to 30(see Table 4). For each experiment, 3 observationswere performed.
Table 4
The different buffers capacities.
Experiment number B 02 B 03
Exp 1 1 1
Exp 2 2 2
Exp 3 1 2
Exp 4 2 1
Exp 5 3 2
Exp 6 2 3
Exp 7 3 3
Exp 8 5 1
Exp 9 1 5
Exp 10 5 2
Exp 11 2 5
Exp 12 5 3
Exp 13 5 5
Exp 14 10 10
Exp 15 20 20
Exp 16 30 30
The experiments were repeated for different num-bers of workers allocated to the technological opera-tions. The number of workers allocated to the tech-nological operations is presented in Table 5. Fromthe table results, it is evident that, for example: invariant V 11 the maximum number of workers is al-located to the technological operations (one machineone worker). The efficiency of operators is equal forall experiments and assumed to be 100%. The ma-chine availability is assumed to be 95% and the meantime to repair is determined to be 1 minute. The sim-ulation experiments were repeated for the differentvariants of the technological operation orders, dif-ferent numbers of workers and buffer capacities. Inaddition to the output values, the throughput of thesystem and the average lifespan of products is al-
Volume 6 • Number 4 • December 2015 63
Management and Production Engineering Review
so presented. In the next chapter, the results of thesimulation experiments are presented.
Table 5The allocation of workers for the operations.
Variant 1 – different number of workers
V 11 V 12 V 13 V 14
TurningO 11,O 12, O 13
3 2 2 1
MillingO 21,O 22, O 23
3 2 2 1
GrindingO 31,O 32, O 33
3 3 2 2
Variant 2 – different number of workers
V 21 V 22 V 23 V 24
GrindingO 11,O 12, O 13
3 3 2 2
MillingO 21,O 22, O 23
3 2 2 1
TurningO 31,O 32, O 33
3 2 2 1
The outcomes of computersimulation experiments
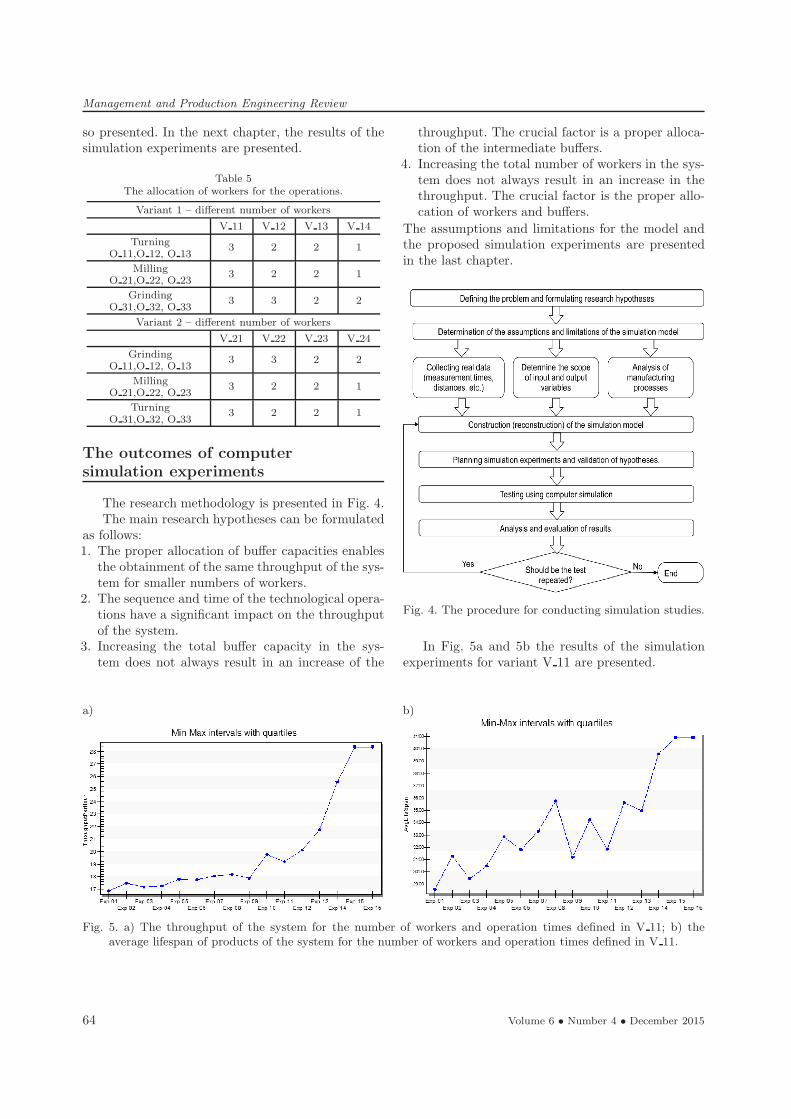
The research methodology is presented in Fig. 4.The main research hypotheses can be formulated
as follows:1. The proper allocation of buffer capacities enablesthe obtainment of the same throughput of the sys-tem for smaller numbers of workers.
2. The sequence and time of the technological opera-tions have a significant impact on the throughputof the system.
3. Increasing the total buffer capacity in the sys-tem does not always result in an increase of the
throughput. The crucial factor is a proper alloca-tion of the intermediate buffers.
4. Increasing the total number of workers in the sys-tem does not always result in an increase in thethroughput. The crucial factor is the proper allo-cation of workers and buffers.
The assumptions and limitations for the model andthe proposed simulation experiments are presentedin the last chapter.
Fig. 4. The procedure for conducting simulation studies.
In Fig. 5a and 5b the results of the simulationexperiments for variant V 11 are presented.
a) b)
Fig. 5. a) The throughput of the system for the number of workers and operation times defined in V 11; b) theaverage lifespan of products of the system for the number of workers and operation times defined in V 11.
64 Volume 6 • Number 4 • December 2015
Management and Production Engineering Review
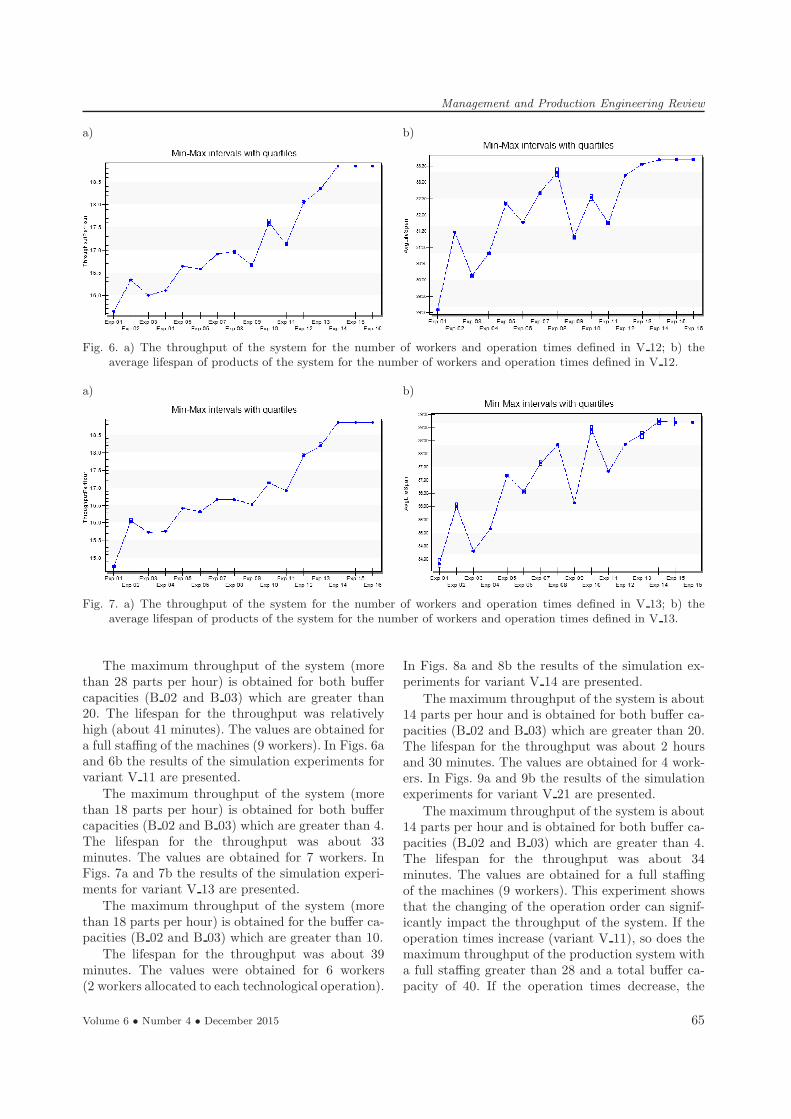
a) b)
Fig. 6. a) The throughput of the system for the number of workers and operation times defined in V 12; b) theaverage lifespan of products of the system for the number of workers and operation times defined in V 12.
a) b)
Fig. 7. a) The throughput of the system for the number of workers and operation times defined in V 13; b) theaverage lifespan of products of the system for the number of workers and operation times defined in V 13.
The maximum throughput of the system (morethan 28 parts per hour) is obtained for both buffercapacities (B 02 and B 03) which are greater than20. The lifespan for the throughput was relativelyhigh (about 41 minutes). The values are obtained fora full staffing of the machines (9 workers). In Figs. 6aand 6b the results of the simulation experiments forvariant V 11 are presented.
The maximum throughput of the system (morethan 18 parts per hour) is obtained for both buffercapacities (B 02 and B 03) which are greater than 4.The lifespan for the throughput was about 33minutes. The values are obtained for 7 workers. InFigs. 7a and 7b the results of the simulation experi-ments for variant V 13 are presented.
The maximum throughput of the system (morethan 18 parts per hour) is obtained for the buffer ca-pacities (B 02 and B 03) which are greater than 10.
The lifespan for the throughput was about 39minutes. The values were obtained for 6 workers(2 workers allocated to each technological operation).
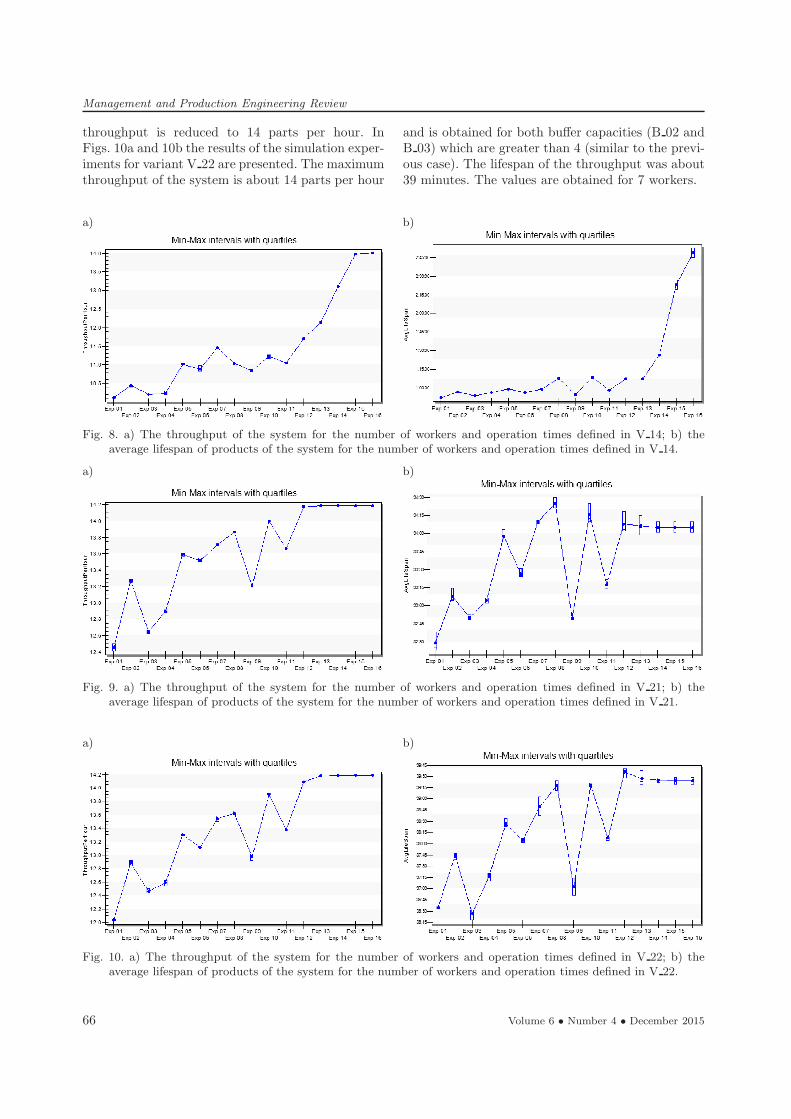
In Figs. 8a and 8b the results of the simulation ex-periments for variant V 14 are presented.
The maximum throughput of the system is about14 parts per hour and is obtained for both buffer ca-pacities (B 02 and B 03) which are greater than 20.The lifespan for the throughput was about 2 hoursand 30 minutes. The values are obtained for 4 work-ers. In Figs. 9a and 9b the results of the simulationexperiments for variant V 21 are presented.
The maximum throughput of the system is about14 parts per hour and is obtained for both buffer ca-pacities (B 02 and B 03) which are greater than 4.The lifespan for the throughput was about 34minutes. The values are obtained for a full staffingof the machines (9 workers). This experiment showsthat the changing of the operation order can signif-icantly impact the throughput of the system. If theoperation times increase (variant V 11), so does themaximum throughput of the production system witha full staffing greater than 28 and a total buffer ca-pacity of 40. If the operation times decrease, the
Volume 6 • Number 4 • December 2015 65
Management and Production Engineering Review
throughput is reduced to 14 parts per hour. InFigs. 10a and 10b the results of the simulation exper-iments for variant V 22 are presented. The maximumthroughput of the system is about 14 parts per hour
and is obtained for both buffer capacities (B 02 andB 03) which are greater than 4 (similar to the previ-ous case). The lifespan of the throughput was about39 minutes. The values are obtained for 7 workers.
a) b)
Fig. 8. a) The throughput of the system for the number of workers and operation times defined in V 14; b) theaverage lifespan of products of the system for the number of workers and operation times defined in V 14.
a) b)
Fig. 9. a) The throughput of the system for the number of workers and operation times defined in V 21; b) theaverage lifespan of products of the system for the number of workers and operation times defined in V 21.
a) b)
Fig. 10. a) The throughput of the system for the number of workers and operation times defined in V 22; b) theaverage lifespan of products of the system for the number of workers and operation times defined in V 22.
66 Volume 6 • Number 4 • December 2015
Management and Production Engineering Review
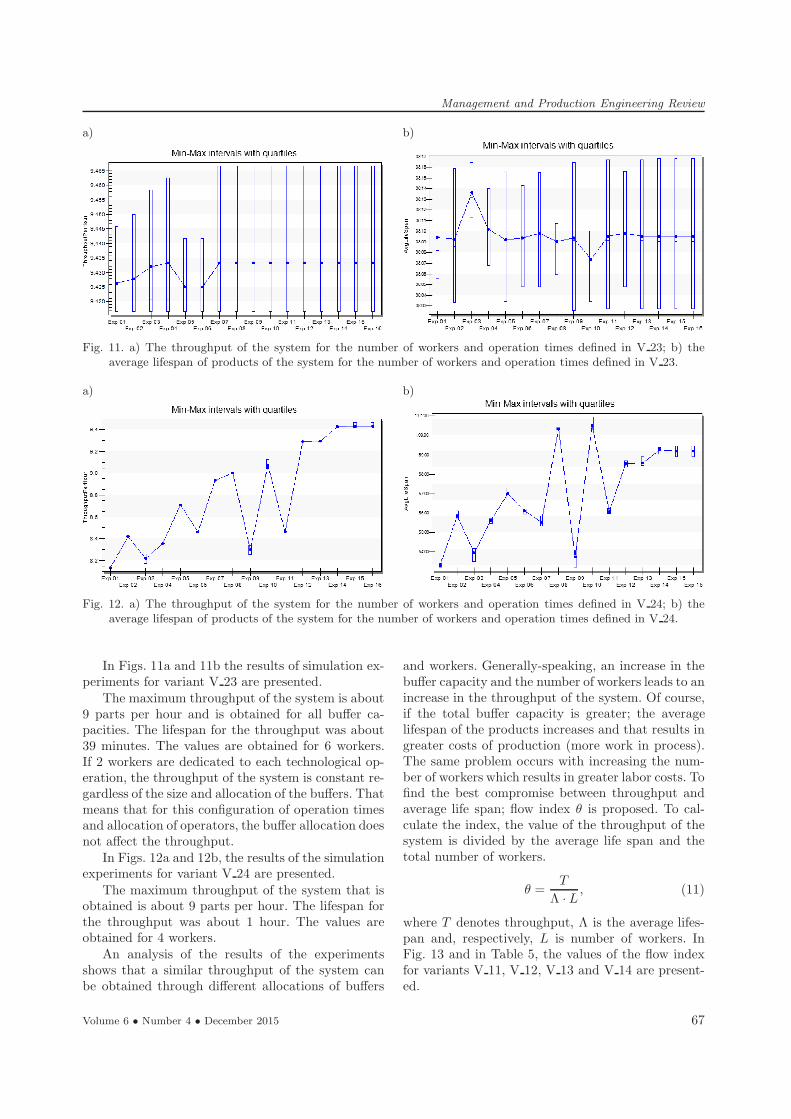
a) b)
Fig. 11. a) The throughput of the system for the number of workers and operation times defined in V 23; b) theaverage lifespan of products of the system for the number of workers and operation times defined in V 23.
a) b)
Fig. 12. a) The throughput of the system for the number of workers and operation times defined in V 24; b) theaverage lifespan of products of the system for the number of workers and operation times defined in V 24.
In Figs. 11a and 11b the results of simulation ex-periments for variant V 23 are presented.The maximum throughput of the system is about
9 parts per hour and is obtained for all buffer ca-pacities. The lifespan for the throughput was about39 minutes. The values are obtained for 6 workers.If 2 workers are dedicated to each technological op-eration, the throughput of the system is constant re-gardless of the size and allocation of the buffers. Thatmeans that for this configuration of operation timesand allocation of operators, the buffer allocation doesnot affect the throughput.In Figs. 12a and 12b, the results of the simulation
experiments for variant V 24 are presented.
The maximum throughput of the system that isobtained is about 9 parts per hour. The lifespan forthe throughput was about 1 hour. The values areobtained for 4 workers.An analysis of the results of the experiments
shows that a similar throughput of the system canbe obtained through different allocations of buffers
and workers. Generally-speaking, an increase in thebuffer capacity and the number of workers leads to anincrease in the throughput of the system. Of course,if the total buffer capacity is greater; the averagelifespan of the products increases and that results ingreater costs of production (more work in process).The same problem occurs with increasing the num-ber of workers which results in greater labor costs. Tofind the best compromise between throughput andaverage life span; flow index θ is proposed. To cal-culate the index, the value of the throughput of thesystem is divided by the average life span and thetotal number of workers.
θ =T
Λ · L, (11)
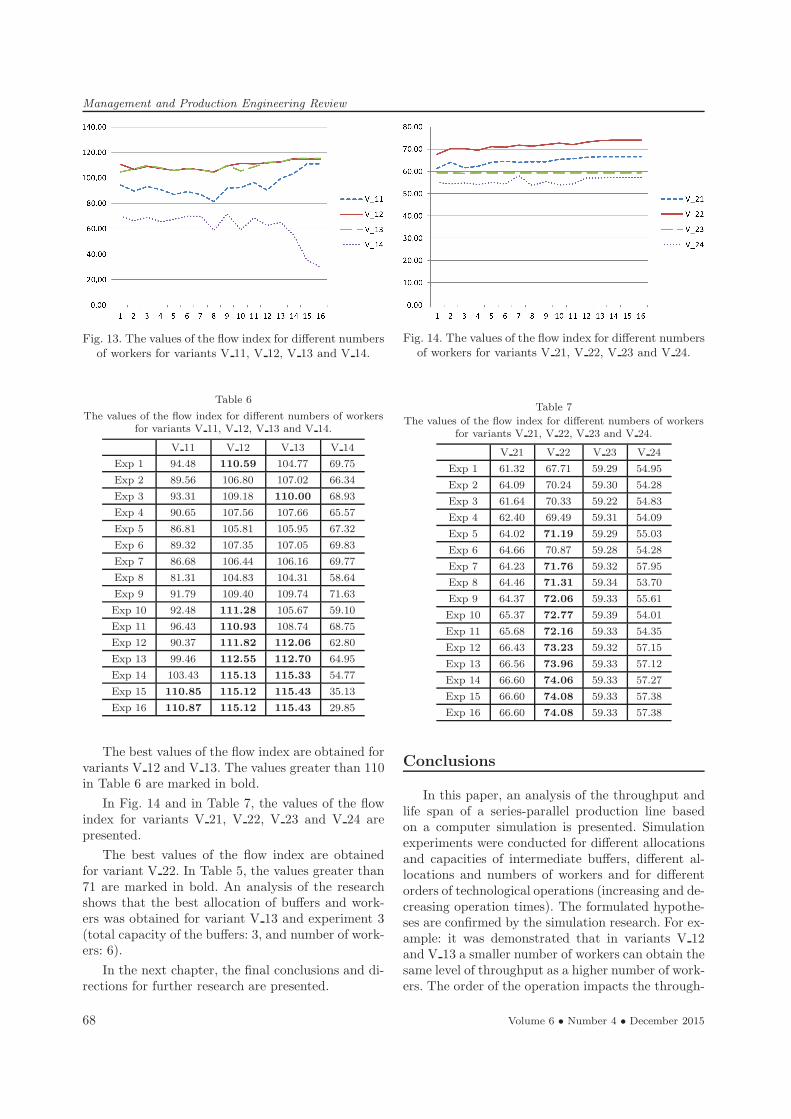
where T denotes throughput, Λ is the average lifes-pan and, respectively, L is number of workers. InFig. 13 and in Table 5, the values of the flow indexfor variants V 11, V 12, V 13 and V 14 are present-ed.
Volume 6 • Number 4 • December 2015 67
Management and Production Engineering Review
Fig. 13. The values of the flow index for different numbersof workers for variants V 11, V 12, V 13 and V 14.
Table 6
The values of the flow index for different numbers of workersfor variants V 11, V 12, V 13 and V 14.
V 11 V 12 V 13 V 14
Exp 1 94.48 110.59 104.77 69.75
Exp 2 89.56 106.80 107.02 66.34
Exp 3 93.31 109.18 110.00 68.93
Exp 4 90.65 107.56 107.66 65.57
Exp 5 86.81 105.81 105.95 67.32
Exp 6 89.32 107.35 107.05 69.83
Exp 7 86.68 106.44 106.16 69.77
Exp 8 81.31 104.83 104.31 58.64
Exp 9 91.79 109.40 109.74 71.63
Exp 10 92.48 111.28 105.67 59.10
Exp 11 96.43 110.93 108.74 68.75
Exp 12 90.37 111.82 112.06 62.80
Exp 13 99.46 112.55 112.70 64.95
Exp 14 103.43 115.13 115.33 54.77
Exp 15 110.85 115.12 115.43 35.13
Exp 16 110.87 115.12 115.43 29.85
The best values of the flow index are obtained forvariants V 12 and V 13. The values greater than 110in Table 6 are marked in bold.
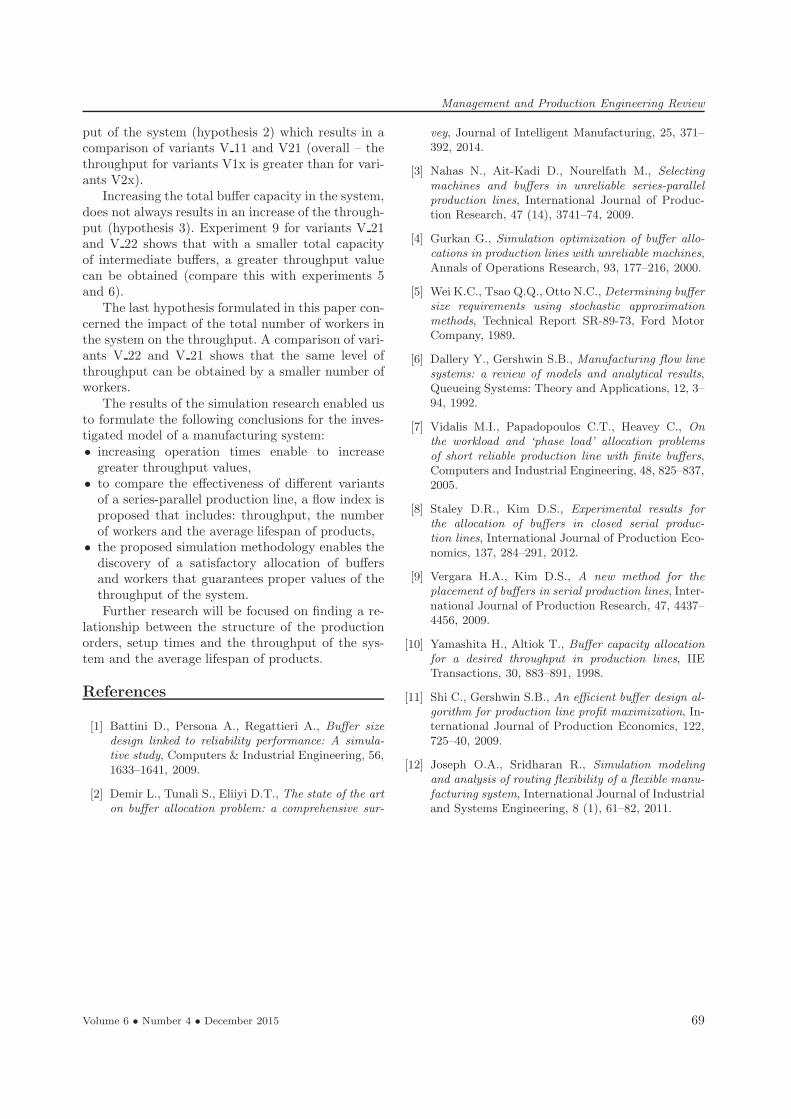
In Fig. 14 and in Table 7, the values of the flowindex for variants V 21, V 22, V 23 and V 24 arepresented.
The best values of the flow index are obtainedfor variant V 22. In Table 5, the values greater than71 are marked in bold. An analysis of the researchshows that the best allocation of buffers and work-ers was obtained for variant V 13 and experiment 3(total capacity of the buffers: 3, and number of work-ers: 6).
In the next chapter, the final conclusions and di-rections for further research are presented.
Fig. 14. The values of the flow index for different numbersof workers for variants V 21, V 22, V 23 and V 24.
Table 7
The values of the flow index for different numbers of workersfor variants V 21, V 22, V 23 and V 24.
V 21 V 22 V 23 V 24
Exp 1 61.32 67.71 59.29 54.95
Exp 2 64.09 70.24 59.30 54.28
Exp 3 61.64 70.33 59.22 54.83
Exp 4 62.40 69.49 59.31 54.09
Exp 5 64.02 71.19 59.29 55.03
Exp 6 64.66 70.87 59.28 54.28
Exp 7 64.23 71.76 59.32 57.95
Exp 8 64.46 71.31 59.34 53.70
Exp 9 64.37 72.06 59.33 55.61
Exp 10 65.37 72.77 59.39 54.01
Exp 11 65.68 72.16 59.33 54.35
Exp 12 66.43 73.23 59.32 57.15
Exp 13 66.56 73.96 59.33 57.12
Exp 14 66.60 74.06 59.33 57.27
Exp 15 66.60 74.08 59.33 57.38
Exp 16 66.60 74.08 59.33 57.38
Conclusions
In this paper, an analysis of the throughput andlife span of a series-parallel production line basedon a computer simulation is presented. Simulationexperiments were conducted for different allocationsand capacities of intermediate buffers, different al-locations and numbers of workers and for differentorders of technological operations (increasing and de-creasing operation times). The formulated hypothe-ses are confirmed by the simulation research. For ex-ample: it was demonstrated that in variants V 12and V 13 a smaller number of workers can obtain thesame level of throughput as a higher number of work-ers. The order of the operation impacts the through-
68 Volume 6 • Number 4 • December 2015
Management and Production Engineering Review
put of the system (hypothesis 2) which results in acomparison of variants V 11 and V21 (overall – thethroughput for variants V1x is greater than for vari-ants V2x).Increasing the total buffer capacity in the system,
does not always results in an increase of the through-put (hypothesis 3). Experiment 9 for variants V 21and V 22 shows that with a smaller total capacityof intermediate buffers, a greater throughput valuecan be obtained (compare this with experiments 5and 6).The last hypothesis formulated in this paper con-
cerned the impact of the total number of workers inthe system on the throughput. A comparison of vari-ants V 22 and V 21 shows that the same level ofthroughput can be obtained by a smaller number ofworkers.The results of the simulation research enabled us
to formulate the following conclusions for the inves-tigated model of a manufacturing system:• increasing operation times enable to increasegreater throughput values,
• to compare the effectiveness of different variantsof a series-parallel production line, a flow index isproposed that includes: throughput, the numberof workers and the average lifespan of products,
• the proposed simulation methodology enables thediscovery of a satisfactory allocation of buffersand workers that guarantees proper values of thethroughput of the system.Further research will be focused on finding a re-
lationship between the structure of the productionorders, setup times and the throughput of the sys-tem and the average lifespan of products.
References
[1] Battini D., Persona A., Regattieri A., Buffer sizedesign linked to reliability performance: A simula-
tive study, Computers & Industrial Engineering, 56,1633–1641, 2009.
[2] Demir L., Tunali S., Eliiyi D.T., The state of the arton buffer allocation problem: a comprehensive sur-
vey, Journal of Intelligent Manufacturing, 25, 371–392, 2014.
[3] Nahas N., Ait-Kadi D., Nourelfath M., Selectingmachines and buffers in unreliable series-parallel
production lines, International Journal of Produc-tion Research, 47 (14), 3741–74, 2009.
[4] Gurkan G., Simulation optimization of buffer allo-cations in production lines with unreliable machines,Annals of Operations Research, 93, 177–216, 2000.
[5] Wei K.C., Tsao Q.Q., Otto N.C., Determining buffersize requirements using stochastic approximation
methods, Technical Report SR-89-73, Ford MotorCompany, 1989.
[6] Dallery Y., Gershwin S.B., Manufacturing flow linesystems: a review of models and analytical results,Queueing Systems: Theory and Applications, 12, 3–94, 1992.
[7] Vidalis M.I., Papadopoulos C.T., Heavey C., Onthe workload and ‘phase load’ allocation problems
of short reliable production line with finite buffers,Computers and Industrial Engineering, 48, 825–837,2005.
[8] Staley D.R., Kim D.S., Experimental results forthe allocation of buffers in closed serial produc-
tion lines, International Journal of Production Eco-nomics, 137, 284–291, 2012.
[9] Vergara H.A., Kim D.S., A new method for theplacement of buffers in serial production lines, Inter-national Journal of Production Research, 47, 4437–4456, 2009.
[10] Yamashita H., Altiok T., Buffer capacity allocationfor a desired throughput in production lines, IIETransactions, 30, 883–891, 1998.
[11] Shi C., Gershwin S.B., An efficient buffer design al-gorithm for production line profit maximization, In-ternational Journal of Production Economics, 122,725–40, 2009.
[12] Joseph O.A., Sridharan R., Simulation modelingand analysis of routing flexibility of a flexible manu-
facturing system, International Journal of Industrialand Systems Engineering, 8 (1), 61–82, 2011.
Volume 6 • Number 4 • December 2015 69