using regression analysis to estimate costs - archivearchive.gao.gov/otherpdf1/090875.pdf ·...
TRANSCRIPT

Y
* , 1 -
- r
\
USING REGRES,SION ANALYSIS TO'ESTIMATE COSTS: / * A' Ck!k.STUDY '

CONTENTS
CHAPTER
1
2
3
4
INTRODUCTION Purpose of case s t u d y What is regression?
THE AUDIT SITUATION
review Legislative mandate for the
Need for life-cycle estimates
GAO ANALYSIS Analytical Procedure Example: analysis of pharmacy
d e p a r t m e n t
USE OF THE ANALYSIS
PAGE
1 1 1
2 2
4 5
7
1 0
CHAPTER 1
INTRODUCTION
This r e p o r t desc r ibes an ins tance i n which a t a s k force of reg iona l and headquarters GAO s t a f f members ex- t e n s i v e l y used regress ion a n a l y s i s t o es t imate t h e l i f e - cyc le c o s t s of a l t e r n a t i v e methods of car ry ing ou t a c t i v - i t i e s e s s e n t i a l t o t h e opera t ion of a h o s p i t a l . The a n a l y s i s w a s a p a r t of t h e work performed i n a wide-ranging review of h e a l t h care f a c i l i t i e s c o s t s .
PURPOSE OF CASE STUDY
This i s thy second case study on regress ion a n a l y s i s i n t h i s series. This r e p o r t , a s we l l a s t h e previous s tudy, shows how t h e technique has been used i n car ry ing o u t an a u d i t assignment and can serve a s a re ference i n f u t u r e u s e of t h e technique.
WHAT I S REGRESSION ANALYSIS?
Regression a n a l y s i s i s a s t a t i s t i c a l technique used t o measure t h e e x t e n t t o which a change i n one q u a n t i t y ( v a r i a b l e ) i s accompanied by a change i n some o t h e r quan t i ty ( v a r i a b l e ) . For example, i nc reases i n years of education received tend t o be accompanied by inc reases i n annual i n - come earned.
"'Regression Analysis A s An Audit Tool: A Case Study, ' ' June 1972.
1

CHAPTER 2
THE AUDIT SITUATION
The s t a f f assigned t o t h e h e a l t h f a c i l i t i e s study needed a way t o es t imate t h e l i f e - cyc le ( i n i t i a l investment p lus l i f e t i m e opera t ion and maintenance) c o s t impl ica t ions of innovative methods t h a t have been developed and proposed f o r u s e i n h o s p i t a l opera t ions so a s t o compare t h e c o s t s of these a l t e r n a t i v e methods with those of more conventional methods.
LEGISLATIVE MANDATE FOR THE REVIEW
The Comprehensive Health Manpower Training Act of 1971 required t h e Comptroller General t o study h e a l t h f a c i l i t i e s cons t ruc t ion c o s t s . The study was t o include the f e a s i b i l i t y of reducing t h e c o s t of cons t ruc t ing h e a l t h f a c i l i t i e s , such as h o s p i t a l s . I n add i t ion , t h e Senate Committee on Labor and Public Welfare, which had i n i t i a t e d t h e requirement f o r t h e study, expressed i n t e r e s t i n t h e opera t ing c o s t of h o s p i t a l s .
Recently innovations have been developed i n s eve ra l major h o s p i t a l a c t i v i t i e s , including the d i e t a r y , pharmacy, c l i n i c a l l abora tory , and laundry departments and t h e ma te r i a l handling and waste d i sposa l a c t i v i t i e s . I n accordance with t h e mandate, t he GAO s t a f f wished t o examine t h e c o s t s of t h e innovations i n these opera t ions t o a s c e r t a i n the ex ten t t o which t h e innovat ions could reduce h e a l t h ca re c o s t s .
NEED FOR LIFE-CYCLE ESTIMATES
I n examining t h e c o s t impact of these innovat ions, we wished t o not l i m i t t h e review t o i n i t i a l cons t ruc t ion c o s t s bu t t o examine t h e i r impact on opera t ion and main- tenance c o s t s a s w e l l . Thus the t a s k force was i n t e r e s t e d i n determining t h e impact of these innovations on t h e l i f e - cyc le c o s t s of h e a l t h c a r e f a c i l i t i e s .
I n many cases t h e a l t e r n a t i v e approaches t o a given h o s p i t a l a c t i v i t y d i f f e r g r e a t l y i n t h e i r i n i t i a l inves t - ment c o s t , and t h e more c o s t l y o f t e n provide savings i n opera t ion and maintenance costs. Savings i n opera t ion and
2
maintenance co-sts f requent ly a r e the r e s u l t of automation o r of ma te r i a l handling methods which increase p roduc t iv i ty of l abo r , t h a t i s , increase volume c a p a b i l i t y per employee. In such a s i t u a t i o n t h e answer t o t h e quest ion of which a l t e r n a t i v e is l e a s t c o s t l y depends on the volume demanded of t h e a c t i v i t y i n quest ion.
I n a l a r g e h o s p i t a l , an innovation having an i n i t i a l investment g r e a t e r than t h a t of t h e conventional method might prove less c o s t l y , on a l i f e - cyc le b a s i s , because the volume demanded of t h e a c t i v i t y is s u f f i c i e n t l y l a r g e t h a t t h e saving i n opera t ion and maintenance c o s t s exceeds t h e h igher investment c o s t s of t he innovation. Bu t t h i s might not hold t r u e for a small h o s p i t a l . For t h i s reason, t h e t a s k force wished t o es t imate t h e l i f e - cyc le c o s t s of each of t h e a l t e r n a t i v e methods over a range of h o s p i t a l s i z e s .
3

CHAPTER 3
GAO ANALYSIS
The t a s k force used regress ion a n a l y s i s t o es t imate t h e l i f e - c y c l e c o s t s of each of seve ra l a l t e r n a t i v e methods of performing seve ra l h o s p i t a l a c t i v i t i e s .
As defined i n t h e GAO glossary f o r systems a n a l y s i s , dated October 1969, regress ion a n a l y s i s is:
"Analysis undertaken t o determine the ex ten t t o which a change i n t he value of one v a r i a b l e , t h e independent v a r i a b l e , tends t o be accompanied by a change i n t h e value of another v a r i a b l e , the dependent v a r i a b l e . Where only one independent v a r i a b l e i s involved i n t h e a n a l y s i s t h e tech- nique i s known a s simple regress ion a n a l y s i s ; where two o r more independent v a r i a b l e s a r e i n - volved t h e technique i s c a l l e d mul t ip le regres- s ion ana lys i s .* * * ' I
I f t h e r e i s evidence t h a t change i n one va r i ab le causes change i n t h e second v a r i a b l e , t h e r e l a t i o n s h i p d isc losed by the regress ion technique can be used t o es- t imate the magnitude of t h e second va r i ab le from information concerning t h e magnitude of t h e f i r s t va r i ab le .
If t h e r e l a t i o n s h i p between t h e independent and de- pendent v a r i a b l e s d isc losed by the a n a l y s i s i s one t h a t can be represented by a s t r a i g h t l i n e , t he r e l a t i o n s h i p i s r e f e r r e d t o a s l i n e a r . Figure 1 on page 5 i l l u s t r a t e s a simple l i n e a r regress ion . The p l o t t e d da t a p o i n t s i n t h e i l l u s t r a t i o n r ep resen t t h e he igh t s of g i r l s of var ious ages. The s t r a i g h t l i n e r ep resen t s t he r e l a t i o n s h i p between he igh t ( t h e dependent v a r i a b l e ) and age ( t h e independent variable) a s d isc losed by regress ion a n a l y s i s . I f t h e change i n t h e dependent v a r i a b l e a s soc ia t ed with a change i n t h e independent v a r i a b l e does n o t occur a t a cons tan t r a t e , t h e r e l a t i o n s h i p can be represented by a curved l i n e and i s r e f e r r e d t o a s c u r v i l i n e a r .
4

LINEAR REGRESSION FIGURE 1
E .-
70 8ol *
I I I I I I
3 6 9 12 15 18
Age in Years
20 '
ANALYTICAL PROCEDURE
For each a l t e r n a t i v e method considered, t h e t a sk force used regress ion a n a l y s i s t o examine the r e l a t i o n s h i p between t h e volume of the h o s p i t a l a c t i v i t y involved (independent v a r i a b l e ) and t h e l i f e - c y c l e ( i n i t i a l investment p lus l i f e - t i m e opera t ion and maintenance) c o s t s (dependent v a r i a b l e ) . The hope was t h a t t h e s t a t i s t i c a l r e l a t i o n s h i p d isc losed by regress ion a n a l y s i s would permit es t imat ion of t h e l i f e - cyc le c o s t s of each a l t e r n a t i v e over a range of poss ib l e volumes of the a c t i v i t y i n ques t ion and thus over a range of poss ib l e h o s p i t a l s i z e s . Such es t imates would permit a comparison of a l t e r n a t i v e methods i n terms of t h e i r d i s - counted l i f e - c y c l e costs for s p e c i f i c h o s p i t a l s i z e s .
The t a s k force selected the following h o s p i t a l depart- ments and a c t i v i t i e s and t h e i r a l t e r n a t i v e methods of opera- t i o n f o r t h e analyses descr ibed above.
5
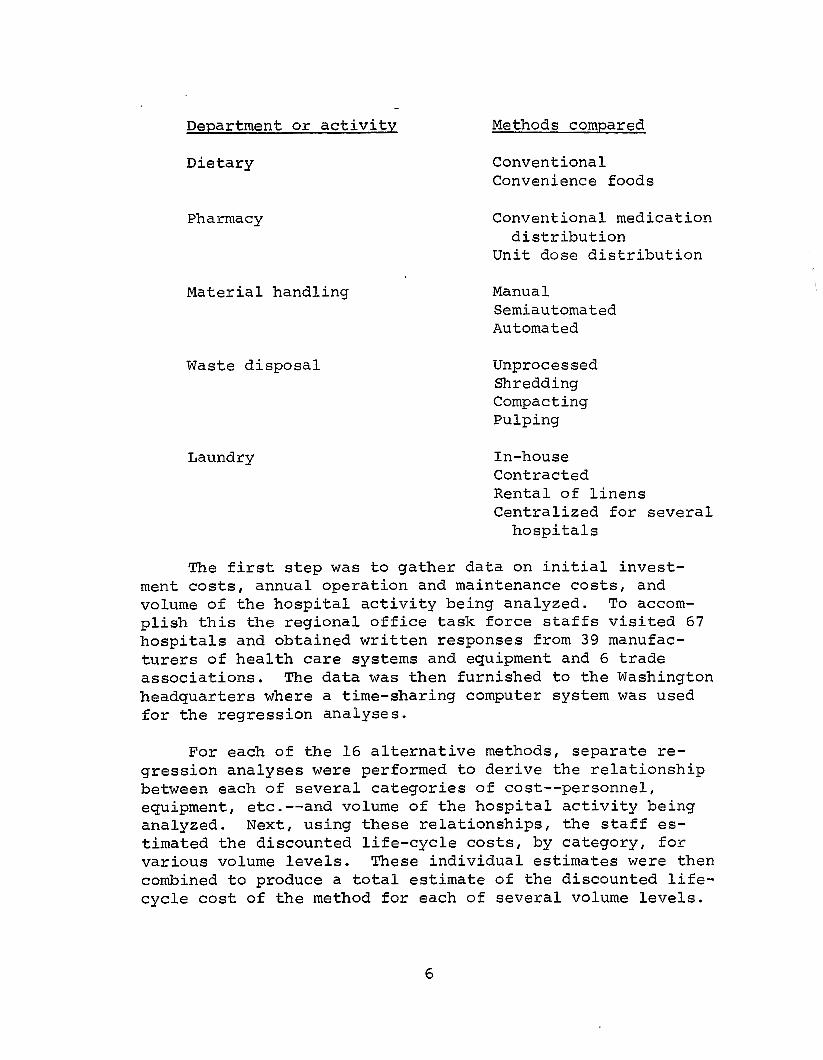
- Department or activity
Dietary
Pharmacy
Material handling
Waste disposal
Laundry
Methods compared
Conventional Convenience foods
Conventional medication
Unit dose distribution distribution
Manual Semiautomated Automated
Unprocessed Shredding Compacting Pulping
In-house Contracted Rental of linens Centralized for several hospitals
The first step was to gather data on initial invest- ment costs, annual operation and maintenance costs, and volume of the hospital activity being analyzed. To accom- plish this the regional office task force staffs visited 67 hospitals and obtained written responses from 39 manufac- turers of health care systems and equipment and 6 trade associations. headquarters where a time-sharing computer system was used for the regression analyses.
The data was then furnished to the Washington
For each of the 16 alternative methods, separate re- gression analyses were performed to derive the relationship between each of several categories of cost--personnel, equipment, etc.--and volume of the hospital activity being analyzed. Next, using these relationships, the staff es- timated the discounted life-cycle costs, by category, for various volume levels. These individual estimates were then combined to produce a total estimate of the discounted life- cycle cost of the method for each of several volume levels.
6

EXAMPLE: ANALYSIS OF PHARMACY DEPARTMENT
The application of regression analysis by the task force can be illustrated by examining how it was applied to the pharmacy department.
The hospital pharmacy is part of a total medication distribution system which includes ordering and receiving medications at the hospital, filling physician medication orders, administering medications to patients, and recording results of medication therapy. In a conventional system, the pharmacy's responsibility relates primarily to procuring medications from outside the hospital and distributing them to patient floors. An alternative to the conventional sys- tem is the unit dose system. The distinguishing feature of the unit dose system is that pharmacy personnel are respon- sible for keeping records associated with dispensing and controlling medications; interpreting physicians' o r d e r s : maintaining patients' medication records: providing unit dose packages of medications at the time medications are to be administered; and, in certain instances, administering medications to patients. A unit dose package contains the exact dose, such as one tablet or one capsule, ordered by the patient's physician to be administered at a specific time.
For each of the a l t e r n a t i v e approaches, a separate regression analysis was performed for each of five cost categories. In each analysis, the number of prescriptions filled annually was the independent variable and the life- time (20-year) costs for that category was the dependent variable. The costs categories used in these analyses were:
--Annual personnel costs. --Annual medication costs. --Annual supply costs. --Equipment costs (including maintenance). --Space costs (including maintenance).
It was assumed that operating costs would remain at their current level over the 20 years: that is, anticipated price changes would not affect the relationship between cost and the volume of prescriptions nor would productivity improve. The annual maintenance costs for equipment and space were es- timated as fixed percentages of equipment cost and space cost, respectively.
7

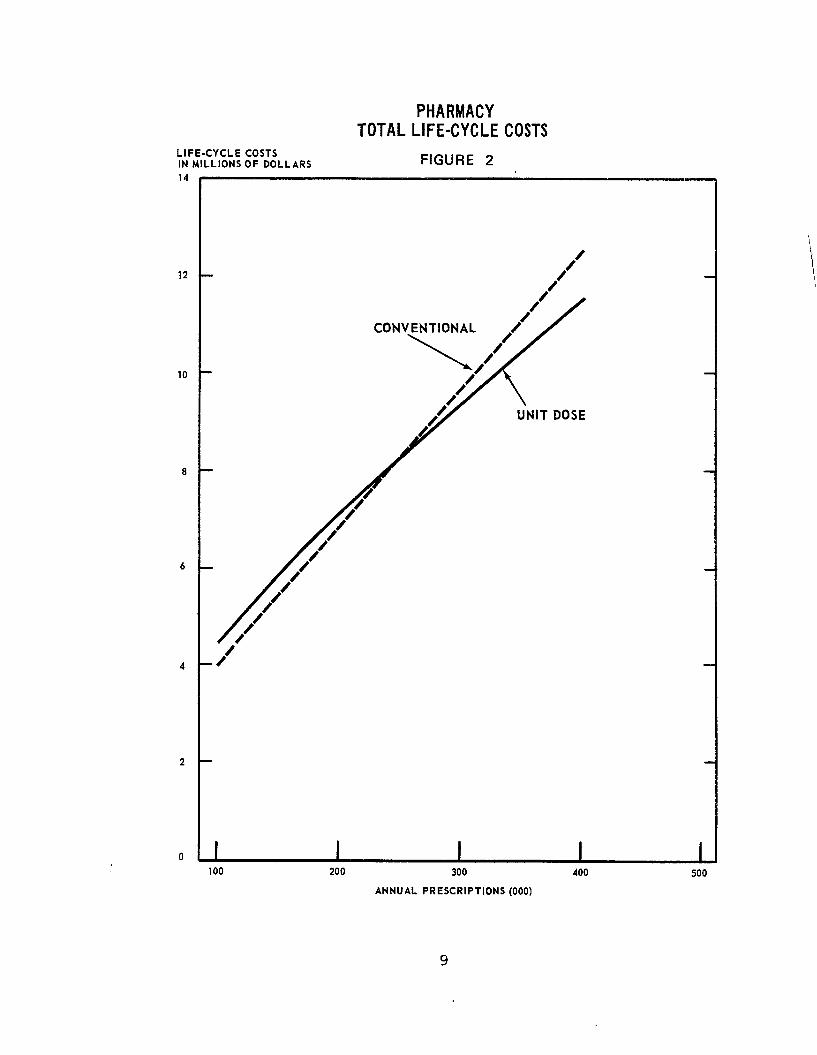
The unit dose distribution system resulted in lower life-cycle costs than conventional distribution systems, for annual prescrip- tions above approximately 250,000. (See Figure 2.) The l i f e - cyc le savings are largely attributed to a reduction in nursing time for administering unit dose medications.
8
LIFE-CYCLE COSTS IN MILLIONS OF DOLLARS 14
12
10
8
6
4
2
0
PHARMACY TOTAL LIFE-CYCLE COSTS
FIGURE 2
100 200 300 400
ANNUAL PRESCRIPTIONS (000)
500
9
CHaPTER 4
USE OF THE ANALYSIS ----_I_-
The regression analysis was used to derive a set of life-cycle cost estimates for each of the five hospital departments and activities analyzed. These estimates were presented in graphic form in the report issued at the com- p l e t i o n of t h e t ask f o r c e ' s work: " S t u d y of H e a l t h F a c i l i - t i e s Cons t ruc t ion Costs" ( B - 1 6 4 0 3 1 ( 3 ) , Nov. 2 0 , 1 9 7 2 . ) The report concluded that our study had demonstrated "that potential exists to achieve significant life-cycle savings in construction of health facilities."
Because the GAO-derived cost estimating curves were based on data obtained at hospitals across the Nation, they were not considered precise representations of cost relation- ships in any specific geographic area. Nevertheless, we believed that they generally reflected the comparative costs of the alternative methods reviewed and the relationship between the magnitude of these costs and hospital size. Therefore we recommended that, pending the establishment of a central reporting of life-cycle operating data, the Department of Health, Education, and Welfare encourage health facility planners to consider the information in the report.
10