using options to manage volatility - cboe · using options to manage volatility cboe european risk...
TRANSCRIPT
OCTOBER 2013
Using Options to Manage Volatility CBOE European Risk Management Conference
Scott Maidel, CFA – Senior Portfolio Manager
Important information and disclosures
Russell Investment Group is a Washington, USA corporation, which operates through subsidiaries worldwide, including Russell Implementation Services Limited ("RISL") and is
a subsidiary of The Northwestern Mutual Life Insurance Company. This material is a product of Russell Implementation Services Inc., a registered investment advisor and broker-
dealer, member FINRA, SIPC. It has been reviewed and approved for use by Russell Implementation Services Limited.
Russell Implementation Services Limited (Company No. 3049880) is registered in England and Wales with registered office at: Rex House, 10 Regent Street, London SW1Y 4PE.
Telephone 020 7024 6000. Russell Investments Limited (Company No. 02086230) is registered in England and Wales with registered office at: Rex House, 10 Regent Street,
London SW1Y 4PE. Telephone 020 7024 6000. Russell Implementation Services Limited and Russell Investments Limited are authorised and regulated by the Financial
Conduct Authority.
Nothing contained in this material is intended to constitute legal, tax, securities, or investment advice, nor an opinion regarding the appropriateness of any investment, nor a
solicitation of any type. The general information contained in this publication should not be acted upon without obtaining specific legal, tax, and investment advice from a licensed
professional.
Copyright © 2013 Russell Investments. All rights reserved. This material is proprietary and may not be reproduced, transferred, or distributed in any form without prior written
permission from Russell Investment Group. It is delivered on an “as is” basis without warranty.
Russell Investments is the owner of the trademarks, service marks, and copyrights related to its respective indexes.
The Russell logo is a trademark and service mark of Russell Investments.
Standard & Poor’s Corporation is the owner of the trademarks, service marks, and copyrights related to its indexes.
Indexes and/or benchmarks are unmanaged and cannot be invested in directly. Returns represent past performance, are not a guarantee of future performance, and are not
indicative of any specific investment.
The Russell Strategic Call Overwriting Fund is distributed by Russell Financial Services, Inc., member FINRA, part of Russell Investments.
Unless otherwise noted, source for the data in this presentation is Russell Implementation Services Inc.
Date of first use: September 2013
RIS RC:
p.2
Defining volatility

The opportunity: The demand for downside protection and alternative risk premia strategies ebbs and flows
p.4
Market Environment
›Low growth concern
›Artificially low yields
›High asset correlation
›Weak hedge fund
returns
›Income seeking
›Lowering volatility
Investor Response
›Exploring other asset
classes
›Rethinking portfolio
construction
›Reducing costs
›Utilizing alternative betas
The solution = finding
downside protection
one can live with!
Used with permission by Elliott Wave International, Inc. August 30, 2013. For illustrative purposes only

Correlation: Relationship of VIX Index versus S&P 500 Index Spot Price
Source: Bloomberg, Russell Investments. January 2, 1986 to July 31, 2013.
For illustrative purposes only. Standard & Poor’s Corporation is the owner of the trademarks, service marks, and copyrights related to its indexes.
Indexes are unmanaged and cannot be invested in directly. Returns represent past performance, are not a guarantee of future performance, and are not
indicative of any specific investment.
-100
100
300
500
700
900
1100
1300
1500
1700
0
20
40
60
80
100
120
140
160
SPXVIX
S&P US debt
downgrade& Euro Debt Crisis VIX
= 48
January 1986 - July 31, 2013
US Recession
VIX = 35
Bond Market
Sell-off VIX = 20
Asian Market Risk VIX = 37
LTCM VIX = 45
Tech Bubble VIX = 34
9/11 aftermath
VIX = 43Iraq War VIX = 45
Subprime Credit Crisis
VIX = 80
Soverign Debt
Crisis VIX = 40
Black Monday VIX = 150
Average VIX ~ 21
p.5
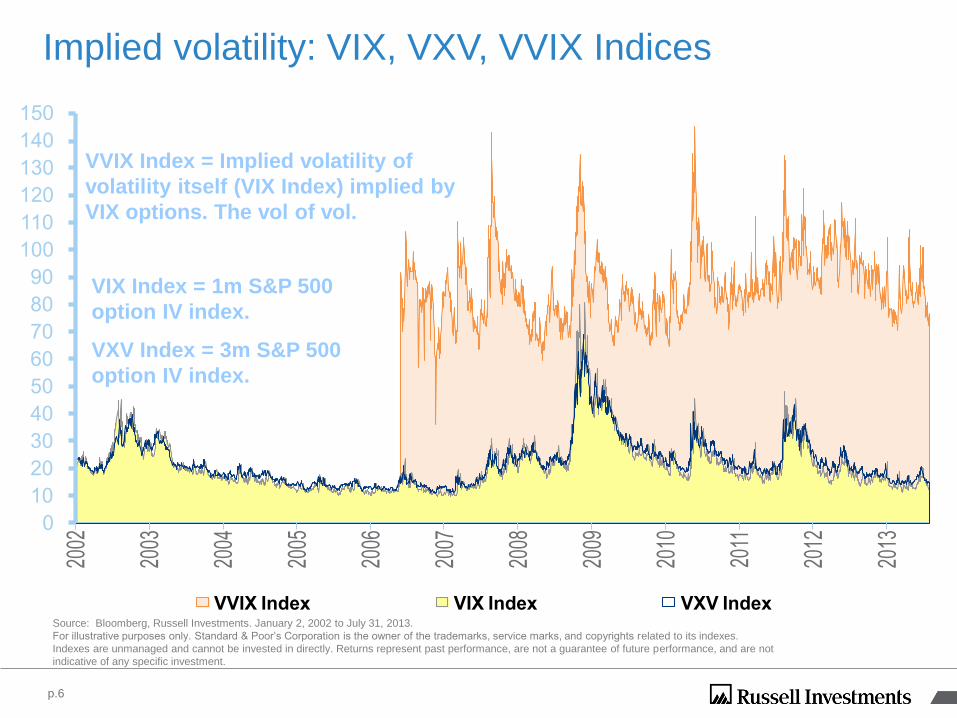
Implied volatility: VIX, VXV, VVIX Indices
Source: Bloomberg, Russell Investments. January 2, 2002 to July 31, 2013.
For illustrative purposes only. Standard & Poor’s Corporation is the owner of the trademarks, service marks, and copyrights related to its indexes.
Indexes are unmanaged and cannot be invested in directly. Returns represent past performance, are not a guarantee of future performance, and are not
indicative of any specific investment.
VVIX Index = Implied volatility of
volatility itself (VIX Index) implied by
VIX options. The vol of vol.
VIX Index = 1m S&P 500
option IV index.
VXV Index = 3m S&P 500
option IV index.
0
10
20
30
40
50
60
70
80
90
100
110
120
130
140
150
2002
2003
2004
2005
2006
2007
2008
2009
2010
2011
2012
2013
VVIX Index VIX Index VXV Index
p.6
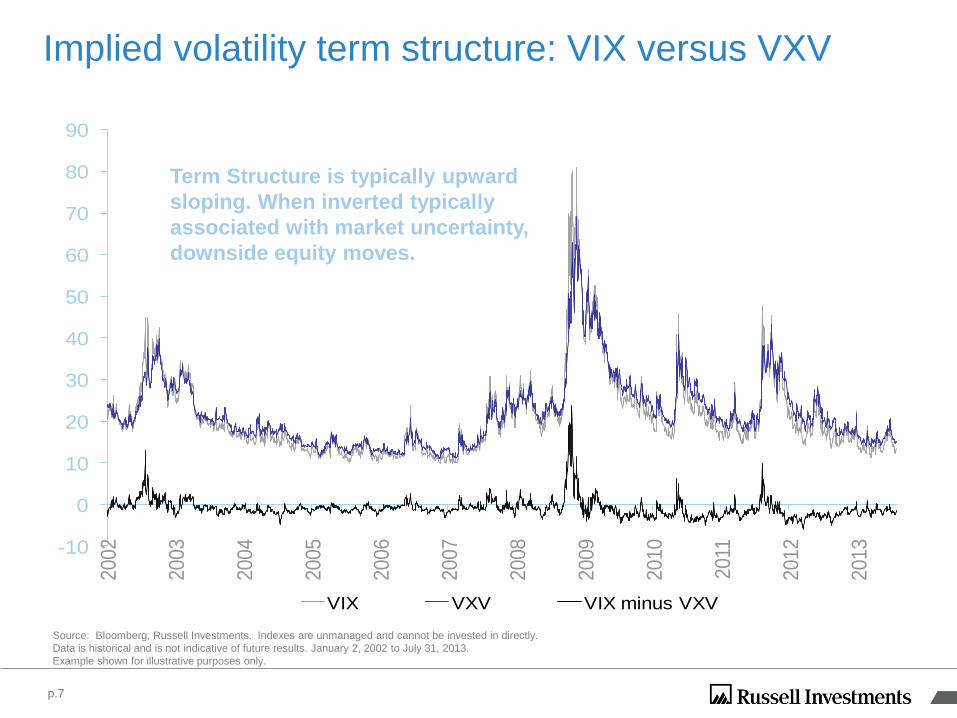
Implied volatility term structure: VIX versus VXV
Source: Bloomberg, Russell Investments. Indexes are unmanaged and cannot be invested in directly.
Data is historical and is not indicative of future results. January 2, 2002 to July 31, 2013.
Example shown for illustrative purposes only.
-10
0
10
20
30
40
50
60
70
80
902002
2003
2004
2005
2006
2007
2008
2009
2010
2011
2012
2013
VIX VXV VIX minus VXV
Term Structure is typically upward
sloping. When inverted typically
associated with market uncertainty,
downside equity moves.
p.7
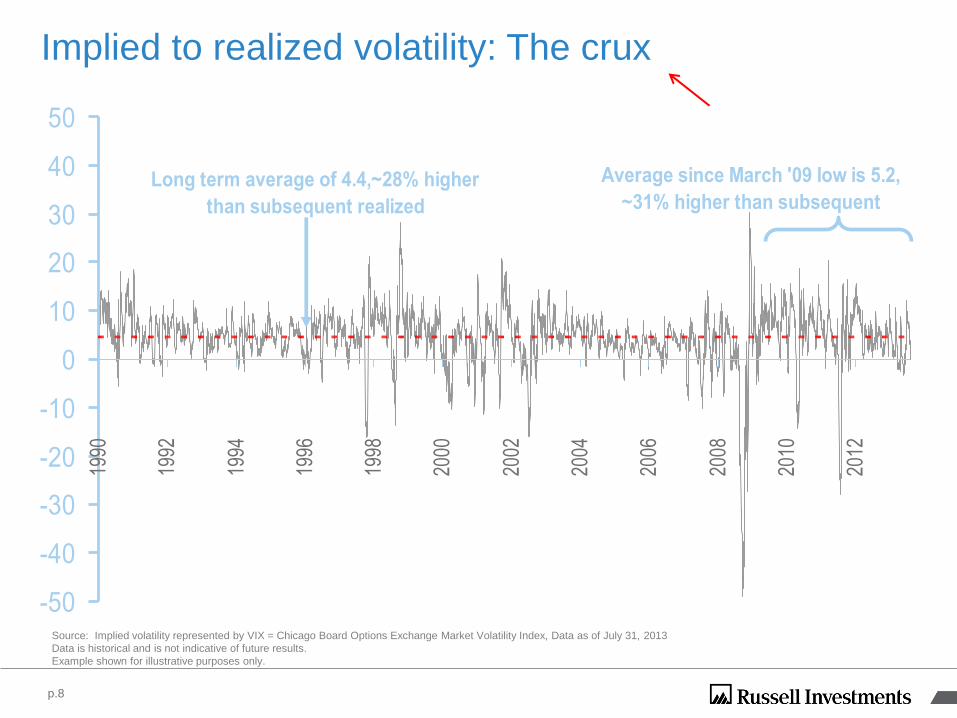
Implied to realized volatility: The crux
Source: Implied volatility represented by VIX = Chicago Board Options Exchange Market Volatility Index, Data as of July 31, 2013
Data is historical and is not indicative of future results.
Example shown for illustrative purposes only.
-50
-40
-30
-20
-10
0
10
20
30
40
5019
90
1992
1994
1996
1998
2000
2002
2004
2006
2008
2010
2012
Average since March '09 low is 5.2,
~31% higher than subsequent Long term average of 4.4,~28% higher
than subsequent realized
p.8
Volatility management framework
p.10
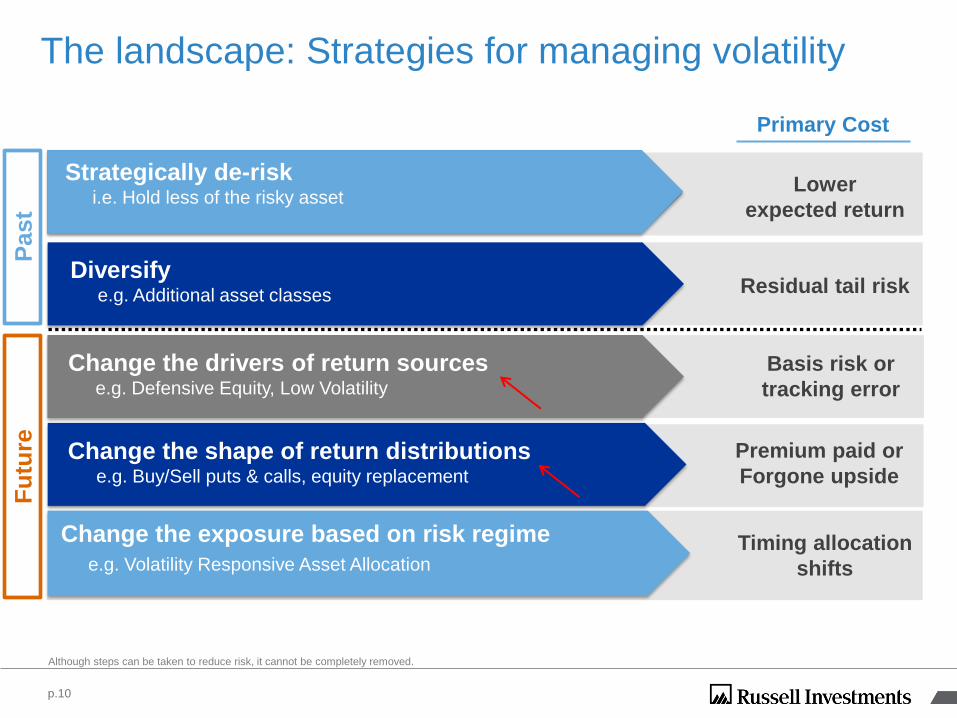
The landscape: Strategies for managing volatility
Although steps can be taken to reduce risk, it cannot be completely removed.
Lower
expected return
Residual tail risk Diversify
e.g. Additional asset classes
Primary Cost
Past
Fu
ture
Strategically de-risk i.e. Hold less of the risky asset
Change the shape of return distributions e.g. Buy/Sell puts & calls, equity replacement
Timing allocation
shifts
Change the exposure based on risk regime
e.g. Volatility Responsive Asset Allocation
Change the drivers of return sources e.g. Defensive Equity, Low Volatility
Premium paid or
Forgone upside
Basis risk or
tracking error
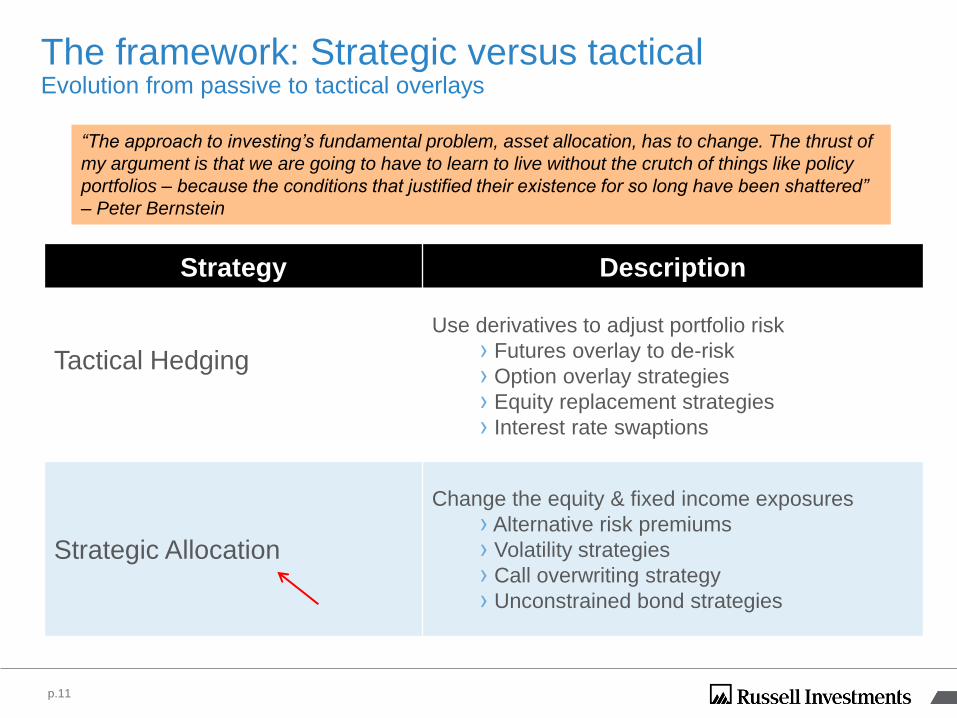
The framework: Strategic versus tactical Evolution from passive to tactical overlays
p.11
Strategy Description
Tactical Hedging
Use derivatives to adjust portfolio risk
› Futures overlay to de-risk
› Option overlay strategies
› Equity replacement strategies
› Interest rate swaptions
Strategic Allocation
Change the equity & fixed income exposures
› Alternative risk premiums
› Volatility strategies
› Call overwriting strategy
› Unconstrained bond strategies
“The approach to investing’s fundamental problem, asset allocation, has to change. The thrust of
my argument is that we are going to have to learn to live without the crutch of things like policy
portfolios – because the conditions that justified their existence for so long have been shattered”
– Peter Bernstein

Strategy construction & techniques
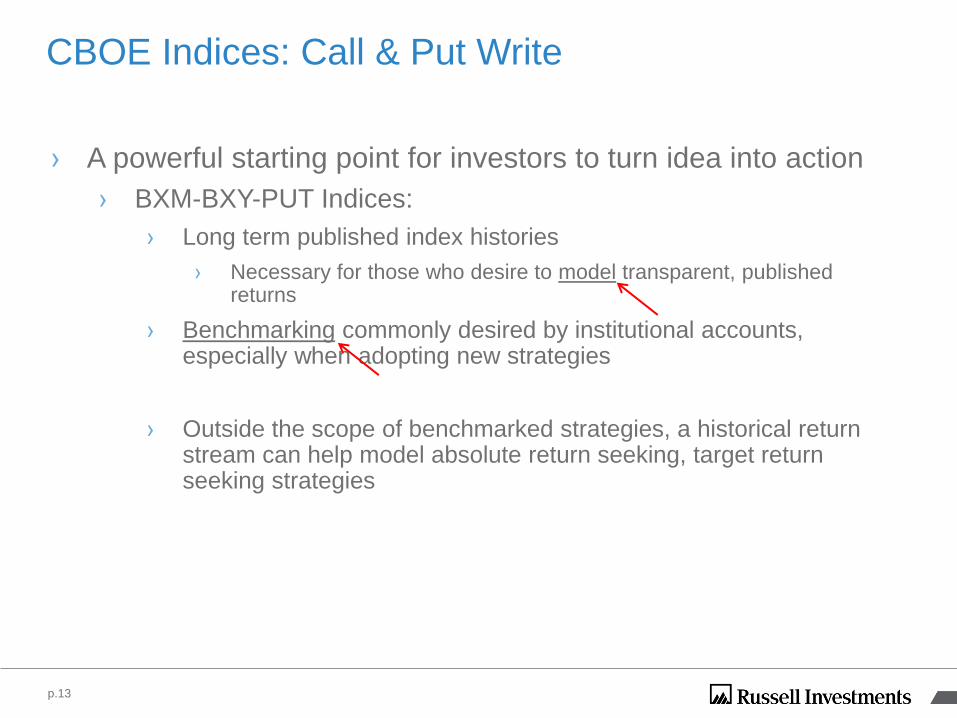
CBOE Indices: Call & Put Write
› A powerful starting point for investors to turn idea into action
› BXM-BXY-PUT Indices:
› Long term published index histories
› Necessary for those who desire to model transparent, published returns
› Benchmarking commonly desired by institutional accounts, especially when adopting new strategies
› Outside the scope of benchmarked strategies, a historical return stream can help model absolute return seeking, target return seeking strategies
p.13
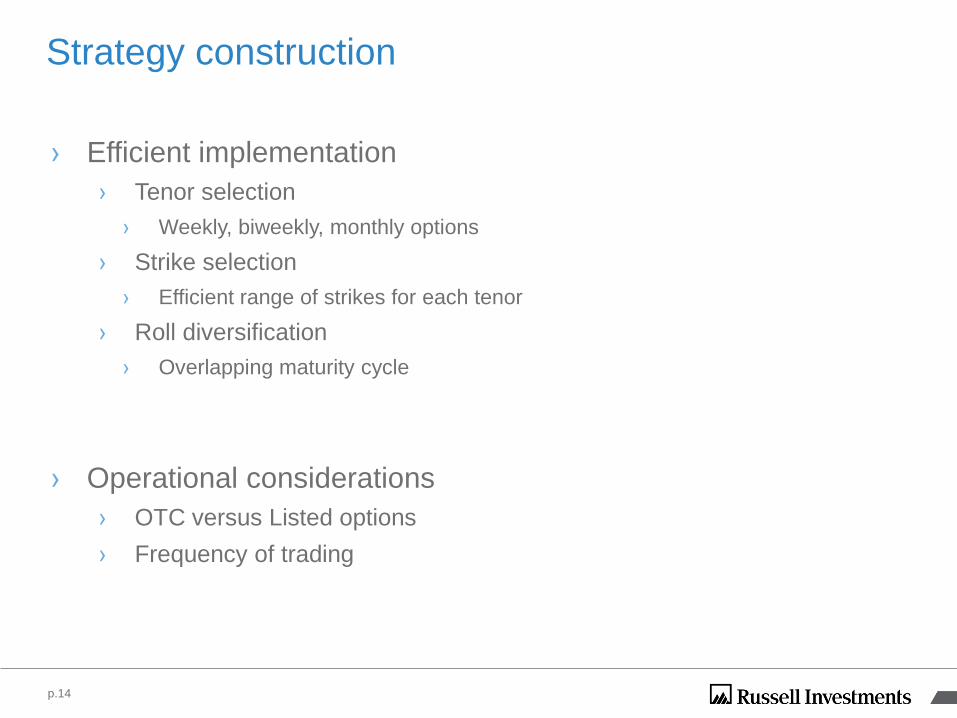
Strategy construction
› Efficient implementation
› Tenor selection
› Weekly, biweekly, monthly options
› Strike selection
› Efficient range of strikes for each tenor
› Roll diversification
› Overlapping maturity cycle
› Operational considerations
› OTC versus Listed options
› Frequency of trading
p.14
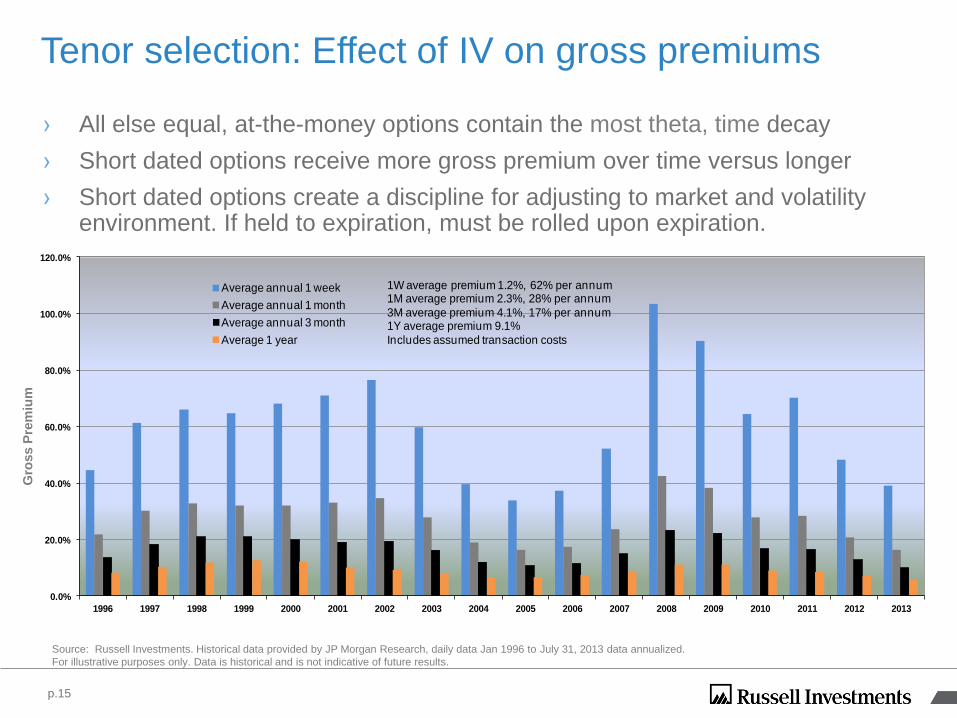
Tenor selection: Effect of IV on gross premiums
Source: Russell Investments. Historical data provided by JP Morgan Research, daily data Jan 1996 to July 31, 2013 data annualized.
For illustrative purposes only. Data is historical and is not indicative of future results.
0.0%
20.0%
40.0%
60.0%
80.0%
100.0%
120.0%
1996 1997 1998 1999 2000 2001 2002 2003 2004 2005 2006 2007 2008 2009 2010 2011 2012 2013
Average annual 1 week
Average annual 1 month
Average annual 3 month
Average 1 year
1W average premium 1.2%, 62% per annum1M average premium 2.3%, 28% per annum
3M average premium 4.1%, 17% per annum1Y average premium 9.1%
Includes assumed transaction costs
› All else equal, at-the-money options contain the most theta, time decay
› Short dated options receive more gross premium over time versus longer
› Short dated options create a discipline for adjusting to market and volatility environment. If held to expiration, must be rolled upon expiration.
p.15
Gro
ss P
rem
ium

Strike selection
› Fixed moneyness strike selection vs. Fixed delta strike selection
› Fixed “strike” = Defined by moneyness, variable delta
› Fixed “delta” = Defined by delta, variable strike
› Dynamic strategies seek to adjust the strike methodology of the call based on a variety of measures including technical analysis, volatility environment and overall portfolio risk measures
88 89 90 91 92 93 94 95 96 97 98 99 00 01 02 03 04 05 06 07 08 09 10 11 12 ITD
Annual Returns (%) Cumulative
SPTR 6.3 31.7 -3.1 30.5 7.6 10.1 1.3 37.6 23.0 33.4 28.6 21.0 -9.1 -11.9 -22.1 28.7 10.9 4.9 15.8 5.5 -37.0 26.5 15.1 2.1 16.0 769.25%
BXM 8.1 25.0 4.0 24.4 11.5 14.1 4.5 21.0 15.5 26.6 19.0 21.2 7.4 -10.9 -7.6 19.4 8.3 4.2 13.3 6.6 -28.7 25.9 5.9 5.7 5.2 734.26%
BXY 9.8 32.6 1.9 22.9 11.0 11.0 4.6 33.2 19.8 29.8 21.2 19.7 2.0 -11.4 -12.3 24.9 9.7 4.4 17.1 6.1 -31.2 32.1 9.8 7.2 10.2 969.95%
Outperformance (%)
BXM-SPTR 1.8 -6.7 7.1 -6.1 3.9 4.0 3.2 -16.6 -7.5 -6.7 -9.6 0.2 16.5 1.0 14.5 -9.3 -2.6 -0.7 -2.5 1.1 8.3 -0.6 -9.2 3.6 -10.8 -35%
BXY-SPTR 3.5 0.9 5.0 -7.5 3.4 0.9 3.3 -4.4 -3.1 -3.6 -7.3 -1.3 11.1 0.5 9.8 -3.8 -1.2 -0.5 1.3 0.6 5.8 5.6 -5.2 5.1 -5.8 201%
p.16
Source: Russell Investments, Bloomberg. Annual data January 1988 to December 2012.
Returns represent past performance, are not a guarantee of future performance,
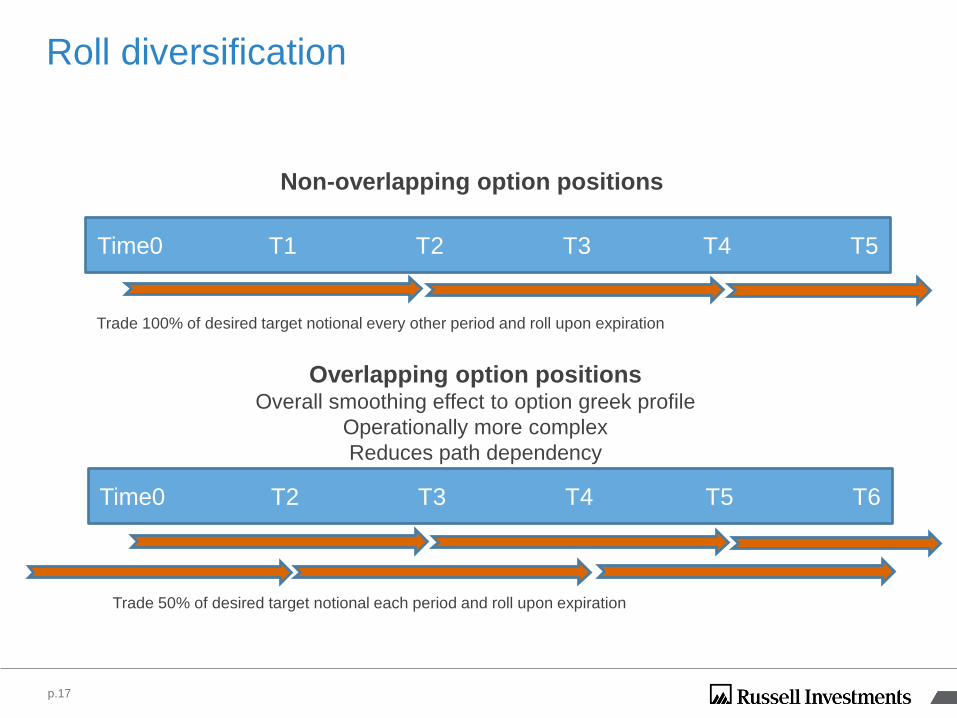
Roll diversification
Non-overlapping option positions
Overlapping option positions Overall smoothing effect to option greek profile
Operationally more complex
Reduces path dependency
Time0 T1 T2 T3 T4 T5
Time0 T2 T3 T4 T5 T6
Trade 100% of desired target notional every other period and roll upon expiration
Trade 50% of desired target notional each period and roll upon expiration
p.17

Strategy & operational considerations
› Frequency of portfolio management and trading
› Availability of listed strikes and tenors versus OTC options
› Margin requirements for listed versus OTC
› Frequency of settlement
› Reporting requirements
p.18
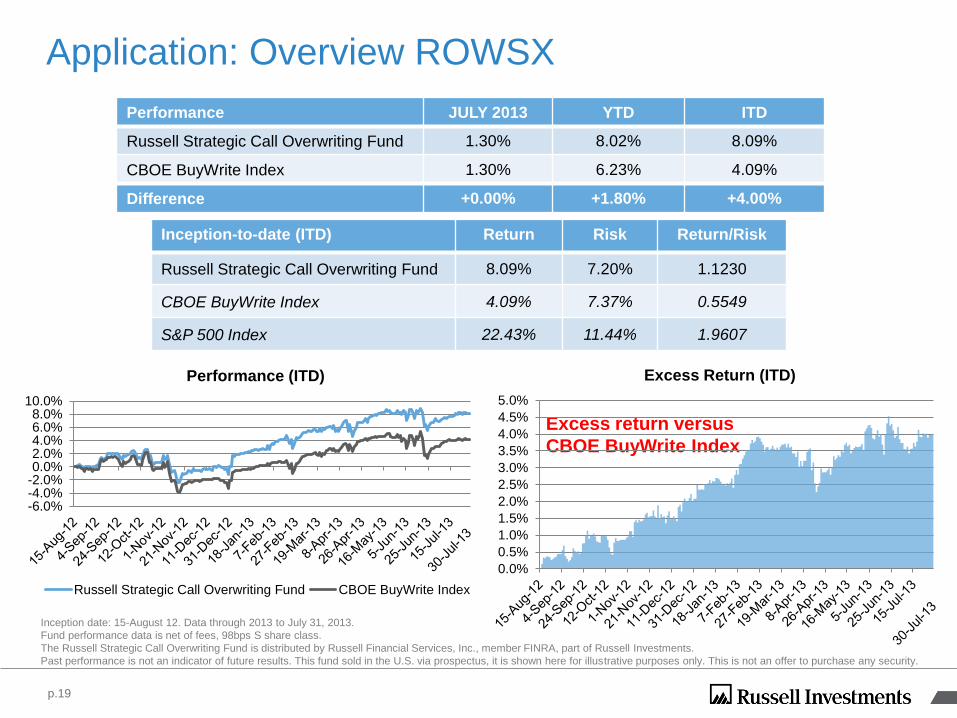
Application: Overview ROWSX
Inception date: 15-August 12. Data through 2013 to July 31, 2013.
Fund performance data is net of fees, 98bps S share class.
The Russell Strategic Call Overwriting Fund is distributed by Russell Financial Services, Inc., member FINRA, part of Russell Investments.
Past performance is not an indicator of future results. This fund sold in the U.S. via prospectus, it is shown here for illustrative purposes only. This is not an offer to purchase any security.
Excess return versus
CBOE BuyWrite Index
Performance JULY 2013 YTD ITD
Russell Strategic Call Overwriting Fund 1.30% 8.02% 8.09%
CBOE BuyWrite Index 1.30% 6.23% 4.09%
Difference +0.00% +1.80% +4.00%
Inception-to-date (ITD) Return Risk Return/Risk
Russell Strategic Call Overwriting Fund 8.09% 7.20% 1.1230
CBOE BuyWrite Index 4.09% 7.37% 0.5549
S&P 500 Index 22.43% 11.44% 1.9607
-6.0%-4.0%-2.0%0.0%2.0%4.0%6.0%8.0%
10.0%
Performance (ITD)
Russell Strategic Call Overwriting Fund CBOE BuyWrite Index
0.0%
0.5%
1.0%
1.5%
2.0%
2.5%
3.0%
3.5%
4.0%
4.5%
5.0%
Excess Return (ITD)
p.19