using multiazimuth seismic data for anisotropy estimation in an...
TRANSCRIPT
1
Using Multiazimuth Seismic Data for Anisotropy Estimation in an Unconventional Reservoir Ms. Surabhi Mishra Santos 60 Flinders Street, Adelaide [email protected]
SUMMARY
Productivity of a well in an unconventional reservoir is governed by various static and dynamic reservoir characteristics. Many
of these characteristics have proxies among pre and post stack seismic attributes that can be derived from Multiazimuth 3D
Seismic Data. The task of a geoscientist in this kind of reservoir is to understand these proxies to predict production behaviour.
Natural fracture density and azimuth, as well as horizontal stress azimuth are the key attributes that seismic can help predict.
Seismic Velocity and Amplitude variations with azimuth can be used to predict fracture strike, relative fracture density and
define potential structural sweet spots. Azimuthal data from a Multiazimuth 3D seismic survey in the Nappamerri Trough of
Cooper Basin has been interpreted to estimate fracture intensity and orientation. Co-rendered structural maps are used to create
stress maps for different interval of interest. Stress maps help to identify areas of higher anisotropy and areas of lower minimum
horizontal stress and so facilitate optimised well placement. To test the geological significance of these maps, correlation of
stress vectors against well Image log and cross dipole sonic data was completed. This ground truth validates the prediction of
direction and distribution of reservoir fractures based on full azimuth seismic data in this area.
Key words: Multiazimuth 3D; Anisotropy; Horizontal Stress; Stress maps
INTRODUCTION
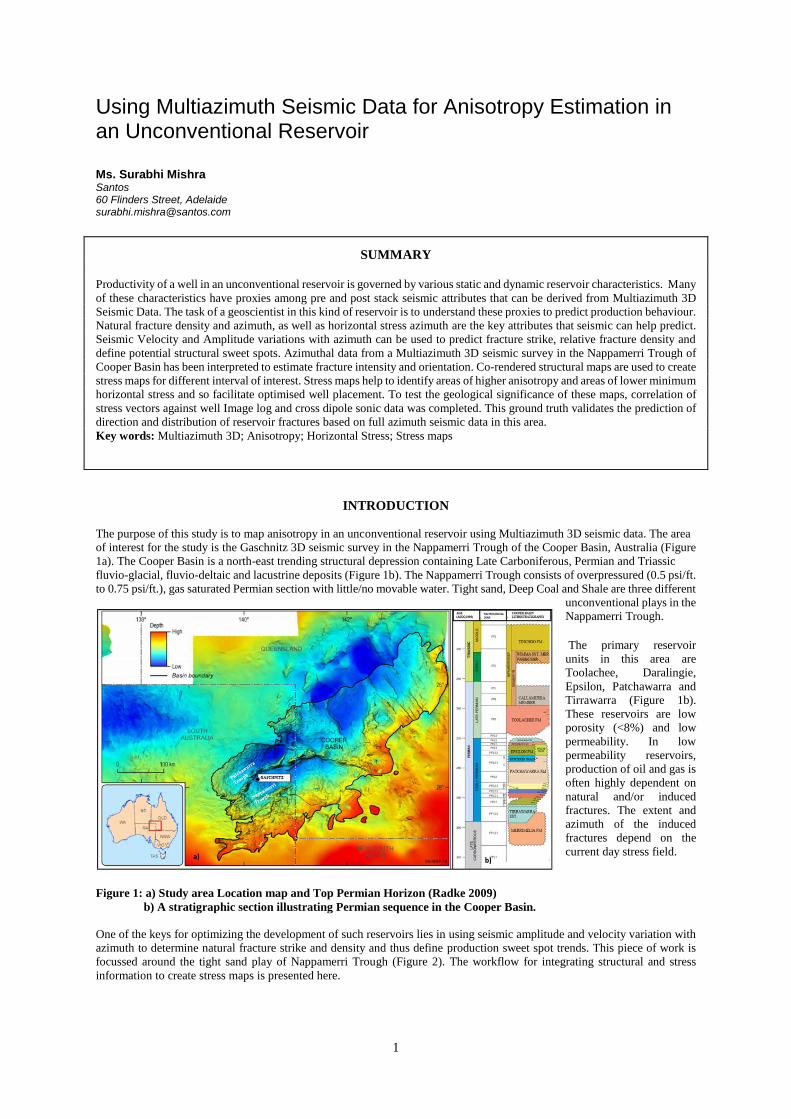
The purpose of this study is to map anisotropy in an unconventional reservoir using Multiazimuth 3D seismic data. The area
of interest for the study is the Gaschnitz 3D seismic survey in the Nappamerri Trough of the Cooper Basin, Australia (Figure
1a). The Cooper Basin is a north-east trending structural depression containing Late Carboniferous, Permian and Triassic
fluvio-glacial, fluvio-deltaic and lacustrine deposits (Figure 1b). The Nappamerri Trough consists of overpressured (0.5 psi/ft.
to 0.75 psi/ft.), gas saturated Permian section with little/no movable water. Tight sand, Deep Coal and Shale are three different
unconventional plays in the
Nappamerri Trough.
The primary reservoir
units in this area are
Toolachee, Daralingie,
Epsilon, Patchawarra and
Tirrawarra (Figure 1b).
These reservoirs are low
porosity (<8%) and low
permeability. In low
permeability reservoirs,
production of oil and gas is
often highly dependent on
natural and/or induced
fractures. The extent and
azimuth of the induced
fractures depend on the
current day stress field.
Figure 1: a) Study area Location map and Top Permian Horizon (Radke 2009)
b) A stratigraphic section illustrating Permian sequence in the Cooper Basin.
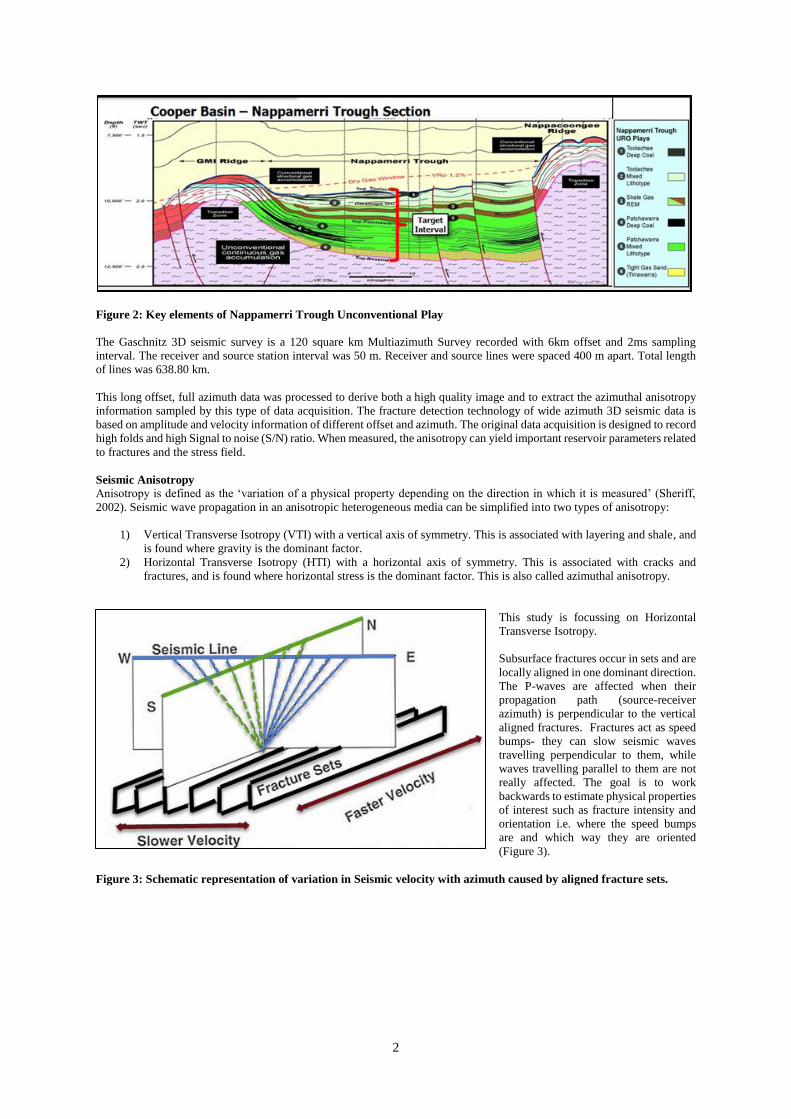
One of the keys for optimizing the development of such reservoirs lies in using seismic amplitude and velocity variation with
azimuth to determine natural fracture strike and density and thus define production sweet spot trends. This piece of work is
focussed around the tight sand play of Nappamerri Trough (Figure 2). The workflow for integrating structural and stress
information to create stress maps is presented here.
2
Figure 2: Key elements of Nappamerri Trough Unconventional Play
The Gaschnitz 3D seismic survey is a 120 square km Multiazimuth Survey recorded with 6km offset and 2ms sampling
interval. The receiver and source station interval was 50 m. Receiver and source lines were spaced 400 m apart. Total length
of lines was 638.80 km.
This long offset, full azimuth data was processed to derive both a high quality image and to extract the azimuthal anisotropy
information sampled by this type of data acquisition. The fracture detection technology of wide azimuth 3D seismic data is
based on amplitude and velocity information of different offset and azimuth. The original data acquisition is designed to record
high folds and high Signal to noise (S/N) ratio. When measured, the anisotropy can yield important reservoir parameters related
to fractures and the stress field.
Seismic Anisotropy
Anisotropy is defined as the ‘variation of a physical property depending on the direction in which it is measured’ (Sheriff,
2002). Seismic wave propagation in an anisotropic heterogeneous media can be simplified into two types of anisotropy:
1) Vertical Transverse Isotropy (VTI) with a vertical axis of symmetry. This is associated with layering and shale, and
is found where gravity is the dominant factor.
2) Horizontal Transverse Isotropy (HTI) with a horizontal axis of symmetry. This is associated with cracks and
fractures, and is found where horizontal stress is the dominant factor. This is also called azimuthal anisotropy.
This study is focussing on Horizontal
Transverse Isotropy.
Subsurface fractures occur in sets and are
locally aligned in one dominant direction.
The P-waves are affected when their
propagation path (source-receiver
azimuth) is perpendicular to the vertical
aligned fractures. Fractures act as speed
bumps- they can slow seismic waves
travelling perpendicular to them, while
waves travelling parallel to them are not
really affected. The goal is to work
backwards to estimate physical properties
of interest such as fracture intensity and
orientation i.e. where the speed bumps
are and which way they are oriented
(Figure 3).
Figure 3: Schematic representation of variation in Seismic velocity with azimuth caused by aligned fracture sets.
3
METHOD AND RESULTS
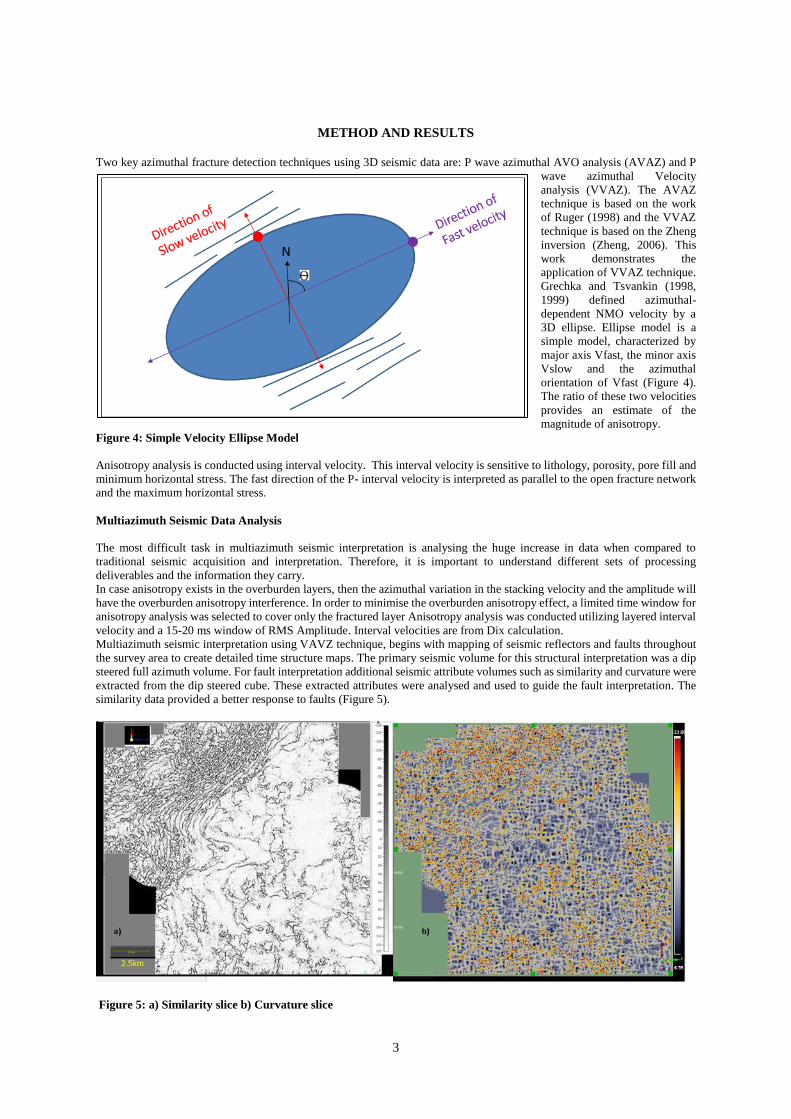
Two key azimuthal fracture detection techniques using 3D seismic data are: P wave azimuthal AVO analysis (AVAZ) and P
wave azimuthal Velocity
analysis (VVAZ). The AVAZ
technique is based on the work
of Ruger (1998) and the VVAZ
technique is based on the Zheng
inversion (Zheng, 2006). This
work demonstrates the
application of VVAZ technique.
Grechka and Tsvankin (1998,
1999) defined azimuthal-
dependent NMO velocity by a
3D ellipse. Ellipse model is a
simple model, characterized by
major axis Vfast, the minor axis
Vslow and the azimuthal
orientation of Vfast (Figure 4).
The ratio of these two velocities
provides an estimate of the
magnitude of anisotropy.
Figure 4: Simple Velocity Ellipse Model
Anisotropy analysis is conducted using interval velocity. This interval velocity is sensitive to lithology, porosity, pore fill and
minimum horizontal stress. The fast direction of the P- interval velocity is interpreted as parallel to the open fracture network
and the maximum horizontal stress.
Multiazimuth Seismic Data Analysis
The most difficult task in multiazimuth seismic interpretation is analysing the huge increase in data when compared to
traditional seismic acquisition and interpretation. Therefore, it is important to understand different sets of processing
deliverables and the information they carry.
In case anisotropy exists in the overburden layers, then the azimuthal variation in the stacking velocity and the amplitude will
have the overburden anisotropy interference. In order to minimise the overburden anisotropy effect, a limited time window for
anisotropy analysis was selected to cover only the fractured layer Anisotropy analysis was conducted utilizing layered interval
velocity and a 15-20 ms window of RMS Amplitude. Interval velocities are from Dix calculation.
Multiazimuth seismic interpretation using VAVZ technique, begins with mapping of seismic reflectors and faults throughout
the survey area to create detailed time structure maps. The primary seismic volume for this structural interpretation was a dip
steered full azimuth volume. For fault interpretation additional seismic attribute volumes such as similarity and curvature were
extracted from the dip steered cube. These extracted attributes were analysed and used to guide the fault interpretation. The
similarity data provided a better response to faults (Figure 5).
Figure 5: a) Similarity slice b) Curvature slice
4
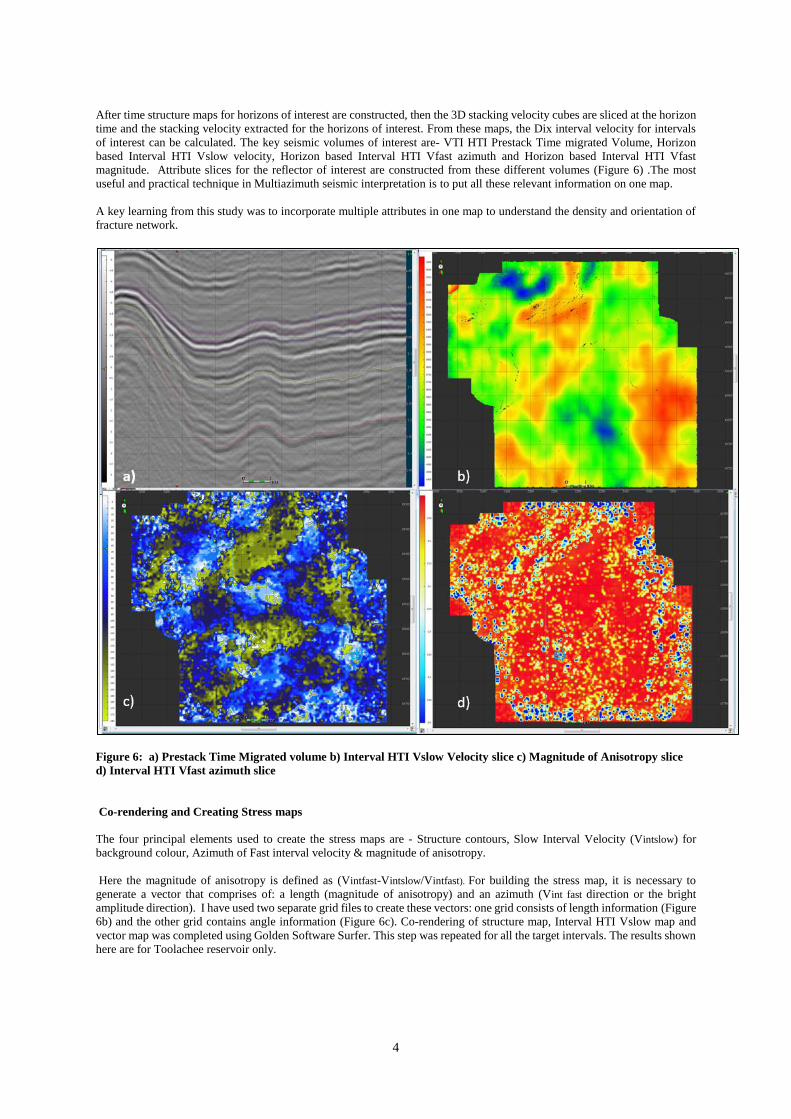
After time structure maps for horizons of interest are constructed, then the 3D stacking velocity cubes are sliced at the horizon
time and the stacking velocity extracted for the horizons of interest. From these maps, the Dix interval velocity for intervals
of interest can be calculated. The key seismic volumes of interest are- VTI HTI Prestack Time migrated Volume, Horizon
based Interval HTI Vslow velocity, Horizon based Interval HTI Vfast azimuth and Horizon based Interval HTI Vfast
magnitude. Attribute slices for the reflector of interest are constructed from these different volumes (Figure 6) .The most
useful and practical technique in Multiazimuth seismic interpretation is to put all these relevant information on one map.
A key learning from this study was to incorporate multiple attributes in one map to understand the density and orientation of
fracture network.
Figure 6: a) Prestack Time Migrated volume b) Interval HTI Vslow Velocity slice c) Magnitude of Anisotropy slice
d) Interval HTI Vfast azimuth slice
Co-rendering and Creating Stress maps
The four principal elements used to create the stress maps are - Structure contours, Slow Interval Velocity (Vintslow) for
background colour, Azimuth of Fast interval velocity & magnitude of anisotropy.
Here the magnitude of anisotropy is defined as (Vintfast-Vintslow/Vintfast). For building the stress map, it is necessary to
generate a vector that comprises of: a length (magnitude of anisotropy) and an azimuth (Vint fast direction or the bright
amplitude direction). I have used two separate grid files to create these vectors: one grid consists of length information (Figure
6b) and the other grid contains angle information (Figure 6c). Co-rendering of structure map, Interval HTI Vslow map and
vector map was completed using Golden Software Surfer. This step was repeated for all the target intervals. The results shown
here are for Toolachee reservoir only.
5
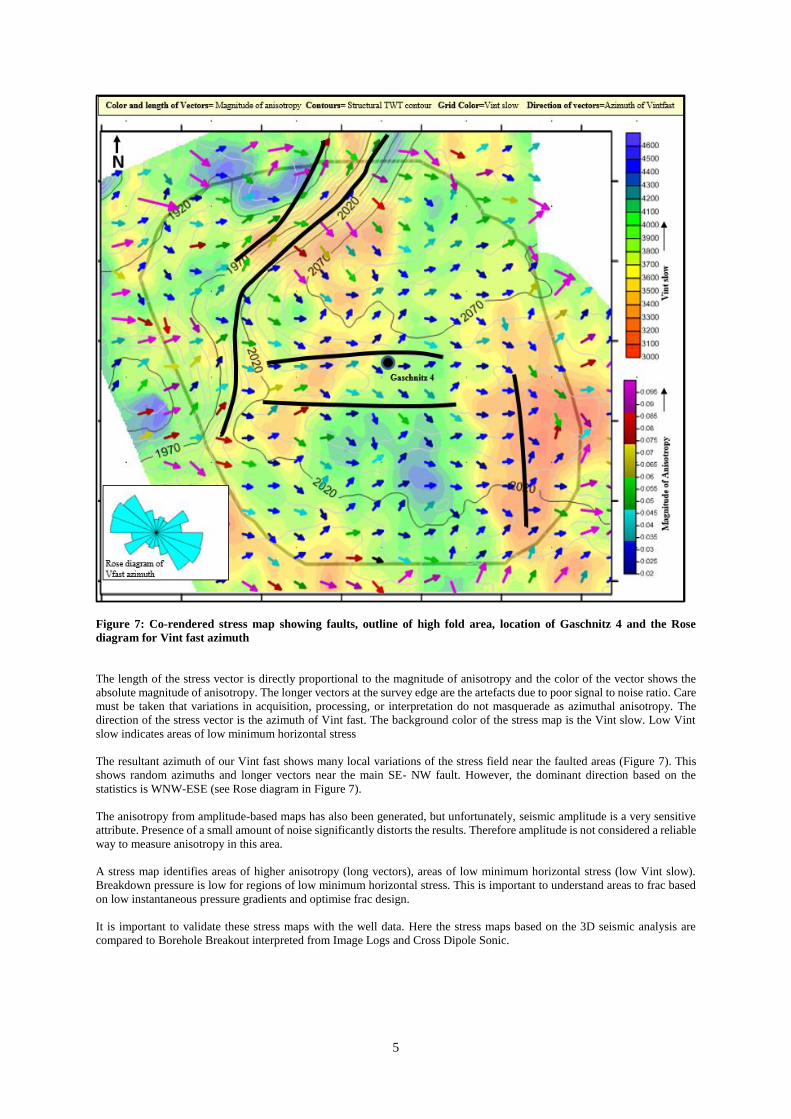
Figure 7: Co-rendered stress map showing faults, outline of high fold area, location of Gaschnitz 4 and the Rose
diagram for Vint fast azimuth
The length of the stress vector is directly proportional to the magnitude of anisotropy and the color of the vector shows the
absolute magnitude of anisotropy. The longer vectors at the survey edge are the artefacts due to poor signal to noise ratio. Care
must be taken that variations in acquisition, processing, or interpretation do not masquerade as azimuthal anisotropy. The
direction of the stress vector is the azimuth of Vint fast. The background color of the stress map is the Vint slow. Low Vint
slow indicates areas of low minimum horizontal stress
The resultant azimuth of our Vint fast shows many local variations of the stress field near the faulted areas (Figure 7). This
shows random azimuths and longer vectors near the main SE- NW fault. However, the dominant direction based on the
statistics is WNW-ESE (see Rose diagram in Figure 7).
The anisotropy from amplitude-based maps has also been generated, but unfortunately, seismic amplitude is a very sensitive
attribute. Presence of a small amount of noise significantly distorts the results. Therefore amplitude is not considered a reliable
way to measure anisotropy in this area.
A stress map identifies areas of higher anisotropy (long vectors), areas of low minimum horizontal stress (low Vint slow).
Breakdown pressure is low for regions of low minimum horizontal stress. This is important to understand areas to frac based
on low instantaneous pressure gradients and optimise frac design.
It is important to validate these stress maps with the well data. Here the stress maps based on the 3D seismic analysis are
compared to Borehole Breakout interpreted from Image Logs and Cross Dipole Sonic.
6
Image Log Analysis
Image log data from Gaschnitz 4 has been used for validation. STAR borehole image log data was run in Gaschnitz 4 by Baker
Hughes. The structural and sedimentological interpretation of this STAR borehole image log data was completed by Task
Fronterra Geoscience.
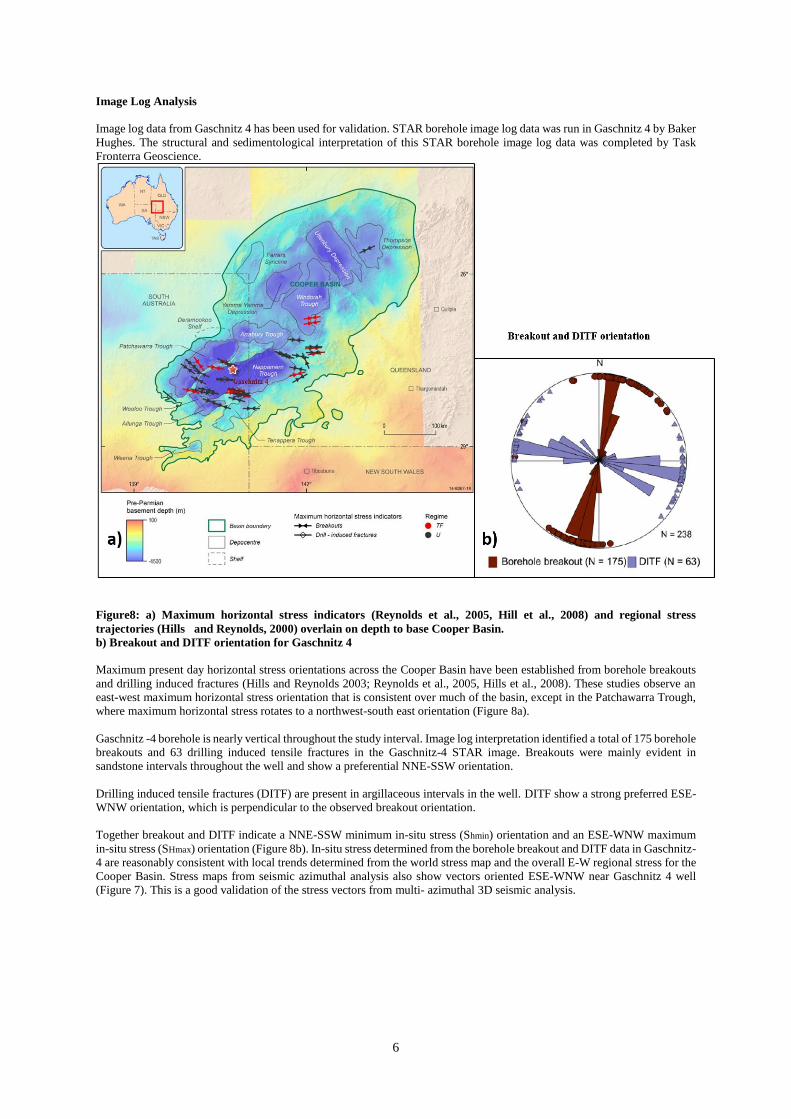
Figure8: a) Maximum horizontal stress indicators (Reynolds et al., 2005, Hill et al., 2008) and regional stress
trajectories (Hills and Reynolds, 2000) overlain on depth to base Cooper Basin.
b) Breakout and DITF orientation for Gaschnitz 4
Maximum present day horizontal stress orientations across the Cooper Basin have been established from borehole breakouts
and drilling induced fractures (Hills and Reynolds 2003; Reynolds et al., 2005, Hills et al., 2008). These studies observe an
east-west maximum horizontal stress orientation that is consistent over much of the basin, except in the Patchawarra Trough,
where maximum horizontal stress rotates to a northwest-south east orientation (Figure 8a).
Gaschnitz -4 borehole is nearly vertical throughout the study interval. Image log interpretation identified a total of 175 borehole
breakouts and 63 drilling induced tensile fractures in the Gaschnitz-4 STAR image. Breakouts were mainly evident in
sandstone intervals throughout the well and show a preferential NNE-SSW orientation.
Drilling induced tensile fractures (DITF) are present in argillaceous intervals in the well. DITF show a strong preferred ESE-
WNW orientation, which is perpendicular to the observed breakout orientation.
Together breakout and DITF indicate a NNE-SSW minimum in-situ stress (Shmin) orientation and an ESE-WNW maximum
in-situ stress (SHmax) orientation (Figure 8b). In-situ stress determined from the borehole breakout and DITF data in Gaschnitz-
4 are reasonably consistent with local trends determined from the world stress map and the overall E-W regional stress for the
Cooper Basin. Stress maps from seismic azimuthal analysis also show vectors oriented ESE-WNW near Gaschnitz 4 well
(Figure 7). This is a good validation of the stress vectors from multi- azimuthal 3D seismic analysis.
7
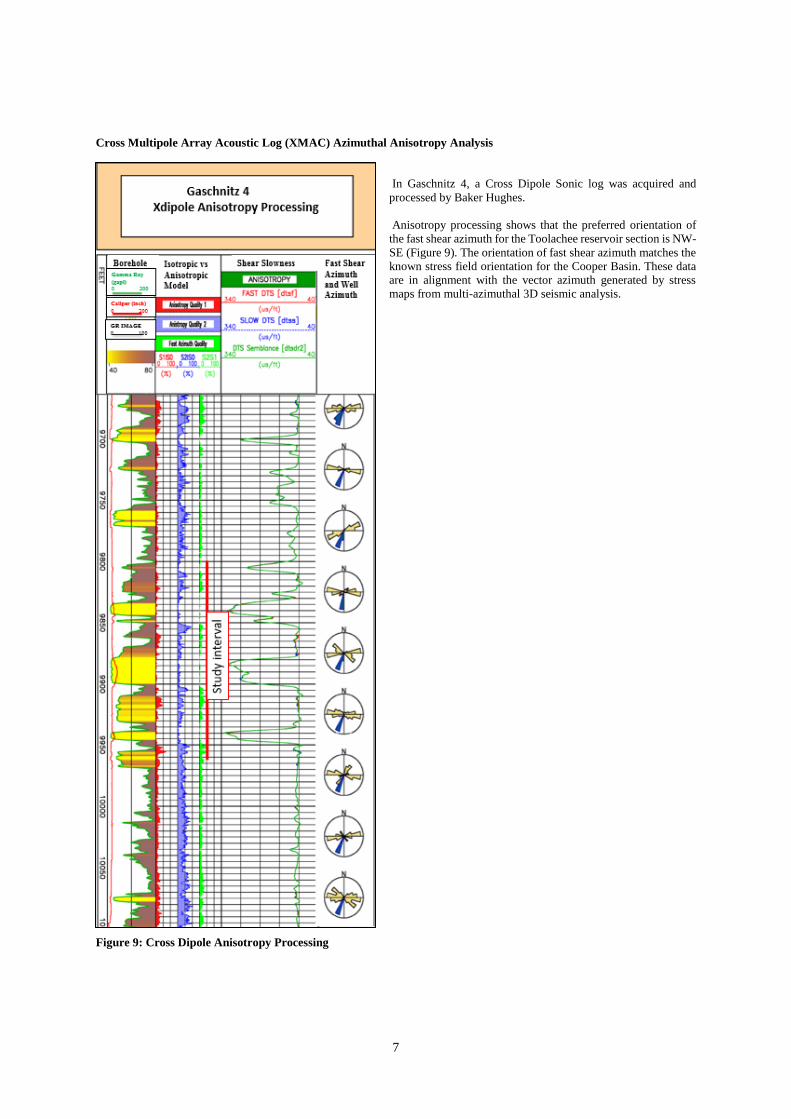
Cross Multipole Array Acoustic Log (XMAC) Azimuthal Anisotropy Analysis
In Gaschnitz 4, a Cross Dipole Sonic log was acquired and
processed by Baker Hughes.
Anisotropy processing shows that the preferred orientation of
the fast shear azimuth for the Toolachee reservoir section is NW-
SE (Figure 9). The orientation of fast shear azimuth matches the
known stress field orientation for the Cooper Basin. These data
are in alignment with the vector azimuth generated by stress
maps from multi-azimuthal 3D seismic analysis.
Figure 9: Cross Dipole Anisotropy Processing
8
CONCLUSIONS
In unconventional reservoirs, fractures and azimuth variation of the horizontal stress cause azimuthal anisotropy. Seismic P-
waves travelling through fractured media exhibit azimuthal variation in travel time and amplitude. If these signatures are
measured and interpreted, valuable information related to either fractures presence or orientation and/or the stress field can be
inferred. Understanding the fracture intensity, direction and maximum stress field is helpful in the choice of drilling direction,
fracture placement, well design and cost effective completion.
More recently, high quality wide azimuth seismic surveys are being acquired to enhance the total value of unconventional
assets through improved imaging quality, resolution and new deliverables including representations of fracture or stress
orientations and intensity. However multiazimuth seismic interpretation is still a challenging issue. There are different
opinions regarding the efficacy of VVAZ/AVAZ techniques. In Gaschnitz, VVAZ technique was practically more effective
for creating stress maps. This study shows a novel way for interpreters to interact with seismic data to create stress maps. It is
observed that the seismic anisotropy maps showed a dominant direction (WNW-ESE) that matches with the well data and
validates horizontal stress direction. However we need more well-bore data to provide a better statistical validation. In the
production stage of the field, it is recommended to test and validate these stress maps with dynamic reservoir data.
ACKNOWLEDGMENTS
The author wishes to thank Santos Ltd., Delhi Petroleum Pty Ltd. and Lattice Energy Ltd. for permission to publish and present
this work.
REFERENCES
Grechka, V., and I. Tsvankin, 1998, 3-D description of normal moveout in anisotropic inhomogeneous media: Geophysics,
63, 614–629.
Hall, L. S., Hill, A. J., Troup, A., Korsch, R. J., Radke, B., Nicoll, R. S., Palu, T. J., Wang, L.1 & Stacey, A.,
Cooper Basin Architecture and Lithofacies. Regional Hydrocarbon Propsectivity of the Cooper Basin, Part1. Record
2015/31, Geoscience Australia
Hillis, R.R. & Reynolds, S.D. 2000. The Australian Stress Map. Journal of the Geological Society, London, 157, 915–921.
Hillis, R.R., Sandiford, M., Reynolds, S.D. & Quigley, M.C. 2008. Present-day stresses, seismicity and Neogene-to-recent
tectonics of Australia’s passive margins: intraplate deformation controlled by plate boundary forces. In: Johnson, H., Dore,
A.G., Gatliff, R.W., Holdsworth, R., Lundin, E. & Ritchie, J.D. (eds.), The Nature and Origin of Compressive Margins.
Geological Society London Special Publications, 306, 71–89.
Lynn, H. B., Simon, M., Beckham ,W : Fracture detection, mapping and analysis of naturally fractured gas reservoirs using
P-wave reflection seismic, SEG Technical Program Expanded Abstracts:pp1210-1213.
Lynn, H.B., Simon, K.M., Bates, C. and Van Dok, R., 1996, Azimuthal anisotropy in P-wave (muiltiazimuth) data: The
Leading
Edge, 15, No. 8, 923 – 928.
Pertz , Mike., Cary, Peter., Li, XinXiang., Chopra, Satinder : Fracture detection via azimuthal analysis of seimic data:snale
oil or silver bullet: Integration geocenvention 2013, Geoscience Engineering partnetrship.
Radke, B., 2009, Hydrocarbon & Geothermal Prospectivity of Sedimentary Basins in Central Australia; Warburton, Cooper,
Pedirka, Galilee, Simpson and Eromanga Basins. Record 2009/25, Geoscience Australia.
Reynolds, S.D., Mildren, S.D., Hillis, R.R., Meyer, J.J. & Flottmann, T. 2005. Maximum horizontal stress orientations in the
Cooper Basin, Australia: implications for plate-scale tectonics and local stress sources. Geophysical Journal International,
160, 331–343.
Rüger, A., 1998, Variation of P-wave reflectivity with offset and azimuth in anisotropic media: Geophysics, 63, 935 - 947.
Sheriff, R.E. [2002] Encyclopedic Dictionary of Applied Geophysics. 4th Edition, Geophysical References Series 13, Society
of Exploration Geophysicists
Zhang, Kui., 2010, Seismic Attribute Analaysis of Unconventional Reservoirs, and stratigraphic patterns: Dissertation for
ConocoPhillips School of Geology and Geophysics.
Zheng, Y., 2006, Seimic azimuthal anisotropy and fracture analysis from PP reflection data: Ph.D. dissertation, University of
Calgary.