using indirect protein interactions for the prediction of gene ontology functions
TRANSCRIPT
BioMed CentralBMC Bioinformatics
ss
Open AcceProceedingsUsing indirect protein interactions for the prediction of Gene Ontology functionsHon Nian Chua, Wing-Kin Sung and Limsoon Wong*Address: School of Computing, National University of Singapore, Singapore, 117543, Singapore
Email: Hon Nian Chua - [email protected]; Wing-Kin Sung - [email protected]; Limsoon Wong* - [email protected]
* Corresponding author
AbstractBackground: Protein-protein interaction has been used to complement traditional sequencehomology to elucidate protein function. Most existing approaches only make use of directinteractions to infer function, and some have studied the application of indirect interactions forfunctional inference but are unable to improve prediction performance. We have previouslyproposed an approach, FS-Weighted Averaging, which uses topological weighting and level-2indirect interactions (protein pairs connected via two interactions) for predicting protein functionfrom protein interactions and have found that it yields predictions with superior precision on yeastproteins over existing approaches. Here we study the use of this technique to predict functionalannotations from the Gene Ontology for seven genomes: Saccharomyces cerevisiae, Drosophilamelanogaster, Caenorhabditis elegans, Arabidopsis thaliana, Rattus norvegicus, Mus musculus, and Homosapiens.
Results: Our analysis shows that protein-protein interactions provide supplementary coverageover sequence homology in the inference of protein function and is definitely a complement tosequence homology. We also find that FS-Weighted Averaging consistently outperforms twoclassical approaches, Neighbor Counting and Chi-Square, across the seven genomes for all threecategories of the Gene Ontology. By randomly adding and removing interactions from theinteractions, we find that Weighted Averaging is also rather robust against noisy interaction data.
Conclusion: We have conducted a comprehensive study over seven genomes. We conclude thatFS-Weighted Averaging can effectively make use of indirect interactions to make the inference ofprotein functions from protein interactions more effective. Furthermore, the technique is generalenough to work over a variety of genomes.
BackgroundAlthough sequence similarity search has proven useful inmany cases, it has fundamental limitations. First, only a
fraction of newly discovered sequences have identifiablehomologous genes in current databases. Second, the mostprominent vertebrate organisms in GenBank have only a
from The Second Automated Function Prediction MeetingLa Jolla, CA, USA. 30 August – 1 September 2006
Published: 22 May 2007
BMC Bioinformatics 2007, 8(Suppl 4):S8 doi:10.1186/1471-2105-8-S4-S8
<supplement> <title> <p>The Second Automated Function Prediction Meeting</p> </title> <editor>Ana PC Rodrigues, Barry J Grant, Adam Godzik and Iddo Friedberg</editor> <note>Proceedings</note> <url>http://www.biomedcentral.com/content/pdf/1471-2105-8-S4-info.pdf</url> </supplement>
This article is available from: http://www.biomedcentral.com/1471-2105/8/S4/S8
© 2007 Chua et al; licensee BioMed Central Ltd. This is an open access article distributed under the terms of the Creative Commons Attribution License (http://creativecommons.org/licenses/by/2.0), which permits unrestricted use, distribution, and reproduction in any medium, provided the original work is properly cited.
Page 1 of 13(page number not for citation purposes)
BMC Bioinformatics 2007, 8(Suppl 4):S8 http://www.biomedcentral.com/1471-2105/8/S4/S8
fraction of their genomes present in finished sequences.New bioinformatics methods allow inference of proteinfunction using "associative analysis" of functional proper-ties to complement traditional sequence homology-basedmethods. Associative properties that have been used toinfer function not evident from sequence homologyinclude: co-occurrence of proteins in operons or genomecontext [1-3]; proteins sharing common domains infusion proteins [4-6]; proteins with similar phylogeneticprofiles [7,8]; proteins with correlated gene expressionpatterns [9]; and so on. Many approaches have also beenproposed for utilizing protein-protein interaction data forfunctional inference [10-18]. A simple but effectiveapproach is to assign a protein with the function thatoccurs most frequently in its interaction partners [10].This is further improved in [11], which predicts functionbased on chi-square statistics instead of frequency. Someapproaches apply machine-learning methods such as clus-tering and support vector machines [12-14]. Others applyglobal optimization techniques, such as Markov randomfields [15,16] and simulated annealing [17], to propagatepredictions so that the function of proteins without char-acterized neighbors can be predicted. Most of theseapproaches use the observation that a protein often sharesfunctions with proteins that interact with it (i.e., its level-1 neighbors). However, proteins that interact with thesame proteins (i.e., level-2 neighbors) may also have agreater likelihood of sharing similar physical or biochem-ical characteristics with the target protein. In a previousstudy [18], we investigated interactions between proteinsfrom the Saccharomyces cerevisiae (bakers' yeast) genomefrom the General Repository of Interaction Datasets(GRID) [19]. We observed that there are proteins that donot share any function with their immediate interactionpartners (i.e., level-1 neighbors, S1) and yet share somefunction similarity with the interaction partners of theirimmediate partners (i.e., level-2 neighbors, S2). Out of4,162 annotated yeast proteins, only 1,999, or 48.0%,share some function with its level-1 neighbors. Of theremaining proteins, 943, or 22.7% of the annotated pro-teins, share some similarity with at least one of its level-2neighbors. Less than 2% of the annotated proteins sharefunctions exclusively with level-1 neighbors.
With the assumption that there is no unobserved interac-tion or annotation, we proposed indirect functional associ-ation as a reasonable explanation for this observation[18]. Such an indirect functional association can be con-sidered as an instance of the "guilt by association" princi-ple – the common "property" between the level-2neighbors and the target protein that is used for derivingthe "association" is precisely the set of proteins that theyboth interact with, namely the level-1 neighbors. It isplausible that two proteins that interact with a commonset of proteins have a good likelihood of sharing similar
physical or biochemical characteristics, and thus exhibit acommon function.
While level-2 neighbors may be used to provide greatercoverage during function inference, they contain toomany false positives to be useful. In order to reduce theimpact of these false positives, we devised a topologicalweighting measure, Functional Similarity Weight (FS-Weight), which can be used to identify both direct andindirect (level-2) neighbors that are more likely to sharefunctions. FS-Weight improves the precision of functioninference, while the inclusion of FS-weighted level-2neighbors improves both sensitivity and precision. A newmethod, FS-Weighted Averaging, which incorporates indi-rect interactions and FS-Weight, was shown to performbetter than existing approaches in predicting protein func-tions for S. cerevisiae from protein interactions [18].
Here we study how FS-Weighted Averaging performs inpredicting protein functions from the protein-proteininteraction maps of seven genomes. We also study howthe approach performs on noisy interaction data and onpredicted interactions. Finally, we show some examples ofnovel functions predicted for uncharacterized proteins inthe S. cerevisiae genome and study the predictions that arebiologically significant.
ResultsCoverage of protein-protein interactionsTo appreciate the feasibility of protein-protein interac-tions for function discovery, we want to find out whetherprotein-protein interactions provide any additional cover-age over sequence homology. We look at two well-studiedgenomes, S. cerevisiae and D. melanogaster, and examine:1) how many known functions can be inferred from otherproteins with sequence similarity in the genome; 2) howmany more functions can be suggested from interactionpartners on top of (1); and 3) how many more functionscan be suggested from indirect interaction partners on topof (1) and (2).
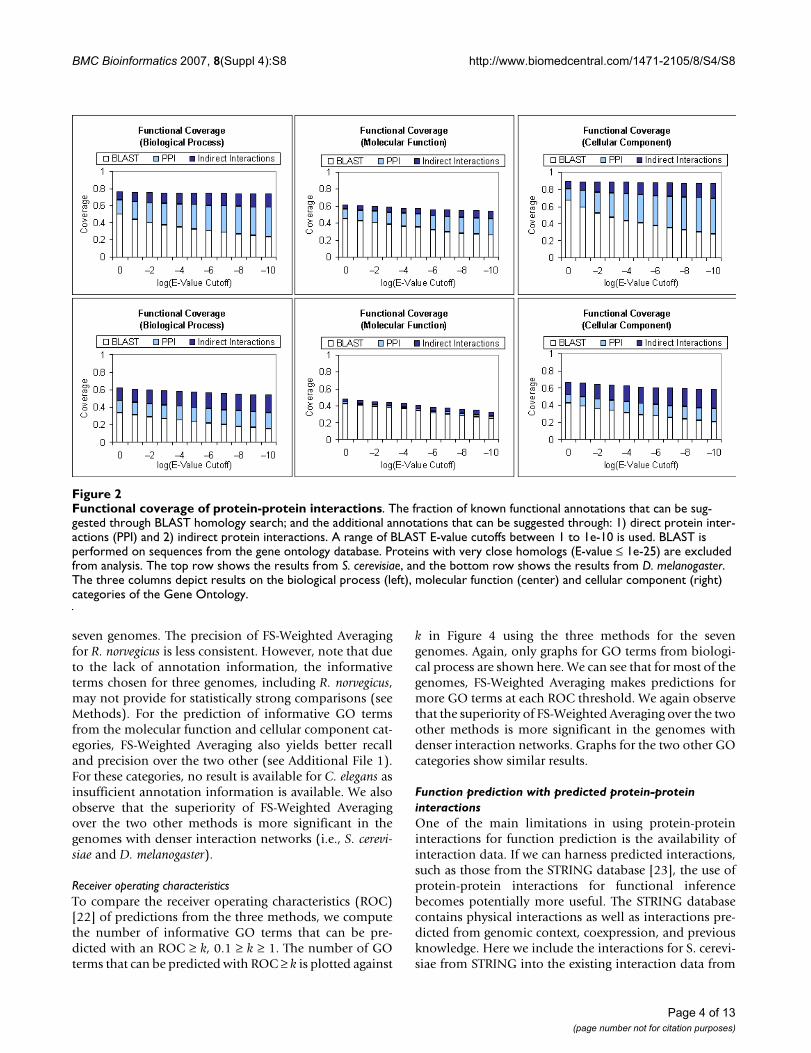
Each protein sequence is searched against all proteinsequences in the Gene Ontology Database [20] using theBasic Local Alignment Search Tool (BLAST) [21] using arange of varying E-value thresholds between 1e-10 to 1. Ahigher E-value will translate to less significant sequencesimilarity and vice versa. Hence, a higher E-value thresh-old will provide better coverage at the expense of lowerprecision. Proteins with close homologs (E-Value <= 1e-25) from the homology search are excluded from the anal-ysis. The protein interaction network is then examined tofind out the number of additional known annotationsthat can be suggested from direct and indirect interac-tions. Figure 2 summarizes the findings of this analysis.We find that protein-protein interactions can provide sub-
Page 2 of 13(page number not for citation purposes)

BMC Bioinformatics 2007, 8(Suppl 4):S8 http://www.biomedcentral.com/1471-2105/8/S4/S8
stantial coverage over annotations that cannot be inferredfrom sequence homology, especially for biological processand cellular component. We also observe that indirect inter-actions can provide significant additional coverage overannotations that cannot be inferred from both sequencehomology and direct interactions.
Effectiveness of FS-WeightThe effectiveness of FS-Weighted Averaging for functionprediction depends upon the capability of FS-Weight inassigning higher weights to direct and indirect interac-tions that involve function sharing. Here we study howwell FS-Weight scores reflect function similarity. All directand indirect interactions are first weighted using FS-Weight. For each unique score, we compute the fraction ofinteractions with weights higher than or equal to thisscore that share at least one level-4 GO term. The Pear-son's correlation coefficient between FS-Weight score andthis computed fraction is then computed. This coefficientindicates how well the FS-Weight score of an interactioncorrelates to the likelihood of function being sharedbetween the proteins involved. Table 2 summarizes thecorresponding Pearson's coefficient for each of the sevengenomes and each of the three GO categories. We can seethat the coefficient values are significant (>0.7) for mostcases, indicating that FS-Weight correlates strongly withthe likelihood of function sharing. The correlation islower for molecular function in the M. musculus and R.norvegicus genomes, but the value is still positive, indicat-ing weaker correlation. No results are available for themolecular function and the cellular component of C. ele-gans due to limited annotation information.
Function prediction using FS-Weighted AveragingUsing Neighbor Counting and Chi-Square as a bench-mark, we want to study the prediction performance of FS-Weighted Averaging over a variety of different genomes.These genomes vary greatly in the availability of annota-tions and interaction data, which provides a good setup tostudy the strengths and limitations of the technique. Ten-fold cross validation is performed on each genome usingNeighbor Counting, Chi-Square, and FS-Weighted Aver-aging. Proteins with known functions are randomlydivided into 10 groups. In each run, the annotations forone group of proteins will be hidden, and their functionspredicted based on the annotations for the remaininggroups and the interaction data. The hidden annotationsare not available to any preprocessing steps, includingreliability estimation and the weighting of interactions.The predictions from the three methods are validated andcompared using the two criteria, precision-recall analysisand receiver operating characteristics, as outlined in theMethods section. Only informative GO terms (see Meth-ods) are used for validation.
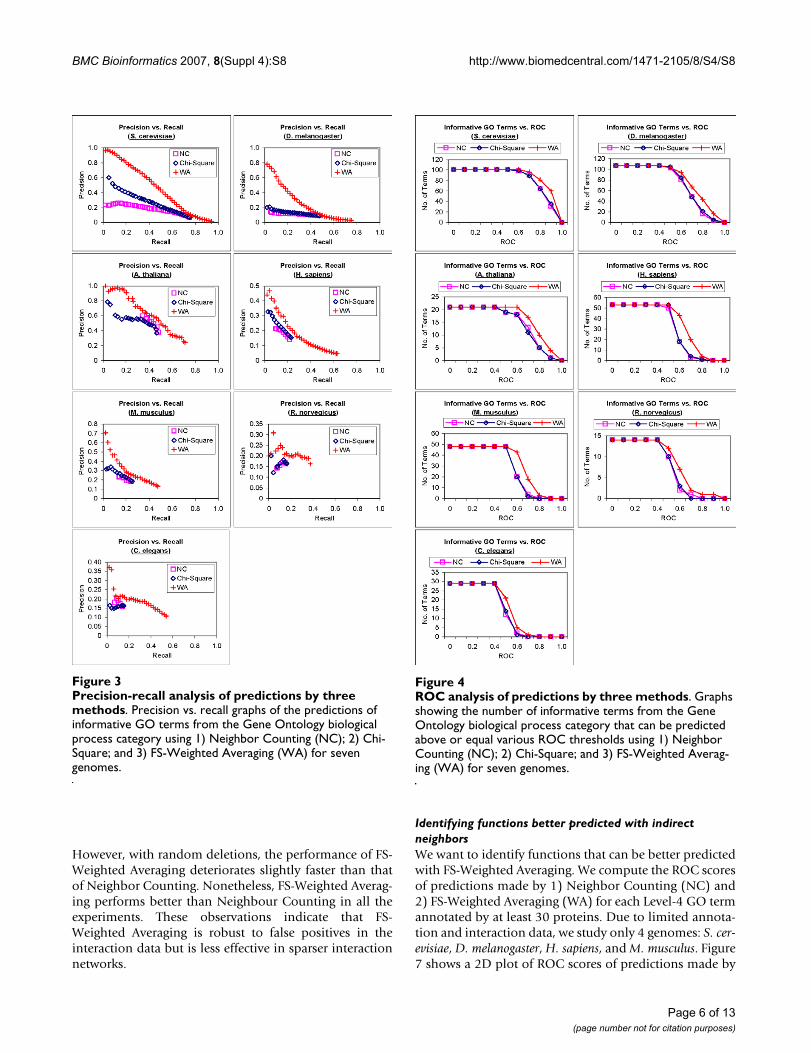
Precision-recall AnalysisThe precision versus recall graphs for the prediction ofinformative GO terms for each of the seven genomes arepresented in Figure 3. Only graphs for the biological proc-ess category are presented to maintain clarity. Graphsfrom the molecular function and cellular component cat-egories are provided in the supplementary data (see Addi-tional File 1). We can see from Figure 3 that FS-WeightedAveraging makes predictions with better precision andrecall compared to the two other methods for most of the
Direct and indirect interactionsFigure 1Direct and indirect interactions. Nodes represent proteins, while edges represent interactions. Direct interactions between labelled proteins are indicated by red lines, while indirect interactions between labelled proteins are indicated by blue lines.
Page 3 of 13(page number not for citation purposes)
BMC Bioinformatics 2007, 8(Suppl 4):S8 http://www.biomedcentral.com/1471-2105/8/S4/S8
seven genomes. The precision of FS-Weighted Averagingfor R. norvegicus is less consistent. However, note that dueto the lack of annotation information, the informativeterms chosen for three genomes, including R. norvegicus,may not provide for statistically strong comparisons (seeMethods). For the prediction of informative GO termsfrom the molecular function and cellular component cat-egories, FS-Weighted Averaging also yields better recalland precision over the two other (see Additional File 1).For these categories, no result is available for C. elegans asinsufficient annotation information is available. We alsoobserve that the superiority of FS-Weighted Averagingover the two other methods is more significant in thegenomes with denser interaction networks (i.e., S. cerevi-siae and D. melanogaster).
Receiver operating characteristicsTo compare the receiver operating characteristics (ROC)[22] of predictions from the three methods, we computethe number of informative GO terms that can be pre-dicted with an ROC ≥ k, 0.1 ≥ k ≥ 1. The number of GOterms that can be predicted with ROC ≥ k is plotted against
k in Figure 4 using the three methods for the sevengenomes. Again, only graphs for GO terms from biologi-cal process are shown here. We can see that for most of thegenomes, FS-Weighted Averaging makes predictions formore GO terms at each ROC threshold. We again observethat the superiority of FS-Weighted Averaging over the twoother methods is more significant in the genomes withdenser interaction networks. Graphs for the two other GOcategories show similar results.
Function prediction with predicted protein-protein interactionsOne of the main limitations in using protein-proteininteractions for function prediction is the availability ofinteraction data. If we can harness predicted interactions,such as those from the STRING database [23], the use ofprotein-protein interactions for functional inferencebecomes potentially more useful. The STRING databasecontains physical interactions as well as interactions pre-dicted from genomic context, coexpression, and previousknowledge. Here we include the interactions for S. cerevi-siae from STRING into the existing interaction data from
Functional coverage of protein-protein interactionsFigure 2Functional coverage of protein-protein interactions. The fraction of known functional annotations that can be sug-gested through BLAST homology search; and the additional annotations that can be suggested through: 1) direct protein inter-actions (PPI) and 2) indirect protein interactions. A range of BLAST E-value cutoffs between 1 to 1e-10 is used. BLAST is performed on sequences from the gene ontology database. Proteins with very close homologs (E-value ≤ 1e-25) are excluded from analysis. The top row shows the results from S. cerevisiae, and the bottom row shows the results from D. melanogaster. The three columns depict results on the biological process (left), molecular function (center) and cellular component (right) categories of the Gene Ontology.
Page 4 of 13(page number not for citation purposes)
BMC Bioinformatics 2007, 8(Suppl 4):S8 http://www.biomedcentral.com/1471-2105/8/S4/S8
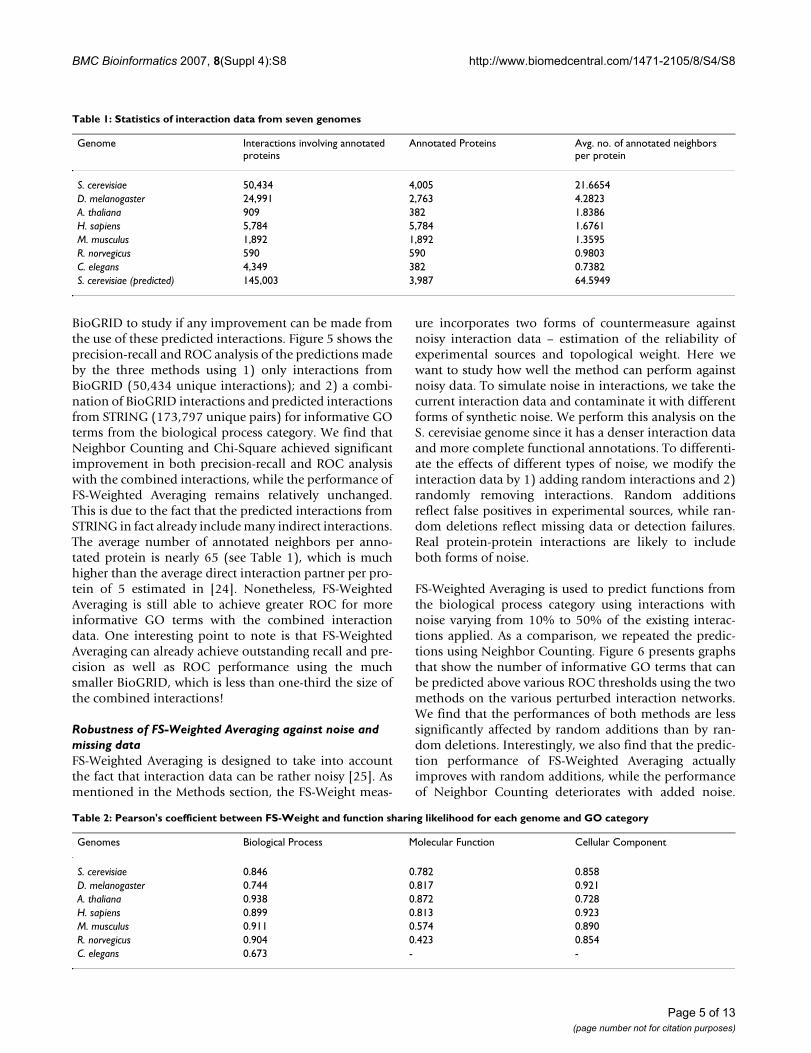
BioGRID to study if any improvement can be made fromthe use of these predicted interactions. Figure 5 shows theprecision-recall and ROC analysis of the predictions madeby the three methods using 1) only interactions fromBioGRID (50,434 unique interactions); and 2) a combi-nation of BioGRID interactions and predicted interactionsfrom STRING (173,797 unique pairs) for informative GOterms from the biological process category. We find thatNeighbor Counting and Chi-Square achieved significantimprovement in both precision-recall and ROC analysiswith the combined interactions, while the performance ofFS-Weighted Averaging remains relatively unchanged.This is due to the fact that the predicted interactions fromSTRING in fact already include many indirect interactions.The average number of annotated neighbors per anno-tated protein is nearly 65 (see Table 1), which is muchhigher than the average direct interaction partner per pro-tein of 5 estimated in [24]. Nonetheless, FS-WeightedAveraging is still able to achieve greater ROC for moreinformative GO terms with the combined interactiondata. One interesting point to note is that FS-WeightedAveraging can already achieve outstanding recall and pre-cision as well as ROC performance using the muchsmaller BioGRID, which is less than one-third the size ofthe combined interactions!
Robustness of FS-Weighted Averaging against noise and missing dataFS-Weighted Averaging is designed to take into accountthe fact that interaction data can be rather noisy [25]. Asmentioned in the Methods section, the FS-Weight meas-
ure incorporates two forms of countermeasure againstnoisy interaction data – estimation of the reliability ofexperimental sources and topological weight. Here wewant to study how well the method can perform againstnoisy data. To simulate noise in interactions, we take thecurrent interaction data and contaminate it with differentforms of synthetic noise. We perform this analysis on theS. cerevisiae genome since it has a denser interaction dataand more complete functional annotations. To differenti-ate the effects of different types of noise, we modify theinteraction data by 1) adding random interactions and 2)randomly removing interactions. Random additionsreflect false positives in experimental sources, while ran-dom deletions reflect missing data or detection failures.Real protein-protein interactions are likely to includeboth forms of noise.
FS-Weighted Averaging is used to predict functions fromthe biological process category using interactions withnoise varying from 10% to 50% of the existing interac-tions applied. As a comparison, we repeated the predic-tions using Neighbor Counting. Figure 6 presents graphsthat show the number of informative GO terms that canbe predicted above various ROC thresholds using the twomethods on the various perturbed interaction networks.We find that the performances of both methods are lesssignificantly affected by random additions than by ran-dom deletions. Interestingly, we also find that the predic-tion performance of FS-Weighted Averaging actuallyimproves with random additions, while the performanceof Neighbor Counting deteriorates with added noise.
Table 2: Pearson's coefficient between FS-Weight and function sharing likelihood for each genome and GO category
Genomes Biological Process Molecular Function Cellular Component
S. cerevisiae 0.846 0.782 0.858D. melanogaster 0.744 0.817 0.921A. thaliana 0.938 0.872 0.728H. sapiens 0.899 0.813 0.923M. musculus 0.911 0.574 0.890R. norvegicus 0.904 0.423 0.854C. elegans 0.673 - -
Table 1: Statistics of interaction data from seven genomes
Genome Interactions involving annotated proteins
Annotated Proteins Avg. no. of annotated neighbors per protein
S. cerevisiae 50,434 4,005 21.6654D. melanogaster 24,991 2,763 4.2823A. thaliana 909 382 1.8386H. sapiens 5,784 5,784 1.6761M. musculus 1,892 1,892 1.3595R. norvegicus 590 590 0.9803C. elegans 4,349 382 0.7382S. cerevisiae (predicted) 145,003 3,987 64.5949
Page 5 of 13(page number not for citation purposes)
BMC Bioinformatics 2007, 8(Suppl 4):S8 http://www.biomedcentral.com/1471-2105/8/S4/S8
However, with random deletions, the performance of FS-Weighted Averaging deteriorates slightly faster than thatof Neighbor Counting. Nonetheless, FS-Weighted Averag-ing performs better than Neighbour Counting in all theexperiments. These observations indicate that FS-Weighted Averaging is robust to false positives in theinteraction data but is less effective in sparser interactionnetworks.
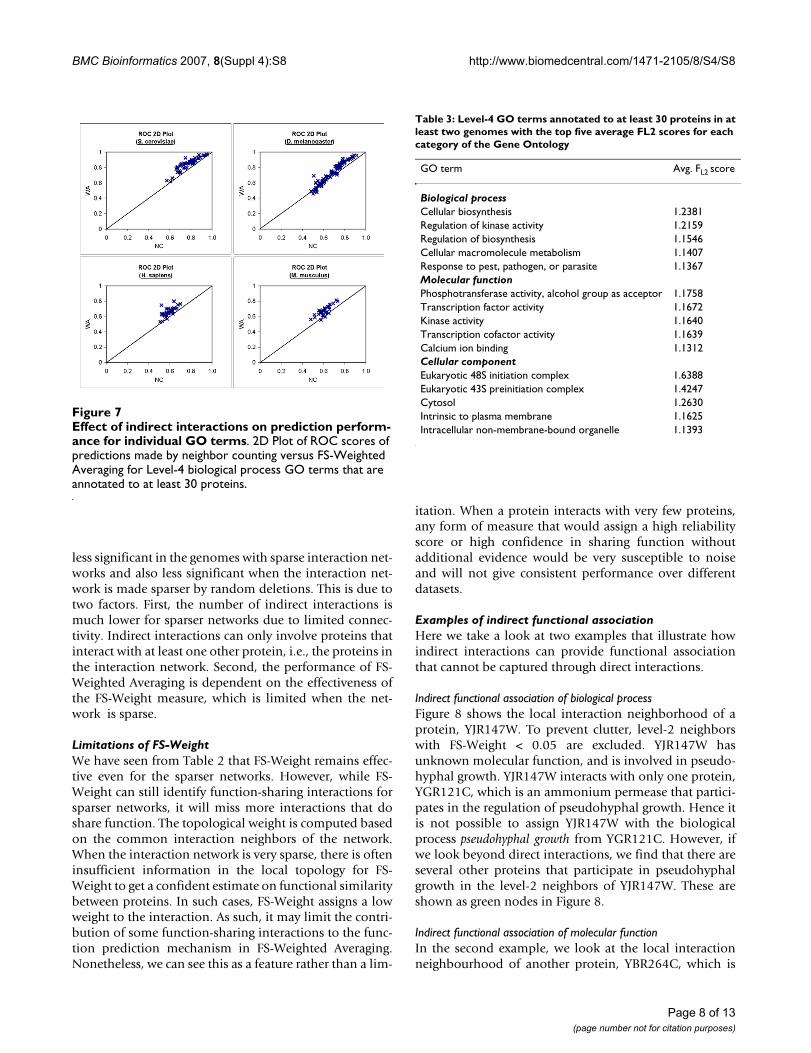
Identifying functions better predicted with indirect neighborsWe want to identify functions that can be better predictedwith FS-Weighted Averaging. We compute the ROC scoresof predictions made by 1) Neighbor Counting (NC) and2) FS-Weighted Averaging (WA) for each Level-4 GO termannotated by at least 30 proteins. Due to limited annota-tion and interaction data, we study only 4 genomes: S. cer-evisiae, D. melanogaster, H. sapiens, and M. musculus. Figure7 shows a 2D plot of ROC scores of predictions made by
ROC analysis of predictions by three methodsFigure 4ROC analysis of predictions by three methods. Graphs showing the number of informative terms from the Gene Ontology biological process category that can be predicted above or equal various ROC thresholds using 1) Neighbor Counting (NC); 2) Chi-Square; and 3) FS-Weighted Averag-ing (WA) for seven genomes.
Precision-recall analysis of predictions by three methodsFigure 3Precision-recall analysis of predictions by three methods. Precision vs. recall graphs of the predictions of informative GO terms from the Gene Ontology biological process category using 1) Neighbor Counting (NC); 2) Chi-Square; and 3) FS-Weighted Averaging (WA) for seven genomes.
Page 6 of 13(page number not for citation purposes)

BMC Bioinformatics 2007, 8(Suppl 4):S8 http://www.biomedcentral.com/1471-2105/8/S4/S8
Neighbor Counting versus predictions made by FS-Weighted Averaging for biological process GO terms. Eachpoint on the graph represents a Level-4 GO term. A pointabove the diagonal line indicates that WA yields a betterROC score, while a point below the diagonal line indi-cates that NC yields a better ROC score.
For all the four genomes in Figure 4, most points on thegraph lie above the diagonal line, indicating that FS-Weighted Averaging performed better than NeighborCounting for most of these GO terms.
To identify GO terms on which FS-Weighted Averagingcan achieve the best relative performance over NeighborCounting, we first select only level-4 GO terms that appearin at least two of the four genomes. For each term, wedefine a score that reflects the relative ROC score of FS-Weighted Averaging against Neighbor Counting as fol-lows:
where ROCWA(x) is the ROC score of the predictions madeby FS-Weighted Averaging; and ROCNC(x) is the ROCscore of the predictions made by Neighbor Counting.
We select the top five terms from each GO category basedon their average FL2 in the genomes in which they appearand present them in Table 3.
DiscussionWe have shown that FS-Weighted Averaging consistentlyoutperforms Neighbor Counting and Chi-Square in func-tion prediction for the various genomes. By incorporatinginteraction reliability, topological weight, and indirectinteractions, the method can predict more functions withhigher precision in all three categories of the Gene Ontol-ogy. It is also reasonably resilient against interactionnoise, maintaining consistent prediction performanceeven when a large number of interactions are randomlyadded to the interaction data. However, we have also seenthat the performance edge of FS-Weighted Averaging is
F xROC x
ROC xLWA
NC2 ( ) =
( )( )
Incorporating predicted interactions for function predictionFigure 5Incorporating predicted interactions for function prediction. Top – Graphs showing the number of informa-tive terms from the Gene Ontology biological process cate-gory that can be predicted greater than or equal to various ROC thresholds for the same methods on BioGRID interac-tions (left) and a combination of BioGRID interactions and predicted interactions from STRING (right). Bottom – Preci-sion vs. recall graphs for predictions of informative terms from the Gene Ontology biological process category using 1) Neighbor Counting (NC); 2) Chi-Square; and 3) FS-Weighted Averaging (WA) on BioGRID interactions (left) and a combi-nation of BioGRID interactions and predicted interactions from STRING (right).
Effect of noisy interaction data on FS-Weighted AveragingFigure 6Effect of noisy interaction data on FS-Weighted Averaging. Graphs showing the number of informative terms from the Gene Ontology biological process category that can be predicted greater than or equal various ROC thresholds using FS-Weighted Averaging (top) and Neighbor Counting (bottom) on synthetically modified interaction data. Interactions are randomly 1) added to the interaction net-work (left) and 2) removed from the interaction network (right) in varying degrees from 10% to 50% of the number of interactions in the original interaction.
Page 7 of 13(page number not for citation purposes)
BMC Bioinformatics 2007, 8(Suppl 4):S8 http://www.biomedcentral.com/1471-2105/8/S4/S8
less significant in the genomes with sparse interaction net-works and also less significant when the interaction net-work is made sparser by random deletions. This is due totwo factors. First, the number of indirect interactions ismuch lower for sparser networks due to limited connec-tivity. Indirect interactions can only involve proteins thatinteract with at least one other protein, i.e., the proteins inthe interaction network. Second, the performance of FS-Weighted Averaging is dependent on the effectiveness ofthe FS-Weight measure, which is limited when the net-work is sparse.
Limitations of FS-WeightWe have seen from Table 2 that FS-Weight remains effec-tive even for the sparser networks. However, while FS-Weight can still identify function-sharing interactions forsparser networks, it will miss more interactions that doshare function. The topological weight is computed basedon the common interaction neighbors of the network.When the interaction network is very sparse, there is ofteninsufficient information in the local topology for FS-Weight to get a confident estimate on functional similaritybetween proteins. In such cases, FS-Weight assigns a lowweight to the interaction. As such, it may limit the contri-bution of some function-sharing interactions to the func-tion prediction mechanism in FS-Weighted Averaging.Nonetheless, we can see this as a feature rather than a lim-
itation. When a protein interacts with very few proteins,any form of measure that would assign a high reliabilityscore or high confidence in sharing function withoutadditional evidence would be very susceptible to noiseand will not give consistent performance over differentdatasets.
Examples of indirect functional associationHere we take a look at two examples that illustrate howindirect interactions can provide functional associationthat cannot be captured through direct interactions.
Indirect functional association of biological processFigure 8 shows the local interaction neighborhood of aprotein, YJR147W. To prevent clutter, level-2 neighborswith FS-Weight < 0.05 are excluded. YJR147W hasunknown molecular function, and is involved in pseudo-hyphal growth. YJR147W interacts with only one protein,YGR121C, which is an ammonium permease that partici-pates in the regulation of pseudohyphal growth. Hence itis not possible to assign YJR147W with the biologicalprocess pseudohyphal growth from YGR121C. However, ifwe look beyond direct interactions, we find that there areseveral other proteins that participate in pseudohyphalgrowth in the level-2 neighbors of YJR147W. These areshown as green nodes in Figure 8.
Indirect functional association of molecular functionIn the second example, we look at the local interactionneighbourhood of another protein, YBR264C, which is
Table 3: Level-4 GO terms annotated to at least 30 proteins in at least two genomes with the top five average FL2 scores for each category of the Gene Ontology
GO term Avg. FL2 score
Biological processCellular biosynthesis 1.2381Regulation of kinase activity 1.2159Regulation of biosynthesis 1.1546Cellular macromolecule metabolism 1.1407Response to pest, pathogen, or parasite 1.1367Molecular functionPhosphotransferase activity, alcohol group as acceptor 1.1758Transcription factor activity 1.1672Kinase activity 1.1640Transcription cofactor activity 1.1639Calcium ion binding 1.1312Cellular componentEukaryotic 48S initiation complex 1.6388Eukaryotic 43S preinitiation complex 1.4247Cytosol 1.2630Intrinsic to plasma membrane 1.1625Intracellular non-membrane-bound organelle 1.1393
Effect of indirect interactions on prediction performance for individual GO termsFigure 7Effect of indirect interactions on prediction perform-ance for individual GO terms. 2D Plot of ROC scores of predictions made by neighbor counting versus FS-Weighted Averaging for Level-4 biological process GO terms that are annotated to at least 30 proteins.
Page 8 of 13(page number not for citation purposes)

BMC Bioinformatics 2007, 8(Suppl 4):S8 http://www.biomedcentral.com/1471-2105/8/S4/S8
shown in Figure 9. YBR264C, shown as a red node in thefigure, is a GTP binding protein. As there are too manylevel-2 neighbors, we only show those with FS-weight >=0.05. While YBR264C interacts with nine proteins, noneof these shares its molecular function, GTPase activity. Onthe other hand, a number of level-2 neighbors have thisfunction (shown as green nodes).
Interestingly, the level-2 neighbors and YBR264C form abipartite graph with four proteins: YGL198W, YNL263C,YNL044W, and YER136W. YGL198W is a Ypt-interactingprotein that interacts with Rab GTPases. YNL263C andYNL044W have no known molecular function but areknown to be involved in ER to Golgi transport.
YER136W is a GDP dissociation inhibitor that regulatesvesicle traffic in secretory pathways by regulating the dis-sociation of GDP from GTP binding proteins. Two of thefour proteins have molecular functions that require inter-action with GTPases, while the other two have no knownmolecular function. It is likely that YNL263C andYNL044W, which have no known molecular function,would have molecular functions that involve interactionwith GTPases.
We also notice that YGR172C is the only member on itsside of the bipartite graph that does not have the molecu-
lar function GTPase activity. YGR172C is known to be anintegral membrane protein required for the biogenesis ofER-derived COPII transport vesicles and has no knownmolecular function. It is likely that YGR172C would sharethe molecular function GTPase activity with YBR264C.
Novel predictions for S. cerevisiaeUsing FS-Weighted Averaging, we predict GO functionsfor uncharacterized proteins in the interaction network ofS. cerevisiae. From these predictions, we select predictionswith higher confidence by:
1. Excluding GO terms that are associated with fewer than30 annotated proteins;
2. Excluding GO terms that have an ROC of less than 0.7during cross validation;
3. For each remaining GO term, retaining only novel pre-dictions that have a score greater than or equal to at least70% of annotated proteins with the term.
4. Propagating predictions to include ancestor terms forconsistency.
These predictions are publicly available at [26]. We wel-come collaborations with experimentalists interested inverifying some of these predictions.
ConclusionWe have investigated the protein-protein interactionsfrom seven genomes and shown that by incorporating
Example of indirect functional association of molecular func-tionFigure 9Example of indirect functional association of molecu-lar function. Graph depicting the local interaction neigh-bourhood of protein YBR264C (shown in red). Proteins shown as green node shares the molecular function GTPase activity with YBR264C.
Example of indirect functional association of biological proc-essFigure 8Example of indirect functional association of biologi-cal process. Graph depicting the local interaction neighbor-hood of protein YJR147W (shown in red). Proteins shown as green nodes share the biological process pseudohyphal growth with YJR147W.
Page 9 of 13(page number not for citation purposes)
BMC Bioinformatics 2007, 8(Suppl 4):S8 http://www.biomedcentral.com/1471-2105/8/S4/S8
topological weighting and indirect neighbors, FS-Weighted Averaging can predict protein function effec-tively for all three categories of the Gene Ontology. Thisresult is consistent across the seven genomes, indicatingthat the approach is robust and likely to be generallyapplicable. We have also studied the impact of noisy inter-action data on the performance of FS-Weighted Averagingand find that it is very robust against random perturba-tions in the interaction network. The study also revealsthat FS-Weighted Averaging displays greater effectivenessfor sufficiently dense interaction networks as its weightingmechanism requires sufficient local network information.
MethodsInteraction and annotation datasets for multiple genomesIn this study, we will cover several genomes, namely Sac-charomyces cerevisiae, Drosophila melanogaster (fruit fly),Caenorhabditis elegans (roundworm), Arabidopsis thaliana(mouse-ear cress), Rattus norvegicus (Norway rat), Musmusculus (house mouse), and Homo sapiens (human). Pro-tein-protein interactions for D. melanogaster, C. elegans,and S. cerevisiae are obtained from the latest release(2.0.20) of BioGRID (formerly GRID [19]). Interactiondata for A. thaliana, R. norvegicus, M. musculus, and H. sapi-ens are obtained from the Biomolecular Interaction Net-work Database (BIND) [27]. Predicted protein-proteininteractions for S. cerevisiae are obtained from the SearchTool for the Retrieval of Interacting Genes/Proteins(STRING) database [23].
As genome-specific function annotation schemes mayhave inherent biases, we use a unified annotation scheme,the Gene Ontology [20], for function annotations. GeneOntology (GO) terms are arranged in a hierarchical man-ner with more general terms at the lower level and morespecific terms at the higher level. In this study, we definethe GO term "biological process" as level 0, its childrenterms as level 1, and so on. Annotations follow the truepath rule – a protein annotated with a GO term is alsoannotated with all its ancestor terms.
Table 1 shows some statistics of the various interactiondatasets. We consider only annotated proteins in ourstudy since our interest is in function inference. As thelower levels in the GO hierarchy can be very general, werefer to a protein as "annotated" if it is being annotatedwith at least one level-4 GO term. The first column depictsthe number of interactions between annotated proteins.The second column shows the number of proteins that areannotated and have at least one interaction partner. Thethird column shows the average number of annotatedneighbors per (annotated) protein. We use this as a simpleindicator of the density of the interaction network. The S.cerevisiae dataset has the densest interaction network fol-lowed by D. melanogaster and H. Sapiens datasets. The R.
norvegicus and C. elegans datasets have sparser interactionnetworks, with less than one annotated neighbor perannotated protein on the average.
Direct and indirect interactionsWe define a direct interaction as an actual interactionbetween proteins in the protein-protein interaction data.In Figure 1, nodes in the graph represent proteins whileedges between the nodes represent protein-protein inter-actions. There is a direct interaction between proteins Aand B. We define an indirect interaction as the sharing ofcommon interaction partners between two proteins (i.e.,the two proteins are level-2 neighbors). Figure 1 shows anindirect interaction between proteins A and C. A pair ofproteins may have both direct and indirect interactions, asillustrated by proteins A and D in Figure 1. Level-2 neigh-bors are able to bind to similar proteins; thus they have ahigher likelihood of having similar molecular functions.Since subcellular localization shows substantial correla-tion with molecular function [28], level-2 neighbors arealso likely to reside in similar cellular components.
Topological weightingNot all indirect interactions indicate function sharing.Indirect relationships are defined upon direct ones andare subjected to noise in the interaction network. Also,while two proteins can interact with a common protein,they may not bind to the common protein at the samesite. To identify which indirect interactions are more likelyto share functions, we proposed a topological weightingscheme, FS-Weight [18].
The FS-Weight of the direct or indirect interactionbetween two proteins u and v is defined as:
N(p) refers to the set that contains protein p and its level-1 neighbors;
λu,v is a pseudo-count included in the computation topenalize similarity weights between protein pairs whenany of the proteins has very few level-1 neighbors.
ru,w refers to the estimated reliability of the interactionbetween u and w:
S u v
r r
r r r
R
u w v ww N u N v
u ww N u
u w v ww N
,
, ,
, , ,
( ) =
+ −( )
∈ ( )∩ ( )( )
∈ ( ) ∈
∑
∑
2
1uu N v
u w v ww N u N v
u v
u w
r r
r r
( )∩ ( )( ) ∈ ( )∩ ( )( )∑ ∑
⎛
⎝
⎜⎜⎜
⎞
⎠
⎟⎟⎟
+ +
×
2
2
, , ,
,
λ
vv ww N u N v
v ww N v
v w u ww N u N v
r r r
,
, , ,
∈ ( )∩ ( )( )
∈ ( ) ∈ ( )∩ ( )( )
∑
∑ ∑+ −( )⎛
⎝1⎜⎜
⎜⎜
⎞
⎠
⎟⎟⎟
+ +∈ ( )∩ ( )( )
∑2 r ru w v ww N u N v
v u, , ,λ
Page 10 of 13(page number not for citation purposes)
BMC Bioinformatics 2007, 8(Suppl 4):S8 http://www.biomedcentral.com/1471-2105/8/S4/S8
ri is the estimated reliability of experimental source i;
Eu,v is the set of experimental sources in which interactionbetween u and v is observed; and
ni,u,v is the number of times that interaction between u andv is observed from experimental source i.
FS-Weight addresses the abovementioned problems intwo ways. First, the interaction network is weighted usingestimated reliability values to reduce the impact of noise.Second, the weight is largely determined by the number ofcommon interaction partners between the two proteins: ifthe two proteins share many common neighbors, the like-lihood of sharing common physical characteristicsincreases. The number of non-common neighbors is usedas a penalizing factor: if any of the two proteins also bindto many other proteins, then the likelihood of sharingcommon physical characteristics decreases.
Reliability of experimental sourcesTo reduce the impact of noise in the interaction network,the reliability of each experimental source of protein inter-action data (e.g., two-hybrid, synthetic lethality) isassessed and weighted. Each source may be assigned anestimated reliability weight by experts based on domainknowledge. However, since we do not have domainknowledge, a simple way to do this is to estimate based onknown functions as well as the agreement among inde-pendent experimental sources. Here we estimate the relia-bility of each experimental source by the fraction ofunique interactions detected by the experimental sourcein which at least one level-4 Gene Ontology term isshared. This is done using annotated proteins in the train-ing data during cross validation. The reliability of interac-tions observed in many independent experimentalsources will be combined as described in the definition ofFS-Weight. We do not use indirect interactions for the esti-mation of reliability to avoid circular reasoning as the def-inition of indirect neighbors is dependent upon thereliability.
Function predictionThe comparison of FS-Weighted Averaging with manyexisting approaches has been done in [18] on the yeastgenome. Here we will study the performance of theapproach on various additional genomes using two classi-cal methods, Neighbor Counting and Chi-Square, as abenchmark:
Neighbor CountingThe Neighbor Counting method is proposed in [10]. Foreach protein u, each function x is ranked based on the fre-quency of its occurrence in the interaction partners (level-1 neighbors) of u. The rank of each function is used as itsscore for u:
δ(v, x) = 1 if v has function x, 0 otherwise;
rank(q(x)) refers to the rank of the function x relative to allfunctions based on q(x).
Chi-SquareThe Chi-Square method is proposed in [11]. Theapproach scores each function f observed in the neighborsof a protein u using the Chi-Square statistic. The statisticmeasure computes the deviation of the observed occur-rence of function f in the neighbors of u from its expectedoccurrence. In [11], the function with the largest chi-square value is assigned to u. Since we want to assign mul-tiple functions to each protein, we use the rank of eachfunction as its score instead:
ex is the expected number of proteins with function xamong the interaction partners of u, computed by multi-plying the number of annotated interaction partners of uwith the frequency of function x among annotated pro-teins in the interaction map
FS-Weighted AveragingNeighbor Counting uses occurrence-based ranking as ascore for functions. A score derived for one protein maynot reflect similar confidence as the same score derived foranother. In [18], we introduced FS-Weighted Averaging,which uses a normalized weighted voting approach. Thelikelihood that a protein u has a function x is estimatedby:
Z is the sum of all weights:
r ru v ii E
n
u v
i u v, ( )
,
, ,= − −∈∏1 1
f u rank v xxv Nu
( ) = ( )⎛
⎝⎜⎜
⎞
⎠⎟⎟∈
∑ δ ,
f u rank
v x e
ex
xv N
x
u( ) =
( ) −⎛
⎝⎜⎜
⎞
⎠⎟⎟
⎛
⎝
⎜⎜⎜⎜⎜⎜⎜
⎞
⎠
⎟⎟⎟⎟⎟⎟⎟
∈∑ δ ,
2
f uZ
S u v v x S u v S v w S u w w xx FS FS FS FS( ) = ( ) ( ) + ( ) ( ) ( )( ) (1, , max , , , , ,δ δ ))
⎛
⎝⎜⎜
⎞
⎠⎟⎟
⎡
⎣
⎢⎢
⎤
⎦
⎥⎥∈∈
∑∑w Nv N vu
Page 11 of 13(page number not for citation purposes)
BMC Bioinformatics 2007, 8(Suppl 4):S8 http://www.biomedcentral.com/1471-2105/8/S4/S8
In the same equation from [18], we added the backgroundfrequency of function x to the summation of weights infx(u). When the weights of all the interactions in the localneighbourhood of a protein are very low, the backgroundfrequency gives an estimate of the score. This is done sothat all proteins can be given a prediction. However, asmany of the genomes in this study are very sparse, derivedinteraction weights are very low. As a result, the back-ground frequency will be given excessive weight, whichnegatively affects predictions results. Hence we excludethe background frequency from FS-Weighted Averaging inthis work.
Prediction performance evaluationTo evaluate the performance of each approach, we use twopopular validation methods, precision-recall analysis andreceiver operating characteristics, both of which aredescribed below.
Precision-recall analysisThe first method is to plot the precision against recall forthe predictions made. Precision-recall analysis indicatesthe overall prediction performance of a predictionmethod. It also reflects the ability of a method to assignscores to predictions across different GO terms since itdoes not differentiate between scores assigned for differ-ent terms.
ki is the number of functions correctly predicted for pro-tein i;
mi is the number of functions predicted for protein i; and
ni is the number of functions annotated for protein i
Receiver operating characteristicsWhile precision-recall analysis summarizes the overallprediction performance of a prediction method, it doesnot tell us about the prediction performance for eachterm. Since it does not differentiate between predictionsmade for different terms, it also penalizes methods thatdo not assign scores that reflect prediction confidence uni-formly across different terms. Hence we choose to com-plement precision-recall analysis with another validationmethod. The Receiver operating characteristics (ROC)[22] score is the area under the curve derived from plot-ting true positives as a function of false positives. The ROC
score is computed for the predictions for each informativeGO term and measures how well the term is predicted forproteins. A higher ROC score indicates a better classifier,and the perfect classifier has an ROC score of 1. For anygiven GO term, if no prediction is made for a protein, weassume that the lowest possible score is assigned. TheROC does not reflect the recall of a method and does notdifferentiate between a method with very low recall and amethod with high recall but low precision. Hence the twovalidation methods are complementary.
Since statistical measures are used for the validation ofpredictions, we only consider terms that are annotated toa reasonably large number of proteins to ensure that con-clusions drawn from these measures are statisticallysound. We adopt the approach of informative functionalclasses used in [9] and [18]. For each of the 3 GO catego-ries – biological process, molecular function, and cellularcomponent – we define an informative GO term as a termwhich is annotated to at least n proteins and does not haveany child term that is annotated to at least n proteins. n =30 is used for the S. cerevisiae, D. melanogaster, M. muscu-lus, and H. sapiens genomes. For the remaining genomes,n = 10 is used instead as there are few or no informativeterms for validation when n = 30 is used.
AbbreviationsER – Endoplasmic Recticulum; FS-Weight – FunctionalSimilarity Weight; GTP – Guanosine triphosphate;GTPases – GTP binding proteins; GDP – Guanosinediphosphate; NC – Neighbour Counting; ROC – ReceiverOperating Characteristics; WA – FS-Weighted Averaging
Competing interestsThe authors declare that they have no competing interests.
Authors' contributionsHNC was responsible for conceptualization and imple-mentation and drafted the manuscript. WKS and LW par-ticipated in conceptualization and discussion as well asrevision of the draft.
Additional material
Z S u v S u v S v w S u wFS FS FS FSw Nv v
= + ( ) + ( ) ( ) ( )( )⎛
⎝⎜⎜
⎞
⎠⎟⎟∈∈
∑1 , max , , , ,NNu
∑
Precision Recall= =∑∑
∑∑
k
m
k
n
iiK
iiK
iiK
iiK
Additional file 1Supplementary Text and Figures. Precision vs. recall and ROC analyses of the predictions of informative GO terms from the Gene Ontology molec-ular function and cellular component categories using Neighbor Counting (NC), Chi-Square, and FS-Weighted Averaging (WA) for seven genomes.Click here for file[http://www.biomedcentral.com/content/supplementary/1471-2105-8-S4-S8-S1.pdf]
Page 12 of 13(page number not for citation purposes)
BMC Bioinformatics 2007, 8(Suppl 4):S8 http://www.biomedcentral.com/1471-2105/8/S4/S8
Publish with BioMed Central and every scientist can read your work free of charge
"BioMed Central will be the most significant development for disseminating the results of biomedical research in our lifetime."
Sir Paul Nurse, Cancer Research UK
Your research papers will be:
available free of charge to the entire biomedical community
peer reviewed and published immediately upon acceptance
cited in PubMed and archived on PubMed Central
yours — you keep the copyright
Submit your manuscript here:http://www.biomedcentral.com/info/publishing_adv.asp
BioMedcentral
AcknowledgementsThis research is funded in part by Singapore Agency for Science, Technol-ogy, and Research (A*STAR) Graduate Scholarship (HNC) and the A*STAR Institute for Infocomm Research-NUS School of Computing Joint Lab on Knowledge Discovery from Clinical Data (WKS, LW).
This article has been published as part of BMC Bioinformatics Volume 8, Sup-plement 4, 2007: The Second Automated Function Prediction Meeting. The full contents of the supplement are available online at http://www.biomed central.com/1471-2105/8?issue=S4.
References1. Dandekar T, Snel B, Huynen M, Bork P: Conservation of gene
order: a fingerprint of proteins that physically interact.Trends Biochem Sci 1998, 23:324-328.
2. Overbeek R, Fonstein M, D'Souza M, Pusch GD, Maltsev N: The useof gene clusters to infer functional coupling. Proc Natl Acad SciUSA 1999, 96:2896-2901.
3. Salgado H, Moreno-Hagelsieb G, Smith TF, Collado-Vides J: Operonsin Escherichia coli: genomic analyses and predictions. Proc NatlAcad Sci USA 2000, 97:6652-6657.
4. Marcotte EM, Pellegrini M, Ng HL, Rice DW, Yeates TO, EisenbergD: Detecting protein function and protein-protein interac-tions from genome sequences. Science 1999, 285:751-753.
5. Enright AJ, Iliopoulos I, Kyrpides NC, Ouzounis CA: Protein inter-action maps for complete genomes based on gene fusionevents. Nature 1999, 402:86-90.
6. Huynen M, Snel B, Lathe W, Bork P: Predicting protein functionby genomic context: quantitative evaluation and qualitativeinferences. Genome Res 2000, 10:1204-1210.
7. Pellegrini M, Marcotte EM, Thompson MJ, Eisenberg D, Yeates TO:Assigning protein functions by comparative genome analy-sis: Protein phylogenetic profiles. Proc Natl Acad Sci USA 1999,96:4285-4288.
8. Wu J, Kasif S, DeLisi C: Identification of functional linksbetween genes using phylogenetic profiles. Bioinformatics 2003,19:1524-1530.
9. Zhou X, Kao MC, Wong WH: Transitive functional annotationby shortest-path analysis of gene expression data. Proc NatlAcad Sci USA 2002, 99:12783-12788.
10. Schwikowski B, Uetz P, Fields S: A network of interacting pro-teins in yeast. Nat Biotechnol 2000, 18:1257-1261.
11. Hishigaki H, Nakai K, Ono T, Tanigami A, Takagi T: Assessment ofprediction accuracy of protein function from protein-proteininteraction data. Yeast 2001, 18:525-531.
12. Brun C, Chevenet F, Martin D, Wojcik J, Guénoche A, Jacq B: Func-tional classification of proteins for the prediction of cellularfunction from a protein-protein interaction network. GenomeBiol 2003, 5:R6.
13. Samanta MP, Liang S: Predicting protein functions from redun-dancies in large-scale protein interaction networks. Proc NatlAcad Sci USA 2003, 100:12579-83.
14. Lanckriet GR, Deng M, Cristianini N, Jordan MI, Noble WS: Kernel-based data fusion and its application to protein function pre-diction in yeast. Pac Symp Biocomput 2004, :300-311.
15. Letovsky S, Kasif S: Predicting protein function from protein/protein interaction data: a probabilistic approach. Bioinformat-ics 2003, 19(Suppl 1):i197-i204.
16. Deng M, Zhang K, Mehta S, Chen T, Sun F: Prediction of proteinfunction using protein-protein interaction data. J Comput Biol2003, 10:947-960.
17. Vazquez A, Flammi A, Maritan A, Vespignani A: Global proteinfunction prediction from protein-protein interaction net-works. Nat Biotechnol 2003, 21:697-700.
18. Chua HN, Sung WK, Wong L: Exploiting indirect neighboursand topological weight to predict protein function from pro-tein-protein interactions. Bioinformatics 2006, 22:1623-1630.
19. Breitkreutz BJ, Stark C, Tyers M: The GRID: the General Repos-itory for Interaction Datasets. Genome Biol 2003, 4:R23.
20. Ashburner M, Ball CA, Blake JA, Botstein D, Butler H, Cherry JM,Davis AP, Dolinski K, Dwight S, Eppig JT, et al.: Gene ontology: toolfor the unification of biology. The Gene Ontology Consor-tium. Nat Genet 2000, 25:25-29 [http://www.godatabase.org].
21. Altschul SF, Gish W, Miller W, Myers EW, Lipman DJ: A basic localalignment search tool. J Mol Biol 1990, 215:403-410.
22. Gribskov M, Robinson NL: Use of receiver operating character-istic analysis to evaluate sequence matching. Comput Chem1996, 20:25-33.
23. Snel B, Lehmann G, Bork P, Huynen MA: STRING: a web-serverto retrieve and display the repeatedly occurring neighbour-hood of a gene. Nucleic Acids Res 2000, 28:3442-3444 [http://string.embl.de/].
24. Grigoriev A: On the number of protein-protein interactions inthe yeast proteome. Nucleic Acids Res 2003, 31:4157-4161.
25. Sprinzak E, Sattath S, Margalit H: How reliable are experimentalprotein-protein interaction data? J Mol Biol 2003, 327:919-923.
26. FS-Weighted Averaging predictions for uncharacterizedyeast ORFs [http://srs2.bic.nus.edu.sg/~kenny/fsweightedavg/]
27. Bader G, Donaldson I, Wolting C, Ouellette B, Pawson T, Hogue C:BIND – the biomolecular interaction network database.Nucleic Acids Res 2001, 29:242-245.
28. Lu Z, Hunter L: GO molecular function terms are predictive ofsubcellular localization. Pac Symp Biocomput :151-161.
Page 13 of 13(page number not for citation purposes)