use of polymer mats in series for sequential reactive barrier remediation of ammonium-contaminated...
TRANSCRIPT
Use of Polymer Mats in Series forSequential Reactive BarrierRemediation ofAmmonium-ContaminatedGroundwater: Field EvaluationB . M . P A T T E R S O N , * , † M . E . G R A S S I , † , ‡
B . S . R O B E R T S O N , † G . B . D A V I S , †
A . J . S M I T H , † A N D A . J . M C K I N L E Y ‡
CSIRO Land and Water, Private Bag No. 5, Wembley,Western Australia 6913, Australia, and Chemistry, School ofBiomedical and Chemical Sciences, The University of WesternAustralia, Nedlands, Western Australia 6907, Australia
A pilot-scale field trial was undertaken to evaluate thepotential of in situ polymer mats (installed in series) aspermeable reactive barriers within a treatment wallremediation system to induce sequential bioremediationof ammonium-contaminated groundwater. The treatmentwall consisted of 10 m wide impermeable wings on eitherside of a 0.75 m wide permeable reactive zone flow-through box. Two polymer mats were positioned in the flow-through box. The upgradient polymer mat within the flow-through box was used to deliver oxygen to inducebacterial nitrification of the ammonium to nitrite/nitrate asthe groundwater moved past. The downgradient polymermat delivered ethanol to induce bacterial denitrification ofthe nitrite/nitrate to produce nitrogen gas. The field trialwas carried out at a near-shore location. Initially the flow-through box was left open; however, this resulted insubstantial groundwater mixing, which inhibited sequentialremediation. Once the flow-through box was in-filledwith gravel, groundwater mixing was reduced, achievinga greater than 90% reduction in total N. Estimated first-order half-lives for nitrification and denitrification rateswere 1.2 and 0.4 d, respectively. Field nitrification half-lives were approximately an order of magnitude greater thanrates determined in large-scale columns using soil andgroundwater from the site, while denitrification half-liveswere similar. The results of this pilot-scale field trial indicatethat sequential bioremediation of ammonium-contaminatedgroundwater at field scale is feasible using in situpolymer mats as permeable reactive barriers, althoughhydraulic conditions can be complex in such barrier systems.
IntroductionCompounding effects of multiple diffuse and point sources,from industry, sewage treatment lagoons, and fertilizer use,can result in ammonium and nitrate contamination ofgroundwater (1). Conventional remediation techniquesnormally involve pumping and capture of polluted ground-
water, with expensive long-term above-ground treatment oflarge volumes of water.
In situ permeable reactive barriers (PRBs) have been usedfor a range of groundwater contaminants such as dechlo-rination of trichloroethene-contaminated groundwater anddenitrification of nitrate-contaminated groundwater. PRBsconstructed with a slowly degrading carbon source, such assawdust (2, 3) or cotton (4), have been investigated to promotean anaerobic environment and provide an energy source fordenitrifying bacteria. The use of PRBs to treat contaminatedgroundwater offers the potential for low-cost remediation,as they rely on the natural hydraulic gradient of the aquiferto induce groundwater flow through the permeable barrier,thus avoiding pumping and above-ground treatment. To becost-effective, long-term maintenance costs need to be low,including amendment or treatment delivery to the PRB. Fora recent overview of bioreactive PRBs, see Davis and Patterson(5).
For ammonium-contaminated groundwater, sequentialnitrification followed by denitrification of nitrate to nitrogengas is feasible (6). However, for in situ treatment, there arefew technologies capable of sequential remediation treatmentover a short time frame or groundwater flow distance,especially where there is a need to induce different geochem-ical redox conditions for contaminant degradation.
For mixed groundwater contaminants (e.g., petroleumand chlorinated hydrocarbons), there have been limited insitu sequential remediation strategies investigated at fieldscale. Morkin et al. (7) conducted an in situ sequential fielddemonstration treatment of a mixed contaminant plume ofpetroleum and chlorinated hydrocarbons, using a combina-tion of an iron reactive wall and air sparging. Fiorenza et al.(8) collated data from field evaluations involving a sequentialiron reactive wall and slow release of oxygen or air sparging.
Polymer-based diffusion systems designed as PRBs havethe potential for targeted delivery of amendments to ground-water contaminants. These targeted PRBs may provide insitu sequential remediation strategies over a short time frameor groundwater flow distance. Also, they may overcomeregeneration problems as the amendments can potentiallybe maintained indefinitely, leading to reduced costs associ-ated with regenerating PRBs.
Polymer-based diffusion systems have been used inlaboratory-scale membrane aeration bioreactors (MABRs)for nitrification (9) and removal of dissolved organic carbon(DOC) in synthetic wastewaters, and in a membrane reactorfor the deoxygenation of a mineral medium (10). In situdiffusion systems using polymers have also been used todeliver dissolved benzene and trichloroethene (TCE) asgroundwater tracers (11). Oxygen has also been deliveredusing polymers to stimulate in situ biodegradation of BTEX(benzene, toluene, ethylbenzene, and xylene) (12), methyltert-butyl ether (MTBE) (13), and atrazine (14) contaminatedgroundwaters. Recently this polymer membrane approachhas been applied to ammonium-contaminated groundwateras a sequential nitrification and denitrification treatment/delivery system in laboratory column experiments (6).
Scale-up of this polymer-based delivery system for theremediation of ammonium-contaminated groundwater hasnow been undertaken. In this paper we present results froma pilot-scale field demonstration trial using polymer mats aspermeable reactive barriers for a dual treatment/deliverysystem to remediate ammonium-contaminated groundwatervia sequential nitrification and denitrification.
* Corresponding author phone: 61-8-93336276; fax: 61-8-93336211; e-mail: [email protected].
† CSORO Land and Water.‡ The University of Western Australia.
Environ. Sci. Technol. 2004, 38, 6846-6854
6846 9 ENVIRONMENTAL SCIENCE & TECHNOLOGY / VOL. 38, NO. 24, 2004 10.1021/es0497781 CCC: $27.50 2004 American Chemical SocietyPublished on Web 11/06/2004
Site DescriptionThe site for the field demonstration is near Perth, WesternAustralia, on the Swan Coastal Plain. The site was locatedwithin 30 m of the shoreline of Cockburn Sound (15). Thestratigraphy of the site consisted of approximately 11 m ofmedium to fine dune sand overlying a clay aquitard. Thewater table was approximately 1.0 m below ground.
Leaks and spills of ammonium products from a fertilizerfactory approximately 300 m upgradient of the site hadresulted in an ammonium-contaminated groundwater plume.Multilevel piezometer data at the location of the treatmentwall showed the plume was approximately 6 m thick,extending from approximately 5 m below ground to the clayaquitard at 11 m below ground. At this location, the maximumtotal N concentration of 110 mg L-1 was located 6 m belowground. The ammonium-contaminated plume was anaero-bic, but only mildly reductive (Eh between +80 and -50 mV)with a low DOC content of 7 mg L-1. Further details of thesite groundwater chemistry are given by Patterson et al. (6).
Materials and MethodsDesign of the Treatment Wall. The pilot-scale treatmentwall was emplaced within an ammonium plume to test, atpilot scale, the feasibility of the in situ sequential polymermat remediation system. The test was not designed to captureand remediate the entire ammonium plume.
The treatment wall was designed with impermeable wingsto direct a proportion of the ammonium-contaminatedgroundwater plume through the permeable reactive zone.Initial column experiments using a polymer mat deliverysystem showed that the oxygen and ethanol delivery ratesdid not limit nitrification and denitrification rates at ground-water flow rates up to 300 m yr-1 (6). As these flow rates wereapproximately an order of magnitude greater than estimatedgroundwater velocities at the field site, the treatment wallwas designed with 10 m wide impermeable wings on eitherside of a 0.75 m wide permeable reactive zone flow-throughbox.
Due to cost limitations, the treatment wall was designedusing 7 m deep impermeable wings and a 7 m deep permeablereactive zone flow-through box. As a result, the treatmentwall was not keyed into the clay aquitard at the base of thesand aquifer (11 m below ground), and only targeted the topof the ammonium plume, where the total N (sum of NH4
+
N, NO3--N, and NO2
--N concentrations) concentration was∼10 mg L-1.
Preliminary modeling used an aquifer permeability of 25m d-1, a wing permeability 3 orders of magnitude lower, anda flow-through box permeability 3 orders of magnitudegreater than the aquifer permeability. Modeling predictedthat using 10 m wide (and 7 m deep) impermeable wings oneither side of a 0.75 m wide permeable reactive zone, notkeyed into the clay aquitard at 11 m below ground, wouldincrease the groundwater flux rates through the flow-throughbox and reactive zone by a factor of 2.7, but flow rates wouldbe less if the flow-through box was in-filled with gravel.
Since the treatment wall was not keyed into the clayaqutard, only a proportion of the groundwater flowing to thetreatment wall would flow through the flow-through box.Groundwater close to the base of the impermeable wingswould tend to travel under the wings rather than throughthe permeable reactive zone, reducing the efficiency of thewings with depth. Also, groundwater close to the sides of theimpermeable wings would tend to travel around the wings.
Construction of the Treatment Wall. The 0.75 m wide,1 m long, 7 m deep permeable reactive zone flow-throughbox was constructed of galvanized mild steel (<0.15% carbon)with PVC screens covering approximately 60% of the surfacearea at the front and back, to allow groundwater to flowthrough the box. The PVC screens had 1 mm wide slots every5 mm, giving an overall open area of approximately 12%.The box was open at the top and bottom. Five pairs of guidechannels were welded into the box to allow vertical instal-lation of the removable polymer mat panels or monitoringpanels.
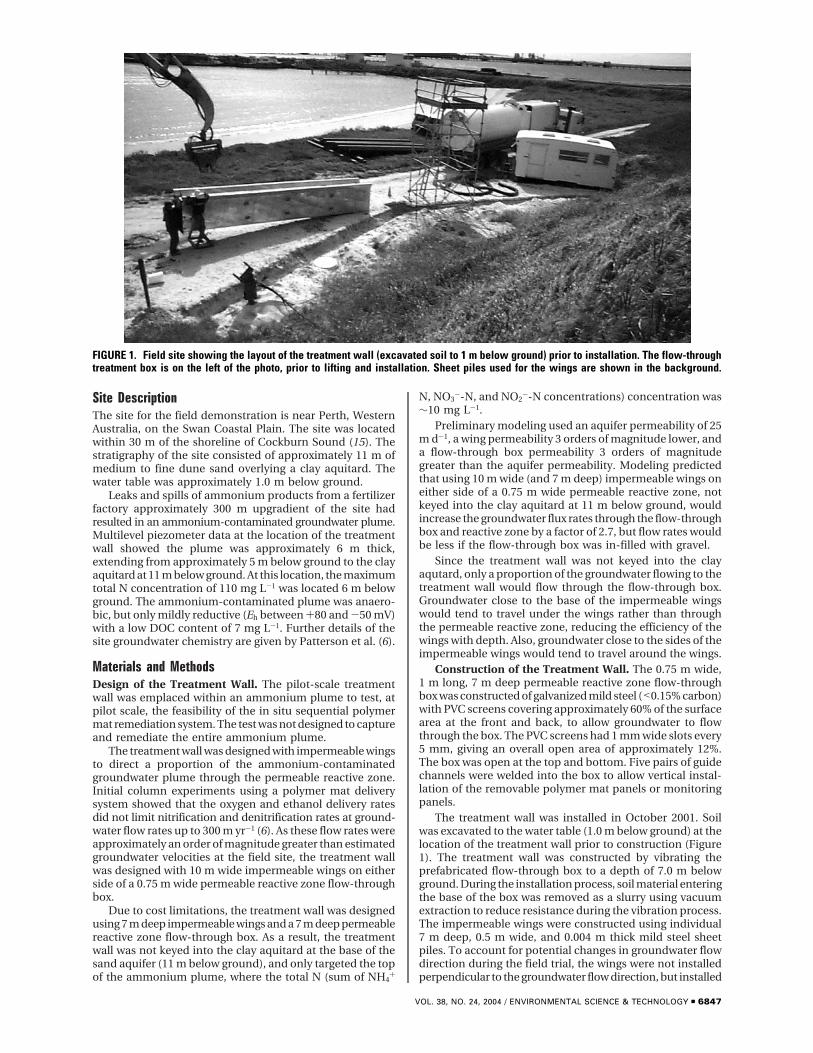
The treatment wall was installed in October 2001. Soilwas excavated to the water table (1.0 m below ground) at thelocation of the treatment wall prior to construction (Figure1). The treatment wall was constructed by vibrating theprefabricated flow-through box to a depth of 7.0 m belowground. During the installation process, soil material enteringthe base of the box was removed as a slurry using vacuumextraction to reduce resistance during the vibration process.The impermeable wings were constructed using individual7 m deep, 0.5 m wide, and 0.004 m thick mild steel sheetpiles. To account for potential changes in groundwater flowdirection during the field trial, the wings were not installedperpendicular to the groundwater flow direction, but installed
FIGURE 1. Field site showing the layout of the treatment wall (excavated soil to 1 m below ground) prior to installation. The flow-throughtreatment box is on the left of the photo, prior to lifting and installation. Sheet piles used for the wings are shown in the background.
VOL. 38, NO. 24, 2004 / ENVIRONMENTAL SCIENCE & TECHNOLOGY 9 6847
at an angle of 70° to the groundwater flow direction. Theeffect of seasonal changes on groundwater flow direction onthe Swan Coastal Plain has previously been observed (16).The sheet piles were interlocked with the box or other sheetpiles and vibrated to a depth of 7.5 m below ground (0.5 mbelow the ground surface). To ensure that the sheet pile wallwas sealed, a bentonite slurry was injected into the sheetpile and sheet pile/box joints, similar to the method of Starret al. (17).
Once the treatment wall was constructed, soil materialwithin the box was excavated to a depth of 6.5 m belowground and gravel-packed sand bags were installed to a depthof 6 m to stop any upward migration of native soil material.
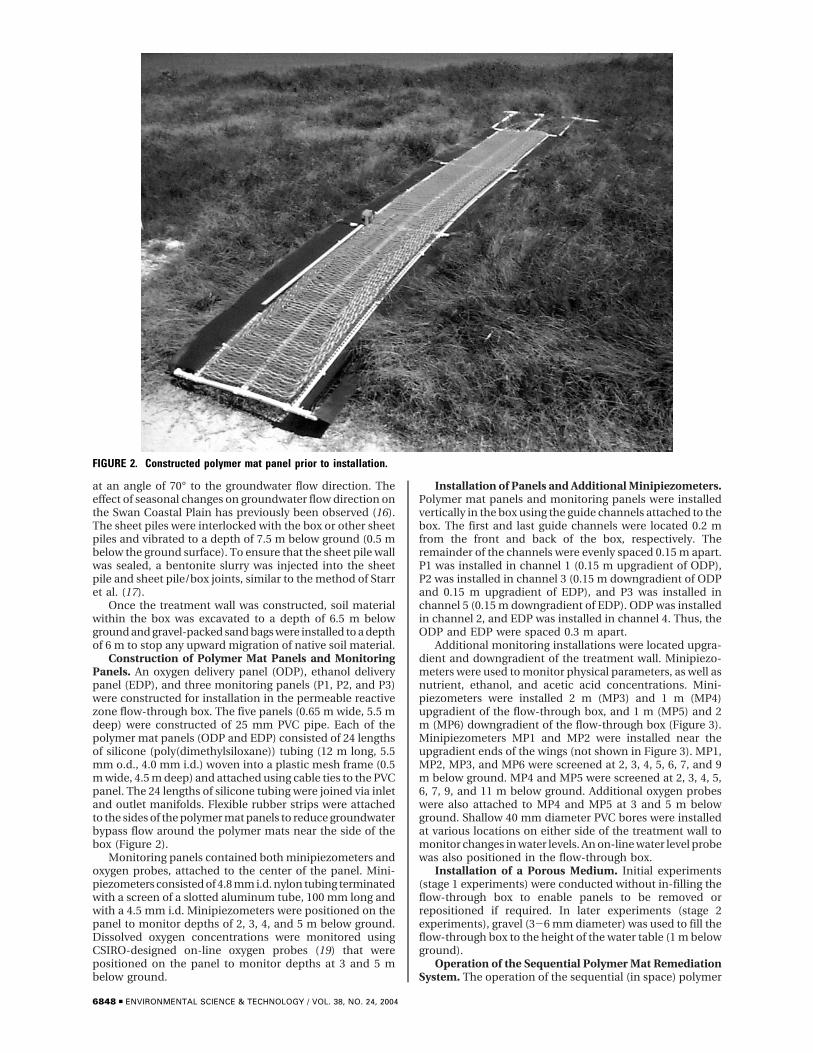
Construction of Polymer Mat Panels and MonitoringPanels. An oxygen delivery panel (ODP), ethanol deliverypanel (EDP), and three monitoring panels (P1, P2, and P3)were constructed for installation in the permeable reactivezone flow-through box. The five panels (0.65 m wide, 5.5 mdeep) were constructed of 25 mm PVC pipe. Each of thepolymer mat panels (ODP and EDP) consisted of 24 lengthsof silicone (poly(dimethylsiloxane)) tubing (12 m long, 5.5mm o.d., 4.0 mm i.d.) woven into a plastic mesh frame (0.5m wide, 4.5 m deep) and attached using cable ties to the PVCpanel. The 24 lengths of silicone tubing were joined via inletand outlet manifolds. Flexible rubber strips were attachedto the sides of the polymer mat panels to reduce groundwaterbypass flow around the polymer mats near the side of thebox (Figure 2).
Monitoring panels contained both minipiezometers andoxygen probes, attached to the center of the panel. Mini-piezometers consisted of 4.8 mm i.d. nylon tubing terminatedwith a screen of a slotted aluminum tube, 100 mm long andwith a 4.5 mm i.d. Minipiezometers were positioned on thepanel to monitor depths of 2, 3, 4, and 5 m below ground.Dissolved oxygen concentrations were monitored usingCSIRO-designed on-line oxygen probes (19) that werepositioned on the panel to monitor depths at 3 and 5 mbelow ground.
Installation of Panels and Additional Minipiezometers.Polymer mat panels and monitoring panels were installedvertically in the box using the guide channels attached to thebox. The first and last guide channels were located 0.2 mfrom the front and back of the box, respectively. Theremainder of the channels were evenly spaced 0.15 m apart.P1 was installed in channel 1 (0.15 m upgradient of ODP),P2 was installed in channel 3 (0.15 m downgradient of ODPand 0.15 m upgradient of EDP), and P3 was installed inchannel 5 (0.15 m downgradient of EDP). ODP was installedin channel 2, and EDP was installed in channel 4. Thus, theODP and EDP were spaced 0.3 m apart.
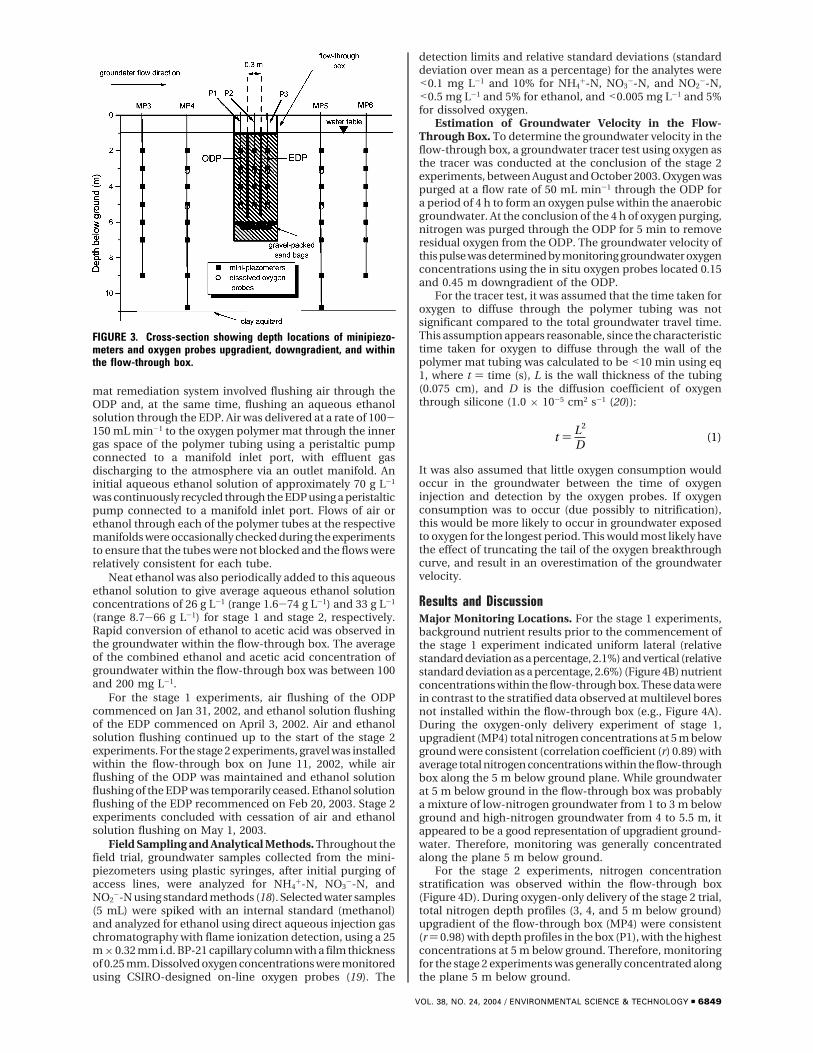
Additional monitoring installations were located upgra-dient and downgradient of the treatment wall. Minipiezo-meters were used to monitor physical parameters, as well asnutrient, ethanol, and acetic acid concentrations. Mini-piezometers were installed 2 m (MP3) and 1 m (MP4)upgradient of the flow-through box, and 1 m (MP5) and 2m (MP6) downgradient of the flow-through box (Figure 3).Minipiezometers MP1 and MP2 were installed near theupgradient ends of the wings (not shown in Figure 3). MP1,MP2, MP3, and MP6 were screened at 2, 3, 4, 5, 6, 7, and 9m below ground. MP4 and MP5 were screened at 2, 3, 4, 5,6, 7, 9, and 11 m below ground. Additional oxygen probeswere also attached to MP4 and MP5 at 3 and 5 m belowground. Shallow 40 mm diameter PVC bores were installedat various locations on either side of the treatment wall tomonitor changes in water levels. An on-line water level probewas also positioned in the flow-through box.
Installation of a Porous Medium. Initial experiments(stage 1 experiments) were conducted without in-filling theflow-through box to enable panels to be removed orrepositioned if required. In later experiments (stage 2experiments), gravel (3-6 mm diameter) was used to fill theflow-through box to the height of the water table (1 m belowground).
Operation of the Sequential Polymer Mat RemediationSystem. The operation of the sequential (in space) polymer
FIGURE 2. Constructed polymer mat panel prior to installation.
6848 9 ENVIRONMENTAL SCIENCE & TECHNOLOGY / VOL. 38, NO. 24, 2004
mat remediation system involved flushing air through theODP and, at the same time, flushing an aqueous ethanolsolution through the EDP. Air was delivered at a rate of 100-150 mL min-1 to the oxygen polymer mat through the innergas space of the polymer tubing using a peristaltic pumpconnected to a manifold inlet port, with effluent gasdischarging to the atmosphere via an outlet manifold. Aninitial aqueous ethanol solution of approximately 70 g L-1
was continuously recycled through the EDP using a peristalticpump connected to a manifold inlet port. Flows of air orethanol through each of the polymer tubes at the respectivemanifolds were occasionally checked during the experimentsto ensure that the tubes were not blocked and the flows wererelatively consistent for each tube.
Neat ethanol was also periodically added to this aqueousethanol solution to give average aqueous ethanol solutionconcentrations of 26 g L-1 (range 1.6-74 g L-1) and 33 g L-1
(range 8.7-66 g L-1) for stage 1 and stage 2, respectively.Rapid conversion of ethanol to acetic acid was observed inthe groundwater within the flow-through box. The averageof the combined ethanol and acetic acid concentration ofgroundwater within the flow-through box was between 100and 200 mg L-1.
For the stage 1 experiments, air flushing of the ODPcommenced on Jan 31, 2002, and ethanol solution flushingof the EDP commenced on April 3, 2002. Air and ethanolsolution flushing continued up to the start of the stage 2experiments. For the stage 2 experiments, gravel was installedwithin the flow-through box on June 11, 2002, while airflushing of the ODP was maintained and ethanol solutionflushing of the EDP was temporarily ceased. Ethanol solutionflushing of the EDP recommenced on Feb 20, 2003. Stage 2experiments concluded with cessation of air and ethanolsolution flushing on May 1, 2003.
Field Sampling and Analytical Methods. Throughout thefield trial, groundwater samples collected from the mini-piezometers using plastic syringes, after initial purging ofaccess lines, were analyzed for NH4
+-N, NO3--N, and
NO2--N using standard methods (18). Selected water samples
(5 mL) were spiked with an internal standard (methanol)and analyzed for ethanol using direct aqueous injection gaschromatography with flame ionization detection, using a 25m × 0.32 mm i.d. BP-21 capillary column with a film thicknessof 0.25 mm. Dissolved oxygen concentrations were monitoredusing CSIRO-designed on-line oxygen probes (19). The
detection limits and relative standard deviations (standarddeviation over mean as a percentage) for the analytes were<0.1 mg L-1 and 10% for NH4
+-N, NO3--N, and NO2
--N,<0.5 mg L-1 and 5% for ethanol, and <0.005 mg L-1 and 5%for dissolved oxygen.
Estimation of Groundwater Velocity in the Flow-Through Box. To determine the groundwater velocity in theflow-through box, a groundwater tracer test using oxygen asthe tracer was conducted at the conclusion of the stage 2experiments, between August and October 2003. Oxygen waspurged at a flow rate of 50 mL min-1 through the ODP fora period of 4 h to form an oxygen pulse within the anaerobicgroundwater. At the conclusion of the 4 h of oxygen purging,nitrogen was purged through the ODP for 5 min to removeresidual oxygen from the ODP. The groundwater velocity ofthis pulse was determined by monitoring groundwater oxygenconcentrations using the in situ oxygen probes located 0.15and 0.45 m downgradient of the ODP.
For the tracer test, it was assumed that the time taken foroxygen to diffuse through the polymer tubing was notsignificant compared to the total groundwater travel time.This assumption appears reasonable, since the characteristictime taken for oxygen to diffuse through the wall of thepolymer mat tubing was calculated to be <10 min using eq1, where t ) time (s), L is the wall thickness of the tubing(0.075 cm), and D is the diffusion coefficient of oxygenthrough silicone (1.0 × 10⁻⁵ cm2 s-1 (20)):
It was also assumed that little oxygen consumption wouldoccur in the groundwater between the time of oxygeninjection and detection by the oxygen probes. If oxygenconsumption was to occur (due possibly to nitrification),this would be more likely to occur in groundwater exposedto oxygen for the longest period. This would most likely havethe effect of truncating the tail of the oxygen breakthroughcurve, and result in an overestimation of the groundwatervelocity.
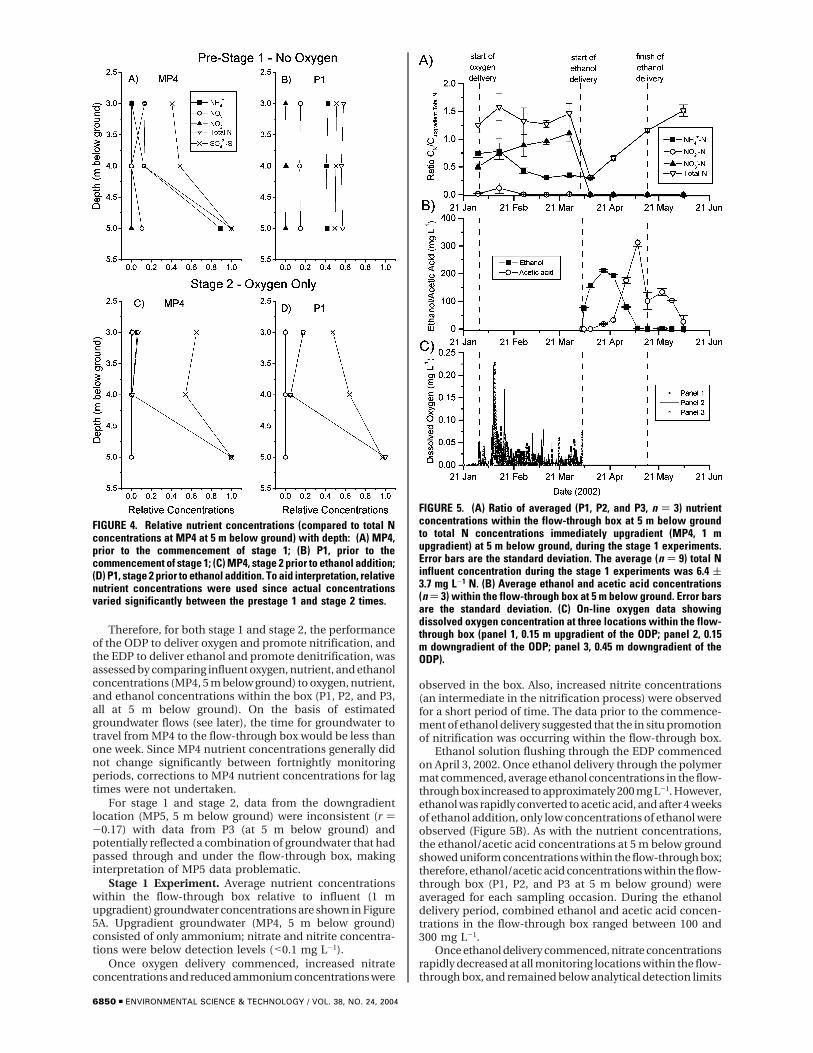
Results and DiscussionMajor Monitoring Locations. For the stage 1 experiments,background nutrient results prior to the commencement ofthe stage 1 experiment indicated uniform lateral (relativestandard deviation as a percentage, 2.1%) and vertical (relativestandard deviation as a percentage, 2.6%) (Figure 4B) nutrientconcentrations within the flow-through box. These data werein contrast to the stratified data observed at multilevel boresnot installed within the flow-through box (e.g., Figure 4A).During the oxygen-only delivery experiment of stage 1,upgradient (MP4) total nitrogen concentrations at 5 m belowground were consistent (correlation coefficient (r) 0.89) withaverage total nitrogen concentrations within the flow-throughbox along the 5 m below ground plane. While groundwaterat 5 m below ground in the flow-through box was probablya mixture of low-nitrogen groundwater from 1 to 3 m belowground and high-nitrogen groundwater from 4 to 5.5 m, itappeared to be a good representation of upgradient ground-water. Therefore, monitoring was generally concentratedalong the plane 5 m below ground.
For the stage 2 experiments, nitrogen concentrationstratification was observed within the flow-through box(Figure 4D). During oxygen-only delivery of the stage 2 trial,total nitrogen depth profiles (3, 4, and 5 m below ground)upgradient of the flow-through box (MP4) were consistent(r ) 0.98) with depth profiles in the box (P1), with the highestconcentrations at 5 m below ground. Therefore, monitoringfor the stage 2 experiments was generally concentrated alongthe plane 5 m below ground.
FIGURE 3. Cross-section showing depth locations of minipiezo-meters and oxygen probes upgradient, downgradient, and withinthe flow-through box.
t ) L2
D(1)
VOL. 38, NO. 24, 2004 / ENVIRONMENTAL SCIENCE & TECHNOLOGY 9 6849
Therefore, for both stage 1 and stage 2, the performanceof the ODP to deliver oxygen and promote nitrification, andthe EDP to deliver ethanol and promote denitrification, wasassessed by comparing influent oxygen, nutrient, and ethanolconcentrations (MP4, 5 m below ground) to oxygen, nutrient,and ethanol concentrations within the box (P1, P2, and P3,all at 5 m below ground). On the basis of estimatedgroundwater flows (see later), the time for groundwater totravel from MP4 to the flow-through box would be less thanone week. Since MP4 nutrient concentrations generally didnot change significantly between fortnightly monitoringperiods, corrections to MP4 nutrient concentrations for lagtimes were not undertaken.
For stage 1 and stage 2, data from the downgradientlocation (MP5, 5 m below ground) were inconsistent (r )-0.17) with data from P3 (at 5 m below ground) andpotentially reflected a combination of groundwater that hadpassed through and under the flow-through box, makinginterpretation of MP5 data problematic.
Stage 1 Experiment. Average nutrient concentrationswithin the flow-through box relative to influent (1 mupgradient) groundwater concentrations are shown in Figure5A. Upgradient groundwater (MP4, 5 m below ground)consisted of only ammonium; nitrate and nitrite concentra-tions were below detection levels (<0.1 mg L-1).
Once oxygen delivery commenced, increased nitrateconcentrations and reduced ammonium concentrations were
observed in the box. Also, increased nitrite concentrations(an intermediate in the nitrification process) were observedfor a short period of time. The data prior to the commence-ment of ethanol delivery suggested that the in situ promotionof nitrification was occurring within the flow-through box.
Ethanol solution flushing through the EDP commencedon April 3, 2002. Once ethanol delivery through the polymermat commenced, average ethanol concentrations in the flow-through box increased to approximately 200 mg L-1. However,ethanol was rapidly converted to acetic acid, and after 4 weeksof ethanol addition, only low concentrations of ethanol wereobserved (Figure 5B). As with the nutrient concentrations,the ethanol/acetic acid concentrations at 5 m below groundshowed uniform concentrations within the flow-through box;therefore, ethanol/acetic acid concentrations within the flow-through box (P1, P2, and P3 at 5 m below ground) wereaveraged for each sampling occasion. During the ethanoldelivery period, combined ethanol and acetic acid concen-trations in the flow-through box ranged between 100 and300 mg L-1.
Once ethanol delivery commenced, nitrate concentrationsrapidly decreased at all monitoring locations within the flow-through box, and remained below analytical detection limits
FIGURE 4. Relative nutrient concentrations (compared to total Nconcentrations at MP4 at 5 m below ground) with depth: (A) MP4,prior to the commencement of stage 1; (B) P1, prior to thecommencement of stage 1; (C) MP4, stage 2 prior to ethanol addition;(D) P1, stage 2 prior to ethanol addition. To aid interpretation, relativenutrient concentrations were used since actual concentrationsvaried significantly between the prestage 1 and stage 2 times.
FIGURE 5. (A) Ratio of averaged (P1, P2, and P3, n ) 3) nutrientconcentrations within the flow-through box at 5 m below groundto total N concentrations immediately upgradient (MP4, 1 mupgradient) at 5 m below ground, during the stage 1 experiments.Error bars are the standard deviation. The average (n ) 9) total Ninfluent concentration during the stage 1 experiments was 6.4 (3.7 mg L-1 N. (B) Average ethanol and acetic acid concentrations(n ) 3) within the flow-through box at 5 m below ground. Error barsare the standard deviation. (C) On-line oxygen data showingdissolved oxygen concentration at three locations within the flow-through box (panel 1, 0.15 m upgradient of the ODP; panel 2, 0.15m downgradient of the ODP; panel 3, 0.45 m downgradient of theODP).
6850 9 ENVIRONMENTAL SCIENCE & TECHNOLOGY / VOL. 38, NO. 24, 2004
(Figure 5A). The disappearance of nitrate, coupled with thereduction in total N, suggests that denitrification wasoccurring within the flow-through box.
However, after ethanol delivery commenced, ammoniumconcentrations slowly increased within the flow-through box(Figure 5A). Assuming the flux of ammonium entering theflow-through box from upgradient was maintained, theincrease in ammonium concentrations suggests nitrificationhad ceased, possibly as a result of the ethanol consumingthe available oxygen. Total N concentrations within the flow-through box before ethanol delivery and at the end of thestage 1 experiment were ∼40% higher than influent con-centrations. These higher concentrations were most likelydue to temporal plume variability along the 5 m flow lineduring this time.
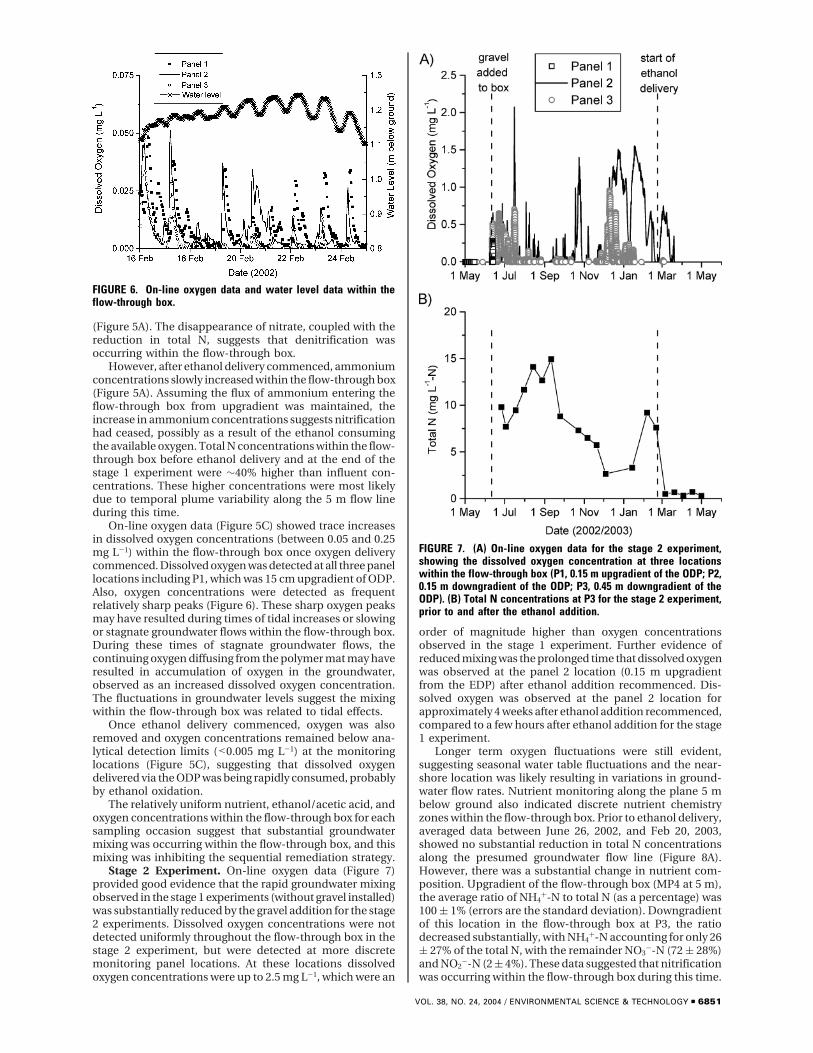
On-line oxygen data (Figure 5C) showed trace increasesin dissolved oxygen concentrations (between 0.05 and 0.25mg L-1) within the flow-through box once oxygen deliverycommenced. Dissolved oxygen was detected at all three panellocations including P1, which was 15 cm upgradient of ODP.Also, oxygen concentrations were detected as frequentrelatively sharp peaks (Figure 6). These sharp oxygen peaksmay have resulted during times of tidal increases or slowingor stagnate groundwater flows within the flow-through box.During these times of stagnate groundwater flows, thecontinuing oxygen diffusing from the polymer mat may haveresulted in accumulation of oxygen in the groundwater,observed as an increased dissolved oxygen concentration.The fluctuations in groundwater levels suggest the mixingwithin the flow-through box was related to tidal effects.
Once ethanol delivery commenced, oxygen was alsoremoved and oxygen concentrations remained below ana-lytical detection limits (<0.005 mg L-1) at the monitoringlocations (Figure 5C), suggesting that dissolved oxygendelivered via the ODP was being rapidly consumed, probablyby ethanol oxidation.
The relatively uniform nutrient, ethanol/acetic acid, andoxygen concentrations within the flow-through box for eachsampling occasion suggest that substantial groundwatermixing was occurring within the flow-through box, and thismixing was inhibiting the sequential remediation strategy.
Stage 2 Experiment. On-line oxygen data (Figure 7)provided good evidence that the rapid groundwater mixingobserved in the stage 1 experiments (without gravel installed)was substantially reduced by the gravel addition for the stage2 experiments. Dissolved oxygen concentrations were notdetected uniformly throughout the flow-through box in thestage 2 experiment, but were detected at more discretemonitoring panel locations. At these locations dissolvedoxygen concentrations were up to 2.5 mg L-1, which were an
order of magnitude higher than oxygen concentrationsobserved in the stage 1 experiment. Further evidence ofreduced mixing was the prolonged time that dissolved oxygenwas observed at the panel 2 location (0.15 m upgradientfrom the EDP) after ethanol addition recommenced. Dis-solved oxygen was observed at the panel 2 location forapproximately 4 weeks after ethanol addition recommenced,compared to a few hours after ethanol addition for the stage1 experiment.
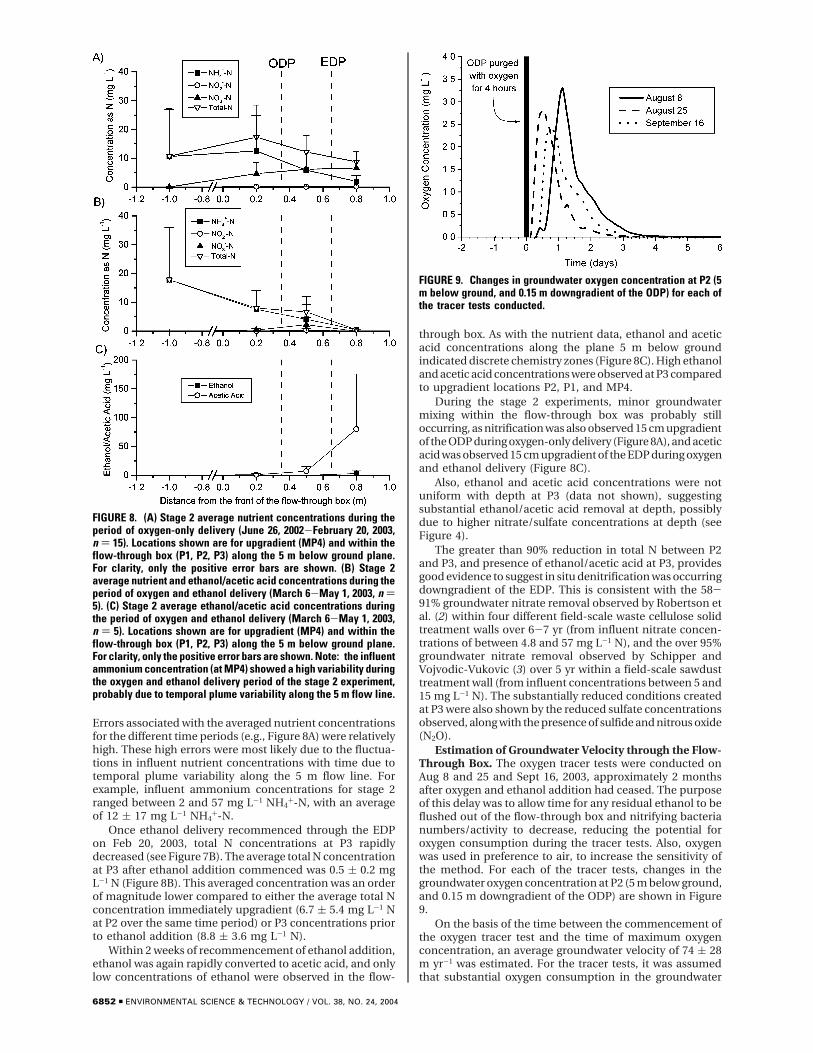
Longer term oxygen fluctuations were still evident,suggesting seasonal water table fluctuations and the near-shore location was likely resulting in variations in ground-water flow rates. Nutrient monitoring along the plane 5 mbelow ground also indicated discrete nutrient chemistryzones within the flow-through box. Prior to ethanol delivery,averaged data between June 26, 2002, and Feb 20, 2003,showed no substantial reduction in total N concentrationsalong the presumed groundwater flow line (Figure 8A).However, there was a substantial change in nutrient com-position. Upgradient of the flow-through box (MP4 at 5 m),the average ratio of NH4
+-N to total N (as a percentage) was100 ( 1% (errors are the standard deviation). Downgradientof this location in the flow-through box at P3, the ratiodecreased substantially, with NH4
+-N accounting for only 26( 27% of the total N, with the remainder NO3
--N (72 ( 28%)and NO2
--N (2 ( 4%). These data suggested that nitrificationwas occurring within the flow-through box during this time.
FIGURE 6. On-line oxygen data and water level data within theflow-through box.
FIGURE 7. (A) On-line oxygen data for the stage 2 experiment,showing the dissolved oxygen concentration at three locationswithin the flow-through box (P1, 0.15 m upgradient of the ODP; P2,0.15 m downgradient of the ODP; P3, 0.45 m downgradient of theODP). (B) Total N concentrations at P3 for the stage 2 experiment,prior to and after the ethanol addition.
VOL. 38, NO. 24, 2004 / ENVIRONMENTAL SCIENCE & TECHNOLOGY 9 6851
Errors associated with the averaged nutrient concentrationsfor the different time periods (e.g., Figure 8A) were relativelyhigh. These high errors were most likely due to the fluctua-tions in influent nutrient concentrations with time due totemporal plume variability along the 5 m flow line. Forexample, influent ammonium concentrations for stage 2ranged between 2 and 57 mg L-1 NH4
+-N, with an averageof 12 ( 17 mg L-1 NH4
+-N.Once ethanol delivery recommenced through the EDP
on Feb 20, 2003, total N concentrations at P3 rapidlydecreased (see Figure 7B). The average total N concentrationat P3 after ethanol addition commenced was 0.5 ( 0.2 mgL-1 N (Figure 8B). This averaged concentration was an orderof magnitude lower compared to either the average total Nconcentration immediately upgradient (6.7 ( 5.4 mg L-1 Nat P2 over the same time period) or P3 concentrations priorto ethanol addition (8.8 ( 3.6 mg L-1 N).
Within 2 weeks of recommencement of ethanol addition,ethanol was again rapidly converted to acetic acid, and onlylow concentrations of ethanol were observed in the flow-
through box. As with the nutrient data, ethanol and aceticacid concentrations along the plane 5 m below groundindicated discrete chemistry zones (Figure 8C). High ethanoland acetic acid concentrations were observed at P3 comparedto upgradient locations P2, P1, and MP4.
During the stage 2 experiments, minor groundwatermixing within the flow-through box was probably stilloccurring, as nitrification was also observed 15 cm upgradientof the ODP during oxygen-only delivery (Figure 8A), and aceticacid was observed 15 cm upgradient of the EDP during oxygenand ethanol delivery (Figure 8C).
Also, ethanol and acetic acid concentrations were notuniform with depth at P3 (data not shown), suggestingsubstantial ethanol/acetic acid removal at depth, possiblydue to higher nitrate/sulfate concentrations at depth (seeFigure 4).
The greater than 90% reduction in total N between P2and P3, and presence of ethanol/acetic acid at P3, providesgood evidence to suggest in situ denitrification was occurringdowngradient of the EDP. This is consistent with the 58-91% groundwater nitrate removal observed by Robertson etal. (2) within four different field-scale waste cellulose solidtreatment walls over 6-7 yr (from influent nitrate concen-trations of between 4.8 and 57 mg L-1 N), and the over 95%groundwater nitrate removal observed by Schipper andVojvodic-Vukovic (3) over 5 yr within a field-scale sawdusttreatment wall (from influent concentrations between 5 and15 mg L-1 N). The substantially reduced conditions createdat P3 were also shown by the reduced sulfate concentrationsobserved, along with the presence of sulfide and nitrous oxide(N2O).
Estimation of Groundwater Velocity through the Flow-Through Box. The oxygen tracer tests were conducted onAug 8 and 25 and Sept 16, 2003, approximately 2 monthsafter oxygen and ethanol addition had ceased. The purposeof this delay was to allow time for any residual ethanol to beflushed out of the flow-through box and nitrifying bacterianumbers/activity to decrease, reducing the potential foroxygen consumption during the tracer tests. Also, oxygenwas used in preference to air, to increase the sensitivity ofthe method. For each of the tracer tests, changes in thegroundwater oxygen concentration at P2 (5 m below ground,and 0.15 m downgradient of the ODP) are shown in Figure9.
On the basis of the time between the commencement ofthe oxygen tracer test and the time of maximum oxygenconcentration, an average groundwater velocity of 74 ( 28m yr-1 was estimated. For the tracer tests, it was assumedthat substantial oxygen consumption in the groundwater
FIGURE 8. (A) Stage 2 average nutrient concentrations during theperiod of oxygen-only delivery (June 26, 2002-February 20, 2003,n ) 15). Locations shown are for upgradient (MP4) and within theflow-through box (P1, P2, P3) along the 5 m below ground plane.For clarity, only the positive error bars are shown. (B) Stage 2average nutrient and ethanol/acetic acid concentrations during theperiod of oxygen and ethanol delivery (March 6-May 1, 2003, n )5). (C) Stage 2 average ethanol/acetic acid concentrations duringthe period of oxygen and ethanol delivery (March 6-May 1, 2003,n ) 5). Locations shown are for upgradient (MP4) and within theflow-through box (P1, P2, P3) along the 5 m below ground plane.For clarity, only the positive error bars are shown. Note: the influentammonium concentration (at MP4) showed a high variability duringthe oxygen and ethanol delivery period of the stage 2 experiment,probably due to temporal plume variability along the 5 m flow line.
FIGURE 9. Changes in groundwater oxygen concentration at P2 (5m below ground, and 0.15 m downgradient of the ODP) for each ofthe tracer tests conducted.
6852 9 ENVIRONMENTAL SCIENCE & TECHNOLOGY / VOL. 38, NO. 24, 2004
from nitrification or carbon oxidation ([DOC] ) 7 mg L-1)did not occur in the groundwater between the time of oxygenaddition and detection by the oxygen probe. Oxygen massbalance data showed ∼40% of the potential mass of oxygendelivered during the 4 h oxygen tracer addition was detectedby the oxygen probe (as an integrated area). This oxygenmass does not take into account the potential mass-transferlimitations at the polymer wall/groundwater interface (re-ducing the mass of oxygen delivered to the groundwater overthe 4 h exposure time); thus, the ∼40% oxygen mass recoverywould be a minimum recovery. Therefore, the assumptionof no substantial oxygen consumption in groundwater overthis short period appears reasonable.
However, if substantial oxygen consumption had oc-curred, this would affect the magnitude and the timing ofthe oxygen peak. Oxygen consumption would be more likelyto occur in groundwater exposed to oxygen for the longestperiod, due to potential lag times in the development ofoxygen-consuming bacteria. This potentially would have theeffect of truncating the tail of the oxygen peak, and result inan overestimation of the groundwater velocity. Therefore,the estimated groundwater velocity would be a maximumvelocity.
As hydraulic gradients at the site would be affected byseasonal conditions, the estimated groundwater velocitywithin the flow-through box determined in August/Septem-ber may not be applicable to other times of the year.
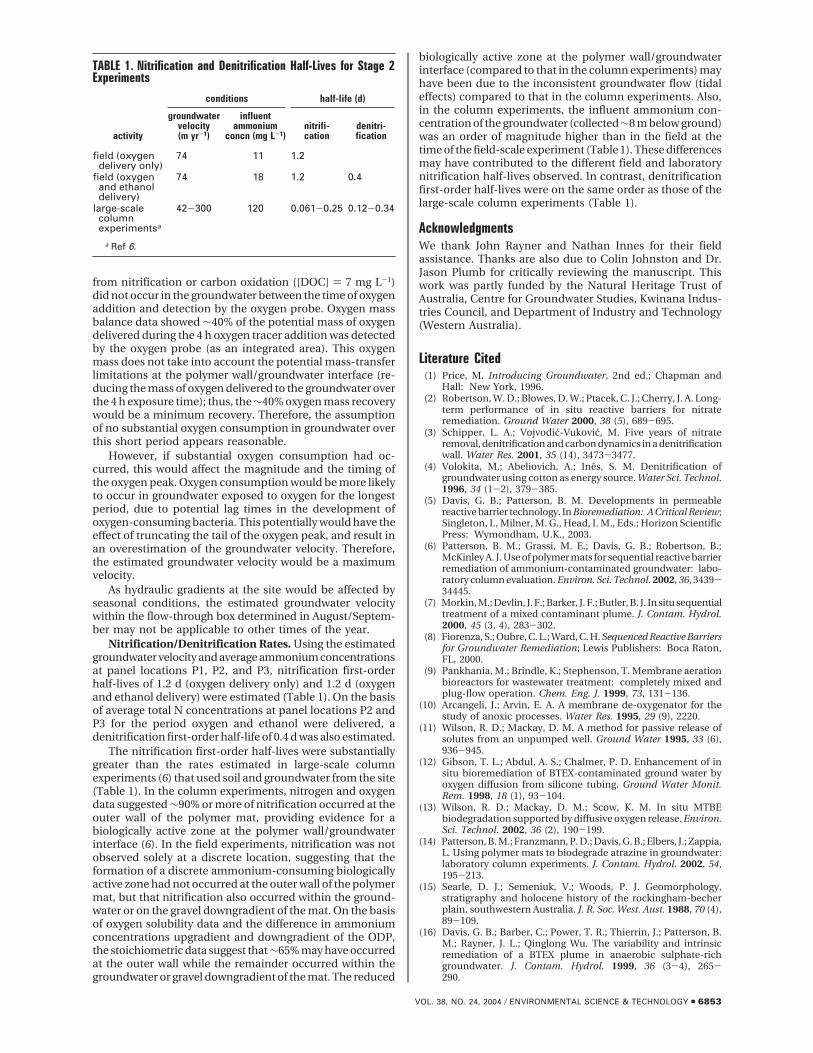
Nitrification/Denitrification Rates. Using the estimatedgroundwater velocity and average ammonium concentrationsat panel locations P1, P2, and P3, nitrification first-orderhalf-lives of 1.2 d (oxygen delivery only) and 1.2 d (oxygenand ethanol delivery) were estimated (Table 1). On the basisof average total N concentrations at panel locations P2 andP3 for the period oxygen and ethanol were delivered, adenitrification first-order half-life of 0.4 d was also estimated.
The nitrification first-order half-lives were substantiallygreater than the rates estimated in large-scale columnexperiments (6) that used soil and groundwater from the site(Table 1). In the column experiments, nitrogen and oxygendata suggested ∼90% or more of nitrification occurred at theouter wall of the polymer mat, providing evidence for abiologically active zone at the polymer wall/groundwaterinterface (6). In the field experiments, nitrification was notobserved solely at a discrete location, suggesting that theformation of a discrete ammonium-consuming biologicallyactive zone had not occurred at the outer wall of the polymermat, but that nitrification also occurred within the ground-water or on the gravel downgradient of the mat. On the basisof oxygen solubility data and the difference in ammoniumconcentrations upgradient and downgradient of the ODP,the stoichiometric data suggest that ∼65% may have occurredat the outer wall while the remainder occurred within thegroundwater or gravel downgradient of the mat. The reduced
biologically active zone at the polymer wall/groundwaterinterface (compared to that in the column experiments) mayhave been due to the inconsistent groundwater flow (tidaleffects) compared to that in the column experiments. Also,in the column experiments, the influent ammonium con-centration of the groundwater (collected∼8 m below ground)was an order of magnitude higher than in the field at thetime of the field-scale experiment (Table 1). These differencesmay have contributed to the different field and laboratorynitrification half-lives observed. In contrast, denitrificationfirst-order half-lives were on the same order as those of thelarge-scale column experiments (Table 1).
AcknowledgmentsWe thank John Rayner and Nathan Innes for their fieldassistance. Thanks are also due to Colin Johnston and Dr.Jason Plumb for critically reviewing the manuscript. Thiswork was partly funded by the Natural Heritage Trust ofAustralia, Centre for Groundwater Studies, Kwinana Indus-tries Council, and Department of Industry and Technology(Western Australia).
Literature Cited(1) Price, M. Introducing Groundwater, 2nd ed.; Chapman and
Hall: New York, 1996.(2) Robertson, W. D.; Blowes, D. W.; Ptacek, C. J.; Cherry, J. A. Long-
term performance of in situ reactive barriers for nitrateremediation. Ground Water 2000, 38 (5), 689-695.
(3) Schipper, L. A.; Vojvodic-Vukovic, M. Five years of nitrateremoval, denitrification and carbon dynamics in a denitrificationwall. Water Res. 2001, 35 (14), 3473-3477.
(4) Volokita, M.; Abeliovich, A.; Ines, S. M. Denitrification ofgroundwater using cotton as energy source. Water Sci. Technol.1996, 34 (1-2), 379-385.
(5) Davis, G. B.; Patterson, B. M. Developments in permeablereactive barrier technology. In Bioremediation: A Critical Review;Singleton, I., Milner, M. G., Head, I. M., Eds.; Horizon ScientificPress: Wymondham, U.K., 2003.
(6) Patterson, B. M.; Grassi, M. E.; Davis, G. B.; Robertson, B.;McKinley A. J. Use of polymer mats for sequential reactive barrierremediation of ammonium-contaminated groundwater: labo-ratory column evaluation. Environ. Sci. Technol. 2002, 36, 3439-34445.
(7) Morkin, M.; Devlin, J. F.; Barker, J. F.; Butler, B. J. In situ sequentialtreatment of a mixed contaminant plume. J. Contam. Hydrol.2000, 45 (3, 4), 283-302.
(8) Fiorenza, S.; Oubre, C. L.; Ward, C. H. Sequenced Reactive Barriersfor Groundwater Remediation; Lewis Publishers: Boca Raton,FL, 2000.
(9) Pankhania, M.; Brindle, K.; Stephenson, T. Membrane aerationbioreactors for wastewater treatment: completely mixed andplug-flow operation. Chem. Eng. J. 1999, 73, 131-136.
(10) Arcangeli, J.; Arvin, E. A. A membrane de-oxygenator for thestudy of anoxic processes. Water Res. 1995, 29 (9), 2220.
(11) Wilson, R. D.; Mackay, D. M. A method for passive release ofsolutes from an unpumped well. Ground Water 1995, 33 (6),936-945.
(12) Gibson, T. L.; Abdul, A. S.; Chalmer, P. D. Enhancement of insitu bioremediation of BTEX-contaminated ground water byoxygen diffusion from silicone tubing. Ground Water Monit.Rem. 1998, 18 (1), 93-104.
(13) Wilson, R. D.; Mackay, D. M.; Scow, K. M. In situ MTBEbiodegradation supported by diffusive oxygen release. Environ.Sci. Technol. 2002, 36 (2), 190-199.
(14) Patterson, B. M.; Franzmann, P. D.; Davis, G. B.; Elbers, J.; Zappia,L. Using polymer mats to biodegrade atrazine in groundwater:laboratory column experiments. J. Contam. Hydrol. 2002, 54,195-213.
(15) Searle, D. J.; Semeniuk, V.; Woods, P. J. Geomorphology,stratigraphy and holocene history of the rockingham-becherplain, southwestern Australia. J. R. Soc. West. Aust. 1988, 70 (4),89-109.
(16) Davis, G. B.; Barber, C.; Power, T. R.; Thierrin, J.; Patterson, B.M.; Rayner, J. L.; Qinglong Wu. The variability and intrinsicremediation of a BTEX plume in anaerobic sulphate-richgroundwater. J. Contam. Hydrol. 1999, 36 (3-4), 265-290.
TABLE 1. Nitrification and Denitrification Half-Lives for Stage 2Experiments
conditions half-life (d)
activity
groundwatervelocity(m yr-1)
influentammonium
concn (mg L-1)nitrifi-cation
denitri-fication
field (oxygendelivery only)
74 11 1.2
field (oxygenand ethanoldelivery)
74 18 1.2 0.4
large-scalecolumnexperimentsa
42-300 120 0.061-0.25 0.12-0.34
a Ref 6.
VOL. 38, NO. 24, 2004 / ENVIRONMENTAL SCIENCE & TECHNOLOGY 9 6853

(17) Starr, R. C.; Cherry, J. A.; Vales, E. S. A new type of steel sheetpiling with sealed joints for groundwater pollution control.Proceedings of the 45th Canadian Geochemical Conference,Toronto, Ontario, October 26-28, 1992; pp 75-1 to 75-9.
(18) Eaton, A. D.; Clesceri, L. S.; Greenberg, A. E.; Franson, M. H.Standard Methods for the Examination of Water and Wastwater;American Public Health Association: Washington, DC, 1995.
(19) Patterson, B. M.; Power, T. R.; Davis, G. B.; Barber, C. An in situdevice to measure oxygen in the vadose zone and in ground-water: laboratory testing and field evaluation to determine
oxygen usage rate coefficients; CSIRO Division of Water ResourcesDivisional Report 95/0; 1995 (confidential).
(20) Yekta, A.; Misoumi, Z.; Winnik, M. A. Luminescence measure-ments of oxygen permeation and oxygen diffusion in thinpolymer films. Can. J. Chem. 1995, 73, 2021-2029.
Received for review February 13, 2004. Revised manuscriptreceived September 10, 2004. Accepted September 13, 2004.
ES0497781
6854 9 ENVIRONMENTAL SCIENCE & TECHNOLOGY / VOL. 38, NO. 24, 2004