use of leaching tests and partition coefficients (kd … · use of leaching tests and partition...
TRANSCRIPT
USE OF LEACHING TESTS AND PARTITION COEFFICIENTS (Kd)
IN ASSESSING POTENTIAL FOR RELEASES AND TRANSPORT OF RADIONUCLIDES
AT THE SEAWAY SITE
— DISCUSSION PAPER —
Prepared for:
U.S. Army Corps of Engineers Buffalo District
Prepared by:
Science Applications International Corporation
June 8, 2001
r:\fusrap\seaway\kdtm\paper1.doc 6/8/01 i
USE OF LEACHING TESTS AND PARTICIENT COEFIICIENTS (Kd) IN ASSESSING POTENTIAL FOR
RELEASES AND TRANSPORT OF RADIONUCLIDES AT THE SEAWAY SITE
— DISCUSSION PAPER —
TABLE OF CONTENTS 1.0 INTRODUCTION AND PURPOSE........................................................................................1
1.1 Introduction..................................................................................................................1 1.2 Purpose of This Discussion Paper................................................................................1
2.0 BACKGROUND AND EXISTING CONDITIONS..................................................................3
2.1 Description of the Residues Disposed at Ashland 1 and Seaway................................3 2.2 Locations of the Residues Disposed at the Seaway Landfill .......................................4 2.3 Radiological Contaminants of Concern.......................................................................5 2.4 Landfill Conditions ......................................................................................................5
3.0 POTENTIAL CONTAMINANT RELEASE AND CONTAMINANT TRANSPORT
SCENARIOS AT THE SEAWAY LANDFILL........................................................................5 3.1 Potential Releases Scenarios From the Source Areas and Solubility of the COCs .....6
3.1.1 Source Area Releases.......................................................................................6 3.1.2 Solubility of COCs...........................................................................................7 3.1.3 Leaching Tests to Determine Solubility of COCs ...........................................8
3.2 Potential Contaminant Transport After Releases from the Source Area – Existing Conditions ....................................................................................................................9
3.3 Potential Contaminant Transport After Releases from the Source Area – Assuming Capping ........................................................................................................................9
3.4 Summary – Potential Releases and Contaminant Transport ......................................13 4.0 TRANSPORT OF RADIONUCLIDES IN THE SUBSURFACE, DISTRIBUTION
COEFFICIENTS AND RETARDATION FACTORS............................................................. 13 4.1 Transport of Radionuclides in the Subsurface ...........................................................13
4.1.1 Physical Characteristics of Subsurface Flow.................................................13 4.1.2 Chemical Transport in Subsurface Flow.......................................................16
4.2 Distribution Coefficients (Kd) and Retardation Factors (Rf) .....................................16 4.2.1 Definition of Kd..............................................................................................16 4.2.2 Retardation Factors and Their Relationship to Kd Values .............................16
4.3 Minimum and Maximum Rf and Kd...........................................................................17 4.4 Measurement of Kd Values ........................................................................................17
4.4.1 Laboratory Batch Method ..............................................................................18 4.4.2 Laboratory Flow-Through Method ................................................................18 4.4.3 Other Methods for Measurement of Kd .........................................................18 4.4.4 ASTM Test Method .......................................................................................19 4.4.5 Back Calculation for Kd from Results of Leaching Tests ..............................20
4.5 Kd Values for Seaway COCs .....................................................................................20 4.5.1 Uranium .........................................................................................................20
r:\fusrap\seaway\kdtm\paper1.doc 6/8/01 ii
4.5.2 Thorium..........................................................................................................21 4.5.3 Radium...........................................................................................................22
4.6 Use of RESRAD ........................................................................................................22 4.7 Summary – Kd Values................................................................................................22
5.0 SUMMARY, CONCLUSIONS AND RECOMMENDATIONS.............................................. 23
5.1 MED Contamination and Current Conditions in the Seaway Landfill ......................23 5.2 MED Contamination and Future Conditions with Capping ......................................23 5.3 Potential Releases from the Source Areas .................................................................23 5.4 Kd and Rf Values........................................................................................................24 5.5 Measurement of Kd Values ........................................................................................24 5.6 Feasibility of Establishing Kd Values for the COCs at the Seaway Landfill .............24 5.7 Recommendations ......................................................................................................24
6.0 REFERENCES..................................................................................................................... 25 LIST OF FIGURES Figure 1 Location Details – Seaway Site Figure 2 Potential Water Migration Pathways from MED Area – Current Conditions Figure 3 Potential Water Migration Pathways from MED Area – Leachate Collection System
Disabled - Current Conditions Figure 4 Potential Water Migration Pathways from MED Area – Future Conditions with Capping Figure 5 Potential Water Migration Pathways from MED Area – Leachate Collection System
Disabled – Future Conditions with Capping
r:\fusrap\seaway\kdtm\paper1.doc 6/8/01 iii
ACRONYM LIST
Ac actinium ASTM American Society for Testing and Materials BFI Browning-Ferris Industries BNI Bechtel National, Inc CFR Code of Federal Regulations Ci curies COCs Contaminants of Concern cy cubic yard(s) DOE United States Department of Energy EP Extraction Procedure ft feet FUSRAP Formerly Utilized Sites Remedial Action Program Kd Partition Coefficient lb pound m meter mg/L milligrams per liter MED Manhattan Engineer District NYSDEC New York State Department of Environmental Conservation ORNL Oak Ridge National Laboratory PCi/g picocuries per gram Ra Radium RBCA Risk Based Corrective Action RCRA Resource Conservation and Recovery Act Rf Retardation Factor TC Toxicity Characteristic TCLP Toxicity Characteristic Leaching Procedure Th thorium U uranium UCL95 upper 95 percent confidence level USACE United States Army Corps of Engineers USEPA United States Environmental Protection Agency y year
r:\fusrap\seaway\kdtm\paper1.doc 6/8/01 1
USE OF LEACHING TESTS AND PARTICIENT COEFIICIENTS (Kd) IN ASSESSING POTENTIAL FOR
RELEASES AND TRANSPORT OF RADIONUCLIDES AT THE SEAWAY SITE
— DISCUSSION PAPER — 1.0 INTRODUCTION AND PURPOSE
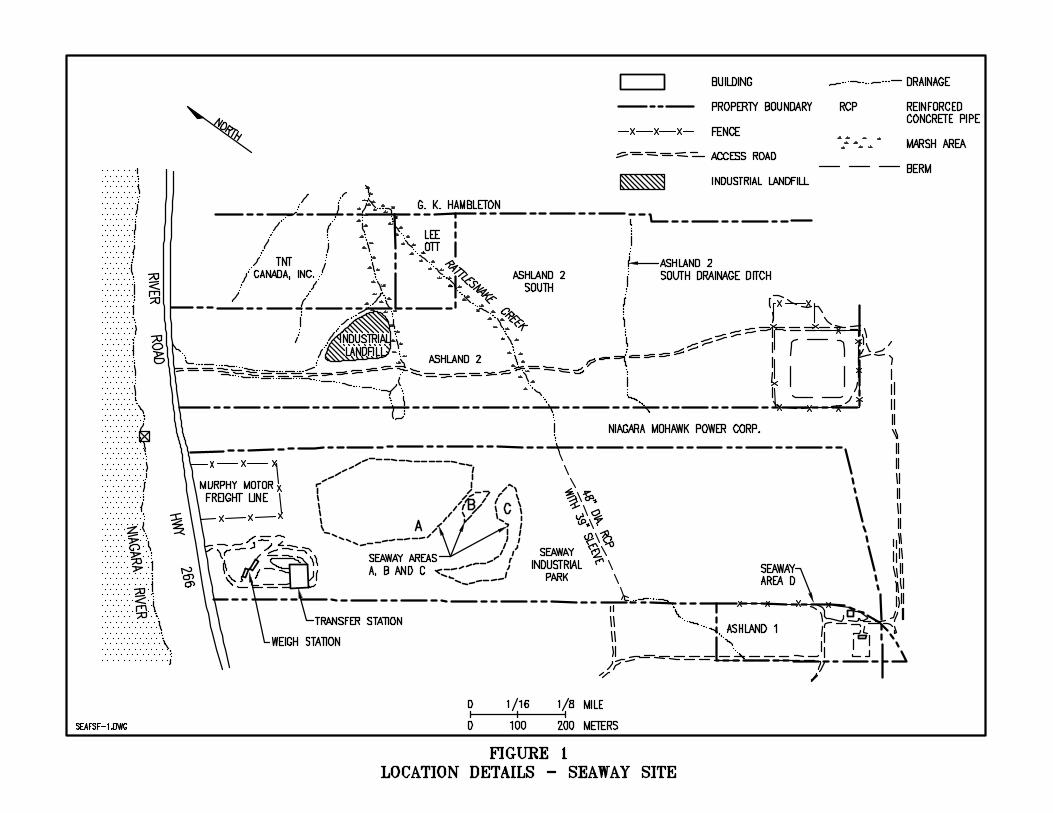
1.1 Introduction The U.S. Army Corps of Engineers (USACE), Buffalo District is assessing remediation alternatives for Manhattan Engineer District (MED) radioactively contaminated residues that were placed in the Seaway landfill (also known as the Niagara landfill or the Seaway Site), which is located in Tonawanda, New York. The USACE work at the Seaway Site is being conducted under the Formerly Utilized Sites Remedial Action Program (FUSRAP). The radioactively contaminated residues in the Seaway Landfill originated at the Linde Site and were initially disposed on the Ashland 1 property (formerly known as the Haist property). These residues contained approximately 0.54 percent uranium oxide [86,100 pounds (lbs) of natural uranium], which corresponds to 26.5 curies (Ci) of natural uranium. In 1974, approximately 6,000 cubic yards (cy) of these residues were transferred from the Ashland 1 property and were placed in the Seaway Landfill in areas referred to as Areas A, B and C (BNI 1993). In 1976, the Oak Ridge National Laboratory (ORNL) conducted a radiological survey of the Seaway Landfill and delineated the areas referred to as Areas A, B and C (ORNL 1978). These areas are shown in Figure 1. ORNL reports that, at the time of the 1976 survey “…Area A covers approximately 10 acres, and Areas B and C together cover approximately two acres. The residue was left in small, isolated mounds in areas B and C, but was spread to a depth of 2 [feet] ft in most places in Area A. Although much of the residue is not covered, it has become mixed somewhat with clean soil because of the moving and spreading it has undergone in recent years” (ORNL 1978). Since 1974, portions of the residues (in Areas B and C and part of Area A) have been buried under refuse and fill material. The New York State Department of Environmental Conservation (NYSDEC) requested that Browning-Ferris Industries (BFI) refrain from depositing any additional refuse in Area A. Area D contamination was reported to result from inadvertent spreading of contamination from soil-moving operations at Ashland 1, construction of a bentonite wall around Seaway, and shaping of a drainage ditch in the area (BNI 1993). Area D has been remediated as part of the cleanup of Ashland 1.
1.2 Purpose of This Discussion Paper One of the remediation alternatives being considered for Seaway Areas A, B and C would involve leaving the MED-contaminated residue in place, capping these areas in accordance with current NYSDEC standards for landfill closure and ensuring that institutional controls are in place to protect the integrity of the landfill cap. USACE is planning to conduct further characterization/investigation efforts in Areas A, B and C in support of the evaluation of remediation alternatives and in response to issues raised by NYSDEC and U.S. Environmental Protection Agency (USEPA) representatives in project planning meetings.
r:\fusrap\seaway\kdtm\paper1.doc 6/8/01 3
A principal concern is the potential for MED-related groundwater contamination arising from the presence of MED residues in the landfill. Leaching tests have been proposed as part of the field investigation in Areas A, B and C. It has been suggested that a site-specific value for the partition coefficient (Kd) for uranium and other radioactive contaminants be established as part of the efforts to be undertaken in Areas A, B and C. This discussion paper describes how leaching tests would be used and assesses the need for and feasibility of establishing a site-specific Kd value for uranium, thorium and radium at the Seaway Site. Kd is defined and the uses of Kd values are addressed, in general. How Kd values are determined is also addressed. Following this introduction, this discussion paper includes the following sections. Section 2 describes existing conditions and summarizes information available concerning MED contamination in the Seaway Landfill. Section 3 discusses potential contaminant release and transport scenarios at the landfill to provide a conceptual model of the Site. The role of contaminant solubility and leachability is described. Section 4 summarizes technical details concerning development and use of Kd values. The USEPA, with U.S. Department of Energy (DOE), has developed a comprehensive two-volume document entitled Understanding Variation in Partition Coefficient (Kd) Values (USEPA 1999). Information on Kd values may be found in greater detail in those USEPA guidance volumes. The USEPA has also recently released two guidance documents addressing radionuclides in soils and screening methodology to determine needs for further investigations at sites with radioactive contamination in soils. These documents are: Soil Screening Guidance for Radionuclides: User’s Guide (USEPA 2000a) and Soil Screening Guidance for Radionuclides: Technical Background Document (USEPA 2000b). These documents include information on simplifying assumptions that are helpful in assessing the potential for leaching of contaminants to groundwater and subsequent transport. These documents are used as appropriate as references in this discussion paper. Section 5 provides a brief summary, conclusions and recommendations concerning proposed leaching tests and development of site-specific Kd values at Seaway. 2.0 BACKGROUND AND EXISTING CONDITIONS
2.1 Description of the Residues Disposed at Ashland 1 and Seaway Under a MED contract, uranium ores from seven different sources were processed at Linde: four African ores (three low-grade pitchblendes and torbernite) and three domestic ores (carnotite from Colorado). The domestic ore tailings sent to Linde resulted from commercial processing, conducted primarily in the Western United States, to remove vanadium. The vanadium removal process also removed radium (Ra), resulting in disruption of the uranium decay chain. For this reason, this Western United States uranium ore supplied to Linde had low concentrations of Ra compared with the natural uranium (U) and Thorium-230 (Th-230) concentrations. The African ores shipped to Linde as unprocessed mining ores contained uranium in equilibrium with all of the daughter products in its decay chain (e.g., Th-230 and radium-226 [Ra-226]). The other constituents of the ores were similar to those of the unprocessed domestic ores.
r:\fusrap\seaway\kdtm\paper1.doc 6/8/01 4
A three-phase process was used to separate uranium from the uranium ores and tailings. The Phase 1 process included acid digestion, precipitation, and filtration to produce uranium oxide (U3O8). The Phase II and Phase III process residues were not transported to Ashland 1 and Seaway. In the Phase I, domestic ore processing, sulfuric acid was added to the ore slurry until a pH of 0.7 to 0.8 was reached. Pyrolusite or magnasite (MnO2) was added to oxidize any reduced uranium. The mixture was digested at 90°C for 3 hours and then cooled with weak wash solution at 60°C. The uranium was in solution as uranyl sulfate, and many of the impurities (iron, silica, phosphorus, vanadium, alumina) were also partially in solution. Soda ash was added until the pH reached about 9.2. Some sodium bicarbonate was also added, which precipitated most of the impurities and left the uranium in solution as sodium uranyl tricarbonate. The slurry was filtered in Moore filters, and the cake hauled to a tailings pile. The liquors contained vanadium and phosphorus as objectionable impurities. These were removed by the addition of ferrous and ferric sulfates, respectively. The resultant iron cake was filtered off in plate and frame presses and hauled to the tailings pile. The liquors were treated with caustic soda and precipitated the uranium as sodium diuranate. The filtrate from this step was discharged as waste effluent. The sodium diuranate cake was treated with sulfuric acid and ammonium sulfate and was converted to an ammonium uranyl sulfate complex. This was removed in a filter press. The cake (acid leach cake) was fed to a calciner to drive off the ammonia, sulfur dioxide and trioxide, and water, leaving the black oxide of uranium (Aerospace 1981). The filtrate (liquid remaining from the processing operations) from this step was discarded as liquid waste at Linde and the filter cake was discarded as solid waste and was ultimately taken to Ashland 1 and then, in part, to Seaway. The principal solid waste resulting from Phase 1 was a solid, gelatinous filter cake consisting of impurities remaining after filtration of the uranium carbonate solutions. Phase1 also produced insoluble precipitates of the dissolved constituents, which were combined with the tailings. The precipitated species included large quantities of silicon dioxide, iron hydroxide, calcium hydroxide, calcium carbonate, aluminum hydroxide, lead sulfate, lead vanadate, barium sulfate, barium carbonate, magnesium hydroxide, magnesium carbonate, and iron complexes of vanadium and phosphorus. Between 1943 and 1946, approximately 8,000 tons of filter cake from the Phase 1 processing of domestic ores were taken from the temporary tailings pile at Linde and transported to the former Haist property, now know as Ashland 1. The residues from the African ore were relatively high in radium content compared with processed domestic ore residues and these African ore residues were not disposed on the Ashland 1 property (USACE 2000a). As described above, approximately 6,000 cy of the Linde residues transported to Ashland 1 were subsequently transported to Seaway.
2.2 Locations of the Residues Disposed at the Seaway Landfill Seaway was characterized for the presence of radioactive contamination several times prior to the remedial investigations conducted at the Site in 1988-1991. From these initial surveys in 1976, 1981, and 1986, it was reported that active operation of the landfill altered the physical conditions of the property and that the locations of radioactive contamination varied from time to time (BNI 1993). Based on comparisons of topographic maps of the landfill in 1976 and 1986, it was estimated that Areas B and C
r:\fusrap\seaway\kdtm\paper1.doc 6/8/01 5
had been covered with up to 40 feet (ft) of fill material and refuse and that approximately 40 percent of Area A had been covered with a similar, but thinner layer of material (0 to 10 feet thick) (BNI 1993).
2.3 Radiological Contaminants of Concern The principal radiological contaminants of concern (COCs) at Seaway are uranium (U), thorium (Th), and radium (Ra). As detailed in the radiological risk discussion paper (USACE 2000b), the mean concentrations for the principal radiological COCs in Area A are: Uranium-238 (U-238), 11 picocuries per gram (pCi/g); Thorium-230 (Th-230), 130 pCi/g; and Radium-226 (Ra-226), 7.3 pCi/g. In Areas B and C, combined, mean concentrations are: U-238, 15 pCi/g and Ra-226, 15 pCi/g. Because the Seaway Landfill has been used for waste disposal for many years, a wide range of chemical contaminants is expected to exist in the filled areas. No chemical characterization of the solid waste landfill area was performed for non-radiological contaminants in the landfill area since they are assumed to be present. Waste reported to have been disposed at the landfill ranges from garbage to fly ash to industrial sludges, solvents, and other wastes. Chemical characterization of samples from Areas A, B and C are being proposed as part of the further investigation efforts.
2.4 Landfill Conditions The Seaway Landfill has been used for landfilling for more than 60 years. The subsurface has been characterized as including two confining strata with a combined thickness of 45 to 75 ft (averaging 60 ft) with a permeability of 1.6 x 10⁻⁸ centimeters per second (cm/s) (Wehran 1979). It has been estimated that the seepage velocity through this formation is 0.04 feet per year (ft/y) and that it would take approximately 1,500 years for groundwater to pass through these strata (Wehran 1979). In 1983, a clay cutoff wall was constructed around the landfill perimeter and was keyed into the underlying clay. A leachate collection system has also been constructed inside the clay cutoff wall. Lateral leachate collectors were also installed to provide a pathway to reach the leachate collection pipe. These laterals were installed where leachate seeps were noted during construction, and where the collection pipe was not in direct contact with the landfilled waste, at 200-foot intervals. The leachate is pumped from low spots in the collection system, with the leachate ultimately flowing north by gravity to a metering manhole and then to the Town of Tonawanda municipal wastewater collection system. Berms, 10 feet above the ground surface, have been constructed around most of the landfill perimeter. The interior slopes of the berms (the landfill side) are designed with a 2 ft thick clay liner connected to the clay cutoff wall. The southern portion of the landfill (about 60 acres) is capped with 24 inches of low-permeability clay, covered by 6 inches of seeded topsoil. The northern portion of the landfill is capped in two areas, the areas where the MED-related contamination has been identified is uncapped. Until the summer of 2000, an active landfill gas collection system was in operation in the southern portion of the landfill. The landfill gas in this southern portion of the southern landfill is now passively vented. 3.0 POTENTIAL CONTAMINANT RELEASE AND CONTAMINANT TRANSPORT
SCENARIOS AT THE SEAWAY LANDFILL To assess needs for additional information, such as leaching tests and Kd values for the Seaway radiological COCs, a conceptual understanding of water flow through the landfill and water flow through
r:\fusrap\seaway\kdtm\paper1.doc 6/8/01 6
the landfill and potential contaminant releases and contaminant transport at the Seaway Landfill is required. The following summarizes potential water flow and contaminant releases and transport scenarios.
3.1 Potential Releases Scenarios From the Source Areas and Solubility of the COCs The potential source areas for release of radionuclides at the Seaway Landfill are Areas A, B and C. The principal radiological COCs in these areas are U-238, Th-230 and Ra-226. The residues containing these COCs were placed at various elevations within the landfill and, currently, some of the residues are still present at or near the existing surface and some are buried under many feet of fill, refuse, and other wastes.
3.1.1 Source Area Releases In the technical background document on soil screening for radionuclides (USEPA 2000b), USEPA envisions the migration of radionuclides from soil to groundwater as a two-stage process: (1) a release of a contaminant in soil leachate; and (2) transport of the contaminant through the underlying soil to groundwater. The principal means for facilitating any releases from the Seaway source areas is via dissolving the contaminants in the source area, with subsequent potential for transport of the contaminants in the liquid phase. Another release mechanism described in the literature (USEPA 1994) (USEPA 1999) envisions the potential for releases of radionuclides with colloids in suspensions. A colloid is a fine-grained material, smaller than clay size, that can be easily suspended. USEPA reports (USEPA 1999) that an increasing body of evidence indicates that under some subsurface conditions, components of the solid phase may exist as colloids that may be transported with flowing water. USEPA (USEPA 1999) cites studies showing that increases in solution pH induce the formation of plutonium-, uranium-, and americium-oxide colloids in carbonate. At the Savannah River Site, laboratory measurements using site-specific soils and a 2-phase solute transport model code, predicted americium, curium, plutonium, and uranium travel to be less than 10 meters (m). The contaminants were found associated with groundwater colloids 1,200 m from the source. The USEPA (USEPA 1999) cautions, however, that because most contaminant transport predictions do not account for preferred flow paths, the interpretation that colloid facilitated migration is the best explanation for such enhanced migration is still being debated. Another potential release scenario at the landfill would involve the physical displacement of the source area due to failure of landfill structure through erosion or other physical means. The potential for colloidal releases from the source areas or by physical displacement is beyond the scope of this memorandum. To estimate the potential for mobilizing the contaminants in the source areas and the potential for liquid phase releases, information on the solubility of the COCs in water or other liquids that may be present in the landfill would be required. In one release scenario, water from precipitation or landfill leachate generated above the source area would move downward by gravity through the source material. As this liquid moves through the material, the U-238, Ra-226 or Th-230 would be transported in a dissolved phase, if these contaminants are soluble in the water or the leachate occurring above the source material. In another potential release scenario, water could build up in the landfill and saturate the source material and dissolve the radionuclides of concern, if they are soluble.
r:\fusrap\seaway\kdtm\paper1.doc 6/8/01 7
3.1.2 Solubility of COCs The solubility of uranium compounds has been reported within a wide range. The residues transported to Seaway resulted from a multi-stage process that utilized strong acid solutions (to a pH of 0.7 to 0.8). In assessing the potential for releases of radioactive contamination from the residues from Linde that were disposed at the Ashland properties, Bechtel National, Inc. (BNI) noted that the residues disposed at the Ashland properties contain the insoluble residues from ore processing. BNI further notes that the residues were insoluble in the aggressive ore digestion process and reported that the most probable form of uranium present in the residues would be uranyl hydroxide which has a solubility in the range of about only 1 x 10-17 milligrams per liter (mg/L) (BNI 1998). In the BNI estimates, a conservative value of the solubility of uranyl peroxide, 6 mg/L, was used (BNI 1998). In its technical support document on standards for radionuclides in drinking water (USEPA 2000c), the USEPA notes that uranium must be oxidized before it can be transported into groundwater, but once in solution, it can travel great distances. USEPA further notes results of a USEPA study, reported in 1981, which shows uranium detected in a range of 0.01-582 picocuries per liter (pCi/L) in surface waters, with an average of 1 pCi/L and uranium in groundwater sources in the range of 0.07 to 653 pCi/L (USEPA 2000c).1 At the Parks Shallow Land Disposal Area in Parks Township, Pennsylvania, geophysical investigations were conducted to assess the potential for migration of constituents of interest, including uranium from waste disposal trenches. Trench leachate samples showed uranium concentrations below 0.05 milligrams per liter (mg/L) in all samples except three, which showed concentrations of 0.08 mg/L, 0.4 mg/L and 0.7 mg/L. The causes of the higher concentration (0.08 mg/L) in one of the samples was attributed, in part, to elevated pH. The cause of elevated concentrations (0.4 mg/L and 0.7 mg/L) in the other two samples was under investigation at the time of the report (ARCO 1995). USEPA (USEPA 1999) reports that the maximum concentration of dissolved thorium that may occur in a low temperature aqueous system can be predicted with solubility of hydrous thorium oxide. In 0.1 molar NaC104 solution, the measured solubility of hydrous thorium oxide ranges from about 0.0007 mg/L to less than 0.0002 mg/L in the pH range from 5 to 10. The concentrations of dissolved thorium increases to approximately 600 mg/L as pH decreases from 5.0 to 3.2. (USEPA 1999). BNI (BNI 1998) reported that the solubility of thorium, as thorium oxalate, is 17 mg/L, but also noted that the remedial investigation report (BNI 1993) indicates that, as a result of ore processing, the thorium in the residues is primarily present as a hydroxide which is much less soluble (by many orders of magnitude) than thorium oxalate. Limited data on the solubility of radium were found. BNI used the solubility of radium sulfate of 0.02 mg/L in evaluating potential leaching from the residues transported to the Ashland properties from Linde (BNI 1998).
1 The relationship between activity concentration and mass concentration of a radionuclide is determined as follows: Mass Conc. (mg/L) = (2.8E-15)(A)(T1/2)[Activity Conc. (pCi/L)] Where: A= Atomic Weight T1/2 = Half life (years) For example, given an activity concentration of 20 pCi/L of U-238 (atomic weight, 238; half life, 4.5 x 10⁹ years), the mass concentration would be 0.06 mg/L.
r:\fusrap\seaway\kdtm\paper1.doc 6/8/01 8
Thus, prediction of single values for the solubility of the radionuclides at Seaway would be difficult. Testing of actual samples from the site is recommended as described below.
3.1.3 Leaching Tests to Determine Solubility of COCs Under the Resource Conservation and Recovery Act (RCRA) Congress charged the USEPA with the responsibility for defining which specific solid wastes would be considered hazardous waste by identifying the characteristics of hazardous waste or listing particular hazardous wastes. The characteristics of hazardous wastes, identified by the USEPA are codified in 40 CFR Part 261 and include toxicity, corrosivity, reactivity and ignitability. The details of testing procedures are provided in Test Methods for Evaluating Solid Wastes, SW-846 (USEPA 1986). The toxicity characteristic is determined using leaching procedures described in SW-846. The extraction procedure (EP) leaching test was the original test developed by the USEPA for determining whether a waste was hazardous due to its toxicity. The USEPA developed a set of assumptions describing ways in which a waste could be improperly disposed to simulate a plausible worst case of mismanagement. Under this worst case scenario, the USEPA assumed that a potentially hazardous waste would be co-disposed with municipal solid waste in a landfill with actively decomposing material overlying an aquifer (USEPA 1995). In 1986, Congress directed the USEPA to expand the toxicity characteristic (TC) and reevaluate its use of the EP, due to concern, in part, that the leaching medium used in the EP was not sufficiently aggressive to adequately identify hazardous wastes. In response, the USEPA developed the Toxicity Characteristic Leaching Procedure (TCLP) (USEPA 1995). The TCLP begins with the same mismanagement assumptions that formed the basis for the development of the EP test (i.e., that wastes would be co-disposed with actively decomposing MSW in a landfill). Thus, the test is designed to determine the mobility of toxic constituent wastes when exposed to organic acids. After particle size reduction, a liquid extract is obtained from the solid waste to a leaching medium, also referred to as an extraction fluid. The extraction fluid used is determined based on the alkalinity of the waste (USEPA 1995).2 The TCLP test is, therefore, considered to be appropriate in addressing the potential for leaching of a waste for residue in a landfill environment such as exists in Seaway Areas A, B and C. The TCLP was not specifically developed for radionuclide leaching. Recent USEPA guidance (USEPA 2000a), however, specifically notes the applicability of TCLP testing to radionuclides. In this guidance, screening procedures for developing acceptable levels of radionuclides in soils to protect groundwater quality are described, including the use of leaching tests as a means to establish initial concentrations of radiological contaminants moving to groundwater from soils (USEPA 2000a). Specifically, USEPA notes, in Section 2.5.2, that “many leach tests are available for application at hazardous waste sites, some of which may be appropriate in specific situations (e.g., the Toxicity Characteristic Leaching Procedure (TCLP) models leaching in a municipal landfill environment)” (USEPA 2000a). Thus, as part of the supplemental investigations proposed at Seaway, samples from the source material would be subjected to leaching tests to determine the potential leachability of uranium and the other COCs from the source material. 2 Two extraction fluids may be used. One has a pH of 4.93 ±.05. It is used on samples showing a pH of less than 5.0 when mixed with reagent water. The other has a pH of 2.88 ±.05. It is used if a sample shows a pH greater than 5.0 when mixed with the reagent.
r:\fusrap\seaway\kdtm\paper1.doc 6/8/01 9
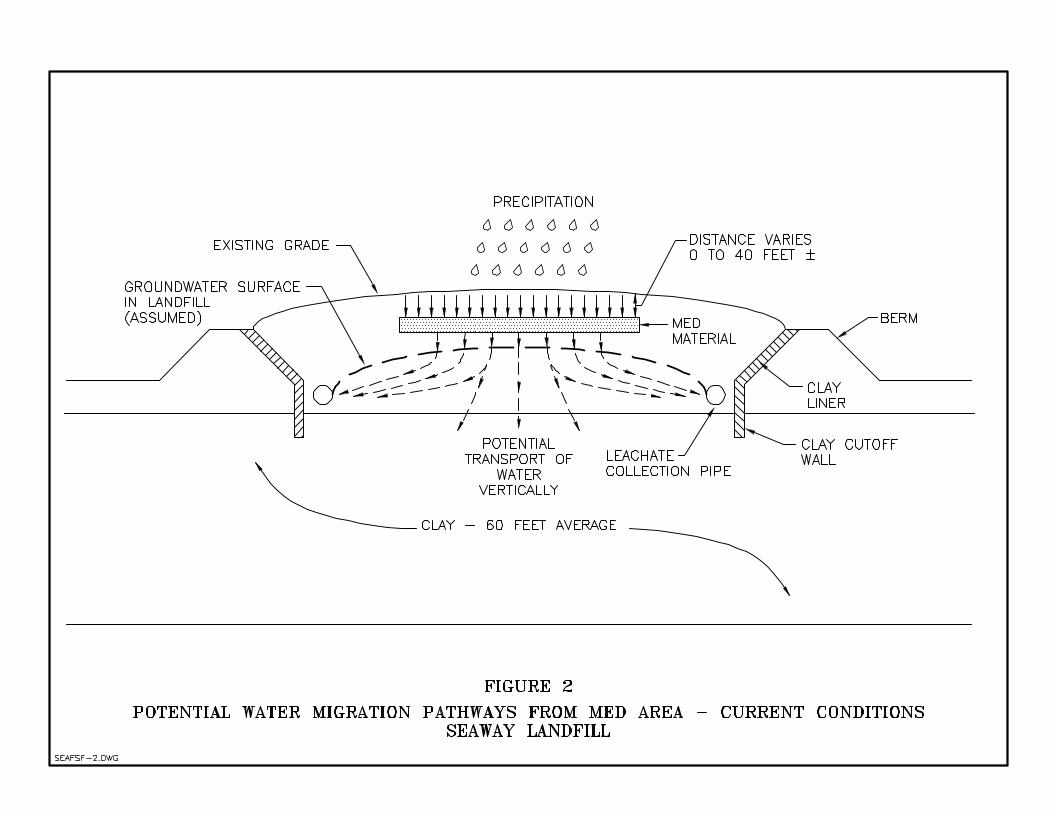
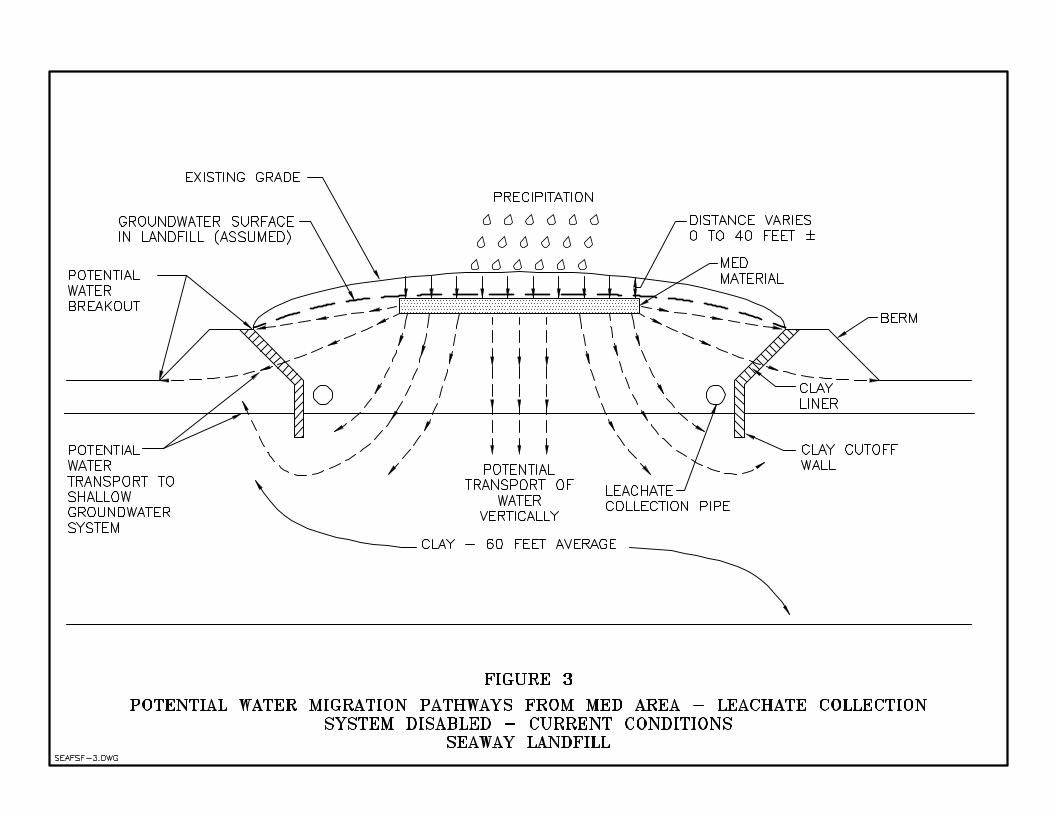
3.2 Potential Contaminant Transport After Releases from the Source Area – Existing Conditions In the Seaway Landfill, any liquid phase contaminants (i.e., contaminated leachate) released from the source areas could travel downward and laterally to the leachate collection system located on the inside of the perimeter cutoff wall. Under current conditions, this leachate is collected by gravity then pumped to the Town wastewater system. Because the northern portion of the landfill is uncapped, precipitation falling on the landfill and reaching the leachate collection system generates an average of about 24,000 gallons of leachate per day. Figure 2 is a conceptual picture of water migration pathways in the landfill from the potential source areas under current conditions. As shown in Figure 2, if contaminants are dissolved as precipitation percolates through the MED material, those contaminants may migrate with the flow to the leachate collection pipe. Since it is expected that there is some water table mounding in the landfill, there is potential for build-up of hydraulic head on the clay layer that underlies the Site. If contaminants are present in the water at the interface of the landfill and the clay layer, there is potential for transport of these contaminants vertically drawn down into the clay. The hydraulic head on the clay layer is limited, however, as long as the leachate collection system remains in operation. Figure 3 illustrates potential conditions in the landfill if the leachate collection system was disabled. As shown in Figure 3, if there is no means to collect leachate, the water level in the landfill would be expected to rise. A rise in the water level would increase the hydraulic head on the clay layer that underlies the landfill, on the clay cutoff wall and on the clay liner of the berms. If the leachate collection system remains disabled, the water mound in the landfill could also eventually cause breakout from the landfill above the berms. As indicated in Figure 3, any contaminants present in the water at the locations showing increased hydraulic heads due to buildup of water levels in the landfill could be transported vertically downward into the clay layer; around or through the clay cutoff wall; and in leachate breakout above the berms.
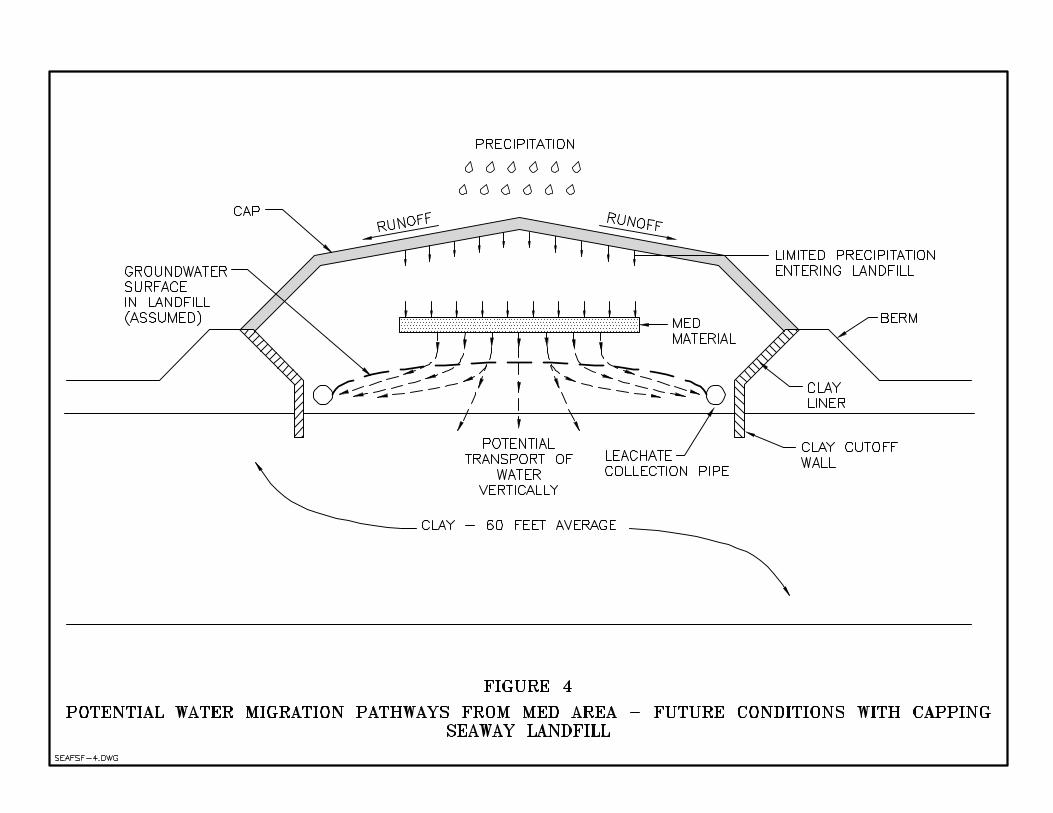
3.3 Potential Contaminant Transport After Releases from the Source Area – Assuming Capping One of the remedial alternatives for Areas A, B and C would involve capping the currently uncapped areas of the northern portion of the landfill, including Areas A, B and C. As envisioned, the cap would be constructed in accordance with NYSDEC requirements and would include a clay layer, a soil layer and a seeded top soil layer. The cap would be configured to facilitate precipitation runoff, while limiting the potential for erosion and the grassed vegetative cover established on the cap would facilitate evapotranspiration. All of these design features would be aimed at reducing the potential for infiltration of precipitation into the landfill. Figure 4 illustrates potential conditions in the landfill after capping. As shown in Figure 4, with a well engineered, constructed and maintained cap, precipitation entering the landfill is limited. A model, such as the USEPA HELP model can be used to predict the quantity of precipitation that will likely percolate through the cap. While no modeling has yet been conducted for the northern portion of the landfill, it is likely that only a small fraction of the current leachate flow would be present after capping. If it is assumed that the leachate collection system will still be operating in the future after capping, the potential for transport of MED contaminants out of the landfill is conceptually the same as current conditions, except that is likely that any rise in the water level in the landfill will be lower because precipitation infiltration into the landfill is greatly reduced due to the cap.
r:\fusrap\seaway\kdtm\paper1.doc 6/8/01 13
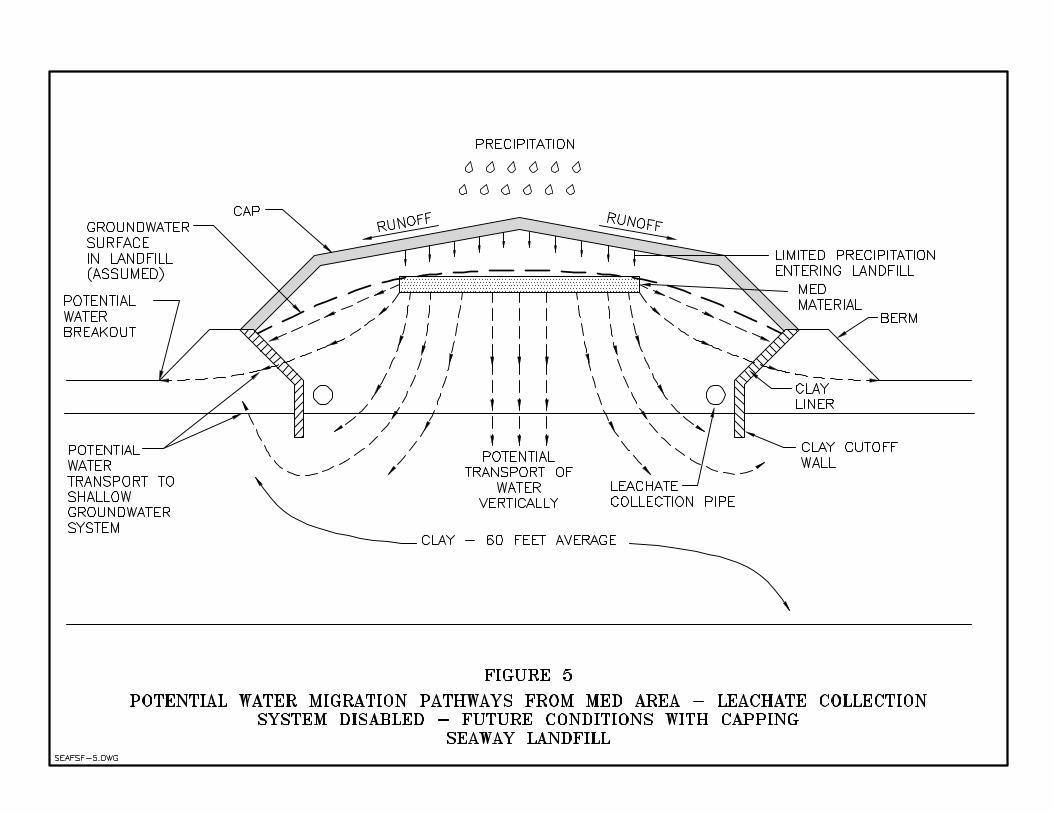
If the leachate collection system is disabled after capping, there is a possibility that the water entering the landfill through the cap may eventually cause the landfill to fill up. This is referred to as the “bathtub” effect and, simply stated, means that if the bottom of the landfill is less permeable than the cap, eventually the landfill will fill up with water. Figure 5 illustrates a condition in the landfill where the leachate collection system is disabled after capping. The potential avenues for transporting contaminants from the source are similar to those shown in Figure 3. The potential for a leachate breakout at the top of the berm is decreased, because the cap would be present at that location. If filling was continuous, eventually a leachate breakout could occur at this location despite capping. Breaches in the cap at any time would increase the rate at which the landfill would fill with water and potentials for transport of contaminants out of the landfill at all locations would increase.
3.4 Summary – Potential Releases and Contaminant Transport The potential for releases of radiological COCs from the MED areas at Seaway will depend on the solubility of the COCs in water and other liquid (leachate) that may be present in the landfill. Leaching tests are planned to determine whether the COCs are soluble. If contaminants are mobilized, they may be transported with water seepage in the landfill mass. Currently, the water seeping through the MED areas and the landfill mass is collected in the leachate collection system. As long as the leachate collection system is operational, the potential for leachate and COC transport out of the landfill area is limited. If the northern end of the landfill is capped, the quantity of water entering the landfill is reduced and the potential for leachate and the potential for leachate and COC transport out of the landfill is reduced. If the leachate collection system is disabled after capping, the potential exists for a buildup of water in the landfill, with resulting potential for transport of contaminants out of the landfill. Any contaminants potentially moving with the water through the landfill mass and surrounding areas may be attenuated. The technical aspects of this potential attenuation are described in Section 4, below. 4.0 TRANSPORT OF RADIONUCLIDES IN THE SUBSURFACE, DISTRIBUTION
COEFFICIENTS AND RETARDATION FACTORS
4.1 Transport of Radionuclides in the Subsurface
4.1.1 Physical Characteristics of Subsurface Flow Transport of radionuclides and other contaminants through subsurface porous material is influenced by the physical and chemical nature of the transporting media (usually water) and the medium through which the flow occurs (soil, rock, landfilled material, etc.). Subsurface porous flow is controlled by two master variables, hydraulic conductivity (also referred to as permeability) and the driving force (also referred to as hydraulic head). The hydraulic conductivity of porous or fractured subsurface material is determined
r:\fusrap\seaway\kdtm\paper1.doc 6/8/01 15
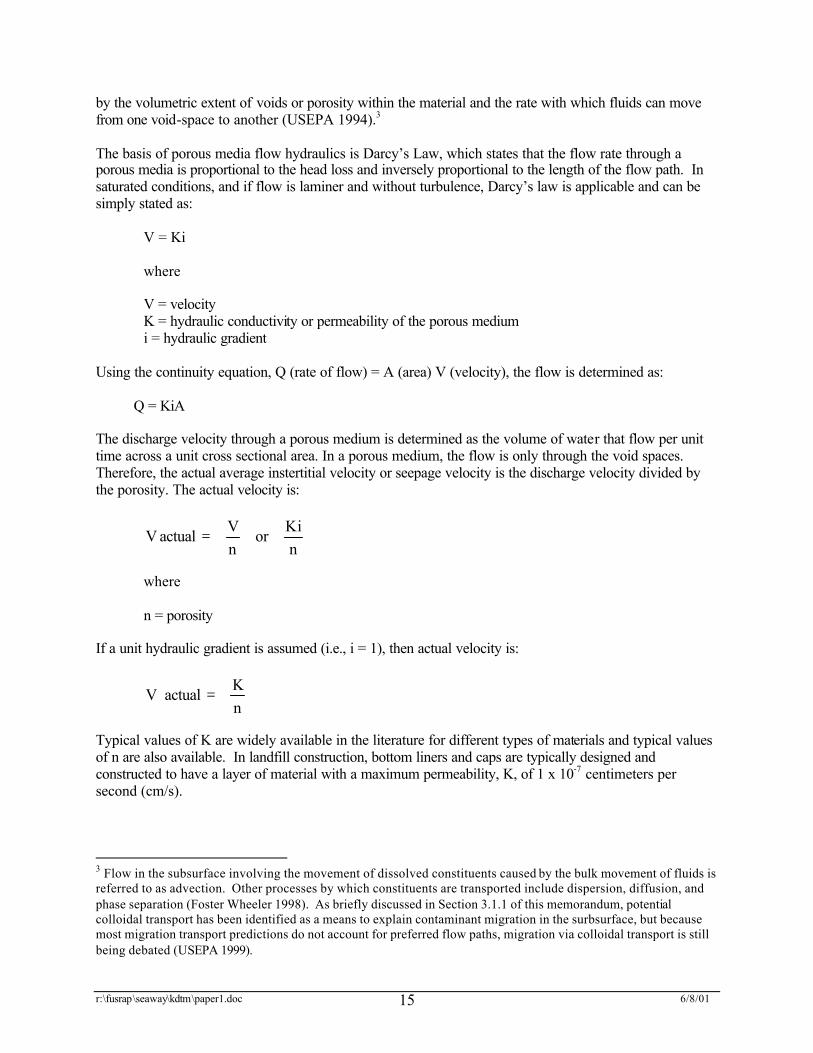
by the volumetric extent of voids or porosity within the material and the rate with which fluids can move from one void-space to another (USEPA 1994).3 The basis of porous media flow hydraulics is Darcy’s Law, which states that the flow rate through a porous media is proportional to the head loss and inversely proportional to the length of the flow path. In saturated conditions, and if flow is laminer and without turbulence, Darcy’s law is applicable and can be simply stated as:
V = Ki where V = velocity K = hydraulic conductivity or permeability of the porous medium i = hydraulic gradient
Using the continuity equation, Q (rate of flow) = A (area) V (velocity), the flow is determined as:
Q = KiA
The discharge velocity through a porous medium is determined as the volume of water that flow per unit time across a unit cross sectional area. In a porous medium, the flow is only through the void spaces. Therefore, the actual average instertitial velocity or seepage velocity is the discharge velocity divided by the porosity. The actual velocity is:
nKior
nVactualV =
where n = porosity If a unit hydraulic gradient is assumed (i.e., i = 1), then actual velocity is:
nKactualV =
Typical values of K are widely available in the literature for different types of materials and typical values of n are also available. In landfill construction, bottom liners and caps are typically designed and constructed to have a layer of material with a maximum permeability, K, of 1 x 10⁻⁷ centimeters per second (cm/s).
3 Flow in the subsurface involving the movement of dissolved constituents caused by the bulk movement of fluids is referred to as advection. Other processes by which constituents are transported include dispersion, diffusion, and phase separation (Foster Wheeler 1998). As briefly discussed in Section 3.1.1 of this memorandum, potential colloidal transport has been identified as a means to explain contaminant migration in the surbsurface, but because most migration transport predictions do not account for preferred flow paths, migration via colloidal transport is still being debated (USEPA 1999).
r:\fusrap\seaway\kdtm\paper1.doc 6/8/01 16
The actual characteristics of flow of water through the subsurface is much more complex than described above. The simple principles of idealized porous media flow provide, however, a background for considering the transport of contaminants with water in the subsurface, as described below.
4.1.2 Chemical Transport in Subsurface Flow As solutions move through the spaces within subsurface materials, solutes may either be added to or removed from that solution. Which solutes are removed or added, and the quantity and rate at which they are added or removed, is controlled by the geochemical nature of the solution and subsurface matrix. These geochemical processes may be very complex, and their understanding may require an extensive base of physical and chemical data which are rarely available. Most subsurface transport models lump the effects of all geochemical reactions into the concept of the distribution coefficient (Kd) or related retardation factors (Rf) (USEPA 1994). Kds and Rfs are described below.
4.2 Distribution Coefficients (Kd) and Retardation Factors (Rf)
4.2.1 Definition of Kd
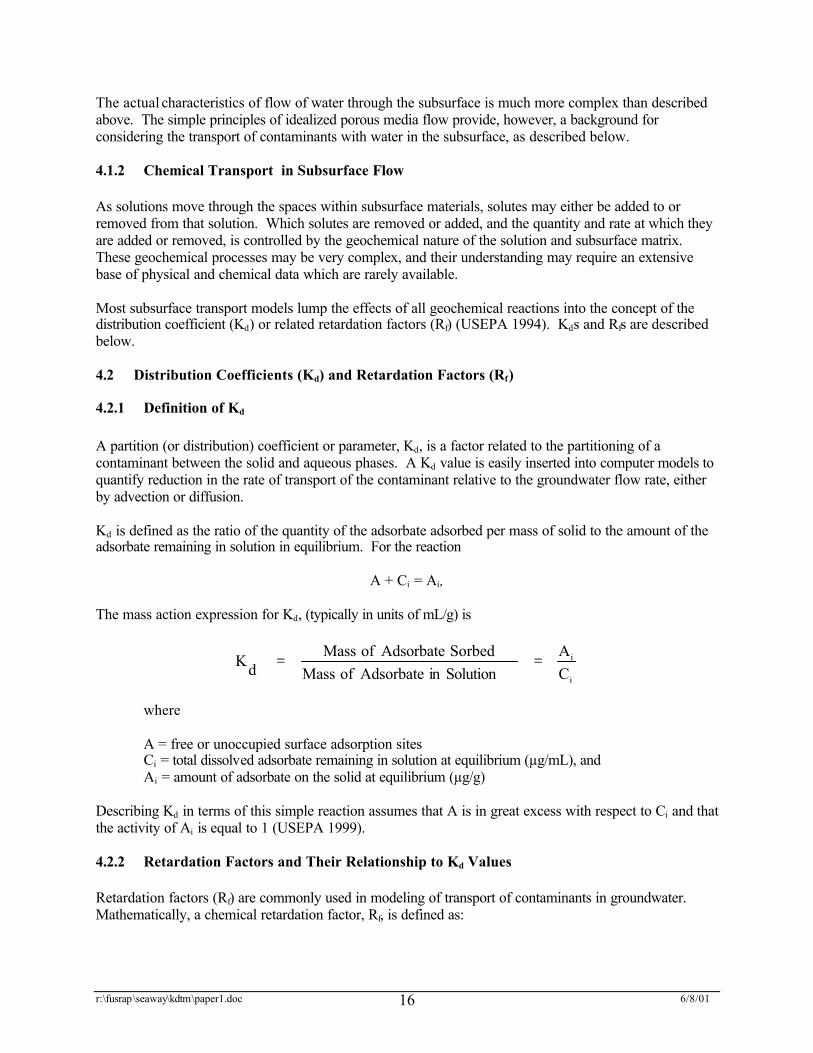
A partition (or distribution) coefficient or parameter, Kd, is a factor related to the partitioning of a contaminant between the solid and aqueous phases. A Kd value is easily inserted into computer models to quantify reduction in the rate of transport of the contaminant relative to the groundwater flow rate, either by advection or diffusion. Kd is defined as the ratio of the quantity of the adsorbate adsorbed per mass of solid to the amount of the adsorbate remaining in solution in equilibrium. For the reaction
A + Ci = Ai, The mass action expression for Kd, (typically in units of mL/g) is
i
i
CA
SolutioninAdsorbateofMassSorbedAdsorbateofMass
dK ==
where A = free or unoccupied surface adsorption sites Ci = total dissolved adsorbate remaining in solution at equilibrium (µg/mL), and Ai = amount of adsorbate on the solid at equilibrium (µg/g)
Describing Kd in terms of this simple reaction assumes that A is in great excess with respect to Ci and that the activity of Ai is equal to 1 (USEPA 1999).
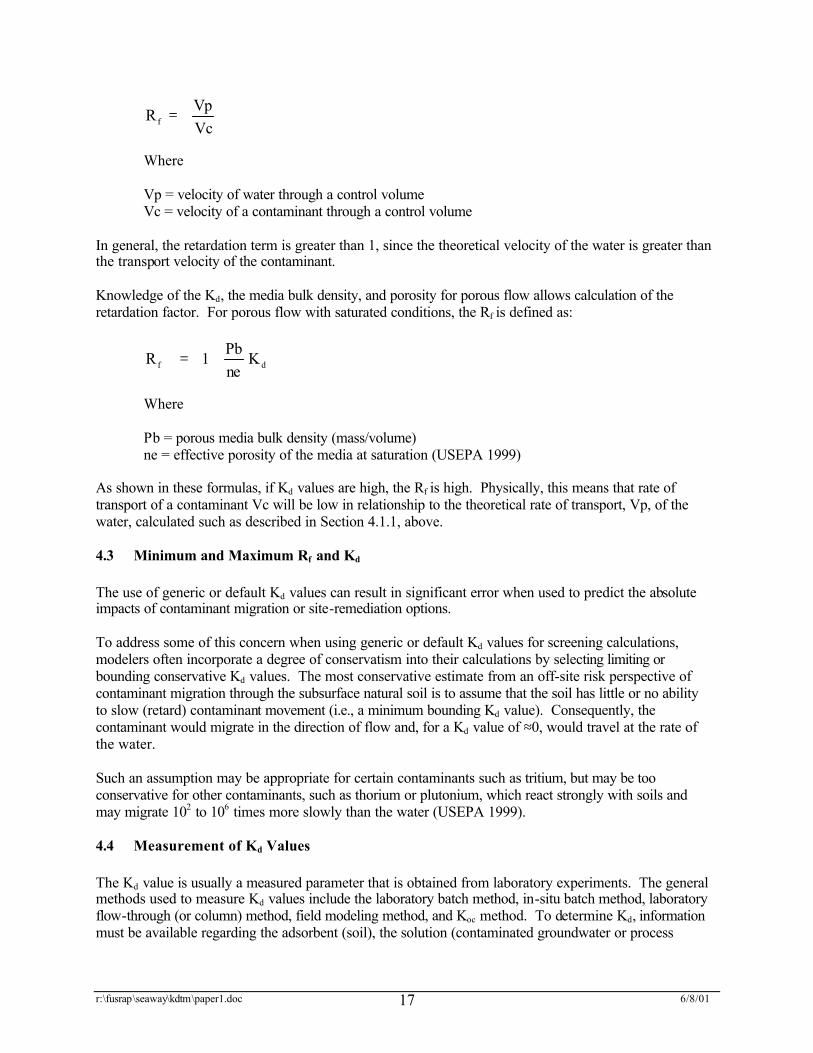
4.2.2 Retardation Factors and Their Relationship to Kd Values Retardation factors (Rf) are commonly used in modeling of transport of contaminants in groundwater. Mathematically, a chemical retardation factor, Rf, is defined as:
r:\fusrap\seaway\kdtm\paper1.doc 6/8/01 17
VcVpR f =
Where
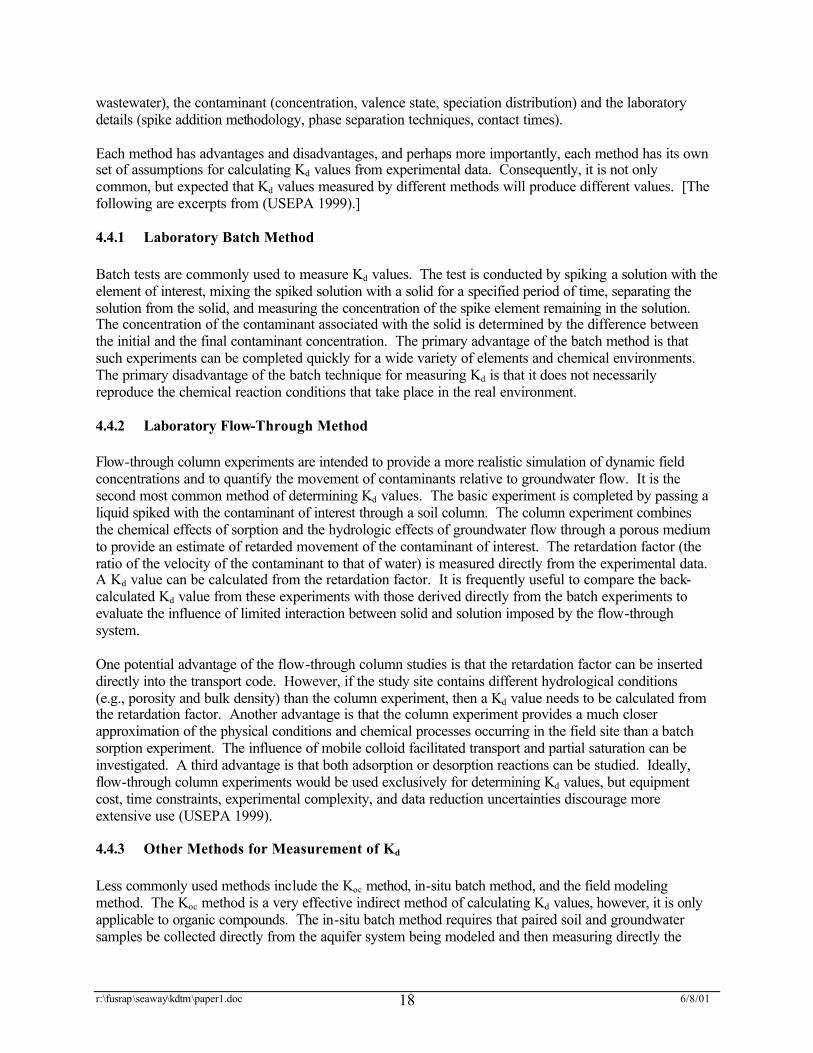
Vp = velocity of water through a control volume Vc = velocity of a contaminant through a control volume In general, the retardation term is greater than 1, since the theoretical velocity of the water is greater than the transport velocity of the contaminant. Knowledge of the Kd, the media bulk density, and porosity for porous flow allows calculation of the retardation factor. For porous flow with saturated conditions, the Rf is defined as:
df KnePb1R +=
Where Pb = porous media bulk density (mass/volume) ne = effective porosity of the media at saturation (USEPA 1999) As shown in these formulas, if Kd values are high, the Rf is high. Physically, this means that rate of transport of a contaminant Vc will be low in relationship to the theoretical rate of transport, Vp, of the water, calculated such as described in Section 4.1.1, above.
4.3 Minimum and Maximum Rf and Kd The use of generic or default Kd values can result in significant error when used to predict the absolute impacts of contaminant migration or site-remediation options. To address some of this concern when using generic or default Kd values for screening calculations, modelers often incorporate a degree of conservatism into their calculations by selecting limiting or bounding conservative Kd values. The most conservative estimate from an off-site risk perspective of contaminant migration through the subsurface natural soil is to assume that the soil has little or no ability to slow (retard) contaminant movement (i.e., a minimum bounding Kd value). Consequently, the contaminant would migrate in the direction of flow and, for a Kd value of ≈0, would travel at the rate of the water. Such an assumption may be appropriate for certain contaminants such as tritium, but may be too conservative for other contaminants, such as thorium or plutonium, which react strongly with soils and may migrate 102 to 106 times more slowly than the water (USEPA 1999).
4.4 Measurement of Kd Values The Kd value is usually a measured parameter that is obtained from laboratory experiments. The general methods used to measure Kd values include the laboratory batch method, in-situ batch method, laboratory flow-through (or column) method, field modeling method, and Koc method. To determine Kd, information must be available regarding the adsorbent (soil), the solution (contaminated groundwater or process
r:\fusrap\seaway\kdtm\paper1.doc 6/8/01 18
wastewater), the contaminant (concentration, valence state, speciation distribution) and the laboratory details (spike addition methodology, phase separation techniques, contact times). Each method has advantages and disadvantages, and perhaps more importantly, each method has its own set of assumptions for calculating Kd values from experimental data. Consequently, it is not only common, but expected that Kd values measured by different methods will produce different values. [The following are excerpts from (USEPA 1999).]
4.4.1 Laboratory Batch Method Batch tests are commonly used to measure Kd values. The test is conducted by spiking a solution with the element of interest, mixing the spiked solution with a solid for a specified period of time, separating the solution from the solid, and measuring the concentration of the spike element remaining in the solution. The concentration of the contaminant associated with the solid is determined by the difference between the initial and the final contaminant concentration. The primary advantage of the batch method is that such experiments can be completed quickly for a wide variety of elements and chemical environments. The primary disadvantage of the batch technique for measuring Kd is that it does not necessarily reproduce the chemical reaction conditions that take place in the real environment.
4.4.2 Laboratory Flow-Through Method Flow-through column experiments are intended to provide a more realistic simulation of dynamic field concentrations and to quantify the movement of contaminants relative to groundwater flow. It is the second most common method of determining Kd values. The basic experiment is completed by passing a liquid spiked with the contaminant of interest through a soil column. The column experiment combines the chemical effects of sorption and the hydrologic effects of groundwater flow through a porous medium to provide an estimate of retarded movement of the contaminant of interest. The retardation factor (the ratio of the velocity of the contaminant to that of water) is measured directly from the experimental data. A Kd value can be calculated from the retardation factor. It is frequently useful to compare the back-calculated Kd value from these experiments with those derived directly from the batch experiments to evaluate the influence of limited interaction between solid and solution imposed by the flow-through system. One potential advantage of the flow-through column studies is that the retardation factor can be inserted directly into the transport code. However, if the study site contains different hydrological conditions (e.g., porosity and bulk density) than the column experiment, then a Kd value needs to be calculated from the retardation factor. Another advantage is that the column experiment provides a much closer approximation of the physical conditions and chemical processes occurring in the field site than a batch sorption experiment. The influence of mobile colloid facilitated transport and partial saturation can be investigated. A third advantage is that both adsorption or desorption reactions can be studied. Ideally, flow-through column experiments would be used exclusively for determining Kd values, but equipment cost, time constraints, experimental complexity, and data reduction uncertainties discourage more extensive use (USEPA 1999).
4.4.3 Other Methods for Measurement of Kd Less commonly used methods include the Koc method, in-situ batch method, and the field modeling method. The Koc method is a very effective indirect method of calculating Kd values, however, it is only applicable to organic compounds. The in-situ batch method requires that paired soil and groundwater samples be collected directly from the aquifer system being modeled and then measuring directly the
r:\fusrap\seaway\kdtm\paper1.doc 6/8/01 19
amount of contaminant on the solid and liquid phases. The advantage to this approach is that the precise solution chemistry and solid phase mineralogy existing in the study site is used to measure the Kd value. However, this method is not used often because of the analytical problems associated with measuring the exchangeable fraction of contaminant on the solid phase. Finally, the field modeling method of calculating Kd values uses groundwater monitoring data and source term data to calculate a Kd value. One key drawback to this technique is that it is very model dependent. Because the calculated Kd values are model dependent and highly site specific, these Kd values should not be used for contaminant transport calculations at other sites.
4.4.4 ASTM Test Method
The American Society for Testing and Materials (ASTM) has developed a test method for determining Kd, entitled Standard Test Method for Distribution Ratios by the Short Term Batch Method (ASTM D4319-93). In developing Kd values, it is generally assumed that equilibrium conditions have been attained. The ASTM test is a short-term test and the attainment of equilibrium in this laboratory test is not presumed, although this may be so for certain systems (for example, strictly interlayer ion exchange reactions of clays). Consistent with general usage, the result of this test could be referred to as “distribution coefficient” or as “distribution ratio;” in the strictest sense, however, the term “distribution ratio” is preferable in that the attainment of equilibrium is not implied (ASTM D4319-93). The test procedures are complex. In short, the test involves, in part: • characterization of the medium of interest (i.e., soil or other porous media through which dissolved
contaminants are transported); • preparation of a spiked solution containing the contaminant of interest at known concentration; • mixing the solid sample with the spiked solution; • allowing equilibrium to be simulated; • determining the final concentration of the contaminant of interest in solution and the concentration in
the solid phase; • recording key parameters, including pH; and • Calculating the distribution ratio. Assuming that satisfactory results are obtained, the resulting Kd value will be applicable for the contaminant of interest selected, in the medium of interest selected, for the environmental conditions selected (e.g., for a given pH). As described in the following sections of this paper, the Kd values for a given contaminant of interest would be expected to vary widely with the medium of interest selected and the environmental conditions present. The “Field Sampling Plan for the Remedial Investigation/Feasibility Study – Environmental Impact Statement for the Tonawanda Site” (USDOE 1993) indicates the use of ASTM D4319 testing to determine Kd values of soil samples from borings conducted outside the southeastern boundary of Seaway. The RI report (BNI 1993) indicates Kd values for uranium in the till (0-24 feet below grade)
r:\fusrap\seaway\kdtm\paper1.doc 6/8/01 20
ranged from 5.3 to 29.3 mL/g; in the varved lacustrine clay (30-36 feet below grade) was 8.9 mL/g; and in the glaciolacustrine clay (30-44 feet below grade) ranged from 8.1 to 12.1 mL/g.
4.4.5 Back Calculation for Kd from Results of Leaching Tests If it is assumed that equilibrium between the liquid and solid phase of a constituent of interest is reached during a leaching test such as the TCLP, it is possible to back calculate Kd. The initial concentration of the constituent in the solid phase is measured and then the concentration of the constituent in the leachate (elutriate) is measured. Using the appropriate weight and liquid volume relationships specified in the tests, the remaining concentration of the constituent on the solid phase is calculated. The remaining concentration in the solid phase and the elutriate concentration may then be used to calculate the Kd value.
4.5 Kd Values for Seaway COCs The USEPA has compiled an extensive review of the geochemistry and available Kd values for selected inorganic contaminants including uranium and thorium (USEPA 1999). The following is excerpted, in part, from Volume II of the 1999 USEPA report.
4.5.1 Uranium
4.5.1.1 Overview of Uranium Geochemistry The +IV and +VI are the most important oxidation states of uranium in most environments. Uranium (VI) species dominate in oxidizing environments. U(VI) retention by soils and rocks is poor in alkaline conditions because of the predominance of neutral or negatively charges species. An increase in CO2
pressure in soils reduces U(VI) by promoting the formation of poorly sorbing carbonate complexes. Uranium (IV) [U(IV)] species dominate in reducing environments. U(IV) tends to hydrolize and form strong hydrolytic complexes. U(IV) also tends to form sparingly soluble precipitates that commonly control U(IV) concentrations in groundwater. U(IV) forms strong complexes with naturally occurring organic materials and in areas of high dissolved organic material, U(V) – organic complexes may increase U(IV) solubility. There are several ancillary environmental parameters affecting uranium migration, including: redox status; pH; ligand (carbonate, fluoride, sulfate, phosphate and dissolved carbon) concentrations; aluminum and iron oxide concentrations; and uranium concentrations.
4.5.1.2 Reported Kd Values for Uranium In the 1999 USEPA report (USEPA 1999), Kd values from more than 20 references are cited for the sorption of uranium onto soils, crushed rock, and single mineral phases. These studies indicated that pH and dissolved carbonate concentrations are the two most important factors influencing the adsorption of U(VI). The uranium Kd values reported exhibit a large scatter. In general, the adsorption of uranium by soils and single-mineral phases in carbonate containing aqueous solutions is low at pH values less than 3, increases rapidly with increasing pH from pH 3 to 5, reaches a maximum in adsorption in the range of pH 5 to 8 and then decreases with increasing pH at a level of pH greater than 8.
r:\fusrap\seaway\kdtm\paper1.doc 6/8/01 21
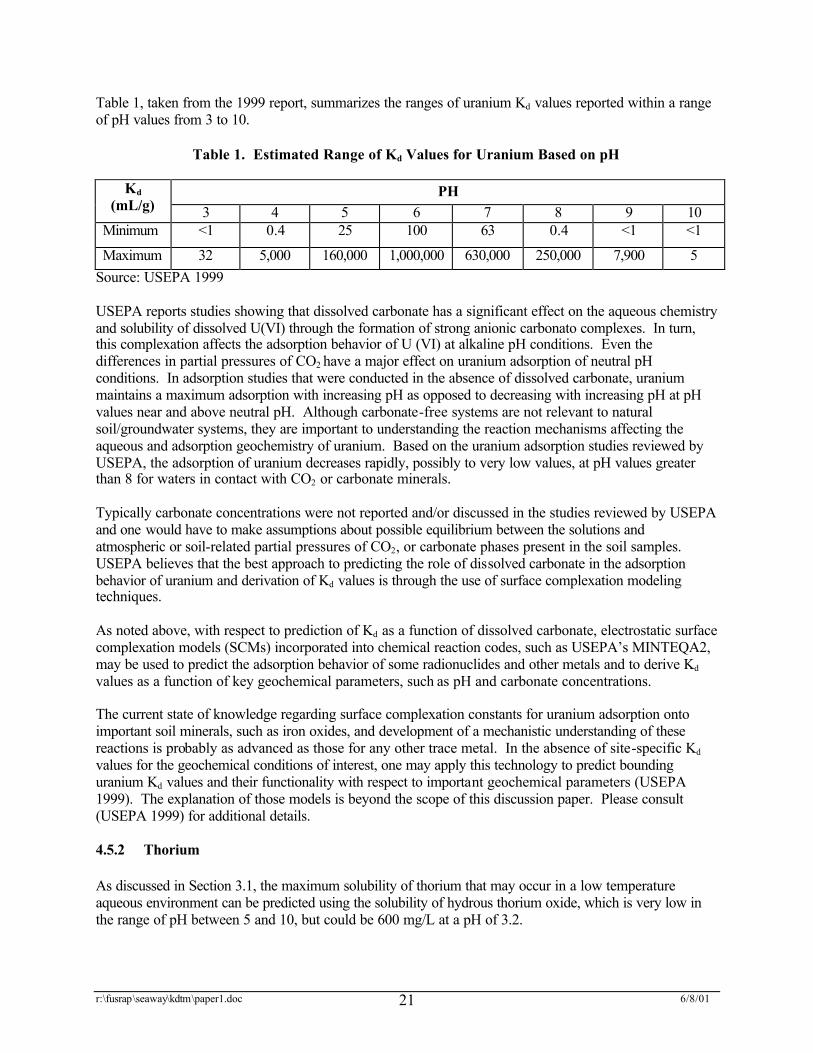
Table 1, taken from the 1999 report, summarizes the ranges of uranium Kd values reported within a range of pH values from 3 to 10.
Table 1. Estimated Range of Kd Values for Uranium Based on pH
PH Kd (mL/g) 3 4 5 6 7 8 9 10
Minimum <1 0.4 25 100 63 0.4 <1 <1
Maximum 32 5,000 160,000 1,000,000 630,000 250,000 7,900 5 Source: USEPA 1999 USEPA reports studies showing that dissolved carbonate has a significant effect on the aqueous chemistry and solubility of dissolved U(VI) through the formation of strong anionic carbonato complexes. In turn, this complexation affects the adsorption behavior of U (VI) at alkaline pH conditions. Even the differences in partial pressures of CO2 have a major effect on uranium adsorption of neutral pH conditions. In adsorption studies that were conducted in the absence of dissolved carbonate, uranium maintains a maximum adsorption with increasing pH as opposed to decreasing with increasing pH at pH values near and above neutral pH. Although carbonate-free systems are not relevant to natural soil/groundwater systems, they are important to understanding the reaction mechanisms affecting the aqueous and adsorption geochemistry of uranium. Based on the uranium adsorption studies reviewed by USEPA, the adsorption of uranium decreases rapidly, possibly to very low values, at pH values greater than 8 for waters in contact with CO2 or carbonate minerals. Typically carbonate concentrations were not reported and/or discussed in the studies reviewed by USEPA and one would have to make assumptions about possible equilibrium between the solutions and atmospheric or soil-related partial pressures of CO2, or carbonate phases present in the soil samples. USEPA believes that the best approach to predicting the role of dissolved carbonate in the adsorption behavior of uranium and derivation of Kd values is through the use of surface complexation modeling techniques. As noted above, with respect to prediction of Kd as a function of dissolved carbonate, electrostatic surface complexation models (SCMs) incorporated into chemical reaction codes, such as USEPA’s MINTEQA2, may be used to predict the adsorption behavior of some radionuclides and other metals and to derive Kd values as a function of key geochemical parameters, such as pH and carbonate concentrations. The current state of knowledge regarding surface complexation constants for uranium adsorption onto important soil minerals, such as iron oxides, and development of a mechanistic understanding of these reactions is probably as advanced as those for any other trace metal. In the absence of site-specific Kd values for the geochemical conditions of interest, one may apply this technology to predict bounding uranium Kd values and their functionality with respect to important geochemical parameters (USEPA 1999). The explanation of those models is beyond the scope of this discussion paper. Please consult (USEPA 1999) for additional details.
4.5.2 Thorium As discussed in Section 3.1, the maximum solubility of thorium that may occur in a low temperature aqueous environment can be predicted using the solubility of hydrous thorium oxide, which is very low in the range of pH between 5 and 10, but could be 600 mg/L at a pH of 3.2.
r:\fusrap\seaway\kdtm\paper1.doc 6/8/01 22
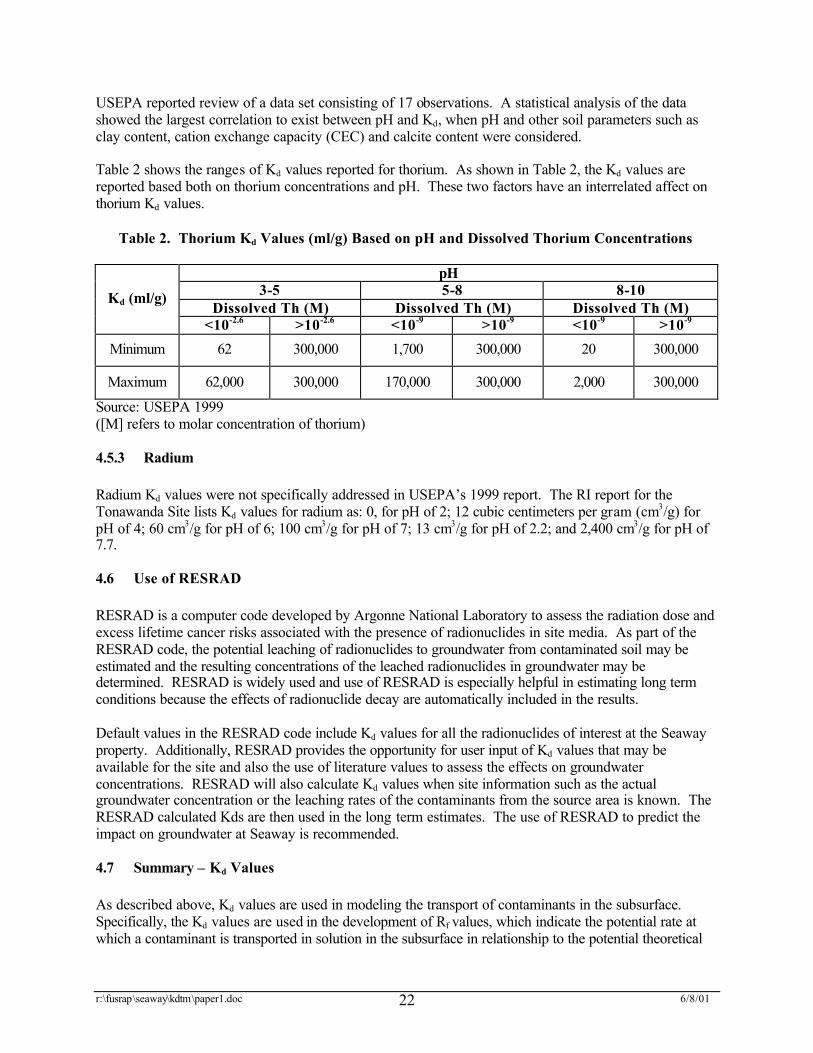
USEPA reported review of a data set consisting of 17 observations. A statistical analysis of the data showed the largest correlation to exist between pH and Kd, when pH and other soil parameters such as clay content, cation exchange capacity (CEC) and calcite content were considered. Table 2 shows the ranges of Kd values reported for thorium. As shown in Table 2, the Kd values are reported based both on thorium concentrations and pH. These two factors have an interrelated affect on thorium Kd values.
Table 2. Thorium Kd Values (ml/g) Based on pH and Dissolved Thorium Concentrations
pH 3-5 5-8 8-10
Dissolved Th (M) Dissolved Th (M) Dissolved Th (M) Kd (ml/g)
<10-2.6 >10-2.6 <10-9 >10-9 <10-9 >10-9
Minimum 62 300,000 1,700 300,000 20 300,000
Maximum 62,000 300,000 170,000 300,000 2,000 300,000
Source: USEPA 1999 ([M] refers to molar concentration of thorium)
4.5.3 Radium Radium Kd values were not specifically addressed in USEPA’s 1999 report. The RI report for the Tonawanda Site lists Kd values for radium as: 0, for pH of 2; 12 cubic centimeters per gram (cm3/g) for pH of 4; 60 cm3/g for pH of 6; 100 cm3/g for pH of 7; 13 cm3/g for pH of 2.2; and 2,400 cm3/g for pH of 7.7.
4.6 Use of RESRAD RESRAD is a computer code developed by Argonne National Laboratory to assess the radiation dose and excess lifetime cancer risks associated with the presence of radionuclides in site media. As part of the RESRAD code, the potential leaching of radionuclides to groundwater from contaminated soil may be estimated and the resulting concentrations of the leached radionuclides in groundwater may be determined. RESRAD is widely used and use of RESRAD is especially helpful in estimating long term conditions because the effects of radionuclide decay are automatically included in the results. Default values in the RESRAD code include Kd values for all the radionuclides of interest at the Seaway property. Additionally, RESRAD provides the opportunity for user input of Kd values that may be available for the site and also the use of literature values to assess the effects on groundwater concentrations. RESRAD will also calculate Kd values when site information such as the actual groundwater concentration or the leaching rates of the contaminants from the source area is known. The RESRAD calculated Kds are then used in the long term estimates. The use of RESRAD to predict the impact on groundwater at Seaway is recommended.
4.7 Summary – Kd Values As described above, Kd values are used in modeling the transport of contaminants in the subsurface. Specifically, the Kd values are used in the development of Rf values, which indicate the potential rate at which a contaminant is transported in solution in the subsurface in relationship to the potential theoretical
r:\fusrap\seaway\kdtm\paper1.doc 6/8/01 23
velocity of the flow of water. A large Kd value will mean a large Rf, indicating the contaminant transport rate will be much slower than the theoretical velocity of the water. Conversely, a low Kd value will mean a small Rf, indicating that a contaminant will travel at a velocity potentially near that of the velocity of water. The measurement of Kd values may be conducted in a number of ways. USEPA recommends the flow-through column method as having many advantages, but notes that equipment costs, time constraints, experimental complexity, and data reduction uncertainties discourage more extensive use. The Kd values available in the USEPA’s 1999 report show a wide range of Kd values for uranium. While there are a number of environmental factors contributing to the wide range of uranium Kds reported, pH is singled out as very important. Reported Kds vary with pH over six orders of magnitude. Kds reported for thorium also vary with pH, the concentration of thorium in solution is correlated with pH and the range of Kds for thorium are reported to range over four orders of magnitude. Kds for radium were not addressed in the 1999 USEPA report, but, based on information available in the RI report for Tonawanda could be expected to vary with pH over about three orders of magnitude. 5.0 SUMMARY, CONCLUSIONS AND RECOMMENDATIONS
5.1 MED Contamination and Current Conditions in the Seaway Landfill The MED residues in the Seaway Landfill have been placed in areas referred to as Areas A, B and C. These residues remain after the aggressive treatment of uranium ores, including the addition of sulfuric acid to reach a pH of 0.7 to 0.8 in one part of the process. The primary radionuclides in the residues are uranium, thorium and radium. The portion of the landfill where the MED residues are placed is not capped. Precipitation infiltrating the landfill percolates downward through the MED material and laterally, entering the leachate collection system, which flows at an average of about 24,000 gallons per day. The potential migration pathways of water through the landfill are shown in Figure 2 in Section 3. If the leachate collection system is disabled under current conditions, the landfill area would fill up and the migration of water out of the landfill could potentially increase, with increased hydraulic head on the landfill bottom, through and potentially around the clay cutoff wall and potentially at the top of the clay liner and berm. These conditions are shown in Figure 3 in Section 3.
5.2 MED Contamination and Future Conditions with Capping
As shown in Figure 4 in Section 3, if the landfill is capped and the leachate collection system remains functional, the potential for water entering the landfill and percolating through the MED material is reduced. The migration pathways at the landfill are the same as the current conditions, but the magnitude of the flow is limited. If the leachate collection system is disabled, or if the cap is breached, the potential exists for the landfill to ultimately fill up with water due to the bathtub effect (i.e., the permeability of the landfill bottom is less than the permeability of the cap). The resultant potential pathways for migration of water out of the landfill are shown in Figure 5 in Section 3.
5.3 Potential Releases from the Source Areas U-238, Th-230 and Ra-226 are the COCs in the source area of the landfill. The principal means for a release of these contaminants to the water within the landfill is via leaching. For leaching to occur, these
r:\fusrap\seaway\kdtm\paper1.doc 6/8/01 24
contaminants would first have to dissolve in the water passing through the source area. The solubilities of the COCs will depend on their chemical composition and a wide range of solubilities have been reported. As part of the supplemental investigations being proposed at Seaway, leaching tests would be conducted.
5.4 Kd and Rf Values Kd values and Rf associated values are used in contaminant transport modeling to predict the rate of transport of a contaminant in relationship to the theoretical velocity of water flow through porous subsurface material. A wide range of Kd values have been reported for the COCs. The pH and other parameters, relating both to the contaminant in solution and the nature of porous subsurface material, play a major role in the determination of Kd values and the associated Rf values. For uranium, reported Kd values range across 6 orders of magnitude, with low Kd values both at low pH and high pH. Low Kd values indicate lower Rf values. The rate of contaminant transport is relatively high in relationship to the theoretical velocity of flow, when Rf values are low. The thorium and radium also show ranges of Kd with pH, but not as markedly as with uranium.
5.5 Measurement of Kd Values USEPA has identified five methods for use in measurement of Kd values. The flow through method is preferred. It involves precise measurement of a spiked solution of the contaminant of interest and a full range of characterization of the chemical and physical properties of a sample of porous media through which the spiked solution is measured.
5.6 Feasibility of Establishing Kd Values for the COCs at the Seaway Landfill As briefly outlined in this discussion paper, the establishment of a Kd for a specific contaminant requires the application of rigorous testing protocols to characterize the physical and chemical characteristics of the solution and the porous media through which the solution flows. In the landfill mass at Seaway, the subsurface is known to be variable, with soil, municipal refuse, fly ash, sludges and debris reported to be present. This potential variability presents a formidable challenge to establishment of a representative Kd, since both the solute and the media must be characterized. Given this variation, numerous samples would be required. Even in the event that a large number of tests are conducted and an average Kd were developed for each of the COCs, a question remains on how these values would be applied. Currently, the seepage through the landfill is rapid, as evidenced by the quantity of leachate being collected. Even if large retardation factors were calculated, the distance to the perimeter of the landfill is limited and the relative rate of contaminant transport to the velocity of water is of limited utility. The use of leaching tests (TCLP) of the source material (i.e., the material in Areas A, B and C) is planned. These results will provide valuable information on the potential contamination leaving the source area in the liquid phase. Back calculation of the results of the TCLP test can be used to determine site specific Kd values for the radionuclides of interest. These Kd values, along with those available in the literature, can be used to assess potential groundwater impacts using the RESRAD code.
5.7 Recommendations To address potential leaching of the COCs out of the source areas, leaching tests should be performed. The TCLP leaching tests developed by USEPA to simulate leaching in a municipal landfill should be
r:\fusrap\seaway\kdtm\paper1.doc 6/8/01 25
used. The use of Kd values back calculated from these tests should be used in RESRAD along with other Kd values to assess potential groundwater impacts. Given the potential for a rise in the water in the landfill if the leachate collection system is disabled or the landfill is capped and the cap is breached, a comprehensive set of long-term institutional controls should be formulated to ensure that water levels in the landfill are minimized. 6.0 REFERENCES Aerospace 1981. Evaluation of the 1943 to 1946 Liquid Effluent Discharge from the Linde Aire Products Company Ceramics Plant. The Aerospace Corporation. December. ARCO 1995. Parks Shallow Land Disposal Area, Studies for Geochemical Parameters. ARCO. May. ASTM D4319-93. Standard Test Method for Distribution Ratios by the Short-Term Batch Method. American Society for Testing and Materials. 1993. BNI 1993. Remedial Investigation for the Tonawanda Site. Bechtel National Incorporated. February Foster Wheeler 1998. RBCA Fate and Transport Models: Compendium and Selection Guidance. Prepared for ASTM. Prepared by Foster Wheeler Environmental Corporation. November. (Note: RBCA refers to Risk Based Corrective Action.) ORNL 1978. Radiological Survey of the Seaway Industrial Park, Tonawanda, New York. Oak Ridge National Laboratory. May USACE 2000a. Record of Decision for the Linde Site, Tonawanda, New York. U.S. Army Corps of Engineers. March USACE 2000b. Technical Memorandum: Modeling of Radiological Risks from Residual Radioactive Materials Following Implementation of Remedial Alternatives for Seaway Landfill Areas A, B and C, Tonawanda, New York, Rev. 2. U.S. Army Corps of Engineers. June USEPA 1986. Test Methods for Evaluating Solid Wastes. U.S. Environmental Protection Agency. SW-846, 1986, as revised. USEPA 1995. Applicability of the Toxicity Characteristic Leaching Procedure to Mineral Processing Wastes, Technical Background Document Supporting the Supplemental Proposed Rule Applying Phase IV Land Restriction to Newly Identified Mineral Processing Wastes. Office of Solid Wastes, U.S. Environmental Protection Agency. December. USEPA 1999. Understanding Variation in Partition Coefficient (Kd) Values. U.S. Environmental Protection Agency. Volume 1 and Volume II. August USEPA 2000a. Soil Screening Guidance for Radionuclides: Users Guide. U.S. Environmental Protection Agency. October. USEPA 2000b. Soil Screening Guidance for Radionuclides: Technical Background Document. U.S. Environmental Protection Agency. October.
r:\fusrap\seaway\kdtm\paper1.doc 6/8/01 26
USEPA 2000c. Radionuclides Notice of Data Availability, Technical Support Document. U.S. Environmental Protection Agency. March. USDOE 1993. Field Sampling Plan for the Remedial Investigation/Feasibility Study – Environmental Impact Statement for the Tonawanda Site. U.S. Department of Energy. August. Wehran 1979. Hydrogeological Investigation, Seaway Industrial Park Sanitary Landfill, Tonawanda, New York. Wehran Engineering Corporation. May