use of interest rate swaps by commercial banks: an ...spidi2.iimb.ernet.in/~networth/ccs/2006/121...
TRANSCRIPT

Use of Interest Rate Swaps by Commercial Banks: An Analysis of Determinants
Contemporary Course Study
Submitted To
Prof. Jayadev M.
ON August 28, 2007
BY
Chirag Thakral (0611016)
Sandeep Kumar (0611042)
INDIAN INSTITUTE OF MANAGEMENT, BANGALORE
ACKNOWLEDGEMENT
We express our sincere thanks to Prof. Jayadev M. (Finance & Control Area) for his
guidance and support extended to us in preparation of the study on “USE OF INTEREST
RATE SWAPS BY COMMERCIAL BANKS: AN ANALYSIS OF DETERMINANTS”. He has been
very helpful throughout the project and co-operated and guided us in the best possible way.
We have benefited a lot from the depth of his knowledge.
We are also extremely grateful to Mr. Srivatsan Sudersan, Bloomberg, Singapore, for being
so helpful and cooperative to us in procuring the data required for the project.
Finally we would like to express our heartfelt thanks to all those who have helped us in this
project.

1
Use of Interest Rate Swaps by Commercial Banks:
An Analysis of Determinants Chirag Thakral (0611016) Sandeep Kumar (0611042)
Prof. Jayadev M.
Indian Institute of Management Bangalore
August 28, 2007
Abstract
Banks like any profit making organisation face a variety of macroeconomic and microeconomic risks and
need to manage all these risks using different methods for their efficient functioning. In this study we develop an
analysis on hedging of the most significant of financial risks faced by the commercial banks i.e. interest rate risk, us-
ing the interest rate swaps. We also look at the revenue generation of banks by trading in interest rate swaps. Banks
interest rate exposure associated with a mismatch between assets and liabilities can be measured using traditional
GAP and duration GAP analysis. To fill this GAP a commercial bank uses derivatives instruments to adjust the
amount of assumed interest rate.
Interest rate swaps are the most popular financial derivatives used by the commercial banks. In this study the
effect of various bank specific parameters (size, profitability, capitalization, interest rate risk profile, creditworthiness,
Stock Price etc.) and economy specific parameters (interest rate volatility, market index etc.) on the interest rate swap
positions of the bank are examined. The study used the annual data of about 20 banks (from India, Singapore, Hong
Kong and Brazil) for a period of over 5 years from 2002-2006 and tried to find out the pattern of interest rate swap
usage for asset liability management by these banks. The various bank specific and economy wide parameters are re-
gressed using Panel Regression, against the notional amount of interest rate swaps obtained from the annual reports of
the bank.
The results suggest that the size, profitability, creditworthiness and interest rate risk profile of the bank are the
bank specific factors that play a major role in the banker’s decision to take interest rate swap position in the market
and the extent of the notional amount is dependent on these. The interest rate volatility is a result of the economy of
the country in which the bank operates and banks take position in the interest rate swap market accordingly to tackle
this factor. The stock market conditions for the bank as well as for the index are not a significant determinant.
Keywords: Interest Rate Swaps, Panel Regression, Commercial Banks, Interest Rate Risk

2
Introduction There are a number of risks banks face that are
typical of non financial firms. According to Hem-
pel et al (1994), financial risks are considered to
be the most critical risks faced by the banks. The
main concern of this study is the analysis of hedg-
ing used by commercial banks for financial risk,
in particular interest rate risk. Interest rate risk is
the risk that the market value of a bank‘s asset
declines due to a change in interest rates.
Looking at financial risks and in particular
interest rate risks from the management perspec-
tive, there are two different approaches managers
may adopt in controlling interest rate risk, namely
on-balance sheet adjustments and off-balance
sheet adjustments. Each has particular strengths
and weaknesses, and should be viewed not as
competing methodologies, but as alternatives
which might be appropriate in certain circum-
stances. On balance sheet adjustment involves the
adjustment of some of the bank‘s assets and li-
abilities in a way that the net effect of an interest
rate movement will not harm the market value of
these components and as a result the overall prof-
itability of the bank. The off-balance sheet ap-
proach involves the use of various non-traditional
financial products, widely known as derivative
instruments. These instruments appear neither on
asset nor on liability side.
In recent years, use of interest rate deriva-
tive products has increased significantly. The
Bank for International Settlements (BIS)
publishes statistics on the notional amounts
outstanding in the OTC (Over the Counter)
Derivatives market. The notional amount
outstanding as of December 2006 in OTC interest
rate swaps was $229.8 trillion, up $60.7 trillion
(35.9%) from December 2005. These contracts
account for 55.4% of the entire $415 trillion OTC
derivative market1.
Swaps based on Interest rate are mostly
used for hedging and speculation. All major
banks in world now have an active Derivatives
structuring desk for corporate wherein they offer
various swap products like Caps, Floors, Digitals,
LIBOR Range Accrual, CMS Spread Range
Accrual, Knock out swap, CMS Blade Range and
Snow range runner etc. for hedging and
speculation.
Figure 1.1 classifications of Bank Risks
1 http://en.wikipedia.org/wiki/Interest_rate_swap
3
An interest rate swap is a contractual agreement
entered into between two counterparties under
which each agrees to make periodic payment to
the other for an agreed period of time on the basis
of a notional amount of principal. Interest Rate
Swaps are typically used to create either synthetic
fixed or floating rate liabilities or assets in an ef-
fort to hedge against adverse movements in inter-
est rates. The floating rate index is usually pegged
to short-term interest rates, such as LIBOR or
one-month commercial paper.
Vanilla interest rate swaps are quoted in
terms of the fixed rate to be paid against the float-
ing index. The fixed rate is usually quoted as an
absolute rate, so a quote of 3% against 3-month
Libor would indicate that the fixed rate would be
3% pa. The fixed rates on vanilla swaps are called
swap rates. The swap curve is a yield curve com-
prising swap rates for different maturities. In
highly liquid USD swap market, the swap curve
has emerged as an alternative to Treasuries as a
benchmark for USD interest rates at maturities
exceeding a year. Swap markets serve as a link
between government debt, corporate debt and
money markets, across currencies and maturities.
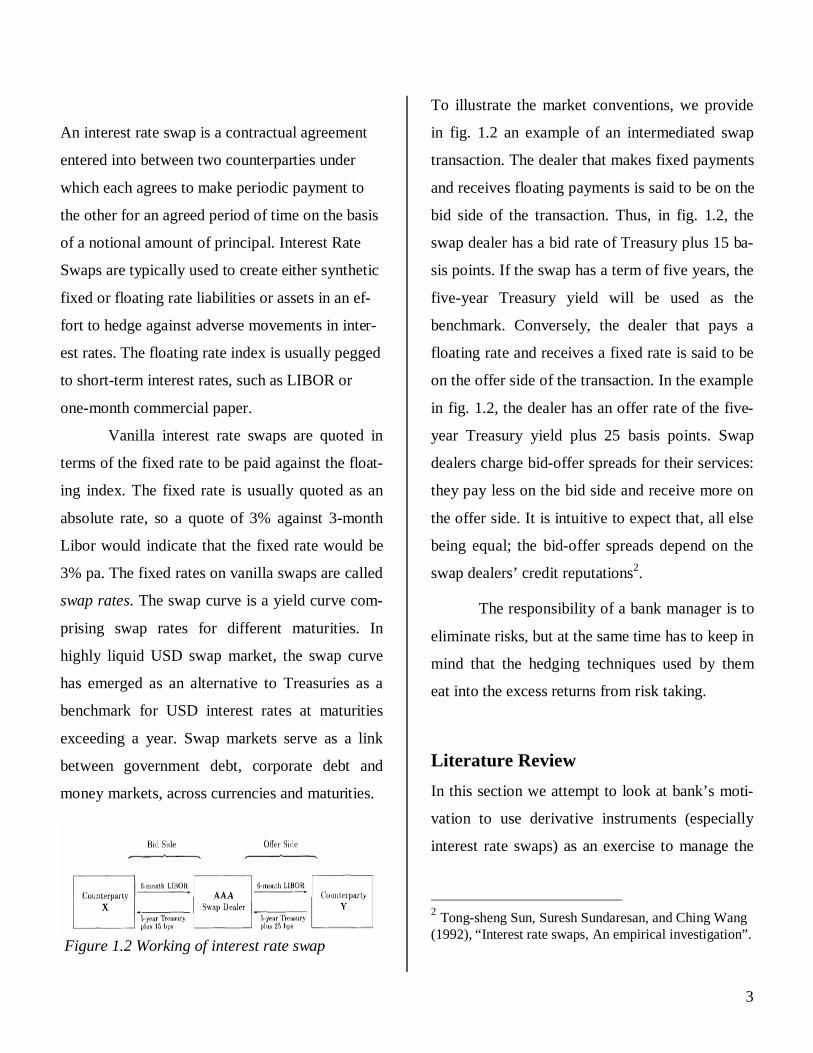
Figure 1.2 Working of interest rate swap
To illustrate the market conventions, we provide
in fig. 1.2 an example of an intermediated swap
transaction. The dealer that makes fixed payments
and receives floating payments is said to be on the
bid side of the transaction. Thus, in fig. 1.2, the
swap dealer has a bid rate of Treasury plus 15 ba-
sis points. If the swap has a term of five years, the
five-year Treasury yield will be used as the
benchmark. Conversely, the dealer that pays a
floating rate and receives a fixed rate is said to be
on the offer side of the transaction. In the example
in fig. 1.2, the dealer has an offer rate of the five-
year Treasury yield plus 25 basis points. Swap
dealers charge bid-offer spreads for their services:
they pay less on the bid side and receive more on
the offer side. It is intuitive to expect that, all else
being equal; the bid-offer spreads depend on the
swap dealers’ credit reputations2.
The responsibility of a bank manager is to
eliminate risks, but at the same time has to keep in
mind that the hedging techniques used by them
eat into the excess returns from risk taking.
Literature Review In this section we attempt to look at bank’s moti-
vation to use derivative instruments (especially
interest rate swaps) as an exercise to manage the
2 Tong-sheng Sun, Suresh Sundaresan, and Ching Wang (1992), “Interest rate swaps, An empirical investigation”.

4
asset liability mismatch by reviewing work done
in this area.
1) Generation of Income
The generation of fee income is a major incentive
for banks to provide risk-management services to
corporate clients. Smith (1993) argues that bank-
ers must recognize the potential benefits of selling
risk-management services. The obvious benefits
come from the generation of fee income and the
opportunities for bankers to create value through
cross-selling and enhanced customer relation-
ships. Less obviously, since hedging with deriva-
tives can reduce the probability of financial dis-
tress for client firms, banks also benefit by reduc-
ing their risk exposure to their customers.
2) Hedging activities
Most of the big banks use interest rate swaps for
income generation but the bank at lower end of
the spectrum use it to hedge against, or speculate
on, the movement of economic variables. Smith
and Stulz (1985) argue that hedging can reduce
the probability of bankruptcy by reducing the
variance of cash flows. Banks with a higher prob-
ability of financial distress would be most likely
to benefit from a hedging program. This implies
that banks with greater leverage, and hence a
greater probability of experiencing bankruptcy,
are more likely to use derivatives to hedge. The
business of banking includes a number of impor-
tant risk factors (for example, default or credit
risk, interest-rate risk, and foreign-exchange risk)
that may be related to the use of derivatives for
hedging purposes. An important consideration is
the interaction between interest-rate risk and
credit risk. Schrand and Unal (1998) investigate
hedging and coordinated risk management used
by thrifts to control both credit risk and interest-
rate risk. If banks are practicing coordinated risk
management, then the use of derivatives to hedge
interest-rate risk should also be related to a bank's
credit exposure. If banks use derivatives (to hedge
or speculate) in response to credit risk, a positive
relationship is expected to exist between loan
losses and derivatives use.
In addition to above papers we looked at the fol-
lowing papers:
Wall and Pringle (1989)
Wall and Pringle (1989) surveyed a set of 250
firms which had reported the use of interest rate
swaps. This study tried to find out the different
motives for using interest rate swaps. They found
that no single explanation is adequate in explain-
ing the behavior of all swap users. They found out
that the motives for using interest rate swaps dif-
fer between banks and other financial institutions
and the non financial institutions.
5
Song (2005)
Song (2005) examined the use of interest rate
swaps to manage earnings in the banking sector.
He finds that banks enter into swap arrangements
to increase (decrease) earnings when they would
have otherwise missed (exceeded) their target. In
a follow up analysis, he finds no evidence that
banks enter into offsetting swap arrangements in
subsequent periods to offset the interest rate risk
taken on by the initial swap arrangement.
Kim and Koppenhaver (1992)
Kim and Koppenhaver (1992) analysis focused on
whether interest rate exposure is a sufficient de-
terminant of a bank to engage in interest rate
swaps transactions. Thus, the authors tried to re-
late the interest rate swap position of the banks to
their interest rate risk profile. However, as Simons
(1995) mentioned in her study the very broad na-
ture of the data in the banks call reports make it
impossible to define such relationships with any
degree of precision. According to the findings of
the study the authors reported a positive relation-
ship between the long term interest rate exposure
of the bank and the extent of swap market partici-
pation. Thus, the study supported the hedging ar-
gument which requires the bank to increase its
hedging position along with the increase of its in-
terest rate exposure.
Moreover the study found that “the size of
interest rate swap positions, as measured by re-
ported notional values, is positively related to the
balance sheet mismatch one to five years forward,
the competitiveness of the bank's deposit market,
the bank's total asset size, primary capitalization
given the bank is a swap dealer, the relative size
of its commercial and industrial loans portfolio,
and futures trading. The study by Kim and Kop-
penhaver (1992) forms the first attempt to shed
some light on the pattern of interest rate swaps
use by commercial banks. It used the method of
regression but the factors used were not much.
L. Shanker (1996)
Shanker (1996) studied the effect that the use of
interest rate derivatives (futures, options, and
swaps) may have in hedging the interest rate risk
of large US commercial banks. Complete data on
stock returns and interest rate sensitive assets and
liabilities were collected for 360 banks over the
period 1986-1993. The study suggested that de-
rivatives usage by banks can effectively reduce
their interest rate risk. However, the study found
that when balance-sheet exposure is considered
the GAP measure is either the same or greater for
the group of banks that uses derivatives than for
the group of banks that does not use derivatives.
Thus, the above result was only supported when
the sensitivity of bank's stock returns to interest
rate changes was considered.

6
Sinkey and Carter (1997)
Sinkey and Carter (1997) examine cross-sectional
differences in the use of derivatives by banks in
an effort to identify the factors that cause banks to
use derivatives. The results of their study suggest
that many of banks' derivative activities can be
explained by the arguments of contemporary fi-
nance theory. Consistent with avoidance of the
costs of financial distress, they find that banks
with greater leverage (and lower capital-to-asset
ratios) are more likely to use derivatives. Incon-
sistent with this argument, however, they find that
banks with greater on-balance-sheet sources of
risk exposure, as reflected in large maturity gaps,
are less likely to use derivatives.
Lyes Boukrami (2002)
The Paper “The Use of Interest Rate Swaps by
Commercial Banks” by Lyes Boukrami, Graduate
Business School, and Manchester analyzed and
illustrated the relationship between one of the
most significant financial risks faced by banks i.e.
interest rate risk, and the interest rate swap. This
study developed a fixed effect model using cross
section data from US banks Annual Reports for
the Year 2001. The paper defined the Bank’s mo-
tives of using derivatives by giving variety of rea-
sons as were mentioned in various papers written
before this paper. The paper used annual data for
a number of US commercial banks and analyzed
the determinants of interest rate swap as a mean
of hedging the interest rate risk of the banks' port-
folios. The objective of this study was to deter-
mine which bank's characteristics best explain the
use of interest rate swaps by commercial banks in
order to hedge the interest rate risk of their portfo-
lios? These characteristics may include the bank's
size, capitalization, assets quality, interest rate
risk profile and the firm's revenue performance
(these were decided based on previous work done
on these topics). Moreover, the degree to which
these characteristics can explain the extent of that
use was also examined. The empirical result was
derived using hypothesis formulation and per-
forming regression on the data available. The re-
sults disclose a positive relationship between the
size of banks and the use of interest rate swaps. In
addition, the study has found that banks with bet-
ter asset quality tend to use interest rate swaps
more intensively than banks with weaker assets
quality.
Aim and Scope of the Study Although interest rate swaps have been the fastest
growing off-balance sheet product in emerging
markets, very less research has been conducted on
the analysis of which specific characteristics best
describe the use of interest rate swaps by banks
and which of these can describe the extent of that
use. Other than the bank specific factors like size,
profitability, stock price, creditworthiness and in-
terest rate risk profile of the bank, the economy

7
wide factors used are financial market index and
interest rate volatility. Although banks don’t dis-
close much about their strategy of portfolio man-
agement, this study analyses the relationship be-
tween various factors of bank and economy and
the position of bank in an interest rate swap.
Hence, the problem is to “Find out the determi-
nants and their extent of influence on the interest
rate swap positions of a commercial bank as a part
of their strategy of asset liability management.”
Methodology of Study and Motivation
In order to solve the above problem our study de-
velops a fixed effect model with the cross section
data for 5 years. The data used in this study was
obtained from annual reports of commercial banks
in India, Hong Kong, Singapore and Brazil for the
year 2002 to 2006. The sample size has been re-
stricted to include only the large banks from a
country as per Simons (1995) paper, which
proved that interest rate swap use is much more
widespread among large banks. The resulting
sample includes 20 banks. The notional amount of
the interest rate swaps used for asset-liability pur-
poses is regressed against the specific characteris-
tics of the banks and economies. The computing
software used for the calculation of the results is
EViews 5.0.
Selection of the variables
In order to select factors which should be exam-
ined to find out the dependence of interest rate
swap exposure of a bank the model developed by
Simons (1995) was employed. The study by
Simons was selected since it provides similar re-
search issues with one of the aims of this study.
This study deals with the emerging markets as
compared to the study by Simons. Moreover, this
study deals with a smaller dataset than Simons
attributed to the limited period of time available
during the face of data collection.
The limited number of studies conducted in the
area of derivatives use by commercial banks sug-
gests that all the authors have more or less used
the same parameters in order to explain the use of
these activities by banks, each one using different
proxies to capture the effects of these parameters.
The most common variables that appear in most
of these studies are (i) the bank's size, (ii) the
bank‘s capital position, (iii) the bank‘s credit wor-
thiness and, (iv) bank‘s interest rate risk profile
(v) and the bank revenue performance. The table
given below provides the most commonly used
parameters by some of the most recent studies on
derivatives use by commercial banks
8
Variable
Kim and
Koppen-
haver,
1992
Simons,
1995
Jagtiani,
1996
Lyes Bou-
krami,
2002
Size Total Assets Total As-
sets
Total Assets Total Assets
Creditwor-
thiness
NA NPA/Asset
LLR/Loans
S&P Rat-
ings
IBT/Assets
NPL/Assets
LLR/Total
loans
Capitaliza-
tion Capital to
Asset Ratio
Equity to
assets ratio KBIND
Capital
Ratio
Equity to
assets ratio
Interest Rate
Risk
GAP meas-
ure
GAP
measure
NA NII/Total
Income
Return Per-
formance
ROA NA NA IBT/Total
Assets Ratio Where IBT= Income before Taxes; NPL= Non-Performing Loans; NPA=
Non-Performing assets;
KBIND= The GAP between the Capital level and the Binding level. NII= Net interest income (the difference between interest income and
interest expenses)
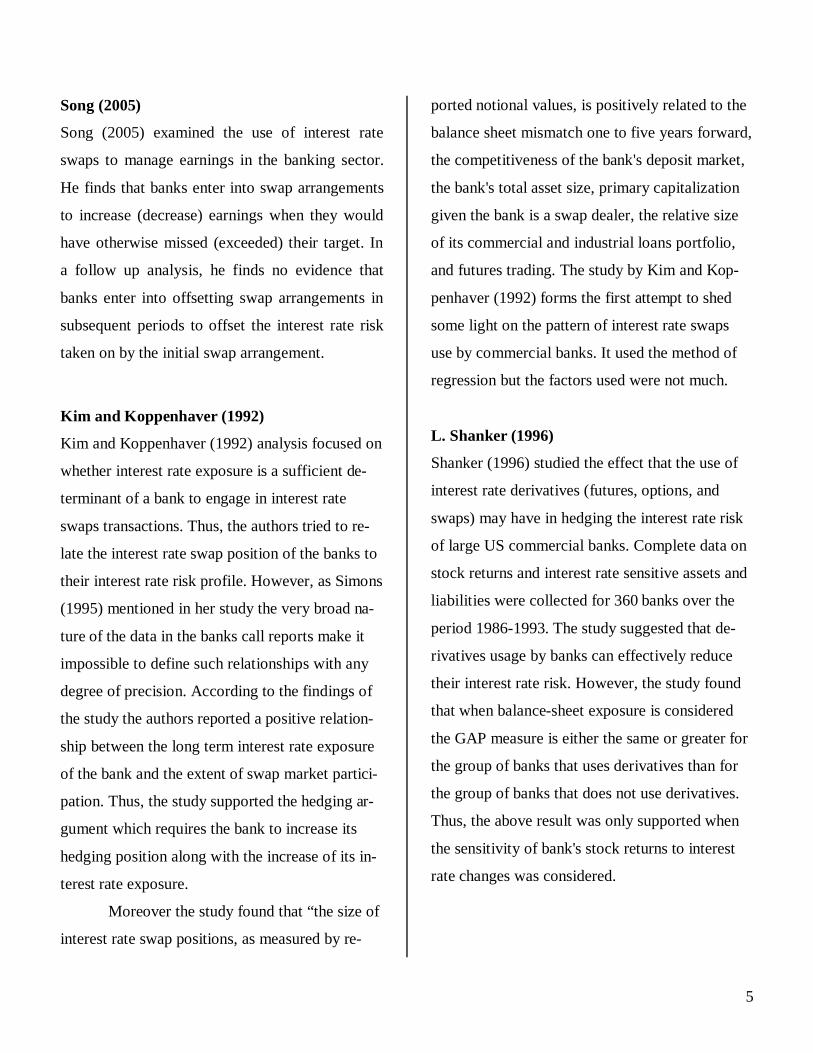
Table 1: Usage of variables by different papers
The variables that may be important in explaining
the use of interest rate swaps for asset liability
management purposes of a commercial bank, for
the purpose of this study, are presented below.
Note that all the data that forms the explanatory
variables of this study were gathered from the
consolidated balance sheets and the income
statements of the banks under examination by
searching through the annual reports of each bank
or looking up on Bloomberg Terminal. The list of
banks and their websites was retrieved from
Bloomberg Terminal.
Bank specific characteristics
• Bank’s size
The variable Total Assets is used to account for
the size of the Bank. It can be seen from the above
table that all the papers on this subject have used
the same variable and hence there is no ambiguity
in selection of this variable.
The bank’s size was taken into account as
research has shown the importance of size in
banks' use of futures (Koppenhaver, 1990), swaps
(Kim & Koppenhaver, 1993), and interest-rate
derivatives (Carter & Sinkey, 1998; Gunther &
Siems, 1996). Large banks due to their large size
may exploit economies of scales using swaps as
an asset-liability tool because of more expertise
and credit worthiness in the a\swap markets.
According to Kim and Koppenhaver (1992. p.63-
64) large banks are in a position to utilize special-
ized management skills to manage effectively an
off balance-sheet activity as swap market partici-
pation. Therefore, size seems to be an important
variable in explaining the characteristics of bank
using swap and thus, total assets is included as an
independent variable for the model. If the analysis
reveals that this variable is significant, it can be
deduced that there are barriers to entry in the
swaps market, and that size gives an advantage to
large entities that use interest rate swaps for asset
liability management activities.

9
Hypothesis
H10: There is no relationship between the usage
of interest rate swaps as an asset liability man-
agement tool and the size of the bank.
H11: A significant relationship exists between the
usage of interest rate swaps as an asset liability
management tool and the size of the bank.
• Bank’s Creditworthiness
The ratio of the Non Performing Assets (NPA)
to the total assets, accounts for the creditworthi-
ness or asset quality of a given bank. This ratio
gives the percentage of bad loans with respect to
the total loans given. Banks with relatively poor
asset quality (as measured by high levels of Non
Performing Assets to total assets), will need to
conserve capital and may find interest rate swaps
as a more desirable, capital efficient way to man-
age their balance sheet.
Hypothesis
H20: There is no relationship between the usage
of interest rate swaps as an asset liability man-
agement tool and the NPA ratio of the bank.
H21: There is a significant relationship between
the usage of interest rate swaps an asset liability
management tool and the NPA Ratio of the bank.
• Bank’s Capitalization
The equity to assets ratio is used to find out the
capitalization for a bank. This is in accordance
with most of the papers on this subject as can be
seen in the table given above. As the capital of a
bank increases, the bank’s risk handling ability
increases and hence the need for use of interest
rate swap (for hedging purposes) decreases.
Hence to investigate this relationship the variable
equity to assets ratio has been included in the
model. Moreover, Kim and Koppenhaver (1992)
also point out bank capital is an important dimen-
sion that has to be considered when choosing to
participate in swaps market.
Hypothesis
H30: There is no relationship between the usage
of interest rate swaps as an asset liability man-
agement tool and the equity to assets ratio of the
bank.
H31: There is a significant relationship between
the usage of interest rate swaps an asset liability
management tool and the equity to assets ratio of
the bank.
• Bank’s Interest rate risk exposure
The ratio of net interest income (the difference
between interest income and interest expenses) to
total income (appears in the income statement as
net income: the sum of net interest income and net
non-interest income) is used to measure the inter-
est rate risk exposure of the bank without taking
the interest rate swap into consideration. This
measure is included unlike the GAP measures
used by other studies (Kim and Koppenhaver,
1992; Simons, 1995) in order to avoid a major


11
match a bank may open a position in the interest
rate swaps.
Hypothesis
H60: There is no relationship between the usage
of interest rate swaps as an asset liability man-
agement tool and the Stock Price of the bank.
H61: A significant relationship exists between the
usage of interest rate swaps as an asset liability
management tool and the Stock Price of the bank.
Economy specific characteristics
• Stock Market index performance
The market index of the most prominent stock
exchange of a country is used as a measure of the
market performance of the country. With the
change in the market performance of the econ-
omy, the assets side of the bank’s balance sheet
may change. This may cause an asset liability
mismatch in the bank’s balance sheet. To care of
this mismatch a bank may open a position in the
interest rate swaps.
Hypothesis
H70: There is no relationship between the usage
of interest rate swaps as an asset liability man-
agement tool for a bank and the market index of
the stock exchange of the country.
H71: A significant relationship exists between the
usage of interest rate swaps as an asset liability
management tool for a bank and the market index
of the stock exchange of the country.
• Interest rate volatility
The ratio of standard deviation to mean of the
interest rate of an economy is used as a measure
of the market performance of the country. The
measure of the deviation of the interest rate with
respect to the mean interest rate is a safe measure
for the volatility of the markets (or interest rates).
Frequent changes in the interest rate of an econ-
omy will affect the positions of various banks in
the interest rate swaps.
Hypothesis
H80: There is no relationship between the usage
of interest rate swaps as an asset liability man-
agement tool for a bank and the interest rate vola-
tility of the country.
H81: A significant relationship exists between the
usage of interest rate swaps as an asset liability
management tool for a bank and the interest rate
volatility of the stock exchange of the country.
The summarization of all the above selection of
variables is done in the table given below:
Variable Used Representative for Total assets Size NPA/Total Assets Creditworthiness/Asset
Quality Equity-to-Assets Ratio Capitalization Net Interest Income / Total Income
Interest Rate Risk exposure
Profit before Tax / Total Assets
Profitability
Stock Price of Bank Bank’s Market Performance Market Index of stock ex-change of country
Market’s performance
Standard deviation/mean of the interest rate of country
Market Volatility
Table 2: Variables used for various parameters

12
Results
Descriptive statistics All the data is collected and converted into USD
for consistent results. Table given below provides
some preliminary descriptive statistics for the
variables used in the empirical analysis. A total of
80 observations of the banks have been used. The
notional principal of swaps used for asset liability
management averaged $505,209.69 million and
ranged from $911 million to $6,749,847 million.
The Bank size as measured by the assets size had
an average of $127,974 million, but most of the
banks in the sample have a lower amount of as-
sets. The largest bank in the sample is HSBC with
a total amount of assets of $1,860,758 million,
whereas the smallest bank was UTI Bank with
total assets of $4,049 million.
The Asset quality on an average is 1.22%
with a variation of 1.27%, representing the variety
in the types of the banks in the sample. The prof-
itability of BANCO ITAU bank is highest at
4.875% with the average profitability of the sam-
ple of the banks at only 1.56%.
In terms of Market index performance of each
country, the sample is very much varied with a
standard deviation of 4949.45 and with the best
valued index of Brazil at 20,818.6 in 2006 and
worst valued index of India at 70.39 in 2002.
Table 3: Descriptive summary of Bank Data
Vari-able
N Min Max Mean Std. Devia-tion
Total as-sets (Mil-lion USD)
80 4,049 1,860,758 127,974 294508.9684
NPA/Total Assets 80 0 0.05284 0.01223 0.012729715
Equity-to-Assets Ratio
80 0.00093 0.11928 0.04913 0.045089438
Net Inter-est Income / Total Income
80 0 0.75758 0.39461 0.192685056
Profit be-fore Tax / Total As-sets
80 0.00439 0.04875 0.01563 0.007468489
Stock Price of Bank
80 0.26264 36.23170 7.07589 6.86613013
Market Index of stock ex-change of country
80 70.3967 20,818.6 2,708.278 4949.453003
Standard devia-tion/mean of the in-terest rate of country
80 0.01870 0.21045 0.14132 0.056806605

13
Regression Results The data we have used to do regression is a time-
series data available for around 5 years for differ-
ent banks, which makes the sample data as cross-
sectional data. So we have used the Panel Regres-
sion to regress the interest rate swap notional val-
ues of the banks against the bank and economy
specific factors. Following Results were obtained:
Table 4: Regression Results Summary Table The R-square of the model equals 74.3% and the
R-square adjusted of the model equals to 71.5%,
which are both consistent. This means that 71.5%
of the changes in the interest rate swaps are due to
the variations of the independent variable used in
the model. This supports the good selection of the
proxies.
Analysis of Hypothesis Size of the Bank
The regression results in table shows that there is
a positive relationship between the use of interest
rate swaps and size. The variable's total asset co-
efficient has a positive sign and equals to 0.4325
in its regression coefficient and is a significant
variable. So we must reject the null hypothesis
and accept that ‘a significant relationship exists
between the usage of interest rate swaps as an
asset liability management tool and the size of
the bank’. It can be deduced that the size and the
expertise, as well as skill, that may be implicitly
available to large banks, give a comparative ad-
vantage to these entities in using interest rate
swaps for hedging and trading applications.
Creditworthiness
By using the NPA to total assets ratio as the vari-
able of the asset quality of the bank, the regres-
sion results in table shows that there is a negative
relationship between the use of interest rate swaps
and asset quality of the banks assets. The vari-
able's coefficient has a negative sign and equals to
Dependent Variable: INTEREST RATE SWAP
Method: Least Squares
White Heteroskedasticity - Consistent Standard Errors & Covariance
Included observations: 80
Variable Coefficient Std. Error t-Statistic Prob.
TOTALASS 0.432594 0.055559 7.786160 0.0000
CAPITAIS 1557281. 1048973. 1.484577 0.1424
PROFITAB 7096655. 3075197. 2.307708 0.0242
INTERSTR 219241.0 94472.64 2.320683 0.0234
CREDITWO -5576091. 1414314. -3.942612 0.0002
STOCKPRI -1704.937 2134.464 -0.798766 0.4273
MARKETIN -56.81285 54.22311 -1.047761 0.2986
INTERE_A -799486.7 363000.8 -2.202438 0.0311
R-squared 0.742724 Mean dependent var 76707.22
Adjusted R-squared 0.715437 S.D. dependent var 176841.9
S.E. of regression 94335.31 Akaike info criterion 25.84890
Sum squared resid 5.87E+11 Schwarz criterion 26.09799
Log likelihood -948.4095 Durbin-Watson stat 0.922159
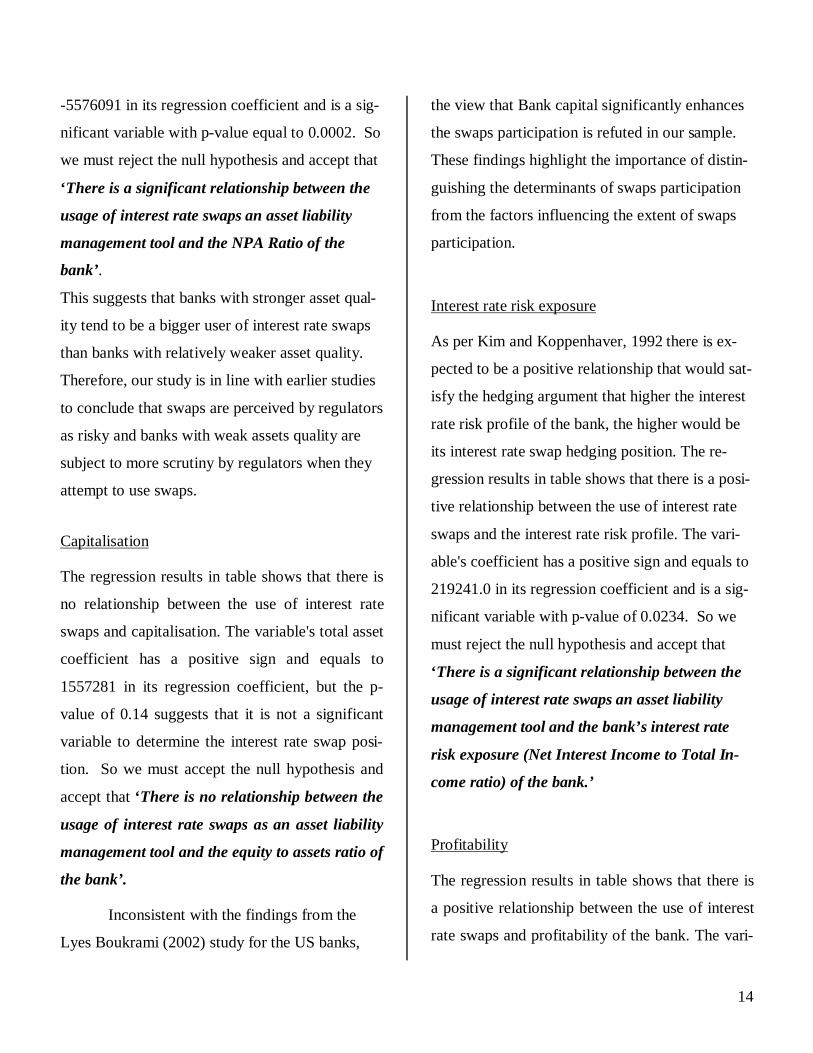
14
-5576091 in its regression coefficient and is a sig-
nificant variable with p-value equal to 0.0002. So
we must reject the null hypothesis and accept that
‘There is a significant relationship between the
usage of interest rate swaps an asset liability
management tool and the NPA Ratio of the
bank’.
This suggests that banks with stronger asset qual-
ity tend to be a bigger user of interest rate swaps
than banks with relatively weaker asset quality.
Therefore, our study is in line with earlier studies
to conclude that swaps are perceived by regulators
as risky and banks with weak assets quality are
subject to more scrutiny by regulators when they
attempt to use swaps.
Capitalisation
The regression results in table shows that there is
no relationship between the use of interest rate
swaps and capitalisation. The variable's total asset
coefficient has a positive sign and equals to
1557281 in its regression coefficient, but the p-
value of 0.14 suggests that it is not a significant
variable to determine the interest rate swap posi-
tion. So we must accept the null hypothesis and
accept that ‘There is no relationship between the
usage of interest rate swaps as an asset liability
management tool and the equity to assets ratio of
the bank’.
Inconsistent with the findings from the
Lyes Boukrami (2002) study for the US banks,
the view that Bank capital significantly enhances
the swaps participation is refuted in our sample.
These findings highlight the importance of distin-
guishing the determinants of swaps participation
from the factors influencing the extent of swaps
participation.
Interest rate risk exposure
As per Kim and Koppenhaver, 1992 there is ex-
pected to be a positive relationship that would sat-
isfy the hedging argument that higher the interest
rate risk profile of the bank, the higher would be
its interest rate swap hedging position. The re-
gression results in table shows that there is a posi-
tive relationship between the use of interest rate
swaps and the interest rate risk profile. The vari-
able's coefficient has a positive sign and equals to
219241.0 in its regression coefficient and is a sig-
nificant variable with p-value of 0.0234. So we
must reject the null hypothesis and accept that
‘There is a significant relationship between the
usage of interest rate swaps an asset liability
management tool and the bank’s interest rate
risk exposure (Net Interest Income to Total In-
come ratio) of the bank.’
Profitability
The regression results in table shows that there is
a positive relationship between the use of interest
rate swaps and profitability of the bank. The vari-

15
able's coefficient has a positive sign and equals to
7096655 in its regression coefficient. Profitability
of a bank comes out to be a significant variable in
the usage of interest rate swap with p-value
0.0242. So we must reject the null hypothesis and
accept that ‘A significant relationship exists be-
tween the usage of interest rate swaps as an asset
liability management tool and the Income before
Taxes to Total Assets ratio of the bank’.
Bank’s Stock market performance
The regression results in table shows that there is
no relationship between the use of interest rate
swaps and Stock Price of the bank. The variable's
coefficient has a negative sign and equals to -
1704.937 in its regression coefficient, but the p-
value of 0.4276 suggests that it is not a significant
variable to determine the interest rate swap posi-
tion. So we must accept the null hypothesis and
accept that ‘There is no relationship between the
usage of interest rate swaps as an asset liability
management tool and the Stock Price of the
bank’.
Country’s Stock Market index performance
The regression results in table shows that there is
no relationship between the use of interest rate
swaps and Stock Market index. The variable's co-
efficient has a negative sign and equals to -56.81
in its regression coefficient, but the p-value of
0.2986 suggests that it is not a significant variable
to determine the interest rate swap position. So
we must accept the null hypothesis and accept that
‘There is no relationship between the usage of
interest rate swaps as an asset liability manage-
ment tool and the market index of the stock ex-
change of the country’.
Interest rate volatility
The regression results in table shows that there is
a negative relationship between the use of interest
rate swaps and interest rate volatility of the coun-
try. The variable's coefficient has a negative sign
and equals to 799486.7 in its regression coeffi-
cient. Interest rate volatility of a country comes
out to be a significant variable in the usage of in-
terest rate swap with p-value 0.0311. So we must
reject the null hypothesis and accept that ‘A sig-
nificant relationship exists between the usage of
interest rate swaps as an asset liability manage-
ment tool for a bank and the interest rate volatil-
ity of the stock exchange of the country.’

16
Key Interpretations & conclusions After analyzing the data of 20 top commercial
banks of some of the emerging markets, our study
sheds some light on the factors which influence
the use of interest rate swaps for asset liability
purpose by the banks. The study has found that
larger the bank, higher will be their position in the
interest rate swap market. This can also be attrib-
uted to the fact that larger the banks, better are the
technical expertise and better the customer rela-
tionship and hence easier for them to get involved
in swaps and derivative activities.
In addition, the study has found that banks with
better asset quality tend to be more intensive users
of interest rate swaps, than those with weaker as-
set quality. There is very little publicly available
information on the swap positions of banks. This
means that it is very difficult to estimate the expo-
sure of interest rate movements.
As per the earlier studies as the capital of a
bank increases, the bank’s risk handling ability
increases and hence the need for use of interest
rate swap (for hedging purposes) decreases. But
our study concludes that capitalization of the bank
is not much related to the interest rate swap posi-
tion in the market. The Study also concludes that
banks with higher profitability manage their risk
better than other banks and hence take bigger po-
sitions in the interest rate swap market. The con-
clusion that interest rate risk profile of the bank
has a consistent relationship with the use of inter-
est rate swaps came as per our expectations.
From the economic factors considered to
play an important role in the interest rate swap
positions of the banks, only the interest rate vola-
tility proved out to be a significant factor as fre-
quent changes in the interest rate of an economy
will have to be managed by banks, which affect
the positions of various banks in the interest rate
swaps. The stock price or stock market index are
not a factor in the banker’s decision to take posi-
tions in the interest rate swap market.
Irrespective of whether swaps are for
hedging or speculating, the positive relationship
between interest rate exposure and swap activity,
if it exists, may not imply that the market does not
care about the bank's risk and allow risky banks to
be more active as guarantors in the swap market.
Depending on the risk propensity of the institu-
tion, risk can be controlled using a wide variety of
techniques that fall into two broad categories,
namely direct and synthetic methods. Direct re-
structuring of the balance sheet involves the
changing of the contractual characteristics of the
bank‘s assets and liabilities in a way that a par-
ticular duration or maturity can be achieved. Since
direct restructuring may not be always possible or
desired, the synthetic method comes to comple-
ment the drawbacks of the direct method and to
add a certain degree of flexibility to the asset li-
ability management process. The synthetic

17
method relies on the use of capital markets in-
struments; such as interest rate swaps, interest rate
futures and interest rate options; and customized
agreements to alter the balance sheet risk expo-
sure. Among these instruments, interest rate
swaps are considered to be the most widely
used instrument for hedging against interest rate
risk.
Limitations One problem that we encountered during the
study is the limited disclosure of interest rate
swap information by the banks. Most of the banks
only disclose the notional amount of swaps in
their annual reports, which doesn’t provide com-
plete information about the risks of interest rate
swap transactions. Russian banks don’t disclose
their interest rate swap positions in their annual
reports. So there is a need of a more detailed dis-
closure by the banks.
Another limitation was the difficulty in
identifying the interest rate swap from other
swaps mentioned in the annual reports. In many
cases, interest rate swaps include plain vanilla
fixed for floating swaps, basis swaps, index-
amortizing swaps, and other, more exotic types of
swaps contracts. Different countries have different
disclosure norms and hence different level of in-
terest rate swap disclosure.
Studying the commercial banks of emerg-
ing markets made the information extraction a
little more difficult as the data disclosure is not
very high outside US banks. The language in
which banks in different countries disclose their
annual reports also limited the scope of our study.
For Example the Chinese banks couldn’t be stud-
ied because of annual reports being published in
Chinese language. We believe that in future more
disclosure information will be available in public
domain for interest rate swaps, which will make
the empirical study of the interest rate swap issues
by researchers more interesting and reliable.
About the Authors Prof. Jayadev M is a professor in the Finance
and Control at the Indian Institute of Management
Bangalore.
Chirag Thakral is a second-year student at the
Indian Institute of Management, Bangalore.
Sandeep Kumar is a second-year student at the
Indian Institute of Management, Bangalore

18
References 1. Ahmed . A S Beatty. A, Takeda . C , (1997),
"Evidence on Interest risk management and derivatives usage by commercial banks", working paper, University of Rochester, NY.
2. Arnold, T.S. (1984). “How To Do Interest
Rate Swaps”, Harvard Business Review. Sep-tember/October, pp. 96-101.
3. Aspinwall, R. (1982). “Managing Interest
Rate Risk.“ In: Proceedings of a Conference on bank structure and Competition. Chicago: Federal Reserve Bank of Chicago, pp.463-470.
4. Badger, P. (1995), “Financial insurance, Inter-
est Rate Risk, and Derivatives”, Bankers Magazine, volume 178, number 3, May/June. p.32-37.
5. Barton, J. “Doe the Use of Financial Deriva-
tives Affect Earnings Management Deci-sions?" The Accounting Review 76 (2005): 1-26.
6. Bicksler, J. and Chen, A.H. (1986). “An Eco-
nomic Analysis of Interest Rate Swaps“. Jour-nal of Finance, volume 41, July, pp. 645-655.
7. Carter.D.A & Sinkey J.F , (1996); " An em-
pirical investigation into the use of interest rate derivatives by US commercial banks. Working paper. Athens, GA: University of Georgia.
8. Carter.D.A & Sinkey J.F , (1998); " The use
of interest rate derivative by end users: the case of large community banks, Journal of Fi-nancial Services Research 14 pp17-34.
9. Colquitt. L.L & Hoyt. R.E, (1997), "Determi-
nants of corporate hedging behaviour," Jour-nal of Risk and Insurance, Vol 64
10. Flannery. M.J & James. C.M, (1984), "The effects of interest rate changes on the common stock returns of financial institutions," Journal of Finance, Vol 39, pp 1141-1153.
11. Felgran, S.D. (1987). “Interest Rate Swaps:
Use, Risk. and Prices”, New England Eco-nomic Review. November/December, pp. 22-32.
12. Geczy. C, Minton. B.A, and Schrand. C,
(1997), "Why firms use currency derivatives," Journal of Finance, Vol 52, pp1323-1354.
13. Goodman, Laurie S., (1990) “The use of in-
terest rate swaps in managing corporate li-abilities”, Journal of Applied Corporate Fi-nance, 2 (4), 35-47.
14. Gunther. J.W, & Siems. T.F, (1996), "the like-
lihood and extent of bank participation in de-rivatives activities," Financial Industry Stud-ies, Federal Reserve Bank of Dallas, Dallas, TX.
15. Haight, T.G. and Kehly, J.C.Jr. (1995). “The
Role of Derivatives as an Asset/Liability Management Tool”. Bankers Magazine, vol-ume 178, number 3, May/June, p.22-26.
16. Jagtiani, J. (1996). “Characteristics of Banks
that are More Active in the Swap Market”. Journal of Financial Services Research, vol-ume 10, pp. 131-141.
17. Jong and Driessen (1999) "LIBOR versus
Swap Market Models: An Empirical Compari-son", European Finance Review, 5(3), 201-237.
18. Kim, S. and Koppenhaver, G.D. (1992). ‘An Empirical Analysis of Bank Interest Rate Swaps”. Journal of Financial Services Re-search. volume 7. number 1. pp. 57-72
19. Kangis. P, Elgar. J and Haar L, (1998), "The
use of Derivatives Instruments for Hedging
19
Purposes," Journal of Financial Services Mar-keting, Vol 3, No 1, p 81.
20. Kuprianov, Anatoli. (Summer 1994) The role
of interest rate swaps in corporate finance, Economic Quarterly, 80, 49-68.
21. Kwan. S.H, (1991), "Re-examination of inter-
est rate sensitivity of commercial banks stock returns using of random-coefficient model," Journal of Financial Services Research, Vol 5, pp 61-76.
22. Litzenberger, R.H. (1992). “Swaps: Plain and
Fanciful”. Journal of Finance, volume 47, number 3, pp. 831-850.
23. Loeys, G.J. (1985). “Interest Rate Swaps: A
New Tool for Managing Risk“. Federal Re-serve Bank of Philadelphia, Business Review, May/June, pp. 17-25.
24. Lyes, Boukrami (2002), “The Use of Interest
Rate Swaps by Commercial Banks”, Man-chester Metropolitan University
25. Remolona E.M. and P.D. Wooldridge (2003)
‘The Euro Interest Rate Swap Market’, BIS Quarterly Review, March.
26. Ronn.E.L, Verma. A.K, (1986)," Pricing the risk adjusted: An option based model," Jour-nal of Finance, Vol 41, pp 871-896.
27. Rudnick, L.T. (1987). “Discussion of Practical
Aspects of Interest Rate Swaps”. In Proceed-ings of a Conference on Bank Structure and Competition. Chicago: Federal Reserve Bank of Chicago, pp. 206-213.
28. Sinkey. J.F and Carter. D.A, (1997), " Evi-
dence on Financial Characteristics of banks that do and do not use derivatives," Working Paper, University of Georgia, Athens.
29. Smith Clifford W and Rene Stulz, (1985), "
The Determinants of Firms' Hedging Poli-
cies", Journal of Financial and Quantitative Analysis 20 , No . 4, pp. 583-601.
30. Shanker, L. (1996). “Derivatives Usage and
Interest Rate Risk of Large Banking Firms”. The Journal of Futures Markets, volume 16, number 4, pp. 459-474.
31. Simons, K. (1993). “Interest Rate Structure
and the Credit Risk of Swaps”. New England Economic Review, July/August, pp. 23-34.
32. Simons, K. (1995). “Interest Rate Derivatives
and Asset-Liability Management by Commer-cial Banks”. New England Economic Review, January, February, p.l7-28.
33. Smith, C. W., Smithson, C.W., Wakeman,
L.M. (1988). “The market for interest rate swaps”. Financial Management 17, (4), 34 -44, Winter.
34. Song, C. J. “Are Interest Rate Swaps Used to
Manage Bank Earnings?" Working paper, Michigan State University, 2005.
35. Sun, T.S., Sundaresan, S., and Wang, C.
(1993). “Interest Rate Swaps: An empirical Investigation”. Journal of Financial Econom-ics, volume 34, number 1, pp. 77-99.
36. Venkatachalam M. “Value-Relevance of
Banks’ Derivatives Disclosures.” Journal of Accounting and Economics 22 (1996)
37. Wright, W.M. and Houpt, J.V. (1996). “An
Analysis of Commercial Bank Exposure to in-terest Rate Risk”. Federal Reserve Bulletin, volume 82, number 2, February, p.l15-128.
38. Yu, W.T. and Pang, W.K. and Li, L.K. (2002)
“Borrowing cost reduction by interest rate swaps––an option pricing analysis,” Euro-pean Journal of Operational Research 154 (2004) 764–778.
39. Bloomberg Database