use of green facades in sustainable … · abstract: green facades are an attractive option for...
TRANSCRIPT

363
International Conference on Sustainable Built Environment (ICSBE-2010)
Kandy, 13-14 December 2010
Abstract: Green facades are an attractive option for sustainable built environments. Their use is well documented for much of the developed world. It is an irony that although tropical creepers are ever green, quick growing and lush, their use as facades in developing nations is limited. In this study, we present results from two facades. The first a controlled façade draped with Passion flower creepers is exposed to clean unpolluted air within the School of Mechanical and Building sciences, VIT University . The second identical façade, also draped with the same creeper, is exposed to varying levels of SOx, NOx and Suspended Particulate Matter at a busy traffic junction on Katpadi road Vellore , In Tamilnadu, India . Sensitivity studies shall be presented based on the deposition pattern of pollutants on these two facades. Scanning Electron Micrographs will elucidate the mechanistic details of the deposition patterns of suspended particulate matter, whilst liquid extraction methods coupled with Spectrophotometric analyses will reveal the concentrations of sulphates and nitrates assimilated by the stoma and the mesophilic tissues from street pollution. Finally, results from a computational model will be presented enabling one to calculate the deposition velocities of SOx and NOx on to the facades.
USE OF GREEN FACADES IN SUSTAINABLE BUILDING ENVIRONMENTS: QUANTIFYING THE UPTAKE RATES OF AIR POLLUTANTS BY FACADES
DRAPED WITH TROPICAL CREEPERS.
V. Jacob Thottathil1, C. Balamuralikrishna2, S.Ghosh3
1 PhD student, School of Mechanical and Building Sciences, VIT University, Vellore. 1E-mail: [email protected], Telephone: +919500363276
2 Professor, School of Mechanical and Building Sciences, VIT University, Vellore.
2E-mail: [email protected], Telephone: +918124845155
3Senior Professor, School of Mechanical and Building Sciences, VIT University, Vellore 3Associate, School of Earth and Environment, University of Leeds, United Kingdom
3E-mail: [email protected], Telephone: +91 416 2202207

364
International Conference on Sustainable Built Environment (ICSBE-2010)
Kandy, 13-14 December 2010
Keywords: Green facades, Deposition Velocity, Oxides of Sulphur and Nitrogen, Passion Flower.
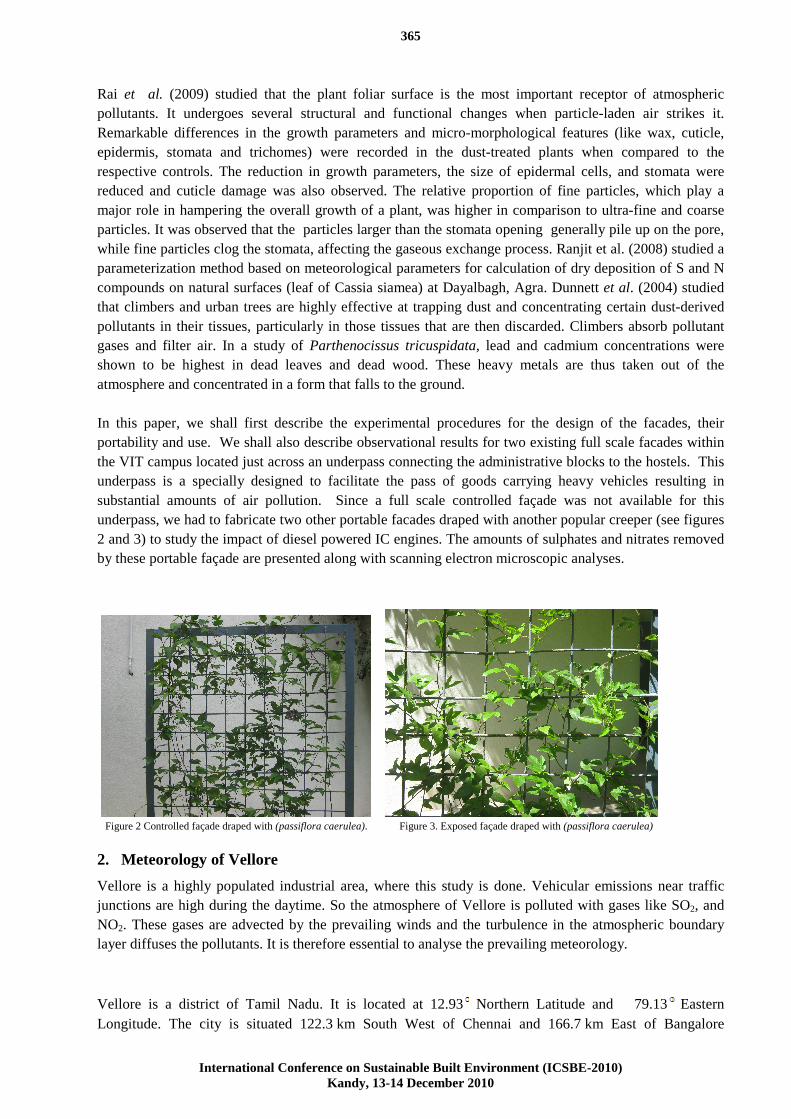
1. Introduction Green facades are a cladding system for buildings in which climbing plants, or in some cases trained shrubs, cover the surface of a building (see Figure1). Traditionally, self-clinging climbers have been used because they require no supporting network of wires or trellis. Modern facade greening, however, favors the use of climbers supported by steel cables or trellis, holding the plants away from the building surface-we have used such Facades (see Figures 2 and 3) for our experimental and theoretical analyses where we draped them with Passion Flower Creeper (passiflora caerulea)
The coastal district of Tamil Nadu experiences a hot humid climate, which is particularly favourable for the rapid growth of shrubs and creepers. In this study, the suitability of creepers on green facades is examined. These are not just aesthetically appealing; they are efficient removers of air pollutants. Green facades are an attractive option to reduce energy requirements in residential as well as office buildings.
Climbers can dramatically reduce the maximum temperatures of a building by shading walls from the sun. They can reduce the daily temperature fluctuation by as much as 50 percent, a fact of great importance in warm-summer climate zones. There is thus a contribution to the reduction of the heat island effect and dust generation. Evergreen climbers provide winter insulation, not only by maintaining a pillow of air between the plant and the wall, but by reducing wind chill on the wall surface. The use of evergreen climbers on walls that do not receive sunlight, on the other hand, helps reduce heat loss in winter. One third of a house's demand for winter heating is generated by wind chill, at least in climates where cold-season winds are a regular feature. Reducing wind chill by 75 percent, facades draped with evergreen climbers reduce heating demand by 25 percent
Climbers on buildings can help protect the surface of the building from damage from very heavy rainfall and hail and may play some role in intercepting and temporarily holding water during rainstorms, in the way that green roofs do. Climbers absorb pollutant gases and filter air. They also help to shield the surface from acid rain, which might be an important consideration for certain traditional as well as modern cladding materials.
Figure1. Green Facades in VIT University, Vellore, Tamil Nadu
365
International Conference on Sustainable Built Environment (ICSBE-2010)
Kandy, 13-14 December 2010
Rai et al. (2009) studied that the plant foliar surface is the most important receptor of atmospheric pollutants. It undergoes several structural and functional changes when particle-laden air strikes it. Remarkable differences in the growth parameters and micro-morphological features (like wax, cuticle, epidermis, stomata and trichomes) were recorded in the dust-treated plants when compared to the respective controls. The reduction in growth parameters, the size of epidermal cells, and stomata were reduced and cuticle damage was also observed. The relative proportion of fine particles, which play a major role in hampering the overall growth of a plant, was higher in comparison to ultra-fine and coarse particles. It was observed that the particles larger than the stomata opening generally pile up on the pore, while fine particles clog the stomata, affecting the gaseous exchange process. Ranjit et al. (2008) studied a parameterization method based on meteorological parameters for calculation of dry deposition of S and N compounds on natural surfaces (leaf of Cassia siamea) at Dayalbagh, Agra. Dunnett et al. (2004) studied that climbers and urban trees are highly effective at trapping dust and concentrating certain dust-derived pollutants in their tissues, particularly in those tissues that are then discarded. Climbers absorb pollutant gases and filter air. In a study of Parthenocissus tricuspidata, lead and cadmium concentrations were shown to be highest in dead leaves and dead wood. These heavy metals are thus taken out of the atmosphere and concentrated in a form that falls to the ground. In this paper, we shall first describe the experimental procedures for the design of the facades, their portability and use. We shall also describe observational results for two existing full scale facades within the VIT campus located just across an underpass connecting the administrative blocks to the hostels. This underpass is a specially designed to facilitate the pass of goods carrying heavy vehicles resulting in substantial amounts of air pollution. Since a full scale controlled façade was not available for this underpass, we had to fabricate two other portable facades draped with another popular creeper (see figures 2 and 3) to study the impact of diesel powered IC engines. The amounts of sulphates and nitrates removed by these portable façade are presented along with scanning electron microscopic analyses.
Figure 2 Controlled façade draped with (passiflora caerulea). Figure 3. Exposed façade draped with (passiflora caerulea)
2. Meteorology of Vellore
Vellore is a highly populated industrial area, where this study is done. Vehicular emissions near traffic junctions are high during the daytime. So the atmosphere of Vellore is polluted with gases like SO2, and NO2. These gases are advected by the prevailing winds and the turbulence in the atmospheric boundary layer diffuses the pollutants. It is therefore essential to analyse the prevailing meteorology.
Vellore is a district of Tamil Nadu. It is located at 12.93 Northern Latitude and 79.13Eastern Longitude. The city is situated 122.3 km South West of Chennai and 166.7 km East of Bangalore
366
International Conference on Sustainable Built Environment (ICSBE-2010)
Kandy, 13-14 December 2010
(www.distancefromto.net). Vellore is on the plains surrounded by low, rocky hills. Temperature ranges from as low as 10°C in the winter months of December-February to even 43°C in the summer months of April-June. It has essentially a dry climate for the non-monsoon months. Precipitation usually happens during the months of June-August and October-December (www.fallingrain.com).
The seasonal maximum and minimum solar insolation and average temperature variations over Vellore are shown in table 1.
Table 1 Solar Insolation and Temperature variation over Vellore
Season Solar Insolation(W/m2)a at 2:30 p.m. Temperature(oC)b
Min. Max. Avg. high Avg. low
Midsummer(April) 107.9 664 36 26
Autumn(August) 234.6 602.4 35 26
Late Autumn(October) 146.7 564 32 24
Winter(December) 78.3 537.6 29 22
Spring(February) 164.7 616 31 22 aSource: Weather data 2008-09 bSource: www.weather.msn.com
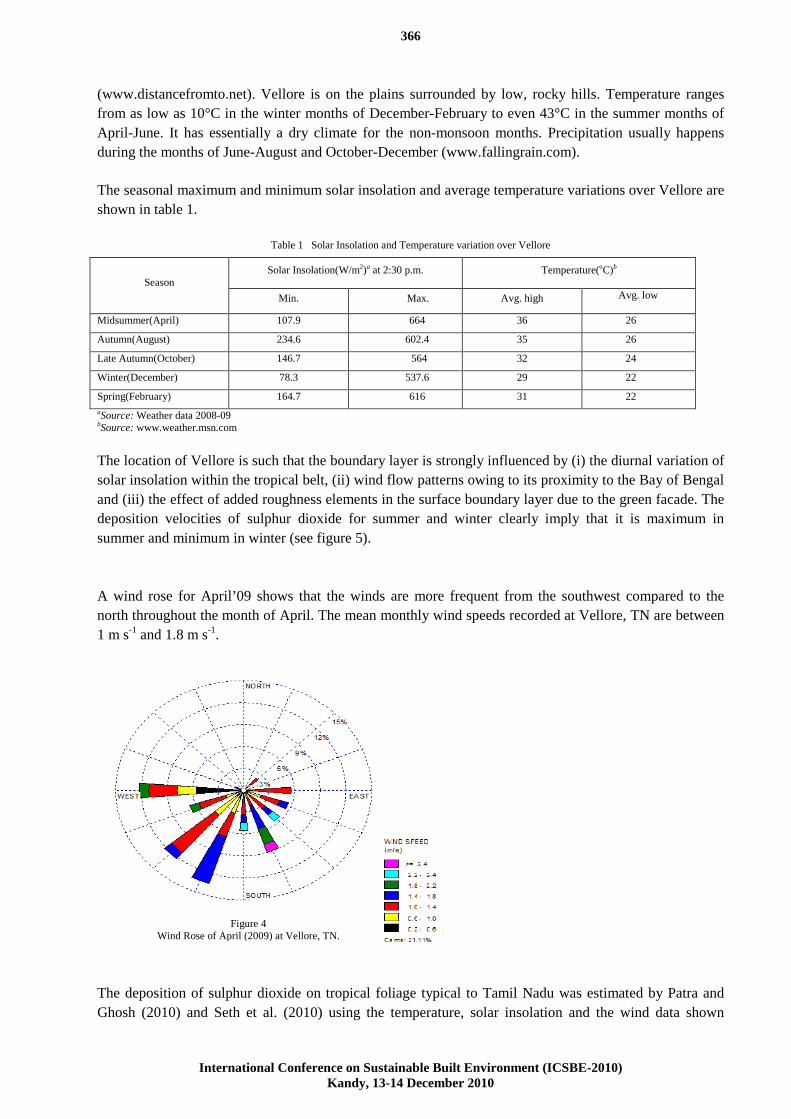
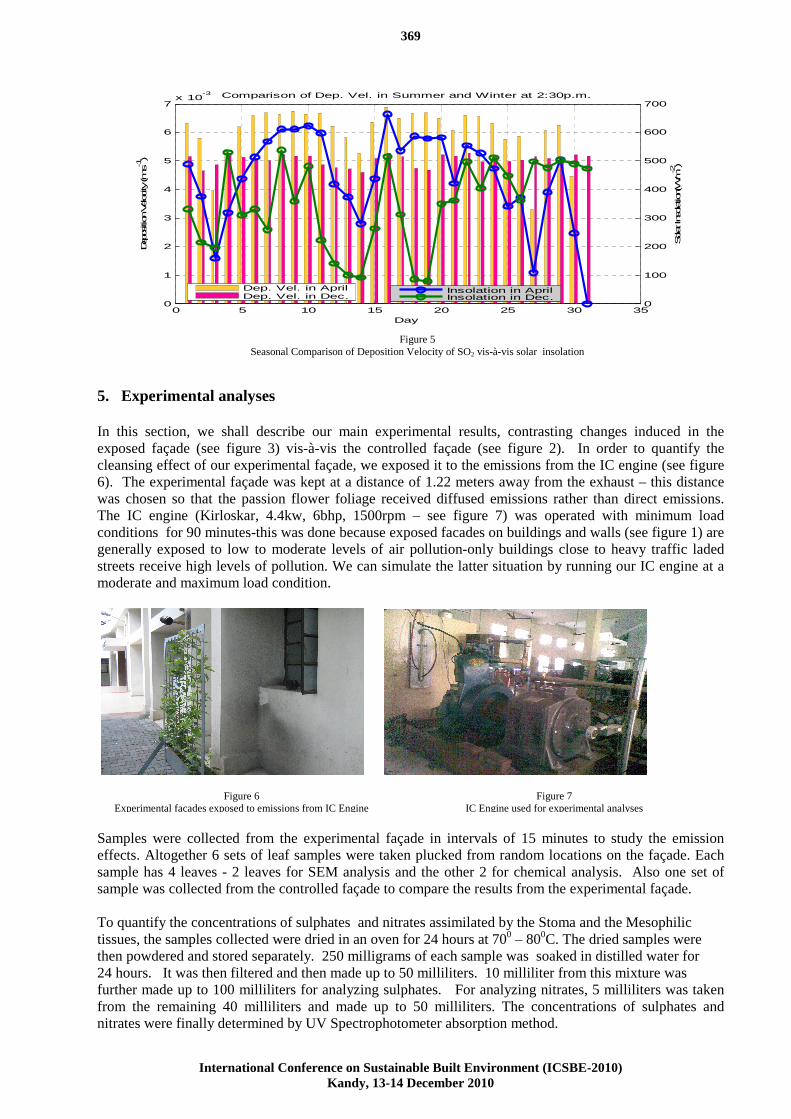
The location of Vellore is such that the boundary layer is strongly influenced by (i) the diurnal variation of solar insolation within the tropical belt, (ii) wind flow patterns owing to its proximity to the Bay of Bengal and (iii) the effect of added roughness elements in the surface boundary layer due to the green facade. The deposition velocities of sulphur dioxide for summer and winter clearly imply that it is maximum in summer and minimum in winter (see figure 5). A wind rose for April’09 shows that the winds are more frequent from the southwest compared to the north throughout the month of April. The mean monthly wind speeds recorded at Vellore, TN are between 1 m s-1 and 1.8 m s-1.
The deposition of sulphur dioxide on tropical foliage typical to Tamil Nadu was estimated by Patra and Ghosh (2010) and Seth et al. (2010) using the temperature, solar insolation and the wind data shown
Figure 4 Wind Rose of April (2009) at Vellore, TN.
367
International Conference on Sustainable Built Environment (ICSBE-2010)
Kandy, 13-14 December 2010
above. This involved a detailed calculation of the binary diffusion coefficient of sulphur dioxide in air using Lennard – Jones model and will not be described here. However we discuss below the theory of resistances used in the present study.
3. Theory of Resistances
In the universally used formulation for dry deposition, it is assumed that the deposition flux is directly proportional to the local concentration C of the depositing species, at some reference height above the surface (e.g., 10 m or less): F=-vdC (1) F represents the vertical dry deposition flux, the amount of material depositing to a unit surface area per unit time. The proportionality constant between flux and concentration, vd, has units of length per unit time and is known as deposition velocity. By convention, a downward flux is negative, so that vd is positive for a depositing substance (Seinfeld et al., 1997) The process of dry deposition of gases and particles generally consists of Aerodynamic, Quasi-laminar and Canopy resistances.
3.1 Aerodynamic Resistance
Turbulent transport is the mechanism that brings material from the bulk atmosphere down to the surface and therefore determines the aerodynamic resistance. The aerodynamic resistance ( Ra ) for gases (Voldner et al., 1986) in neutral and stable conditions is calculated by ra = 4( u )-1 (2) and in unstable conditions by ra=9(u )-1 (3) where, u= mean wind speed and = standard deviation of wind direction. It was assumed that the atmospheric was stable in winter and unstable during the summer and the monsoon.
3.2 Quasi Laminar Resistance Adjacent to the surface there exists a quasi-laminar layer, across which the resistance to transfer depends on the molecular properties of the substance and the surface characteristics. The quasi-laminar layer resistance for a gas in terms of the Schmidt number is given by (Wesely, 1989),
(4)
where, the dimensionless Schmidt number, Sc = v/D ( v is the kinematic viscosity of air and D is the molecular diffusivity of the species) and is the friction velocity.
3.3 Canopy or Surface Resistance The surface or canopy resistance rc poses the greatest computational complexity. rc is assumed to be zero for particles and thus in developing a model for rc we need consider only gases. The approach adopted here is based primarily on the methodology developed by Wesely (1989) for regional-scale modelling over a range of species, land-use types, and seasons. The surface resistance is calculated from individual resistances by the following equation:
= (5)
where the first term includes the leaf stomatal ( rst ) and mesophyllic ( rm ) resistances, the second term is the outer surface resistance in the upper canopy ( r lu ), which includes the leaf cuticular resistance in healthy vegetation and other outer surface resistances; the third term is the resistance in the lower canopy, which includes the resistance to transfer by buoyant convection (rdc) and the resistance to uptake by leaves, twigs, and other exposed surfaces ( rcl ); and the fourth term is the resistance at the ground, which includes a transfer resistance ( rac ) for processes that depend only on the canopy height and a resistance for uptake by the soil, leaf litter, and so on at the ground surface ( rgs ).
368
International Conference on Sustainable Built Environment (ICSBE-2010)
Kandy, 13-14 December 2010
The bulk canopy stomatal resistance (for a Passion flower type foliage) is calculated from tabulated values of r j (where rj is the minimum bulk canopy stomatal resistance for water vapour) , the solar radiation ( G in W m-2 ), and surface air temperature ( Ts in oC between 0 and 40 oC ) using
= (6)
Outside this range, the stomata are assumed to be closed and rst is set to a large value. The combined minimum stomatal and mesophyllic resistance is calculated from
= + = (7)
where is the ratio of the molecular diffusivity of water to that of the specific gas, is
the effective Henry’s law constant for gas (for SO2, = 1 X 10⁵ M atm-1 ), and is a normalized reactivity factor (between 0 and 1) for the dissolved gas. The second term on the R.H.S of (14) is the mesophyllic resistance for the gas. The resistance of the outer surfaces in the upper canopy for a specific gas is computed from
= (8)
where r lu is tabulated for midsummer and winter conditions from Wesley (1989). The resistance rdc is determined by the effects of mixing forced by buoyant convection and is estimated from
(9)
where is the slope of the local terrain in radians. The resistance of the exposed surfaces in the lower portions of structures ( canopies or buildings) is computed from
(10)
Similarly, at the ground, the resistances are computed from
(11)
4. Estimation of Deposition Velocity
Having obtained the values for all the resistances, we now proceed to the quantification of the dry deposition velocity of SO2 on vegetation draped surface. The total resistance, r t, to deposition of a gaseous species is the sum of the three individual resistances described earlier and is, by definition, the inverse of the deposition velocity: vd
-1=r t=ra+rb+rc (12) The most important factors that modulate values of the deposition velocity are the wind velocity and the solar insolation (see figure 5) which is the highest during April–a reflection on higher SO2 uptake rates by the profusion of green leaves during summer. Though both solar insolation and wind velocity influence the value of deposition velocity, the vd values are most influenced by solar insolation and we show the solar insolation dependent vd. variability (see figure 5)
369
International Conference on Sustainable Built Environment (ICSBE-2010)
Kandy, 13-14 December 2010
0 5 10 15 20 25 30 350
1
2
3
4
5
6
7x 10
-3
Day
Dep
osition
Veloc
ity (m s-1)
Solar Ins
olation(W m
-2)
Comparison of Dep. Vel. in Summer and Winter at 2:30p.m.
0
100
200
300
400
500
600
700
Dep. Vel. in AprilDep. Vel. in Dec.
Insolation in AprilInsolation in Dec.
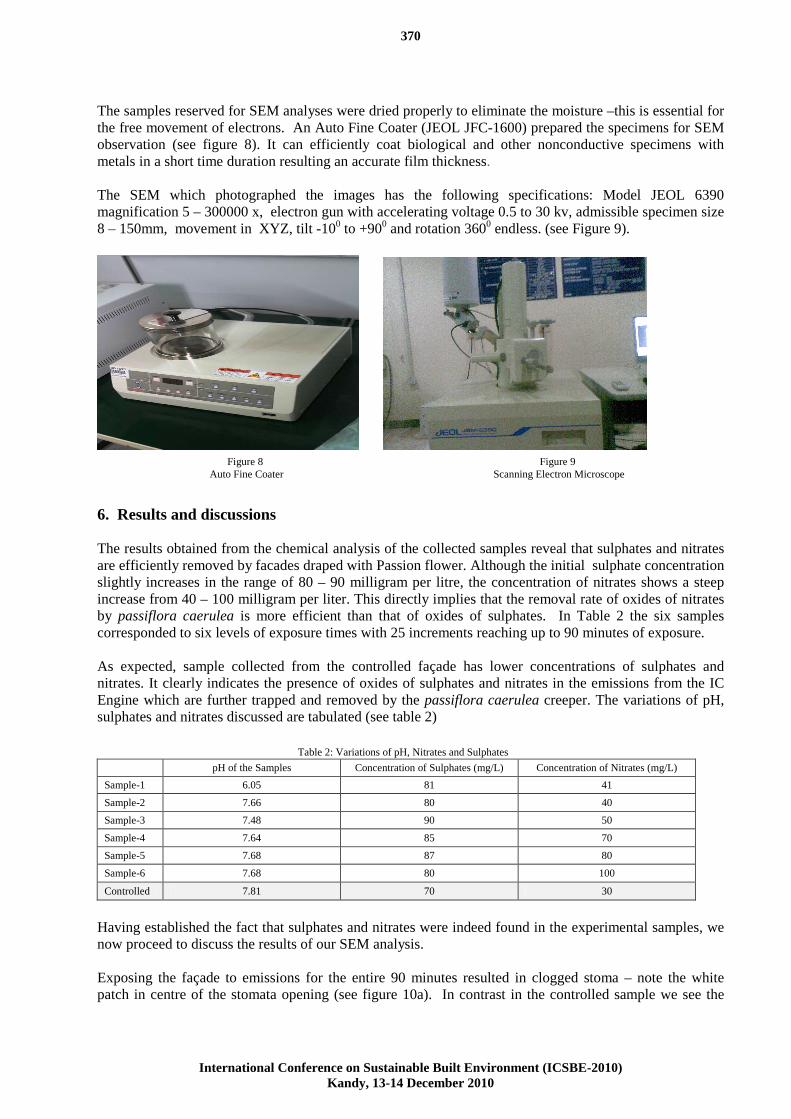
5. Experimental analyses In this section, we shall describe our main experimental results, contrasting changes induced in the exposed façade (see figure 3) vis-à-vis the controlled façade (see figure 2). In order to quantify the cleansing effect of our experimental façade, we exposed it to the emissions from the IC engine (see figure 6). The experimental façade was kept at a distance of 1.22 meters away from the exhaust – this distance was chosen so that the passion flower foliage received diffused emissions rather than direct emissions. The IC engine (Kirloskar, 4.4kw, 6bhp, 1500rpm – see figure 7) was operated with minimum load conditions for 90 minutes-this was done because exposed facades on buildings and walls (see figure 1) are generally exposed to low to moderate levels of air pollution-only buildings close to heavy traffic laded streets receive high levels of pollution. We can simulate the latter situation by running our IC engine at a moderate and maximum load condition.
Samples were collected from the experimental façade in intervals of 15 minutes to study the emission effects. Altogether 6 sets of leaf samples were taken plucked from random locations on the façade. Each sample has 4 leaves - 2 leaves for SEM analysis and the other 2 for chemical analysis. Also one set of sample was collected from the controlled façade to compare the results from the experimental façade. To quantify the concentrations of sulphates and nitrates assimilated by the Stoma and the Mesophilic tissues, the samples collected were dried in an oven for 24 hours at 700 – 800C. The dried samples were then powdered and stored separately. 250 milligrams of each sample was soaked in distilled water for 24 hours. It was then filtered and then made up to 50 milliliters. 10 milliliter from this mixture was further made up to 100 milliliters for analyzing sulphates. For analyzing nitrates, 5 milliliters was taken from the remaining 40 milliliters and made up to 50 milliliters. The concentrations of sulphates and nitrates were finally determined by UV Spectrophotometer absorption method.
Figure 6 Experimental facades exposed to emissions from IC Engine
Figure 7 IC Engine used for experimental analyses
Figure 5 Seasonal Comparison of Deposition Velocity of SO2 vis-à-vis solar insolation
370
International Conference on Sustainable Built Environment (ICSBE-2010)
Kandy, 13-14 December 2010
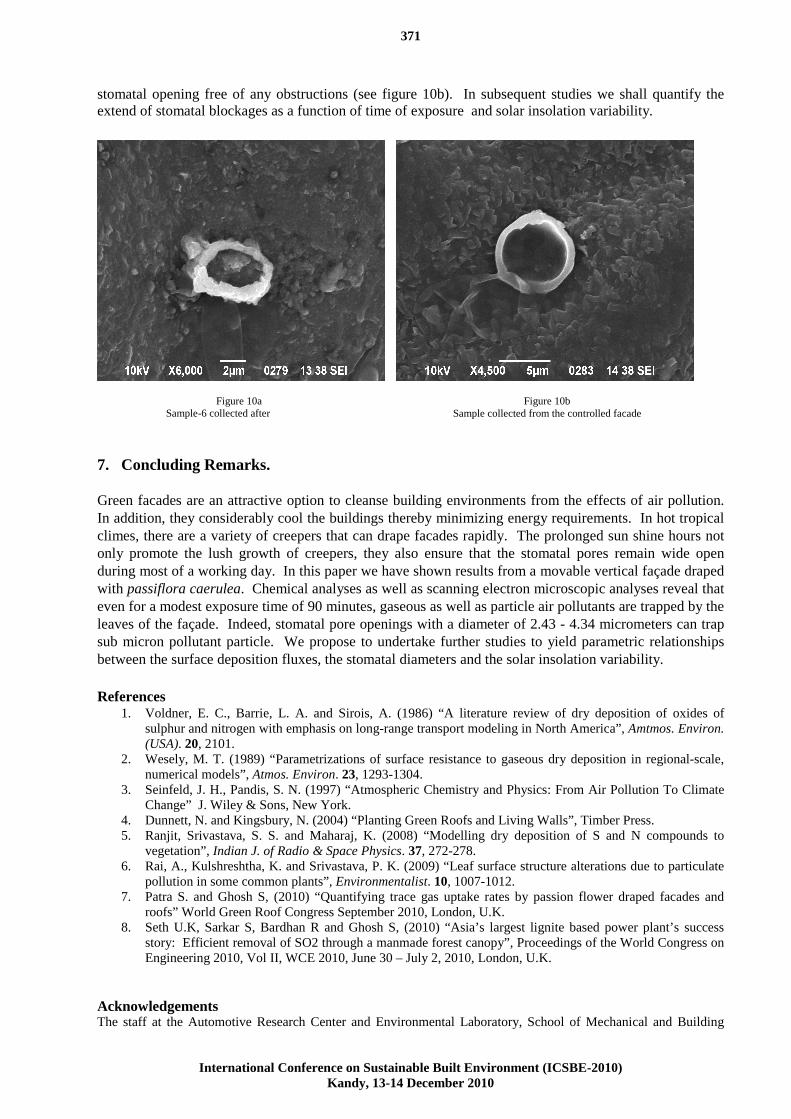
The samples reserved for SEM analyses were dried properly to eliminate the moisture –this is essential for the free movement of electrons. An Auto Fine Coater (JEOL JFC-1600) prepared the specimens for SEM observation (see figure 8). It can efficiently coat biological and other nonconductive specimens with metals in a short time duration resulting an accurate film thickness. The SEM which photographed the images has the following specifications: Model JEOL 6390 magnification 5 – 300000 x, electron gun with accelerating voltage 0.5 to 30 kv, admissible specimen size 8 – 150mm, movement in XYZ, tilt -100 to +900 and rotation 3600 endless. (see Figure 9).
6. Results and discussions The results obtained from the chemical analysis of the collected samples reveal that sulphates and nitrates are efficiently removed by facades draped with Passion flower. Although the initial sulphate concentration slightly increases in the range of 80 – 90 milligram per litre, the concentration of nitrates shows a steep increase from 40 – 100 milligram per liter. This directly implies that the removal rate of oxides of nitrates by passiflora caerulea is more efficient than that of oxides of sulphates. In Table 2 the six samples corresponded to six levels of exposure times with 25 increments reaching up to 90 minutes of exposure. As expected, sample collected from the controlled façade has lower concentrations of sulphates and nitrates. It clearly indicates the presence of oxides of sulphates and nitrates in the emissions from the IC Engine which are further trapped and removed by the passiflora caerulea creeper. The variations of pH, sulphates and nitrates discussed are tabulated (see table 2)
pH of the Samples Concentration of Sulphates (mg/L) Concentration of Nitrates (mg/L)
Sample-1 6.05 81 41
Sample-2 7.66 80 40
Sample-3 7.48 90 50
Sample-4 7.64 85 70
Sample-5 7.68 87 80
Sample-6 7.68 80 100
Controlled 7.81 70 30
Having established the fact that sulphates and nitrates were indeed found in the experimental samples, we now proceed to discuss the results of our SEM analysis. Exposing the façade to emissions for the entire 90 minutes resulted in clogged stoma – note the white patch in centre of the stomata opening (see figure 10a). In contrast in the controlled sample we see the
Figure 9 Scanning Electron Microscope
Figure 8 Auto Fine Coater
Table 2: Variations of pH, Nitrates and Sulphates
371
International Conference on Sustainable Built Environment (ICSBE-2010)
Kandy, 13-14 December 2010
stomatal opening free of any obstructions (see figure 10b). In subsequent studies we shall quantify the extend of stomatal blockages as a function of time of exposure and solar insolation variability.
7. Concluding Remarks. Green facades are an attractive option to cleanse building environments from the effects of air pollution. In addition, they considerably cool the buildings thereby minimizing energy requirements. In hot tropical climes, there are a variety of creepers that can drape facades rapidly. The prolonged sun shine hours not only promote the lush growth of creepers, they also ensure that the stomatal pores remain wide open during most of a working day. In this paper we have shown results from a movable vertical façade draped with passiflora caerulea. Chemical analyses as well as scanning electron microscopic analyses reveal that even for a modest exposure time of 90 minutes, gaseous as well as particle air pollutants are trapped by the leaves of the façade. Indeed, stomatal pore openings with a diameter of 2.43 - 4.34 micrometers can trap sub micron pollutant particle. We propose to undertake further studies to yield parametric relationships between the surface deposition fluxes, the stomatal diameters and the solar insolation variability. References
1. Voldner, E. C., Barrie, L. A. and Sirois, A. (1986) “A literature review of dry deposition of oxides of sulphur and nitrogen with emphasis on long-range transport modeling in North America”, Amtmos. Environ. (USA). 20, 2101.
2. Wesely, M. T. (1989) “Parametrizations of surface resistance to gaseous dry deposition in regional-scale, numerical models”, Atmos. Environ. 23, 1293-1304.
3. Seinfeld, J. H., Pandis, S. N. (1997) “Atmospheric Chemistry and Physics: From Air Pollution To Climate Change” J. Wiley & Sons, New York.
4. Dunnett, N. and Kingsbury, N. (2004) “Planting Green Roofs and Living Walls”, Timber Press. 5. Ranjit, Srivastava, S. S. and Maharaj, K. (2008) “Modelling dry deposition of S and N compounds to
vegetation”, Indian J. of Radio & Space Physics. 37, 272-278. 6. Rai, A., Kulshreshtha, K. and Srivastava, P. K. (2009) “Leaf surface structure alterations due to particulate
pollution in some common plants”, Environmentalist. 10, 1007-1012. 7. Patra S. and Ghosh S, (2010) “Quantifying trace gas uptake rates by passion flower draped facades and
roofs” World Green Roof Congress September 2010, London, U.K. 8. Seth U.K, Sarkar S, Bardhan R and Ghosh S, (2010) “Asia’s largest lignite based power plant’s success
story: Efficient removal of SO2 through a manmade forest canopy”, Proceedings of the World Congress on Engineering 2010, Vol II, WCE 2010, June 30 – July 2, 2010, London, U.K.
Acknowledgements The staff at the Automotive Research Center and Environmental Laboratory, School of Mechanical and Building
Figure 10a Sample-6 collected after 90minutes
Figure 10b Sample collected from the controlled facade

372
International Conference on Sustainable Built Environment (ICSBE-2010)
Kandy, 13-14 December 2010
Sciences, VIT University, helped in conducting the experiments.
About the Authors V. JACOB THOTTATHIL , B.E Industrial and Production, Mangalore University, Karnataka, M.Tech.(Honours) Manufacturing Technology, N.I.T. Calicut, Kerala, currently a research scholar at the School of Mechanical and Building Sciences, VIT University, Vellore, Tamil Nadu, India.
C. BALAMURALIKRISHNA, Dr. C. Balamuralikrishna, PhD. N.I.T Surathkal, Karnataka, is currently a professor at the School of Mechanical and Building Sciences, VIT University. He has more than 20 years of experience and serves as a leading consultant in the field of Environmental Engineering. S. GHOSH, Dr. Ghosh is currently a Senior Professor at the School of Mechanical and Building Sciences, VIT University. He is also an Associate member of the School of Earth and Environment, University of Leeds, U.K. He has spent about 20 years in the U.K. including 9 years at Cambridge University. His research areas include Cloud Microphysics, Aerosol Science, Two phase flows, Large Eddy Simulations. He is currently an Editor of ‘Atmospheric Science Letters’ published by the Royal Meteorological Society, U.K.

373
International Conference on Sustainable Built Environment (ICSBE-2010)
Kandy, 13-14 December 2010