usability engineering for gis: learning from a screenshot · refereed paper usability engineering...
TRANSCRIPT
R E F E R E E D P A P E R
Usability Engineering for GIS: Learning from aScreenshot
Mordechai (Muki) Haklay and Antigoni Zafiri
Department of Civil, Environmental and Geomatic Engineering, University College London (UCL), Gower St.
London WC1E 6BT
Email: [email protected]
In this paper, the focus is on the concept of Usability Engineering for GIS – a set of techniques and methods that are
especially suitable for evaluating the usability of GIS applications – which can be deployed as part of the development
process. To demonstrate how the framework of Usability Engineering for GIS can be used in reality, a screenshot study is
described. Users were asked to provide a screenshot of their GIS during their working day. The study shows how a simple
technique can help in understanding the way GIS is used in situ.
Keywords: Usability Engineering, Human–Computer Interaction, GIS, snapshot study
INTRODUCTION
Interest in Human–Computer Interaction (HCI) has beenpart of Geographical Information Science (GIScience) for along time. Long before the term GIScience was coined(Goodchild, 1992), and even before the term GeographicalInformation System (GIS) was invented (Tomlinson, 1967),researchers of ‘Man Machine Interaction’ at MIT wereutilising the display capabilities of the latest generation ofcomputers to manipulate oceanic geographical information –though, admittedly, the visualisation that was possible in theearly 1960s was of rudimentary points on a display monitor(Pivar et al., 1963). From this early start, HCI became anintegral part of the GIScience research agenda.
After a flurry of interest in the mid 1990s in the waycommon users, those that use GIS every day as part of theirworking life, use these systems (Traynor and Williams,1995; Davies and Medyckyj-Scott, 1996), HCI research inGIScience changed its emphasis. Today, the range of topicscovered by HCI research in GIScience includes deeperunderstanding of spatial cognition (Mark et al., 1999),development of novel interfaces (Blaser et al., 2000), andontology in spatial data (Fonseca et al., 2000) amongothers. This is a natural progression in a discipline whichestablished itself some 15 years ago with Goodchild’sseminal definition of the field as ‘Geographic InformationScience’, followed by a concerted intellectual effort todefine a coherent research agenda (Rhind, 1998;Goodchild, 1992; Mark, 2003; McMaster and Usery,2004). Indeed, three areas which are central in theGIScience research agenda are related to HCI: spatialcognition, spatial ontologies, and geographic visualisation(Geovisualisation).
While this current body of research is highly significant inadvancing the knowledge in Geographical InformationScience and is influential in the development of GIS practicein many ways, it seems that, in the process, the commonuser has been neglected, almost forgotten. There is lack ofresearch into the way GIS is used at the workplace, inschools, and at home. Moreover, the context and use ofGIS has changed dramatically since the studies of the early1990s and, today, the common user is one of the million orso people across the globe who works daily with GISsoftware, or one of the tens of millions of users who usespublic mapping sites – such as Google Maps or MapQuest –or uses digital geographical information in other forms,such as through Satellite Navigation Systems (Longley et al.,2001). We know very little about these users, and how todesign systems for them in a way that ensures that GIS isused effectively, efficiently, and enjoyably.
Significantly, the early studies, such as those that are includedin Medyckyj-Scott and Hearnshaw (1993) or Nyerges et al.(1995), focused on GIS use by engineers, draughtspersons, andscientists – specialised users who work in an environment wheretasks are well defined and the function of the system is fairlyclear. Today, the range of users has changed dramatically interms of educational attainment, the tasks which they perform,and the organisational settings within which GIS is used.Furthermore, GIS itself has changed significantly. When Daviesand Medyckyj-Scott (1996) conducted their research, GIS wasmainly command-line driven and run on UNIX workstations,whereas current systems rely on Graphical User Interface(GUI), large databases, and the Internet.
It is, therefore, somewhat ironic that, just as GIS becamemore commonplace at work and at home, there has been
The Cartographic Journal Vol. 45 No. 2 pp. 87–97 Use and Users Special Issue 2008# The British Cartographic Society 2008
DOI: 10.1179/174327708X305085
almost no research looking at how GIS is used in theseenvironments. For example, while web mapping sites havebeen in existence since 1994 (Putz, 1994), to our knowl-edge Skarlatidou and Haklay (2006) is the first publishedstudy in which public mapping sites were compared interms of their performance with users who are GIS novices(see also Nivala, 2007, Steinmann, 2004). The studyincluded 30 users, and examined 8 popular web mappingsites. The study has highlighted that, even in commercialsites where the revenue is generated by visitors andtherefore it is imperative to ensure that the sites are usableand accessible, there are many usability problems. Asignificant number of users (1 in 5) failed to performfundamental tasks on the sites – even though, clearly, thesites were designed to support these tasks.
Beyond the specific aspects of public mapping websites,the study also emphasised the need for researching the‘common user’ or ‘accidental geographers’ as Unwin(2005) calls them. It is very likely that some of the websitesthat were included in the study went through usabilitytesting and evaluation by their developers – but theoutcomes of such studies are not made public, and cannotbe used by developers of new systems. Furthermore, thestudy demonstrates that, by understanding the waycommon users approach public mapping sites, meaningful
observations that are relevant to any application of GIS canbe gleaned.
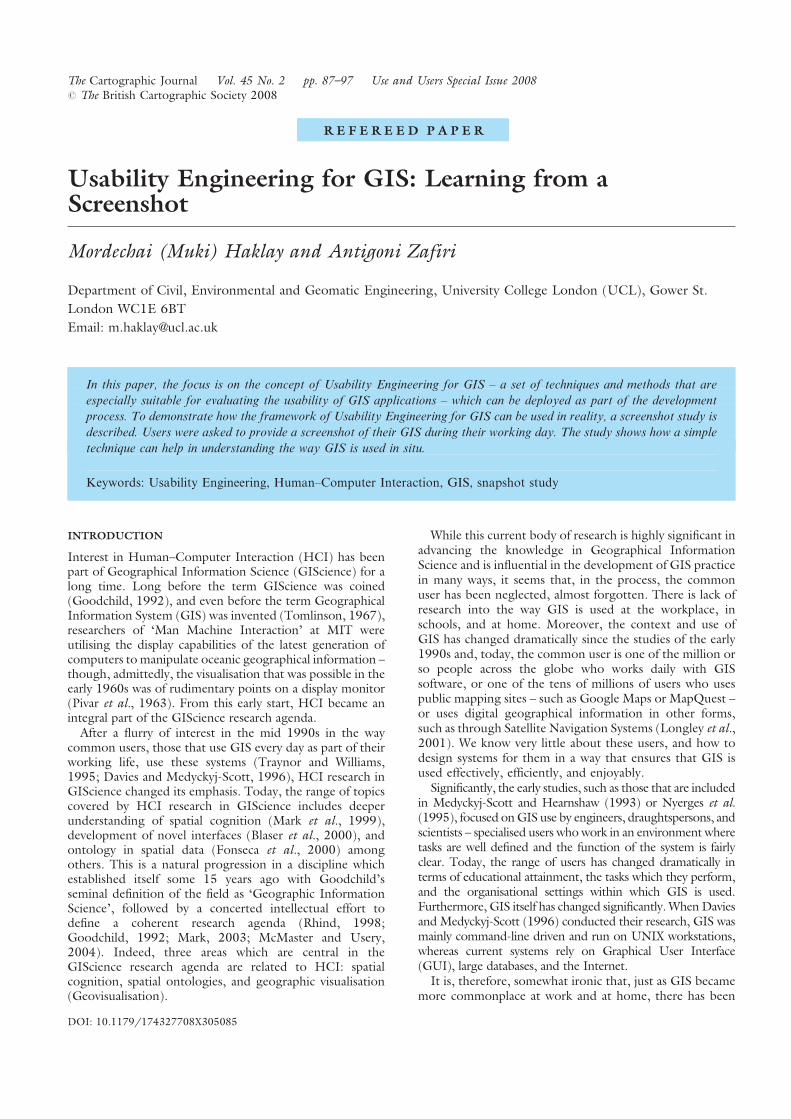
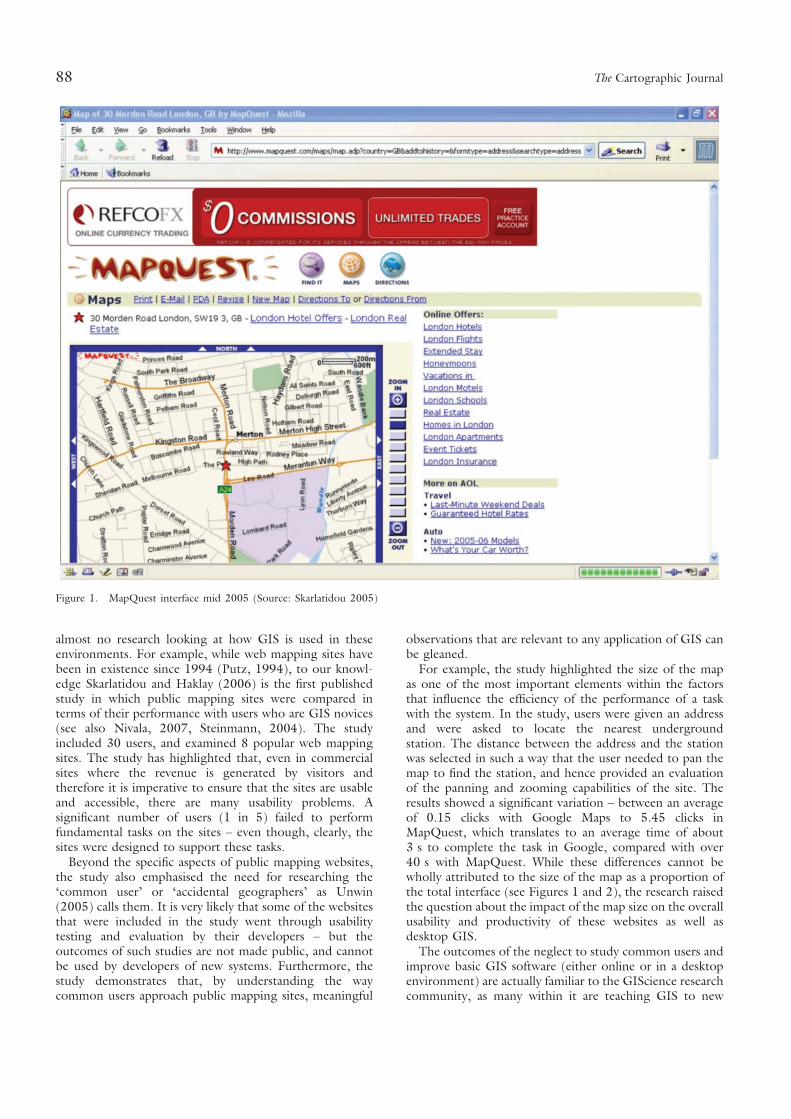
For example, the study highlighted the size of the mapas one of the most important elements within the factorsthat influence the efficiency of the performance of a taskwith the system. In the study, users were given an addressand were asked to locate the nearest undergroundstation. The distance between the address and the stationwas selected in such a way that the user needed to pan themap to find the station, and hence provided an evaluationof the panning and zooming capabilities of the site. Theresults showed a significant variation – between an averageof 0.15 clicks with Google Maps to 5.45 clicks inMapQuest, which translates to an average time of about3 s to complete the task in Google, compared with over40 s with MapQuest. While these differences cannot bewholly attributed to the size of the map as a proportion ofthe total interface (see Figures 1 and 2), the research raisedthe question about the impact of the map size on the overallusability and productivity of these websites as well asdesktop GIS.
The outcomes of the neglect to study common users andimprove basic GIS software (either online or in a desktopenvironment) are actually familiar to the GIScience researchcommunity, as many within it are teaching GIS to new
Figure 1. MapQuest interface mid 2005 (Source: Skarlatidou 2005)
88 The Cartographic Journal
generations of students. During computer practicals, it ishard not to notice the difficulties that students are facing inlearning to operate popular GIS packages. Clearly, asystemic failure in ensuring the usability of these packagesis occurring. It is astonishing that, although written over adecade ago, Traynor and Williams (1995) ‘Why areGeographic Information Systems Hard to Use?’ is stillaccurate, and current.
IS USABILITY ENGINEERING FOR GIS THE SOLUTION?
As Geographic Information and GIS methods are becom-ing more and more popular, there is a need to create aninterest within the GIScience research community ingeneral, and those that focus on HCI in particular, in theneeds of common users.
This can be achieved by focusing attention on thedevelopment of Usability Engineering for GIS. UsabilityEngineering (UE) is a sub-discipline of HCI whichemerged in the mid 1980s with the aim of addressing‘system usability in a reliable and replicable manner. UEprovides systematic methods and tools for the complex taskof designing user interfaces that can be readily compre-hended, quickly learned, and reliably operated.’ (Butler,1996, p. 59.) UE built on the lessons learned through HCI
research, and turned them into a set of operationalprocedures, matrices, and techniques that can be used bysystem designers and developers to ensure that the system isefficient, effective, engaging, error tolerant, and easy tolearn (also known as the 5 Es of Usability – although UEliterature offers many other lists and conceptualisations).
Importantly, Usability Engineering techniques have beenwidely used as part of HCI research in GIScience: examplesinclude Haklay and Tobon (2003), where UE techniqueswere used within a Public Participation GIS context, orFabrikant (2001), where they served to study the scalemetaphor in information visualisation. There are alsoexamples from GIS practitioners who are using UE in thedesign of new systems (Ellis et al., 2003). Moreover, in thearea of Geovisualisation, an ongoing interest and use of UEfor evaluating new interfaces and configurations is com-monplace (Koua and Kraak, 2004; MacEachren et al.,2005; Marsh, 2007).
However, despite this cumulative knowledge in the useof UE as part of GIS research, there is no coherent body ofUE knowledge for GIS – knowledge that can be applied inthe development of new systems, or how best to use UEwithin GIScience studies. UE for GIS should include toolsand methods that have been designed or adapted in such away that they take the special characteristics of geographicalinformation and its manipulation into account, and assist in
Figure 2. Google Map interface mid 2005 (Source: Skarlatidou 2005)
Usability Engineering for GIS 89
the design of user interaction. Noteworthy is that the mostpopular textbook on GIS (Longley et al., 2001) onlymentioned HCI in passing, and the most complete treatiseof HCI in a GIS textbook (Worboys and Duckham, 2005)dedicates less than a page to UE. A recent literature reviewrevealed over 150 papers and book chapters discussing theuse of UE methods as part of GIScience and GIS research –but only a few that can be categorised as UE for GIS (suchas Marsh, 2007; Nivala, 2007; and Harrower and Sheesley,2005).
Usability Engineering for GIScience can be immenselyvaluable to the developers of GIS. UE will provide a set oftried and tested methods that have been proven to beeffective for GIS. This can be done quite easily through twoactivities. Firstly, by consolidating the lessons that werelearned from the use of UE techniques as part of GIScienceresearch, a basic body of knowledge can be assembledincluding methods and matrices that have been found to bethe most useful for GIS designers and developers. Secondly,by developing UE research for GIS and focusing on thedesign of specific UE techniques which will take intoaccount the special characteristics of GIS such as the size ofthe map or the representation of the information (see alsoDavies et al., 2005).
By developing a focus on Usability Engineering for GIS,GIScience research can rekindle the interest in the commonuser and, due to the widespread availability of modern GIS,make a real impact and improve the quality of the workinglife of millions.
Of course, Usability Engineering for GIS must recognisethe differences between the range of users of GIS andgeospatial technologies. Techniques that are suitable forevaluating public web mapping sites will not necessarily besuitable for experienced desktop GIS users. However, asUnwin (2005) noted, the GIScience research communityknows very little about the characteristics, needs, skills, andcontext of these users, be they ‘Google Earth browsers’who enjoy using a geobrowser at home or experts whowork with GIS on a daily basis.
To clarify the concept of Usability Engineering for GIS, apractical example of a technique that was developed at UCLin 2005 is provided. The technique is based on a screenshotstudy and is aimed at more experienced users than in theweb-mapping study described earlier. Here, we are inter-ested in users of desktop GIS who are employed to operatethese software packages during their working day. The aimhere is to demonstrate how, by taking into account thespecific characteristics of GIS and the user environment, it ispossible to devise suitable UE methods and techniques.
DEVELOPING A USABILITY EVALUATION METHOD
There are several methods available for evaluating theusability of an interface. Their aim is to change one or moremeasures of usability in order to attain increased usability(Nielsen, 1993). While a comprehensive discussion of themethods is beyond the scope of this paper, it is worthmentioning the range of techniques, which includeHeuristic evaluation, Guideline reviews, Pluralistic walk-throughs, Consistency inspections, Standards inspections,
Cognitive walkthroughs, Formal usability inspections, andFeature inspections (for more details, see Nielsen, 1993).
Perhaps the approach used most often since its introduc-tion in the 1980s is usability testing (Shneiderman, 1998;Dix et al., 2004). It is based on the principle of trailingprototypes, analysing data captured about the system anduser performances (Lin et al., 1997). Often laboratories areused for user observation (Nielsen, 1993; Dix et al., 2004),and information can be derived from the execution time,accuracy, and users’ satisfaction as well as video and systemlogs (Lin et al., 1997). Because real users are activelyinvolved, the approach can be more objective, and revealserious and recurring problems (Lin et al., 1997).
Questionnaires are also used to accompany usability tests.They can be used at any stage of the development and theyare used to assess the perception of the users about a system(Shneiderman, 1998; Chien, Diehl and Norman, 1988; Dixet al., 2004). Their main advantage is that they areinexpensive and they can yield a large number of responsesas opposed to usability testing. Furthermore, the users’satisfaction of a system is a critical measure for itsacceptance and can be independent of the system’sperformance measure (Chien, Diehl and Norman, 1988).
All usability evaluation methods have their advantagesand disadvantages, and, generally, they can be eitherdifficult to apply or largely dependent upon the evaluator’sexperience (Chien, Diehl and Norman, 1988). The aim ofthe screenshot study, however, was not to carry out aformal usability evaluation of a particular GIS, but tocompare the effectiveness of the interface across thedifferent GIS packages, to derive conclusions and makerecommendations that can lead to increased usability of GISdesign in general. Therefore, the questionnaire approachwas chosen as a preferred method of evaluation. In order togain an understanding in the way the GIS interface isactually used in practice, users were asked to provide ascreenshot of their entire screen while they were in themiddle of their work with GIS. The questionnaire was usedto support the screenshots and provide additional informa-tion about the users and their tasks.
The questionnaire was emailed to GIS mailing lists,asking users to take a screenshot of their GIS, paste it intotheir email client, answer the questionnaire, and send itback to UCL for analysis. This was a short procedure thatrequired no more than 5 min of attention from the users.
The screenshots constitute the primary means of collect-ing the essential information and achieving the objective ofthis study. Most importantly, they provide a more objectivemeasure for assessing the usability of the GIS interface andthey can be combined and correlated to the subjectivemeasures derived from the questionnaire. The correlationbetween the two measures will help to examine and betterunderstand the relation between the objective and sub-jective information (Hornbæk, 2006).
THE SCREENSHOT STUDY
As noted, the aim of the study was to explore how the GISinterface was used when carrying out routine tasks. Ourcore question was about the way in which GIS usersorganise and customise the interface of their system.
90 The Cartographic Journal
In a Graphical User Interface (GUI) environment, theuser is capable of changing the size of windows in a givenapplication, setting toolbars, and organising certain aspectsof the interface. The use of the GUI creates tensionbetween the integration of User Interface (UI) elements,which are used to drive the application and perform tasks,and the available area for the actual application (Kurtenbachet al., 1997). As noted, the web mapping study indicatedthat the size of the map area as a proportion of the totalinterface can have significant implications of the effective-ness of the application. Yet, the ability to customise theinterface means that the user is capable of reducing theeffective area of the map. It is, therefore, interesting toexplore how GIS users organise their interface, taking intoaccount the graphical nature of the information that isbeing manipulated, and the way it changes during routineoperation through zooming and panning operations.
An ideal methodology for such a study, as described inDavies and Medyckyj-Scott (1996), includes the identifica-tion of the organisation and users that will be involved inthe study, followed by a selection of a representative samplefrom all applications and systems in which the GIS is used,and the same task should be tested across all applications inorder to be able to draw a comparison. However, such acomprehensive study is complex and requires significantresources. Furthermore, at the general level of GIS tasksand users, it is very difficult to define a specific range ofapplications and processes.
However, although the screenshot method is simpler andeasy to complete, it is interesting to explore how effective it isin revealing usage patterns and comparison amongst thedifferent GIS. Although the nature of this study wasexploratory, a set of research questions were formulated tofocus the analysis and to enable us to draw a morecomprehensive picture and conclusions. First, the studyallowed us to explore ‘How is the map area used?’ – as notedabove, this was one of the core motivations for this study. Anobservation from a previous study (Skarlatidou and Haklay,2006) indicated that, in almost all tasks, a larger map areareduced the time length of basic tasks on a web mapping site.Further anecdotal evidence from observations of how noviceusers use GIS (in other words – how students operate
popular GIS packages during their studies) provided furtherimpetus for this question. To put the first question incontext, a further question was formulated: ‘What propor-tion of the interface is assigned to the map area and to otherparts of the interface such as toolbars?’ Other questions thatcould be answered by examining screenshots were ‘What canwe learn about the way in which users customise their GISinterface?’ and ‘Do they tend to use the windows tiled oroverlapping?’ This is important in considering which modelof windows organisation is the most suitable for GIS.
Since the screenshot was accompanied by a short survey,which provided some information about their experiencewith GIS, it was also possible to explore ‘Is there anydifference between experienced and inexperienced users inthe way they use their GIS?’
Finally, the images themselves provided informationabout the resolution of the monitor that was being used,and it was possible to explore ‘What screen resolutions aregenerally used by GIS users?’
RESULTS
Following the research questions, an analysis of the 35images that were received ensued. Each image was analysedusing a standard graphics package (such as AdobePhotoshop or Paint.Net). The following aspects of theimages were recorded – the total size of the image, whichindicated the screen resolution that was used during thecapture process; the number of toolbars on the interfaceand whether they were active or not; the size of the area ofthe interface that was dedicated to the map; the type ofsoftware that was used; and the number of concurrentapplications that were running.
Once all the results were tabulated, it was possible tocalculate the percentage of the total screen area that wasdedicated to the map and to other interface elements.Statistical analysis was carried out to evaluate correlationsbetween users’ demographic profiles and the imagecharacteristics.
The finding of the study revealed the following traits ofthe GIS users who were in our sample group: the majority
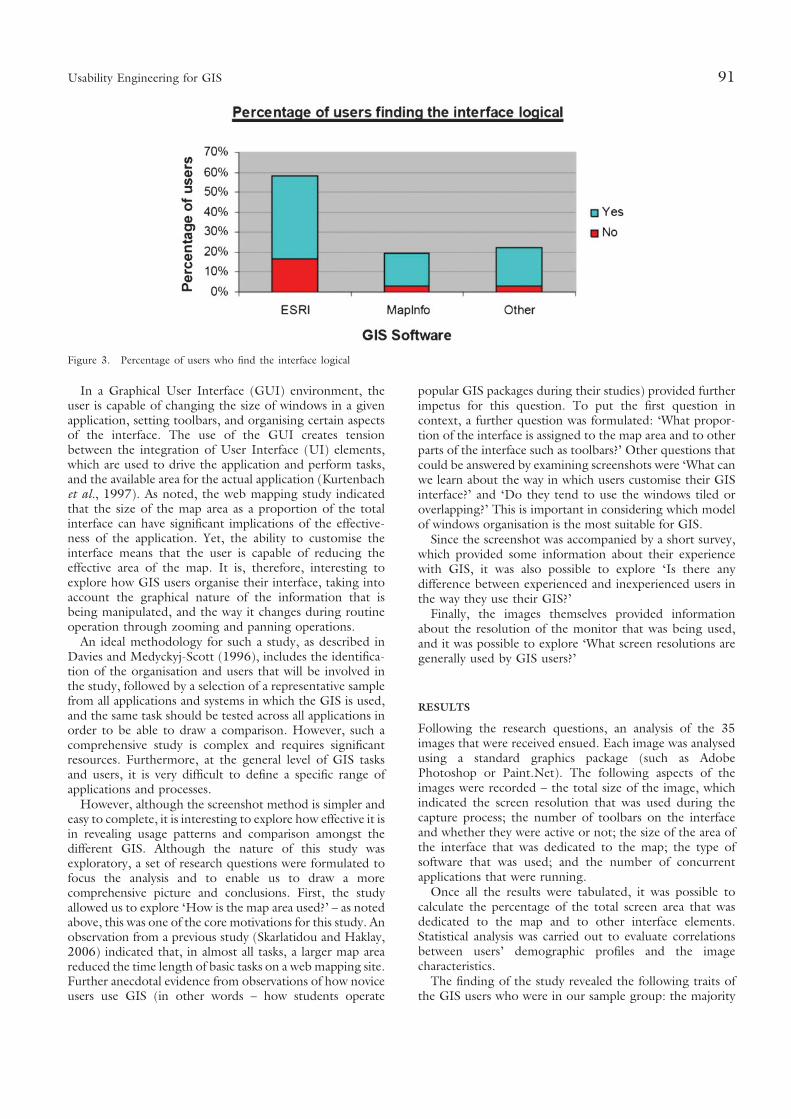
Figure 3. Percentage of users who find the interface logical
Usability Engineering for GIS 91
of the users (60%) that took part in the study wereexperienced GIS users and had been using GIS for over ayear with some of them using it for over 10; they weretechnically competent and declared that they feel comfor-table with computer use; they were using a GIS on a regularweekly basis with the majority using it between 2–10 hours(39%) and 10–30 hours (25%).
Similarly, about 75% of the users stated that they had nodifficulty locating desired functions on the GIS interfaceand found its structure logical, although quite a fewexperienced users reported that this was due to therearrangement of the toolbars. As Figure 3 demonstrates,ESRI products scored low on the logical structure of theinterface; the majority of the users still use GIS mainly for
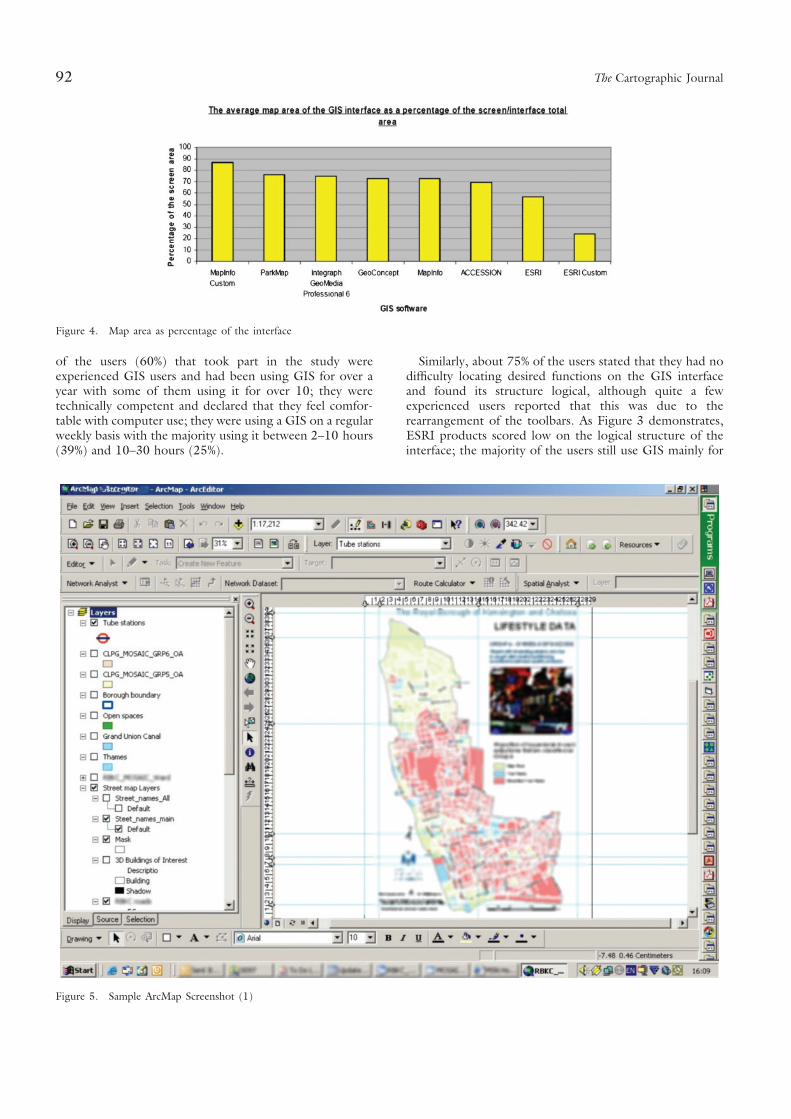
Figure 4. Map area as percentage of the interface
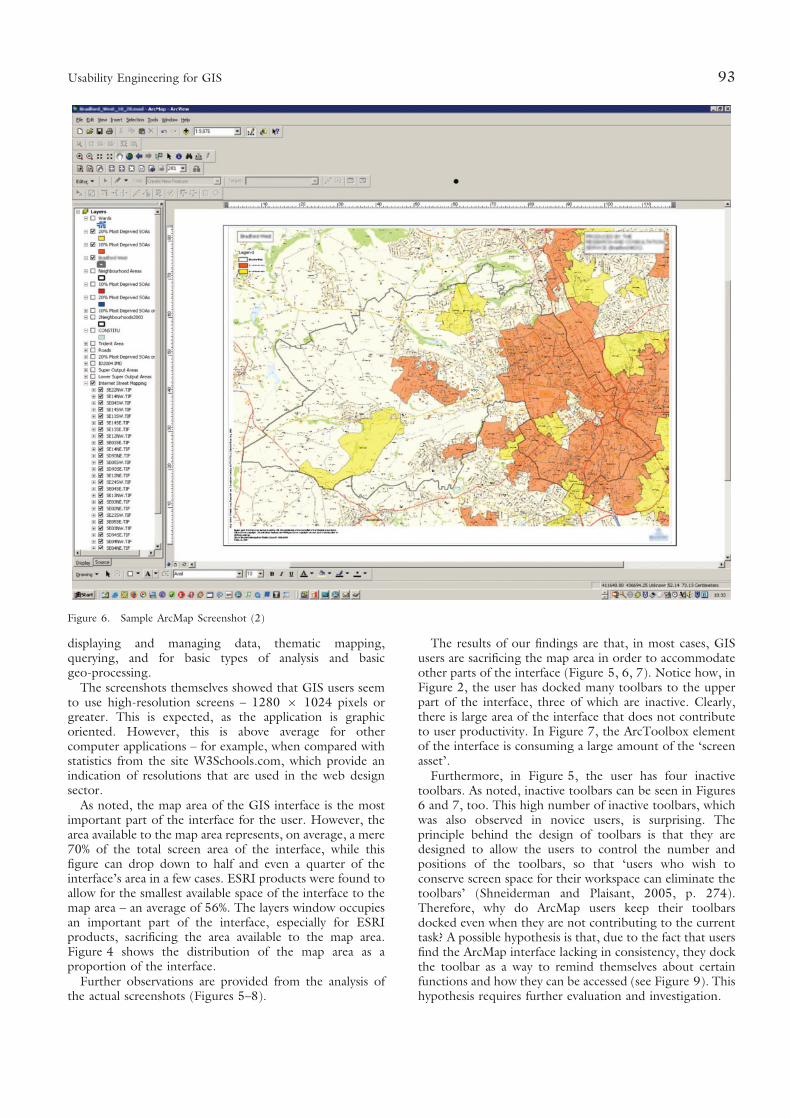
Figure 5. Sample ArcMap Screenshot (1)
92 The Cartographic Journal
displaying and managing data, thematic mapping,querying, and for basic types of analysis and basicgeo-processing.
The screenshots themselves showed that GIS users seemto use high-resolution screens – 1280 6 1024 pixels orgreater. This is expected, as the application is graphicoriented. However, this is above average for othercomputer applications – for example, when compared withstatistics from the site W3Schools.com, which provide anindication of resolutions that are used in the web designsector.
As noted, the map area of the GIS interface is the mostimportant part of the interface for the user. However, thearea available to the map area represents, on average, a mere70% of the total screen area of the interface, while thisfigure can drop down to half and even a quarter of theinterface’s area in a few cases. ESRI products were found toallow for the smallest available space of the interface to themap area – an average of 56%. The layers window occupiesan important part of the interface, especially for ESRIproducts, sacrificing the area available to the map area.Figure 4 shows the distribution of the map area as aproportion of the interface.
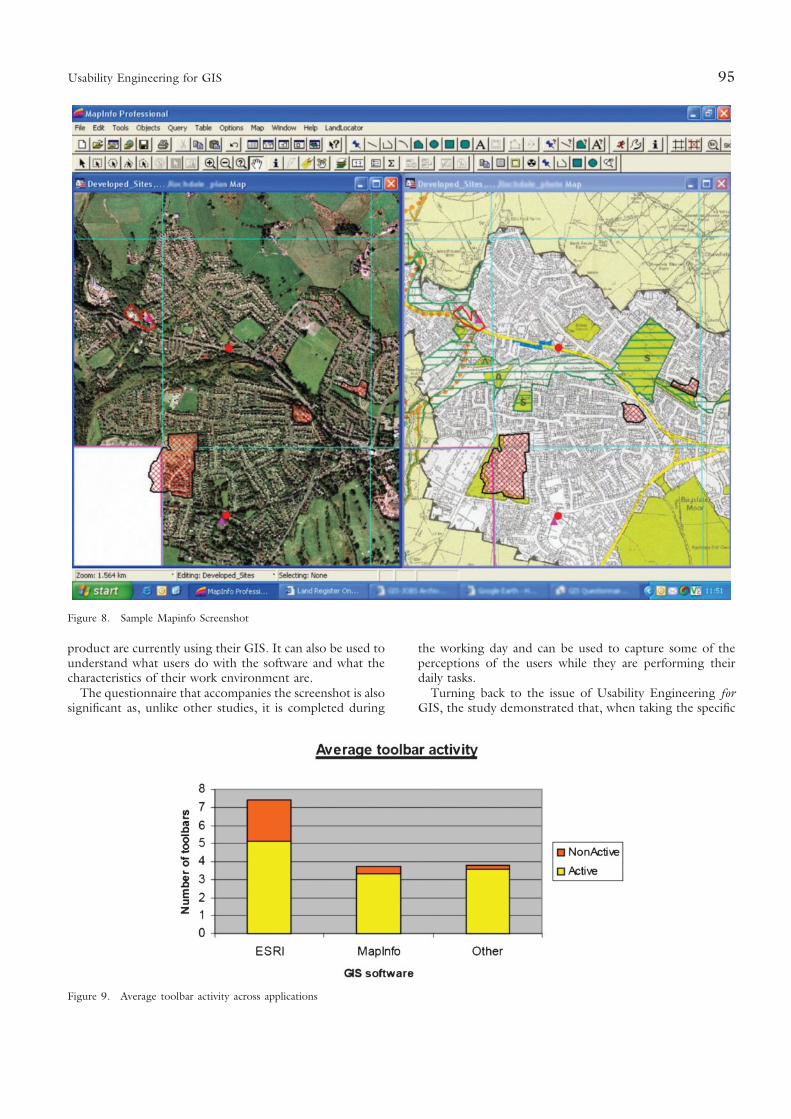
Further observations are provided from the analysis ofthe actual screenshots (Figures 5–8).
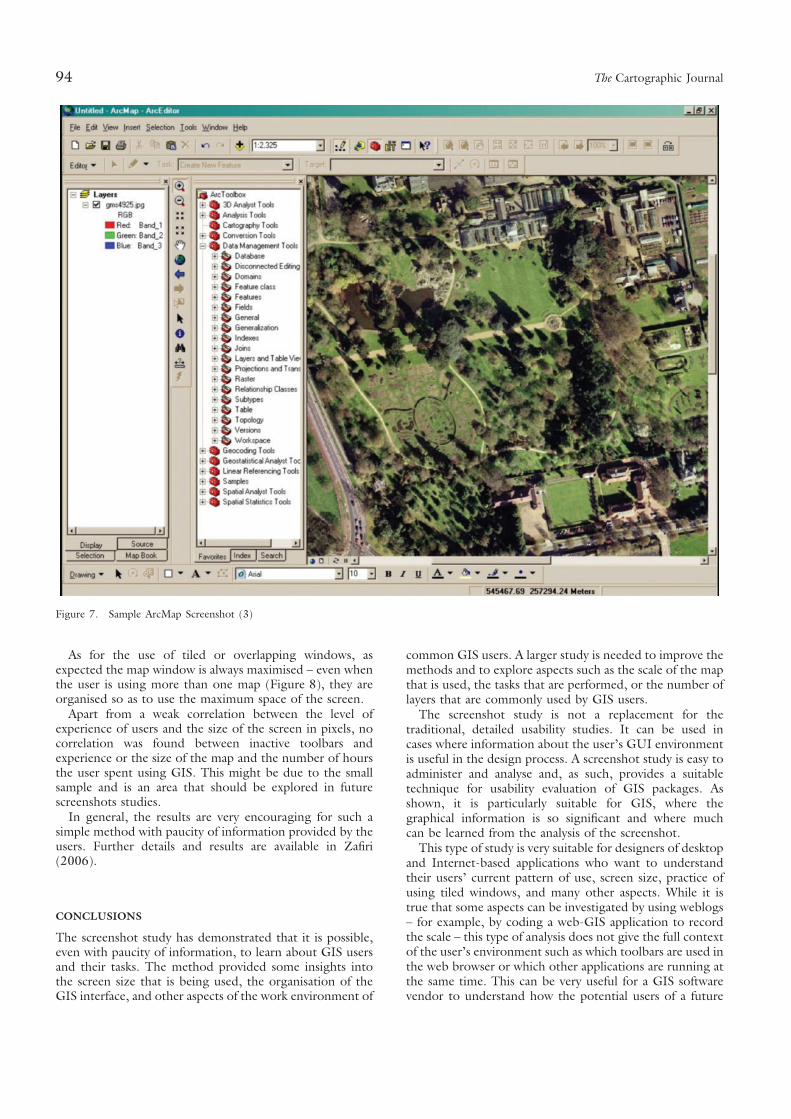
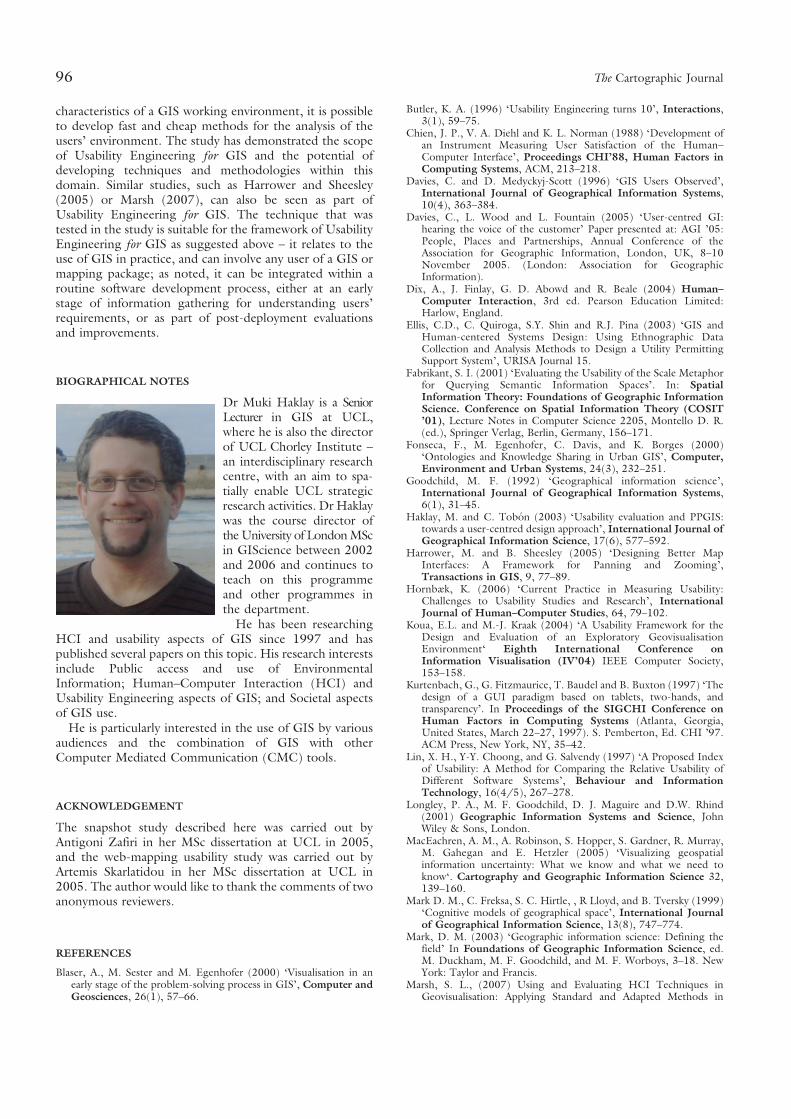
The results of our findings are that, in most cases, GISusers are sacrificing the map area in order to accommodateother parts of the interface (Figure 5, 6, 7). Notice how, inFigure 2, the user has docked many toolbars to the upperpart of the interface, three of which are inactive. Clearly,there is large area of the interface that does not contributeto user productivity. In Figure 7, the ArcToolbox elementof the interface is consuming a large amount of the ‘screenasset’.
Furthermore, in Figure 5, the user has four inactivetoolbars. As noted, inactive toolbars can be seen in Figures6 and 7, too. This high number of inactive toolbars, whichwas also observed in novice users, is surprising. Theprinciple behind the design of toolbars is that they aredesigned to allow the users to control the number andpositions of the toolbars, so that ‘users who wish toconserve screen space for their workspace can eliminate thetoolbars’ (Shneiderman and Plaisant, 2005, p. 274).Therefore, why do ArcMap users keep their toolbarsdocked even when they are not contributing to the currenttask? A possible hypothesis is that, due to the fact that usersfind the ArcMap interface lacking in consistency, they dockthe toolbar as a way to remind themselves about certainfunctions and how they can be accessed (see Figure 9). Thishypothesis requires further evaluation and investigation.
Figure 6. Sample ArcMap Screenshot (2)
Usability Engineering for GIS 93
As for the use of tiled or overlapping windows, asexpected the map window is always maximised – even whenthe user is using more than one map (Figure 8), they areorganised so as to use the maximum space of the screen.
Apart from a weak correlation between the level ofexperience of users and the size of the screen in pixels, nocorrelation was found between inactive toolbars andexperience or the size of the map and the number of hoursthe user spent using GIS. This might be due to the smallsample and is an area that should be explored in futurescreenshots studies.
In general, the results are very encouraging for such asimple method with paucity of information provided by theusers. Further details and results are available in Zafiri(2006).
CONCLUSIONS
The screenshot study has demonstrated that it is possible,even with paucity of information, to learn about GIS usersand their tasks. The method provided some insights intothe screen size that is being used, the organisation of theGIS interface, and other aspects of the work environment of
common GIS users. A larger study is needed to improve themethods and to explore aspects such as the scale of the mapthat is used, the tasks that are performed, or the number oflayers that are commonly used by GIS users.
The screenshot study is not a replacement for thetraditional, detailed usability studies. It can be used incases where information about the user’s GUI environmentis useful in the design process. A screenshot study is easy toadminister and analyse and, as such, provides a suitabletechnique for usability evaluation of GIS packages. Asshown, it is particularly suitable for GIS, where thegraphical information is so significant and where muchcan be learned from the analysis of the screenshot.
This type of study is very suitable for designers of desktopand Internet-based applications who want to understandtheir users’ current pattern of use, screen size, practice ofusing tiled windows, and many other aspects. While it istrue that some aspects can be investigated by using weblogs– for example, by coding a web-GIS application to recordthe scale – this type of analysis does not give the full contextof the user’s environment such as which toolbars are used inthe web browser or which other applications are running atthe same time. This can be very useful for a GIS softwarevendor to understand how the potential users of a future
Figure 7. Sample ArcMap Screenshot (3)
94 The Cartographic Journal
product are currently using their GIS. It can also be used tounderstand what users do with the software and what thecharacteristics of their work environment are.
The questionnaire that accompanies the screenshot is alsosignificant as, unlike other studies, it is completed during
the working day and can be used to capture some of theperceptions of the users while they are performing theirdaily tasks.
Turning back to the issue of Usability Engineering forGIS, the study demonstrated that, when taking the specific
Figure 8. Sample Mapinfo Screenshot
Figure 9. Average toolbar activity across applications
Usability Engineering for GIS 95
characteristics of a GIS working environment, it is possibleto develop fast and cheap methods for the analysis of theusers’ environment. The study has demonstrated the scopeof Usability Engineering for GIS and the potential ofdeveloping techniques and methodologies within thisdomain. Similar studies, such as Harrower and Sheesley(2005) or Marsh (2007), can also be seen as part ofUsability Engineering for GIS. The technique that wastested in the study is suitable for the framework of UsabilityEngineering for GIS as suggested above – it relates to theuse of GIS in practice, and can involve any user of a GIS ormapping package; as noted, it can be integrated within aroutine software development process, either at an earlystage of information gathering for understanding users’requirements, or as part of post-deployment evaluationsand improvements.
BIOGRAPHICAL NOTES
Dr Muki Haklay is a SeniorLecturer in GIS at UCL,where he is also the directorof UCL Chorley Institute –an interdisciplinary researchcentre, with an aim to spa-tially enable UCL strategicresearch activities. Dr Haklaywas the course director ofthe University of London MScin GIScience between 2002and 2006 and continues toteach on this programmeand other programmes inthe department.
He has been researchingHCI and usability aspects of GIS since 1997 and haspublished several papers on this topic. His research interestsinclude Public access and use of EnvironmentalInformation; Human–Computer Interaction (HCI) andUsability Engineering aspects of GIS; and Societal aspectsof GIS use.
He is particularly interested in the use of GIS by variousaudiences and the combination of GIS with otherComputer Mediated Communication (CMC) tools.
ACKNOWLEDGEMENT
The snapshot study described here was carried out byAntigoni Zafiri in her MSc dissertation at UCL in 2005,and the web-mapping usability study was carried out byArtemis Skarlatidou in her MSc dissertation at UCL in2005. The author would like to thank the comments of twoanonymous reviewers.
REFERENCES
Blaser, A., M. Sester and M. Egenhofer (2000) ‘Visualisation in anearly stage of the problem-solving process in GIS’, Computer andGeosciences, 26(1), 57–66.
Butler, K. A. (1996) ‘Usability Engineering turns 10’, Interactions,3(1), 59–75.
Chien, J. P., V. A. Diehl and K. L. Norman (1988) ‘Development ofan Instrument Measuring User Satisfaction of the Human–Computer Interface’, Proceedings CHI’88, Human Factors inComputing Systems, ACM, 213–218.
Davies, C. and D. Medyckyj-Scott (1996) ‘GIS Users Observed’,International Journal of Geographical Information Systems,10(4), 363–384.
Davies, C., L. Wood and L. Fountain (2005) ‘User-centred GI:hearing the voice of the customer’ Paper presented at: AGI ’05:People, Places and Partnerships, Annual Conference of theAssociation for Geographic Information, London, UK, 8–10November 2005. (London: Association for GeographicInformation).
Dix, A., J. Finlay, G. D. Abowd and R. Beale (2004) Human–Computer Interaction, 3rd ed. Pearson Education Limited:Harlow, England.
Ellis, C.D., C. Quiroga, S.Y. Shin and R.J. Pina (2003) ‘GIS andHuman-centered Systems Design: Using Ethnographic DataCollection and Analysis Methods to Design a Utility PermittingSupport System’, URISA Journal 15.
Fabrikant, S. I. (2001) ‘Evaluating the Usability of the Scale Metaphorfor Querying Semantic Information Spaces’. In: SpatialInformation Theory: Foundations of Geographic InformationScience. Conference on Spatial Information Theory (COSIT’01), Lecture Notes in Computer Science 2205, Montello D. R.(ed.), Springer Verlag, Berlin, Germany, 156–171.
Fonseca, F., M. Egenhofer, C. Davis, and K. Borges (2000)‘Ontologies and Knowledge Sharing in Urban GIS’, Computer,Environment and Urban Systems, 24(3), 232–251.
Goodchild, M. F. (1992) ‘Geographical information science’,International Journal of Geographical Information Systems,6(1), 31–45.
Haklay, M. and C. Tobon (2003) ‘Usability evaluation and PPGIS:towards a user-centred design approach’, International Journal ofGeographical Information Science, 17(6), 577–592.
Harrower, M. and B. Sheesley (2005) ‘Designing Better MapInterfaces: A Framework for Panning and Zooming’,Transactions in GIS, 9, 77–89.
Hornbæk, K. (2006) ‘Current Practice in Measuring Usability:Challenges to Usability Studies and Research’, InternationalJournal of Human–Computer Studies, 64, 79–102.
Koua, E.L. and M.-J. Kraak (2004) ‘A Usability Framework for theDesign and Evaluation of an Exploratory GeovisualisationEnvironment‘ Eighth International Conference onInformation Visualisation (IV’04) IEEE Computer Society,153–158.
Kurtenbach, G., G. Fitzmaurice, T. Baudel and B. Buxton (1997) ‘Thedesign of a GUI paradigm based on tablets, two-hands, andtransparency’. In Proceedings of the SIGCHI Conference onHuman Factors in Computing Systems (Atlanta, Georgia,United States, March 22–27, 1997). S. Pemberton, Ed. CHI ’97.ACM Press, New York, NY, 35–42.
Lin, X. H., Y-Y. Choong, and G. Salvendy (1997) ‘A Proposed Indexof Usability: A Method for Comparing the Relative Usability ofDifferent Software Systems’, Behaviour and InformationTechnology, 16(4/5), 267–278.
Longley, P. A., M. F. Goodchild, D. J. Maguire and D.W. Rhind(2001) Geographic Information Systems and Science, JohnWiley & Sons, London.
MacEachren, A. M., A. Robinson, S. Hopper, S. Gardner, R. Murray,M. Gahegan and E. Hetzler (2005) ‘Visualizing geospatialinformation uncertainty: What we know and what we need toknow‘. Cartography and Geographic Information Science 32,139–160.
Mark D. M., C. Freksa, S. C. Hirtle, , R Lloyd, and B. Tversky (1999)‘Cognitive models of geographical space’, International Journalof Geographical Information Science, 13(8), 747–774.
Mark, D. M. (2003) ‘Geographic information science: Defining thefield’ In Foundations of Geographic Information Science, ed.M. Duckham, M. F. Goodchild, and M. F. Worboys, 3–18. NewYork: Taylor and Francis.
Marsh, S. L., (2007) Using and Evaluating HCI Techniques inGeovisualisation: Applying Standard and Adapted Methods in
96 The Cartographic Journal
Research and Education. Unpublished PhD, City University,London.
McMaster, R. B. and E. L. Usery (2004) A Research Agenda ForGeographic Information Science, CRC Press.
Medyckyj-Scott, D. and H. M. Hearnshaw (Eds.) (1993) HumanFactors in Geographical Information Systems, Bellhaven Press,London.
Nielsen, J. (1993) Usability Engineering, Academic Press, Boston,MA.
Nivala, A-N. (2007) Usability Perspectives for the Design ofInteractive Maps, publications of the Finnish geodetic instituteNo. 136.
Nyerges, T. L., D. M. Mark, R.Laurini and M. J. Egenhofer (Eds.)(1995) Cognitive Aspects of Human–Computer Interaction forGeographic Information Systems, Kluwer Academic Publishers,Dordrecht.
Pivar, M., E. Fredkin, and H. Stommel (1963) ‘Computer-compiledoceanographic atlas: an experiment in man-machine interaction’,Proceedings of the National Academy of Sciences of the UnitedStates of America 50(2), 396–398.
Putz, S. (1994) ‘Interactive Information Services Using World-WideWeb Hypertext’ Proceedings of the First InternationalConference on World-Wide Web, Geneva, May 25–27, 1994.
Rhind, D.W. (1988) ‘A GIS research agenda’, International Journalof Geographical Information Systems, 2, 23–28
Shneiderman, B. (1998) Designing the User Interface: Strategies forEffective Human–Computer Interaction. (3rd ed). Addison WesleyLongman, Inc.
Shneiderman, B., and C. Plaisant (2005) Designing the UserInterface, 4th ed., Pearson Education, Boston, USA.
Skarlatidou, A. and M. Haklay (2006) ‘Public Web Mapping:Preliminary Usability Evaluation’, Proceedings of GIS ResearchUK Conference, Nottingham, April 5–7 2006.
Steinmann, R., A. Krek and T. Blaschke (2004) ‘Analysis of OnlinePublic Participatory GIS Applications with Respect to theDifferences Between the US and Europe’, Proceedings of UrbanData Management Symposium ’04, Chioggia, Italy.
Tomlinson, R. F. (1967) An Introduction to the GeographicInformation System of the Canada Land Inventory. Departmentof Forestry and Rural Development, Ottawa Canada.
Traynor, C. and M. G. Williams (1995) ‘Why are GeographicInformation Systems Hard to Use?’, CHI’95 Mosaic ofCreativity, Denver, Colorado, ACM/SIGCHI, 288–289.
Unwin, D. (2005) ‘Fiddling on a different planet’, Geoforum, 36,681–684
Worboys, M. and M. Duckham (2005) GIS: A ComputingPerspective, 2ed. Boca Raton, FL: CRC Press.
Zafiri, A.F. (2006) The effectiveness of WIMP for GIS users: asnapshot study for assessing the usability of current GIS,unpublished MSc dissertation, UCL.
Usability Engineering for GIS 97