us preeminence - goldman sachs · that the full scale of us preeminence has not yet been fully...
TRANSCRIPT
Outlook
Our six-year investment theme endures.
Investment Management Division
Investment Strategy Group | January 2015
US Preeminence

This material represents the views of the Investment Strategy Group in the Investment Management Division of Goldman Sachs. It is not a product of Goldman Sachs Global Investment Research. The views and opinions expressed herein may differ from those expressed by other groups of Goldman Sachs.
Sharmin Mossavar-Rahmani Chief Investment Officer Investment Strategy Group Goldman Sachs
Brett NelsonHead of Tactical Asset AllocationInvestment Strategy GroupGoldman Sachs
Additional Contributors from the Investment Strategy Group:
Matthew WeirManaging Director
Maziar MinoviManaging Director
Benoit MercereauManaging Director
Farshid AslManaging Director
2 01 5 O U T LO O K
Outlook Investment Strategy Group 1
Overview
the preeminence of the united states has driven our investment views for the past six years and over this time we have recommended clients maintain the core of their strategic allocation in US assets. Since the global financial crisis, the United States has outpaced major developed and emerging market countries and regions across economic, financial and human capital dimensions. With US equities now some 240% higher than their 2009 trough, we have to ask: Has the investment theme of US preeminence already played out?
We answer that question in the pages that follow by examining key measures and showing that the gap between the United States and other major countries and regions has widened relative to pre-crisis levels. The United States continues to build on its strengths, ranging from immigration to innovation, while many other key developed and emerging market countries and regions are held back by their structural fault lines, ranging from demographics to governance. Our analysis shows that the full scale of US preeminence has not yet been fully factored in or discounted.
We believe that our six-year investment theme will therefore endure for the foreseeable future. We continue to recommend maintaining a strategic overweight to US equities relative to their share of global market capitalization. While
we advise our clients to stay fully invested in US equities, we recommend caution, given that valuations are in the 9th decile of their historical range in the post-WWII period. It also needs to be said that US preeminence does not mean that US assets consistently will outperform or avoid bouts of volatility. But even after their staggering outperformance in recent years, we believe that US assets can continue to do well.
In this report, we include our return expectations for all major asset classes for the next one and five years, along with the key risks that could alter their trajectory. The balance of the report is dedicated to an in-depth discussion of the outlook for the major developed and emerging economies, global equities, currencies, fixed income and commodities.
Goldman Sachs january 2015 2
2 01 5 o u t lo o k
Contents
4 US PreeminenceOur Six-Year Investment Theme Endures
8 uS Preeminence: the Gap WidensWe believe that US preeminence is not fully priced into markets, and that our six-year investment theme will endure through 2015.
8 Widening Gap across Most Key Economic Metrics
13 Widening Gap across Financial Markets
17 Widening Gap across Human Capital Factors
18 Is the Widening Gap Cyclical or Structural?
19 Investment Implications of the Widening Gap
19 Strategic Implications
20 Tactical Tilt Implications
25 Prospective Returns
25 the Risks to our Investment Views
26 Federal Reserve Tightening
28 Eurozone Crisis Is Reignited
30 The “Unpredictable” President Vladimir Putin
31 Geopolitical Risks of 2014 Spill Over into 2015
32 Ebola Epidemic
32 key takeawaysWe maintain our recommendation that clients stay fully invested in US equities with some tactical overweight allocations to high yield bonds and to the US dollar relative to the euro and the yen.
S E C t I o N I

Outlook Investment Strategy Group 3
34 2015 Economic Outlook
36 united States
40 Eurozone
42 united kingdom
43 Japan
44 Emerging Markets
48 2015 Financial Markets Outlook
50 uS Equities
54 EAFE Equities
56 Eurozone Equities
57 uk Equities
58 Japanese Equities
60 Emerging Market Equities
61 Global Currencies
65 Global Fixed Income
73 Global Commodities
S E C t I o N I I : G lo b A l D I V E RG E N C E S S E C t I o N I I I : N ot Y E t o u t to PASt u R E

Goldman Sachs january 2015
S E C T I O N I
4
US Preeminence: Our Six-Year Investment Theme Endures
the preeminence of the United States has driven our investment views and annual Outlooks since the dark days of 2008–09. While the prevailing sentiment in the investment community during the global financial crisis was to turn away from US assets, with some even questioning the dollar’s status as the world’s reserve currency, the Investment Strategy Group focused on the inherent strengths of the United States. We highlighted its immense wealth, vast natural resources, institutional strengths and human capital advantages.
In our 2009 Outlook, Uncertain But Not Uncharted, we compared the crises of the 1970s, early 1980s and early 1990s to that of 2008–09 and demonstrated that the US economy and US financial markets not only survived, but prospered in the aftermath of these crises. In Take Stock of America, our 2010 Outlook, we delved deeper into the fundamental strengths of the US economy and the contribution of such factors as immigration, technological innovation, a stable political system and even a powerful military; we rejected the oft-expressed view that the 2008–09 crisis had dealt a fatal blow to the United States as

Outlook Investment Strategy Group 5
Goldman Sachs january 2015 6
the predominant economic and geopolitical power. In our 2011 Outlook, Stay the Course—which featured Emanuel Leutze’s painting of George Washington crossing the Delaware—we continued this theme and touched on US corporate resiliency, favorable demographics, elite universities and dominant position in public and private research and development. In our three subsequent annual Outlooks, we contrasted these US strengths with the structural fault lines of the Eurozone, Japan and the largest emerging markets of Brazil, Russia, India and China (BRICs).
Our analysis invariably led us to two key investment recommendations for our clients over the past six years. And these recommendations remain valid for our 2015 Outlook.
First, we continue to recommend that our clients strategically allocate a significant portion of their portfolios to US assets and at well above market capitalization levels. Our standard moderate-risk model portfolios for taxable and tax-exempt US clients had a strategic allocation to US assets between 80% and 85% in 2009–14 (80% in 2015). For our European clients with the euro as their base currency, our strategic allocation to US assets for a moderate-risk portfolio has ranged between 37% and 44% (44% in 2015), with the primary difference resulting from the fixed income portion of the portfolio, which is allocated to clients’ base currency.
Second, many of our tactical tilts, especially earlier in this bull market, have been focused on US equity and US high yield overweight allocations, reaching peak levels in September 2009. In fact, a key takeaway of many of our Outlooks, Sunday Night Insights and periodic conference calls in which many of you participated was to stay invested at your strategic allocation to US equities, with specific tactical tilts highlighted at various times. We have made this recommendation 45 times since 2009, if you were counting.
With US equities now some 240% higher than their 2009 trough, is US preeminence already priced into US financial assets and is it time for a change in investment stance with respect to strategic and tactical allocations? Six years is a long time for an investment theme to play out, and it is important not to miss other attractive long-term investment opportunities. Moreover, the magnitude of the outperformance of US financial assets relative to their counterparts has been staggering. Can this continue?
To answer this question, let us first explore the extent to which US financial assets have outperformed other global asset classes.
Leading up to the trough in March 2009, US equities experienced daily price declines of as much as 9% and market volatility1 as high as 89%. With the onset of recovery and through the end of 2014, US equities have outperformed Eurozone, Japanese
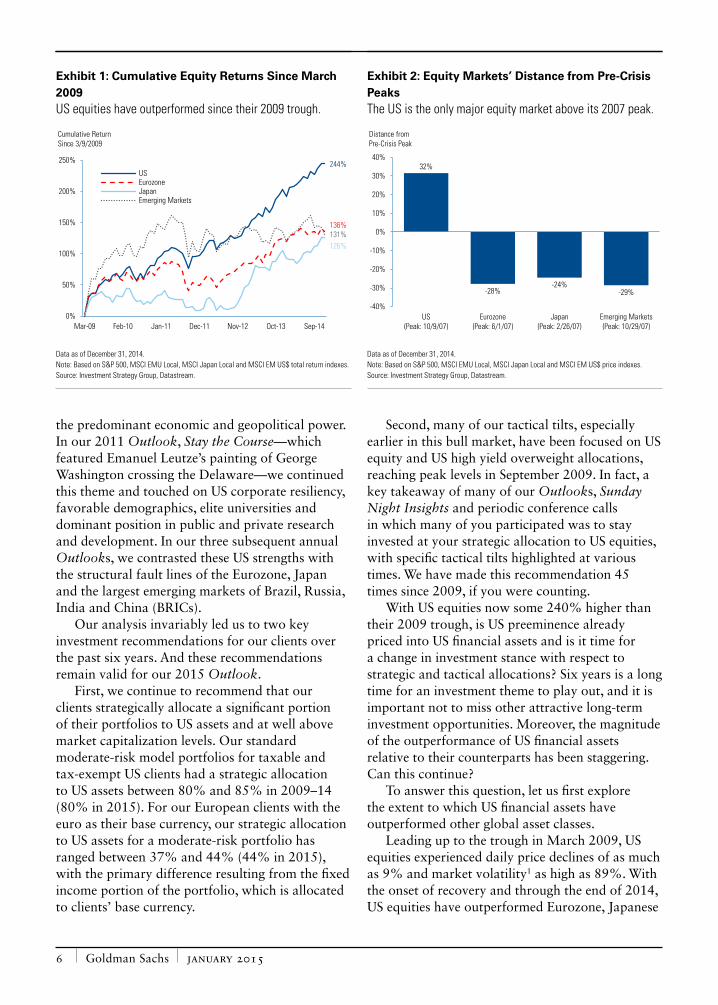
Exhibit 1: Cumulative Equity Returns Since March 2009US equities have outperformed since their 2009 trough.
244%
136%
126%131%
0%
50%
100%
150%
200%
250%
Mar-09 Feb-10 Jan-11 Dec-11 Nov-12 Oct-13 Sep-14
USEurozoneJapanEmerging Markets
Cumulative Return Since 3/9/2009
Data as of December 31, 2014. Note: Based on S&P 500, MSCI EMU Local, MSCI Japan Local and MSCI EM US$ total return indexes. Source: Investment Strategy Group, Datastream.
Exhibit 2: Equity Markets’ Distance from Pre-Crisis PeaksThe US is the only major equity market above its 2007 peak.
32%
-28%-24%
-29%
-40%
-30%
-20%
-10%
0%
10%
20%
30%
40%
US(Peak: 10/9/07)
Eurozone(Peak: 6/1/07)
Japan(Peak: 2/26/07)
Emerging Markets(Peak: 10/29/07)
Distance from Pre-Crisis Peak
Data as of December 31, 2014. Note: Based on S&P 500, MSCI EMU Local, MSCI Japan Local and MSCI EM US$ price indexes. Source: Investment Strategy Group, Datastream.
Outlook Investment Strategy Group 7
and emerging market equities by 108%, 118% and 113%, respectively, as shown in Exhibit 1. On an annualized basis, these numbers equate to an outperformance of 8%, 9% and 8%, respectively. Notably, US equities are 32% above their October 2007 peak, whereas the Eurozone, Japanese and emerging market equities are all still below their October 2007 levels. Indeed, as shown in Exhibit 2, no major market other than that of the United States has exceeded its own pre-crisis peak over this period as measured by MSCI indexes.
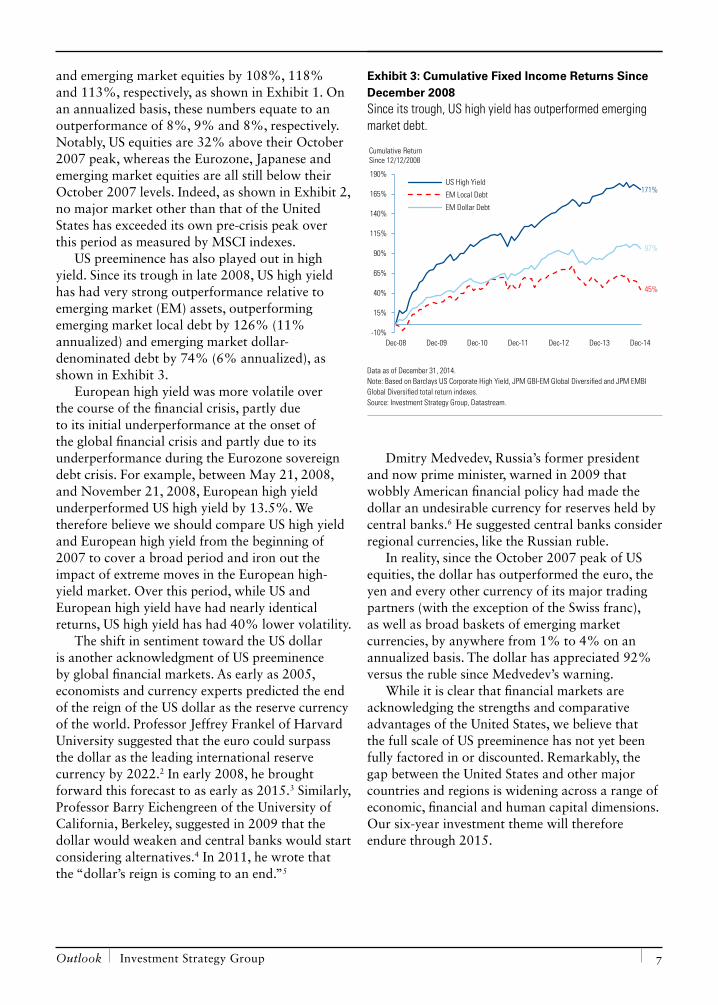
US preeminence has also played out in high yield. Since its trough in late 2008, US high yield has had very strong outperformance relative to emerging market (EM) assets, outperforming emerging market local debt by 126% (11% annualized) and emerging market dollar-denominated debt by 74% (6% annualized), as shown in Exhibit 3.
European high yield was more volatile over the course of the financial crisis, partly due to its initial underperformance at the onset of the global financial crisis and partly due to its underperformance during the Eurozone sovereign debt crisis. For example, between May 21, 2008, and November 21, 2008, European high yield underperformed US high yield by 13.5%. We therefore believe we should compare US high yield and European high yield from the beginning of 2007 to cover a broad period and iron out the impact of extreme moves in the European high-yield market. Over this period, while US and European high yield have had nearly identical returns, US high yield has had 40% lower volatility.
The shift in sentiment toward the US dollar is another acknowledgment of US preeminence by global financial markets. As early as 2005, economists and currency experts predicted the end of the reign of the US dollar as the reserve currency of the world. Professor Jeffrey Frankel of Harvard University suggested that the euro could surpass the dollar as the leading international reserve currency by 2022.2 In early 2008, he brought forward this forecast to as early as 2015.3 Similarly, Professor Barry Eichengreen of the University of California, Berkeley, suggested in 2009 that the dollar would weaken and central banks would start considering alternatives.4 In 2011, he wrote that the “dollar’s reign is coming to an end.”5
Dmitry Medvedev, Russia’s former president and now prime minister, warned in 2009 that wobbly American financial policy had made the dollar an undesirable currency for reserves held by central banks.6 He suggested central banks consider regional currencies, like the Russian ruble.
In reality, since the October 2007 peak of US equities, the dollar has outperformed the euro, the yen and every other currency of its major trading partners (with the exception of the Swiss franc), as well as broad baskets of emerging market currencies, by anywhere from 1% to 4% on an annualized basis. The dollar has appreciated 92% versus the ruble since Medvedev’s warning.
While it is clear that financial markets are acknowledging the strengths and comparative advantages of the United States, we believe that the full scale of US preeminence has not yet been fully factored in or discounted. Remarkably, the gap between the United States and other major countries and regions is widening across a range of economic, financial and human capital dimensions. Our six-year investment theme will therefore endure through 2015.
Exhibit 3: Cumulative Fixed Income Returns Since December 2008Since its trough, US high yield has outperformed emerging market debt.
171%
45%
97%
-10%
15%
40%
65%
90%
115%
140%
165%
190%
Dec-08 Dec-09 Dec-10 Dec-11 Dec-12 Dec-13 Dec-14
US High Yield
EM Local Debt
EM Dollar Debt
Cumulative Return Since 12/12/2008
Data as of December 31, 2014. Note: Based on Barclays US Corporate High Yield, JPM GBI-EM Global Diversified and JPM EMBI Global Diversified total return indexes. Source: Investment Strategy Group, Datastream.
Goldman Sachs january 2015 8
The introductory section of our 2015 Outlook begins by examining the key areas where the gap between the United States and other major countries and regions has widened. The gap has widened as the United States builds on its strengths, ranging from immigration to innovation, while so many others are held back by their structural fault lines, ranging from demographics to governance. We then discuss key investment implications as well as our expected returns for 2015 and for the next five years. We conclude with the risks to our outlook.
In the second section of our Outlook, we present our economic views for the key regions of the world, with emphasis on their diverging paths. The third section concludes with a more detailed investment outlook for the major marketable asset classes.
US Preeminence: The Gap Widens
Since WWII, the United States has exhibited its preeminence across a wide range of economic, military, institutional and human capital factors. During periods of financial and economic stress, this preeminence is invariably questioned both within and outside the United States, and the 2008–09 crisis was no exception. For example, many financial market participants, the media, think-tank pundits and academics hailed the end of the “American Century” and start of the “Chinese Century.” And as in past periods of financial and economic stress, the sentiment has reversed. The “declinists” are in retreat and the recognition of US preeminence has taken hold.
Once again, the United States has emerged economically and financially stronger than other major countries and regions, and the gap between the United States and the rest of the world has actually widened. The Eurozone and Japan have experienced weak-to-negligible growth, compounded by limited structural reforms. Most
key emerging market countries, with the notable exception of India, have experienced slowly to rapidly deteriorating economic conditions, compounded by very limited to nonexistent structural reforms and, in some cases, actual regression with respect to such measures as corruption and economic freedom.
We begin by examining this divergence between the United States and the rest of the world’s key countries and regions across three categories: economic, financial and human capital. While the United States has not outperformed across every metric in every category, the picture that emerges is of an economy on a much stronger footing, backed by a more stable and streamlined private sector.
Widening Gap across Most Key Economic Metrics
GDP and GDP per Capita Growth: After a relatively slow and uneven start to the economic recovery, US growth is now on solid ground, with
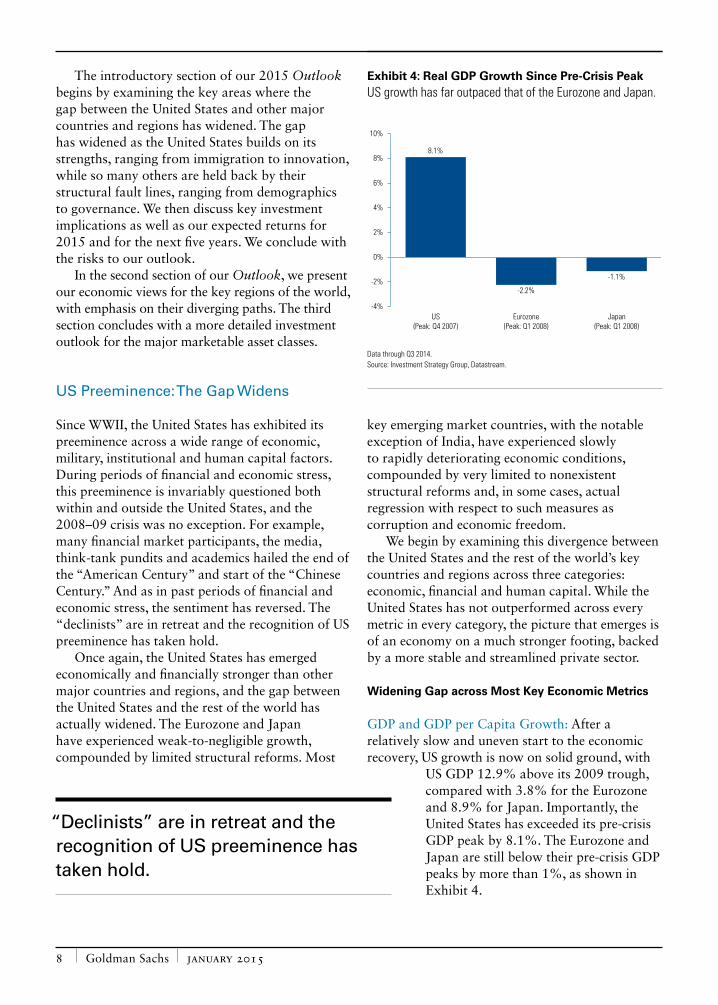
US GDP 12.9% above its 2009 trough, compared with 3.8% for the Eurozone and 8.9% for Japan. Importantly, the United States has exceeded its pre-crisis GDP peak by 8.1%. The Eurozone and Japan are still below their pre-crisis GDP peaks by more than 1%, as shown in Exhibit 4.
Exhibit 4: Real GDP Growth Since Pre-Crisis PeakUS growth has far outpaced that of the Eurozone and Japan.
8.1%
-2.2%
-1.1%
-4%
-2%
0%
2%
4%
6%
8%
10%
US(Peak: Q4 2007)
Eurozone(Peak: Q1 2008)
Japan(Peak: Q1 2008)
Data through Q3 2014. Source: Investment Strategy Group, Datastream.
“Declinists” are in retreat and the recognition of US preeminence has taken hold.
Outlook Investment Strategy Group 9
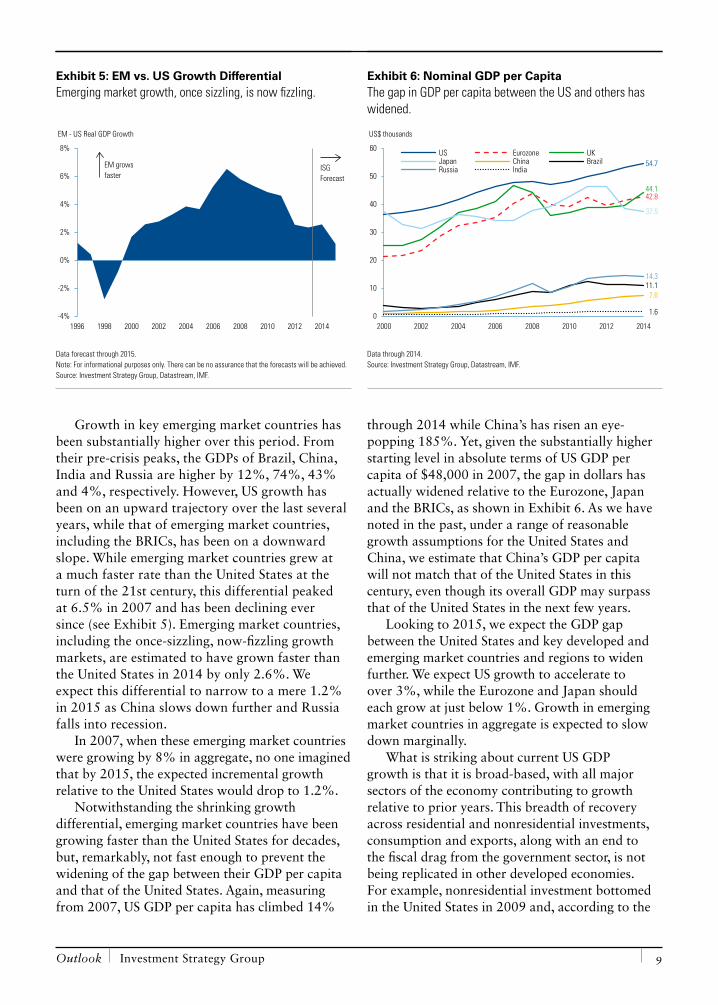
Growth in key emerging market countries has been substantially higher over this period. From their pre-crisis peaks, the GDPs of Brazil, China, India and Russia are higher by 12%, 74%, 43% and 4%, respectively. However, US growth has been on an upward trajectory over the last several years, while that of emerging market countries, including the BRICs, has been on a downward slope. While emerging market countries grew at a much faster rate than the United States at the turn of the 21st century, this differential peaked at 6.5% in 2007 and has been declining ever since (see Exhibit 5). Emerging market countries, including the once-sizzling, now-fizzling growth markets, are estimated to have grown faster than the United States in 2014 by only 2.6%. We expect this differential to narrow to a mere 1.2% in 2015 as China slows down further and Russia falls into recession.
In 2007, when these emerging market countries were growing by 8% in aggregate, no one imagined that by 2015, the expected incremental growth relative to the United States would drop to 1.2%.
Notwithstanding the shrinking growth differential, emerging market countries have been growing faster than the United States for decades, but, remarkably, not fast enough to prevent the widening of the gap between their GDP per capita and that of the United States. Again, measuring from 2007, US GDP per capita has climbed 14%
through 2014 while China’s has risen an eye-popping 185%. Yet, given the substantially higher starting level in absolute terms of US GDP per capita of $48,000 in 2007, the gap in dollars has actually widened relative to the Eurozone, Japan and the BRICs, as shown in Exhibit 6. As we have noted in the past, under a range of reasonable growth assumptions for the United States and China, we estimate that China’s GDP per capita will not match that of the United States in this century, even though its overall GDP may surpass that of the United States in the next few years.
Looking to 2015, we expect the GDP gap between the United States and key developed and emerging market countries and regions to widen further. We expect US growth to accelerate to over 3%, while the Eurozone and Japan should each grow at just below 1%. Growth in emerging market countries in aggregate is expected to slow down marginally.
What is striking about current US GDP growth is that it is broad-based, with all major sectors of the economy contributing to growth relative to prior years. This breadth of recovery across residential and nonresidential investments, consumption and exports, along with an end to the fiscal drag from the government sector, is not being replicated in other developed economies. For example, nonresidential investment bottomed in the United States in 2009 and, according to the
Exhibit 5: EM vs. US Growth DifferentialEmerging market growth, once sizzling, is now fizzling.
-4%
-2%
0%
2%
4%
6%
8%
1996 1998 2000 2002 2004 2006 2008 2010 2012 2014
EM growsfaster
ISGForecast
EM - US Real GDP Growth
Data forecast through 2015. Note: For informational purposes only. There can be no assurance that the forecasts will be achieved. Source: Investment Strategy Group, Datastream, IMF.
Exhibit 6: Nominal GDP per CapitaThe gap in GDP per capita between the US and others has widened.
54.7
42.844.1
37.5
7.611.114.3
1.60
10
20
30
40
50
60
2000 2002 2004 2006 2008 2010 2012 2014
Thou
sand
s US Eurozone UKJapan China BrazilRussia India
US$ thousands
Data through 2014. Source: Investment Strategy Group, Datastream, IMF.
Goldman Sachs january 2015 10
latest statistics, is 7% above its pre-crisis peak. In the Eurozone and Japan, nonresidential investment is 14% and 9% below peak levels, respectively. Similarly, private consumption is 9% above its 2007 peak in the United States, while it is more than 1% below peak in the Eurozone and about 3% above peak in Japan.
Even the US export sector is exhibiting better performance, which is notable given that the United States is traditionally less export-oriented
than the Eurozone and Japan. Exports account for 13% of GDP in the United States, compared with 19% in the Eurozone and 17% in Japan. Yet exports in the United States are 18% above their pre-crisis peak while Eurozone exports are 10% above and Japan exports are notably more than 2% below.
Section II of this Outlook discusses our 2015 economic views in greater detail.
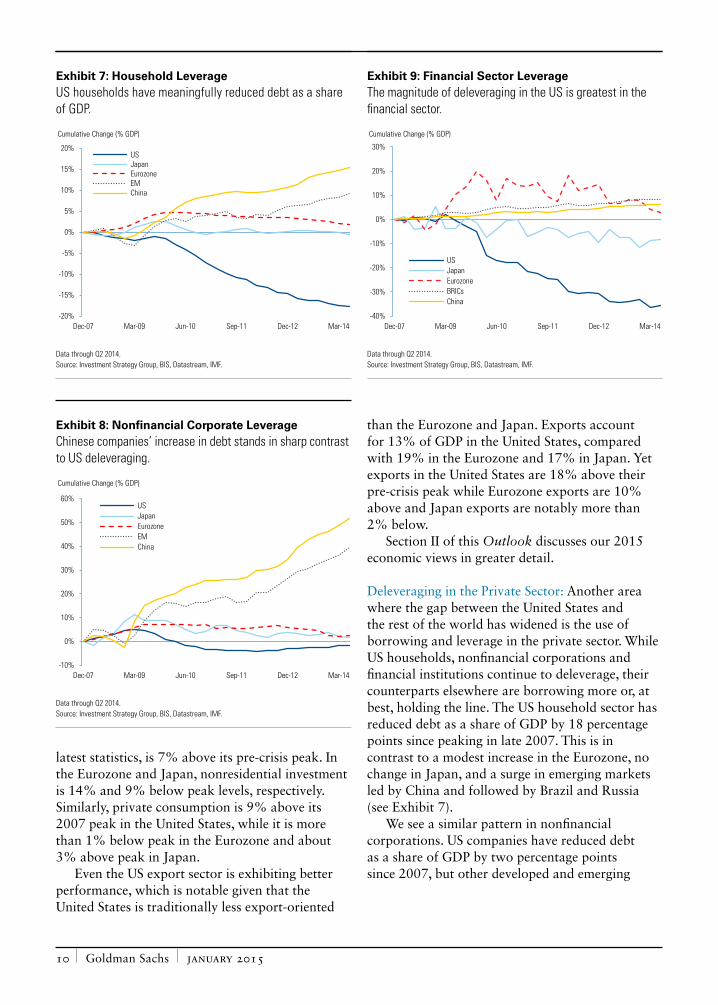
Deleveraging in the Private Sector: Another area where the gap between the United States and the rest of the world has widened is the use of borrowing and leverage in the private sector. While US households, nonfinancial corporations and financial institutions continue to deleverage, their counterparts elsewhere are borrowing more or, at best, holding the line. The US household sector has reduced debt as a share of GDP by 18 percentage points since peaking in late 2007. This is in contrast to a modest increase in the Eurozone, no change in Japan, and a surge in emerging markets led by China and followed by Brazil and Russia (see Exhibit 7).
We see a similar pattern in nonfinancial corporations. US companies have reduced debt as a share of GDP by two percentage points since 2007, but other developed and emerging
Exhibit 7: Household LeverageUS households have meaningfully reduced debt as a share of GDP.
-20%
-15%
-10%
-5%
0%
5%
10%
15%
20%
Dec-07 Mar-09 Jun-10 Sep-11 Dec-12 Mar-14
USJapanEurozoneEMChina
Cumulative Change (% GDP)
Data through Q2 2014. Source: Investment Strategy Group, BIS, Datastream, IMF.
Exhibit 8: Nonfinancial Corporate LeverageChinese companies’ increase in debt stands in sharp contrast to US deleveraging.
-10%
0%
10%
20%
30%
40%
50%
60%
Dec-07 Mar-09 Jun-10 Sep-11 Dec-12 Mar-14
USJapanEurozoneEMChina
Cumulative Change (% GDP)
Data through Q2 2014. Source: Investment Strategy Group, BIS, Datastream, IMF.
Exhibit 9: Financial Sector LeverageThe magnitude of deleveraging in the US is greatest in the financial sector.
-40%
-30%
-20%
-10%
0%
10%
20%
30%
Dec-07 Mar-09 Jun-10 Sep-11 Dec-12 Mar-14
USJapanEurozoneBRICsChina
Cumulative Change (% GDP)
Data through Q2 2014. Source: Investment Strategy Group, BIS, Datastream, IMF.
Outlook Investment Strategy Group 11
market companies have increased their debt levels significantly; China’s increased by 52 percentage points, as shown in Exhibit 8.
The magnitude of US deleveraging is greatest in the financial sector. Financial sector debt as a share of GDP has decreased by more than 30 percentage points in the United States since the end of 2007, compared with an increase of 3 percentage points in the Eurozone, a decrease of 8 percentage points in Japan, and an increase of 6 percentage points in China, as shown in Exhibit 9.
The US private sector is entering 2015 with a substantially improved debt profile relative to key developed and emerging market countries.
Deficits in the Public Sector: The significant improvement in the US’ fiscal situation has also exceeded expectations. You may recall the oft-quoted economists Carmen Reinhart and Kenneth Rogoff, co-authors of This Time Is Different, who repeatedly warned7 that the US recovery from the financial crisis was likely to follow the path of post-crisis developed and emerging market recoveries, with prolonged periods of large deficits. This view gained credence in August 2011, when Standard & Poor’s downgraded US Treasury debt as the federal deficit rose above 8% of GDP.
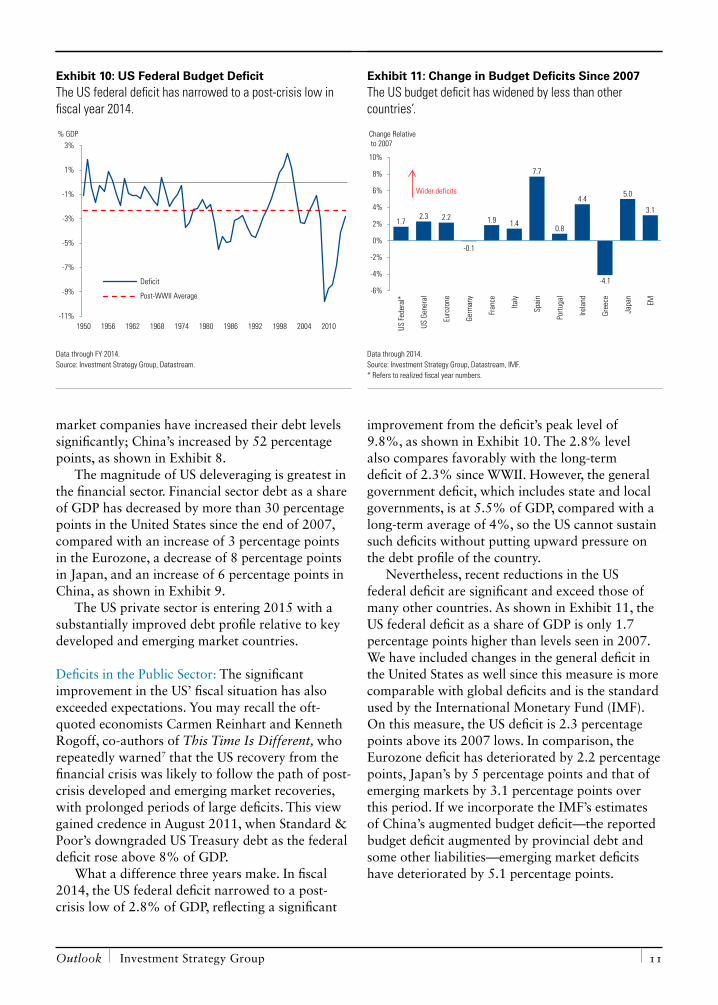
What a difference three years make. In fiscal 2014, the US federal deficit narrowed to a post-crisis low of 2.8% of GDP, reflecting a significant
improvement from the deficit’s peak level of 9.8%, as shown in Exhibit 10. The 2.8% level also compares favorably with the long-term deficit of 2.3% since WWII. However, the general government deficit, which includes state and local governments, is at 5.5% of GDP, compared with a long-term average of 4%, so the US cannot sustain such deficits without putting upward pressure on the debt profile of the country.
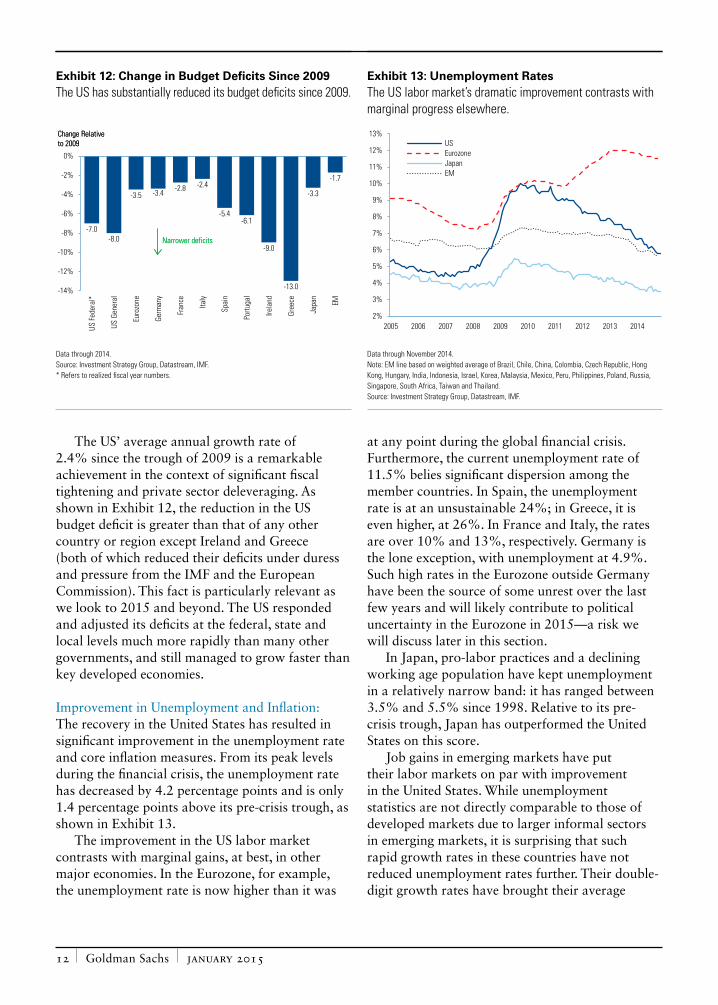
Nevertheless, recent reductions in the US federal deficit are significant and exceed those of many other countries. As shown in Exhibit 11, the US federal deficit as a share of GDP is only 1.7 percentage points higher than levels seen in 2007. We have included changes in the general deficit in the United States as well since this measure is more comparable with global deficits and is the standard used by the International Monetary Fund (IMF). On this measure, the US deficit is 2.3 percentage points above its 2007 lows. In comparison, the Eurozone deficit has deteriorated by 2.2 percentage points, Japan’s by 5 percentage points and that of emerging markets by 3.1 percentage points over this period. If we incorporate the IMF’s estimates of China’s augmented budget deficit—the reported budget deficit augmented by provincial debt and some other liabilities—emerging market deficits have deteriorated by 5.1 percentage points.
Exhibit 10: US Federal Budget DeficitThe US federal deficit has narrowed to a post-crisis low in fiscal year 2014.
-11%
-9%
-7%
-5%
-3%
-1%
1%
3%
1950 1956 1962 1968 1974 1980 1986 1992 1998 2004 2010
Deficit
Post-WWII Average
% GDP
Data through FY 2014. Source: Investment Strategy Group, Datastream.
Exhibit 11: Change in Budget Deficits Since 2007The US budget deficit has widened by less than other countries’.
1.72.3 2.2
-0.1
1.9 1.4
7.7
0.8
4.4
-4.1
5.0
3.1
-6%
-4%
-2%
0%
2%
4%
6%
8%
10%
US Fe
dera
l*
US G
ener
al
Euro
zone
Germ
any
Fran
ce
Italy
Spai
n
Portu
gal
Irela
nd
Gree
ce
Japa
n
EM
Wider deficits
Change Relativeto 2007
Data through 2014. Source: Investment Strategy Group, Datastream, IMF. * Refers to realized fiscal year numbers.
Goldman Sachs january 2015 12
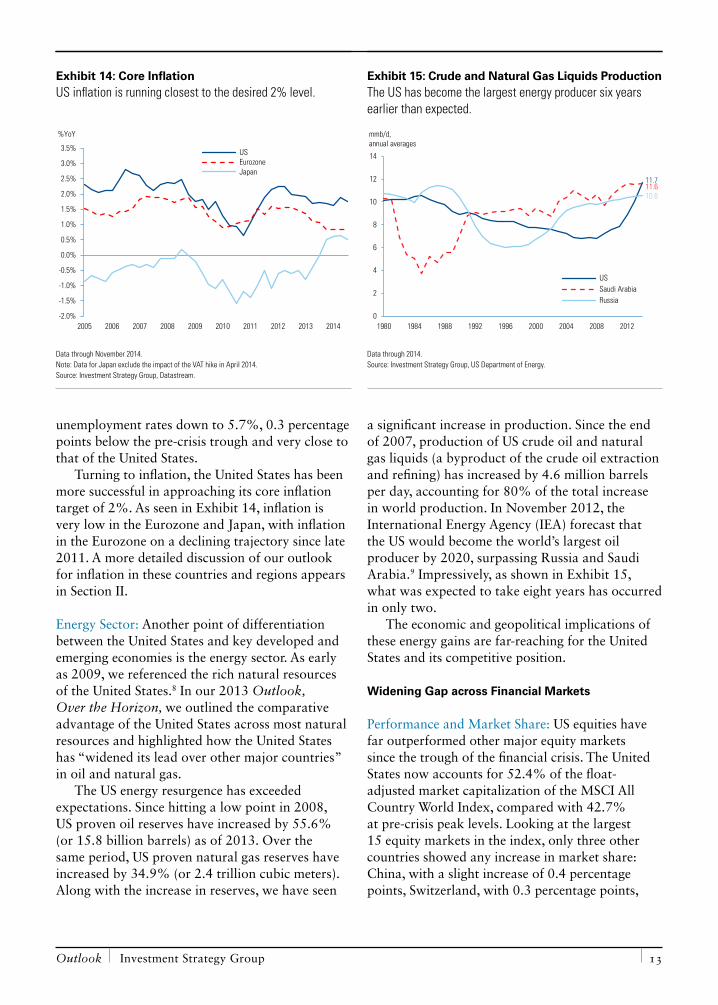
The US’ average annual growth rate of 2.4% since the trough of 2009 is a remarkable achievement in the context of significant fiscal tightening and private sector deleveraging. As shown in Exhibit 12, the reduction in the US budget deficit is greater than that of any other country or region except Ireland and Greece (both of which reduced their deficits under duress and pressure from the IMF and the European Commission). This fact is particularly relevant as we look to 2015 and beyond. The US responded and adjusted its deficits at the federal, state and local levels much more rapidly than many other governments, and still managed to grow faster than key developed economies.
Improvement in Unemployment and Inflation: The recovery in the United States has resulted in significant improvement in the unemployment rate and core inflation measures. From its peak levels during the financial crisis, the unemployment rate has decreased by 4.2 percentage points and is only 1.4 percentage points above its pre-crisis trough, as shown in Exhibit 13.
The improvement in the US labor market contrasts with marginal gains, at best, in other major economies. In the Eurozone, for example, the unemployment rate is now higher than it was
at any point during the global financial crisis. Furthermore, the current unemployment rate of 11.5% belies significant dispersion among the member countries. In Spain, the unemployment rate is at an unsustainable 24%; in Greece, it is even higher, at 26%. In France and Italy, the rates are over 10% and 13%, respectively. Germany is the lone exception, with unemployment at 4.9%. Such high rates in the Eurozone outside Germany have been the source of some unrest over the last few years and will likely contribute to political uncertainty in the Eurozone in 2015—a risk we will discuss later in this section.
In Japan, pro-labor practices and a declining working age population have kept unemployment in a relatively narrow band: it has ranged between 3.5% and 5.5% since 1998. Relative to its pre-crisis trough, Japan has outperformed the United States on this score.
Job gains in emerging markets have put their labor markets on par with improvement in the United States. While unemployment statistics are not directly comparable to those of developed markets due to larger informal sectors in emerging markets, it is surprising that such rapid growth rates in these countries have not reduced unemployment rates further. Their double-digit growth rates have brought their average
Exhibit 12: Change in Budget Deficits Since 2009The US has substantially reduced its budget deficits since 2009.
-7.0-8.0
-3.5 -3.4 -2.8 -2.4
-5.4-6.1
-9.0
-13.0
-3.3
-1.7
-14%
-12%
-10%
-8%
-6%
-4%
-2%
0%
US Fe
dera
l*
US G
ener
al
Euro
zone
Germ
any
Fran
ce
Italy
Spai
n
Portu
gal
Irela
nd
Gree
ce
Japa
n
EM
Narrower deficits
Change Relative to 2009
Narrower deficits
Change Relative to 2009
Data through 2014. Source: Investment Strategy Group, Datastream, IMF. * Refers to realized fiscal year numbers.
Exhibit 13: Unemployment RatesThe US labor market’s dramatic improvement contrasts with marginal progress elsewhere.
2%
3%
4%
5%
6%
7%
8%
9%
10%
11%
12%
13%
2005 2006 2007 2008 2009 2010 2011 2012 2013 2014
USEurozoneJapanEM
Data through November 2014. Note: EM line based on weighted average of Brazil, Chile, China, Colombia, Czech Republic, Hong Kong, Hungary, India, Indonesia, Israel, Korea, Malaysia, Mexico, Peru, Philippines, Poland, Russia, Singapore, South Africa, Taiwan and Thailand. Source: Investment Strategy Group, Datastream, IMF.
Outlook Investment Strategy Group 13
unemployment rates down to 5.7%, 0.3 percentage points below the pre-crisis trough and very close to that of the United States.
Turning to inflation, the United States has been more successful in approaching its core inflation target of 2%. As seen in Exhibit 14, inflation is very low in the Eurozone and Japan, with inflation in the Eurozone on a declining trajectory since late 2011. A more detailed discussion of our outlook for inflation in these countries and regions appears in Section II.
Energy Sector: Another point of differentiation between the United States and key developed and emerging economies is the energy sector. As early as 2009, we referenced the rich natural resources of the United States.8 In our 2013 Outlook, Over the Horizon, we outlined the comparative advantage of the United States across most natural resources and highlighted how the United States has “widened its lead over other major countries” in oil and natural gas.
The US energy resurgence has exceeded expectations. Since hitting a low point in 2008, US proven oil reserves have increased by 55.6% (or 15.8 billion barrels) as of 2013. Over the same period, US proven natural gas reserves have increased by 34.9% (or 2.4 trillion cubic meters). Along with the increase in reserves, we have seen
a significant increase in production. Since the end of 2007, production of US crude oil and natural gas liquids (a byproduct of the crude oil extraction and refining) has increased by 4.6 million barrels per day, accounting for 80% of the total increase in world production. In November 2012, the International Energy Agency (IEA) forecast that the US would become the world’s largest oil producer by 2020, surpassing Russia and Saudi Arabia.9 Impressively, as shown in Exhibit 15, what was expected to take eight years has occurred in only two.
The economic and geopolitical implications of these energy gains are far-reaching for the United States and its competitive position.
Widening Gap across Financial Markets
Performance and Market Share: US equities have far outperformed other major equity markets since the trough of the financial crisis. The United States now accounts for 52.4% of the float-adjusted market capitalization of the MSCI All Country World Index, compared with 42.7% at pre-crisis peak levels. Looking at the largest 15 equity markets in the index, only three other countries showed any increase in market share: China, with a slight increase of 0.4 percentage points, Switzerland, with 0.3 percentage points,
Exhibit 14: Core InflationUS inflation is running closest to the desired 2% level.
-2.0%
-1.5%
-1.0%
-0.5%
0.0%
0.5%
1.0%
1.5%
2.0%
2.5%
3.0%
3.5%
2005 2006 2007 2008 2009 2010 2011 2012 2013 2014
USEurozoneJapan
%YoY
Data through November 2014. Note: Data for Japan exclude the impact of the VAT hike in April 2014. Source: Investment Strategy Group, Datastream.
Exhibit 15: Crude and Natural Gas Liquids ProductionThe US has become the largest energy producer six years earlier than expected.
11.711.610.6
0
2
4
6
8
10
12
14
1980 1984 1988 1992 1996 2000 2004 2008 2012
USSaudi ArabiaRussia
mmb/d, annual averages
Data through 2014. Source: Investment Strategy Group, US Department of Energy.

Goldman Sachs january 2015 14
and Taiwan, with an even more negligible 0.1 percentage points. The rest of the equity markets lost market share, led by the Eurozone’s 5.1 percentage point decline, as shown in Exhibit 16. While many investors overinvested in emerging
markets in anticipation of higher returns and a growing share of world equity indexes, the share of emerging market equities dropped by 0.4 percentage points over this period.
Does this outperformance by US equities reflect improving fundamentals of the corporate sector or an overvaluation of US equities?
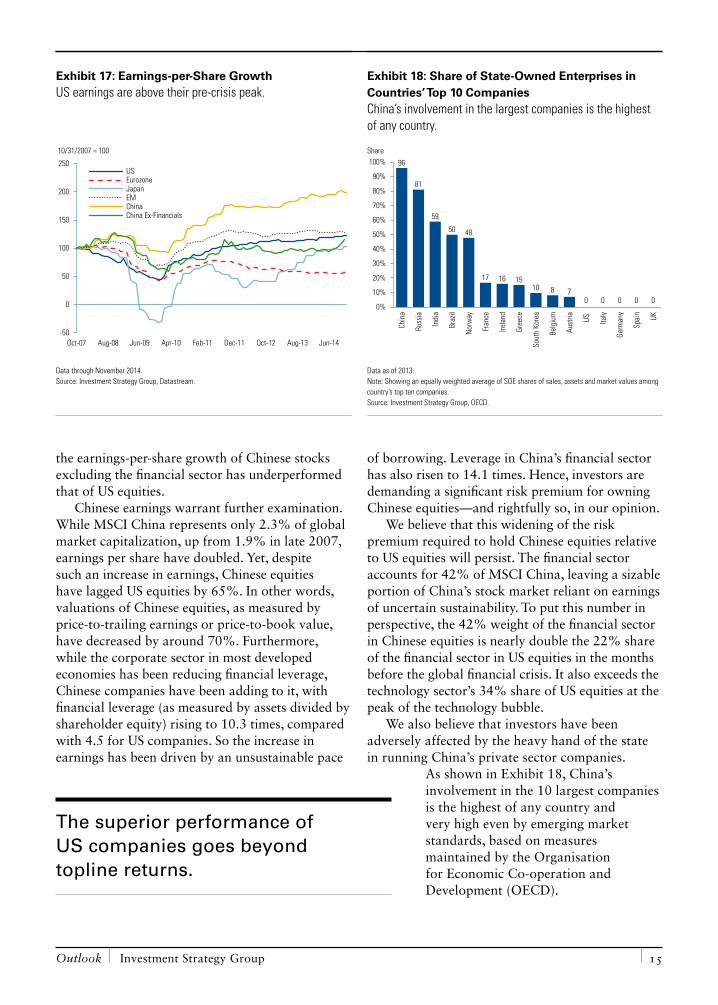
Earnings: The superior performance of US companies goes beyond topline returns and can be seen across several metrics, starting with earnings per share. Earnings per share in the United States have increased significantly from their 2009 trough and their pre-crisis peak in the third quarter of 2007, as shown in Exhibit 17. In contrast, corporate earnings in the Eurozone are well below their pre-crisis peak. In Japan, earnings are about the same level as in the third quarter of 2007.
On the surface, earnings growth in emerging markets has slightly outpaced that of the United States. However, US companies have enjoyed a steady increase in earnings from the trough of the crisis while emerging market equities have remained basically flat for the last 3.5 years and are below their 2011 peak levels. We also note that China’s financial sector accounts for all of this slight outperformance. As shown in Exhibit 17,
Exhibit 16: Global Market ShareUS equities now account for more than half of the global market.
WeightCurrent Change vs. 2007
United States 52.4% 9.7%United Kingdom 7.1% -2.7%Japan 7.2% -1.6%Canada 3.6% -0.2%France 3.3% -1.2%Switzerland 3.1% 0.3%Germany 3.1% -0.6%Australia 2.5% -0.4%China 2.3% 0.4%Korea 1.5% -0.1%Taiwan 1.3% 0.1%Spain 1.2% -0.6%Brazil 0.9% -0.4%India 0.7% –Russia 0.3% -0.6%Eurozone 10.2% -5.1%EM 10.3% -0.4%
Data as of December 31, 2014. Note: Based on MSCI All Country World Index weghts. Showing changes relative to October 9, 2007. Source: Investment Strategy Group, Datastream, MSCI.
The US energy resurgence has been swifter and stronger than expected.
Outlook Investment Strategy Group 15
the earnings-per-share growth of Chinese stocks excluding the financial sector has underperformed that of US equities.
Chinese earnings warrant further examination. While MSCI China represents only 2.3% of global market capitalization, up from 1.9% in late 2007, earnings per share have doubled. Yet, despite such an increase in earnings, Chinese equities have lagged US equities by 65%. In other words, valuations of Chinese equities, as measured by price-to-trailing earnings or price-to-book value, have decreased by around 70%. Furthermore, while the corporate sector in most developed economies has been reducing financial leverage, Chinese companies have been adding to it, with financial leverage (as measured by assets divided by shareholder equity) rising to 10.3 times, compared with 4.5 for US companies. So the increase in earnings has been driven by an unsustainable pace
of borrowing. Leverage in China’s financial sector has also risen to 14.1 times. Hence, investors are demanding a significant risk premium for owning Chinese equities—and rightfully so, in our opinion.
We believe that this widening of the risk premium required to hold Chinese equities relative to US equities will persist. The financial sector accounts for 42% of MSCI China, leaving a sizable portion of China’s stock market reliant on earnings of uncertain sustainability. To put this number in perspective, the 42% weight of the financial sector in Chinese equities is nearly double the 22% share of the financial sector in US equities in the months before the global financial crisis. It also exceeds the technology sector’s 34% share of US equities at the peak of the technology bubble.
We also believe that investors have been adversely affected by the heavy hand of the state in running China’s private sector companies.
As shown in Exhibit 18, China’s involvement in the 10 largest companies is the highest of any country and very high even by emerging market standards, based on measures maintained by the Organisation for Economic Co-operation and Development (OECD).
Exhibit 17: Earnings-per-Share GrowthUS earnings are above their pre-crisis peak.
-50
0
50
100
150
200
250
Oct-07 Aug-08 Jun-09 Apr-10 Feb-11 Dec-11 Oct-12 Aug-13 Jun-14
USEurozoneJapanEMChinaChina Ex-Financials
10/31/2007 = 100
Data through November 2014. Source: Investment Strategy Group, Datastream.
Exhibit 18: Share of State-Owned Enterprises in Countries’ Top 10 CompaniesChina’s involvement in the largest companies is the highest of any country.
96
81
59
50 48
17 16 1510 8 7
0 0 0 0 00%
10%
20%
30%
40%
50%
60%
70%
80%
90%
100%
Chin
a
Russ
ia
Indi
a
Braz
il
Nor
way
Fran
ce
Irela
nd
Gree
ce
Sout
h Ko
rea
Belg
ium
Aust
ria US Italy
Germ
any
Spai
n
UK
Share
Data as of 2013. Note: Showing an equally weighted average of SOE shares of sales, assets and market values among country’s top ten companies. Source: Investment Strategy Group, OECD.
The superior performance of US companies goes beyond topline returns.
Goldman Sachs january 2015 16
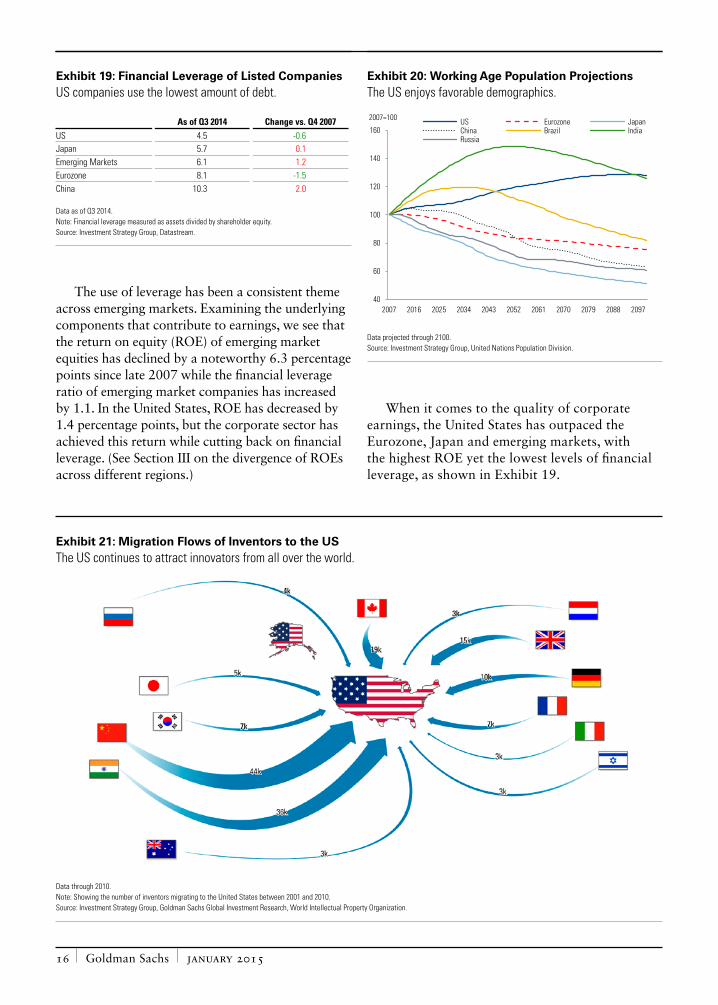
The use of leverage has been a consistent theme across emerging markets. Examining the underlying components that contribute to earnings, we see that the return on equity (ROE) of emerging market equities has declined by a noteworthy 6.3 percentage points since late 2007 while the financial leverage ratio of emerging market companies has increased by 1.1. In the United States, ROE has decreased by 1.4 percentage points, but the corporate sector has achieved this return while cutting back on financial leverage. (See Section III on the divergence of ROEs across different regions.)
When it comes to the quality of corporate earnings, the United States has outpaced the Eurozone, Japan and emerging markets, with the highest ROE yet the lowest levels of financial leverage, as shown in Exhibit 19.
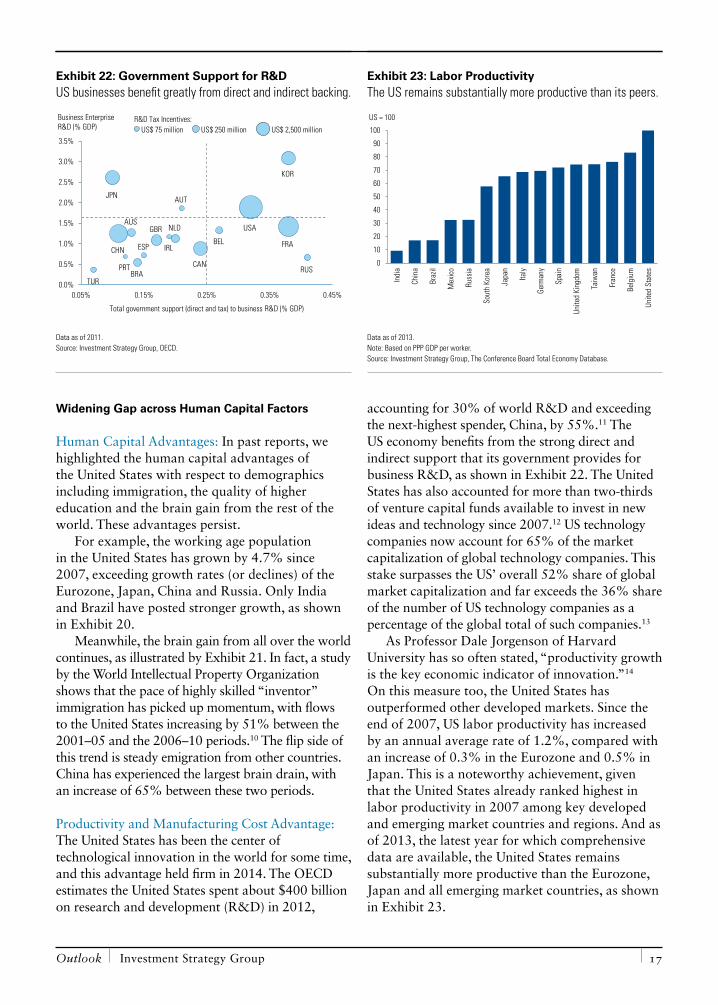
Exhibit 21: Migration Flows of Inventors to the USThe US continues to attract innovators from all over the world.
Data through 2010. Note: Showing the number of inventors migrating to the United States between 2001 and 2010. Source: Investment Strategy Group, Goldman Sachs Global Investment Research, World Intellectual Property Organization.
Exhibit 20: Working Age Population ProjectionsThe US enjoys favorable demographics.
40
60
80
100
120
140
160
2007 2016 2025 2034 2043 2052 2061 2070 2079 2088 2097
US Eurozone JapanChina Brazil IndiaRussia
2007=100
Data projected through 2100. Source: Investment Strategy Group, United Nations Population Division.
Exhibit 19: Financial Leverage of Listed CompaniesUS companies use the lowest amount of debt.
As of Q3 2014 Change vs. Q4 2007US 4.5 -0.6Japan 5.7 0.1Emerging Markets 6.1 1.2Eurozone 8.1 -1.5China 10.3 2.0
Data as of Q3 2014. Note: Financial leverage measured as assets divided by shareholder equity. Source: Investment Strategy Group, Datastream.
Outlook Investment Strategy Group 17
Widening Gap across Human Capital Factors
Human Capital Advantages: In past reports, we highlighted the human capital advantages of the United States with respect to demographics including immigration, the quality of higher education and the brain gain from the rest of the world. These advantages persist.
For example, the working age population in the United States has grown by 4.7% since 2007, exceeding growth rates (or declines) of the Eurozone, Japan, China and Russia. Only India and Brazil have posted stronger growth, as shown in Exhibit 20.
Meanwhile, the brain gain from all over the world continues, as illustrated by Exhibit 21. In fact, a study by the World Intellectual Property Organization shows that the pace of highly skilled “inventor” immigration has picked up momentum, with flows to the United States increasing by 51% between the 2001–05 and the 2006–10 periods.10 The flip side of this trend is steady emigration from other countries. China has experienced the largest brain drain, with an increase of 65% between these two periods.
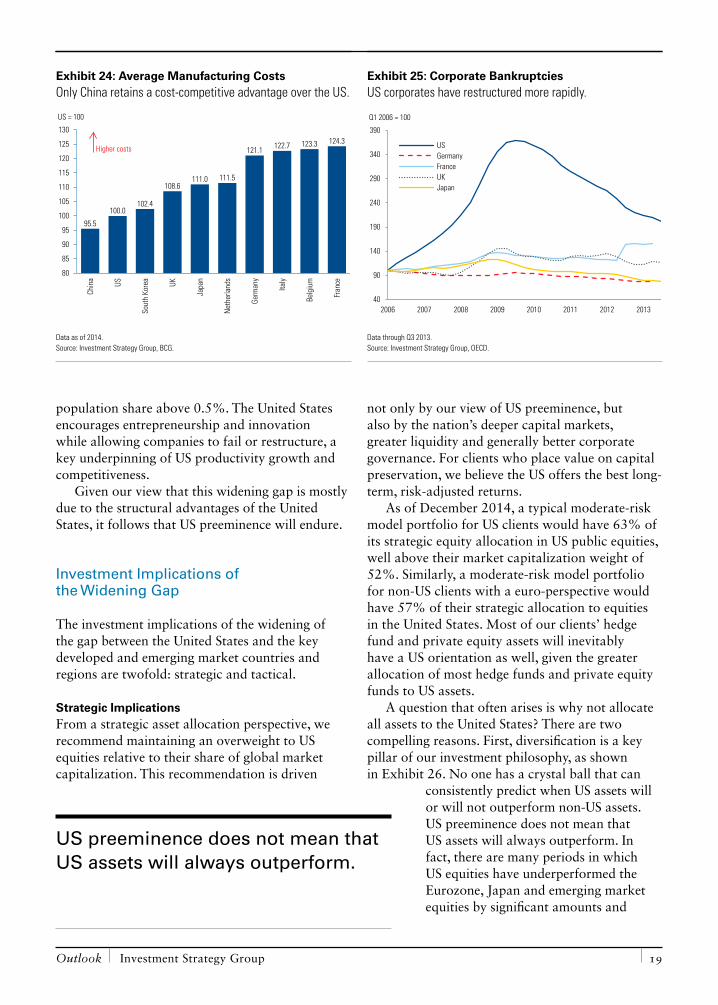
Productivity and Manufacturing Cost Advantage: The United States has been the center of technological innovation in the world for some time, and this advantage held firm in 2014. The OECD estimates the United States spent about $400 billion on research and development (R&D) in 2012,
accounting for 30% of world R&D and exceeding the next-highest spender, China, by 55%.11 The US economy benefits from the strong direct and indirect support that its government provides for business R&D, as shown in Exhibit 22. The United States has also accounted for more than two-thirds of venture capital funds available to invest in new ideas and technology since 2007.12 US technology companies now account for 65% of the market capitalization of global technology companies. This stake surpasses the US’ overall 52% share of global market capitalization and far exceeds the 36% share of the number of US technology companies as a percentage of the global total of such companies.13
As Professor Dale Jorgenson of Harvard University has so often stated, “productivity growth is the key economic indicator of innovation.”14 On this measure too, the United States has outperformed other developed markets. Since the end of 2007, US labor productivity has increased by an annual average rate of 1.2%, compared with an increase of 0.3% in the Eurozone and 0.5% in Japan. This is a noteworthy achievement, given that the United States already ranked highest in labor productivity in 2007 among key developed and emerging market countries and regions. And as of 2013, the latest year for which comprehensive data are available, the United States remains substantially more productive than the Eurozone, Japan and all emerging market countries, as shown in Exhibit 23.
Exhibit 22: Government Support for R&DUS businesses benefit greatly from direct and indirect backing.
USA
FRACHN
JPN
KOR
CAN
GBR NLD
BRA
AUS
BEL
RUSTUR
ESP
AUT
IRL
PRT
0.0%
0.5%
1.0%
1.5%
2.0%
2.5%
3.0%
3.5%
0.05% 0.15% 0.25% 0.35% 0.45%
Total government support (direct and tax) to business R&D (% GDP)
Business Enterprise R&D (% GDP)
R&D Tax Incentives: US$ 75 million US$ 250 million US$ 2,500 million
Data as of 2011. Source: Investment Strategy Group, OECD.
Exhibit 23: Labor ProductivityThe US remains substantially more productive than its peers.
0
10
20
30
40
50
60
70
80
90
100
Indi
a
Chin
a
Braz
il
Mex
ico
Russ
ia
Sout
h Ko
rea
Japa
n
Italy
Germ
any
Spai
n
Unite
d Ki
ngdo
m
Taiw
an
Fran
ce
Belg
ium
Unite
d St
ates
US = 100
Data as of 2013. Note: Based on PPP GDP per worker. Source: Investment Strategy Group, The Conference Board Total Economy Database.

Goldman Sachs january 2015 18
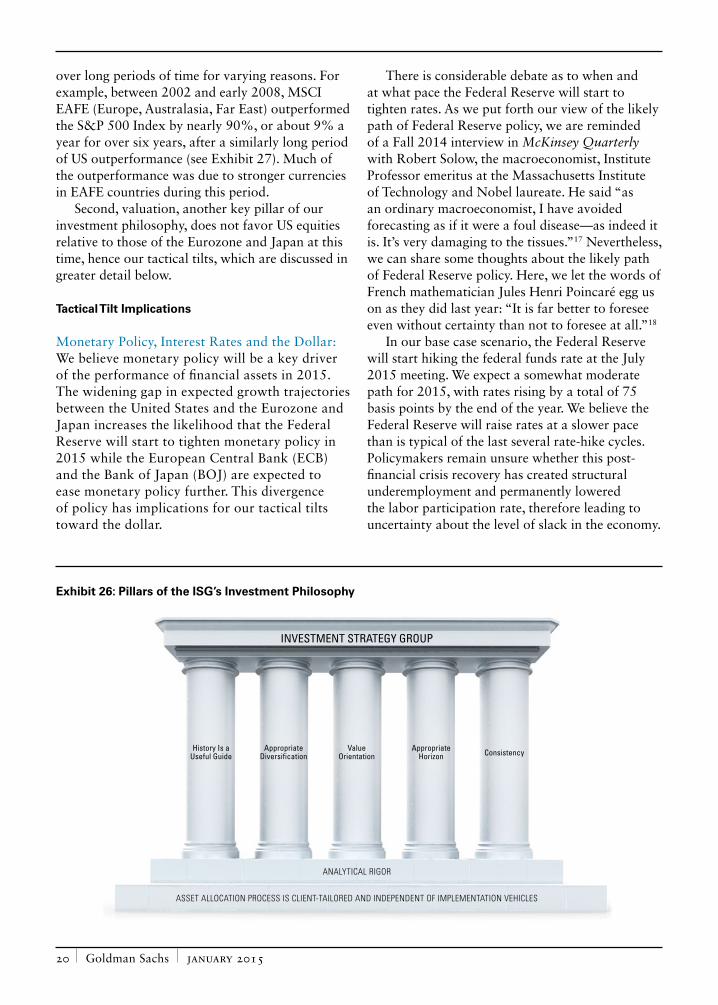
An April 2014 analysis by the Boston Consulting Group (BCG) shows that the only country among the world’s 10 largest exporters with a cost-competitive advantage over the US is China, as shown in Exhibit 24. That said, with the exception of the Netherlands, all countries have actually lost ground relative to the US over the last 10 years. Even China will continue to see its manufacturing competitiveness erode. If both countries maintain the same change in components of manufacturing costs, including productivity changes, as they have over the last 10 years, BCG estimates that China will actually be less competitive than the US by 2018. Such a shift would improve the competitiveness of US exports in very short order.
Is the Widening Gap Cyclical or Structural?Some have suggested that this widening gap between the United States and other developed and emerging market countries is cyclical and the United States has simply recovered faster. While there are some cyclical components to this widening gap, we believe that the differences are primarily structural.
As outlined in past Outlooks and touched upon here, the United States has major structural advantages over other key countries and regions,
including favorable demographics, immigration, productivity, economic diversity and wealth of resources. The United States also has a resilience and responsiveness that stands out and takes many forms. For example, US monetary policy has been aggressive and decisive in trying to stimulate economic activity since the financial crisis, while that of Europe and Japan has been incremental and hesitant. US regulators implemented bank stress tests earlier and more rigorously than their counterparts in the Eurozone.
While it is fashionable to complain about dysfunction in Washington, DC, the United States dealt with its major structural fault line—its debt profile—in a relatively short period of time, through several key pieces of legislation including the Budget Control Act, the American Taxpayer Relief Act and other discretionary spending cuts to implement fiscal reform in the aftermath of the global financial crisis.
The corporate sector also restructured rapidly, allowing for a far greater number of bankruptcies, as shown in Exhibit 25. The resilience of corporate America is probably best seen through the prism of two rankings: the United States ranks number one in the Index of Economic Freedom15 and the Ease of Doing Business16 among all countries with world GDP share above 2.5% and world
The US ranks among the top countries for labor productivity and cost-competitive manufacturing.
Outlook Investment Strategy Group 19
population share above 0.5%. The United States encourages entrepreneurship and innovation while allowing companies to fail or restructure, a key underpinning of US productivity growth and competitiveness.
Given our view that this widening gap is mostly due to the structural advantages of the United States, it follows that US preeminence will endure.
Investment Implications of the Widening Gap
The investment implications of the widening of the gap between the United States and the key developed and emerging market countries and regions are twofold: strategic and tactical.
Strategic ImplicationsFrom a strategic asset allocation perspective, we recommend maintaining an overweight to US equities relative to their share of global market capitalization. This recommendation is driven
not only by our view of US preeminence, but also by the nation’s deeper capital markets, greater liquidity and generally better corporate governance. For clients who place value on capital preservation, we believe the US offers the best long-term, risk-adjusted returns.
As of December 2014, a typical moderate-risk model portfolio for US clients would have 63% of its strategic equity allocation in US public equities, well above their market capitalization weight of 52%. Similarly, a moderate-risk model portfolio for non-US clients with a euro-perspective would have 57% of their strategic allocation to equities in the United States. Most of our clients’ hedge fund and private equity assets will inevitably have a US orientation as well, given the greater allocation of most hedge funds and private equity funds to US assets.
A question that often arises is why not allocate all assets to the United States? There are two compelling reasons. First, diversification is a key pillar of our investment philosophy, as shown in Exhibit 26. No one has a crystal ball that can
consistently predict when US assets will or will not outperform non-US assets. US preeminence does not mean that US assets will always outperform. In fact, there are many periods in which US equities have underperformed the Eurozone, Japan and emerging market equities by significant amounts and
Exhibit 24: Average Manufacturing CostsOnly China retains a cost-competitive advantage over the US.
95.5
100.0102.4
108.6111.0 111.5
121.1 122.7 123.3 124.3
80
85
90
95
100
105
110
115
120
125
130
Chin
a
US
Sout
h Ko
rea
UK
Japa
n
Net
herla
nds
Germ
any
Italy
Belg
ium
Fran
ce
Higher costs
US = 100
Data as of 2014. Source: Investment Strategy Group, BCG.
Exhibit 25: Corporate BankruptciesUS corporates have restructured more rapidly.
40
90
140
190
240
290
340
390
2006 2007 2008 2009 2010 2011 2012 2013
USGermanyFranceUKJapan
Q1 2006 = 100
Data through Q3 2013. Source: Investment Strategy Group, OECD.
US preeminence does not mean that US assets will always outperform.
Goldman Sachs january 2015 20
over long periods of time for varying reasons. For example, between 2002 and early 2008, MSCI EAFE (Europe, Australasia, Far East) outperformed the S&P 500 Index by nearly 90%, or about 9% a year for over six years, after a similarly long period of US outperformance (see Exhibit 27). Much of the outperformance was due to stronger currencies in EAFE countries during this period.
Second, valuation, another key pillar of our investment philosophy, does not favor US equities relative to those of the Eurozone and Japan at this time, hence our tactical tilts, which are discussed in greater detail below.
Tactical Tilt Implications
Monetary Policy, Interest Rates and the Dollar: We believe monetary policy will be a key driver of the performance of financial assets in 2015. The widening gap in expected growth trajectories between the United States and the Eurozone and Japan increases the likelihood that the Federal Reserve will start to tighten monetary policy in 2015 while the European Central Bank (ECB) and the Bank of Japan (BOJ) are expected to ease monetary policy further. This divergence of policy has implications for our tactical tilts toward the dollar.
There is considerable debate as to when and at what pace the Federal Reserve will start to tighten rates. As we put forth our view of the likely path of Federal Reserve policy, we are reminded of a Fall 2014 interview in McKinsey Quarterly with Robert Solow, the macroeconomist, Institute Professor emeritus at the Massachusetts Institute of Technology and Nobel laureate. He said “as an ordinary macroeconomist, I have avoided forecasting as if it were a foul disease—as indeed it is. It’s very damaging to the tissues.”17 Nevertheless, we can share some thoughts about the likely path of Federal Reserve policy. Here, we let the words of French mathematician Jules Henri Poincaré egg us on as they did last year: “It is far better to foresee even without certainty than not to foresee at all.”18
In our base case scenario, the Federal Reserve will start hiking the federal funds rate at the July 2015 meeting. We expect a somewhat moderate path for 2015, with rates rising by a total of 75 basis points by the end of the year. We believe the Federal Reserve will raise rates at a slower pace than is typical of the last several rate-hike cycles. Policymakers remain unsure whether this post-financial crisis recovery has created structural underemployment and permanently lowered the labor participation rate, therefore leading to uncertainty about the level of slack in the economy.
Exhibit 26: Pillars of the ISG’s Investment Philosophy
INVESTMENT STRATEGY GROUP
History Is aUseful Guide
AppropriateDiversification
ValueOrientation
AppropriateHorizon Consistency
ASSET ALLOCATION PROCESS IS CLIENT-TAILORED AND INDEPENDENT OF IMPLEMENTATION VEHICLES
ANALYTICAL RIGOR
Exhibit 9: Pillars of the Investment Strategy Group’s Investment Philosophy
Outlook Investment Strategy Group 21
Since WWII, the average pace of interest rate hikes has been about 300 basis points a year over a tightening cycle, but this average includes the periods of high inflation in the mid-to-late 1970s and early 1980s. Excluding these periods, the average rate hike pace is about 200 basis points a year. The slowest pace occurred between 1954 and 1957, when the Federal Reserve hiked rates about 85 basis points a year. As shown in Exhibit 28, we expect a pace of about 100 basis points a year on average for 3.5 years, which is in line with the view of our colleagues in Goldman Sachs Global Investment Research’s economics research team.
Of course, as Federal Reserve Chair Janet Yellen has said on multiple occasions, policy will be determined by the most current and most comprehensive set of data, including leading indicators, growth, housing, unemployment and inflation.
Still, in the past, the Federal Reserve has underestimated the pace at which it acted to normalize rates. This underestimation was most pronounced in 1994, when the Federal Reserve’s policy projections were 190 basis points below where rates eventually landed one year later. Interestingly, in this cycle, the Federal Reserve’s projections are substantially above the path implied by the markets as well as our view, as shown in Exhibit 28.
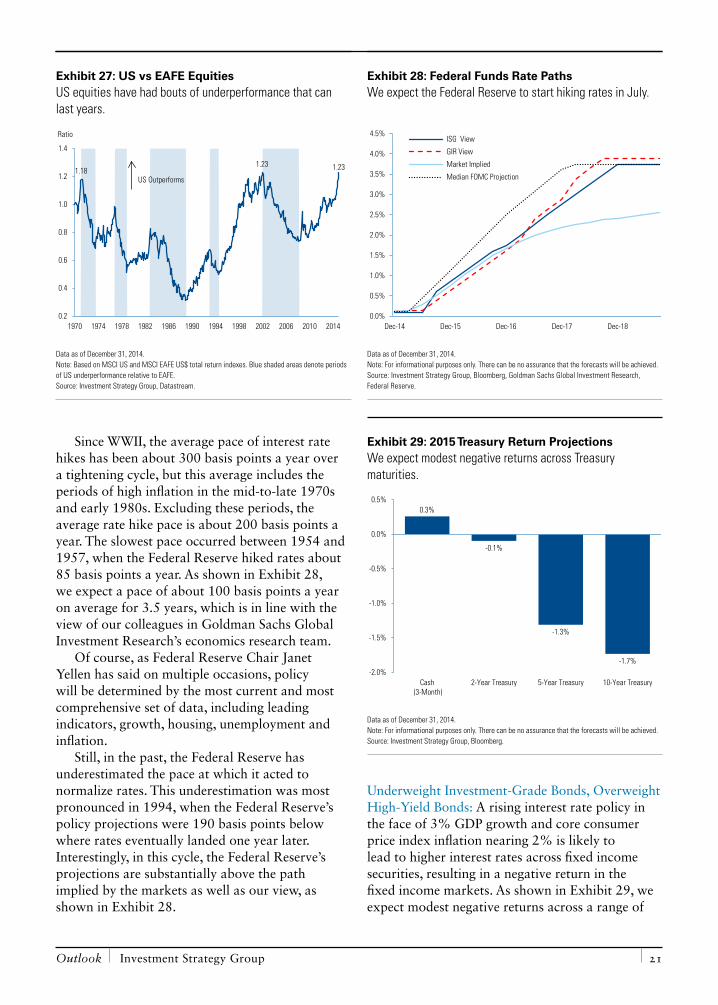
Underweight Investment-Grade Bonds, Overweight High-Yield Bonds: A rising interest rate policy in the face of 3% GDP growth and core consumer price index inflation nearing 2% is likely to lead to higher interest rates across fixed income securities, resulting in a negative return in the fixed income markets. As shown in Exhibit 29, we expect modest negative returns across a range of
Exhibit 27: US vs EAFE EquitiesUS equities have had bouts of underperformance that can last years.
1.181.23 1.23
0.2
0.4
0.6
0.8
1.0
1.2
1.4
1970 1974 1978 1982 1986 1990 1994 1998 2002 2006 2010 2014
Ratio
US Outperforms
Data as of December 31, 2014. Note: Based on MSCI US and MSCI EAFE US$ total return indexes. Blue shaded areas denote periods of US underperformance relative to EAFE. Source: Investment Strategy Group, Datastream.
Exhibit 28: Federal Funds Rate PathsWe expect the Federal Reserve to start hiking rates in July.
0.0%
0.5%
1.0%
1.5%
2.0%
2.5%
3.0%
3.5%
4.0%
4.5%
Dec-14 Dec-15 Dec-16 Dec-17 Dec-18
ISG View
GIR View
Market Implied
Median FOMC Projection
Data as of December 31, 2014. Note: For informational purposes only. There can be no assurance that the forecasts will be achieved. Source: Investment Strategy Group, Bloomberg, Goldman Sachs Global Investment Research, Federal Reserve.
Exhibit 29: 2015 Treasury Return ProjectionsWe expect modest negative returns across Treasury maturities.
0.3%
-0.1%
-1.3%
-1.7%-2.0%
-1.5%
-1.0%
-0.5%
0.0%
0.5%
Cash (3-Month)
2-Year Treasury 5-Year Treasury 10-Year Treasury
Data as of December 31, 2014. Note: For informational purposes only. There can be no assurance that the forecasts will be achieved. Source: Investment Strategy Group, Bloomberg.
Goldman Sachs january 2015 22
Treasury maturities in 2015. We recommend clients underweight investment-grade bonds both on an absolute basis and relative to other alternatives.
As we did last year, we recommend an overweight to high-yield bonds and bank loans. We expect both sectors to outperform investment-grade bonds and cash in 2015. High-yield spreads have widened significantly since mid-June 2014 as a result of the decline in oil prices and growing concerns about defaults in the high-yield energy sector. We do not expect default rates to reach levels priced by the market and believe that these higher incremental yield levels provide an attractive risk/return opportunity.
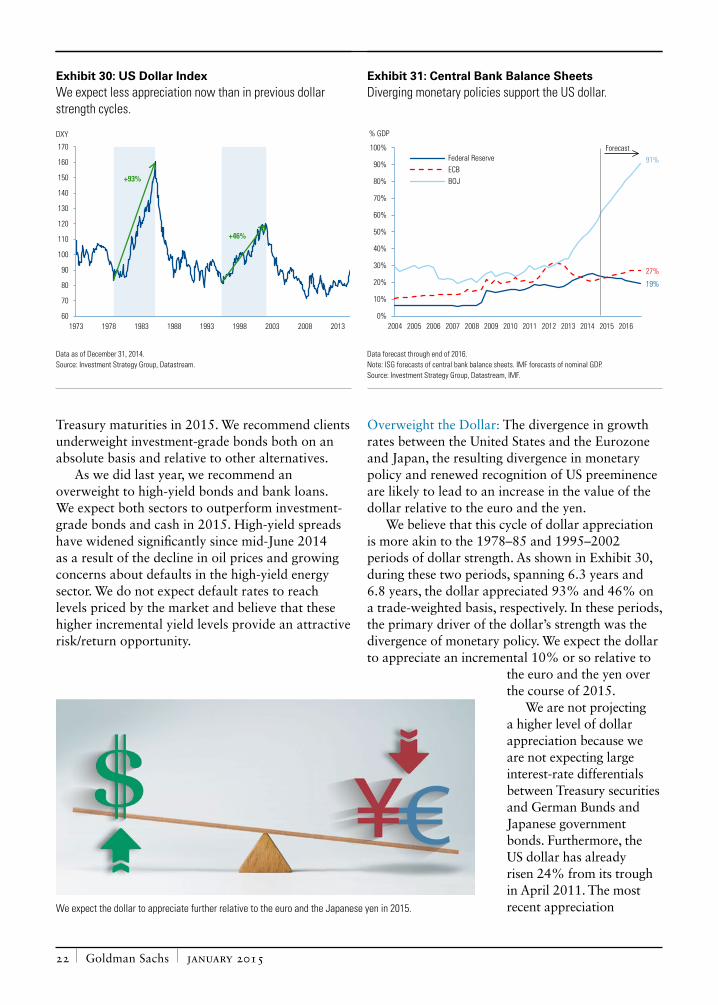
Overweight the Dollar: The divergence in growth rates between the United States and the Eurozone and Japan, the resulting divergence in monetary policy and renewed recognition of US preeminence are likely to lead to an increase in the value of the dollar relative to the euro and the yen.
We believe that this cycle of dollar appreciation is more akin to the 1978–85 and 1995–2002 periods of dollar strength. As shown in Exhibit 30, during these two periods, spanning 6.3 years and 6.8 years, the dollar appreciated 93% and 46% on a trade-weighted basis, respectively. In these periods, the primary driver of the dollar’s strength was the divergence of monetary policy. We expect the dollar to appreciate an incremental 10% or so relative to
the euro and the yen over the course of 2015.
We are not projecting a higher level of dollar appreciation because we are not expecting large interest-rate differentials between Treasury securities and German Bunds and Japanese government bonds. Furthermore, the US dollar has already risen 24% from its trough in April 2011. The most recent appreciation We expect the dollar to appreciate further relative to the euro and the Japanese yen in 2015.
Exhibit 30: US Dollar IndexWe expect less appreciation now than in previous dollar strength cycles.
60
70
80
90
100
110
120
130
140
150
160
170
1973 1978 1983 1988 1993 1998 2003 2008 2013
+93%
+46%
DXY
Data as of December 31, 2014. Source: Investment Strategy Group, Datastream.
Exhibit 31: Central Bank Balance SheetsDiverging monetary policies support the US dollar.
0%
10%
20%
30%
40%
50%
60%
70%
80%
90%
100%
2004 2005 2006 2007 2008 2009 2010 2011 2012 2013 2014 2015 2016
Federal ReserveECBBOJ
% GDP
Forecast91%
27%
19%
Data forecast through end of 2016. Note: ISG forecasts of central bank balance sheets. IMF forecasts of nominal GDP. Source: Investment Strategy Group, Datastream, IMF.
Outlook Investment Strategy Group 23
followed statements by ECB President Mario Draghi in November 2014 suggesting more significant measures to prevent the Eurozone from sliding into deflation and by BOJ Governor Haruhiko Kuroda in late October 2014 to increase Japan’s pace of quantitative easing to fight deflation. This divergence of monetary policy can also be seen in the projected balance sheets of the three central banks over the next two years, as shown in Exhibit 31.
The corollary to our view on US preeminence and a strong dollar is a negative view on gold. The correlation between gold and the dollar has been -0.36 since 1974. Even though gold has already declined almost 40% from peak levels in September 2011, we believe that gold prices have further downside given declining physical demand, a stronger dollar and rising US interest rates. We recommend a tactical allocation that is designed to benefit from declining gold prices with some downside protection.
Stay Fully Invested in US Equities: Given our view of the widening gap between the United States and key countries and regions, one might expect a tactical overweight to US equities. While we recommend an above-market capitalization weight strategically, we also recommend that clients not exceed the full strategic allocation at this time. As mentioned earlier,
the six-plus years of US equities’ outperformance have already discounted much of the US cyclical recovery and US structural preeminence.
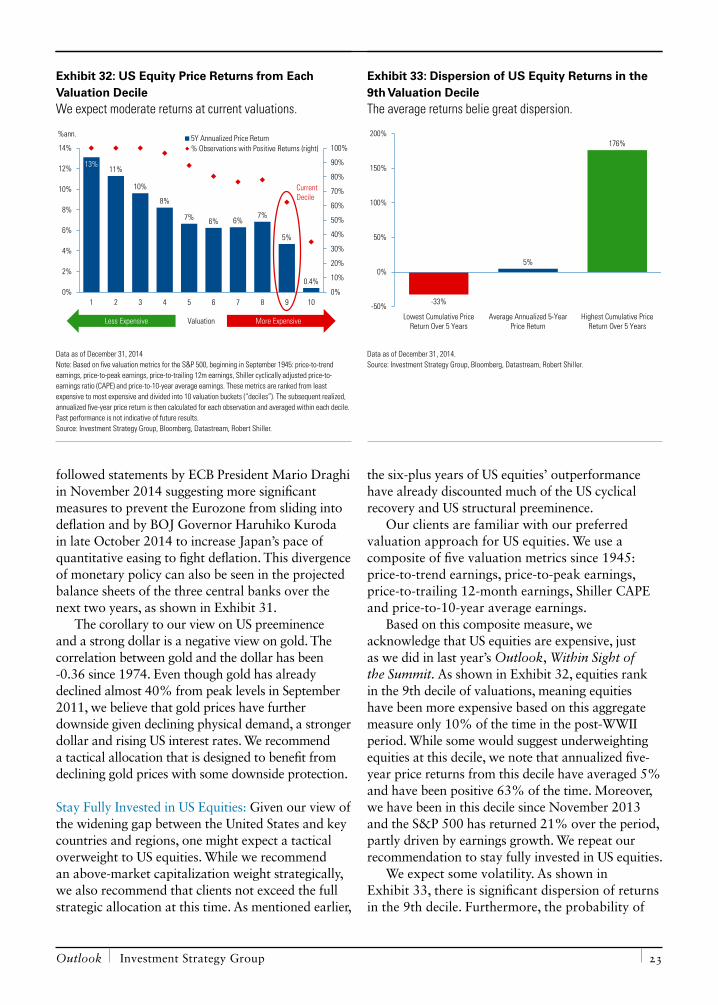
Our clients are familiar with our preferred valuation approach for US equities. We use a composite of five valuation metrics since 1945: price-to-trend earnings, price-to-peak earnings, price-to-trailing 12-month earnings, Shiller CAPE and price-to-10-year average earnings.
Based on this composite measure, we acknowledge that US equities are expensive, just as we did in last year’s Outlook, Within Sight of the Summit. As shown in Exhibit 32, equities rank in the 9th decile of valuations, meaning equities have been more expensive based on this aggregate measure only 10% of the time in the post-WWII period. While some would suggest underweighting equities at this decile, we note that annualized five-year price returns from this decile have averaged 5% and have been positive 63% of the time. Moreover, we have been in this decile since November 2013 and the S&P 500 has returned 21% over the period, partly driven by earnings growth. We repeat our recommendation to stay fully invested in US equities.
We expect some volatility. As shown in Exhibit 33, there is significant dispersion of returns in the 9th decile. Furthermore, the probability of
Exhibit 32: US Equity Price Returns from Each Valuation DecileWe expect moderate returns at current valuations.
13%11%
10%
8%
7% 6% 6%7%
5%
0.4%0%
10%
20%
30%
40%
50%
60%
70%
80%
90%
100%
0%
2%
4%
6%
8%
10%
12%
14%
1 2 3 4 5 6 7 8 9 10
5Y Annualized Price Return% Observations with Positive Returns (right)
%ann.
More ExpensiveValuation
CurrentDecile
Less Expensive
Data as of December 31, 2014 Note: Based on five valuation metrics for the S&P 500, beginning in September 1945: price-to-trend earnings, price-to-peak earnings, price-to-trailing 12m earnings, Shiller cyclically adjusted price-to-earnings ratio (CAPE) and price-to-10-year average earnings. These metrics are ranked from least expensive to most expensive and divided into 10 valuation buckets (“deciles”). The subsequent realized, annualized five-year price return is then calculated for each observation and averaged within each decile. Past performance is not indicative of future results. Source: Investment Strategy Group, Bloomberg, Datastream, Robert Shiller.
Exhibit 33: Dispersion of US Equity Returns in the 9th Valuation DecileThe average returns belie great dispersion.
-33%
5%
176%
-50%
0%
50%
100%
150%
200%
Lowest Cumulative PriceReturn Over 5 Years
Average Annualized 5-YearPrice Return
Highest Cumulative PriceReturn Over 5 Years
Data as of December 31, 2014. Source: Investment Strategy Group, Bloomberg, Datastream, Robert Shiller.
Goldman Sachs january 2015 24
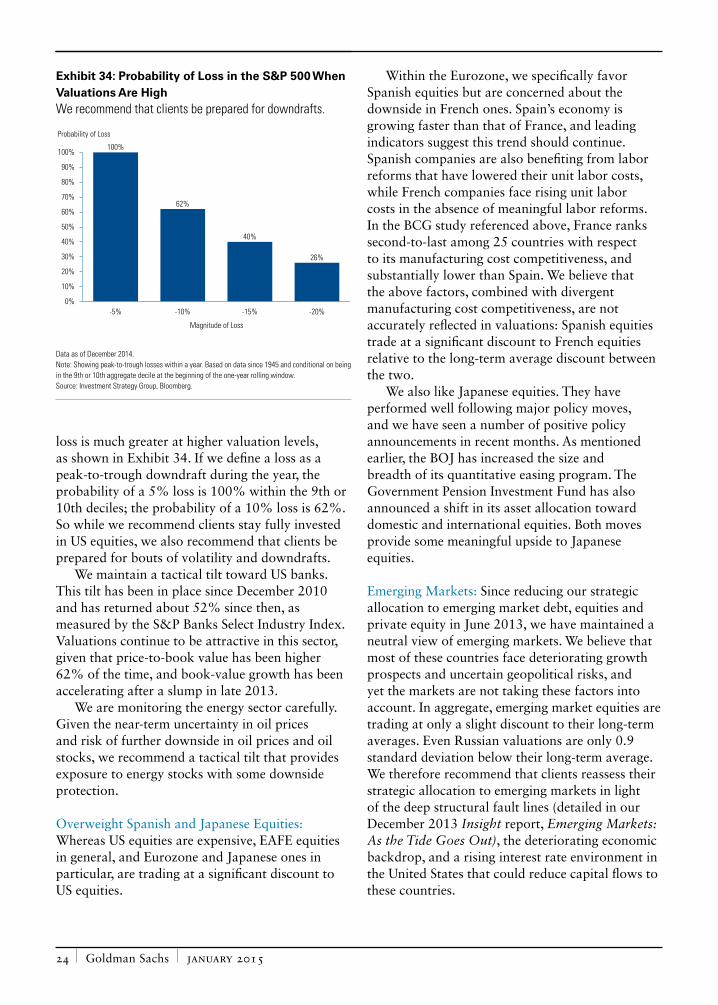
loss is much greater at higher valuation levels, as shown in Exhibit 34. If we define a loss as a peak-to-trough downdraft during the year, the probability of a 5% loss is 100% within the 9th or 10th deciles; the probability of a 10% loss is 62%. So while we recommend clients stay fully invested in US equities, we also recommend that clients be prepared for bouts of volatility and downdrafts.
We maintain a tactical tilt toward US banks. This tilt has been in place since December 2010 and has returned about 52% since then, as measured by the S&P Banks Select Industry Index. Valuations continue to be attractive in this sector, given that price-to-book value has been higher 62% of the time, and book-value growth has been accelerating after a slump in late 2013.
We are monitoring the energy sector carefully. Given the near-term uncertainty in oil prices and risk of further downside in oil prices and oil stocks, we recommend a tactical tilt that provides exposure to energy stocks with some downside protection.
Overweight Spanish and Japanese Equities: Whereas US equities are expensive, EAFE equities in general, and Eurozone and Japanese ones in particular, are trading at a significant discount to US equities.
Within the Eurozone, we specifically favor Spanish equities but are concerned about the downside in French ones. Spain’s economy is growing faster than that of France, and leading indicators suggest this trend should continue. Spanish companies are also benefiting from labor reforms that have lowered their unit labor costs, while French companies face rising unit labor costs in the absence of meaningful labor reforms. In the BCG study referenced above, France ranks second-to-last among 25 countries with respect to its manufacturing cost competitiveness, and substantially lower than Spain. We believe that the above factors, combined with divergent manufacturing cost competitiveness, are not accurately reflected in valuations: Spanish equities trade at a significant discount to French equities relative to the long-term average discount between the two.
We also like Japanese equities. They have performed well following major policy moves, and we have seen a number of positive policy announcements in recent months. As mentioned earlier, the BOJ has increased the size and breadth of its quantitative easing program. The Government Pension Investment Fund has also announced a shift in its asset allocation toward domestic and international equities. Both moves provide some meaningful upside to Japanese equities.
Emerging Markets: Since reducing our strategic allocation to emerging market debt, equities and private equity in June 2013, we have maintained a neutral view of emerging markets. We believe that most of these countries face deteriorating growth prospects and uncertain geopolitical risks, and yet the markets are not taking these factors into account. In aggregate, emerging market equities are trading at only a slight discount to their long-term averages. Even Russian valuations are only 0.9 standard deviation below their long-term average. We therefore recommend that clients reassess their strategic allocation to emerging markets in light of the deep structural fault lines (detailed in our December 2013 Insight report, Emerging Markets: As the Tide Goes Out), the deteriorating economic backdrop, and a rising interest rate environment in the United States that could reduce capital flows to these countries.
Exhibit 34: Probability of Loss in the S&P 500 When Valuations Are HighWe recommend that clients be prepared for downdrafts.
100%
62%
40%
26%
0%
10%
20%
30%
40%
50%
60%
70%
80%
90%
100%
-5% -10% -15% -20%
Magnitude of Loss
Probability of Loss
Data as of December 2014. Note: Showing peak-to-trough losses within a year. Based on data since 1945 and conditional on being in the 9th or 10th aggregate decile at the beginning of the one-year rolling window. Source: Investment Strategy Group, Bloomberg.
Outlook Investment Strategy Group 25
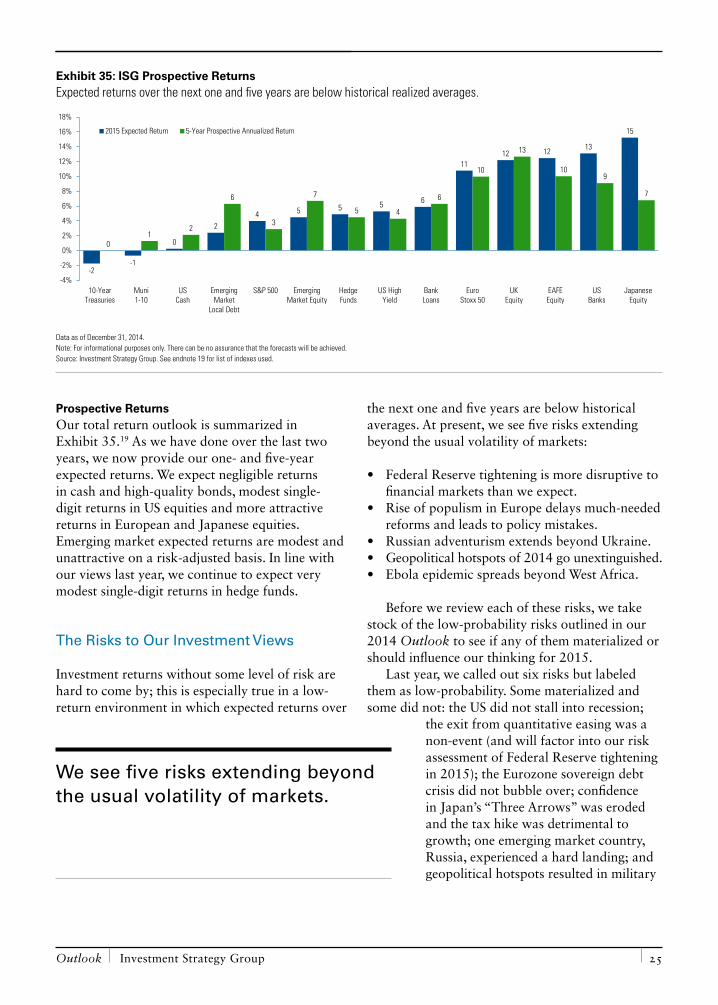
Prospective ReturnsOur total return outlook is summarized in Exhibit 35.19 As we have done over the last two years, we now provide our one- and five-year expected returns. We expect negligible returns in cash and high-quality bonds, modest single-digit returns in US equities and more attractive returns in European and Japanese equities. Emerging market expected returns are modest and unattractive on a risk-adjusted basis. In line with our views last year, we continue to expect very modest single-digit returns in hedge funds.
The Risks to Our Investment Views
Investment returns without some level of risk are hard to come by; this is especially true in a low-return environment in which expected returns over
the next one and five years are below historical averages. At present, we see five risks extending beyond the usual volatility of markets:
• Federal Reserve tightening is more disruptive to financial markets than we expect.
• Rise of populism in Europe delays much-needed reforms and leads to policy mistakes.
• Russian adventurism extends beyond Ukraine.• Geopolitical hotspots of 2014 go unextinguished.• Ebola epidemic spreads beyond West Africa.
Before we review each of these risks, we take stock of the low-probability risks outlined in our 2014 Outlook to see if any of them materialized or should influence our thinking for 2015.
Last year, we called out six risks but labeled them as low-probability. Some materialized and some did not: the US did not stall into recession;
the exit from quantitative easing was a non-event (and will factor into our risk assessment of Federal Reserve tightening in 2015); the Eurozone sovereign debt crisis did not bubble over; confidence in Japan’s “Three Arrows” was eroded and the tax hike was detrimental to growth; one emerging market country, Russia, experienced a hard landing; and geopolitical hotspots resulted in military
Exhibit 35: ISG Prospective ReturnsExpected returns over the next one and five years are below historical realized averages.
-2-1
0
24 5 5 5 6
1112 12 13
15
01
2
6
3
7
5 4
6
10
13
109
7
-4%
-2%
0%
2%
4%
6%
8%
10%
12%
14%
16%
18%
10-YearTreasuries
Muni1-10
USCash
EmergingMarket
Local Debt
S&P 500 EmergingMarket Equity
HedgeFunds
US HighYield
BankLoans
EuroStoxx 50
UKEquity
EAFEEquity
USBanks
JapaneseEquity
2015 Expected Return 5-Year Prospective Annualized Return
Data as of December 31, 2014. Note: For informational purposes only. There can be no assurance that the forecasts will be achieved. Source: Investment Strategy Group. See endnote 19 for list of indexes used.
We see five risks extending beyond the usual volatility of markets.
Goldman Sachs january 2015 26
engagement. Importantly, none of the realized risks derailed the US economy or slowed down the rise of US equities.
We are not carrying all these risks into 2015. As discussed earlier, the US economy is on a strong footing and has gained momentum, recovering from a surprisingly weak first quarter. While confidence in some aspects of Prime Minister Shinzo Abe’s “Three Arrows” intended to boost Japan’s economy and combat deflation has dissipated, confidence in the impact of the BOJ’s aggressive monetary policy has increased.
China may be viewed as being at risk of a hard economic landing, but we see this as unlikely. We expect China’s leadership to pursue the same policies they did in 2014 to avert a significant slowdown. China certainly has enough resources and reasons to prevent a hard landing.
Risks related to Federal Reserve tightening, along with political and geopolitical risks, may challenge our 2015 outlook.
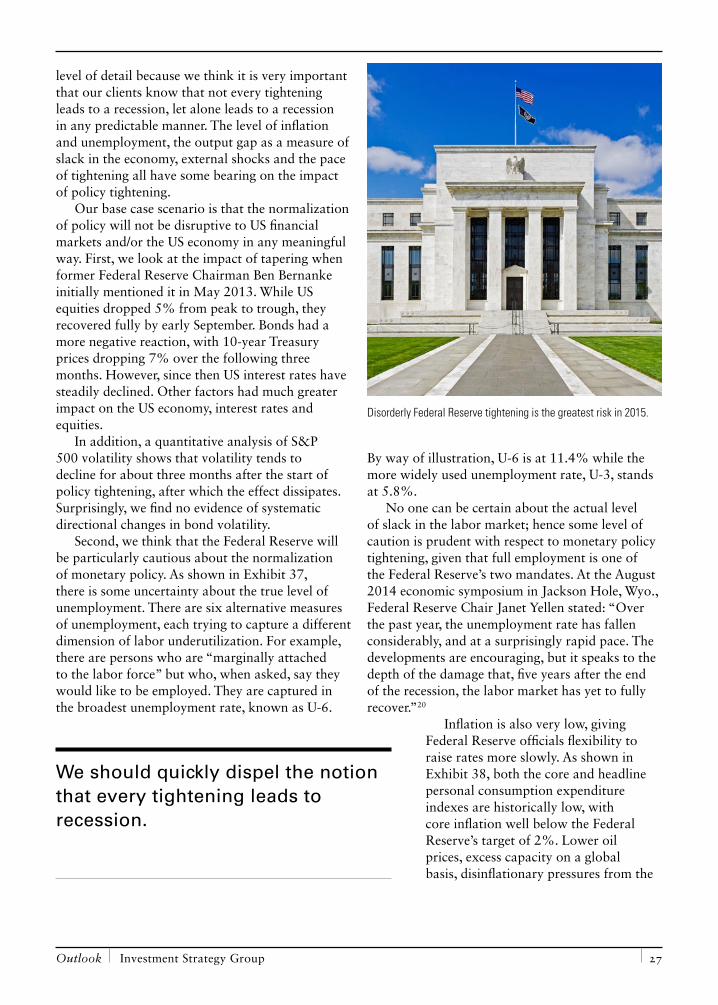
Federal Reserve Tightening The greatest risk to the US economy, and hence to our clients’ portfolios, is a disorderly start to the Federal Reserve’s normalization of interest rates. However, we think this is a low-probability risk.
While we cannot rule out some volatility in US financial assets in response to the first few interest rate hikes, we do not think that the normalization of policy will negatively impact US equities and/or lead to a recession in 2015.
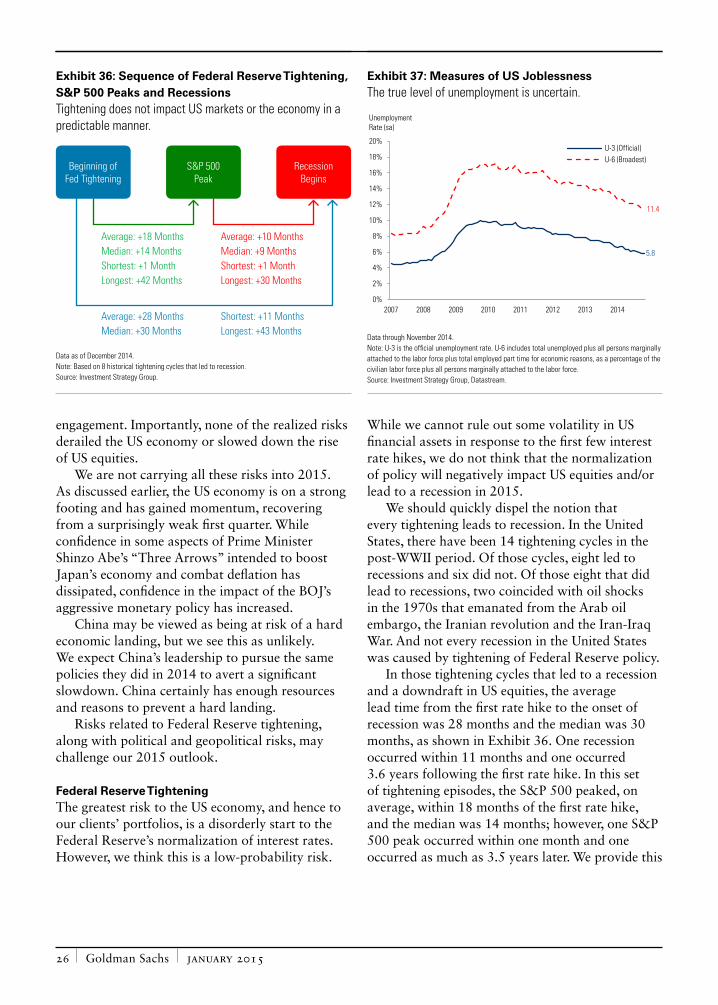
We should quickly dispel the notion that every tightening leads to recession. In the United States, there have been 14 tightening cycles in the post-WWII period. Of those cycles, eight led to recessions and six did not. Of those eight that did lead to recessions, two coincided with oil shocks in the 1970s that emanated from the Arab oil embargo, the Iranian revolution and the Iran-Iraq War. And not every recession in the United States was caused by tightening of Federal Reserve policy.
In those tightening cycles that led to a recession and a downdraft in US equities, the average lead time from the first rate hike to the onset of recession was 28 months and the median was 30 months, as shown in Exhibit 36. One recession occurred within 11 months and one occurred 3.6 years following the first rate hike. In this set of tightening episodes, the S&P 500 peaked, on average, within 18 months of the first rate hike, and the median was 14 months; however, one S&P 500 peak occurred within one month and one occurred as much as 3.5 years later. We provide this
Exhibit 36: Sequence of Federal Reserve Tightening, S&P 500 Peaks and RecessionsTightening does not impact US markets or the economy in a predictable manner.
Average: +18 MonthsMedian: +14 MonthsShortest: +1 MonthLongest: +42 Months
Average: +28 MonthsMedian: +30 Months
Average: +10 MonthsMedian: +9 MonthsShortest: +1 MonthLongest: +30 Months
Shortest: +11 MonthsLongest: +43 Months
Recession Begins
Beginning of Fed Tightening
S&P 500 Peak
Data as of December 2014. Note: Based on 8 historical tightening cycles that led to recession. Source: Investment Strategy Group.
Exhibit 37: Measures of US JoblessnessThe true level of unemployment is uncertain.
0%
2%
4%
6%
8%
10%
12%
14%
16%
18%
20%
2007 2008 2009 2010 2011 2012 2013 2014
U-3 (Official)U-6 (Broadest)
Unemployment Rate (sa)
11.4
5.8
Data through November 2014. Note: U-3 is the official unemployment rate. U-6 includes total unemployed plus all persons marginally attached to the labor force plus total employed part time for economic reasons, as a percentage of the civilian labor force plus all persons marginally attached to the labor force. Source: Investment Strategy Group, Datastream.
Outlook Investment Strategy Group 27
level of detail because we think it is very important that our clients know that not every tightening leads to a recession, let alone leads to a recession in any predictable manner. The level of inflation and unemployment, the output gap as a measure of slack in the economy, external shocks and the pace of tightening all have some bearing on the impact of policy tightening.
Our base case scenario is that the normalization of policy will not be disruptive to US financial markets and/or the US economy in any meaningful way. First, we look at the impact of tapering when former Federal Reserve Chairman Ben Bernanke initially mentioned it in May 2013. While US equities dropped 5% from peak to trough, they recovered fully by early September. Bonds had a more negative reaction, with 10-year Treasury prices dropping 7% over the following three months. However, since then US interest rates have steadily declined. Other factors had much greater impact on the US economy, interest rates and equities.
In addition, a quantitative analysis of S&P 500 volatility shows that volatility tends to decline for about three months after the start of policy tightening, after which the effect dissipates. Surprisingly, we find no evidence of systematic directional changes in bond volatility.
Second, we think that the Federal Reserve will be particularly cautious about the normalization of monetary policy. As shown in Exhibit 37, there is some uncertainty about the true level of unemployment. There are six alternative measures of unemployment, each trying to capture a different dimension of labor underutilization. For example, there are persons who are “marginally attached to the labor force” but who, when asked, say they would like to be employed. They are captured in the broadest unemployment rate, known as U-6.
By way of illustration, U-6 is at 11.4% while the more widely used unemployment rate, U-3, stands at 5.8%.
No one can be certain about the actual level of slack in the labor market; hence some level of caution is prudent with respect to monetary policy tightening, given that full employment is one of the Federal Reserve’s two mandates. At the August 2014 economic symposium in Jackson Hole, Wyo., Federal Reserve Chair Janet Yellen stated: “Over the past year, the unemployment rate has fallen considerably, and at a surprisingly rapid pace. The developments are encouraging, but it speaks to the depth of the damage that, five years after the end of the recession, the labor market has yet to fully recover.”20
Inflation is also very low, giving Federal Reserve officials flexibility to raise rates more slowly. As shown in Exhibit 38, both the core and headline personal consumption expenditure indexes are historically low, with core inflation well below the Federal Reserve’s target of 2%. Lower oil prices, excess capacity on a global basis, disinflationary pressures from the
Disorderly Federal Reserve tightening is the greatest risk in 2015.
We should quickly dispel the notion that every tightening leads to recession.
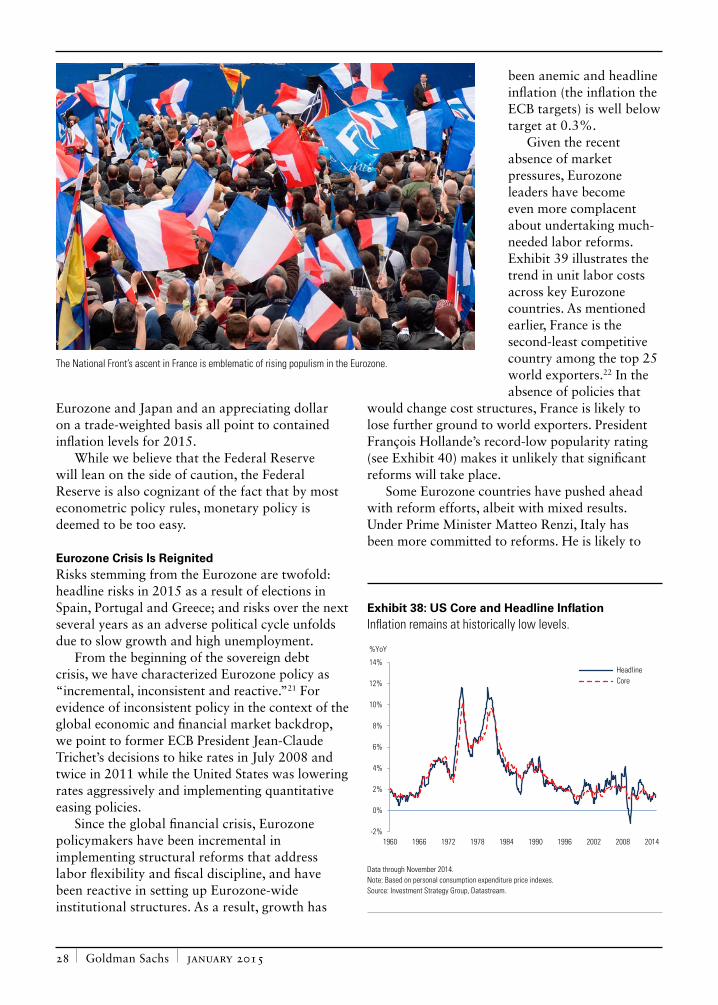
Goldman Sachs january 2015 28
Eurozone and Japan and an appreciating dollar on a trade-weighted basis all point to contained inflation levels for 2015.
While we believe that the Federal Reserve will lean on the side of caution, the Federal Reserve is also cognizant of the fact that by most econometric policy rules, monetary policy is deemed to be too easy.
Eurozone Crisis Is ReignitedRisks stemming from the Eurozone are twofold: headline risks in 2015 as a result of elections in Spain, Portugal and Greece; and risks over the next several years as an adverse political cycle unfolds due to slow growth and high unemployment.
From the beginning of the sovereign debt crisis, we have characterized Eurozone policy as “incremental, inconsistent and reactive.”21 For evidence of inconsistent policy in the context of the global economic and financial market backdrop, we point to former ECB President Jean-Claude Trichet’s decisions to hike rates in July 2008 and twice in 2011 while the United States was lowering rates aggressively and implementing quantitative easing policies.
Since the global financial crisis, Eurozone policymakers have been incremental in implementing structural reforms that address labor flexibility and fiscal discipline, and have been reactive in setting up Eurozone-wide institutional structures. As a result, growth has
been anemic and headline inflation (the inflation the ECB targets) is well below target at 0.3%.
Given the recent absence of market pressures, Eurozone leaders have become even more complacent about undertaking much-needed labor reforms. Exhibit 39 illustrates the trend in unit labor costs across key Eurozone countries. As mentioned earlier, France is the second-least competitive country among the top 25 world exporters.22 In the absence of policies that
would change cost structures, France is likely to lose further ground to world exporters. President François Hollande’s record-low popularity rating (see Exhibit 40) makes it unlikely that significant reforms will take place.
Some Eurozone countries have pushed ahead with reform efforts, albeit with mixed results. Under Prime Minister Matteo Renzi, Italy has been more committed to reforms. He is likely to
Exhibit 38: US Core and Headline InflationInflation remains at historically low levels.
-2%
0%
2%
4%
6%
8%
10%
12%
14%
1960 1966 1972 1978 1984 1990 1996 2002 2008 2014
HeadlineCore
%YoY
Data through November 2014. Note: Based on personal consumption expenditure price indexes. Source: Investment Strategy Group, Datastream.
The National Front’s ascent in France is emblematic of rising populism in the Eurozone.
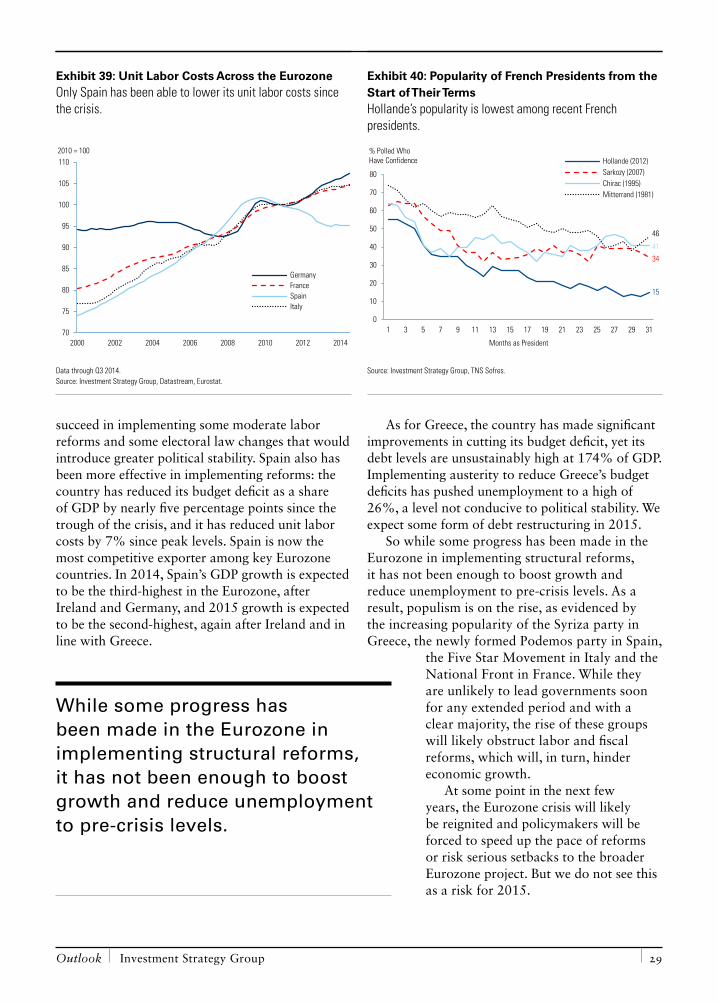
Outlook Investment Strategy Group 29
succeed in implementing some moderate labor reforms and some electoral law changes that would introduce greater political stability. Spain also has been more effective in implementing reforms: the country has reduced its budget deficit as a share of GDP by nearly five percentage points since the trough of the crisis, and it has reduced unit labor costs by 7% since peak levels. Spain is now the most competitive exporter among key Eurozone countries. In 2014, Spain’s GDP growth is expected to be the third-highest in the Eurozone, after Ireland and Germany, and 2015 growth is expected to be the second-highest, again after Ireland and in line with Greece.
As for Greece, the country has made significant improvements in cutting its budget deficit, yet its debt levels are unsustainably high at 174% of GDP. Implementing austerity to reduce Greece’s budget deficits has pushed unemployment to a high of 26%, a level not conducive to political stability. We expect some form of debt restructuring in 2015.
So while some progress has been made in the Eurozone in implementing structural reforms, it has not been enough to boost growth and reduce unemployment to pre-crisis levels. As a result, populism is on the rise, as evidenced by the increasing popularity of the Syriza party in Greece, the newly formed Podemos party in Spain,
the Five Star Movement in Italy and the National Front in France. While they are unlikely to lead governments soon for any extended period and with a clear majority, the rise of these groups will likely obstruct labor and fiscal reforms, which will, in turn, hinder economic growth.
At some point in the next few years, the Eurozone crisis will likely be reignited and policymakers will be forced to speed up the pace of reforms or risk serious setbacks to the broader Eurozone project. But we do not see this as a risk for 2015.
Exhibit 39: Unit Labor Costs Across the EurozoneOnly Spain has been able to lower its unit labor costs since the crisis.
70
75
80
85
90
95
100
105
110
2000 2002 2004 2006 2008 2010 2012 2014
GermanyFranceSpainItaly
2010 = 100
Data through Q3 2014. Source: Investment Strategy Group, Datastream, Eurostat.
Exhibit 40: Popularity of French Presidents from the Start of Their TermsHollande’s popularity is lowest among recent French presidents.
0
10
20
30
40
50
60
70
80
1 3 5 7 9 11 13 15 17 19 21 23 25 27 29 31
Months as President
Hollande (2012)Sarkozy (2007)Chirac (1995)Mitterrand (1981)
% Polled Who Have Confidence
46
41
34
15
Source: Investment Strategy Group, TNS Sofres.
While some progress has been made in the Eurozone in implementing structural reforms, it has not been enough to boost growth and reduce unemployment to pre-crisis levels.

Goldman Sachs january 2015 30
The “Unpredictable” President Vladimir Putin We in the Investment Strategy Group rely on the insights of external experts to formulate our views on geopolitical risks. We reach out to experts from prominent research groups, think tanks, universities and former and current government officials, both in the United States and abroad. When it comes to analyzing the rule and actions of Russian President Vladimir Putin, we find their views particularly instructive.
According to the editorial board of The New York Times, “President Vladimir Putin of Russia has shown himself to be a reckless and unpredictable provocateur in creating the worst conflict with the West since the Cold War.”23 Gernot Erler, the German government’s coordinator for Eastern European affairs, has also stated that “Russia has become unpredictable.”24 In our March 19, 2014, client call, Dr. Anders Aslund of the Peterson Institute for International Economics and former economic advisor to the Russian and Ukrainian governments discussed President Putin’s long-term goals, making comparisons to the geopolitical environment that led to WWII. In summary, his view is that “Russia can no longer be perceived as a status-quo power. Rather it has become a radical revisionist and revanchist state.”25 In a September 2014 Goldman Sachs Forum publication, Professor Nicholas Burns of the Harvard Kennedy School of Government and Under Secretary of State for Political Affairs between 2005 and 2008, stated that President Putin
“is a strategic thinker . . . a more sophisticated leader than people have given him credit for . . . and inclined to indirection,” whereby he would stand for peace publicly while subverting Ukraine behind the scenes.26 In our September 11, 2014, client call, Cliff Kupchan, Eurasia Group’s Chairman and Practice Head for Eurasia, stated that President Putin is “a horrible strategist” but “a great tactician.”27
President Putin has made it clear that he will not tolerate a move by countries along Russia’s southern and western borders that were once part of the former Soviet Union to shift their primary allegiance to the European Union (EU) or join the North Atlantic Treaty Organization (NATO). It is therefore highly unlikely that sanctions alone will force Russia to abandon southern and eastern Ukraine. Since Ukraine’s parliament voted to drop its nonaligned status and work toward NATO membership in late December 2014, significant uncertainty remains as to what President Putin will do if a move toward NATO membership progresses further.
Clearly, falling oil prices have only worsened Russia’s economic position. The economy is expected to contract sharply; we expect a decline of 3–5% in 2015. Russian markets will be volatile: the ruble had dropped almost 60% from its 2014 peak in early January, only to rebound 30% from its trough in the last few days of 2014. Russian equities have also been volatile, falling 18% from their 2014 highs in early January and ending the
year down 16%. Russia will be
a source of market volatility, placing at risk neighboring emerging market countries, as well as Western companies with businesses in Russia. A recession in Russia will have a greater impact on the Eurozone than on the United States.
None of these Russia risks impact our investment views. However, the fact that President Putin is unpredictable means that
Russia’s aggressive stance toward Ukraine remains a key uncertainty.

Outlook Investment Strategy Group 31
we may all be surprised by his next move, with the potential for a wide range of negative and positive implications for markets.
Geopolitical Risks of 2014 Spill Over into 2015The geopolitical risks of 2014 that carry over into 2015 are the conflict with the Islamic State of Iraq and the Levant (ISIL), the breakdown of the Iranian nuclear negotiations, the uncertainty surrounding North Korea’s next move and an oil shock from instability in Venezuela, Nigeria and Libya.
The fighting in Iraq and Syria will almost certainly continue as President Obama has declared his objective is to “degrade and destroy” ISIL.28 Combined with the rest of the civil war in Syria, the fighting has exacted a steep humanitarian toll. However, the conflict in the region has had a limited impact on global economies and financial markets. Our external experts believe that while
the threat of terrorism on US soil is not zero, ISIL is too preoccupied with fighting to hit United States targets at this time.
The Iran nuclear negotiations have been extended to June 30, 2015, following 10 months of negotiations between Iran and the P5+1 (United States, France, United Kingdom, Germany, Russia and China). The probability of a resolution has ranged between 30% and 60%, according to our external experts. We
think these diplomatic discussions will continue, as it is not in the parties’ interests to abandon them. Both the United States and Iran would like to avoid military confrontation, especially given the instability in Iraq, Syria, Afghanistan and Pakistan.
North Korea was back in the news in 2014. The planned release of a new Sony movie, The Interview, about North Korea’s leadership, sparked concerns about cybersecurity and outright threats of terrorism at movie theaters in the United States, ultimately eliciting a response from the White House. This episode reminded the world of North Korea’s unpredictable leader and its nuclear capability. Richard Haass, the president of the Council on Foreign Relations, warned recently that “it is only a matter of time before North Korea can place a nuclear warhead on . . . missiles capable of reaching the US.”29 There are also signs that China is concerned about North Korea’s unreliable
behavior.30 While our base case remains that North Korea will continue to garner headlines, we do not expect any meaningful military engagement with its neighbors or the United States.
Another low-probability risk is that of an oil supply shock from Venezuela, Nigeria or Libya. While the current level of oil prices and the excess supply are likely to persist in the first half of 2015, we cannot rule out supply disruptions. As some in the oil industry say of their business, “the biggest surprise is no surprise.”
The fighting in Iraq and Syria has exacted a steep humanitarian toll.
“President Vladimir Putin of Russia has shown himself to be a reckless and unpredictable provocateur in creating the worst conflict with the West since the Cold War.”23 – The New York Times

Goldman Sachs january 2015 32
Strikes by Venezuelan oil workers in November 2002 pushed production down by 2.4 million barrels per day in just two months, close to the 2.5 million barrels per day the nation now produces. In Nigeria, civil strife, theft and terrorist attacks have led to supply disruptions as large as 0.7 million barrels per day; Nigeria currently produces just over 2 million barrels per day. In Libya, production has already dropped significantly, to less than 0.5 million barrels per day from a high of 1.6 million barrels per day in mid-2012.
We are most concerned about Venezuela. The 50% drop in oil prices since the June 2014 highs has increased the country’s risk of a default or debt restructuring. Markets are pricing in a 42% probability of default within one year, increasing to a 90% probability in five years. While the impact of an outright default or restructuring will not be significant, social unrest could lead to disruptions to oil production.
Ebola EpidemicFinally, while an Ebola epidemic spreading beyond Liberia, Sierra Leone and Guinea is still a low-probability risk, West Africa is far from free of Ebola virus transmission. The late December 2014 lab incident at the Centers for Disease Control and Prevention, as well as a new confirmed case involving a health-care worker
returned to Scotland from West Africa, serve as stark reminders of the continued risks of Ebola.
Key Takeaways
In our 2009 Outlook, Uncertain But Not Uncharted, we underscored the uncertainty surrounding our economic and investment outlook by stating that it was with “a strong dose of humility that we put forth our Outlook for 2009.” Today, we put forth our views with an equal amount of caution. American economist John Kenneth Galbraith said “one of the greatest pieces of economic wisdom is to know what you do not know.”31 This sentiment is worth repeating today. There are many factors that will affect our clients’ portfolios that are not knowable in this environment.
Critically, we worry that in spite of all their insights and expertise, monetary policymakers
in the United States, the Eurozone, Japan and China are unlikely to get it right every time. The Federal Reserve may be too slow or too fast to tighten, the ECB may be embarking on quantitative easing “too little and too late,” the BOJ may be the only arrow left in Prime Minister Abe’s quiver and China has to walk the fine line between creating enough stimulus to avert a big slowdown but not so much that it worsens an already heavily indebted credit profile.
While the current level of oil prices and the excess supply are likely to persist in the first half of 2015, we cannot rule out supply disruptions.
The United States is constructing Ebola treatment units in West Africa.

Outlook Investment Strategy Group 33
Our view of US preeminence has served our clients well for six years. We maintain our recommendation that clients stay fully invested in US equities with some tactical overweight allocations to high-yield bonds and to the US dollar relative to the euro and the yen. We recommend that clients tactically overweight certain EAFE equities as well, given very favorable valuations. And, in line with our views last year, we recommend that clients carefully reassess their strategic allocation to emerging markets as we believe these countries will face considerable economic and political headwinds.

S E C T I O N I I
Goldman Sachs january 2015 34
2015 Global Economic Outlook: Global Divergences
although the world’s economies rarely travel exactly the same avenues, their routes seem particularly divergent today. Consider that growth in the US and UK is projected to be above trend while that of emerging markets is below trend and slowing. Even within the developed markets, the expected pickup in the US stands in contrast to the ongoing economic malaise—and persistent deflationary concerns—plaguing Japan and the Eurozone.
Last year’s 46% decline in oil prices adds another dimension to these dissimilarities, both across countries and within them. Naturally, declining fuel costs are positive for many net oil importers, such as the US, and negative for commodity exporters, many of them emerging countries. Yet even within the beneficiary countries, the resulting declines in energy-related employment and capital investments can generate notable offsets. Moreover, the lower headline inflation that accompanies lower oil prices complicates the fight against low inflation for some central banks, such as the ECB.

Outlook Investment Strategy Group 35
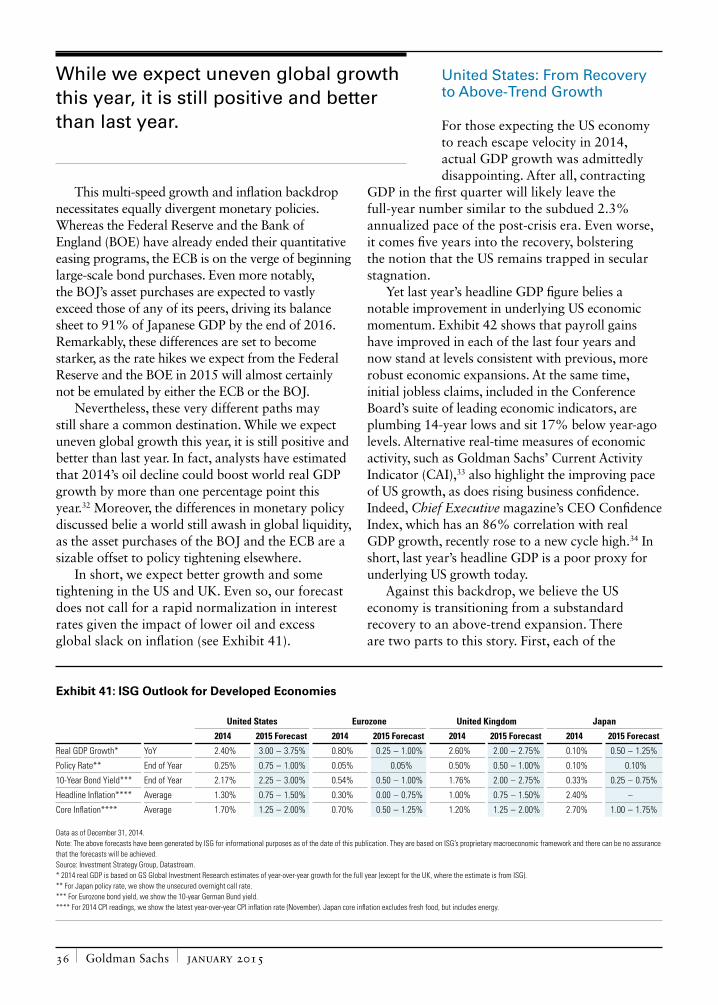
Goldman Sachs january 2015 36
This multi-speed growth and inflation backdrop necessitates equally divergent monetary policies. Whereas the Federal Reserve and the Bank of England (BOE) have already ended their quantitative easing programs, the ECB is on the verge of beginning large-scale bond purchases. Even more notably, the BOJ’s asset purchases are expected to vastly exceed those of any of its peers, driving its balance sheet to 91% of Japanese GDP by the end of 2016. Remarkably, these differences are set to become starker, as the rate hikes we expect from the Federal Reserve and the BOE in 2015 will almost certainly not be emulated by either the ECB or the BOJ.
Nevertheless, these very different paths may still share a common destination. While we expect uneven global growth this year, it is still positive and better than last year. In fact, analysts have estimated that 2014’s oil decline could boost world real GDP growth by more than one percentage point this year.32 Moreover, the differences in monetary policy discussed belie a world still awash in global liquidity, as the asset purchases of the BOJ and the ECB are a sizable offset to policy tightening elsewhere.
In short, we expect better growth and some tightening in the US and UK. Even so, our forecast does not call for a rapid normalization in interest rates given the impact of lower oil and excess global slack on inflation (see Exhibit 41).
United States: From Recovery to Above-Trend Growth
For those expecting the US economy to reach escape velocity in 2014, actual GDP growth was admittedly disappointing. After all, contracting
GDP in the first quarter will likely leave the full-year number similar to the subdued 2.3% annualized pace of the post-crisis era. Even worse, it comes five years into the recovery, bolstering the notion that the US remains trapped in secular stagnation.
Yet last year’s headline GDP figure belies a notable improvement in underlying US economic momentum. Exhibit 42 shows that payroll gains have improved in each of the last four years and now stand at levels consistent with previous, more robust economic expansions. At the same time, initial jobless claims, included in the Conference Board’s suite of leading economic indicators, are plumbing 14-year lows and sit 17% below year-ago levels. Alternative real-time measures of economic activity, such as Goldman Sachs’ Current Activity Indicator (CAI),33 also highlight the improving pace of US growth, as does rising business confidence. Indeed, Chief Executive magazine’s CEO Confidence Index, which has an 86% correlation with real GDP growth, recently rose to a new cycle high.34 In short, last year’s headline GDP is a poor proxy for underlying US growth today.
Against this backdrop, we believe the US economy is transitioning from a substandard recovery to an above-trend expansion. There are two parts to this story. First, each of the
Exhibit 41: ISG Outlook for Developed Economies
United States Eurozone United Kingdom Japan
2014 2015 Forecast 2014 2015 Forecast 2014 2015 Forecast 2014 2015 Forecast
Real GDP Growth* YoY 2.40% 3.00 – 3.75% 0.80% 0.25 – 1.00% 2.60% 2.00 – 2.75% 0.10% 0.50 – 1.25%
Policy Rate** End of Year 0.25% 0.75 – 1.00% 0.05% 0.05% 0.50% 0.50 – 1.00% 0.10% 0.10%
10-Year Bond Yield*** End of Year 2.17% 2.25 – 3.00% 0.54% 0.50 – 1.00% 1.76% 2.00 – 2.75% 0.33% 0.25 – 0.75%
Headline Inflation**** Average 1.30% 0.75 – 1.50% 0.30% 0.00 – 0.75% 1.00% 0.75 – 1.50% 2.40% –
Core Inflation**** Average 1.70% 1.25 – 2.00% 0.70% 0.50 – 1.25% 1.20% 1.25 – 2.00% 2.70% 1.00 – 1.75%
Data as of December 31, 2014. Note: The above forecasts have been generated by ISG for informational purposes as of the date of this publication. They are based on ISG’s proprietary macroeconomic framework and there can be no assurance that the forecasts will be achieved. Source: Investment Strategy Group, Datastream. * 2014 real GDP is based on GS Global Investment Research estimates of year-over-year growth for the full year (except for the UK, where the estimate is from ISG). ** For Japan policy rate, we show the unsecured overnight call rate. *** For Eurozone bond yield, we show the 10-year German Bund yield. **** For 2014 CPI readings, we show the latest year-over-year CPI inflation rate (November). Japan core inflation excludes fresh food, but includes energy.
While we expect uneven global growth this year, it is still positive and better than last year.
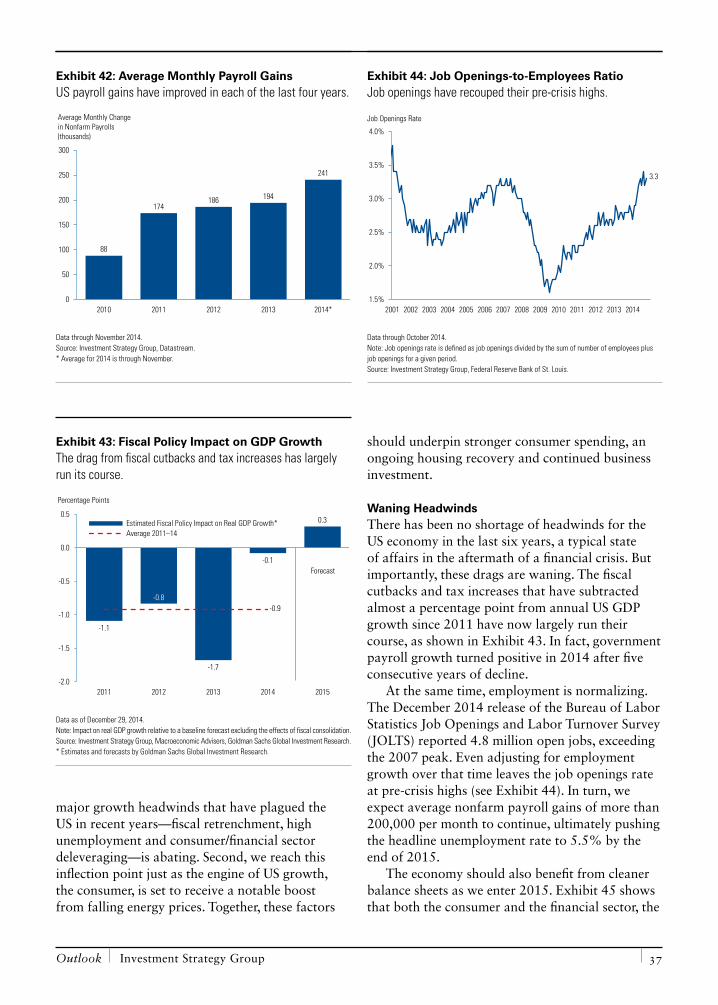
Outlook Investment Strategy Group 37
major growth headwinds that have plagued the US in recent years—fiscal retrenchment, high unemployment and consumer/financial sector deleveraging—is abating. Second, we reach this inflection point just as the engine of US growth, the consumer, is set to receive a notable boost from falling energy prices. Together, these factors
should underpin stronger consumer spending, an ongoing housing recovery and continued business investment.
Waning HeadwindsThere has been no shortage of headwinds for the US economy in the last six years, a typical state of affairs in the aftermath of a financial crisis. But importantly, these drags are waning. The fiscal cutbacks and tax increases that have subtracted almost a percentage point from annual US GDP growth since 2011 have now largely run their course, as shown in Exhibit 43. In fact, government payroll growth turned positive in 2014 after five consecutive years of decline.
At the same time, employment is normalizing. The December 2014 release of the Bureau of Labor Statistics Job Openings and Labor Turnover Survey (JOLTS) reported 4.8 million open jobs, exceeding the 2007 peak. Even adjusting for employment growth over that time leaves the job openings rate at pre-crisis highs (see Exhibit 44). In turn, we expect average nonfarm payroll gains of more than 200,000 per month to continue, ultimately pushing the headline unemployment rate to 5.5% by the end of 2015.
The economy should also benefit from cleaner balance sheets as we enter 2015. Exhibit 45 shows that both the consumer and the financial sector, the
Exhibit 42: Average Monthly Payroll GainsUS payroll gains have improved in each of the last four years.
88
174186 194
241
0
50
100
150
200
250
300
2010 2011 2012 2013 2014*
Average Monthly Change in Nonfarm Payrolls (thousands)
Data through November 2014. Source: Investment Strategy Group, Datastream. * Average for 2014 is through November.
Exhibit 43: Fiscal Policy Impact on GDP GrowthThe drag from fiscal cutbacks and tax increases has largely run its course.
-1.1
-0.8
-1.7
-0.1
0.3
-0.9
-2.0
-1.5
-1.0
-0.5
0.0
0.5
2011 2012 2013 2014 2015
Estimated Fiscal Policy Impact on Real GDP Growth*Average 2011–14
Percentage Points
Forecast
Data as of December 29, 2014. Note: Impact on real GDP growth relative to a baseline forecast excluding the effects of fiscal consolidation. Source: Investment Strategy Group, Macroeconomic Advisers, Goldman Sachs Global Investment Research. * Estimates and forecasts by Goldman Sachs Global Investment Research.
Exhibit 44: Job Openings-to-Employees RatioJob openings have recouped their pre-crisis highs.
1.5%
2.0%
2.5%
3.0%
3.5%
4.0%
2001 2002 2003 2004 2005 2006 2007 2008 2009 2010 2011 2012 2013 2014
3.3
Job Openings Rate
Data through October 2014. Note: Job openings rate is defined as job openings divided by the sum of number of employees plus job openings for a given period. Source: Investment Strategy Group, Federal Reserve Bank of St. Louis.
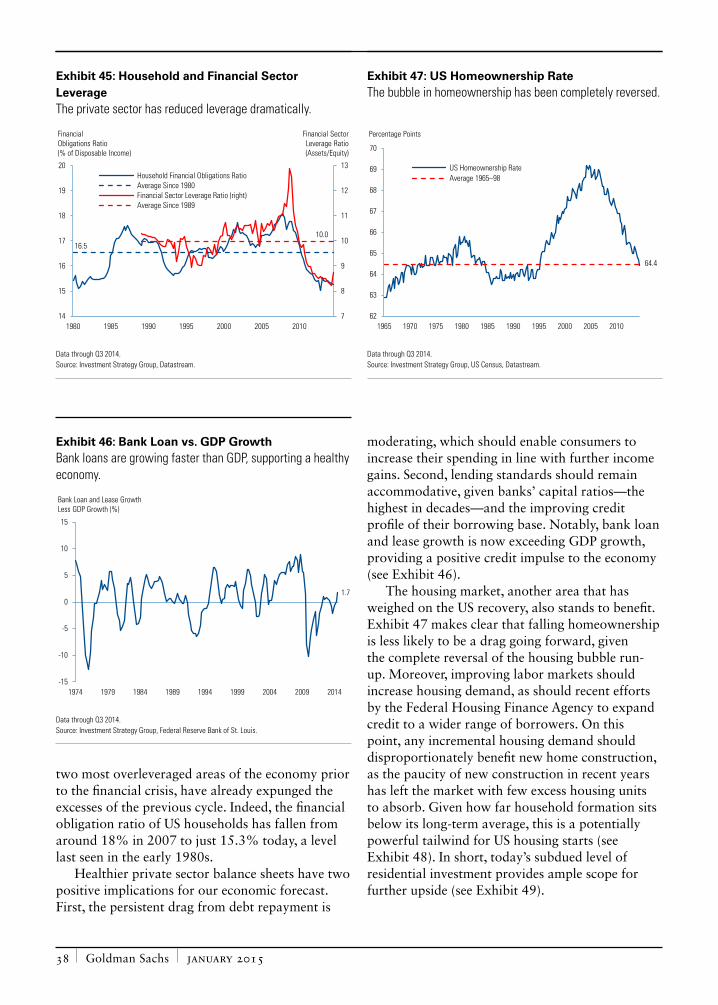
Goldman Sachs january 2015 38
two most overleveraged areas of the economy prior to the financial crisis, have already expunged the excesses of the previous cycle. Indeed, the financial obligation ratio of US households has fallen from around 18% in 2007 to just 15.3% today, a level last seen in the early 1980s.
Healthier private sector balance sheets have two positive implications for our economic forecast. First, the persistent drag from debt repayment is
moderating, which should enable consumers to increase their spending in line with further income gains. Second, lending standards should remain accommodative, given banks’ capital ratios—the highest in decades—and the improving credit profile of their borrowing base. Notably, bank loan and lease growth is now exceeding GDP growth, providing a positive credit impulse to the economy (see Exhibit 46).
The housing market, another area that has weighed on the US recovery, also stands to benefit. Exhibit 47 makes clear that falling homeownership is less likely to be a drag going forward, given the complete reversal of the housing bubble run-up. Moreover, improving labor markets should increase housing demand, as should recent efforts by the Federal Housing Finance Agency to expand credit to a wider range of borrowers. On this point, any incremental housing demand should disproportionately benefit new home construction, as the paucity of new construction in recent years has left the market with few excess housing units to absorb. Given how far household formation sits below its long-term average, this is a potentially powerful tailwind for US housing starts (see Exhibit 48). In short, today’s subdued level of residential investment provides ample scope for further upside (see Exhibit 49).
Exhibit 45: Household and Financial Sector LeverageThe private sector has reduced leverage dramatically.
7
8
9
10
11
12
13
14
15
16
17
18
19
20
1980 1985 1990 1995 2000 2005 2010
Household Financial Obligations RatioAverage Since 1980Financial Sector Leverage Ratio (right)Average Since 1989
16.510.0
Financial Obligations Ratio (% of Disposable Income)
Financial SectorLeverage Ratio(Assets/Equity)
Data through Q3 2014. Source: Investment Strategy Group, Datastream.
Exhibit 46: Bank Loan vs. GDP GrowthBank loans are growing faster than GDP, supporting a healthy economy.
-15
-10
-5
0
5
10
15
1974 1979 1984 1989 1994 1999 2004 2009 2014
Bank Loan and Lease Growth Less GDP Growth (%)
1.7
Data through Q3 2014. Source: Investment Strategy Group, Federal Reserve Bank of St. Louis.
Exhibit 47: US Homeownership RateThe bubble in homeownership has been completely reversed.
62
63
64
65
66
67
68
69
70
1965 1970 1975 1980 1985 1990 1995 2000 2005 2010
US Homeownership RateAverage 1965–98
64.4
Percentage Points
Data through Q3 2014. Source: Investment Strategy Group, US Census, Datastream.
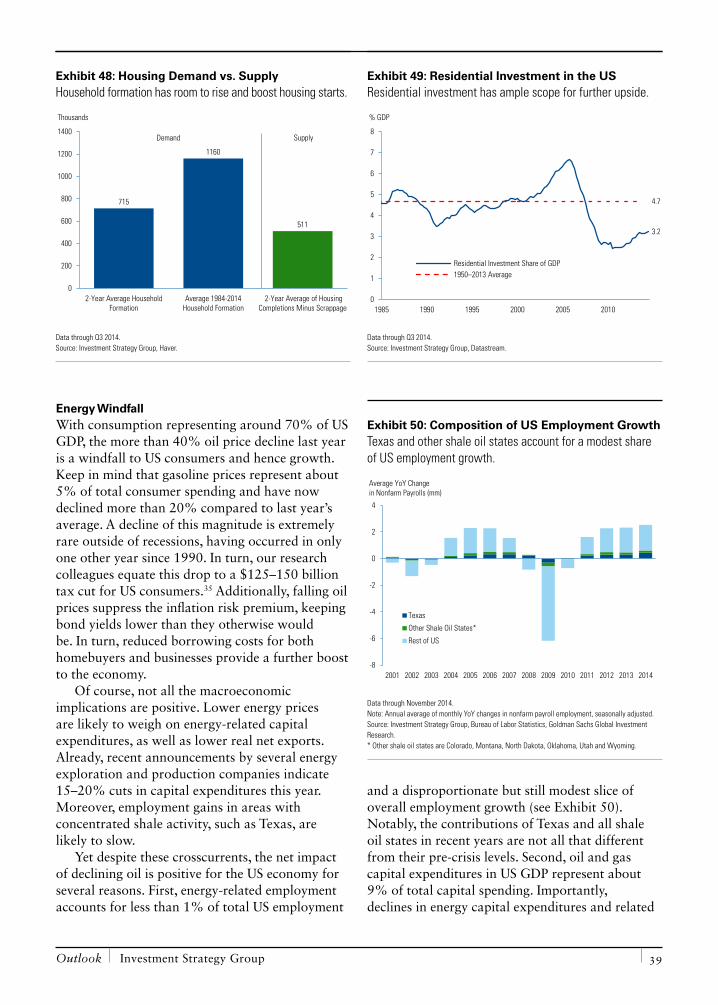
Outlook Investment Strategy Group 39
Energy WindfallWith consumption representing around 70% of US GDP, the more than 40% oil price decline last year is a windfall to US consumers and hence growth. Keep in mind that gasoline prices represent about 5% of total consumer spending and have now declined more than 20% compared to last year’s average. A decline of this magnitude is extremely rare outside of recessions, having occurred in only one other year since 1990. In turn, our research colleagues equate this drop to a $125–150 billion tax cut for US consumers.35 Additionally, falling oil prices suppress the inflation risk premium, keeping bond yields lower than they otherwise would be. In turn, reduced borrowing costs for both homebuyers and businesses provide a further boost to the economy.
Of course, not all the macroeconomic implications are positive. Lower energy prices are likely to weigh on energy-related capital expenditures, as well as lower real net exports. Already, recent announcements by several energy exploration and production companies indicate 15–20% cuts in capital expenditures this year. Moreover, employment gains in areas with concentrated shale activity, such as Texas, are likely to slow.
Yet despite these crosscurrents, the net impact of declining oil is positive for the US economy for several reasons. First, energy-related employment accounts for less than 1% of total US employment
and a disproportionate but still modest slice of overall employment growth (see Exhibit 50). Notably, the contributions of Texas and all shale oil states in recent years are not all that different from their pre-crisis levels. Second, oil and gas capital expenditures in US GDP represent about 9% of total capital spending. Importantly, declines in energy capital expenditures and related
Exhibit 48: Housing Demand vs. SupplyHousehold formation has room to rise and boost housing starts.
715
1160
511
0
200
400
600
800
1000
1200
1400
2-Year Average HouseholdFormation
Average 1984-2014Household Formation
2-Year Average of HousingCompletions Minus Scrappage
Demand Supply
Thousands
Data through Q3 2014. Source: Investment Strategy Group, Haver.
Exhibit 49: Residential Investment in the USResidential investment has ample scope for further upside.
0
1
2
3
4
5
6
7
8
1985 1990 1995 2000 2005 2010
Residential Investment Share of GDP1950–2013 Average
4.7
3.2
% GDP
Data through Q3 2014. Source: Investment Strategy Group, Datastream.
Exhibit 50: Composition of US Employment GrowthTexas and other shale oil states account for a modest share of US employment growth.
-8
-6
-4
-2
0
2
4
2001 2002 2003 2004 2005 2006 2007 2008 2009 2010 2011 2012 2013 2014
Texas
Other Shale Oil States*
Rest of US
Average YoY Change in Nonfarm Payrolls (mm)
Data through November 2014. Note: Annual average of monthly YoY changes in nonfarm payroll employment, seasonally adjusted. Source: Investment Strategy Group, Bureau of Labor Statistics, Goldman Sachs Global Investment Research. * Other shale oil states are Colorado, Montana, North Dakota, Oklahoma, Utah and Wyoming.
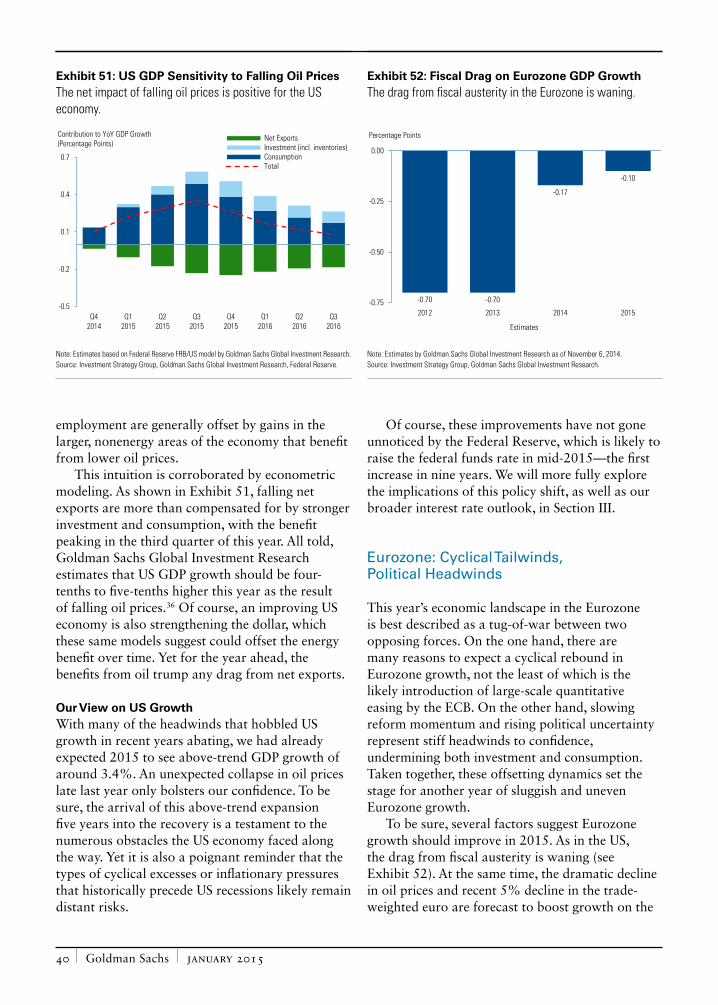
Goldman Sachs january 2015 40
employment are generally offset by gains in the larger, nonenergy areas of the economy that benefit from lower oil prices.
This intuition is corroborated by econometric modeling. As shown in Exhibit 51, falling net exports are more than compensated for by stronger investment and consumption, with the benefit peaking in the third quarter of this year. All told, Goldman Sachs Global Investment Research estimates that US GDP growth should be four-tenths to five-tenths higher this year as the result of falling oil prices.36 Of course, an improving US economy is also strengthening the dollar, which these same models suggest could offset the energy benefit over time. Yet for the year ahead, the benefits from oil trump any drag from net exports.
Our View on US GrowthWith many of the headwinds that hobbled US growth in recent years abating, we had already expected 2015 to see above-trend GDP growth of around 3.4%. An unexpected collapse in oil prices late last year only bolsters our confidence. To be sure, the arrival of this above-trend expansion five years into the recovery is a testament to the numerous obstacles the US economy faced along the way. Yet it is also a poignant reminder that the types of cyclical excesses or inflationary pressures that historically precede US recessions likely remain distant risks.
Of course, these improvements have not gone unnoticed by the Federal Reserve, which is likely to raise the federal funds rate in mid-2015—the first increase in nine years. We will more fully explore the implications of this policy shift, as well as our broader interest rate outlook, in Section III.
Eurozone: Cyclical Tailwinds, Political Headwinds
This year’s economic landscape in the Eurozone is best described as a tug-of-war between two opposing forces. On the one hand, there are many reasons to expect a cyclical rebound in Eurozone growth, not the least of which is the likely introduction of large-scale quantitative easing by the ECB. On the other hand, slowing reform momentum and rising political uncertainty represent stiff headwinds to confidence, undermining both investment and consumption. Taken together, these offsetting dynamics set the stage for another year of sluggish and uneven Eurozone growth.
To be sure, several factors suggest Eurozone growth should improve in 2015. As in the US, the drag from fiscal austerity is waning (see Exhibit 52). At the same time, the dramatic decline in oil prices and recent 5% decline in the trade-weighted euro are forecast to boost growth on the
Exhibit 51: US GDP Sensitivity to Falling Oil PricesThe net impact of falling oil prices is positive for the US economy.
-0.5
-0.2
0.1
0.4
0.7
Q42014
Q12015
Q22015
Q32015
Q42015
Q12016
Q22016
Q32016
Net ExportsInvestment (incl. inventories)ConsumptionTotal
Contribution to YoY GDP Growth (Percentage Points)
Note: Estimates based on Federal Reserve FRB/US model by Goldman Sachs Global Investment Research. Source: Investment Strategy Group, Goldman Sachs Global Investment Research, Federal Reserve.
Exhibit 52: Fiscal Drag on Eurozone GDP GrowthThe drag from fiscal austerity in the Eurozone is waning.
-0.70 -0.70
-0.17
-0.10
-0.75
-0.50
-0.25
0.00
2012 2013 2014 2015
Percentage Points
Estimates
Note: Estimates by Goldman Sachs Global Investment Research as of November 6, 2014. Source: Investment Strategy Group, Goldman Sachs Global Investment Research.
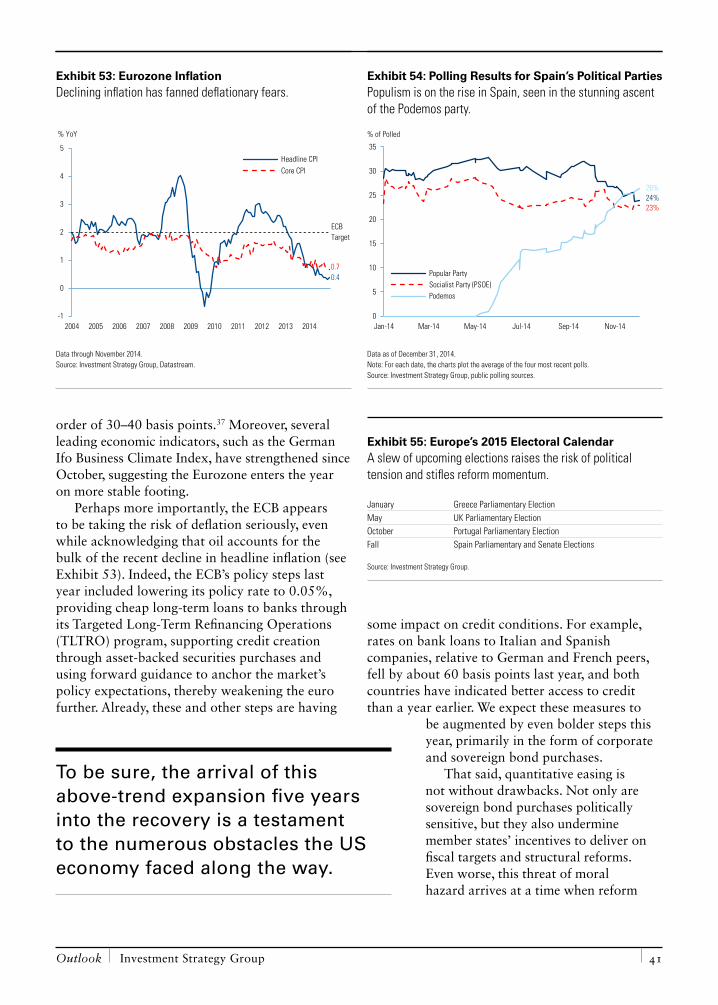
Outlook Investment Strategy Group 41
order of 30–40 basis points.37 Moreover, several leading economic indicators, such as the German Ifo Business Climate Index, have strengthened since October, suggesting the Eurozone enters the year on more stable footing.
Perhaps more importantly, the ECB appears to be taking the risk of deflation seriously, even while acknowledging that oil accounts for the bulk of the recent decline in headline inflation (see Exhibit 53). Indeed, the ECB’s policy steps last year included lowering its policy rate to 0.05%, providing cheap long-term loans to banks through its Targeted Long-Term Refinancing Operations (TLTRO) program, supporting credit creation through asset-backed securities purchases and using forward guidance to anchor the market’s policy expectations, thereby weakening the euro further. Already, these and other steps are having
some impact on credit conditions. For example, rates on bank loans to Italian and Spanish companies, relative to German and French peers, fell by about 60 basis points last year, and both countries have indicated better access to credit than a year earlier. We expect these measures to
be augmented by even bolder steps this year, primarily in the form of corporate and sovereign bond purchases.
That said, quantitative easing is not without drawbacks. Not only are sovereign bond purchases politically sensitive, but they also undermine member states’ incentives to deliver on fiscal targets and structural reforms. Even worse, this threat of moral hazard arrives at a time when reform
Exhibit 53: Eurozone InflationDeclining inflation has fanned deflationary fears.
-1
0
1
2
3
4
5
2004 2005 2006 2007 2008 2009 2010 2011 2012 2013 2014
Headline CPICore CPI
0.70.4
ECB Target
% YoY
Data through November 2014. Source: Investment Strategy Group, Datastream.
Exhibit 54: Polling Results for Spain’s Political PartiesPopulism is on the rise in Spain, seen in the stunning ascent of the Podemos party.
0
5
10
15
20
25
30
35
Jan-14 Mar-14 May-14 Jul-14 Sep-14 Nov-14
Popular PartySocialist Party (PSOE)Podemos
26%24%23%
% of Polled
Data as of December 31, 2014. Note: For each date, the charts plot the average of the four most recent polls. Source: Investment Strategy Group, public polling sources.
Exhibit 55: Europe’s 2015 Electoral CalendarA slew of upcoming elections raises the risk of political tension and stifles reform momentum.
January Greece Parliamentary ElectionMay UK Parliamentary ElectionOctober Portugal Parliamentary ElectionFall Spain Parliamentary and Senate Elections
Source: Investment Strategy Group.
To be sure, the arrival of this above-trend expansion five years into the recovery is a testament to the numerous obstacles the US economy faced along the way.
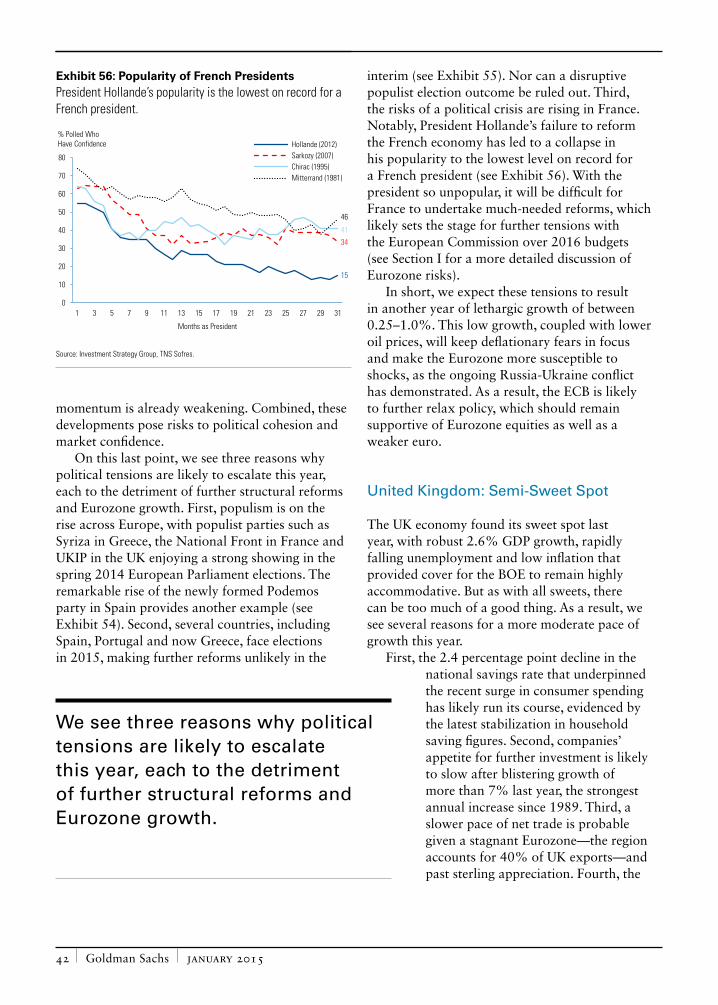
Goldman Sachs january 2015 42
momentum is already weakening. Combined, these developments pose risks to political cohesion and market confidence.
On this last point, we see three reasons why political tensions are likely to escalate this year, each to the detriment of further structural reforms and Eurozone growth. First, populism is on the rise across Europe, with populist parties such as Syriza in Greece, the National Front in France and UKIP in the UK enjoying a strong showing in the spring 2014 European Parliament elections. The remarkable rise of the newly formed Podemos party in Spain provides another example (see Exhibit 54). Second, several countries, including Spain, Portugal and now Greece, face elections in 2015, making further reforms unlikely in the
interim (see Exhibit 55). Nor can a disruptive populist election outcome be ruled out. Third, the risks of a political crisis are rising in France. Notably, President Hollande’s failure to reform the French economy has led to a collapse in his popularity to the lowest level on record for a French president (see Exhibit 56). With the president so unpopular, it will be difficult for France to undertake much-needed reforms, which likely sets the stage for further tensions with the European Commission over 2016 budgets (see Section I for a more detailed discussion of Eurozone risks).
In short, we expect these tensions to result in another year of lethargic growth of between 0.25–1.0%. This low growth, coupled with lower oil prices, will keep deflationary fears in focus and make the Eurozone more susceptible to shocks, as the ongoing Russia-Ukraine conflict has demonstrated. As a result, the ECB is likely to further relax policy, which should remain supportive of Eurozone equities as well as a weaker euro.
United Kingdom: Semi-Sweet Spot
The UK economy found its sweet spot last year, with robust 2.6% GDP growth, rapidly falling unemployment and low inflation that provided cover for the BOE to remain highly accommodative. But as with all sweets, there can be too much of a good thing. As a result, we see several reasons for a more moderate pace of growth this year.
First, the 2.4 percentage point decline in the national savings rate that underpinned the recent surge in consumer spending has likely run its course, evidenced by the latest stabilization in household saving figures. Second, companies’ appetite for further investment is likely to slow after blistering growth of more than 7% last year, the strongest annual increase since 1989. Third, a slower pace of net trade is probable given a stagnant Eurozone—the region accounts for 40% of UK exports—and past sterling appreciation. Fourth, the
Exhibit 56: Popularity of French PresidentsPresident Hollande’s popularity is the lowest on record for a French president.
0
10
20
30
40
50
60
70
80
1 3 5 7 9 11 13 15 17 19 21 23 25 27 29 31
Months as President
Hollande (2012)Sarkozy (2007)Chirac (1995)Mitterrand (1981)
% Polled Who Have Confidence
46
41
34
15
Source: Investment Strategy Group, TNS Sofres.
We see three reasons why political tensions are likely to escalate this year, each to the detriment of further structural reforms and Eurozone growth.
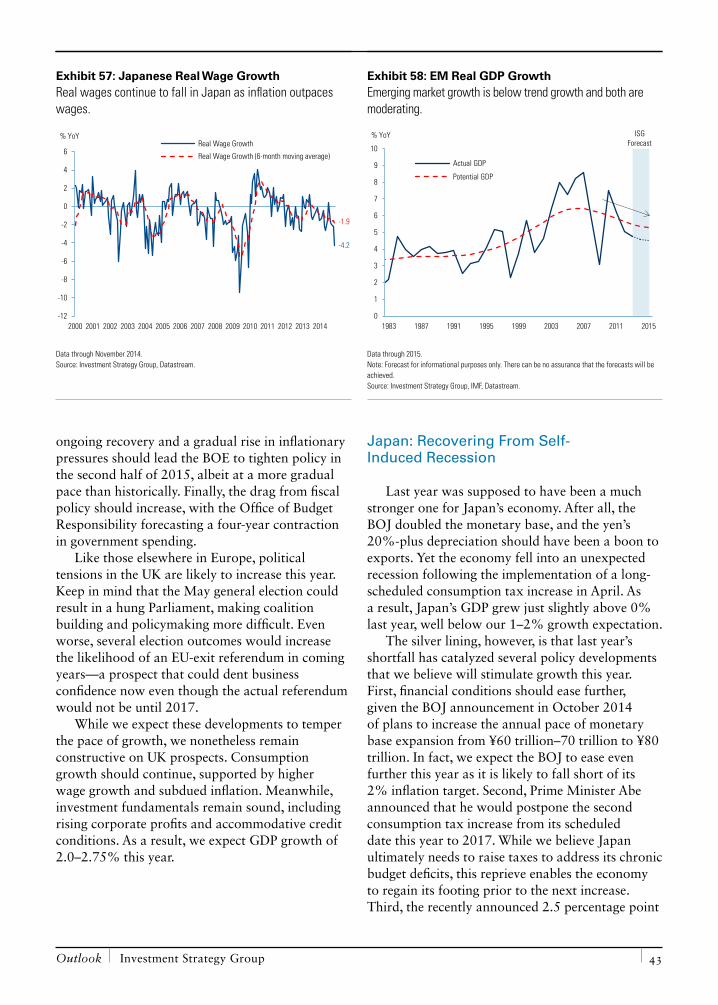
Outlook Investment Strategy Group 43
ongoing recovery and a gradual rise in inflationary pressures should lead the BOE to tighten policy in the second half of 2015, albeit at a more gradual pace than historically. Finally, the drag from fiscal policy should increase, with the Office of Budget Responsibility forecasting a four-year contraction in government spending.
Like those elsewhere in Europe, political tensions in the UK are likely to increase this year. Keep in mind that the May general election could result in a hung Parliament, making coalition building and policymaking more difficult. Even worse, several election outcomes would increase the likelihood of an EU-exit referendum in coming years—a prospect that could dent business confidence now even though the actual referendum would not be until 2017.
While we expect these developments to temper the pace of growth, we nonetheless remain constructive on UK prospects. Consumption growth should continue, supported by higher wage growth and subdued inflation. Meanwhile, investment fundamentals remain sound, including rising corporate profits and accommodative credit conditions. As a result, we expect GDP growth of 2.0–2.75% this year.
Japan: Recovering From Self-Induced Recession
Last year was supposed to have been a much stronger one for Japan’s economy. After all, the BOJ doubled the monetary base, and the yen’s 20%-plus depreciation should have been a boon to exports. Yet the economy fell into an unexpected recession following the implementation of a long-scheduled consumption tax increase in April. As a result, Japan’s GDP grew just slightly above 0% last year, well below our 1–2% growth expectation.
The silver lining, however, is that last year’s shortfall has catalyzed several policy developments that we believe will stimulate growth this year. First, financial conditions should ease further, given the BOJ announcement in October 2014 of plans to increase the annual pace of monetary base expansion from ¥60 trillion–70 trillion to ¥80 trillion. In fact, we expect the BOJ to ease even further this year as it is likely to fall short of its 2% inflation target. Second, Prime Minister Abe announced that he would postpone the second consumption tax increase from its scheduled date this year to 2017. While we believe Japan ultimately needs to raise taxes to address its chronic budget deficits, this reprieve enables the economy to regain its footing prior to the next increase. Third, the recently announced 2.5 percentage point
Exhibit 57: Japanese Real Wage GrowthReal wages continue to fall in Japan as inflation outpaces wages.
-12
-10
-8
-6
-4
-2
0
2
4
6
2000 2001 2002 2003 2004 2005 2006 2007 2008 2009 2010 2011 2012 2013 2014
% YoYReal Wage Growth
Real Wage Growth (6-month moving average)
-1.9
-4.2
Data through November 2014. Source: Investment Strategy Group, Datastream.
Exhibit 58: EM Real GDP GrowthEmerging market growth is below trend growth and both are moderating.
0
1
2
3
4
5
6
7
8
9
10
1983 1987 1991 1995 1999 2003 2007 2011 2015
% YoY
Actual GDP
Potential GDP
ISGForecast
Data through 2015. Note: Forecast for informational purposes only. There can be no assurance that the forecasts will be achieved. Source: Investment Strategy Group, IMF, Datastream.
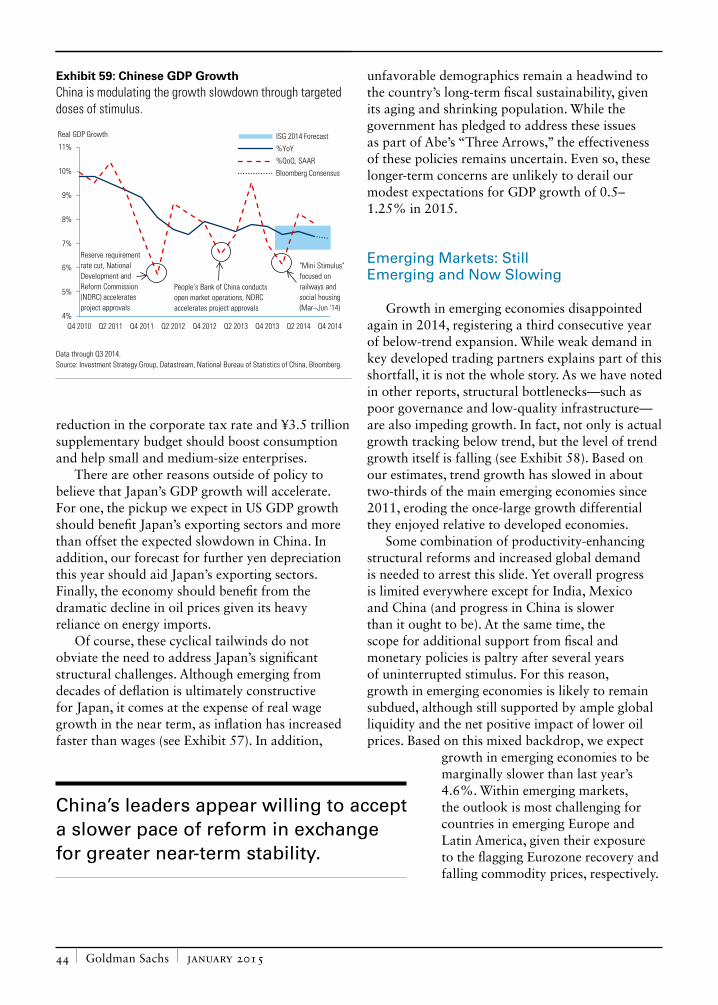
Goldman Sachs january 2015 44
reduction in the corporate tax rate and ¥3.5 trillion supplementary budget should boost consumption and help small and medium-size enterprises.
There are other reasons outside of policy to believe that Japan’s GDP growth will accelerate. For one, the pickup we expect in US GDP growth should benefit Japan’s exporting sectors and more than offset the expected slowdown in China. In addition, our forecast for further yen depreciation this year should aid Japan’s exporting sectors. Finally, the economy should benefit from the dramatic decline in oil prices given its heavy reliance on energy imports.
Of course, these cyclical tailwinds do not obviate the need to address Japan’s significant structural challenges. Although emerging from decades of deflation is ultimately constructive for Japan, it comes at the expense of real wage growth in the near term, as inflation has increased faster than wages (see Exhibit 57). In addition,
unfavorable demographics remain a headwind to the country’s long-term fiscal sustainability, given its aging and shrinking population. While the government has pledged to address these issues as part of Abe’s “Three Arrows,” the effectiveness of these policies remains uncertain. Even so, these longer-term concerns are unlikely to derail our modest expectations for GDP growth of 0.5–1.25% in 2015.
Emerging Markets: Still Emerging and Now Slowing
Growth in emerging economies disappointed again in 2014, registering a third consecutive year of below-trend expansion. While weak demand in key developed trading partners explains part of this shortfall, it is not the whole story. As we have noted in other reports, structural bottlenecks—such as poor governance and low-quality infrastructure—are also impeding growth. In fact, not only is actual growth tracking below trend, but the level of trend growth itself is falling (see Exhibit 58). Based on our estimates, trend growth has slowed in about two-thirds of the main emerging economies since 2011, eroding the once-large growth differential they enjoyed relative to developed economies.
Some combination of productivity-enhancing structural reforms and increased global demand is needed to arrest this slide. Yet overall progress is limited everywhere except for India, Mexico and China (and progress in China is slower than it ought to be). At the same time, the scope for additional support from fiscal and monetary policies is paltry after several years of uninterrupted stimulus. For this reason, growth in emerging economies is likely to remain subdued, although still supported by ample global liquidity and the net positive impact of lower oil prices. Based on this mixed backdrop, we expect
growth in emerging economies to be marginally slower than last year’s 4.6%. Within emerging markets, the outlook is most challenging for countries in emerging Europe and Latin America, given their exposure to the flagging Eurozone recovery and falling commodity prices, respectively.
Exhibit 59: Chinese GDP GrowthChina is modulating the growth slowdown through targeted doses of stimulus.
4%
5%
6%
7%
8%
9%
10%
11%
Q4 2010 Q2 2011 Q4 2011 Q2 2012 Q4 2012 Q2 2013 Q4 2013 Q2 2014 Q4 2014
ISG 2014 Forecast
%YoY
%QoQ, SAAR
Bloomberg Consensus
Real GDP Growth
Reserve requirementrate cut, National Development and Reform Commission (NDRC) accelerates project approvals
People's Bank of China conducts open market operations, NDRC accelerates project approvals
"Mini Stimulus" focused on railways and social housing(Mar–Jun '14)
Data through Q3 2014. Source: Investment Strategy Group, Datastream, National Bureau of Statistics of China, Bloomberg.
China’s leaders appear willing to accept a slower pace of reform in exchange for greater near-term stability.
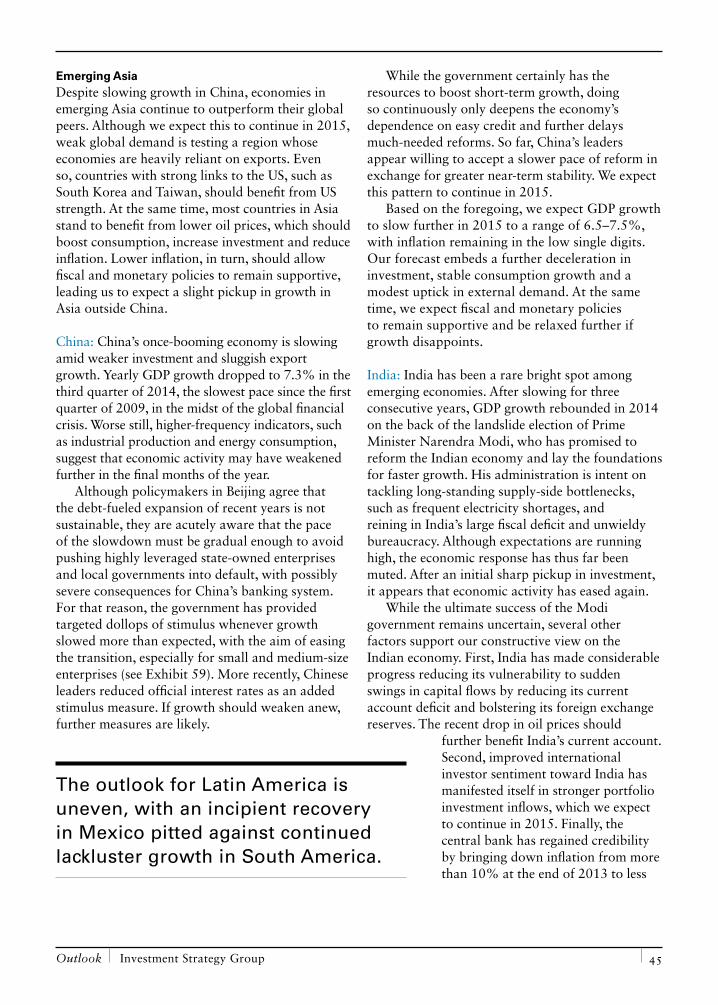
Outlook Investment Strategy Group 45
Emerging AsiaDespite slowing growth in China, economies in emerging Asia continue to outperform their global peers. Although we expect this to continue in 2015, weak global demand is testing a region whose economies are heavily reliant on exports. Even so, countries with strong links to the US, such as South Korea and Taiwan, should benefit from US strength. At the same time, most countries in Asia stand to benefit from lower oil prices, which should boost consumption, increase investment and reduce inflation. Lower inflation, in turn, should allow fiscal and monetary policies to remain supportive, leading us to expect a slight pickup in growth in Asia outside China.
China: China’s once-booming economy is slowing amid weaker investment and sluggish export growth. Yearly GDP growth dropped to 7.3% in the third quarter of 2014, the slowest pace since the first quarter of 2009, in the midst of the global financial crisis. Worse still, higher-frequency indicators, such as industrial production and energy consumption, suggest that economic activity may have weakened further in the final months of the year.
Although policymakers in Beijing agree that the debt-fueled expansion of recent years is not sustainable, they are acutely aware that the pace of the slowdown must be gradual enough to avoid pushing highly leveraged state-owned enterprises and local governments into default, with possibly severe consequences for China’s banking system. For that reason, the government has provided targeted dollops of stimulus whenever growth slowed more than expected, with the aim of easing the transition, especially for small and medium-size enterprises (see Exhibit 59). More recently, Chinese leaders reduced official interest rates as an added stimulus measure. If growth should weaken anew, further measures are likely.
While the government certainly has the resources to boost short-term growth, doing so continuously only deepens the economy’s dependence on easy credit and further delays much-needed reforms. So far, China’s leaders appear willing to accept a slower pace of reform in exchange for greater near-term stability. We expect this pattern to continue in 2015.
Based on the foregoing, we expect GDP growth to slow further in 2015 to a range of 6.5–7.5%, with inflation remaining in the low single digits. Our forecast embeds a further deceleration in investment, stable consumption growth and a modest uptick in external demand. At the same time, we expect fiscal and monetary policies to remain supportive and be relaxed further if growth disappoints.
India: India has been a rare bright spot among emerging economies. After slowing for three consecutive years, GDP growth rebounded in 2014 on the back of the landslide election of Prime Minister Narendra Modi, who has promised to reform the Indian economy and lay the foundations for faster growth. His administration is intent on tackling long-standing supply-side bottlenecks, such as frequent electricity shortages, and reining in India’s large fiscal deficit and unwieldy bureaucracy. Although expectations are running high, the economic response has thus far been muted. After an initial sharp pickup in investment, it appears that economic activity has eased again.
While the ultimate success of the Modi government remains uncertain, several other factors support our constructive view on the Indian economy. First, India has made considerable progress reducing its vulnerability to sudden swings in capital flows by reducing its current account deficit and bolstering its foreign exchange reserves. The recent drop in oil prices should
further benefit India’s current account. Second, improved international investor sentiment toward India has manifested itself in stronger portfolio investment inflows, which we expect to continue in 2015. Finally, the central bank has regained credibility by bringing down inflation from more than 10% at the end of 2013 to less
The outlook for Latin America is uneven, with an incipient recovery in Mexico pitted against continued lackluster growth in South America.
Goldman Sachs january 2015 46
than 6% currently. This improvement, if sustained, will give the central bank room to cut rates and support investment going forward.
We are therefore cautiously optimistic about the outlook for India’s economy and project GDP growth to increase to 5.3–6.3% in 2015.
Latin AmericaThe outlook for Latin America is uneven, with an incipient recovery in Mexico pitted against continued lackluster growth in South America. Low commodity prices and declining competitiveness continue to weigh on the performance of the laggards. Despite low growth, these economies are close to full capacity owing to supply-side bottlenecks, leaving them with virtually no room for fiscal or monetary stimulus. Absent a new commodity price boom or productivity-enhancing reforms, the region’s underperformance is likely to persist.
Mexico continues to stand out. Although growth disappointed in 2014, we believe the country is well positioned to benefit from the ongoing recovery in the US, its main trading partner. Structural reforms in recent years have primed the economy to become more efficient and competitive, while prudent fiscal and monetary policies provide the flexibility to deal with external shocks. Being a small net exporter of oil, Mexico will no doubt suffer from lower oil prices, but the impact on growth should be manageable with the exchange rate expected to absorb a large part of the shock.
Brazil: The Brazilian economy is facing a challenging combination of low growth and high inflation. Falling commodity prices are hurting Brazil’s main exports while interventionist policies have contributed to a contraction in investment
and a sharply weaker currency. However, following a narrow win in the October 2014 presidential election, the government has signaled its intention to adjust course, if only to avoid a ratings downgrade of Brazil’s government debt. The adjustment would entail tighter monetary and fiscal policies, including increases in regulated prices. While
this policy mix could ultimately help to rebuild confidence and support a recovery in investment, it will be contractionary in the near term.
Given this backdrop, we expect relatively modest GDP growth of 0.3–1.3% in 2015, supported by a slight pickup in investment from a low base. Despite this sluggish growth, inflation will remain elevated near the top end of the central bank’s target band (2.5–6.5%), as the bank is unlikely to tighten aggressively and administered prices are set to rise.
Europe, Middle East and Africa (EMEA)Countries in the EMEA region are caught between disappointing growth in the Eurozone and a Russian economy spiraling into recession, with this year unlikely to offer a reprieve on either front. A partial offset comes from the fact that most countries in the region still have some room to use fiscal or monetary policy to support growth. This is not true for Russia, Turkey and South Africa, however. Particularly in the latter two countries, policy flexibility remains very limited given their sizable twin deficits, which make foreign capital skittish.
Russia: The Russian economy seems headed for a sharp contraction under the intense pressure of economic sanctions and low oil prices. The situation came to a head last year in the third week of December when the ruble fell dramatically, prompting the central bank to hike policy rates by 650 basis points, the biggest rise since the 1998 crisis. The resulting increase in the cost of capital—in combination with ongoing sanctions and capital flight—will severely depress investment. At the same time, domestic consumers are likely to face weakening labor markets and high inflation. Already, consumer prices are rising at a rapid pace
The Russian economy seems headed for a sharp contraction under the intense pressure of economic sanctions and low oil prices.

Outlook Investment Strategy Group 47
of more than 9% year-over-year owing to reduced supplies of goods and a sharply weaker exchange rate. Until these pressures abate, the central bank will maintain tight monetary policy. Fiscal policy, on the other hand, is beholden to the low price of oil. Although the sharp depreciation of the ruble is substantially offsetting the immediate impact of the lower oil price, ultimately this dynamic is inflationary and therefore not sustainable.
Against this backdrop, we expect GDP to contract by 3–5% in 2015 and inflation to remain in the high single digits. Given the continuously changing situation, this projection is especially uncertain. The risks around this outlook depend very much on the price of oil and the standoff with Ukraine. A higher oil price and reduced tensions in Ukraine could ease pressure on the ruble and allow the central bank to cut rates. In contrast, an escalation of the conflict could lead to more sanctions and incremental pressure on growth. Finally, the most toxic combination of low oil prices, a depreciating currency and increasing stresses in the banking system could result in an even deeper slump in the Russian economy.
S E C T I O N I I I
Goldman Sachs january 2015 48
2015 Financial Markets Outlook: Not Yet Out to Pasture
many expect the now six-year-old bull market in risk assets to be put out to pasture in 2015. After all, this rally has already outlasted the post-WWII average by a full year. In addition, the S&P 500 is more than three times its 2009 trough level. Such strong gains in not only US equities but also other global risk assets have left their valuations full and more vulnerable to adverse shocks. As the old English proverb reminds us, “A full cup must be carried steadily.”
While investors admittedly have a narrower margin of safety today, we do not agree that the sun has already set on this bull market. As we noted in last year’s Outlook, bull markets do not die of old age, but more typically of severe economic imbalances, recessions and tight monetary policy. In contrast, today’s unusual combination of ample global slack, improving economic momentum and highly accommodative monetary policy is historically inconsistent with the typical conditions at market tops.
Keep in mind that financial conditions—an important driver of economic growth and therefore risk assets—remain incredibly accommodative. Countries with zero-interest-rate policies

Outlook Investment Strategy Group 49
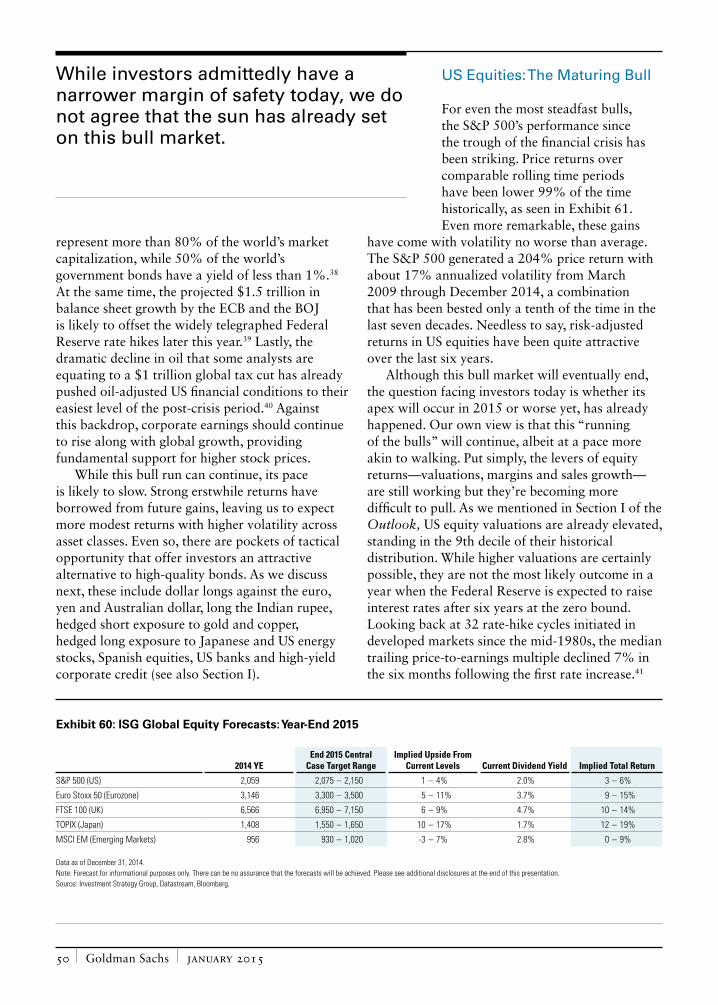
Goldman Sachs january 2015 50
represent more than 80% of the world’s market capitalization, while 50% of the world’s government bonds have a yield of less than 1%.38 At the same time, the projected $1.5 trillion in balance sheet growth by the ECB and the BOJ is likely to offset the widely telegraphed Federal Reserve rate hikes later this year.39 Lastly, the dramatic decline in oil that some analysts are equating to a $1 trillion global tax cut has already pushed oil-adjusted US financial conditions to their easiest level of the post-crisis period.40 Against this backdrop, corporate earnings should continue to rise along with global growth, providing fundamental support for higher stock prices.
While this bull run can continue, its pace is likely to slow. Strong erstwhile returns have borrowed from future gains, leaving us to expect more modest returns with higher volatility across asset classes. Even so, there are pockets of tactical opportunity that offer investors an attractive alternative to high-quality bonds. As we discuss next, these include dollar longs against the euro, yen and Australian dollar, long the Indian rupee, hedged short exposure to gold and copper, hedged long exposure to Japanese and US energy stocks, Spanish equities, US banks and high-yield corporate credit (see also Section I).
US Equities: The Maturing Bull
For even the most steadfast bulls, the S&P 500’s performance since the trough of the financial crisis has been striking. Price returns over comparable rolling time periods have been lower 99% of the time historically, as seen in Exhibit 61. Even more remarkable, these gains
have come with volatility no worse than average. The S&P 500 generated a 204% price return with about 17% annualized volatility from March 2009 through December 2014, a combination that has been bested only a tenth of the time in the last seven decades. Needless to say, risk-adjusted returns in US equities have been quite attractive over the last six years.
Although this bull market will eventually end, the question facing investors today is whether its apex will occur in 2015 or worse yet, has already happened. Our own view is that this “running of the bulls” will continue, albeit at a pace more akin to walking. Put simply, the levers of equity returns—valuations, margins and sales growth—are still working but they’re becoming more difficult to pull. As we mentioned in Section I of the Outlook, US equity valuations are already elevated, standing in the 9th decile of their historical distribution. While higher valuations are certainly possible, they are not the most likely outcome in a year when the Federal Reserve is expected to raise interest rates after six years at the zero bound. Looking back at 32 rate-hike cycles initiated in developed markets since the mid-1980s, the median trailing price-to-earnings multiple declined 7% in the six months following the first rate increase.41
While investors admittedly have a narrower margin of safety today, we do not agree that the sun has already set on this bull market.
Exhibit 60: ISG Global Equity Forecasts: Year-End 2015
2014 YEEnd 2015 Central
Case Target RangeImplied Upside From
Current Levels Current Dividend Yield Implied Total Return
S&P 500 (US) 2,059 2,075 – 2,150 1 – 4% 2.0% 3 – 6%
Euro Stoxx 50 (Eurozone) 3,146 3,300 – 3,500 5 – 11% 3.7% 9 – 15%
FTSE 100 (UK) 6,566 6,950 – 7,150 6 – 9% 4.7% 10 – 14%
TOPIX (Japan) 1,408 1,550 – 1,650 10 – 17% 1.7% 12 – 19%
MSCI EM (Emerging Markets) 956 930 – 1,020 -3 – 7% 2.8% 0 – 9%
Data as of December 31, 2014. Note: Forecast for informational purposes only. There can be no assurance that the forecasts will be achieved. Please see additional disclosures at the end of this presentation. Source: Investment Strategy Group, Datastream, Bloomberg.
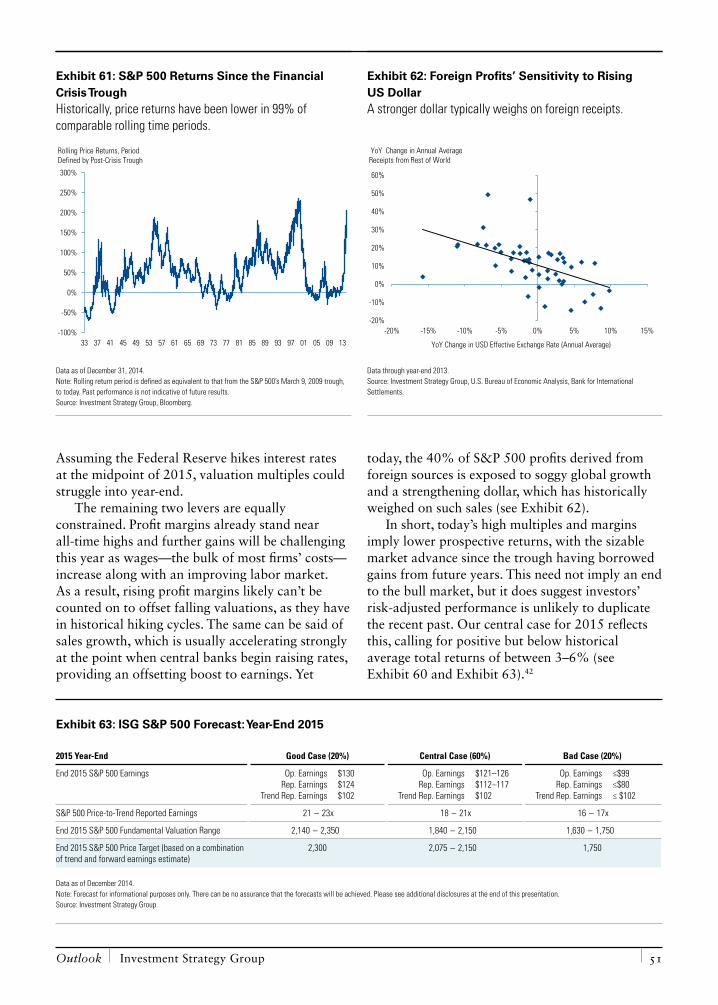
Outlook Investment Strategy Group 51
Assuming the Federal Reserve hikes interest rates at the midpoint of 2015, valuation multiples could struggle into year-end.
The remaining two levers are equally constrained. Profit margins already stand near all-time highs and further gains will be challenging this year as wages—the bulk of most firms’ costs—increase along with an improving labor market. As a result, rising profit margins likely can’t be counted on to offset falling valuations, as they have in historical hiking cycles. The same can be said of sales growth, which is usually accelerating strongly at the point when central banks begin raising rates, providing an offsetting boost to earnings. Yet
today, the 40% of S&P 500 profits derived from foreign sources is exposed to soggy global growth and a strengthening dollar, which has historically weighed on such sales (see Exhibit 62).
In short, today’s high multiples and margins imply lower prospective returns, with the sizable market advance since the trough having borrowed gains from future years. This need not imply an end to the bull market, but it does suggest investors’ risk-adjusted performance is unlikely to duplicate the recent past. Our central case for 2015 reflects this, calling for positive but below historical average total returns of between 3–6% (see Exhibit 60 and Exhibit 63).42
Exhibit 61: S&P 500 Returns Since the Financial Crisis TroughHistorically, price returns have been lower in 99% of comparable rolling time periods.
-100%
-50%
0%
50%
100%
150%
200%
250%
300%
33 37 41 45 49 53 57 61 65 69 73 77 81 85 89 93 97 01 05 09 13
Rolling Price Returns, Period Defined by Post-Crisis Trough
Data as of December 31, 2014. Note: Rolling return period is defined as equivalent to that from the S&P 500’s March 9, 2009 trough, to today. Past performance is not indicative of future results. Source: Investment Strategy Group, Bloomberg.
Exhibit 62: Foreign Profits’ Sensitivity to Rising US DollarA stronger dollar typically weighs on foreign receipts.
-20%
-10%
0%
10%
20%
30%
40%
50%
60%
-20% -15% -10% -5% 0% 5% 10% 15%
YoY Change in Annual Average Receipts from Rest of World
YoY Change in USD Effective Exchange Rate (Annual Average)
Data through year-end 2013. Source: Investment Strategy Group, U.S. Bureau of Economic Analysis, Bank for International Settlements.
Exhibit 63: ISG S&P 500 Forecast: Year-End 2015
2015 Year-End Good Case (20%) Central Case (60%) Bad Case (20%)
End 2015 S&P 500 Earnings Op. Earnings $130 Rep. Earnings $124 Trend Rep. Earnings $102
Op. Earnings $121–126 Rep. Earnings $112–117 Trend Rep. Earnings $102
Op. Earnings ≤$99 Rep. Earnings ≤$80 Trend Rep. Earnings ≤ $102
S&P 500 Price-to-Trend Reported Earnings 21 – 23x 18 – 21x 16 – 17x
End 2015 S&P 500 Fundamental Valuation Range 2,140 – 2,350 1,840 – 2,150 1,630 – 1,750
End 2015 S&P 500 Price Target (based on a combination of trend and forward earnings estimate)
2,300 2,075 – 2,150 1,750
Data as of December 2014. Note: Forecast for informational purposes only. There can be no assurance that the forecasts will be achieved. Please see additional disclosures at the end of this presentation. Source: Investment Strategy Group.
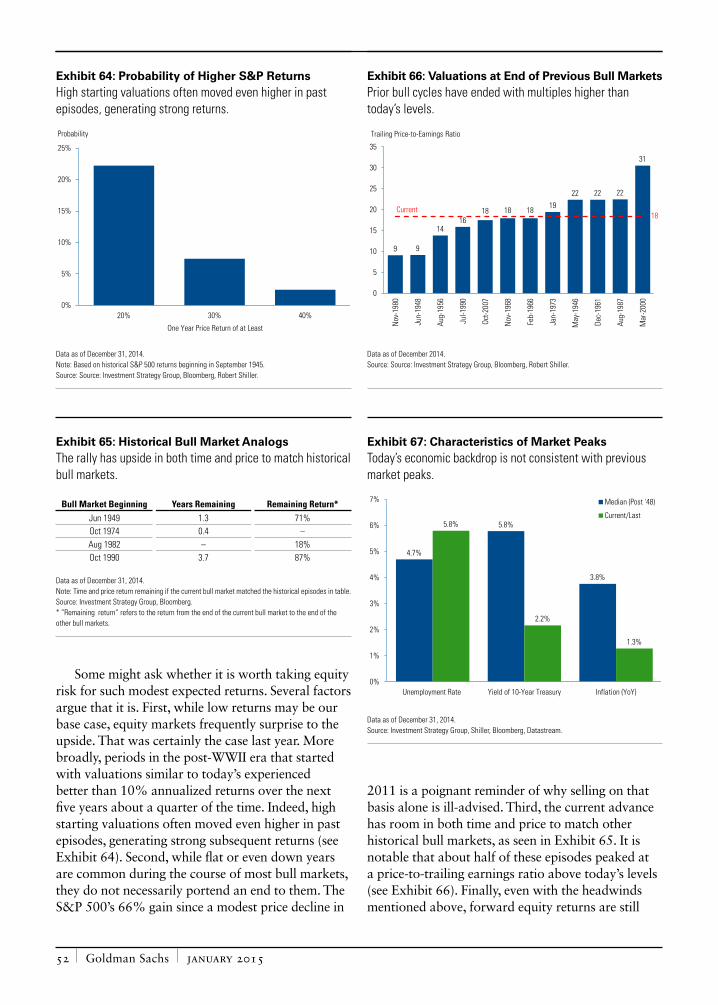
Goldman Sachs january 2015 52
Some might ask whether it is worth taking equity risk for such modest expected returns. Several factors argue that it is. First, while low returns may be our base case, equity markets frequently surprise to the upside. That was certainly the case last year. More broadly, periods in the post-WWII era that started with valuations similar to today’s experienced better than 10% annualized returns over the next five years about a quarter of the time. Indeed, high starting valuations often moved even higher in past episodes, generating strong subsequent returns (see Exhibit 64). Second, while flat or even down years are common during the course of most bull markets, they do not necessarily portend an end to them. The S&P 500’s 66% gain since a modest price decline in
2011 is a poignant reminder of why selling on that basis alone is ill-advised. Third, the current advance has room in both time and price to match other historical bull markets, as seen in Exhibit 65. It is notable that about half of these episodes peaked at a price-to-trailing earnings ratio above today’s levels (see Exhibit 66). Finally, even with the headwinds mentioned above, forward equity returns are still
Exhibit 64: Probability of Higher S&P ReturnsHigh starting valuations often moved even higher in past episodes, generating strong returns.
0%
5%
10%
15%
20%
25%
20% 30% 40%
Probability
One Year Price Return of at Least
Data as of December 31, 2014. Note: Based on historical S&P 500 returns beginning in September 1945. Source: Source: Investment Strategy Group, Bloomberg, Robert Shiller.
Exhibit 65: Historical Bull Market AnalogsThe rally has upside in both time and price to match historical bull markets.
Bull Market Beginning Years Remaining Remaining Return*Jun 1949 1.3 71%Oct 1974 0.4 –Aug 1982 – 18%Oct 1990 3.7 87%
Data as of December 31, 2014. Note: Time and price return remaining if the current bull market matched the historical episodes in table. Source: Investment Strategy Group, Bloomberg. * “Remaining return” refers to the return from the end of the current bull market to the end of the other bull markets.
Exhibit 66: Valuations at End of Previous Bull MarketsPrior bull cycles have ended with multiples higher than today’s levels.
9 9
1416
18 18 1819
22 22 22
31
0
5
10
15
20
25
30
35
Nov
-198
0
Jun-
1948
Aug-
1956
Jul-1
990
Oct-2
007
Nov
-196
8
Feb-
1966
Jan-
1973
May
-194
6
Dec-
1961
Aug-
1987
Mar
-200
0
Trailing Price-to-Earnings Ratio
Current18
Data as of December 2014. Source: Source: Investment Strategy Group, Bloomberg, Robert Shiller.
Exhibit 67: Characteristics of Market PeaksToday’s economic backdrop is not consistent with previous market peaks.
4.7%
5.8%
3.8%
5.8%
2.2%
1.3%
0%
1%
2%
3%
4%
5%
6%
7%
Unemployment Rate Yield of 10-Year Treasury Inflation (YoY)
Median (Post '48)
Current/Last
Data as of December 31, 2014. Source: Investment Strategy Group, Shiller, Bloomberg, Datastream.
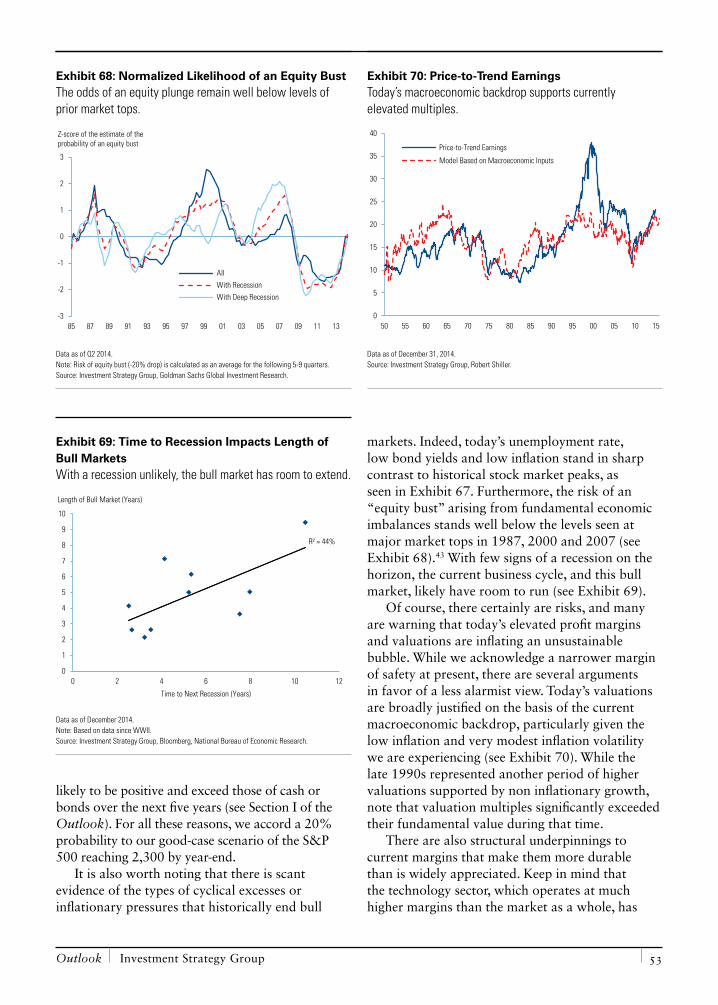
Outlook Investment Strategy Group 53
likely to be positive and exceed those of cash or bonds over the next five years (see Section I of the Outlook). For all these reasons, we accord a 20% probability to our good-case scenario of the S&P 500 reaching 2,300 by year-end.
It is also worth noting that there is scant evidence of the types of cyclical excesses or inflationary pressures that historically end bull
markets. Indeed, today’s unemployment rate, low bond yields and low inflation stand in sharp contrast to historical stock market peaks, as seen in Exhibit 67. Furthermore, the risk of an “equity bust” arising from fundamental economic imbalances stands well below the levels seen at major market tops in 1987, 2000 and 2007 (see Exhibit 68).43 With few signs of a recession on the horizon, the current business cycle, and this bull market, likely have room to run (see Exhibit 69).
Of course, there certainly are risks, and many are warning that today’s elevated profit margins and valuations are inflating an unsustainable bubble. While we acknowledge a narrower margin of safety at present, there are several arguments in favor of a less alarmist view. Today’s valuations are broadly justified on the basis of the current macroeconomic backdrop, particularly given the low inflation and very modest inflation volatility we are experiencing (see Exhibit 70). While the late 1990s represented another period of higher valuations supported by non inflationary growth, note that valuation multiples significantly exceeded their fundamental value during that time.
There are also structural underpinnings to current margins that make them more durable than is widely appreciated. Keep in mind that the technology sector, which operates at much higher margins than the market as a whole, has
Exhibit 68: Normalized Likelihood of an Equity BustThe odds of an equity plunge remain well below levels of prior market tops.
-3
-2
-1
0
1
2
3
85 87 89 91 93 95 97 99 01 03 05 07 09 11 13
All
With Recession
With Deep Recession
Z-score of the estimate of the probability of an equity bust
Data as of Q2 2014. Note: Risk of equity bust (-20% drop) is calculated as an average for the following 5-9 quarters. Source: Investment Strategy Group, Goldman Sachs Global Investment Research.
Exhibit 69: Time to Recession Impacts Length of Bull MarketsWith a recession unlikely, the bull market has room to extend.
0
1
2
3
4
5
6
7
8
9
10
0 2 4 6 8 10 12
Length of Bull Market (Years)
Time to Next Recession (Years)
R² = 44%
Data as of December 2014. Note: Based on data since WWII. Source: Investment Strategy Group, Bloomberg, National Bureau of Economic Research.
Exhibit 70: Price-to-Trend EarningsToday’s macroeconomic backdrop supports currently elevated multiples.
0
5
10
15
20
25
30
35
40
50 55 60 65 70 75 80 85 90 95 00 05 10 15
Price-to-Trend Earnings
Model Based on Macroeconomic Inputs
Data as of December 31, 2014. Source: Investment Strategy Group, Robert Shiller.
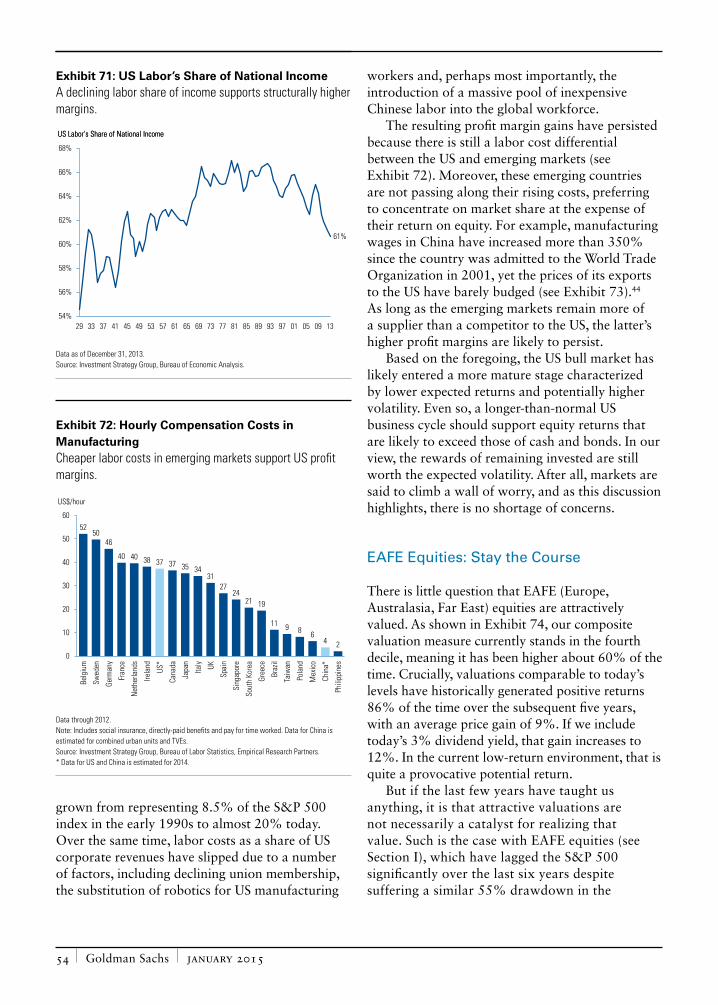
Goldman Sachs january 2015 54
grown from representing 8.5% of the S&P 500 index in the early 1990s to almost 20% today. Over the same time, labor costs as a share of US corporate revenues have slipped due to a number of factors, including declining union membership, the substitution of robotics for US manufacturing
workers and, perhaps most importantly, the introduction of a massive pool of inexpensive Chinese labor into the global workforce.
The resulting profit margin gains have persisted because there is still a labor cost differential between the US and emerging markets (see Exhibit 72). Moreover, these emerging countries are not passing along their rising costs, preferring to concentrate on market share at the expense of their return on equity. For example, manufacturing wages in China have increased more than 350% since the country was admitted to the World Trade Organization in 2001, yet the prices of its exports to the US have barely budged (see Exhibit 73).44 As long as the emerging markets remain more of a supplier than a competitor to the US, the latter’s higher profit margins are likely to persist.
Based on the foregoing, the US bull market has likely entered a more mature stage characterized by lower expected returns and potentially higher volatility. Even so, a longer-than-normal US business cycle should support equity returns that are likely to exceed those of cash and bonds. In our view, the rewards of remaining invested are still worth the expected volatility. After all, markets are said to climb a wall of worry, and as this discussion highlights, there is no shortage of concerns.
EAFE Equities: Stay the Course
There is little question that EAFE (Europe, Australasia, Far East) equities are attractively valued. As shown in Exhibit 74, our composite valuation measure currently stands in the fourth decile, meaning it has been higher about 60% of the time. Crucially, valuations comparable to today’s levels have historically generated positive returns 86% of the time over the subsequent five years, with an average price gain of 9%. If we include today’s 3% dividend yield, that gain increases to 12%. In the current low-return environment, that is quite a provocative potential return.
But if the last few years have taught us anything, it is that attractive valuations are not necessarily a catalyst for realizing that value. Such is the case with EAFE equities (see Section I), which have lagged the S&P 500 significantly over the last six years despite suffering a similar 55% drawdown in the
Exhibit 71: US Labor’s Share of National IncomeA declining labor share of income supports structurally higher margins.
61%
54%
56%
58%
60%
62%
64%
66%
68%
29 33 37 41 45 49 53 57 61 65 69 73 77 81 85 89 93 97 01 05 09 13
US Labor's Share of National IncomeUS Labor's Share of National Income
Data as of December 31, 2013. Source: Investment Strategy Group, Bureau of Economic Analysis.
Exhibit 72: Hourly Compensation Costs in ManufacturingCheaper labor costs in emerging markets support US profit margins.
5250
46
40 40 38 37 37 35 3431
2724
21 19
11 9 8 64 2
0
10
20
30
40
50
60
Belg
ium
Swed
en
Germ
any
Fran
ce
Net
herla
nds
Irela
nd
US*
Cana
da
Japa
n
Italy UK
Spai
n
Sing
apor
e
Sout
h Ko
rea
Gree
ce
Braz
il
Taiw
an
Pola
nd
Mex
ico
Chin
a*
Phili
ppin
es
US$/hour
Data through 2012. Note: Includes social insurance, directly-paid benefits and pay for time worked. Data for China is estimated for combined urban units and TVEs. Source: Investment Strategy Group, Bureau of Labor Statistics, Empirical Research Partners. * Data for US and China is estimated for 2014.
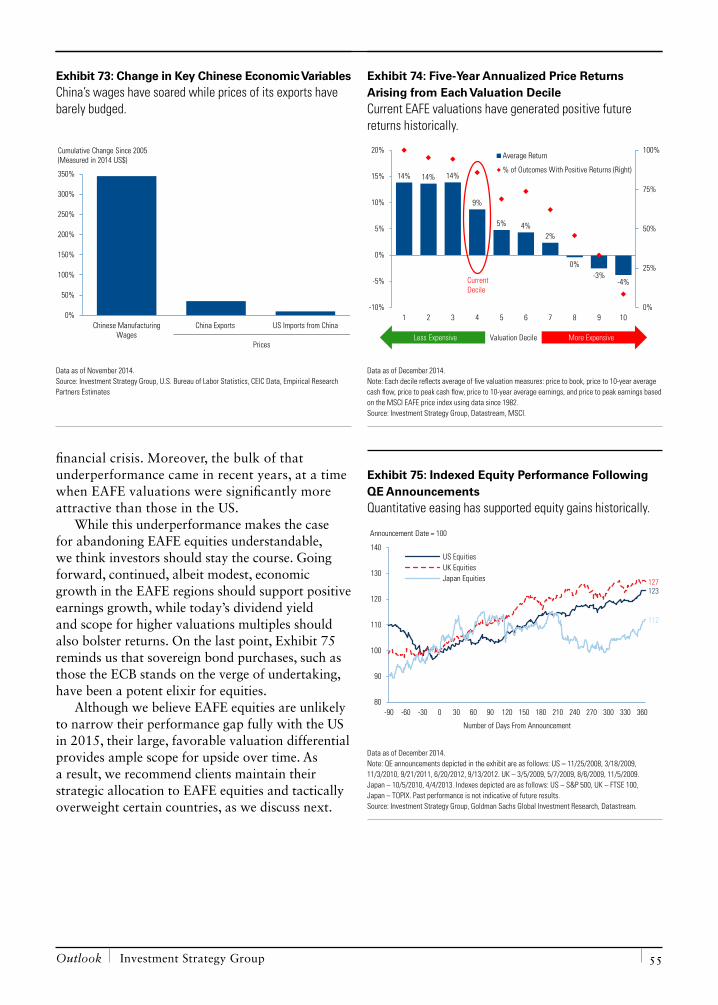
Outlook Investment Strategy Group 55
financial crisis. Moreover, the bulk of that underperformance came in recent years, at a time when EAFE valuations were significantly more attractive than those in the US.
While this underperformance makes the case for abandoning EAFE equities understandable, we think investors should stay the course. Going forward, continued, albeit modest, economic growth in the EAFE regions should support positive earnings growth, while today’s dividend yield and scope for higher valuations multiples should also bolster returns. On the last point, Exhibit 75 reminds us that sovereign bond purchases, such as those the ECB stands on the verge of undertaking, have been a potent elixir for equities.
Although we believe EAFE equities are unlikely to narrow their performance gap fully with the US in 2015, their large, favorable valuation differential provides ample scope for upside over time. As a result, we recommend clients maintain their strategic allocation to EAFE equities and tactically overweight certain countries, as we discuss next.
Exhibit 73: Change in Key Chinese Economic VariablesChina’s wages have soared while prices of its exports have barely budged.
0%
50%
100%
150%
200%
250%
300%
350%
Chinese ManufacturingWages
China Exports US Imports from China
Cumulative Change Since 2005(Measured in 2014 US$)
Prices
Data as of November 2014. Source: Investment Strategy Group, U.S. Bureau of Labor Statistics, CEIC Data, Empirical Research Partners Estimates
Exhibit 74: Five-Year Annualized Price Returns Arising from Each Valuation DecileCurrent EAFE valuations have generated positive future returns historically.
14% 14% 14%
9%
5% 4%2%
0%-3%
-4%
0%
25%
50%
75%
100%
-10%
-5%
0%
5%
10%
15%
20%
1 2 3 4 5 6 7 8 9 10
Average Return
% of Outcomes With Positive Returns (Right)
More ExpensiveValuation Decile
CurrentDecile
Less Expensive
Data as of December 2014. Note: Each decile reflects average of five valuation measures: price to book, price to 10-year average cash flow, price to peak cash flow, price to 10-year average earnings, and price to peak earnings based on the MSCI EAFE price index using data since 1982. Source: Investment Strategy Group, Datastream, MSCI.
Exhibit 75: Indexed Equity Performance Following QE AnnouncementsQuantitative easing has supported equity gains historically.
123127
112
80
90
100
110
120
130
140
-90 -60 -30 0 30 60 90 120 150 180 210 240 270 300 330 360
Number of Days From Announcement
US EquitiesUK EquitiesJapan Equities
Announcement Date = 100
Data as of December 2014. Note: QE announcements depicted in the exhibit are as follows: US – 11/25/2008, 3/18/2009, 11/3/2010, 9/21/2011, 6/20/2012, 9/13/2012. UK – 3/5/2009, 5/7/2009, 8/6/2009, 11/5/2009. Japan – 10/5/2010, 4/4/2013. Indexes depicted are as follows: US – S&P 500, UK – FTSE 100, Japan – TOPIX. Past performance is not indicative of future results. Source: Investment Strategy Group, Goldman Sachs Global Investment Research, Datastream.
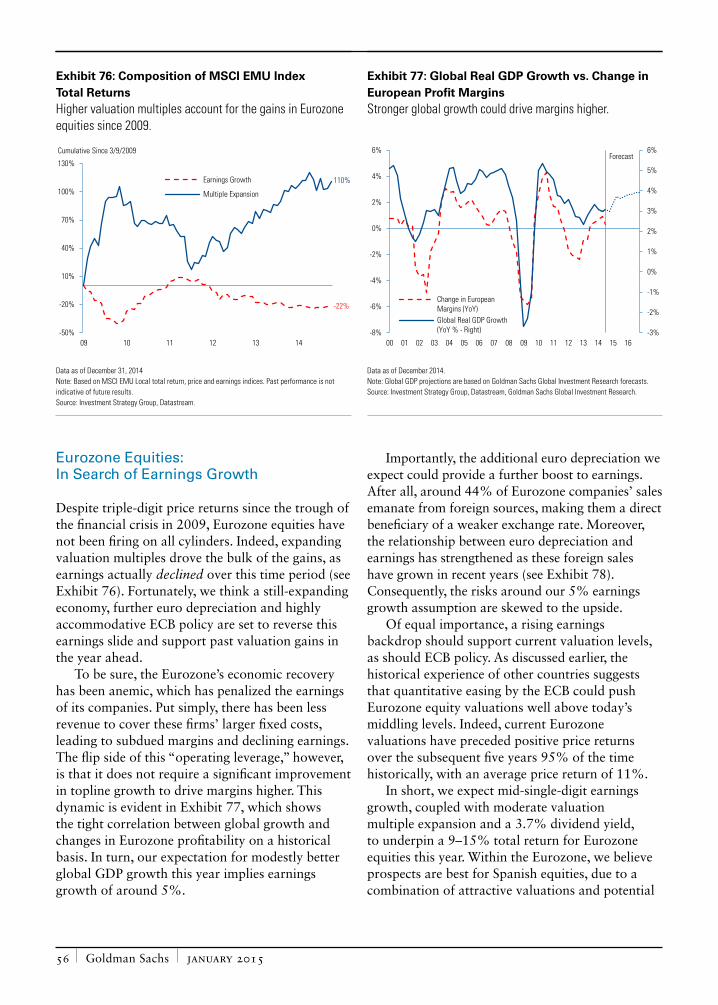
Goldman Sachs january 2015 56
Eurozone Equities: In Search of Earnings Growth
Despite triple-digit price returns since the trough of the financial crisis in 2009, Eurozone equities have not been firing on all cylinders. Indeed, expanding valuation multiples drove the bulk of the gains, as earnings actually declined over this time period (see Exhibit 76). Fortunately, we think a still-expanding economy, further euro depreciation and highly accommodative ECB policy are set to reverse this earnings slide and support past valuation gains in the year ahead.
To be sure, the Eurozone’s economic recovery has been anemic, which has penalized the earnings of its companies. Put simply, there has been less revenue to cover these firms’ larger fixed costs, leading to subdued margins and declining earnings. The flip side of this “operating leverage,” however, is that it does not require a significant improvement in topline growth to drive margins higher. This dynamic is evident in Exhibit 77, which shows the tight correlation between global growth and changes in Eurozone profitability on a historical basis. In turn, our expectation for modestly better global GDP growth this year implies earnings growth of around 5%.
Importantly, the additional euro depreciation we expect could provide a further boost to earnings. After all, around 44% of Eurozone companies’ sales emanate from foreign sources, making them a direct beneficiary of a weaker exchange rate. Moreover, the relationship between euro depreciation and earnings has strengthened as these foreign sales have grown in recent years (see Exhibit 78). Consequently, the risks around our 5% earnings growth assumption are skewed to the upside.
Of equal importance, a rising earnings backdrop should support current valuation levels, as should ECB policy. As discussed earlier, the historical experience of other countries suggests that quantitative easing by the ECB could push Eurozone equity valuations well above today’s middling levels. Indeed, current Eurozone valuations have preceded positive price returns over the subsequent five years 95% of the time historically, with an average price return of 11%.
In short, we expect mid-single-digit earnings growth, coupled with moderate valuation multiple expansion and a 3.7% dividend yield, to underpin a 9–15% total return for Eurozone equities this year. Within the Eurozone, we believe prospects are best for Spanish equities, due to a combination of attractive valuations and potential
Exhibit 76: Composition of MSCI EMU Index Total ReturnsHigher valuation multiples account for the gains in Eurozone equities since 2009.
-50%
-20%
10%
40%
70%
100%
130%
09 10 11 12 13 14
Earnings Growth
Multiple Expansion
Cumulative Since 3/9/2009
110%
-22%
Data as of December 31, 2014 Note: Based on MSCI EMU Local total return, price and earnings indices. Past performance is not indicative of future results. Source: Investment Strategy Group, Datastream.
Exhibit 77: Global Real GDP Growth vs. Change in European Profit MarginsStronger global growth could drive margins higher.
-3%
-2%
-1%
0%
1%
2%
3%
4%
5%
6%
-8%
-6%
-4%
-2%
0%
2%
4%
6%
00 01 02 03 04 05 06 07 08 09 10 11 12 13 14 15 16
Change in EuropeanMargins (YoY)Global Real GDP Growth(YoY % - Right)
Forecast
Data as of December 2014. Note: Global GDP projections are based on Goldman Sachs Global Investment Research forecasts. Source: Investment Strategy Group, Datastream, Goldman Sachs Global Investment Research.
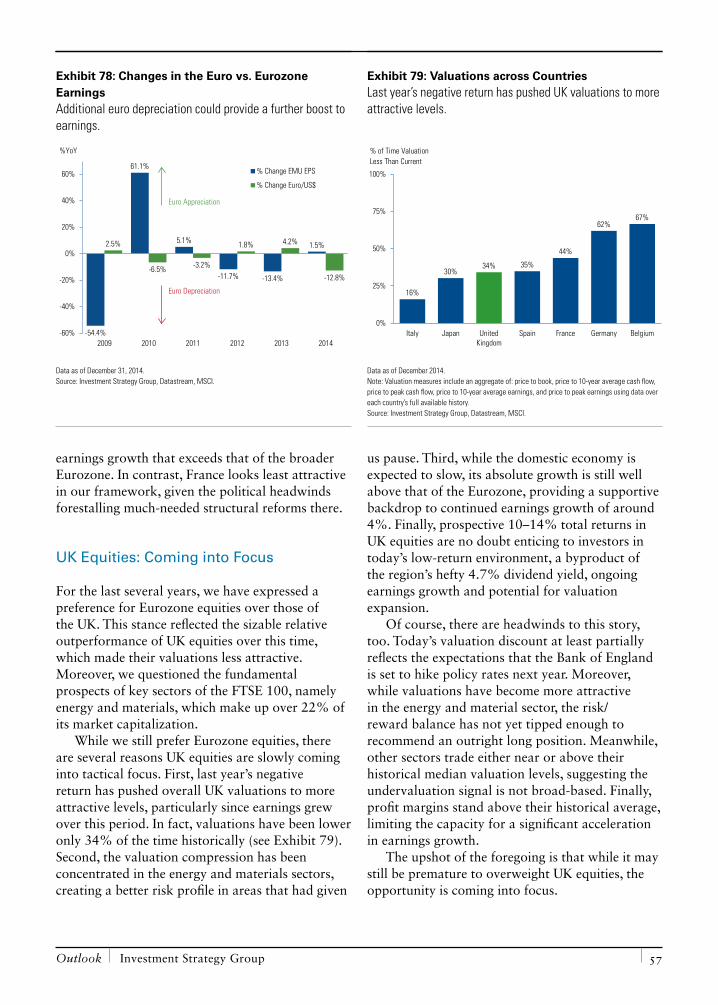
Outlook Investment Strategy Group 57
earnings growth that exceeds that of the broader Eurozone. In contrast, France looks least attractive in our framework, given the political headwinds forestalling much-needed structural reforms there.
UK Equities: Coming into Focus
For the last several years, we have expressed a preference for Eurozone equities over those of the UK. This stance reflected the sizable relative outperformance of UK equities over this time, which made their valuations less attractive. Moreover, we questioned the fundamental prospects of key sectors of the FTSE 100, namely energy and materials, which make up over 22% of its market capitalization.
While we still prefer Eurozone equities, there are several reasons UK equities are slowly coming into tactical focus. First, last year’s negative return has pushed overall UK valuations to more attractive levels, particularly since earnings grew over this period. In fact, valuations have been lower only 34% of the time historically (see Exhibit 79). Second, the valuation compression has been concentrated in the energy and materials sectors, creating a better risk profile in areas that had given
us pause. Third, while the domestic economy is expected to slow, its absolute growth is still well above that of the Eurozone, providing a supportive backdrop to continued earnings growth of around 4%. Finally, prospective 10–14% total returns in UK equities are no doubt enticing to investors in today’s low-return environment, a byproduct of the region’s hefty 4.7% dividend yield, ongoing earnings growth and potential for valuation expansion.
Of course, there are headwinds to this story, too. Today’s valuation discount at least partially reflects the expectations that the Bank of England is set to hike policy rates next year. Moreover, while valuations have become more attractive in the energy and material sector, the risk/reward balance has not yet tipped enough to recommend an outright long position. Meanwhile, other sectors trade either near or above their historical median valuation levels, suggesting the undervaluation signal is not broad-based. Finally, profit margins stand above their historical average, limiting the capacity for a significant acceleration in earnings growth.
The upshot of the foregoing is that while it may still be premature to overweight UK equities, the opportunity is coming into focus.
Exhibit 78: Changes in the Euro vs. Eurozone EarningsAdditional euro depreciation could provide a further boost to earnings.
-54.4%
61.1%
5.1%
-11.7% -13.4%
1.5%2.5%
-6.5% -3.2%
1.8% 4.2%
-12.8%
2009 2010 2011 2012 2013 2014-60%
-40%
-20%
0%
20%
40%
60% % Change EMU EPS
% Change Euro/US$
%YoY
Euro Appreciation
Euro Depreciation
Data as of December 31, 2014. Source: Investment Strategy Group, Datastream, MSCI.
Exhibit 79: Valuations across CountriesLast year’s negative return has pushed UK valuations to more attractive levels.
16%
30%34% 35%
44%
62%67%
0%
25%
50%
75%
100%
Italy Japan UnitedKingdom
Spain France Germany Belgium
% of Time Valuation Less Than Current
Data as of December 2014. Note: Valuation measures include an aggregate of: price to book, price to 10-year average cash flow, price to peak cash flow, price to 10-year average earnings, and price to peak earnings using data over each country’s full available history. Source: Investment Strategy Group, Datastream, MSCI.
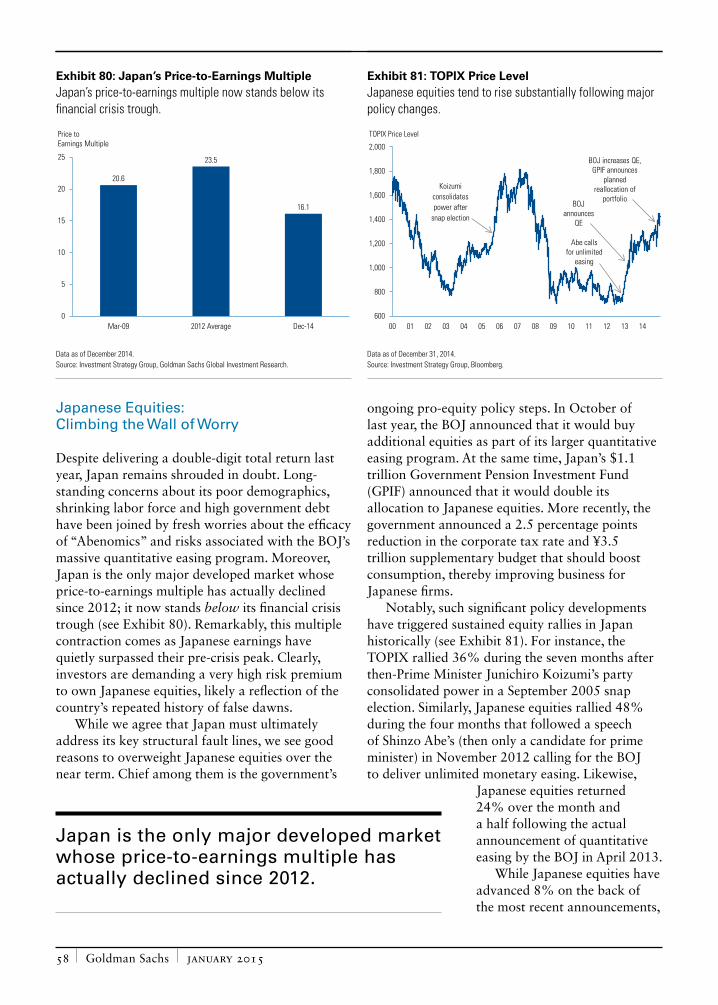
Goldman Sachs january 2015 58
Japanese Equities: Climbing the Wall of Worry
Despite delivering a double-digit total return last year, Japan remains shrouded in doubt. Long-standing concerns about its poor demographics, shrinking labor force and high government debt have been joined by fresh worries about the efficacy of “Abenomics” and risks associated with the BOJ’s massive quantitative easing program. Moreover, Japan is the only major developed market whose price-to-earnings multiple has actually declined since 2012; it now stands below its financial crisis trough (see Exhibit 80). Remarkably, this multiple contraction comes as Japanese earnings have quietly surpassed their pre-crisis peak. Clearly, investors are demanding a very high risk premium to own Japanese equities, likely a reflection of the country’s repeated history of false dawns.
While we agree that Japan must ultimately address its key structural fault lines, we see good reasons to overweight Japanese equities over the near term. Chief among them is the government’s
ongoing pro-equity policy steps. In October of last year, the BOJ announced that it would buy additional equities as part of its larger quantitative easing program. At the same time, Japan’s $1.1 trillion Government Pension Investment Fund (GPIF) announced that it would double its allocation to Japanese equities. More recently, the government announced a 2.5 percentage points reduction in the corporate tax rate and ¥3.5 trillion supplementary budget that should boost consumption, thereby improving business for Japanese firms.
Notably, such significant policy developments have triggered sustained equity rallies in Japan historically (see Exhibit 81). For instance, the TOPIX rallied 36% during the seven months after then-Prime Minister Junichiro Koizumi’s party consolidated power in a September 2005 snap election. Similarly, Japanese equities rallied 48% during the four months that followed a speech of Shinzo Abe’s (then only a candidate for prime minister) in November 2012 calling for the BOJ to deliver unlimited monetary easing. Likewise,
Japanese equities returned 24% over the month and a half following the actual announcement of quantitative easing by the BOJ in April 2013.
While Japanese equities have advanced 8% on the back of the most recent announcements,
Japan is the only major developed market whose price-to-earnings multiple has actually declined since 2012.
Exhibit 80: Japan’s Price-to-Earnings MultipleJapan’s price-to-earnings multiple now stands below its financial crisis trough.
20.6
23.5
16.1
0
5
10
15
20
25
Mar-09 2012 Average Dec-14
Price to Earnings Multiple
Data as of December 2014. Source: Investment Strategy Group, Goldman Sachs Global Investment Research.
Exhibit 81: TOPIX Price LevelJapanese equities tend to rise substantially following major policy changes.
600
800
1,000
1,200
1,400
1,600
1,800
2,000
00 01 02 03 04 05 06 07 08 09 10 11 12 13 14
TOPIX Price Level
Koizumi consolidates power after
snap election
Abe callsfor unlimited
easing
BOJannounces
QE
BOJ increases QE, GPIF announces
planned reallocation of
portfolio
Data as of December 31, 2014. Source: Investment Strategy Group, Bloomberg.
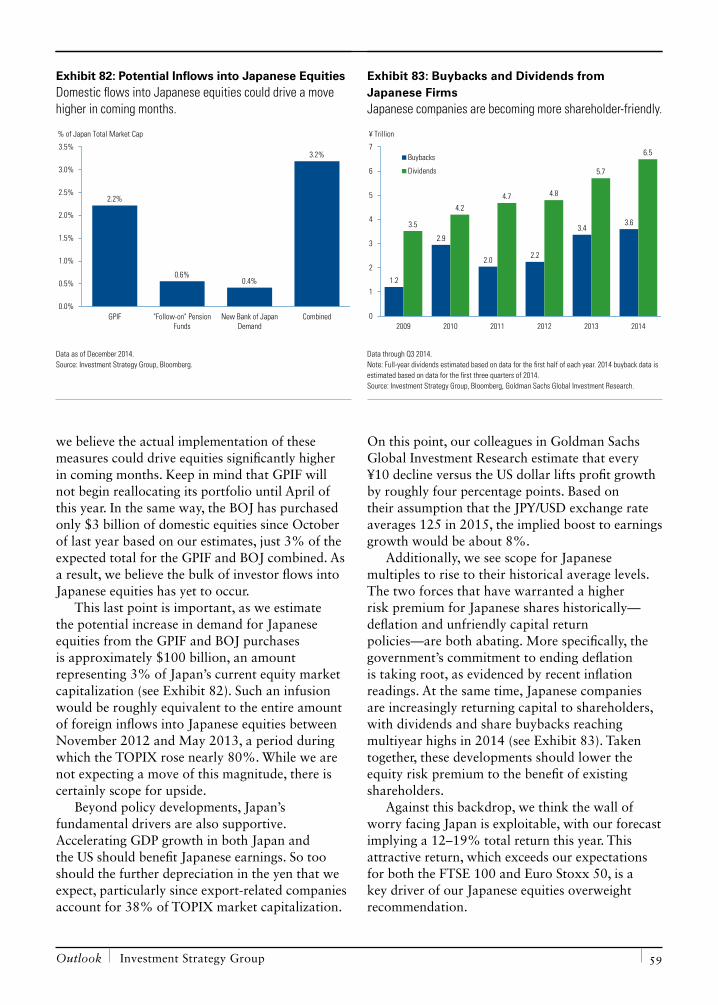
Outlook Investment Strategy Group 59
we believe the actual implementation of these measures could drive equities significantly higher in coming months. Keep in mind that GPIF will not begin reallocating its portfolio until April of this year. In the same way, the BOJ has purchased only $3 billion of domestic equities since October of last year based on our estimates, just 3% of the expected total for the GPIF and BOJ combined. As a result, we believe the bulk of investor flows into Japanese equities has yet to occur.
This last point is important, as we estimate the potential increase in demand for Japanese equities from the GPIF and BOJ purchases is approximately $100 billion, an amount representing 3% of Japan’s current equity market capitalization (see Exhibit 82). Such an infusion would be roughly equivalent to the entire amount of foreign inflows into Japanese equities between November 2012 and May 2013, a period during which the TOPIX rose nearly 80%. While we are not expecting a move of this magnitude, there is certainly scope for upside.
Beyond policy developments, Japan’s fundamental drivers are also supportive. Accelerating GDP growth in both Japan and the US should benefit Japanese earnings. So too should the further depreciation in the yen that we expect, particularly since export-related companies account for 38% of TOPIX market capitalization.
On this point, our colleagues in Goldman Sachs Global Investment Research estimate that every ¥10 decline versus the US dollar lifts profit growth by roughly four percentage points. Based on their assumption that the JPY/USD exchange rate averages 125 in 2015, the implied boost to earnings growth would be about 8%.
Additionally, we see scope for Japanese multiples to rise to their historical average levels. The two forces that have warranted a higher risk premium for Japanese shares historically—deflation and unfriendly capital return policies—are both abating. More specifically, the government’s commitment to ending deflation is taking root, as evidenced by recent inflation readings. At the same time, Japanese companies are increasingly returning capital to shareholders, with dividends and share buybacks reaching multiyear highs in 2014 (see Exhibit 83). Taken together, these developments should lower the equity risk premium to the benefit of existing shareholders.
Against this backdrop, we think the wall of worry facing Japan is exploitable, with our forecast implying a 12–19% total return this year. This attractive return, which exceeds our expectations for both the FTSE 100 and Euro Stoxx 50, is a key driver of our Japanese equities overweight recommendation.
Exhibit 82: Potential Inflows into Japanese EquitiesDomestic flows into Japanese equities could drive a move higher in coming months.
2.2%
0.6%0.4%
3.2%
0.0%
0.5%
1.0%
1.5%
2.0%
2.5%
3.0%
3.5%
GPIF "Follow-on" PensionFunds
New Bank of JapanDemand
Combined
% of Japan Total Market Cap
Data as of December 2014. Source: Investment Strategy Group, Bloomberg.
Exhibit 83: Buybacks and Dividends from Japanese FirmsJapanese companies are becoming more shareholder-friendly.
1.2
2.9
2.02.2
3.43.63.5
4.24.7 4.8
5.7
6.5
0
1
2
3
4
5
6
7
2009 2010 2011 2012 2013 2014
Buybacks
Dividends
¥ Trillion
Data through Q3 2014. Note: Full-year dividends estimated based on data for the first half of each year. 2014 buyback data is estimated based on data for the first three quarters of 2014. Source: Investment Strategy Group, Bloomberg, Goldman Sachs Global Investment Research.
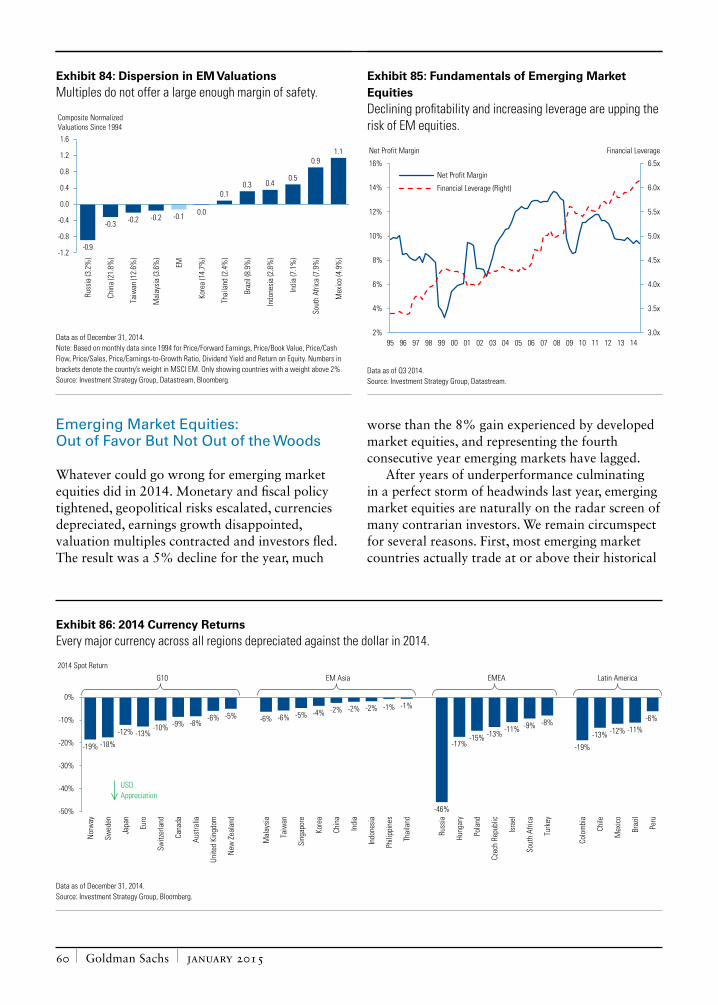
Goldman Sachs january 2015 60
Emerging Market Equities: Out of Favor But Not Out of the Woods
Whatever could go wrong for emerging market equities did in 2014. Monetary and fiscal policy tightened, geopolitical risks escalated, currencies depreciated, earnings growth disappointed, valuation multiples contracted and investors fled. The result was a 5% decline for the year, much
worse than the 8% gain experienced by developed market equities, and representing the fourth consecutive year emerging markets have lagged.
After years of underperformance culminating in a perfect storm of headwinds last year, emerging market equities are naturally on the radar screen of many contrarian investors. We remain circumspect for several reasons. First, most emerging market countries actually trade at or above their historical
Exhibit 84: Dispersion in EM ValuationsMultiples do not offer a large enough margin of safety.
-0.9
-0.3 -0.2 -0.2 -0.1 0.0
0.10.3 0.4
0.5
0.91.1
-1.2
-0.8
-0.4
0.0
0.4
0.8
1.2
1.6
Russ
ia (3
.2%
)
Chin
a (2
1.8%
)
Taiw
an (1
2.6%
)
Mal
aysia
(3.6
%)
EM
Kore
a (1
4.7%
)
Thai
land
(2.4
%)
Braz
il (8
.9%
)
Indo
nesi
a (2
.8%
)
Indi
a (7
.1%
)
Sout
h Af
rica
(7.9
%)
Mex
ico (4
.9%
)
Composite Normalized Valuations Since 1994
Data as of December 31, 2014. Note: Based on monthly data since 1994 for Price/Forward Earnings, Price/Book Value, Price/Cash Flow, Price/Sales, Price/Earnings-to-Growth Ratio, Dividend Yield and Return on Equity. Numbers in brackets denote the country’s weight in MSCI EM. Only showing countries with a weight above 2%. Source: Investment Strategy Group, Datastream, Bloomberg.
Exhibit 85: Fundamentals of Emerging Market EquitiesDeclining profitability and increasing leverage are upping the risk of EM equities.
3.0x
3.5x
4.0x
4.5x
5.0x
5.5x
6.0x
6.5x
2%
4%
6%
8%
10%
12%
14%
16%
95 96 97 98 99 00 01 02 03 04 05 06 07 08 09 10 11 12 13 14
Net Profit Margin
Financial Leverage (Right)
Net Profit Margin Financial Leverage
Data as of Q3 2014. Source: Investment Strategy Group, Datastream.
Exhibit 86: 2014 Currency ReturnsEvery major currency across all regions depreciated against the dollar in 2014.
-19% -18%
-12% -13%-10% -9% -8%
-6% -5% -6% -6% -5% -4% -2% -2% -2% -1% -1%
-46%
-17%-15% -13% -11% -9% -8%
-19%
-13% -12% -11%-6%
-50%
-40%
-30%
-20%
-10%
0%
Nor
way
Swed
en
Japa
n
Euro
Switz
erla
nd
Cana
da
Aust
ralia
Unite
d Ki
ngdo
m
New
Zea
land
Mal
aysia
Taiw
an
Sing
apor
e
Kore
a
Chin
a
Indi
a
Indo
nesi
a
Phili
ppin
es
Thai
land
Russ
ia
Hung
ary
Pola
nd
Czec
h Re
publ
ic
Isra
el
Sout
h Af
rica
Turk
ey
Colo
mbi
a
Chile
Mex
ico
Braz
il
Peru
2014 Spot Return
G10 EM Asia EMEA Latin America
USD Appreciation
Data as of December 31, 2014. Source: Investment Strategy Group, Bloomberg.
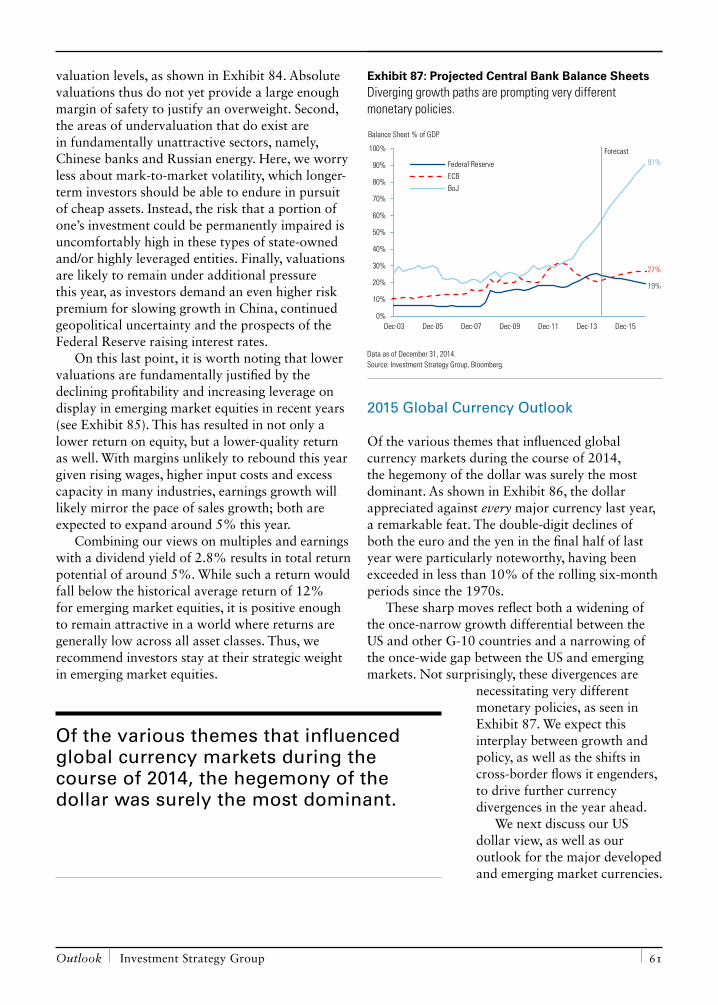
Outlook Investment Strategy Group 61
valuation levels, as shown in Exhibit 84. Absolute valuations thus do not yet provide a large enough margin of safety to justify an overweight. Second, the areas of undervaluation that do exist are in fundamentally unattractive sectors, namely, Chinese banks and Russian energy. Here, we worry less about mark-to-market volatility, which longer-term investors should be able to endure in pursuit of cheap assets. Instead, the risk that a portion of one’s investment could be permanently impaired is uncomfortably high in these types of state-owned and/or highly leveraged entities. Finally, valuations are likely to remain under additional pressure this year, as investors demand an even higher risk premium for slowing growth in China, continued geopolitical uncertainty and the prospects of the Federal Reserve raising interest rates.
On this last point, it is worth noting that lower valuations are fundamentally justified by the declining profitability and increasing leverage on display in emerging market equities in recent years (see Exhibit 85). This has resulted in not only a lower return on equity, but a lower-quality return as well. With margins unlikely to rebound this year given rising wages, higher input costs and excess capacity in many industries, earnings growth will likely mirror the pace of sales growth; both are expected to expand around 5% this year.
Combining our views on multiples and earnings with a dividend yield of 2.8% results in total return potential of around 5%. While such a return would fall below the historical average return of 12% for emerging market equities, it is positive enough to remain attractive in a world where returns are generally low across all asset classes. Thus, we recommend investors stay at their strategic weight in emerging market equities.
2015 Global Currency Outlook
Of the various themes that influenced global currency markets during the course of 2014, the hegemony of the dollar was surely the most dominant. As shown in Exhibit 86, the dollar appreciated against every major currency last year, a remarkable feat. The double-digit declines of both the euro and the yen in the final half of last year were particularly noteworthy, having been exceeded in less than 10% of the rolling six-month periods since the 1970s.
These sharp moves reflect both a widening of the once-narrow growth differential between the US and other G-10 countries and a narrowing of the once-wide gap between the US and emerging markets. Not surprisingly, these divergences are
necessitating very different monetary policies, as seen in Exhibit 87. We expect this interplay between growth and policy, as well as the shifts in cross-border flows it engenders, to drive further currency divergences in the year ahead.
We next discuss our US dollar view, as well as our outlook for the major developed and emerging market currencies.
Of the various themes that influenced global currency markets during the course of 2014, the hegemony of the dollar was surely the most dominant.
Exhibit 87: Projected Central Bank Balance SheetsDiverging growth paths are prompting very different monetary policies.
0%
10%
20%
30%
40%
50%
60%
70%
80%
90%
100%
Dec-03 Dec-05 Dec-07 Dec-09 Dec-11 Dec-13 Dec-15
Federal Reserve
ECB
BoJ
Forecast91%
27%
19%
Balance Sheet % of GDP
Data as of December 31, 2014. Source: Investment Strategy Group, Bloomberg.
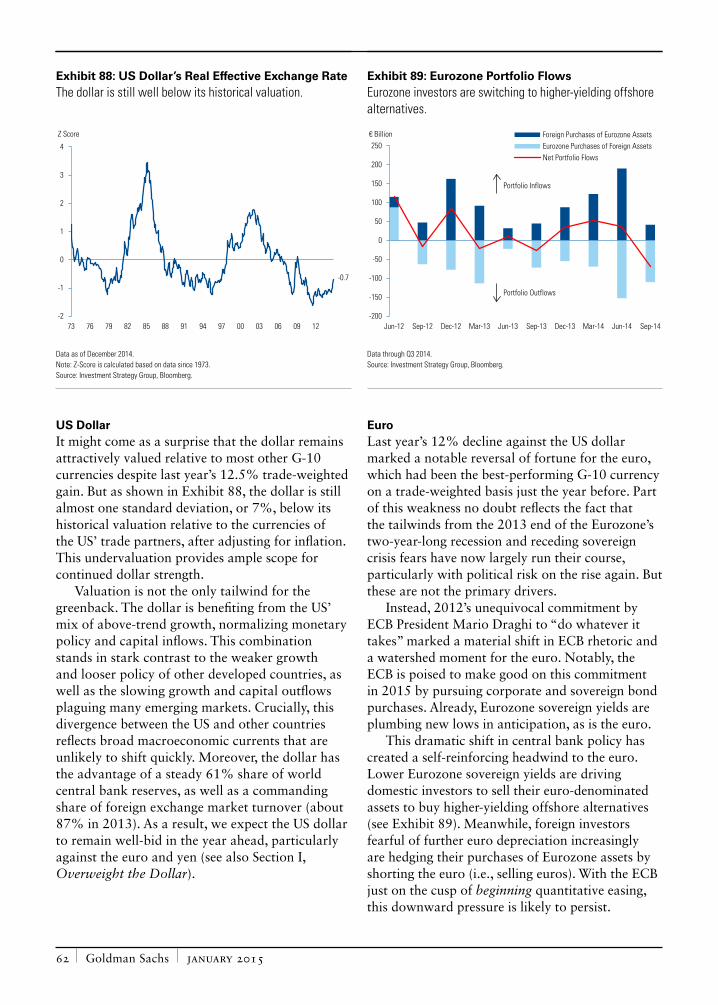
Goldman Sachs january 2015 62
US DollarIt might come as a surprise that the dollar remains attractively valued relative to most other G-10 currencies despite last year’s 12.5% trade-weighted gain. But as shown in Exhibit 88, the dollar is still almost one standard deviation, or 7%, below its historical valuation relative to the currencies of the US’ trade partners, after adjusting for inflation. This undervaluation provides ample scope for continued dollar strength.
Valuation is not the only tailwind for the greenback. The dollar is benefiting from the US’ mix of above-trend growth, normalizing monetary policy and capital inflows. This combination stands in stark contrast to the weaker growth and looser policy of other developed countries, as well as the slowing growth and capital outflows plaguing many emerging markets. Crucially, this divergence between the US and other countries reflects broad macroeconomic currents that are unlikely to shift quickly. Moreover, the dollar has the advantage of a steady 61% share of world central bank reserves, as well as a commanding share of foreign exchange market turnover (about 87% in 2013). As a result, we expect the US dollar to remain well-bid in the year ahead, particularly against the euro and yen (see also Section I, Overweight the Dollar).
EuroLast year’s 12% decline against the US dollar marked a notable reversal of fortune for the euro, which had been the best-performing G-10 currency on a trade-weighted basis just the year before. Part of this weakness no doubt reflects the fact that the tailwinds from the 2013 end of the Eurozone’s two-year-long recession and receding sovereign crisis fears have now largely run their course, particularly with political risk on the rise again. But these are not the primary drivers.
Instead, 2012’s unequivocal commitment by ECB President Mario Draghi to “do whatever it takes” marked a material shift in ECB rhetoric and a watershed moment for the euro. Notably, the ECB is poised to make good on this commitment in 2015 by pursuing corporate and sovereign bond purchases. Already, Eurozone sovereign yields are plumbing new lows in anticipation, as is the euro.
This dramatic shift in central bank policy has created a self-reinforcing headwind to the euro. Lower Eurozone sovereign yields are driving domestic investors to sell their euro-denominated assets to buy higher-yielding offshore alternatives (see Exhibit 89). Meanwhile, foreign investors fearful of further euro depreciation increasingly are hedging their purchases of Eurozone assets by shorting the euro (i.e., selling euros). With the ECB just on the cusp of beginning quantitative easing, this downward pressure is likely to persist.
Exhibit 88: US Dollar’s Real Effective Exchange RateThe dollar is still well below its historical valuation.
-2
-1
0
1
2
3
4
73 76 79 82 85 88 91 94 97 00 03 06 09 12
Z Score
-0.7
Data as of December 2014. Note: Z-Score is calculated based on data since 1973. Source: Investment Strategy Group, Bloomberg.
Exhibit 89: Eurozone Portfolio FlowsEurozone investors are switching to higher-yielding offshore alternatives.
-200
-150
-100
-50
0
50
100
150
200
250
Jun-12 Sep-12 Dec-12 Mar-13 Jun-13 Sep-13 Dec-13 Mar-14 Jun-14 Sep-14
Foreign Purchases of Eurozone AssetsEurozone Purchases of Foreign AssetsNet Portfolio Flows
€ Billion
Portfolio Inflows
Portfolio Outflows
Data through Q3 2014. Source: Investment Strategy Group, Bloomberg.
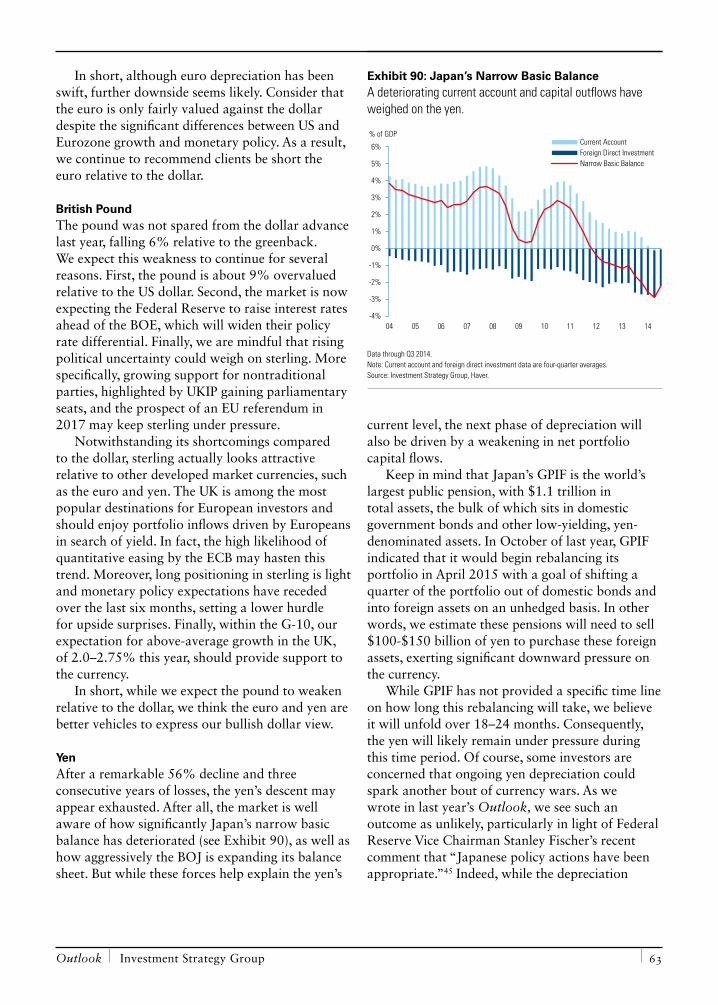
Outlook Investment Strategy Group 63
In short, although euro depreciation has been swift, further downside seems likely. Consider that the euro is only fairly valued against the dollar despite the significant differences between US and Eurozone growth and monetary policy. As a result, we continue to recommend clients be short the euro relative to the dollar.
British PoundThe pound was not spared from the dollar advance last year, falling 6% relative to the greenback. We expect this weakness to continue for several reasons. First, the pound is about 9% overvalued relative to the US dollar. Second, the market is now expecting the Federal Reserve to raise interest rates ahead of the BOE, which will widen their policy rate differential. Finally, we are mindful that rising political uncertainty could weigh on sterling. More specifically, growing support for nontraditional parties, highlighted by UKIP gaining parliamentary seats, and the prospect of an EU referendum in 2017 may keep sterling under pressure.
Notwithstanding its shortcomings compared to the dollar, sterling actually looks attractive relative to other developed market currencies, such as the euro and yen. The UK is among the most popular destinations for European investors and should enjoy portfolio inflows driven by Europeans in search of yield. In fact, the high likelihood of quantitative easing by the ECB may hasten this trend. Moreover, long positioning in sterling is light and monetary policy expectations have receded over the last six months, setting a lower hurdle for upside surprises. Finally, within the G-10, our expectation for above-average growth in the UK, of 2.0–2.75% this year, should provide support to the currency.
In short, while we expect the pound to weaken relative to the dollar, we think the euro and yen are better vehicles to express our bullish dollar view.
YenAfter a remarkable 56% decline and three consecutive years of losses, the yen’s descent may appear exhausted. After all, the market is well aware of how significantly Japan’s narrow basic balance has deteriorated (see Exhibit 90), as well as how aggressively the BOJ is expanding its balance sheet. But while these forces help explain the yen’s
current level, the next phase of depreciation will also be driven by a weakening in net portfolio capital flows.
Keep in mind that Japan’s GPIF is the world’s largest public pension, with $1.1 trillion in total assets, the bulk of which sits in domestic government bonds and other low-yielding, yen-denominated assets. In October of last year, GPIF indicated that it would begin rebalancing its portfolio in April 2015 with a goal of shifting a quarter of the portfolio out of domestic bonds and into foreign assets on an unhedged basis. In other words, we estimate these pensions will need to sell $100-$150 billion of yen to purchase these foreign assets, exerting significant downward pressure on the currency.
While GPIF has not provided a specific time line on how long this rebalancing will take, we believe it will unfold over 18–24 months. Consequently, the yen will likely remain under pressure during this time period. Of course, some investors are concerned that ongoing yen depreciation could spark another bout of currency wars. As we wrote in last year’s Outlook, we see such an outcome as unlikely, particularly in light of Federal Reserve Vice Chairman Stanley Fischer’s recent comment that “Japanese policy actions have been appropriate.”45 Indeed, while the depreciation
Exhibit 90: Japan’s Narrow Basic BalanceA deteriorating current account and capital outflows have weighed on the yen.
-4%
-3%
-2%
-1%
0%
1%
2%
3%
4%
5%
6%
04 05 06 07 08 09 10 11 12 13 14
Current AccountForeign Direct InvestmentNarrow Basic Balance
% of GDP
Data through Q3 2014. Note: Current account and foreign direct investment data are four-quarter averages. Source: Investment Strategy Group, Haver.

Goldman Sachs january 2015 64
has been rapid, the yen is trading only around the average of its 30-year trading range (see Exhibit 91).
Therefore, we continue to recommend clients be short the yen relative to the dollar.
Emerging Market CurrenciesEmerging market currencies were not immune to dollar strength in 2014, depreciating about 13% against the dollar. Of course, this aggregate return belies significant dispersion, as the strongest emerging market currency was basically flat while the weakest—the Russian ruble—was down a staggering 46% against the dollar.
Despite their collective underperformance, we remain cautious on emerging market currencies. As last year reminded us, continued dollar strength represents a stiff headwind to the group. Moreover, rising US interest rates will weigh on countries with large external financing needs (e.g., Turkey and South Africa), as evidenced during 2013’s “taper tantrum.” We are also wary about the tendency of independent central banks in countries like Chile and Mexico to use currency depreciation as a shock absorber against external jolts. Finally, the Russian ruble, which is 4.3% of the emerging market local debt currency index, should remain under pressure in the face of lower oil prices and ongoing Western sanctions.46
At the same time, we do not find a tactical short appealing. Valuations have become much more attractive, with the group now 12% undervalued and about three standard deviations cheaper than at any point in the last five years (see Exhibit 92). In fact, many emerging market currencies now trade beneath their global financial crisis lows. Moreover, their relative yield differential to the US dollar has increased to 5.6%, about 1.8 percentage points higher than levels seen before the taper tantrum. At these levels, yield-hungry investors are apt to take a look.
In light of these opposing drivers, we do not find a tactical view on the overall asset class attractive. Instead, we recommend a more granular focus on country-specific opportunities, such as our continued overweight to the Indian rupee. Not only does the currency benefit from ongoing capital inflows on the back of the new Narendra Modi government’s structural and fiscal reforms, but it also has an enticing 6.3% yield. In addition, India’s current account deficit continues to improve, reflecting lower oil and gold imports.
Against this, we recommend an underweight to the Australian dollar, which should struggle in the face of a stronger US dollar, a sizable drop in the price of its commodity exports (especially iron ore to China) and expected rate cuts by its central bank.
Exhibit 91: Yen vs. US DollarDespite its rapid weakening, the yen is trading near its 30-year average.
50
75
100
125
150
175
200
225
250
275
84 86 88 90 92 94 96 98 00 02 04 06 08 10 12 14
USDJPY
Average
USDJPY Spot Rate
JPY Depreciation
Data as of December 31, 2014 Source: Investment Strategy Group, Bloomberg.
Exhibit 92: Emerging Market FX ValuationIn spite of cheap valuations, emerging market currencies face headwinds in 2015.
-20%
-15%
-10%
-5%
0%
5%
10%
08 09 10 11 12 13 14
Deviation from Fair Value
EM CurrenciesUndervalued
Data as of December 31, 2014. Note: Average of 5-year moving average, GSDEER and FEER misalignments. Source: Investment Strategy Group, Bloomberg, Goldman Sachs Global Investment Research, Peterson Institute for International Economics.
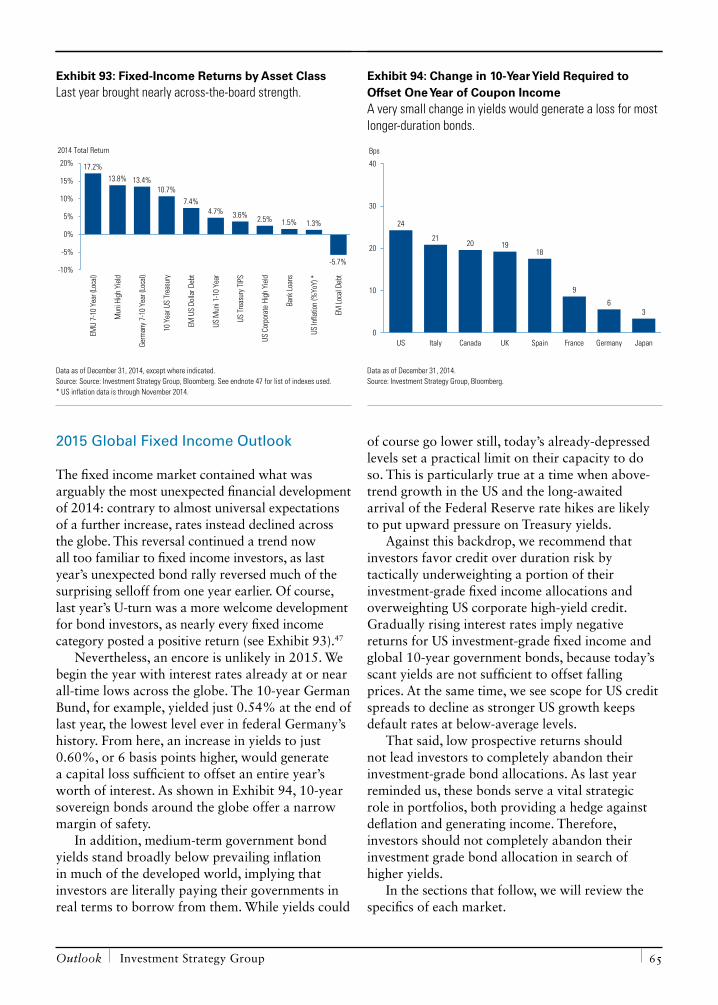
Outlook Investment Strategy Group 65
2015 Global Fixed Income Outlook
The fixed income market contained what was arguably the most unexpected financial development of 2014: contrary to almost universal expectations of a further increase, rates instead declined across the globe. This reversal continued a trend now all too familiar to fixed income investors, as last year’s unexpected bond rally reversed much of the surprising selloff from one year earlier. Of course, last year’s U-turn was a more welcome development for bond investors, as nearly every fixed income category posted a positive return (see Exhibit 93).47
Nevertheless, an encore is unlikely in 2015. We begin the year with interest rates already at or near all-time lows across the globe. The 10-year German Bund, for example, yielded just 0.54% at the end of last year, the lowest level ever in federal Germany’s history. From here, an increase in yields to just 0.60%, or 6 basis points higher, would generate a capital loss sufficient to offset an entire year’s worth of interest. As shown in Exhibit 94, 10-year sovereign bonds around the globe offer a narrow margin of safety.
In addition, medium-term government bond yields stand broadly below prevailing inflation in much of the developed world, implying that investors are literally paying their governments in real terms to borrow from them. While yields could
of course go lower still, today’s already-depressed levels set a practical limit on their capacity to do so. This is particularly true at a time when above-trend growth in the US and the long-awaited arrival of the Federal Reserve rate hikes are likely to put upward pressure on Treasury yields.
Against this backdrop, we recommend that investors favor credit over duration risk by tactically underweighting a portion of their investment-grade fixed income allocations and overweighting US corporate high-yield credit. Gradually rising interest rates imply negative returns for US investment-grade fixed income and global 10-year government bonds, because today’s scant yields are not sufficient to offset falling prices. At the same time, we see scope for US credit spreads to decline as stronger US growth keeps default rates at below-average levels.
That said, low prospective returns should not lead investors to completely abandon their investment-grade bond allocations. As last year reminded us, these bonds serve a vital strategic role in portfolios, both providing a hedge against deflation and generating income. Therefore, investors should not completely abandon their investment grade bond allocation in search of higher yields.
In the sections that follow, we will review the specifics of each market.
Exhibit 93: Fixed-Income Returns by Asset ClassLast year brought nearly across-the-board strength.
17.2%13.8% 13.4%
10.7%7.4%
4.7% 3.6% 2.5% 1.5% 1.3%
-5.7%-10%
-5%
0%
5%
10%
15%
20%
EMU
7-10
Yea
r (Lo
cal)
Mun
i Hig
h Yi
eld
Germ
any
7-10
Yea
r (Lo
cal)
10 Y
ear U
S Tr
easu
ry
EM U
S Do
llar D
ebt
US M
uni 1
-10
Year
US T
reas
ury
TIPS
US C
orpo
rate
Hig
h Yi
eld
Bank
Loan
s
US In
flatio
n (%
YoY)
*
EM Lo
cal D
ebt
2014 Total Return
Data as of December 31, 2014, except where indicated. Source: Source: Investment Strategy Group, Bloomberg. See endnote 47 for list of indexes used. * US inflation data is through November 2014.
Exhibit 94: Change in 10-Year Yield Required to Offset One Year of Coupon IncomeA very small change in yields would generate a loss for most longer-duration bonds.
24
2120 19
18
9
63
0
10
20
30
40
US Italy Canada UK Spain France Germany Japan
Bps
Data as of December 31, 2014. Source: Investment Strategy Group, Bloomberg.
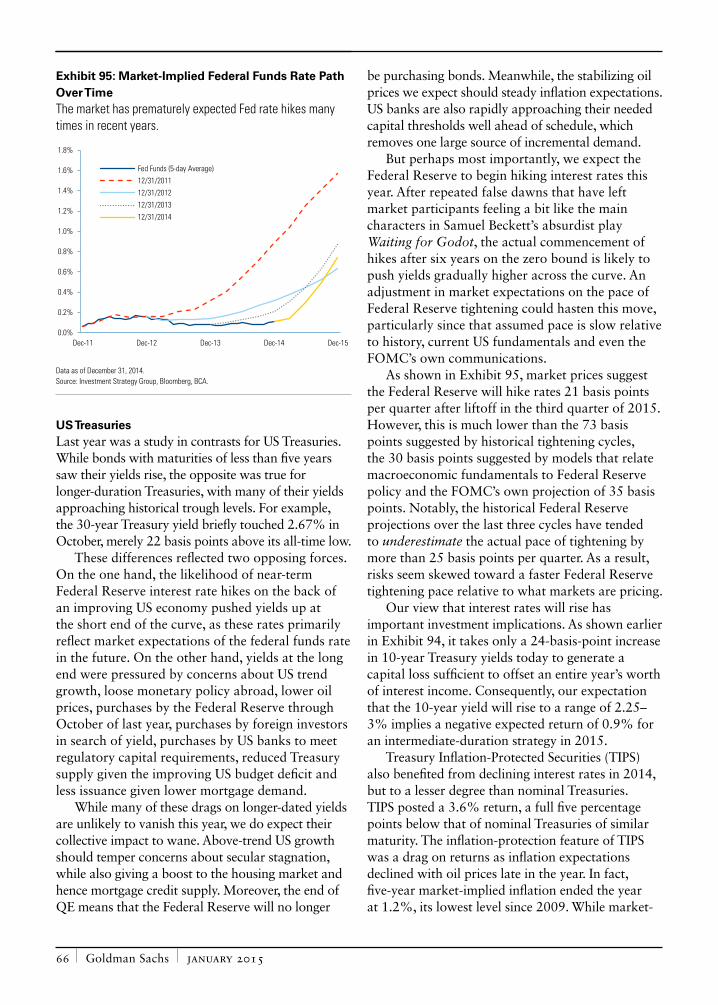
Goldman Sachs january 2015 66
US TreasuriesLast year was a study in contrasts for US Treasuries. While bonds with maturities of less than five years saw their yields rise, the opposite was true for longer-duration Treasuries, with many of their yields approaching historical trough levels. For example, the 30-year Treasury yield briefly touched 2.67% in October, merely 22 basis points above its all-time low.
These differences reflected two opposing forces. On the one hand, the likelihood of near-term Federal Reserve interest rate hikes on the back of an improving US economy pushed yields up at the short end of the curve, as these rates primarily reflect market expectations of the federal funds rate in the future. On the other hand, yields at the long end were pressured by concerns about US trend growth, loose monetary policy abroad, lower oil prices, purchases by the Federal Reserve through October of last year, purchases by foreign investors in search of yield, purchases by US banks to meet regulatory capital requirements, reduced Treasury supply given the improving US budget deficit and less issuance given lower mortgage demand.
While many of these drags on longer-dated yields are unlikely to vanish this year, we do expect their collective impact to wane. Above-trend US growth should temper concerns about secular stagnation, while also giving a boost to the housing market and hence mortgage credit supply. Moreover, the end of QE means that the Federal Reserve will no longer
be purchasing bonds. Meanwhile, the stabilizing oil prices we expect should steady inflation expectations. US banks are also rapidly approaching their needed capital thresholds well ahead of schedule, which removes one large source of incremental demand.
But perhaps most importantly, we expect the Federal Reserve to begin hiking interest rates this year. After repeated false dawns that have left market participants feeling a bit like the main characters in Samuel Beckett’s absurdist play Waiting for Godot, the actual commencement of hikes after six years on the zero bound is likely to push yields gradually higher across the curve. An adjustment in market expectations on the pace of Federal Reserve tightening could hasten this move, particularly since that assumed pace is slow relative to history, current US fundamentals and even the FOMC’s own communications.
As shown in Exhibit 95, market prices suggest the Federal Reserve will hike rates 21 basis points per quarter after liftoff in the third quarter of 2015. However, this is much lower than the 73 basis points suggested by historical tightening cycles, the 30 basis points suggested by models that relate macroeconomic fundamentals to Federal Reserve policy and the FOMC’s own projection of 35 basis points. Notably, the historical Federal Reserve projections over the last three cycles have tended to underestimate the actual pace of tightening by more than 25 basis points per quarter. As a result, risks seem skewed toward a faster Federal Reserve tightening pace relative to what markets are pricing.
Our view that interest rates will rise has important investment implications. As shown earlier in Exhibit 94, it takes only a 24-basis-point increase in 10-year Treasury yields today to generate a capital loss sufficient to offset an entire year’s worth of interest income. Consequently, our expectation that the 10-year yield will rise to a range of 2.25–3% implies a negative expected return of 0.9% for an intermediate-duration strategy in 2015.
Treasury Inflation-Protected Securities (TIPS) also benefited from declining interest rates in 2014, but to a lesser degree than nominal Treasuries. TIPS posted a 3.6% return, a full five percentage points below that of nominal Treasuries of similar maturity. The inflation-protection feature of TIPS was a drag on returns as inflation expectations declined with oil prices late in the year. In fact, five-year market-implied inflation ended the year at 1.2%, its lowest level since 2009. While market-
Exhibit 95: Market-Implied Federal Funds Rate Path Over TimeThe market has prematurely expected Fed rate hikes many times in recent years.
0.0%
0.2%
0.4%
0.6%
0.8%
1.0%
1.2%
1.4%
1.6%
1.8%
Dec-11 Dec-12 Dec-13 Dec-14 Dec-15
Fed Funds (5-day Average)
12/31/2011
12/31/2012
12/31/2013
12/31/2014
Data as of December 31, 2014. Source: Investment Strategy Group, Bloomberg, BCA.
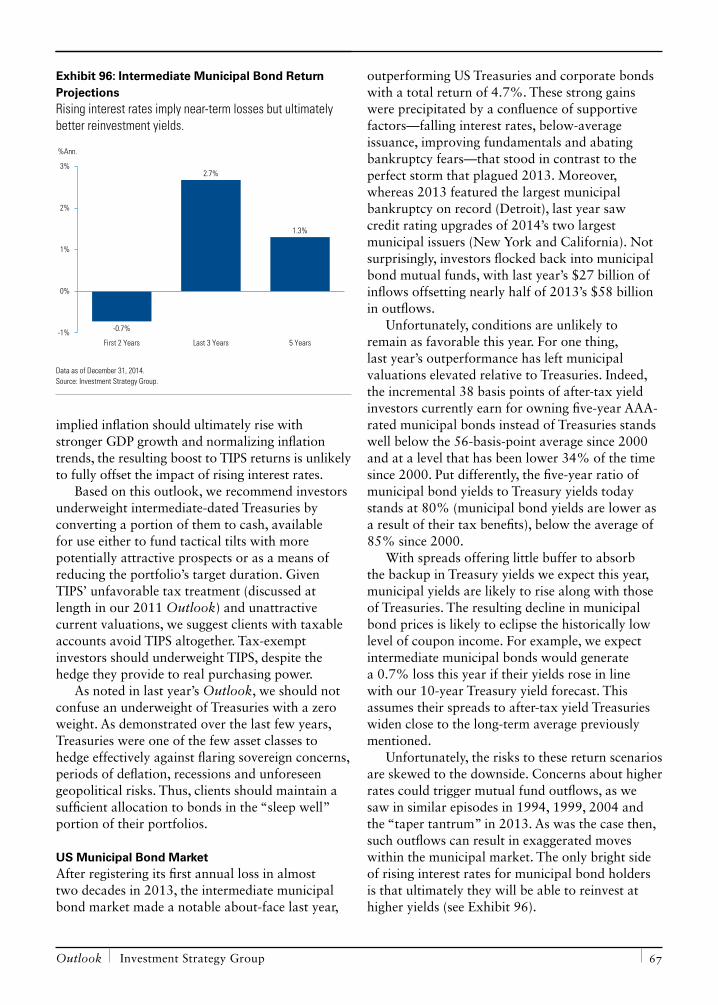
Outlook Investment Strategy Group 67
implied inflation should ultimately rise with stronger GDP growth and normalizing inflation trends, the resulting boost to TIPS returns is unlikely to fully offset the impact of rising interest rates.
Based on this outlook, we recommend investors underweight intermediate-dated Treasuries by converting a portion of them to cash, available for use either to fund tactical tilts with more potentially attractive prospects or as a means of reducing the portfolio’s target duration. Given TIPS’ unfavorable tax treatment (discussed at length in our 2011 Outlook) and unattractive current valuations, we suggest clients with taxable accounts avoid TIPS altogether. Tax-exempt investors should underweight TIPS, despite the hedge they provide to real purchasing power.
As noted in last year’s Outlook, we should not confuse an underweight of Treasuries with a zero weight. As demonstrated over the last few years, Treasuries were one of the few asset classes to hedge effectively against flaring sovereign concerns, periods of deflation, recessions and unforeseen geopolitical risks. Thus, clients should maintain a sufficient allocation to bonds in the “sleep well” portion of their portfolios.
US Municipal Bond MarketAfter registering its first annual loss in almost two decades in 2013, the intermediate municipal bond market made a notable about-face last year,
outperforming US Treasuries and corporate bonds with a total return of 4.7%. These strong gains were precipitated by a confluence of supportive factors—falling interest rates, below-average issuance, improving fundamentals and abating bankruptcy fears—that stood in contrast to the perfect storm that plagued 2013. Moreover, whereas 2013 featured the largest municipal bankruptcy on record (Detroit), last year saw credit rating upgrades of 2014’s two largest municipal issuers (New York and California). Not surprisingly, investors flocked back into municipal bond mutual funds, with last year’s $27 billion of inflows offsetting nearly half of 2013’s $58 billion in outflows.
Unfortunately, conditions are unlikely to remain as favorable this year. For one thing, last year’s outperformance has left municipal valuations elevated relative to Treasuries. Indeed, the incremental 38 basis points of after-tax yield investors currently earn for owning five-year AAA-rated municipal bonds instead of Treasuries stands well below the 56-basis-point average since 2000 and at a level that has been lower 34% of the time since 2000. Put differently, the five-year ratio of municipal bond yields to Treasury yields today stands at 80% (municipal bond yields are lower as a result of their tax benefits), below the average of 85% since 2000.
With spreads offering little buffer to absorb the backup in Treasury yields we expect this year, municipal yields are likely to rise along with those of Treasuries. The resulting decline in municipal bond prices is likely to eclipse the historically low level of coupon income. For example, we expect intermediate municipal bonds would generate a 0.7% loss this year if their yields rose in line with our 10-year Treasury yield forecast. This assumes their spreads to after-tax yield Treasuries widen close to the long-term average previously mentioned.
Unfortunately, the risks to these return scenarios are skewed to the downside. Concerns about higher rates could trigger mutual fund outflows, as we saw in similar episodes in 1994, 1999, 2004 and the “taper tantrum” in 2013. As was the case then, such outflows can result in exaggerated moves within the municipal market. The only bright side of rising interest rates for municipal bond holders is that ultimately they will be able to reinvest at higher yields (see Exhibit 96).
Exhibit 96: Intermediate Municipal Bond Return ProjectionsRising interest rates imply near-term losses but ultimately better reinvestment yields.
-0.7%
2.7%
1.3%
-1%
0%
1%
2%
3%
First 2 Years Last 3 Years 5 Years
%Ann.
Data as of December 31, 2014. Source: Investment Strategy Group.
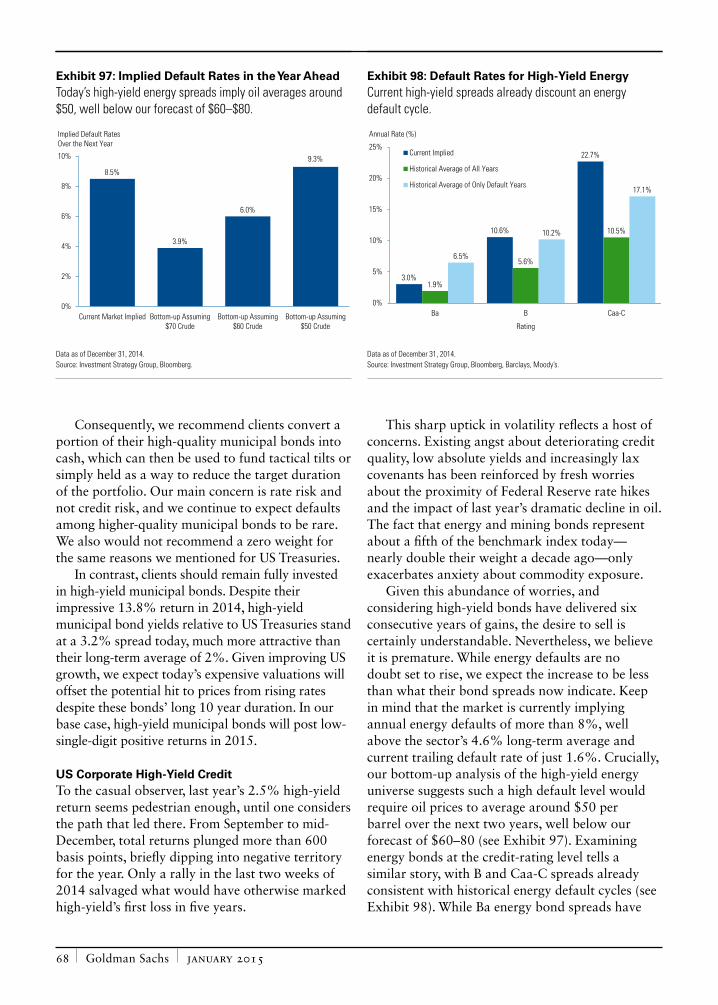
Goldman Sachs january 2015 68
Consequently, we recommend clients convert a portion of their high-quality municipal bonds into cash, which can then be used to fund tactical tilts or simply held as a way to reduce the target duration of the portfolio. Our main concern is rate risk and not credit risk, and we continue to expect defaults among higher-quality municipal bonds to be rare. We also would not recommend a zero weight for the same reasons we mentioned for US Treasuries.
In contrast, clients should remain fully invested in high-yield municipal bonds. Despite their impressive 13.8% return in 2014, high-yield municipal bond yields relative to US Treasuries stand at a 3.2% spread today, much more attractive than their long-term average of 2%. Given improving US growth, we expect today’s expensive valuations will offset the potential hit to prices from rising rates despite these bonds’ long 10 year duration. In our base case, high-yield municipal bonds will post low-single-digit positive returns in 2015.
US Corporate High-Yield CreditTo the casual observer, last year’s 2.5% high-yield return seems pedestrian enough, until one considers the path that led there. From September to mid-December, total returns plunged more than 600 basis points, briefly dipping into negative territory for the year. Only a rally in the last two weeks of 2014 salvaged what would have otherwise marked high-yield’s first loss in five years.
This sharp uptick in volatility reflects a host of concerns. Existing angst about deteriorating credit quality, low absolute yields and increasingly lax covenants has been reinforced by fresh worries about the proximity of Federal Reserve rate hikes and the impact of last year’s dramatic decline in oil. The fact that energy and mining bonds represent about a fifth of the benchmark index today—nearly double their weight a decade ago—only exacerbates anxiety about commodity exposure.
Given this abundance of worries, and considering high-yield bonds have delivered six consecutive years of gains, the desire to sell is certainly understandable. Nevertheless, we believe it is premature. While energy defaults are no doubt set to rise, we expect the increase to be less than what their bond spreads now indicate. Keep in mind that the market is currently implying annual energy defaults of more than 8%, well above the sector’s 4.6% long-term average and current trailing default rate of just 1.6%. Crucially, our bottom-up analysis of the high-yield energy universe suggests such a high default level would require oil prices to average around $50 per barrel over the next two years, well below our forecast of $60–80 (see Exhibit 97). Examining energy bonds at the credit-rating level tells a similar story, with B and Caa-C spreads already consistent with historical energy default cycles (see Exhibit 98). While Ba energy bond spreads have
Exhibit 97: Implied Default Rates in the Year AheadToday’s high-yield energy spreads imply oil averages around $50, well below our forecast of $60–$80.
8.5%
3.9%
6.0%
9.3%
0%
2%
4%
6%
8%
10%
Current Market Implied Bottom-up Assuming$70 Crude
Bottom-up Assuming$60 Crude
Bottom-up Assuming$50 Crude
Implied Default Rates Over the Next Year
Data as of December 31, 2014. Source: Investment Strategy Group, Bloomberg.
Exhibit 98: Default Rates for High-Yield EnergyCurrent high-yield spreads already discount an energy default cycle.
3.0%
10.6%
22.7%
1.9%
5.6%
10.5%
6.5%
10.2%
17.1%
0%
5%
10%
15%
20%
25%
Ba B Caa-C
Rating
Current Implied
Historical Average of All Years
Historical Average of Only Default Years
Annual Rate (%)
Data as of December 31, 2014. Source: Investment Strategy Group, Bloomberg, Barclays, Moody’s.
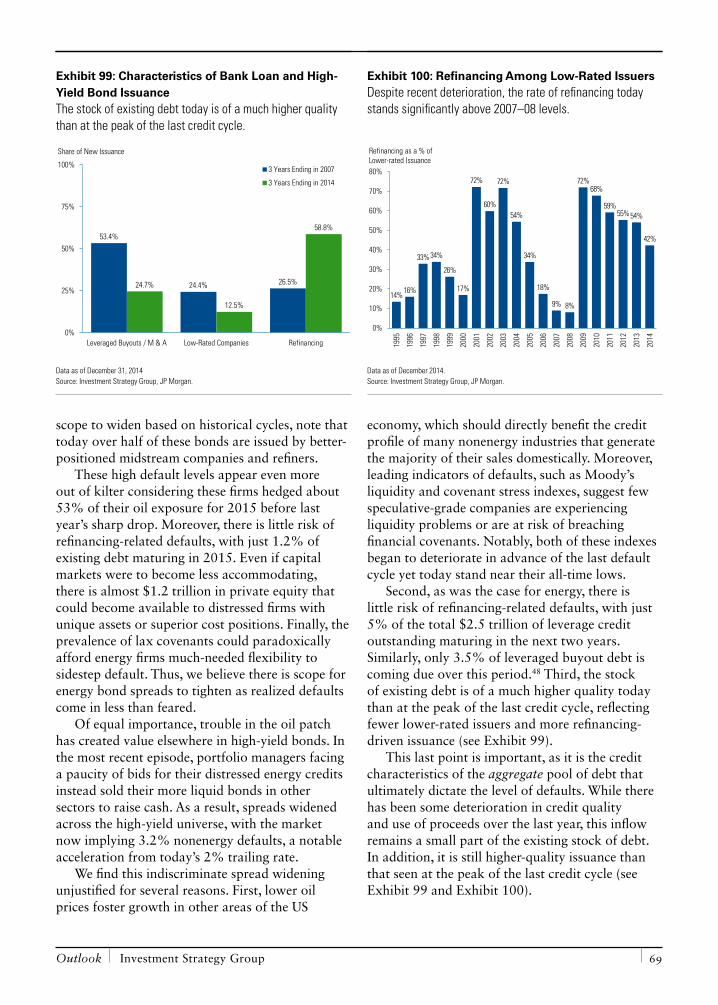
Outlook Investment Strategy Group 69
scope to widen based on historical cycles, note that today over half of these bonds are issued by better-positioned midstream companies and refiners.
These high default levels appear even more out of kilter considering these firms hedged about 53% of their oil exposure for 2015 before last year’s sharp drop. Moreover, there is little risk of refinancing-related defaults, with just 1.2% of existing debt maturing in 2015. Even if capital markets were to become less accommodating, there is almost $1.2 trillion in private equity that could become available to distressed firms with unique assets or superior cost positions. Finally, the prevalence of lax covenants could paradoxically afford energy firms much-needed flexibility to sidestep default. Thus, we believe there is scope for energy bond spreads to tighten as realized defaults come in less than feared.
Of equal importance, trouble in the oil patch has created value elsewhere in high-yield bonds. In the most recent episode, portfolio managers facing a paucity of bids for their distressed energy credits instead sold their more liquid bonds in other sectors to raise cash. As a result, spreads widened across the high-yield universe, with the market now implying 3.2% nonenergy defaults, a notable acceleration from today’s 2% trailing rate.
We find this indiscriminate spread widening unjustified for several reasons. First, lower oil prices foster growth in other areas of the US
economy, which should directly benefit the credit profile of many nonenergy industries that generate the majority of their sales domestically. Moreover, leading indicators of defaults, such as Moody’s liquidity and covenant stress indexes, suggest few speculative-grade companies are experiencing liquidity problems or are at risk of breaching financial covenants. Notably, both of these indexes began to deteriorate in advance of the last default cycle yet today stand near their all-time lows.
Second, as was the case for energy, there is little risk of refinancing-related defaults, with just 5% of the total $2.5 trillion of leverage credit outstanding maturing in the next two years. Similarly, only 3.5% of leveraged buyout debt is coming due over this period.48 Third, the stock of existing debt is of a much higher quality today than at the peak of the last credit cycle, reflecting fewer lower-rated issuers and more refinancing-driven issuance (see Exhibit 99).
This last point is important, as it is the credit characteristics of the aggregate pool of debt that ultimately dictate the level of defaults. While there has been some deterioration in credit quality and use of proceeds over the last year, this inflow remains a small part of the existing stock of debt. In addition, it is still higher-quality issuance than that seen at the peak of the last credit cycle (see Exhibit 99 and Exhibit 100).
Exhibit 99: Characteristics of Bank Loan and High-Yield Bond IssuanceThe stock of existing debt today is of a much higher quality than at the peak of the last credit cycle.
53.4%
24.4% 26.5%24.7%
12.5%
58.8%
0%
25%
50%
75%
100%
Leveraged Buyouts / M & A Low-Rated Companies Refinancing
3 Years Ending in 2007
3 Years Ending in 2014
Share of New Issuance
Data as of December 31, 2014 Source: Investment Strategy Group, JP Morgan.
Exhibit 100: Refinancing Among Low-Rated IssuersDespite recent deterioration, the rate of refinancing today stands significantly above 2007–08 levels.
14%16%
33%34%
26%
17%
72%
60%
72%
54%
34%
18%
9% 8%
72%68%
59%55%54%
42%
0%
10%
20%
30%
40%
50%
60%
70%
80%
1995
1996
1997
1998
1999
2000
2001
2002
2003
2004
2005
2006
2007
2008
2009
2010
2011
2012
2013
2014
Refinancing as a % of Lower-rated Issuance
Data as of December 2014. Source: Investment Strategy Group, JP Morgan.
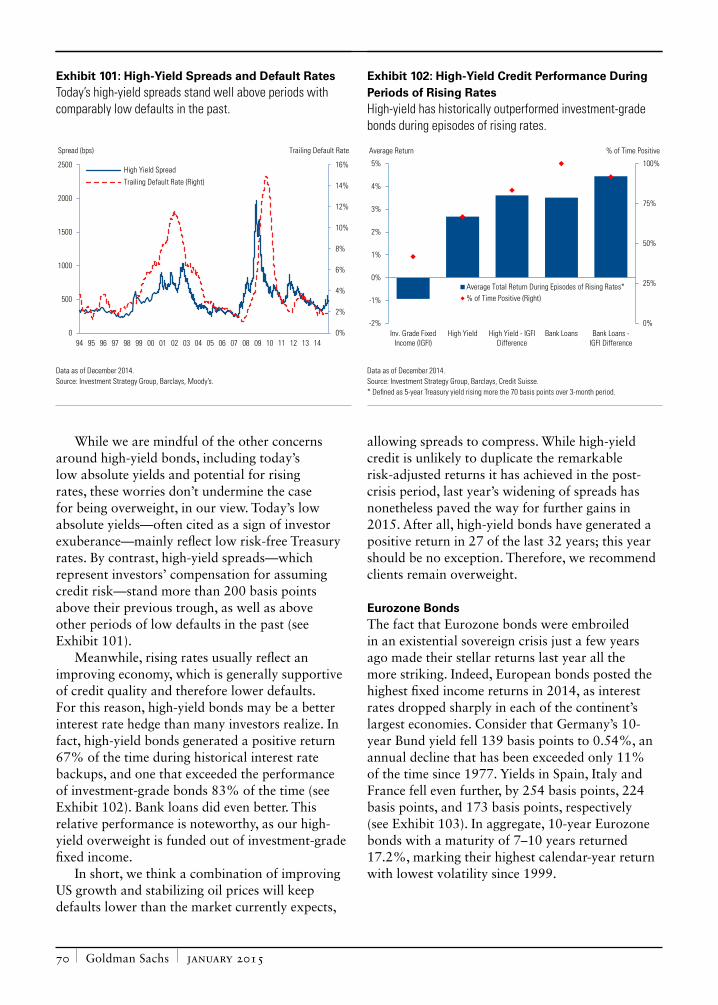
Goldman Sachs january 2015 70
While we are mindful of the other concerns around high-yield bonds, including today’s low absolute yields and potential for rising rates, these worries don’t undermine the case for being overweight, in our view. Today’s low absolute yields—often cited as a sign of investor exuberance—mainly reflect low risk-free Treasury rates. By contrast, high-yield spreads—which represent investors’ compensation for assuming credit risk—stand more than 200 basis points above their previous trough, as well as above other periods of low defaults in the past (see Exhibit 101).
Meanwhile, rising rates usually reflect an improving economy, which is generally supportive of credit quality and therefore lower defaults. For this reason, high-yield bonds may be a better interest rate hedge than many investors realize. In fact, high-yield bonds generated a positive return 67% of the time during historical interest rate backups, and one that exceeded the performance of investment-grade bonds 83% of the time (see Exhibit 102). Bank loans did even better. This relative performance is noteworthy, as our high-yield overweight is funded out of investment-grade fixed income.
In short, we think a combination of improving US growth and stabilizing oil prices will keep defaults lower than the market currently expects,
allowing spreads to compress. While high-yield credit is unlikely to duplicate the remarkable risk-adjusted returns it has achieved in the post-crisis period, last year’s widening of spreads has nonetheless paved the way for further gains in 2015. After all, high-yield bonds have generated a positive return in 27 of the last 32 years; this year should be no exception. Therefore, we recommend clients remain overweight.
Eurozone BondsThe fact that Eurozone bonds were embroiled in an existential sovereign crisis just a few years ago made their stellar returns last year all the more striking. Indeed, European bonds posted the highest fixed income returns in 2014, as interest rates dropped sharply in each of the continent’s largest economies. Consider that Germany’s 10-year Bund yield fell 139 basis points to 0.54%, an annual decline that has been exceeded only 11% of the time since 1977. Yields in Spain, Italy and France fell even further, by 254 basis points, 224 basis points, and 173 basis points, respectively (see Exhibit 103). In aggregate, 10-year Eurozone bonds with a maturity of 7–10 years returned 17.2%, marking their highest calendar-year return with lowest volatility since 1999.
Exhibit 101: High-Yield Spreads and Default RatesToday’s high-yield spreads stand well above periods with comparably low defaults in the past.
0%
2%
4%
6%
8%
10%
12%
14%
16%
0
500
1000
1500
2000
2500
94 95 96 97 98 99 00 01 02 03 04 05 06 07 08 09 10 11 12 13 14
High Yield Spread
Trailing Default Rate (Right)
Spread (bps) Trailing Default Rate
Data as of December 2014. Source: Investment Strategy Group, Barclays, Moody’s.
Exhibit 102: High-Yield Credit Performance During Periods of Rising RatesHigh-yield has historically outperformed investment-grade bonds during episodes of rising rates.
0%
25%
50%
75%
100%
-2%
-1%
0%
1%
2%
3%
4%
5%
Inv. Grade FixedIncome (IGFI)
High Yield High Yield - IGFIDifference
Bank Loans Bank Loans -IGFI Difference
Average Total Return During Episodes of Rising Rates*% of Time Positive (Right)
Average Return % of Time Positive
Data as of December 2014. Source: Investment Strategy Group, Barclays, Credit Suisse. * Defined as 5-year Treasury yield rising more the 70 basis points over 3-month period.
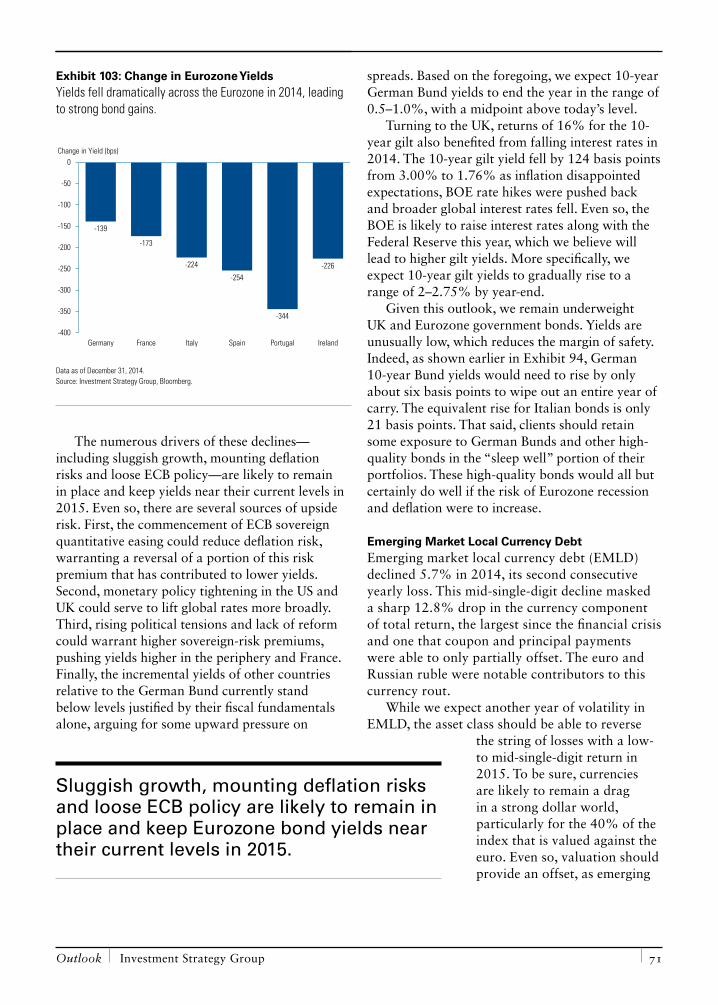
Outlook Investment Strategy Group 71
The numerous drivers of these declines—including sluggish growth, mounting deflation risks and loose ECB policy—are likely to remain in place and keep yields near their current levels in 2015. Even so, there are several sources of upside risk. First, the commencement of ECB sovereign quantitative easing could reduce deflation risk, warranting a reversal of a portion of this risk premium that has contributed to lower yields. Second, monetary policy tightening in the US and UK could serve to lift global rates more broadly. Third, rising political tensions and lack of reform could warrant higher sovereign-risk premiums, pushing yields higher in the periphery and France. Finally, the incremental yields of other countries relative to the German Bund currently stand below levels justified by their fiscal fundamentals alone, arguing for some upward pressure on
spreads. Based on the foregoing, we expect 10-year German Bund yields to end the year in the range of 0.5–1.0%, with a midpoint above today’s level.
Turning to the UK, returns of 16% for the 10-year gilt also benefited from falling interest rates in 2014. The 10-year gilt yield fell by 124 basis points from 3.00% to 1.76% as inflation disappointed expectations, BOE rate hikes were pushed back and broader global interest rates fell. Even so, the BOE is likely to raise interest rates along with the Federal Reserve this year, which we believe will lead to higher gilt yields. More specifically, we expect 10-year gilt yields to gradually rise to a range of 2–2.75% by year-end.
Given this outlook, we remain underweight UK and Eurozone government bonds. Yields are unusually low, which reduces the margin of safety. Indeed, as shown earlier in Exhibit 94, German 10-year Bund yields would need to rise by only about six basis points to wipe out an entire year of carry. The equivalent rise for Italian bonds is only 21 basis points. That said, clients should retain some exposure to German Bunds and other high-quality bonds in the “sleep well” portion of their portfolios. These high-quality bonds would all but certainly do well if the risk of Eurozone recession and deflation were to increase.
Emerging Market Local Currency DebtEmerging market local currency debt (EMLD) declined 5.7% in 2014, its second consecutive yearly loss. This mid-single-digit decline masked a sharp 12.8% drop in the currency component of total return, the largest since the financial crisis and one that coupon and principal payments were able to only partially offset. The euro and Russian ruble were notable contributors to this currency rout.
While we expect another year of volatility in EMLD, the asset class should be able to reverse
the string of losses with a low- to mid-single-digit return in 2015. To be sure, currencies are likely to remain a drag in a strong dollar world, particularly for the 40% of the index that is valued against the euro. Even so, valuation should provide an offset, as emerging
Sluggish growth, mounting deflation risks and loose ECB policy are likely to remain in place and keep Eurozone bond yields near their current levels in 2015.
Exhibit 103: Change in Eurozone YieldsYields fell dramatically across the Eurozone in 2014, leading to strong bond gains.
-139
-173
-224
-254
-344
-226
-400
-350
-300
-250
-200
-150
-100
-50
0
Germany France Italy Spain Portugal Ireland
Change in Yield (bps)
Data as of December 31, 2014. Source: Investment Strategy Group, Bloomberg.
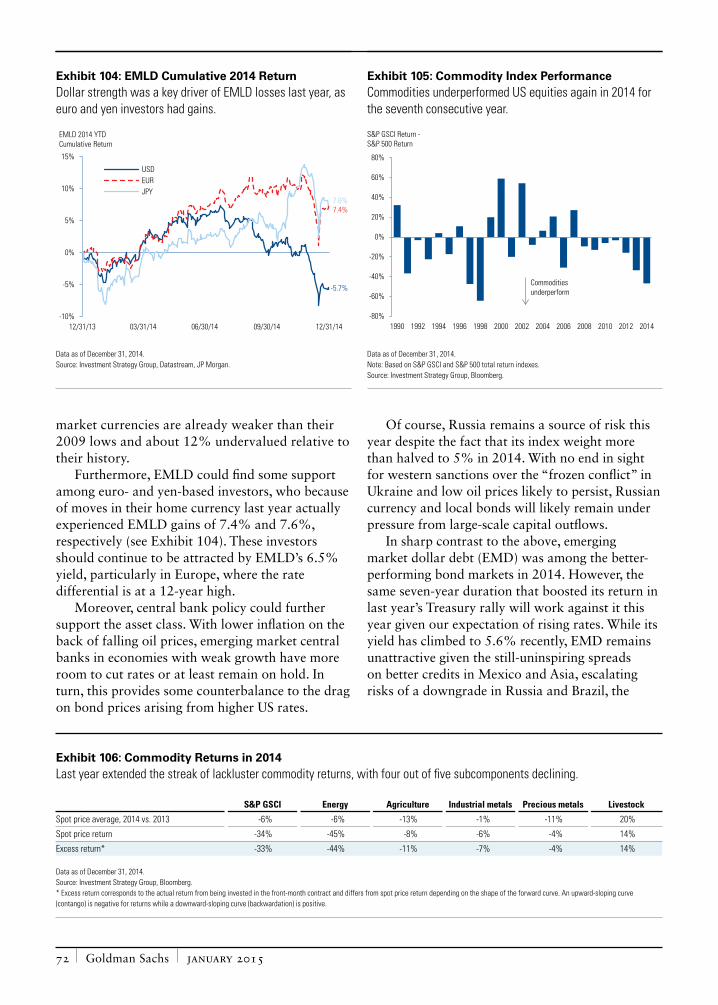
Goldman Sachs january 2015 72
market currencies are already weaker than their 2009 lows and about 12% undervalued relative to their history.
Furthermore, EMLD could find some support among euro- and yen-based investors, who because of moves in their home currency last year actually experienced EMLD gains of 7.4% and 7.6%, respectively (see Exhibit 104). These investors should continue to be attracted by EMLD’s 6.5% yield, particularly in Europe, where the rate differential is at a 12-year high.
Moreover, central bank policy could further support the asset class. With lower inflation on the back of falling oil prices, emerging market central banks in economies with weak growth have more room to cut rates or at least remain on hold. In turn, this provides some counterbalance to the drag on bond prices arising from higher US rates.
Of course, Russia remains a source of risk this year despite the fact that its index weight more than halved to 5% in 2014. With no end in sight for western sanctions over the “frozen conflict” in Ukraine and low oil prices likely to persist, Russian currency and local bonds will likely remain under pressure from large-scale capital outflows.
In sharp contrast to the above, emerging market dollar debt (EMD) was among the better-performing bond markets in 2014. However, the same seven-year duration that boosted its return in last year’s Treasury rally will work against it this year given our expectation of rising rates. While its yield has climbed to 5.6% recently, EMD remains unattractive given the still-uninspiring spreads on better credits in Mexico and Asia, escalating risks of a downgrade in Russia and Brazil, the
Exhibit 106: Commodity Returns in 2014Last year extended the streak of lackluster commodity returns, with four out of five subcomponents declining.
S&P GSCI Energy Agriculture Industrial metals Precious metals Livestock
Spot price average, 2014 vs. 2013 -6% -6% -13% -1% -11% 20%
Spot price return -34% -45% -8% -6% -4% 14%
Excess return* -33% -44% -11% -7% -4% 14%
Data as of December 31, 2014. Source: Investment Strategy Group, Bloomberg. * Excess return corresponds to the actual return from being invested in the front-month contract and differs from spot price return depending on the shape of the forward curve. An upward-sloping curve (contango) is negative for returns while a downward-sloping curve (backwardation) is positive.
Exhibit 104: EMLD Cumulative 2014 ReturnDollar strength was a key driver of EMLD losses last year, as euro and yen investors had gains.
-5.7%
7.4%7.6%
-10%
-5%
0%
5%
10%
15%
12/31/13 03/31/14 06/30/14 09/30/14 12/31/14
USDEURJPY
EMLD 2014 YTD Cumulative Return
Data as of December 31, 2014. Source: Investment Strategy Group, Datastream, JP Morgan.
Exhibit 105: Commodity Index PerformanceCommodities underperformed US equities again in 2014 for the seventh consecutive year.
-80%
-60%
-40%
-20%
0%
20%
40%
60%
80%
1990 1992 1994 1996 1998 2000 2002 2004 2006 2008 2010 2012 2014
S&P GSCI Return -S&P 500 Return
Commodities underperform
Data as of December 31, 2014. Note: Based on S&P GSCI and S&P 500 total return indexes. Source: Investment Strategy Group, Bloomberg.
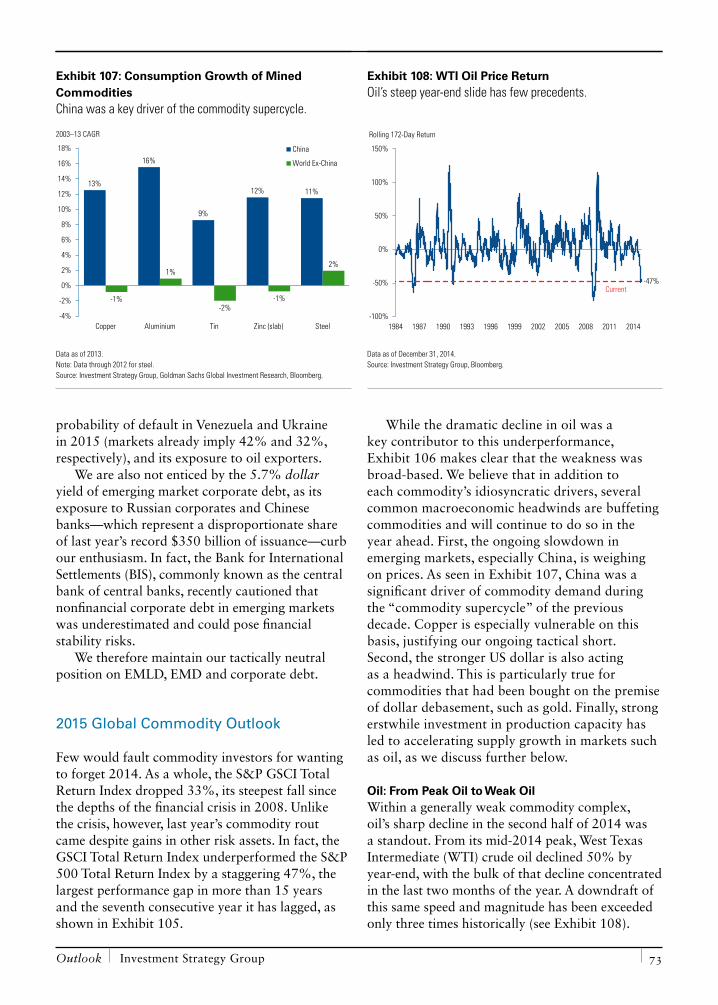
Outlook Investment Strategy Group 73
probability of default in Venezuela and Ukraine in 2015 (markets already imply 42% and 32%, respectively), and its exposure to oil exporters.
We are also not enticed by the 5.7% dollar yield of emerging market corporate debt, as its exposure to Russian corporates and Chinese banks—which represent a disproportionate share of last year’s record $350 billion of issuance—curb our enthusiasm. In fact, the Bank for International Settlements (BIS), commonly known as the central bank of central banks, recently cautioned that nonfinancial corporate debt in emerging markets was underestimated and could pose financial stability risks.
We therefore maintain our tactically neutral position on EMLD, EMD and corporate debt.
2015 Global Commodity Outlook
Few would fault commodity investors for wanting to forget 2014. As a whole, the S&P GSCI Total Return Index dropped 33%, its steepest fall since the depths of the financial crisis in 2008. Unlike the crisis, however, last year’s commodity rout came despite gains in other risk assets. In fact, the GSCI Total Return Index underperformed the S&P 500 Total Return Index by a staggering 47%, the largest performance gap in more than 15 years and the seventh consecutive year it has lagged, as shown in Exhibit 105.
While the dramatic decline in oil was a key contributor to this underperformance, Exhibit 106 makes clear that the weakness was broad-based. We believe that in addition to each commodity’s idiosyncratic drivers, several common macroeconomic headwinds are buffeting commodities and will continue to do so in the year ahead. First, the ongoing slowdown in emerging markets, especially China, is weighing on prices. As seen in Exhibit 107, China was a significant driver of commodity demand during the “commodity supercycle” of the previous decade. Copper is especially vulnerable on this basis, justifying our ongoing tactical short. Second, the stronger US dollar is also acting as a headwind. This is particularly true for commodities that had been bought on the premise of dollar debasement, such as gold. Finally, strong erstwhile investment in production capacity has led to accelerating supply growth in markets such as oil, as we discuss further below.
Oil: From Peak Oil to Weak Oil Within a generally weak commodity complex, oil’s sharp decline in the second half of 2014 was a standout. From its mid-2014 peak, West Texas Intermediate (WTI) crude oil declined 50% by year-end, with the bulk of that decline concentrated in the last two months of the year. A downdraft of this same speed and magnitude has been exceeded only three times historically (see Exhibit 108).
Exhibit 107: Consumption Growth of Mined CommoditiesChina was a key driver of the commodity supercycle.
13%
16%
9%
12% 11%
-1%
1%
-2%-1%
2%
-4%
-2%
0%
2%
4%
6%
8%
10%
12%
14%
16%
18%
Copper Aluminium Tin Zinc (slab) Steel
China
World Ex-China
2003–13 CAGR
Data as of 2013. Note: Data through 2012 for steel. Source: Investment Strategy Group, Goldman Sachs Global Investment Research, Bloomberg.
Exhibit 108: WTI Oil Price ReturnOil’s steep year-end slide has few precedents.
-100%
-50%
0%
50%
100%
150%
1984 1987 1990 1993 1996 1999 2002 2005 2008 2011 2014
Rolling 172-Day Return
-47%Current
Data as of December 31, 2014. Source: Investment Strategy Group, Bloomberg.
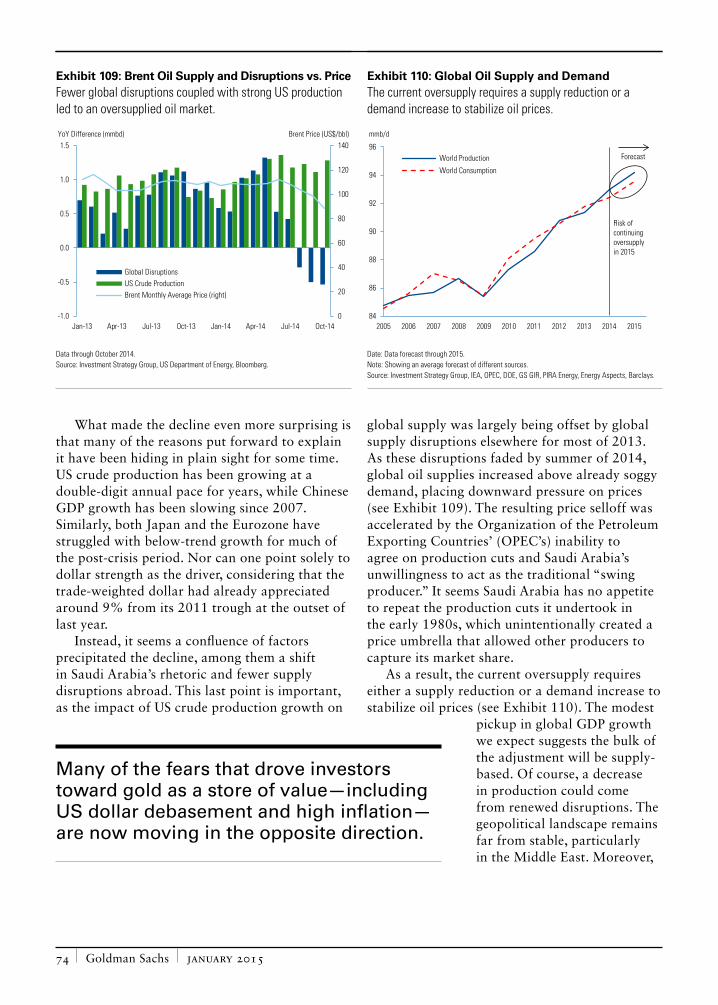
Goldman Sachs january 2015 74
What made the decline even more surprising is that many of the reasons put forward to explain it have been hiding in plain sight for some time. US crude production has been growing at a double-digit annual pace for years, while Chinese GDP growth has been slowing since 2007. Similarly, both Japan and the Eurozone have struggled with below-trend growth for much of the post-crisis period. Nor can one point solely to dollar strength as the driver, considering that the trade-weighted dollar had already appreciated around 9% from its 2011 trough at the outset of last year.
Instead, it seems a confluence of factors precipitated the decline, among them a shift in Saudi Arabia’s rhetoric and fewer supply disruptions abroad. This last point is important, as the impact of US crude production growth on
global supply was largely being offset by global supply disruptions elsewhere for most of 2013. As these disruptions faded by summer of 2014, global oil supplies increased above already soggy demand, placing downward pressure on prices (see Exhibit 109). The resulting price selloff was accelerated by the Organization of the Petroleum Exporting Countries’ (OPEC’s) inability to agree on production cuts and Saudi Arabia’s unwillingness to act as the traditional “swing producer.” It seems Saudi Arabia has no appetite to repeat the production cuts it undertook in the early 1980s, which unintentionally created a price umbrella that allowed other producers to capture its market share.
As a result, the current oversupply requires either a supply reduction or a demand increase to stabilize oil prices (see Exhibit 110). The modest
pickup in global GDP growth we expect suggests the bulk of the adjustment will be supply-based. Of course, a decrease in production could come from renewed disruptions. The geopolitical landscape remains far from stable, particularly in the Middle East. Moreover,
Many of the fears that drove investors toward gold as a store of value—including US dollar debasement and high inflation—are now moving in the opposite direction.
Exhibit 109: Brent Oil Supply and Disruptions vs. PriceFewer global disruptions coupled with strong US production led to an oversupplied oil market.
0
20
40
60
80
100
120
140
-1.0
-0.5
0.0
0.5
1.0
1.5
Jan-13 Apr-13 Jul-13 Oct-13 Jan-14 Apr-14 Jul-14 Oct-14
Global DisruptionsUS Crude ProductionBrent Monthly Average Price (right)
YoY Difference (mmbd) Brent Price (US$/bbl)
Data through October 2014. Source: Investment Strategy Group, US Department of Energy, Bloomberg.
Exhibit 110: Global Oil Supply and DemandThe current oversupply requires a supply reduction or a demand increase to stabilize oil prices.
84
86
88
90
92
94
96
2005 2006 2007 2008 2009 2010 2011 2012 2013 2014 2015
World Production
World Consumption
mmb/d
Risk of continuingoversupply in 2015
Forecast
Date: Data forecast through 2015. Note: Showing an average forecast of different sources. Source: Investment Strategy Group, IEA, OPEC, DOE, GS GIR, PIRA Energy, Energy Aspects, Barclays.
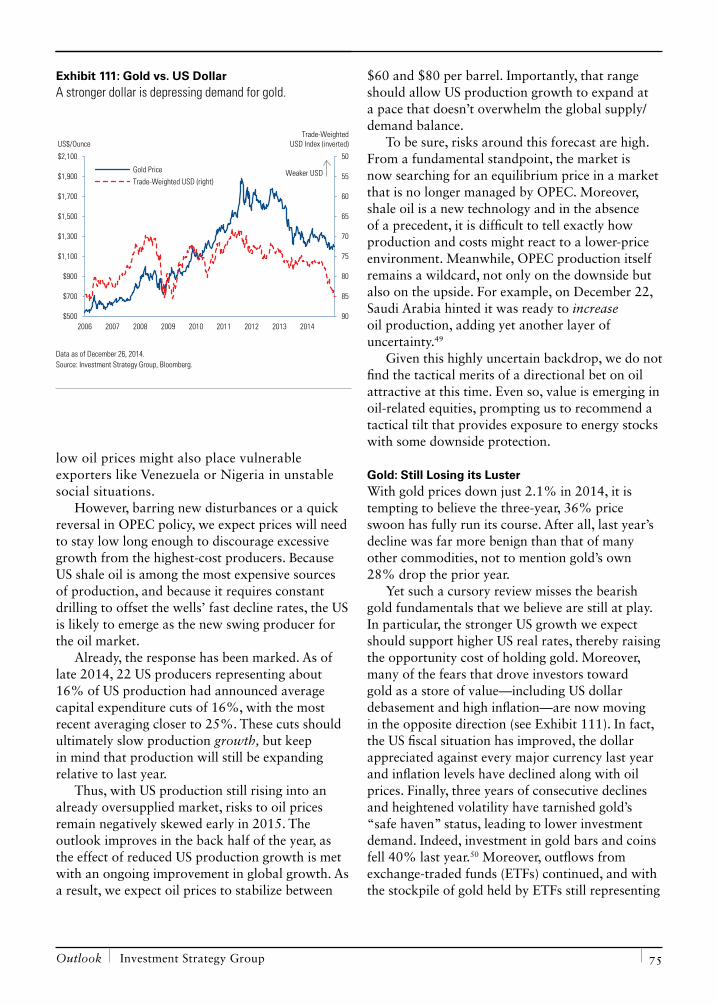
Outlook Investment Strategy Group 75
low oil prices might also place vulnerable exporters like Venezuela or Nigeria in unstable social situations.
However, barring new disturbances or a quick reversal in OPEC policy, we expect prices will need to stay low long enough to discourage excessive growth from the highest-cost producers. Because US shale oil is among the most expensive sources of production, and because it requires constant drilling to offset the wells’ fast decline rates, the US is likely to emerge as the new swing producer for the oil market.
Already, the response has been marked. As of late 2014, 22 US producers representing about 16% of US production had announced average capital expenditure cuts of 16%, with the most recent averaging closer to 25%. These cuts should ultimately slow production growth, but keep in mind that production will still be expanding relative to last year.
Thus, with US production still rising into an already oversupplied market, risks to oil prices remain negatively skewed early in 2015. The outlook improves in the back half of the year, as the effect of reduced US production growth is met with an ongoing improvement in global growth. As a result, we expect oil prices to stabilize between
$60 and $80 per barrel. Importantly, that range should allow US production growth to expand at a pace that doesn’t overwhelm the global supply/demand balance.
To be sure, risks around this forecast are high. From a fundamental standpoint, the market is now searching for an equilibrium price in a market that is no longer managed by OPEC. Moreover, shale oil is a new technology and in the absence of a precedent, it is difficult to tell exactly how production and costs might react to a lower-price environment. Meanwhile, OPEC production itself remains a wildcard, not only on the downside but also on the upside. For example, on December 22, Saudi Arabia hinted it was ready to increase oil production, adding yet another layer of uncertainty.49
Given this highly uncertain backdrop, we do not find the tactical merits of a directional bet on oil attractive at this time. Even so, value is emerging in oil-related equities, prompting us to recommend a tactical tilt that provides exposure to energy stocks with some downside protection.
Gold: Still Losing its LusterWith gold prices down just 2.1% in 2014, it is tempting to believe the three-year, 36% price swoon has fully run its course. After all, last year’s decline was far more benign than that of many other commodities, not to mention gold’s own 28% drop the prior year.
Yet such a cursory review misses the bearish gold fundamentals that we believe are still at play. In particular, the stronger US growth we expect should support higher US real rates, thereby raising the opportunity cost of holding gold. Moreover, many of the fears that drove investors toward gold as a store of value—including US dollar debasement and high inflation—are now moving in the opposite direction (see Exhibit 111). In fact, the US fiscal situation has improved, the dollar appreciated against every major currency last year and inflation levels have declined along with oil prices. Finally, three years of consecutive declines and heightened volatility have tarnished gold’s “safe haven” status, leading to lower investment demand. Indeed, investment in gold bars and coins fell 40% last year.50 Moreover, outflows from exchange-traded funds (ETFs) continued, and with the stockpile of gold held by ETFs still representing
Exhibit 111: Gold vs. US DollarA stronger dollar is depressing demand for gold.
50
55
60
65
70
75
80
85
90$500
$700
$900
$1,100
$1,300
$1,500
$1,700
$1,900
$2,100
2006 2007 2008 2009 2010 2011 2012 2013 2014
Gold Price
Trade-Weighted USD (right)
US$/Ounce
Weaker USD
Trade-WeightedUSD Index (inverted)
Data as of December 26, 2014. Source: Investment Strategy Group, Bloomberg.
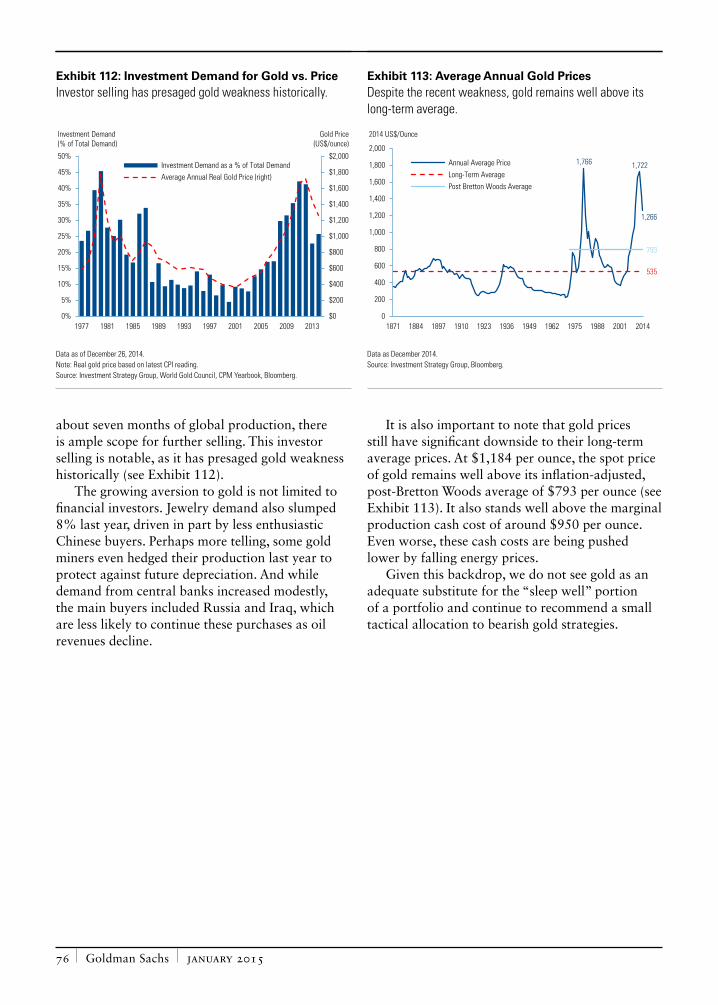
Goldman Sachs january 2015 76
about seven months of global production, there is ample scope for further selling. This investor selling is notable, as it has presaged gold weakness historically (see Exhibit 112).
The growing aversion to gold is not limited to financial investors. Jewelry demand also slumped 8% last year, driven in part by less enthusiastic Chinese buyers. Perhaps more telling, some gold miners even hedged their production last year to protect against future depreciation. And while demand from central banks increased modestly, the main buyers included Russia and Iraq, which are less likely to continue these purchases as oil revenues decline.
It is also important to note that gold prices still have significant downside to their long-term average prices. At $1,184 per ounce, the spot price of gold remains well above its inflation-adjusted, post-Bretton Woods average of $793 per ounce (see Exhibit 113). It also stands well above the marginal production cash cost of around $950 per ounce. Even worse, these cash costs are being pushed lower by falling energy prices.
Given this backdrop, we do not see gold as an adequate substitute for the “sleep well” portion of a portfolio and continue to recommend a small tactical allocation to bearish gold strategies.
Exhibit 112: Investment Demand for Gold vs. PriceInvestor selling has presaged gold weakness historically.
$0
$200
$400
$600
$800
$1,000
$1,200
$1,400
$1,600
$1,800
$2,000
0%
5%
10%
15%
20%
25%
30%
35%
40%
45%
50%
1977 1981 1985 1989 1993 1997 2001 2005 2009 2013
Investment Demand as a % of Total DemandAverage Annual Real Gold Price (right)
Investment Demand (% of Total Demand)
Gold Price(US$/ounce)
Data as of December 26, 2014. Note: Real gold price based on latest CPI reading. Source: Investment Strategy Group, World Gold Council, CPM Yearbook, Bloomberg.
Exhibit 113: Average Annual Gold PricesDespite the recent weakness, gold remains well above its long-term average.
1,766 1,722
1,266
535
793
0
200
400
600
800
1,000
1,200
1,400
1,600
1,800
2,000
1871 1884 1897 1910 1923 1936 1949 1962 1975 1988 2001 2014
Annual Average PriceLong-Term AveragePost Bretton Woods Average
2014 US$/Ounce
Data as December 2014. Source: Investment Strategy Group, Bloomberg.
2 01 5 O U T LO O K
Outlook Investment Strategy Group 77
In Closing
our view of us preeminence has served our clients well for six years. Given that the underpinnings of this preeminence are structural and based on deep economic, financial, human capital and institutional advantages, we cannot foresee anything that would cause us to abandon this view. In fact, the gap between the United States and other key developed and emerging market countries and regions has widened across a range of metrics. While the US financial markets have outperformed their counterparts, we do not believe that US preeminence has been fully discounted. Hence, our six-year investment theme endures.
We continue to recommend clients have a core of their portfolio invested in US assets. However, we remain vigilant with respect to factors that might derail our 2015 economic and investment outlook.

Notes
1. As measured by the Chicago Board Options Exchange Market Volatility Index (VIX).
2. Menzie Chinn and Jeffrey Frankel, “Will the Euro Eventually Surpass the Dollar as Leading International Reserve Currency?” NBER Working Paper No. 11510, August 2005.
3. Jeffrey Frankel, “The Euro Could Surpass the Dollar within Ten Years,” VoxEU, March 18, 2008.
4. Barry Eichengreen, “The Dollar Dilemma,” Foreign Affairs, September/October 2009.
5. Barry Eichengreen, “Why the Dollar’s Reign Is Near an End,” The Wall Street Journal, March 2, 2011.
6. Andrew E. Kramer, “Russian Warns Against Relying on Dollar,” The New York Times, June 5, 2009.
7. See for instance Carmen Reinhart and Kenneth Rogoff, This Time Is Different: Eight Centuries of Financial Folly, Princeton University Press, 2009, or Carmen Reinhart and Vincent Reinhart, “Beware Those Who Think the Worst Is Past,” Financial Times, August 30, 2010.
8. Investment Strategy Group, “Questioning the Role of US Assets in a Portfolio,” July 6, 2009.
9. International Energy Agency, “World Energy Outlook 2012,” OECD/IEA, 2012.
10. Ernest Miguelez and Carsten Fink, “Measuring the International Mobility of Inventors: A New Database,” World Intellectual Property Organization, May 2013.
11. OECD, “OECD Science, Technology and Industry Outlook 2014,” June 2014.
12. Ernst & Young, “Adapting and Evolving: Global Venture Capital Insights and Trends 2014,” January 2014.
13. For companies with a market capitalization above $100 million in the Bloomberg World Index.
14. Dale W. Jorgenson, Mun Ho and Jon Samuels, “Information Technology and US Productivity Growth: Evidence from a Prototype Industry Production Account,” Journal of Productivity Analysis, October 2011.
15. The Heritage Foundation, “2014 Index of Economic Freedom,” November 2013.
16. World Bank, “Doing Business 2015: Going Beyond Efficiency,” October 29, 2014.
17. McKinsey & Company, “Prospects for Growth: An Interview with Robert Solow,” McKinsey Quarterly, September 2014.
18. Henri Poincaré, Science and Hypothesis, 1905.
19. These forecasts have been generated by ISG for informational purposes as of the date of this publication. Return targets are based on ISG’s framework, which incorporates historical valuation, fundamental and technical analysis. Dividend yield assumptions are based on each indexes trailing 12-month dividend yield. They are based on proprietary models and there can be no assurance that the forecasts will be achieved. Please see additional disclosures
at the end of this publication. The following indexes were used for each asset class: Barclays Municipal 1-10Y Blend (Muni 1-10); BAML US T-Bills 0-3M Index (Cash); JPM Government Bond Index Emerging Markets Global Diversified (Emerging Market Local Debt); HFRI Fund of Funds Composite (Hedge Funds); MSCI EM US$ Index (Emerging Market Equity); Barclays US Corporate High Yield (US High Yield); Barclays US High Yield Loans (Bank Loans); MSCI UK Local Index (UK Equities); MSCI EAFE Local Index (EAFE Equity); S&P Banks Select Industry Index (US Banks); MSCI Japan Local Index (Japanese Equity).
20. Chair Janet L. Yellen, “Labor Market Dynamics and Monetary Policy,” speech delivered at the Federal Reserve Bank of Kansas City Economic Symposium in Jackson Hole, Wyo., August 22, 2014.
21. Investment Strategy Group, “European Sovereign Debt Crisis: Uncertain, Uncharted, and Certainly Unsettling,” August 21, 2011.
22. Harold Sirkin, Michael Zinser and Justin Rose, “The Shifting Economics of Global Manufacturing: How Cost Competitiveness Is Changing Worldwide,” The Boston Consulting Group, August 19, 2014.
23. The Editorial Board, “A Cease-Fire in Ukraine,” The New York Times, September 5, 2014.
24. Gregory L. White and Anton Troianovski, “Putin’s Year of Defiance and Miscalculation,” The Wall Street Journal, December 17, 2014.
25. Anders Aslund, “12 Ways in Which Putin’s Rhetoric Resembles Germany in the 1930s,” KyivPost, March 21, 2014.
26. Goldman Sachs, “Investing Insights: Geopolitical Hot Spots and Their Investment Implications,” Forum, Volume 7, Issue 1, September 2014.
27. Investment Strategy Group, “Have Geopolitical Risks Reached a Tipping Point?” September 11, 2014.
28. The White House, “Statement by the President on ISIL,” September 10, 2014.
29. Richard Haass, “Time to End the North Korean Threat,” The Wall Street Journal, December 23, 2014.
30. Jane Perlez, “Chinese Annoyance with North Korea Bubbles to the Surface,” The New York Times, December 20, 2014.
31. Connie Robertson, The Wordsworth Dictionary of Quotations, Wordsworth Editions, 1998.
32. Bank of America Merrill Lynch, “I’m a Commodity…Get me Out of Here,” December 4, 2014.
33. The CAI uses a broad collection of economic variables, both hard spending data and survey data, which seek to provide a more timely read on underlying economic trends.
34. Cornerstone Macro, “U.S. Business Confidence Rose to the Highest Since 2006,” December 4, 2014.
35. Goldman Sachs Global Investment Research, “Lower Oil Prices: More Sugarplums than Lumps of Coal,” December 19, 2014.
36. Ibid.
37. Goldman Sachs Global Investment Research, “Cheaper Crude with a Weaker Euro—A Boost to Growth and a Small Drag on Inflation,” October 15, 2014.
38. Bank of America Merrill Lynch, “2015: Pax Americana, iBubble & FX Wars,” November 23, 2014.
39. JP Morgan, “What Have We Learned this Year?” December 12, 2014.
40. Bank of America Merrill Lynch, “I’m a Commodity…Get Me Out of Here,” December 4, 2014.
41. Goldman Sachs Global Investment Research, “Let it Grow: Markets Take Policy-Rate-Hike Cycles in Stride,” September 10, 2014.
42. Note: Forecasts have been generated by ISG for informational purposes as of the date of this presentation. Return targets are based on a combination of trend and forward earnings estimates.
43. Goldman Sachs Global Investment Research, “US Daily: Revisiting the Risk of Another Bust,” November 3, 2014.
44. Empirical Research Partners, “Portfolio Strategy,” November 7, 2014.
45. Alister Bull, “Fischer: Recent Japanese Policy Actions Have Been Appropriate,” Bloomberg News, December 2, 2014.
46. Based on the JPM GBI-EM Global Diversified Index.
47. The following indexes were used for each asset class: Barclays United States Treasury Bellwether 10 Years (10-Year US Treasury); Barclays United States Treasury TIPS (US Treasury TIPS); Barclays Municipal Bond : High Yield (Muni High Yield); Barclays United States Corporate High Yield (US Corporate High Yield); Barclays Municipal 1 - 10 Years Blend (US Muni 1-10 Year); Barclays United States High Yield Loans (Bank Loans); JPM GBI-Emerging Markets Global Diversified Composite (USD) (EM Local Debt); JPM EMBI Global Diversified Composite (EM US Dollar Debt); JPM GBI Germany 7 - 10 Years (Euro) (Germany 7-10 Year (Local)); JPM European Monetary Union Government 7 - 10 Years (Euro)( EMU 7-10 Year (Local)); United States, All Urban Consumers, U S City Average, Consumer Prices, All Items, SA, Index, 1982-1984 = 100 (US Inflation (%YoY)).
48. JP Morgan, “2014 High-Yield Annual Review,” December 4, 2014.
49. Anjli Raval, “Opec Leader Vows Not to Cut Oil Output Even If Price Hits $20,” Financial Times, December 22, 2014.
50. Based on data through Q3 2014.

The co-authors give special thanks to:
Matheus Dibo Associate
Travis Pfander Associate
Mary Craig Associate
Paul Swartz Vice President
Additional contributors from the Investment Strategy Group include:
Venkatesh Balasubramanian Vice President
Thomas Devos Vice President
Andrew Dubinsky Vice President
Oussama Fatri Vice President
Gregory Mariasch Vice President
Howard Spector Vice President
Giuseppe Vera Vice President
Harm Zebregs Vice President
Lili Zhu Associate

Thank you for reviewing this publication which is intended to discuss general market activity, industry or sector trends, or other broad-based economic, market or political conditions. It should not be construed as research. Any reference to a specific company or security is for illustrative purposes and does not constitute a recommendation to buy, sell, hold or directly invest in the company or its securities.
Investment Strategy Group. The Investment Strategy Group (ISG) is focused on asset allocation strategy formation and market analysis for Private Wealth Management. Any information that references ISG, including their mod-el portfolios, represents the views of ISG, is not research and is not a product of Global Investment Research or Goldman Sachs Asset Management, L.P (GSAM). The views and opinions expressed may differ from those expressed by other groups of Goldman Sachs. If shown, ISG Model Portfolios are provided for illustra-tive purposes only. Your asset allocation, tactical tilts and portfolio performance may look significantly different based on your particular circumstances and risk tolerance.
Not a Municipal Advisor. Except in circumstances where Goldman Sachs expressly agrees otherwise, Goldman Sachs is not acting as a municipal advi-sor and the opinions or views contained in this presentation are not intended to be, and do not constitute, advice, includ-ing within the meaning of Section 15B of the Securities Exchange Act of 1934.
Forecasts. Economic and market forecasts presented herein reflect our judgment as of the date of this mate-rial and are subject to change without notice. These forecasts are estimated, based on assumptions, and are subject to significant revision and may change materially as economic and market con-ditions change. Goldman Sachs has no obligation to provide updates or changes to these forecasts. If shown, case studies and examples are for illustrative purposes only.
Indices. Any references to indices, benchmarks or other measure of relative market performance over a specified period of time are provided for your information only. Indices are unmanaged. Investors cannot invest directly in indices. The figures for the index reflect the reinvestment of dividends and other earn-ings but do not reflect the deduction of advisory fees, transaction costs and other expenses a client would have paid, which would reduce returns. Past performance is not indicative of future results.
JPMorgan Indices. Information has been obtained from sources believed to be re-liable but JPMorgan does not warrant its completeness or accuracy. The JPMorgan GBI Broad, JPMorgan EMBI Global
Diversified and JPMorgan GBI-EM Global Diversified are used with permission and may not be copied, used, or distributed without JPMorgan’s prior written ap-proval. Copyright 2015, JPMorgan Chase & Co. All rights reserved.
S&P Indices. “Standard & Poor’s” and “S&P” are registered trademarks of Standard & Poor’s Financial Services LLC (“S&P”) and Dow Jones is a registered trademark of Dow Jones Trademark Holdings LLC (“Dow Jones”) and have been licensed for use by S&P Dow Jones Indices LLC and sublicensed for certain purposes by The Goldman Sachs Group, Inc. The “S&P 500 Index” is a product of S&P Dow Jones Indices LLC, and has been licensed for use by The Goldman Sachs Group, Inc. The Goldman Sachs Group, Inc. is not sponsored, endorsed, sold or promoted by S&P Dow Jones Indices LLC, Dow Jones, S&P, their respective affiliates, and neither S&P Dow Jones Indices LLC, Dow Jones, S&P, or their respective affiliates make any representation regarding the advisability of investing in such product(s).
EURO Stoxx 50. The EURO STOXX 50® is the intellectual property (including registered trademarks) of STOXX Limited, Zurich, Switzerland and/or its licensors (“Licensors”), which is used under license.
MSCI Indices. The MSCI indices are the exclusive property of MSCI Inc. (“MSCI”). MSCI and the MSCI index names are ser-vice mark(s) of MSCI or its affiliates and are licensed for use for certain purposes by The Goldman Sachs Group, Inc.
Barclays Capital Indices. © 2015 Barclays Capital Inc. Used with permission.
Tokyo Stock Exchange Indices. Indices including TOPIX (Tokyo Stock Price Index), calculated and published by Tokyo Stock Exchange, Inc. (TSE), are intellectual properties that belong to TSE. All rights to calculate, publicize, disseminate, and use the indices are reserved by TSE. © Tokyo Stock Exchange, Inc. 2015. All rights reserved.
Investment Risks. Risks vary by the type of investment. For example, invest-ments that involve futures, equity swaps, and other derivatives, as well as non-investment grade securities, give rise to substantial risk and are not available to or suitable for all investors. We have de-scribed some of the risks associated with certain investments below. Additional information regarding risks may be available in the materials provided in connection with specific investments. You should not enter into a transaction or make an investment unless you un-derstand the terms of the transaction or investment and the nature and extent of the associated risks. You should also be satisfied that the investment is appropri-ate for you in light of your circumstances and financial condition.
Alternative Investments. Alternative investments may involve a substantial degree of risk, including the risk of total loss of an investor’s capital and the use of leverage, and therefore may not be appropriate for all investors. Private equity, private real estate, hedge funds and other alternative investments structured as private investment funds are subject to less regulation than other types of pooled vehicles and liquidity may be limited. Investors in private investment funds should review the Offering Memorandum, the Subscription Agreement and any other applicable dis-closures for risks and potential conflicts of interest. Terms and conditions govern-ing private investments are contained in the applicable offering documents, which also include information regarding the liquidity of such investments, which may be limited.
Commodities. Commodity investments may be less liquid and more volatile than other investments. The risk of loss in trading commodities can be substantial due, but not limited to, volatile political, market and economic conditions. An investor’s returns may change radically at any time since commodities are subject, by nature, to abrupt changes in price. Commodity prices are volatile because they respond to many unpredictable factors including weather, labor strikes, inflation, foreign exchange rates, etc. In an individual account, because your posi-tion is leveraged, a small move against your position may result in a large loss. Losses may be larger than your initial deposit. Investors should carefully consider the inherent risk of such an investment in light of their experience, objectives, financial resources and other circumstances. No representation is made regarding the suitability of com-modity investments.
Emerging Markets and Growth Markets. Investing in the securities of issuers in emerging markets and growth markets involves certain considerations, includ-ing: political and economic conditions, the potential difficulty of repatriating funds or enforcing contractual or other legal rights, and the small size of the securities markets in such countries coupled with a low volume of trading, resulting in potential lack of liquidity and in price volatility.
Tactical Tilts. Tactical tilts may involve a high degree of risk. No assurance can be made that profits will be achieved or that substantial losses will not be incurred.
Equity Investments. Equity investments are subject to market risk, which means that the value of the securities may go up or down in respect to the prospects of individual companies, particular industry sectors and/or general economic conditions. The securities of small and mid-capitalization companies involve greater risks than those associated with
larger, more established companies and may be subject to more abrupt or erratic price movements.
Fixed Income. Investments in fixed income securities are subject to the risks associated with debt securities generally, including credit/default, liquidity and interest rate risk. Any guarantee on an investment grade bond of a given country applies only if held to maturity.
Non-US Securities. Investing in non-US securities involves the risk of loss as a result of more or less non-US govern-ment regulation, less public information, less liquidity and greater volatility in the countries of domicile of the issuers of the securities and/or the jurisdiction in which these securities are traded. In addition, investors in securities such as ADRs/GDRs, whose values are influenced by foreign currencies, effectively assume currency risk.
Tax Information. Goldman Sachs does not provide legal, tax or accounting advice. You should obtain your own independent tax advice based on your particular circumstances.
Distributing Entities. This material has been approved for issue in the United Kingdom solely for the purposes of Section 21 of the Financial Services and Markets Act 2000 by GSI, Peterborough Court, 133 Fleet Street, London EC4A 2BB; by Goldman Sachs Canada, in con-nection with its distribution in Canada; in the United States by Goldman, Sachs & Co. Member FINRA/SIPC; in Hong Kong by Goldman Sachs (Asia) L.L.C.; in Korea by Goldman Sachs (Asia) L.L.C., Seoul Branch; in Japan by Goldman Sachs (Japan) Ltd; in Australia by Goldman Sachs Australia Pty Limited (ACN 092 589 770); and in Singapore by Goldman Sachs (Singapore) Pte. (Company Number: 198502165W); and in Brazil by Goldman Sachs do Brasil Banco Múltiplo S.A.
No Distribution; No Offer or Solicitation. This material may not, without Goldman Sachs’ prior written consent, be (i) copied, photocopied or duplicated in any form, by any means, or (ii) distributed to any person that is not an employee, officer, director, or authorized agent of the recipient. This material is not an offer or solicitation with respect to the purchase or sale of a security in any jurisdiction in which such offer or solicitation is not authorized or to any person to whom it would be unlawful to make such offer or solicitation. This material is a solicitation of derivatives business generally, only for the purposes of, and to the extent it would otherwise be subject to, §§ 1.71 and 23.605 of the U.S. Commodity Exchange Act.
© 2015 Goldman Sachs. All rights reserved. Phot
ogra
phy
Cred
its: P
age
28: P
IERR
E AN
DRIE
U/AF
P/Ge
tty Im
ages
; Pag
e 30
: DIM
ITAR
DIL
KOFF
/AFP
/Get
ty Im
ages
; Pag
e 31
: ARI
S M
ESSI
NIS
/AFP
/Get
ty Im
ages
; Pag
e 32
: JOH
N M
OORE
/GET
TY IM
AGES
NEW
S/Ge
tty Im
ages
.


Atlanta BeijingBoston Chicago Dallas Dubai Frankfurt Geneva
Hong Kong Houston LathamLondon Los Angeles Madrid Melbourne Miami
Milan Monaco New York Philadelphia San Francisco Sao PauloSeattle Shanghai
Singapore Sydney Washington, DC West Palm Beach Zurich
www.gs.com
Goldman Sachs