u.s. multifamily, q2 2016 multifamily maintains strength; faces … · 2016-10-25 · demand trends...
TRANSCRIPT

MARKETVIEW
Q2 2016 CBRE Research © 2016 CBRE, Inc. | 1
MARKETVIEW
The U.S. multifamily housing industry has experienced healthy market fundamentals for the past seven years. Both cyclical and structural trends continue to create strong market demand. Development activity has been steadily rising, but vacancy rates remain low and rental growth is above the historical average.
Gains in market performance are moderating, however. Construction deliveries are now outpacing demand. The imbalance is still moderate, but likely to widen. Developers are expected to deliver the highest annual number of new apartment units in the current real estate cycle this year.
• Although the U.S. multifamily market remains very healthy, it has entered a new phase in which deliveries are outpacing demand, leading to slightly less favorable market conditions in Q2 2016. Performance moderation is expected over the balance of the year.
• Net absorption reached 202,000 units for the year ending Q2 2016, 8.4% lower than a year earlier, but still reflecting robust demand.
• Completions totaled 229,000 units for the year ending Q2 2016, and 61,000 in Q2 alone. Completions are expected to reach a cyclical high of 275,000 units this year.
• The vacancy rate was 4.4% in Q2 2016, up 10 basis points year-over-year. While the increase was very small, it marked the first annual increase since 2009.
• The Q2 2016 year-over-year rent appreciation of 3.3% was above the historical average of 2.4% since 2000, but below last year’s Q2 rate of 5.3%.
• CBRE Research’s Buyer Underwriting Survey of prime mid- and high-rise product continued to reflect a competitive transactional environment, with unlevered target IRRs averaging 6.2% and initial cap rates at 4.27%, both unchanged from the prior quarter.
• In contrast to other property sectors, multifamily investment activity increased in Q2 2016 compared to the prior year. Q2’s $34 billion reflected an 8.9% gain over Q2 2015.
• Dallas/Ft. Worth remains one of the most dynamic apartment markets in the country. Despite high levels of new supply (4,200 units in the first half of 2016), the Q2 vacancy rate was low at 4.3% and the year-over-year rent growth healthy at 6.9%.
U.S. Multifamily, Q2 2016
Multifamily maintains strength; faces increased deliveries in H2 2016
Arrows indicate change from previous year.*Total last four quarters.
Vacancy Rate4.4%
Rentable Completions*229,000 Units
Net Absorption*202,000 Units
Total Acquisitions $34 Billion

Q2 2016 CBRE Research © 2016 CBRE, Inc. | 2
MARKETVIEW U.S. MULTIFAMILY
economic expansion are technology, housing and healthcare. Additionally, consumer spending and confidence are fairly healthy and rising, especially now that wages are rising at a higher rate than experienced through most of the recovery/expansion period. Year-over-year wage growth was 2.6% in July.
DEMAND TRENDS
MULTIFAMILY DEMAND REMAINS ROBUST
Demand for multifamily rental units remains healthy. Net absorption reached 201,800 units for the year ending Q2 2016, one of the highest levels during the current cycle but less than in 2014 and 2015, as shown in Figure 1.
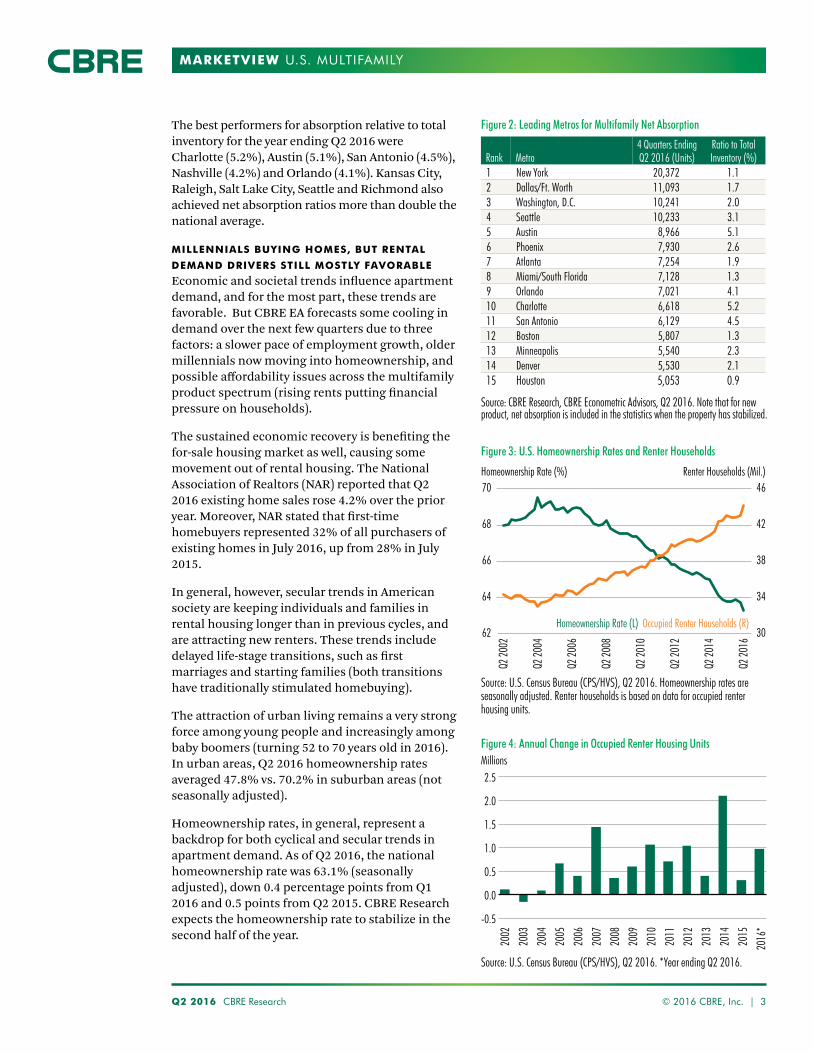
Among the 62 metropolitan areas tracked by CBRE Econometric Advisors (CBRE EA), New York City led the nation with more than 20,000 units absorbed in the year ending Q2 2016. Dallas/Ft. Worth, Washington, D.C. and Seattle each broke the 10,000-unit level.
The ratio of units absorbed relative to total existing inventory provides one measure of how dynamic multifamily demand is in a market. Nationally, the ratio averaged 1.4% for the year ending Q2 2016—down from the current recovery period’s 1.7% peak in 2014, but still very healthy.
Multifamily vacancy remained low in Q2, but for the first time since 2009 there was a year-over-year rise, albeit very small. With the increase in completions, vacancy is expected to increase slightly over the balance of the year. The current rate of rent growth remains above the historical average, but has moderated from the level achieved over the past six years.
The multifamily sector continues to reflect healthy and active capital markets. Both debt and equity investment volumes showed moderate gains over 2015, and investment pricing has held firm. Institutional property returns, however, have come down from their 2015 peak.
This quarter’s spotlight is on Dallas/Ft. Worth, unquestionably one of the country’s most dynamic multifamily markets. Despite high levels of new supply, vacancy remained low and rents increased at twice the national average.
(Note: The terms “multifamily” and “apartment” are used interchangeably in this report to represent the rental multifamily market, unless otherwise noted. National statistics represent the 62 metro markets tracked by CBRE Econometric Advisors).
ECONOMIC TRENDS
Q2 2016 GDP DISAPPOINTS, EMPLOYMENT DOES NOT
By GDP standards, U.S. economic growth appears modest. GDP growth was a modest 1.1% in Q2. Other statistics reveal stronger conditions, and the consensus GDP forecast for H2 2016 is double the Q2 growth rate at approximately 2.5% annualized.
Monthly employment gains averaged a favorable 190,000 jobs between May and July. The July total alone reflects a very respectable year-over-year increase of 2.4 million jobs or 1.7%. Job growth averaging 150,000 per month is expected for the balance of the year, lower in part to labor shortages in some professions.
No major industries currently are in decline, but some including energy, manufacturing and export trade are either stagnating or growing only marginally. Offsetting the downward pull from these industries and contributing significantly to overall
300
250
150
50
-50
200
100
0
-100
Q2 20
08
Q2 20
15
Q2 20
10
Q2 20
14
Q2 20
09
Q2 20
06
Q2 20
13
Q2 20
12
Q2 20
11
Q2 20
07
Figure 1: Multifamily Net Absorption (Rolling Four-Quarter Totals)
Units (000s)
Source: CBRE Research, CBRE Econometric Advisors, Q2 2016. Most recent data point is the four quarters ending Q2 2016 (201,809 units). Note that for new product, net absorption is included in the statistics when the property has stabilized.
Q2 20
16
Q2 2016 CBRE Research © 2016 CBRE, Inc. | 3
MARKETVIEW U.S. MULTIFAMILY
The best performers for absorption relative to total inventory for the year ending Q2 2016 were Charlotte (5.2%), Austin (5.1%), San Antonio (4.5%), Nashville (4.2%) and Orlando (4.1%). Kansas City, Raleigh, Salt Lake City, Seattle and Richmond also achieved net absorption ratios more than double the national average.
MILLENNIALS BUYING HOMES, BUT RENTAL
DEMAND DRIVERS STILL MOSTLY FAVORABLE
Economic and societal trends influence apartment demand, and for the most part, these trends are favorable. But CBRE EA forecasts some cooling in demand over the next few quarters due to three factors: a slower pace of employment growth, older millennials now moving into homeownership, and possible affordability issues across the multifamily product spectrum (rising rents putting financial pressure on households).
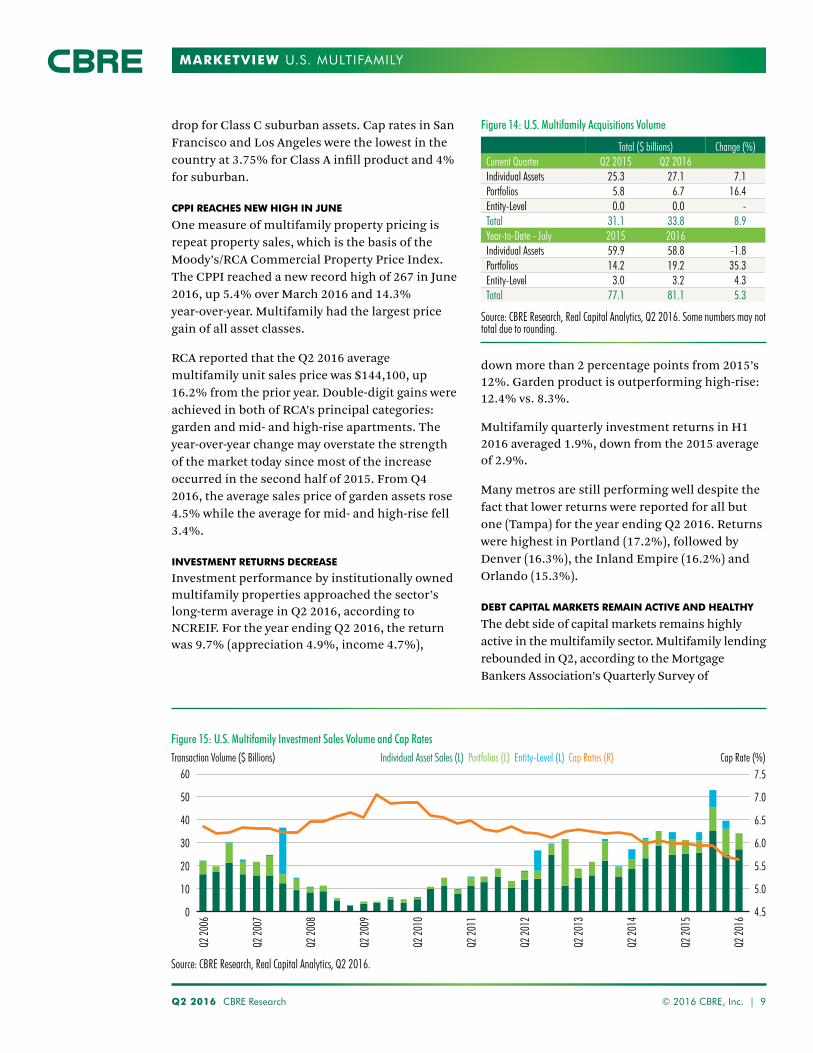
The sustained economic recovery is benefiting the for-sale housing market as well, causing some movement out of rental housing. The National Association of Realtors (NAR) reported that Q2 2016 existing home sales rose 4.2% over the prior year. Moreover, NAR stated that first-time homebuyers represented 32% of all purchasers of existing homes in July 2016, up from 28% in July 2015.
In general, however, secular trends in American society are keeping individuals and families in rental housing longer than in previous cycles, and are attracting new renters. These trends include delayed life-stage transitions, such as first marriages and starting families (both transitions have traditionally stimulated homebuying).
The attraction of urban living remains a very strong force among young people and increasingly among baby boomers (turning 52 to 70 years old in 2016). In urban areas, Q2 2016 homeownership rates averaged 47.8% vs. 70.2% in suburban areas (not seasonally adjusted).
Homeownership rates, in general, represent a backdrop for both cyclical and secular trends in apartment demand. As of Q2 2016, the national homeownership rate was 63.1% (seasonally adjusted), down 0.4 percentage points from Q1 2016 and 0.5 points from Q2 2015. CBRE Research expects the homeownership rate to stabilize in the second half of the year.
70 46
4268
64 34
66 38
62 30
Q2 20
02
Q2 20
04
Q2 20
08
Q2 20
12
Q2 20
06
Q2 20
10
Q2 20
14
Q2 20
16
Figure 3: U.S. Homeownership Rates and Renter Households
Homeownership Rate (%) Renter Households (Mil.)
Source: U.S. Census Bureau (CPS/HVS), Q2 2016. Homeownership rates are seasonally adjusted. Renter households is based on data for occupied renter housing units.
Homeownership Rate (L) Occupied Renter Households (R)
Figure 4: Annual Change in Occupied Renter Housing Units
Source: U.S. Census Bureau (CPS/HVS), Q2 2016. *Year ending Q2 2016.
2002
2003
2004
2005
2006
2007
2008
2009
2010
2011
2012
2013
2014
2015
2016
*
-0.5
2.5Millions
0.5
1.0
1.5
2.0
0.0
Figure 2: Leading Metros for Multifamily Net Absorption
Source: CBRE Research, CBRE Econometric Advisors, Q2 2016. Note that for new product, net absorption is included in the statistics when the property has stabilized.
Rank Metro4 Quarters Ending Q2 2016 (Units)
Ratio to Total Inventory (%)
1 New York 20,372 1.12 Dallas/Ft. Worth 11,093 1.73 Washington, D.C. 10,241 2.04 Seattle 10,233 3.15 Austin 8,966 5.16 Phoenix 7,930 2.67 Atlanta 7,254 1.98 Miami/South Florida 7,128 1.39 Orlando 7,021 4.110 Charlotte 6,618 5.211 San Antonio 6,129 4.512 Boston 5,807 1.313 Minneapolis 5,540 2.314 Denver 5,530 2.115 Houston 5,053 0.9

Q2 2016 CBRE Research © 2016 CBRE, Inc. | 4
MARKETVIEW U.S. MULTIFAMILY
Due to these factors, the number of renter households in all types of rentals, including single-family, has risen steadily over the past several years and reached 43.9 million in Q2 2016, up 984,000 or 2.3% from the prior year.
SUPPLY TRENDS
DELIVERIES IN FIRST HALF 2016 SET FASTEST
PACE SINCE 2000
Apartment unit deliveries continue at a rapid pace. Nationally, completions totaled 60,600 units in Q2 2016—up 24.1% year-over-year and the highest quarter total since 2000. In the first half of the year, 101,100 units were added, marking a 32.2% increase year-over-year and the highest first-half completions rate since 2000.
Despite these higher numbers, construction starts are beginning to slow. Reasons for this include the increased difficulty of obtaining construction financing, rising land costs, moderation in recent and expected rent growth and less clarity in exit strategies for merchant builders. The slowdown in permitting and starts is expected to continue through 2016 and 2017.
Multifamily building permit data indicate that the development cycle may have passed its peak. Permit totals declined on a year-over-year basis for two consecutive quarters after 23 straight quarters (nearly six years) of year-on-year gains. Approximately 100,900 multifamily units received permit approval in Q2 2016, down 30% from the
29-year high of 144,100 units approved in Q2 2015.
A surge in permits in New York City during 2015 contributed to a significant increase in the national total that year, and a subsequent decline in permits in New York likewise contributed significantly to the decline in national permits during the year ending Q2 2016. U.S. multifamily permits still show a decline when New York is removed from consideration, but it is notably smaller than the decline when New York is included.
Units (000s)
Source: CBRE Research, CBRE Econometric Advisors, Q2 2016. *In 2016, Q3 and Q4 are forecasts. Note that deliveries are counted in the quarter in which property is stabilized.
Figure 5: Historical U.S. Multifamily Completions
1998
300
200
100
250
150
50
0
2002
2001
2006
2005
2010
2009
2000
1999
2004
2003
2008
2007
2012
2011
2014
2013
2016
*20
15
Q1 Q2 Q3 Q4
Figure 6: Historical U.S. Multifamily Permits
120
150
30
90
60
0
Units (000s)
Source: CBRE Research, U.S. Census Bureau, Q2 2016. For buildings with 5+ units including for-sale product. Line represents historical average for period displayed (73,800).
Q2 20
06
Q2 20
08
Q2 20
07
Q2 20
09
Q2 20
10
Q2 20
11
Q2 20
12
Q2 20
13
Q2 20
16
Q2 20
14
Q2 20
15

Q2 2016 CBRE Research © 2016 CBRE, Inc. | 5
MARKETVIEW U.S. MULTIFAMILY
While quarterly permits remain above the 2006-2015 average, the recent year-on-year declines foreshadow a reduction in completions in 2017 and beyond.
Annual completions are expected to total 275,000 units in 2016, marking the historical high since the beginning of CBRE EA’s data series in 1994. Another 225,000 units are expected in 2017, bringing the two-year total to 500,000 units. After that the outlook is for more moderate delivery levels.
The majority of completions have been in urban areas where changing lifestyle trends have created dramatic increases in rental demand. But many of the infill markets may also experience short-term impacts from too much supply in a short time period, including slower lease-ups of new properties and very modest to no rental growth in existing communities.
NEW YORK, HOUSTON AND SOUTH FLORIDA LEAD
METROS IN TOTAL DELIVERIES
New York, Houston and South Florida (Miami, Ft. Lauderdale and West Palm Beach) led U.S. metro areas in apartment deliveries during the year ending Q2 2016. Austin, San Antonio, Charlotte and Nashville had the highest new-supply-to-total-inventory ratios—each at or above 4% and well in excess of the national average of 1.6%. Oversupply in these markets is a concern, but demand is also very high.
New multifamily supply has increased significantly in Detroit, Philadelphia, Seattle, Denver and South Florida, where completions in each over the past year were at least more than double their average annual completions rate of the past 10 years. While New York and Houston were national leaders in total new supply over the past year, deliveries in these markets were closer to their 10-year average annual completions rate than in most other major U.S. metros.
Figure 7: Leading Metros for Multifamily Completions
Source: CBRE Research, CBRE Econometric Advisors, Q2 2016. Note that deliveries are counted in the quarter in which property reaches stabilization.
Rank Metro4 Quarters Ending Q2 2016 (Units)
Ratio to Total Inventory (%)
1 New York City 25,026 1.32 Houston 12,389 2.13 Miami/South Florida 10,403 1.94 Seattle 9,815 2.85 Dallas/Ft. Worth 9,771 1.56 Austin 9,333 4.87 Washington, D.C. 9,291 1.78 Denver 8,981 3.19 Boston 8,250 1.810 Atlanta 7,962 1.911 Phoenix 7,618 2.312 San Antonio 6,885 4.613 Orlando 6,808 3.614 Los Angeles 6,593 0.615 Charlotte 6,199 4.6
Figure 8: Current Construction vs. Historical
DetroitPhiladelphia
SeattleDenver
Miami/South FloridaSan Francisco
MinneapolisAustin
San DiegoPhoenixTampa
Sum of MarketsBoston
Orange CountyNew York
AtlantaWashington, D.C.
HoustonChicago
Los AngelesDallas/Ft. Worth
Ratio of Units Completed in 4 Quarters Ending Q2 2016 to 2005-2015 Average
Source: CBRE Research, CBRE Econometric Advisors, Q2 2016. For 19 largest markets and Austin.
2 41 3 650

Q2 2016 CBRE Research © 2016 CBRE, Inc. | 6
MARKETVIEW U.S. MULTIFAMILY
VACANCY TRENDS
MARKET EXPERIENCES FIRST YEAR-OVER-YEAR
VACANCY INCREASE SINCE 2009
The national apartment vacancy rate edged up in Q2 2016 for the first year-over-year increase since 2009. The Q2 2016 rate of 4.4% is still very healthy, and the 10 basis point (bps) rise year-over-year is very small.
Among the markets tracked by CBRE EA, the tightest were Providence (2.7%) and Newark (2.9%). Thirteen other markets had vacancy rates below 4% in Q2 2016, including Minneapolis (3%) and New York (3.1%). The markets posting the highest vacancy rates included Oklahoma City (8%) and a dozen other markets with vacancy rates of more than 6%, including Houston (6.4%).
The majority of metro markets (32 of the 62 tracked) had slight vacancy declines in the year ending Q2 2016, and seven had no change. The markets with the largest declines were Tucson (-130 bps), Norfolk (-120 bps) and Long Island (-100 bps). Larger markets with the highest declines were Detroit (-90 bps), Minneapolis (-50 bps) and Dallas/Ft. Worth (-27 bps).
A sizeable minority (23 markets) had vacancy increases on a year-over-year basis due either to excessive supply or weaker demand. Nine markets, including Pittsburgh, Houston, Denver and Portland, posted year-over-year increases of more than 100 bps.
RENT/REVENUE TRENDS
RENT GROWTH MODERATES IN Q2 2016
Nationally, rent growth continued to moderate in Q2 2016 from its 2015 peak. The weighted-average lease rate across the tracked markets increased by 3.3% year-over-year, versus 4% in Q1 2016 and 5.3% in Q2 2015. Although the national rate of rent growth is now below the average annual rate during the past two expansion cycles (3.9%), it still is above the 2.4% historical average from 2000 to Q2 2016.
Rent growth was considerably higher for garden-style apartment communities (+4.2%) than for high-rise communities (+1.7%) on a year-over-year basis. This is not surprising, as the bulk of construction completions have been mid- and high-rise buildings.
Similarly, older vintage apartments are currently achieving higher rates of rent appreciation. CBRE
Figure 9: Historical U.S. Vacancy Rates and Change
Source: CBRE Research, CBRE Econometric Advisors, Axiometrics Inc., Q2 2016.
250200150100
500
-50-100-150
Y-o-Y Vacancy Change (bps) Vacancy Rate (%)
Q2 20
04
Q2 20
08
Q2 20
12
Q2 20
06
Q2 20
10
Q2 20
16
Q2 20
14
8
10
3
5
2
4
67
Y-o-Y Vacancy Change (L) Vacancy Rate (R)
Figure 10: Vacancy Rate Change in Major MarketsY-o-Y Change (bps)
Source: CBRE Research, CBRE Econometric Advisors, Axiometrics Inc., Q2 2016. For 19 largest metros and Austin.
DetroitMinneapolis
Dallas/Ft. WorthPhoenix
Orange CountySeattle
Washington, D.C.Philadelphia
San DiegoTampaAustin
AtlantaSum of Markets
ChicagoNew York
BostonSan Francisco
Los AngelesMiami/South Florida
DenverHouston
-100 -50 0 15010050

Q2 2016 CBRE Research © 2016 CBRE, Inc. | 7
MARKETVIEW U.S. MULTIFAMILY
UNDERWRITING SURVEY REFLECTS LITTLE
CHANGE FROM PRIOR QUARTER
The results of CBRE Research’s Q2 2016 Buyer Underwriting Survey were essentially unchanged from the prior quarter. They continued to reflect confidence in market conditions and a willingness to accept lower returns for high-end mid- and high-rise assets in the best submarkets. Pricing remains very strong, even though the pool of bidders has contracted, according to CBRE investment professionals. The survey showed unlevered target IRRs averaging only 6.2% and going-in cap rates averaging a still-very-low 4.27%.
EA reports that apartment communities built in the 1980s and 1970s had increases of 4.5% and 4.3%, respectively, over the past year.
National rent growth is projected to moderate moderate in response to the high level of deliveries, dropping to 1.7% over the next year (year ending Q2 2017). This forecast is based on CBRE EA’s baseline view of the economy, which includes cooling economic conditions over the next two years and a mild recession in late 2018 and early 2019. Conversely, under CBRE’s upside scenario, which appears more likely, multifamily rent growth is expected to reach 3.4% for the year ending Q2 2017.
Sacramento registered the highest rate of rent growth (8.9%) over the past year, followed by Seattle (8%), Nashville (7.9%) and Phoenix (7.7%).
Increasing vacancy is starting to drag on rent gains in some major markets. For example, year-over-year rent growth in San Francisco slowed to 2% in Q2 2016 versus 11.1% in Q2 2015. In Denver, annual rent growth slowed to 4.2% in Q2 2016 from 11.9% the previous year. Houston, where vacancy increased 120 bps year-over-year, saw rents decrease 0.1% in the year ending Q2 2016 after increasing 3% a year earlier.
Four markets had small year-over-year rent declines. Oklahoma City posted the largest drop of -1.6%, followed by Pittsburgh (-0.7%), El Paso (-0.5%) and Houston (-0.1%).
CAPITAL MARKETS
MULTIFAMILY LEADS ALL PROPERTY SECTORS IN
MAINTAINING INVESTMENT VOLUME
The multifamily capital markets environment remained very active and generally positive in Q2 2016. Acquisitions momentum maintained an active pace and pricing reflected sustained buyer interest. Among all property types, multifamily has held up best in terms of year-over-year investment volumes and pricing.
Figure 12: Leading Metros for Multifamily Rent Growth
Source: CBRE Research, CBRE Econometric Advisors, Axiometrics Inc., Q2 2016.
Rank MetroY-o-Y
Change (%)Average Monthly Rent, Q2 2016
1 Sacramento 8.7 1,3492 Seattle 8.0 1,7123 Nashville 7.9 1,1394 Phoenix 7.7 9505 Tampa 7.3 1,1076 Inland Empire 7.1 1,4657 Salt Lake City 7.1 1,0198 Portland 7.1 1,3939 San Diego 7.0 1,91310 Dallas/Ft. Worth 6.6 1,08611 St. Louis 6.5 97012 Orlando 6.4 1,13913 Las Vegas 6.0 91414 Chicago 5.8 1,563
Figure 11: Historical U.S. Rental Rates and Change
Source: CBRE Research, CBRE Econometric Advisors, Axiometrics Inc., Q2 2016.
8
4
0
-4
-8
Y-o-Y Rent Change (%) Monthly Rent per Unit ($)
Q2 20
04
Q2 20
08
Q2 20
12
Q2 20
06
Q2 20
10
Q2 20
16
Q2 20
14
1,800
1,200
1,000
1,400
1,600
Y-o-Y Change (L) Rent per Unit (R)

Q2 2016 CBRE Research © 2016 CBRE, Inc. | 8
MARKETVIEW U.S. MULTIFAMILY
Q2 2016 ACQUISITIONS RISE 9% YEAR-OVER-
YEAR TO $34 BILLION
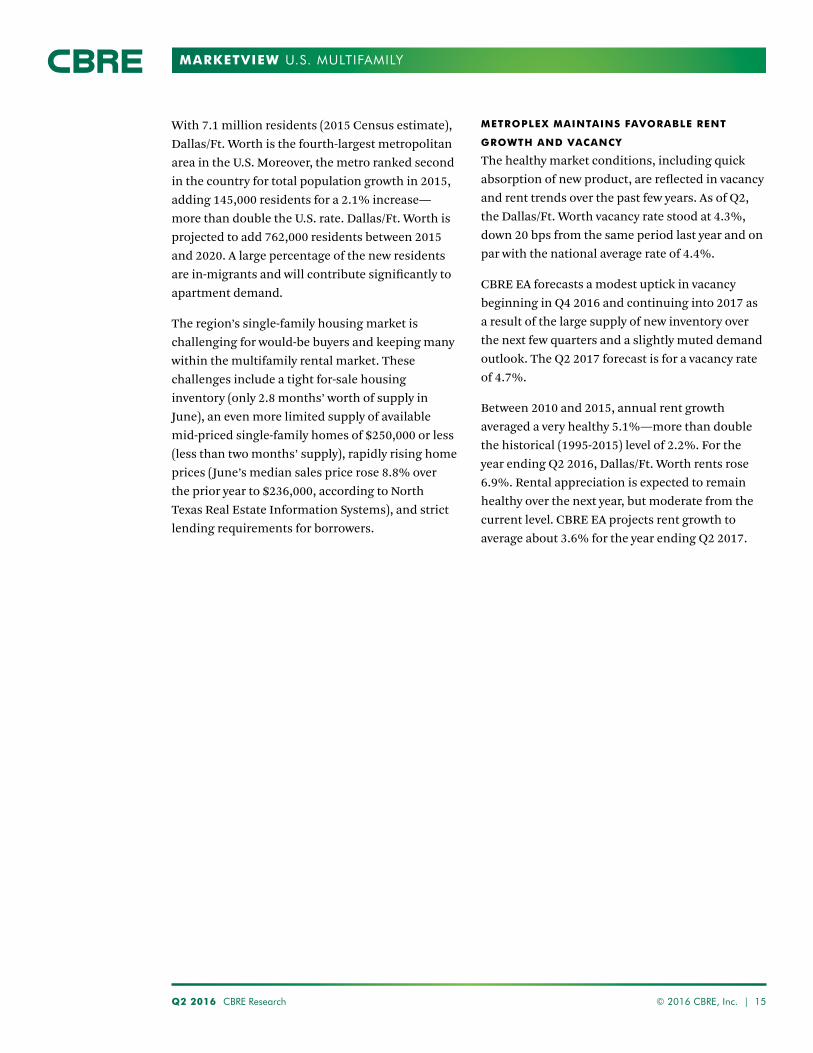
Multifamily investment remained very active in Q2 2016. Acquisitions totaled $34 billion, up 8.9% year-over-year. The sector’s increase stood in contrast to other property sectors, all of which recorded year-over-year declines. Year-to-date through July, acquisitions totaled $81 billion for a year-over-year gain of 5.3%.
Multifamily’s increase was partly due to robust portfolio sales in Q2 (and year-to-date), although most of the portfolio acquisitions were small (i.e., less than 25 properties). Individual property sales—the best measure of investment momentum—rose 7.1% in Q2 compared with the same quarter a year ago. Year-to-date, however, individual asset purchases fell 1.8% compared with the same time last year.
In mid-August, MAA “Mid-America Apartment Communities” announced its $3.9 billion acquisition of and merger with Post Properties Inc., which is expected to close late this year. Combined, the two companies will form the largest publicly traded multifamily REIT with an approximate total market capitalization of $17 billion and a portfolio of 105,000 units in 317 properties.
Cross-border capital sources acquired $2.8 billion worth of multifamily properties in Q2 2016, accounting for 8.7% of total multifamily investment. While significant, the role of international capital has moderated from 2015 when 12.8% of all investment came from international buyers. Over the long term, CBRE Research expects global capital to increase its buying activity relative to all sources. The lead country sources for Q2 2016 purchases were Canada and Israel.
The New York City metropolitan area continued to attract the most multifamily investment among U.S. metros, with a total of $9.6 billion in the first half of the year, or 13.4% of the $72 billion U.S. total. Most of the top metros for multifamily investment, however, were non-gateway markets, including Miami/South Florida, Denver, Dallas/Ft. Worth, Atlanta and Phoenix.
CBRE CAP RATE SURVEY REVEALS STABLE CAP
RATE ENVIRONMENT
U.S. multifamily cap rates averaged 5.26% for stabilized infill assets and 5.67% for suburban assets, according to CBRE North America Cap Rate Survey, H1 2016. Multifamily rates were largely unchanged from the H2 2015 survey. The only notable national rate change was the 9-bp
Market SubmarketMultifamily Subtype
Asking Rent ($/SF/PM)
Average Annual Rent Growth Underwriting
First 3 Years (%)Unlevered IRR
Target (%)Going-in
Cap Rate (%)Exit
Cap Rate (%)Holding Period
(Years)Boston Downtown High Rise 4.86 3.0 5.75 4.00 4.75 7 - 10Los Angeles West Los Angeles Mid Rise 4.53 5.0 6.00 3.25 4.75 5 - 7San Francisco South of Market Mid Rise 5.00 3.0 6.00 4.00 5.00 10Seattle Downtown Mid Rise 3.75 4.0 6.00 4.25 5.00 10Washington, D.C. West End High Rise 4.50 4.1 6.00 4.25 4.50 - 4.75 5 - 7Dallas Intown Dallas High Rise 3.10 3.5 6.00 - 6.25 4.00 - 4.50 4.75 - 5.25 5 - 7Miami Downtown/Brickell High Rise 3.00 3.0 6.00 - 6.25 4.00 - 4.50 5.00 - 5.25 7 - 10Austin Downtown High Rise 3.40 3.5 6.00 - 6.25 4.25 5.00 - 5.25 10Chicago River North High Rise 3.60 3.0 6.00 - 6.25 4.25 - 4.75 5.25 10Atlanta Midtown High Rise 2.75 3.5 6.25 4.25 5.25 7New York Manhattan High Rise 5.80 3.0 6.50 4.25 4.75 10Denver Downtown High Rise 2.80 3.0 6.50 4.50 5.25 7 - 10Phoenix South Scottsdale Mid Rise 2.30 4.0 6.50 4.75 5.50 10Houston Inner Loop W/Greenway Plaza High Rise 2.46 2.5 6.25 - 7.25 4.75 - 5.25 5.25 - 5.75 7 - 10Average 3.61 3.5 6.20 4.27 5.06 8.5
Figure 13: Buyer Valuation Underwriting Survey for Prime Class A Multifamily Assets: Ranked by IRR Target and Cap Rate
Source: CBRE Research, Q2 2016. The “prime” statistics displayed above are estimates of current buyer underwriting assumptions for the highest quality asset in the best location of a particular market. The quoted prime rents reflect the level at which top-tier relevant transactions are being completed. Estimates are based on the expert opinion of CBRE brokers that handle deals in these particular markets.
Q2 2016 CBRE Research © 2016 CBRE, Inc. | 9
MARKETVIEW U.S. MULTIFAMILY
down more than 2 percentage points from 2015’s 12%. Garden product is outperforming high-rise: 12.4% vs. 8.3%.
Multifamily quarterly investment returns in H1 2016 averaged 1.9%, down from the 2015 average of 2.9%.
Many metros are still performing well despite the fact that lower returns were reported for all but one (Tampa) for the year ending Q2 2016. Returns were highest in Portland (17.2%), followed by Denver (16.3%), the Inland Empire (16.2%) and Orlando (15.3%).
DEBT CAPITAL MARKETS REMAIN ACTIVE AND HEALTHY
The debt side of capital markets remains highly active in the multifamily sector. Multifamily lending rebounded in Q2, according to the Mortgage Bankers Association’s Quarterly Survey of
drop for Class C suburban assets. Cap rates in San Francisco and Los Angeles were the lowest in the country at 3.75% for Class A infill product and 4% for suburban.
CPPI REACHES NEW HIGH IN JUNE
One measure of multifamily property pricing is repeat property sales, which is the basis of the Moody’s/RCA Commercial Property Price Index. The CPPI reached a new record high of 267 in June 2016, up 5.4% over March 2016 and 14.3% year-over-year. Multifamily had the largest price gain of all asset classes.
RCA reported that the Q2 2016 average multifamily unit sales price was $144,100, up 16.2% from the prior year. Double-digit gains were achieved in both of RCA’s principal categories: garden and mid- and high-rise apartments. The year-over-year change may overstate the strength of the market today since most of the increase occurred in the second half of 2015. From Q4 2016, the average sales price of garden assets rose 4.5% while the average for mid- and high-rise fell 3.4%.
INVESTMENT RETURNS DECREASE
Investment performance by institutionally owned multifamily properties approached the sector’s long-term average in Q2 2016, according to NCREIF. For the year ending Q2 2016, the return was 9.7% (appreciation 4.9%, income 4.7%),
Figure 14: U.S. Multifamily Acquisitions Volume
Source: CBRE Research, Real Capital Analytics, Q2 2016. Some numbers may not total due to rounding.
Total ($ billions) Change (%)Current Quarter Q2 2015 Q2 2016Individual Assets 25.3 27.1 7.1Portfolios 5.8 6.7 16.4Entity-Level 0.0 0.0 -Total 31.1 33.8 8.9Year-to-Date - July 2015 2016Individual Assets 59.9 58.8 -1.8Portfolios 14.2 19.2 35.3Entity-Level 3.0 3.2 4.3Total 77.1 81.1 5.3
Figure 15: U.S. Multifamily Investment Sales Volume and Cap Rates
40
50
60
7.0
7.5
5.0
6.0
6.5
5.5
4.5
30
10
20
0
Transaction Volume ($ Billions) Cap Rate (%)Individual Asset Sales (L) Portfolios (L) Entity-Level (L) Cap Rates (R)
Source: CBRE Research, Real Capital Analytics, Q2 2016.
Q2 20
06
Q2 20
08
Q2 20
07
Q2 20
09
Q2 20
10
Q2 20
11
Q2 20
12
Q2 20
13
Q2 20
16
Q2 20
15
Q2 20
14

Q2 2016 CBRE Research © 2016 CBRE, Inc. | 10
MARKETVIEW U.S. MULTIFAMILY
Commercial/Multifamily Mortgage Bankers Originations. The Q2 2016 index reflected an 18.1% gain over Q1 2016, but was down by 1.3% from a year ago.
Combined mortgage production volumes of Fannie Mae and Freddie Mac totaled $19.6 billion in Q2, down from $30.1 billion in the previous quarter and from $27.9 billion in the same quarter a year ago.
Even though agency Q2 mortgage production volumes eased off from prior months, the year-to-date (through July) total of $59.2 billion is still robust and puts them on pace to exceed $100 billion this year (for both capped and uncapped production).
In CMBS, multifamily recorded a tepid Q2 with less than $3 billion in issuance. For H1 2016, multifamily CMBS issuance is down 15% compared to this time last year. All other property sectors experienced much larger year-over-year declines. There are indicators that the CMBS market is regaining some momentum, so multifamily issuance in the second half of the year has a good chance of exceeding that of the first half.
For life insurance companies, multifamily mortgage production rose considerably in Q2 compared to the prior year. Multifamily was the
most active property sector for life company lending, slightly ahead of office.
Banks are assuming a much more active role in financing all types of real estate, including multifamily. Although new production volumes are not available, FDIC totals for multifamily mortgages held by banks can provide a baseline for mortgage production. For loans secured by existing multifamily assets, bank holdings rose by $13 billion in Q2 2016, compared to the $10 billion increase a year ago. The net changes in total holdings include new mortgages less paydowns and payoffs.
Construction loans are not included in the $13 billion increase of existing multifamily loans shown
Figure 16: Leading Metros for Multifamily Investment, H1 2016
Source: Real Capital Analytics, CBRE Research, Q2 2016. Total include entity-level acquisitions. *Los Angeles includes Orange County and Inland Empire.
Rank
Metro
Acquisitions ($ billions)
Market Share (%)Metro Cumulative
1 New York City 9.6 13.4 13.42 Los Angeles* 5.1 7.1 20.43 Miami/South Florida 4.4 6.1 26.54 Denver 3.8 5.3 31.85 Dallas/Ft. Worth 3.5 4.8 36.66 Atlanta 3.0 4.2 40.87 Phoenix 2.6 3.5 44.38 San Francisco Bay Area 2.4 3.4 47.79 Washington, D.C. 2.4 3.4 51.110 Houston 2.1 2.9 54.011 Austin 2.0 2.8 56.812 Seattle 2.0 2.8 59.513 Chicago 1.9 2.7 62.2
Figure 17: Multifamily Cap Rates, H1 2016
Source: CBRE North America Cap Rate Survey H1 2016. Cap rates for stabilized assets. *10-year Treasury at end of H1 2016 (1.49%).
Sector ClassH1 2016
(%)Change from H2
2015 (bps)Spread Over
10-Year Treasury*
Infill
ALL 5.26 0 377A 4.60 3 311B 5.15 -1 366C 6.06 -3 457
Suburban
ALL 5.67 -3 418A 5.00 2 351B 5.52 -3 403C 6.48 -9 499
300
250
200
150
50
100
0
Jun-
06
Jun-
08
Jun-
10
Jun-
12
Jun-
16
Jun-
14
Figure 18: U.S. Multifamily Sales Price Index
Source: Real Capital Analytics, Moody’s Investors Services, CBRE Research, Q2 2016. Monthly data. Index = December 2000.
Multifamily All Property

Q2 2016 CBRE Research © 2016 CBRE, Inc. | 11
MARKETVIEW U.S. MULTIFAMILY
in Figure 20, but banks have been very active players in multifamily construction financing. In Q2 2016 alone, banks increased their total holdings of commercial real estate and land development loans by $9.9 billion.
Despite these gains, there is extensive evidence that construction financing for multifamily development is becoming harder to obtain and more costly. By all accounts, banks are becoming more selective on who they will provide construction financing. Loan-to-value ratios are falling, and loan terms are becoming more restrictive.
The Federal Reserve Bank’s quarterly Senior Loan Officer Opinion Survey on Bank Lending Practices found that 34.3% of loan officers reported tighter standards for construction and land development loans in Q2. The tightening was most pronounced in the large banks, 46.3% of which reported tightening vs. 17.2% in small and medium-sized banks.
MULTIFAMILY DELINQUENCIES REMAIN VERY
LOW
Mortgage delinquency rates remain very low and favorable for multifamily loans. As of June 2016, the multifamily 60+ day delinquency rates for Fannie Mae and Freddie Mac were 0.07% and
0.02%, respectively. Both rates are relatively stable. In Q1 2016, the latest data available, life insurance companies reported a similarly low delinquency of 0.06%. For banks, the FDIC reported that Q2 2016 30+ day delinquency rates on multifamily loans represented only 0.33% of the total loan balance—a 16-bps improvement over the prior year.
Figure 20: U.S. Multifamily Mortgage Production
Source: CBRE Research, Commercial Mortgage Alert, Fannie Mae, Freddie Mac, American Council for Life Insurers, Federal Deposit Insurance Corporation, Q2 2016. *Bank data are net changes in total existing multifamily loan holdings and thereby underrepresent new mortgage production. Some numbers may not total due to rounding.
Lending Source Period
Total ($ Billions) Change (%)2015 2016
Current QuarterCMBS Q2 4.3 3.3 -23.6Fannie Mae Q2 14.7 10.2 -30.6Freddie Mac Q2 13.2 9.4 -28.8Life Insurance Companies Q2 4.1 5.4 33.4Banks* Q2 9.9 13.1 32.3Total 27.2 27.9 2.8Year-to-DateCMBS H1 7.3 6.2 -15.2Fannie Mae through July 28.4 28.6 0.7Freddie Mac through July 27.4 30.6 11.7Life Insurance Companies H1 6.3 10.2 62.3Banks* Q1 17.8 21.1 18.5Total 51.5 61.9 20.3
Figure 19: Institutional Multifamily Returns for Major MarketsYear Ending Q2 2016 (%) Income Appreciation Total
Source: CBRE Research, NCREIF, Q2 2016. All returns are reported on an unlevered basis.
-5
20
5
10
15
0
Portla
nd
Denv
er
Inlan
d Emp
ire
Orlan
do
Oran
ge Co
unty
W. Pa
lm Be
ach
Tamp
a
San D
iego
Seatt
le
Los A
ngele
s
Phoe
nix
Ft. La
uderd
ale
Atlan
ta
Bosto
n-Ca
mbrid
ge
Dalla
s
Austi
n
New
York
Chica
go
Minn
eapo
lis
Wash
ington
, D.C.
Baltim
ore
Hous
ton
U.S.
- Gard
en
U.S.
- Low
-Rise U.S.
U.S.
- High
-Rise

Q2 2016 CBRE Research © 2016 CBRE, Inc. | 12
MARKETVIEW U.S. MULTIFAMILY
In the CMBS world, the 30+ day multifamily delinquency level was 0.58% in July 2016. Multifamily, by far, has the lowest CMBS delinquency rate among major property types and is not considered at any particular risk from the “wall of maturities” —the 2006-07 vintage loans maturing this year.
MARKET OUTLOOK
NEAR-TERM OUTLOOK STILL FAVORABLE, BUT
RENT APPRECIATION TO SLOW
The outlook for the multifamily market remains favorable, but some cooling is expected. The sector has a robust development pipeline. Even in a climate of sustained strong demand, the high level of deliveries will outpace net absorption, temper rent growth and moderately increase vacancy levels.
CBRE EA forecasts net absorption to decline in 2016 to 171,000 units. Deliveries are projected to reach 275,000 units. As a consequence, the vacancy rate for 2016 is expected to increase by 20 bps to 4.7% from 2015’s rate. In 2017, due to continued imbalance between new supply and net absorption, CBRE EA projects vacancy will rise to 5.5%. Rental growth for full-year 2016 is projected at 3.5%, slightly ahead of the Q2 2016 year-over-year level. The conservative outlook for rental growth in 2017
is 1.1%; however, the upside projection of 2.5% growth is more likely.
By 2018, new apartment deliveries should subside to a much more sustainable level, and that will go far to ease the temporary market imbalances of 2016 and 2017.
While the short-term outlook includes some cooling in multifamily performance, there is no question that the long-term demand outlook is favorable due to many lifestyle changes in American society that favor rental living vs. homeownership. These include urban location preferences for households of all ages, including retiring baby boomers, millennials who are transitioning into homeownership later than preceding generations, and the still large number of younger millennials in their early 20s just coming into the rental marketplace.
Figure 22: U.S. Annual Completions vs. Net Absorption (Units)
Source: CBRE Research, CBRE Econometric Advisors, Q2 2016. *Baseline forecasts. Note: Under the upside forecasts, the net absorption outlook in 2016 is 176,419 units and 180,113 units in 2017. Deliveries are essentially the same under both the baseline and upside scenarios.
2013 2014 2015 2016* 2017*
Completions 128,942 190,202 203,866 275,335 224,939
Net Absorption 119,904 240,915 194,223 171,297 151,061
Forecast
Figure 21: U.S. Multifamily Outlook
300
400
65
87
1
34
2
-10
200
0
100
-100
Units (000s) (%)Completions (L) Net Absorption (L) Vacancy (R)
Source: CBRE Research, CBRE Econometric Advisors, Q2 2016. *Forecasts.
2006
2008
2007
2009
2010
2011
2012
2013
2017
2015
2016
2014

Q2 2016 CBRE Research © 2016 CBRE, Inc. | 13
MARKETVIEW U.S. MULTIFAMILY
Inventory Rank Market
Total Inventory (Units)
New Supply Previous 4 Quarters (Units)
Net Absorption Previous
4 Quarters (Units)
Vacancy Rental Rate
Rate (%) Y-o-Y (bps)
Per Sq. Ft. (2000s
Product)
Average Mo. Rent
($ Per Unit)Y-o-Y
Change (%)1 New York 1,886,178 25,026 20,372 3.1 30 3.79 3,018 0.52 Los Angeles 1,062,626 6,593 2,199 4.2 40 2.78 2,241 4.93 Chicago 700,819 4,308 2,378 4.4 20 2.13 1,563 5.84 Dallas/Ft. Worth 650,215 9,771 11,093 4.3 -27 1.36 1,086 6.65 Houston 588,401 12,389 5,053 6.4 120 1.29 1,080 -0.16 Miami/South Florida 558,751 10,403 7,128 4.4 55 1.70 1,599 4.87 Washington, D.C. 550,337 9,291 10,241 4.4 -20 2.18 1,686 2.88 Boston 460,281 8,250 5,807 4.1 40 2.57 2,272 5.69 Atlanta 412,603 7,962 7,254 5.3 0 1.17 1,085 5.7
10 Seattle 348,798 9,815 10,233 3.7 -20 2.13 1,712 8.011 Phoenix 335,490 7,618 7,930 5.1 -20 1.15 950 7.712 Philadelphia 295,268 3,732 3,986 4.4 -20 1.78 1,363 2.013 San Diego 292,118 2,299 2,439 3.9 -10 2.17 1,913 7.014 Denver 286,797 8,981 5,530 5.0 110 1.64 1,403 4.215 Minneapolis 253,644 4,530 5,540 3.0 -50 1.56 1,328 0.216 Detroit 249,350 1,921 4,197 3.1 -90 1.30 958 3.517 Orange County 232,693 3,030 3,332 4.0 -20 2.36 2,012 5.018 Tampa 225,639 3,855 3,528 4.5 0 1.24 1,107 7.319 San Francisco 218,133 2,927 1,996 4.3 40 4.23 3,233 2.020 Cleveland 200,421 1,287 2,345 3.7 -60 1.06 915 0.021 Oakland 198,132 745 316 3.7 20 2.99 2,392 5.122 Baltimore 196,619 1,880 1,380 4.8 20 1.58 1,295 1.923 Austin 192,575 9,333 8,966 4.9 0 1.44 1,204 5.624 Orlando 187,953 6,808 7,021 4.2 -20 1.25 1,139 6.425 Portland 180,784 3,900 1,701 4.3 110 1.69 1,393 7.126 Las Vegas 168,991 2,702 2,898 5.4 -20 1.05 914 6.027 Newark 166,462 1,728 2,804 2.9 -70 2.16 1,748 2.828 Riverside 163,707 1,653 1,223 4.4 30 1.66 1,465 7.129 San Jose 150,906 921 -438 4.5 90 3.24 2,790 2.430 San Antonio 150,617 6,885 6,129 6.0 20 1.20 916 2.031 Cincinnati 150,137 1,830 2,474 4.3 -50 1.14 942 4.832 Columbus 149,415 3,604 3,316 4.1 10 1.07 861 4.333 Charlotte 140,756 6,199 6,618 4.1 -50 1.15 1,025 5.434 Indianapolis 139,357 2,762 2,633 6.2 0 1.04 821 4.435 Kansas City 128,166 3,761 4,091 4.3 -40 1.07 930 3.336 St. Louis 128,115 1,333 1,229 6.0 0 1.25 970 6.537 Sacramento 127,118 282 253 3.6 0 1.57 1,349 8.738 Raleigh 126,969 3,916 3,839 5.1 -10 1.11 1,024 4.939 Nashville 120,304 4,627 4,656 3.9 -20 1.30 1,139 7.940 Norfolk 114,515 1,338 2,559 5.7 -120 1.29 1,043 2.241 Pittsburgh 106,497 2,157 -47 6.4 200 1.50 1,273 -0.742 Providence 99,142 183 894 2.7 -70 1.75 1,455 5.643 Jacksonville 88,170 1,462 1,428 5.2 -10 1.09 980 4.844 Salt Lake City 86,675 2,135 2,551 3.9 -50 1.25 1,019 7.145 Memphis 85,139 699 1,062 5.9 -50 0.98 826 2.3
U.S.* 14,279,268 228,985 201,809 4.4 10 1.59 1,670 3.3
Figure 23: Multifamily Fundamentals for the 45 Largest U.S. Markets, Q2 2016
Source: CBRE Research, CBRE Econometric Advisors, Axiometrics Inc., Q2 2016. Markets ranked by inventory size. *U.S. represents sum of all markets tracked by CBRE EA.
Q2 2016 CBRE Research © 2016 CBRE, Inc. | 14
MARKETVIEW U.S. MULTIFAMILY
MARKET SPOTLIGHT
DALLAS/FT. WORTH STEALS THE SPOTLIGHT FOR
SUPERIOR MARKET PERFORMANCE
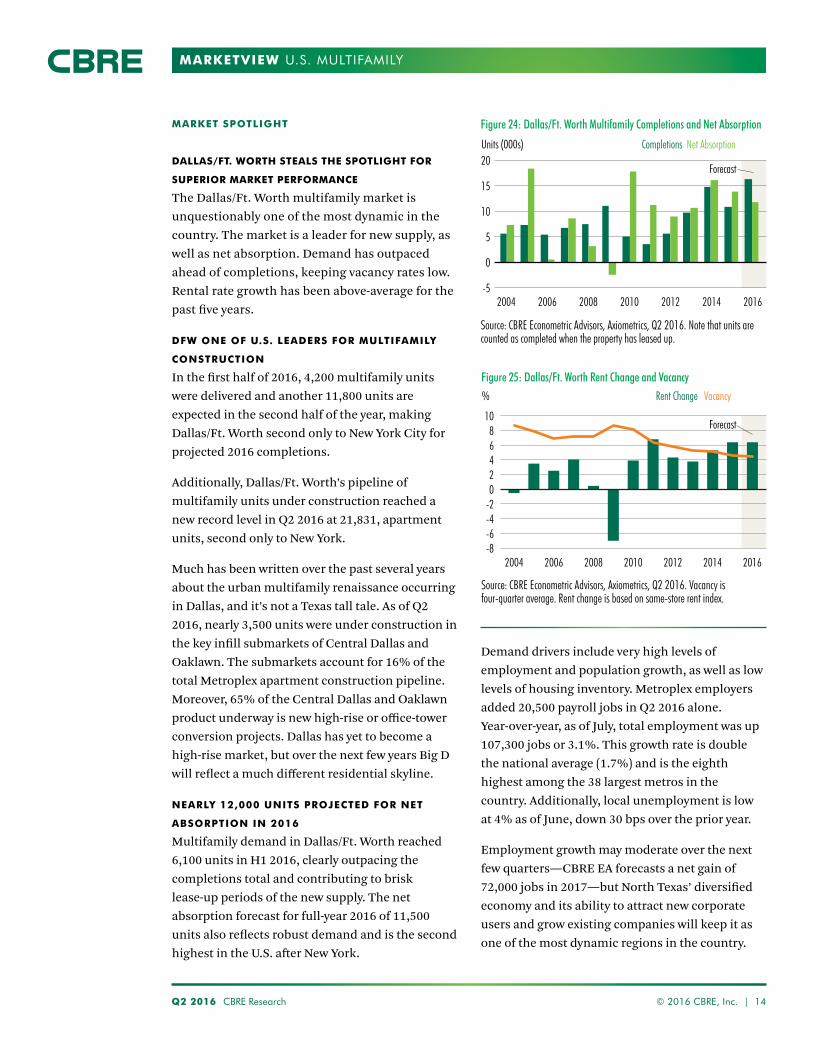
The Dallas/Ft. Worth multifamily market is unquestionably one of the most dynamic in the country. The market is a leader for new supply, as well as net absorption. Demand has outpaced ahead of completions, keeping vacancy rates low. Rental rate growth has been above-average for the past five years.
DFW ONE OF U.S. LEADERS FOR MULTIFAMILY
CONSTRUCTION
In the first half of 2016, 4,200 multifamily units were delivered and another 11,800 units are expected in the second half of the year, making Dallas/Ft. Worth second only to New York City for projected 2016 completions.
Additionally, Dallas/Ft. Worth’s pipeline of multifamily units under construction reached a new record level in Q2 2016 at 21,831, apartment units, second only to New York.
Much has been written over the past several years about the urban multifamily renaissance occurring in Dallas, and it’s not a Texas tall tale. As of Q2 2016, nearly 3,500 units were under construction in the key infill submarkets of Central Dallas and Oaklawn. The submarkets account for 16% of the total Metroplex apartment construction pipeline. Moreover, 65% of the Central Dallas and Oaklawn product underway is new high-rise or office-tower conversion projects. Dallas has yet to become a high-rise market, but over the next few years Big D will reflect a much different residential skyline.
NEARLY 12,000 UNITS PROJECTED FOR NET
ABSORPTION IN 2016
Multifamily demand in Dallas/Ft. Worth reached 6,100 units in H1 2016, clearly outpacing the completions total and contributing to brisk lease-up periods of the new supply. The net absorption forecast for full-year 2016 of 11,500 units also reflects robust demand and is the second highest in the U.S. after New York.
Demand drivers include very high levels of employment and population growth, as well as low levels of housing inventory. Metroplex employers added 20,500 payroll jobs in Q2 2016 alone. Year-over-year, as of July, total employment was up 107,300 jobs or 3.1%. This growth rate is double the national average (1.7%) and is the eighth highest among the 38 largest metros in the country. Additionally, local unemployment is low at 4% as of June, down 30 bps over the prior year.
Employment growth may moderate over the next few quarters—CBRE EA forecasts a net gain of 72,000 jobs in 2017—but North Texas’ diversified economy and its ability to attract new corporate users and grow existing companies will keep it as one of the most dynamic regions in the country.
Forecast
Figure 24: Dallas/Ft. Worth Multifamily Completions and Net Absorption
Source: CBRE Econometric Advisors, Axiometrics, Q2 2016. Note that units are counted as completed when the property has leased up.
Units (000s) Completions Net Absorption
10
15
20
-5
0
5
2004 2006 2010 20142008 2012 2016
Figure 25: Dallas/Ft. Worth Rent Change and Vacancy
Source: CBRE Econometric Advisors, Axiometrics, Q2 2016. Vacancy is four-quarter average. Rent change is based on same-store rent index.
%
2004 2008 20122006 2010 20162014
108
-8
-4
0
-6
-2
2
64
Rent Change Vacancy
Forecast
Q2 2016 CBRE Research © 2016 CBRE, Inc. | 15
MARKETVIEW U.S. MULTIFAMILY
METROPLEX MAINTAINS FAVORABLE RENT
GROWTH AND VACANCY
The healthy market conditions, including quick absorption of new product, are reflected in vacancy and rent trends over the past few years. As of Q2, the Dallas/Ft. Worth vacancy rate stood at 4.3%, down 20 bps from the same period last year and on par with the national average rate of 4.4%.
CBRE EA forecasts a modest uptick in vacancy beginning in Q4 2016 and continuing into 2017 as a result of the large supply of new inventory over the next few quarters and a slightly muted demand outlook. The Q2 2017 forecast is for a vacancy rate of 4.7%.
Between 2010 and 2015, annual rent growth averaged a very healthy 5.1%—more than double the historical (1995-2015) level of 2.2%. For the year ending Q2 2016, Dallas/Ft. Worth rents rose 6.9%. Rental appreciation is expected to remain healthy over the next year, but moderate from the current level. CBRE EA projects rent growth to average about 3.6% for the year ending Q2 2017.
With 7.1 million residents (2015 Census estimate), Dallas/Ft. Worth is the fourth-largest metropolitan area in the U.S. Moreover, the metro ranked second in the country for total population growth in 2015, adding 145,000 residents for a 2.1% increase—more than double the U.S. rate. Dallas/Ft. Worth is projected to add 762,000 residents between 2015 and 2020. A large percentage of the new residents are in-migrants and will contribute significantly to apartment demand.
The region’s single-family housing market is challenging for would-be buyers and keeping many within the multifamily rental market. These challenges include a tight for-sale housing inventory (only 2.8 months’ worth of supply in June), an even more limited supply of available mid-priced single-family homes of $250,000 or less (less than two months’ supply), rapidly rising home prices (June’s median sales price rose 8.8% over the prior year to $236,000, according to North Texas Real Estate Information Systems), and strict lending requirements for borrowers.

MARKETVIEW U.S. MULTIFAMILY
Disclaimer: Information contained herein, including projections, has been obtained from sources believed to be reliable. While we do not doubt its accuracy, we have not verified it and make no guarantee warrant or representation about it. It is our responsibilit to confirm independentl its accurac and completeness. This information is presented exclusively for use by CBRE clients and professionals and all rights to the material are reserved and cannot be reproduced without prior written permission of CBRE.
Spencer G. Levy Americas Head of Research +1 617 912 5236 [email protected] Follow Spencer on Twitter: @SpencerGLevyFollow Spencer on Linkedin: LinkedIn
Jeanette I. Rice, CRE Americas Head of Investment Research +1 214 979 6169 [email protected] Follow Jeanette on Twitter: @RiceJeanette
Quinn EddinsDirector, Research and Analysis+1 305 428 [email protected]
Jeffrey HavsyAmericas Chief Economist+1 617 912 [email protected]
Matt VanceEconomist+1 617 912 [email protected]
FOR MORE INFORMATION, PLEASE CONTACT:
CAPITAL MARKETS
Brian McAuliffePresidentCapital Markets, Institutional Properties+1 312 935 [email protected] Jeff MajewskiExecutive Managing DirectorHead of Production, AmericasCapital Markets+1 713 787 [email protected]
CAPITAL MARKETS - MULTIFAMILY
Christine AkinsSenior Managing DirectorCapital Markets, Multifamily Investment Sales+1 321 861 [email protected]
Peter DonovanExecutive Managing DirectorCapital Markets, Multifamily+1 617 217 [email protected] Colleen Pentland LallyDirector, Capital Markets OperationsCapital Markets, Multifamily+1 617 217 [email protected]
To learn more about CBRE Research, or to access additional research reports, please visit the Global Research Gateway at www.cbre.com/researchgateway.
Additional U.S. research reports from CBRE can be found here.