u.s. insurance industry outlook trends to look out for · u.s. insurance industry outlook trends to...
TRANSCRIPT
0Presented at St. John’s University SRM October 30, 2013Copyright © 2013 Conning, Inc.
Presented by
Stephan Christiansen, FCAS, MAAAManaging Director
U.S. Insurance Industry OutlookTrends to Look Out For
Placeholder for Head Shot if desired
1Presented at St. John’s University SRM October 30, 2013Copyright © 2013 Conning, Inc.
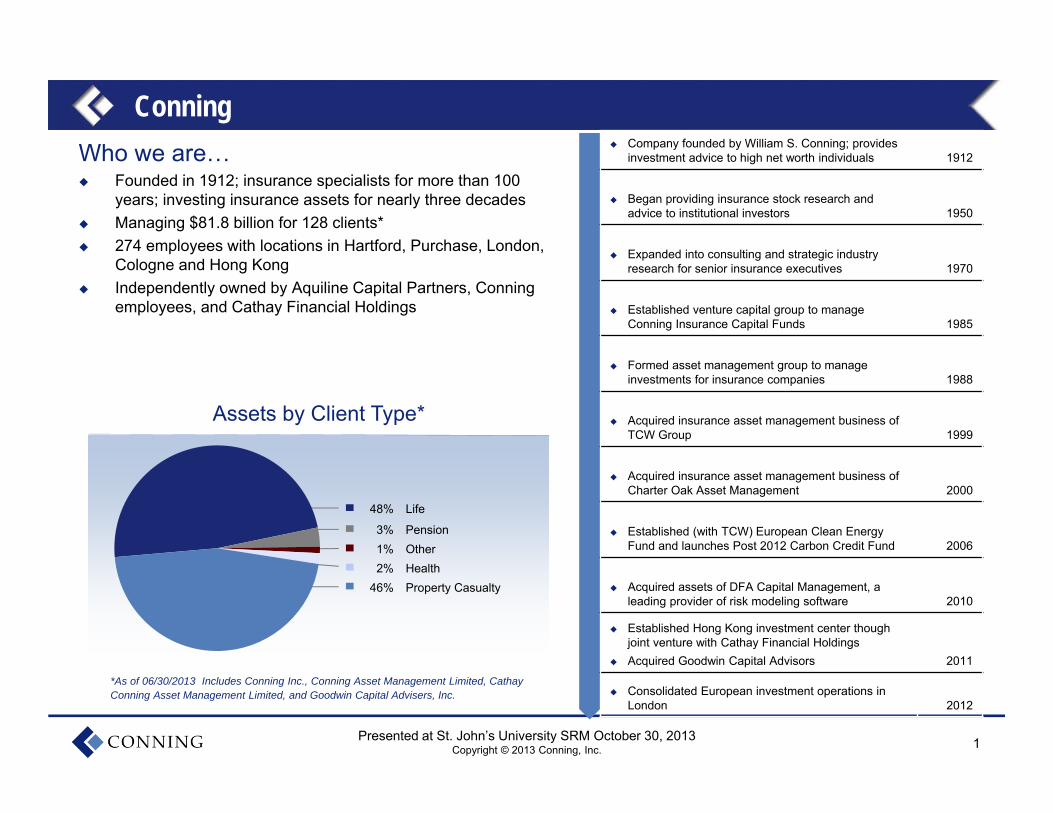
Who we are… Founded in 1912; insurance specialists for more than 100
years; investing insurance assets for nearly three decades Managing $81.8 billion for 128 clients* 274 employees with locations in Hartford, Purchase, London,
Cologne and Hong Kong Independently owned by Aquiline Capital Partners, Conning
employees, and Cathay Financial Holdings
Conning
*As of 06/30/2013 Includes Conning Inc., Conning Asset Management Limited, Cathay Conning Asset Management Limited, and Goodwin Capital Advisers, Inc.
Company founded by William S. Conning; provides investment advice to high net worth individuals 1912
Began providing insurance stock research and advice to institutional investors 1950
Expanded into consulting and strategic industry research for senior insurance executives 1970
Established venture capital group to manage Conning Insurance Capital Funds 1985
Formed asset management group to manage investments for insurance companies 1988
Acquired insurance asset management business of TCW Group 1999
Acquired insurance asset management business of Charter Oak Asset Management 2000
Established (with TCW) European Clean Energy Fund and launches Post 2012 Carbon Credit Fund 2006
Acquired assets of DFA Capital Management, a leading provider of risk modeling software 2010
Established Hong Kong investment center though joint venture with Cathay Financial Holdings
Acquired Goodwin Capital Advisors 2011
Consolidated European investment operations in London 2012
48% Life
3% Pension1% Other2% Health
46% Property Casualty
Assets by Client Type*
2Presented at St. John’s University SRM October 30, 2013Copyright © 2013 Conning, Inc.
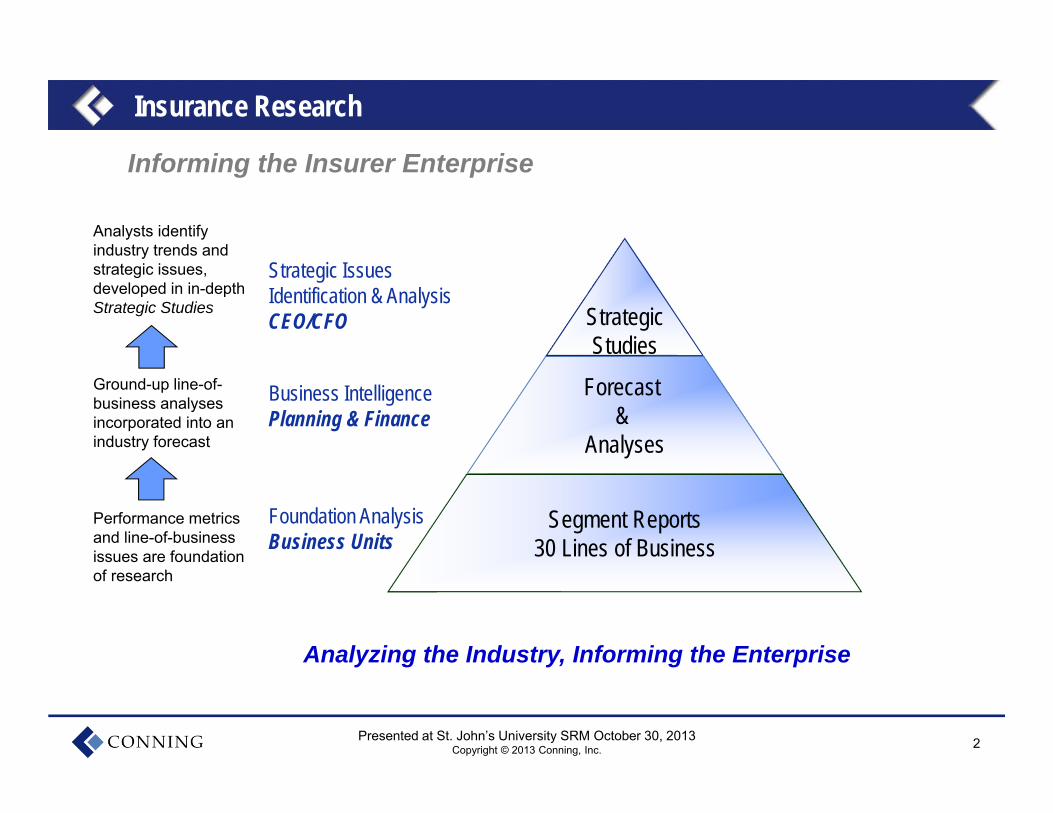
Insurance Research
Analysts identify industry trends and strategic issues, developed in in-depth Strategic Studies
Ground-up line-of-business analyses incorporated into an industry forecast
Performance metrics and line-of-business issues are foundation of research
Informing the Insurer Enterprise
StrategicStudies
Forecast &
Analyses
Segment Reports30 Lines of Business
Business IntelligencePlanning & Finance
Strategic Issues Identification & AnalysisCEO/CFO
Foundation AnalysisBusiness Units
Analyzing the Industry, Informing the Enterprise
3Presented at St. John’s University SRM October 30, 2013Copyright © 2013 Conning, Inc.
Insurance Research
Projects in Support of Client Strategic Planning Proprietary Executive Surveys and Analysis Peer Analyses
Business Development Support Quantitative Analysis of Market Segments Acquisition Target Identification Detailed Company Analyses
State-Level Premium Forecasting Analysis of State Regulatory Environment Review of State-Level Drivers and Indicators Premium History and Forecast by Segment by State
Proprietary Research and Strategic Advisory
4Presented at St. John’s University SRM October 30, 2013Copyright © 2013 Conning, Inc.
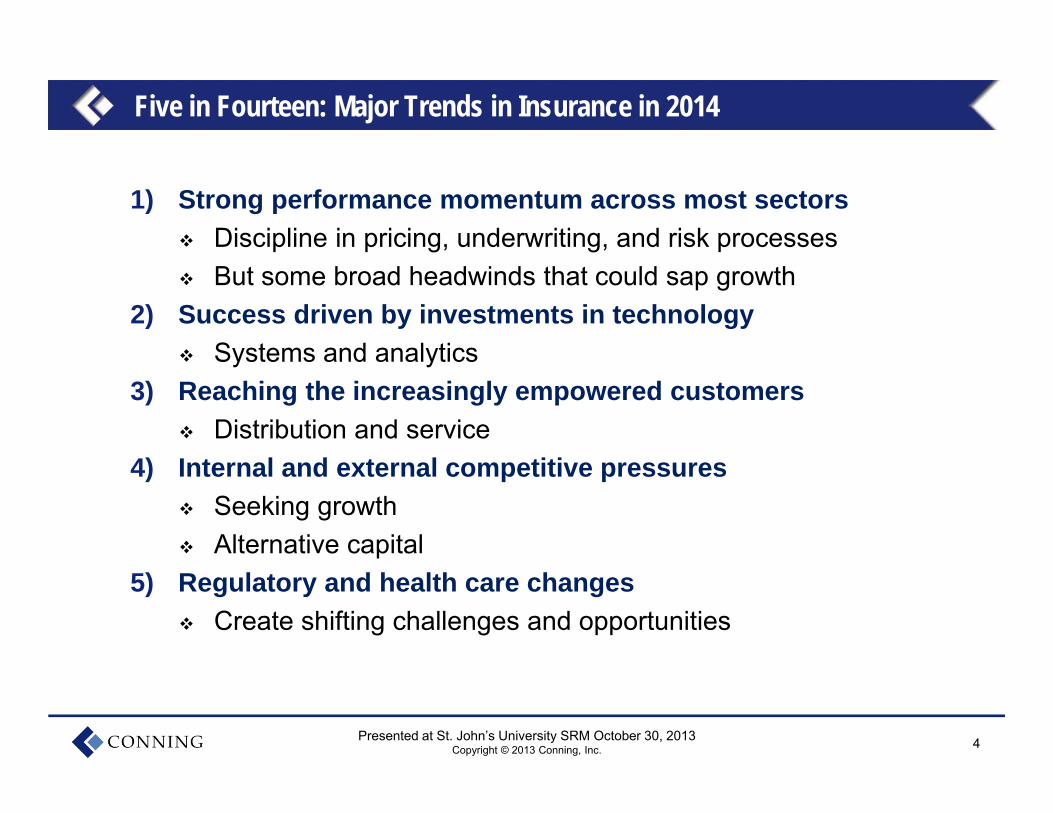
Five in Fourteen: Major Trends in Insurance in 2014
1) Strong performance momentum across most sectors Discipline in pricing, underwriting, and risk processes But some broad headwinds that could sap growth
2) Success driven by investments in technology Systems and analytics
3) Reaching the increasingly empowered customers Distribution and service
4) Internal and external competitive pressures Seeking growth Alternative capital
5) Regulatory and health care changes Create shifting challenges and opportunities
5Presented at St. John’s University SRM October 30, 2013Copyright © 2013 Conning, Inc.
Strong Performance Heading Into 2014
Discipline in pricing, underwriting, and risk processes
But some broad headwinds that could sap growth
6Presented at St. John’s University SRM October 30, 2013Copyright © 2013 Conning, Inc.
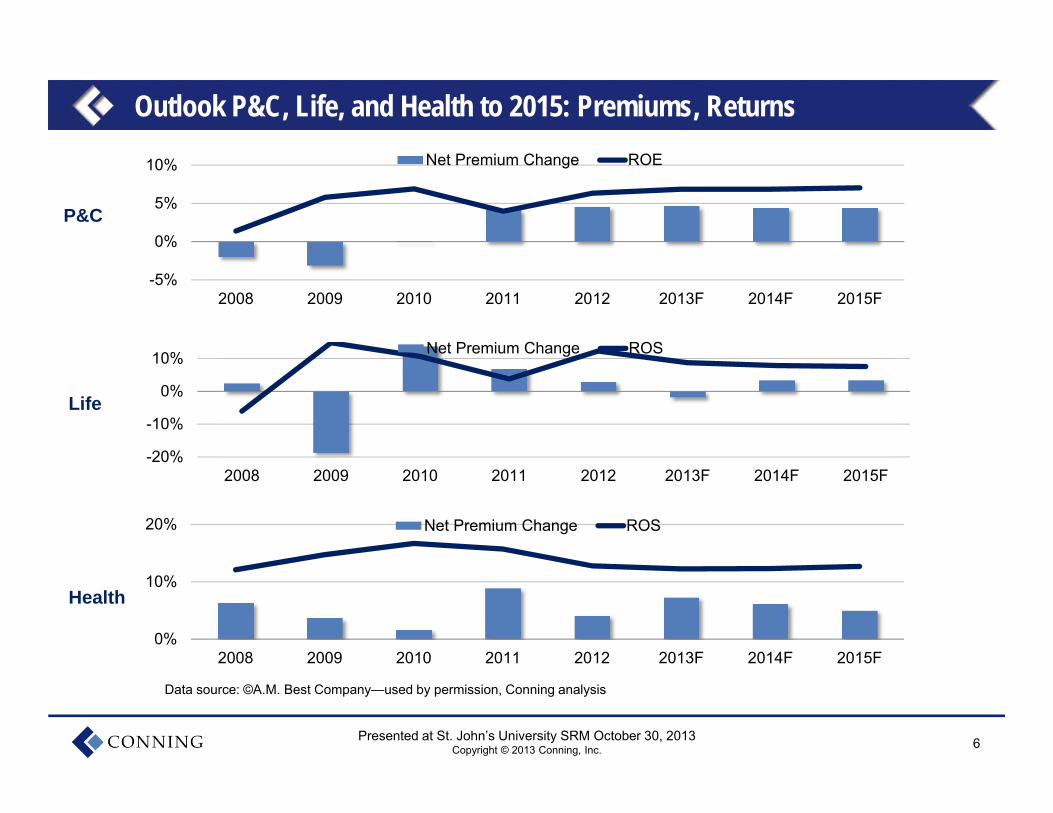
Outlook P&C, Life, and Health to 2015: Premiums, Returns
-5%
0%
5%
10%
2008 2009 2010 2011 2012 2013F 2014F 2015F
Net Premium Change ROE
P&C
Life
Health
-20%
-10%
0%
10%
2008 2009 2010 2011 2012 2013F 2014F 2015F
Net Premium Change ROS
0%
10%
20%
2008 2009 2010 2011 2012 2013F 2014F 2015F
Net Premium Change ROS
Data source: ©A.M. Best Company—used by permission, Conning analysis
7Presented at St. John’s University SRM October 30, 2013Copyright © 2013 Conning, Inc.
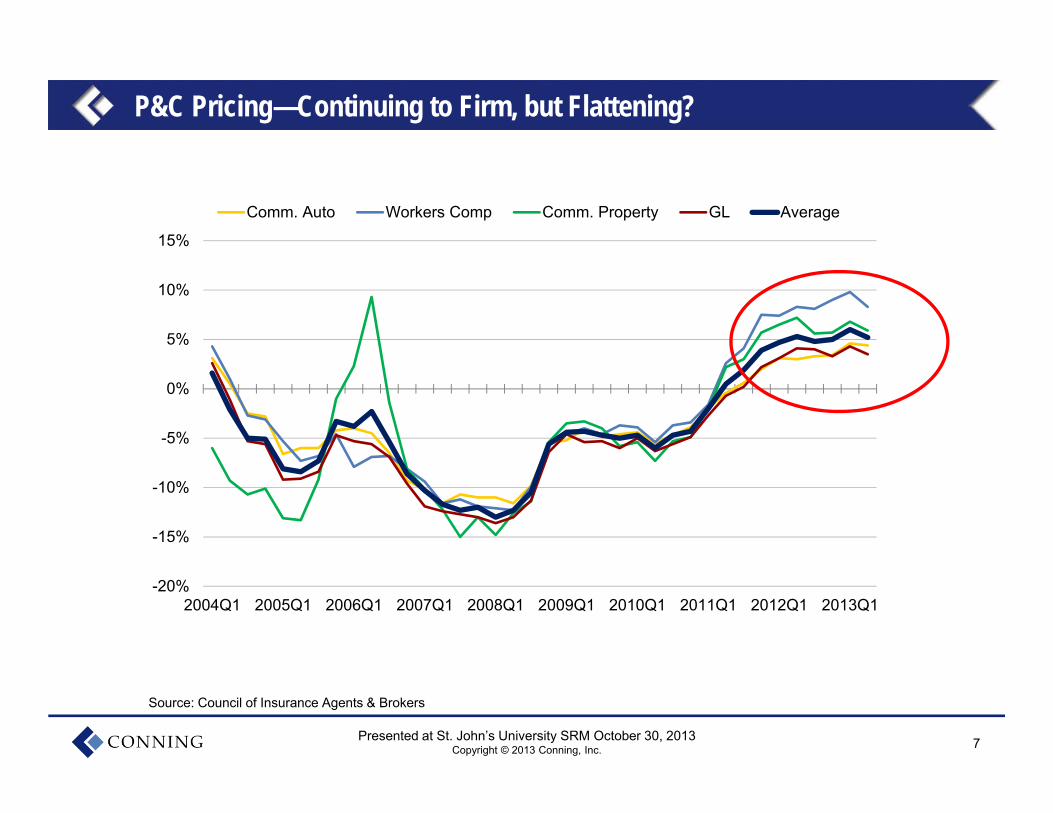
P&C Pricing—Continuing to Firm, but Flattening?
-20%
-15%
-10%
-5%
0%
5%
10%
15%
2004Q1 2005Q1 2006Q1 2007Q1 2008Q1 2009Q1 2010Q1 2011Q1 2012Q1 2013Q1
Comm. Auto Workers Comp Comm. Property GL Average
Source: Council of Insurance Agents & Brokers
8Presented at St. John’s University SRM October 30, 2013Copyright © 2013 Conning, Inc.
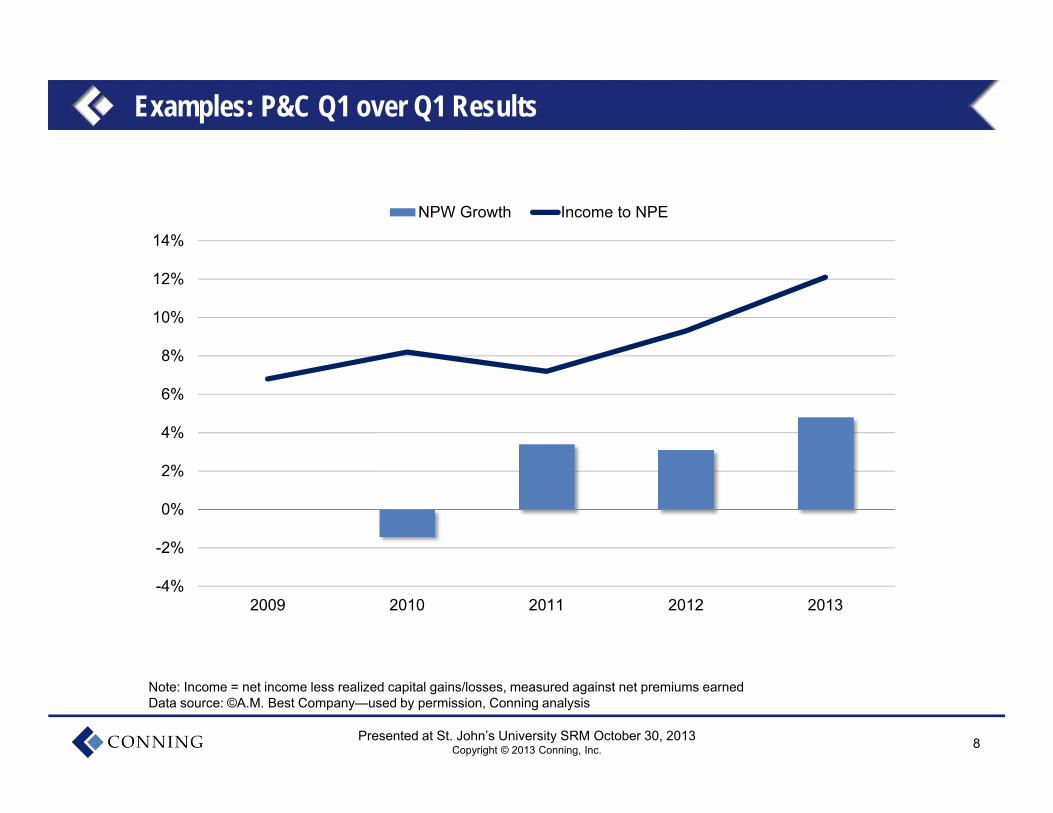
Examples: P&C Q1 over Q1 Results
-4%
-2%
0%
2%
4%
6%
8%
10%
12%
14%
2009 2010 2011 2012 2013
NPW Growth Income to NPE
Note: Income = net income less realized capital gains/losses, measured against net premiums earnedData source: ©A.M. Best Company—used by permission, Conning analysis
9Presented at St. John’s University SRM October 30, 2013Copyright © 2013 Conning, Inc.
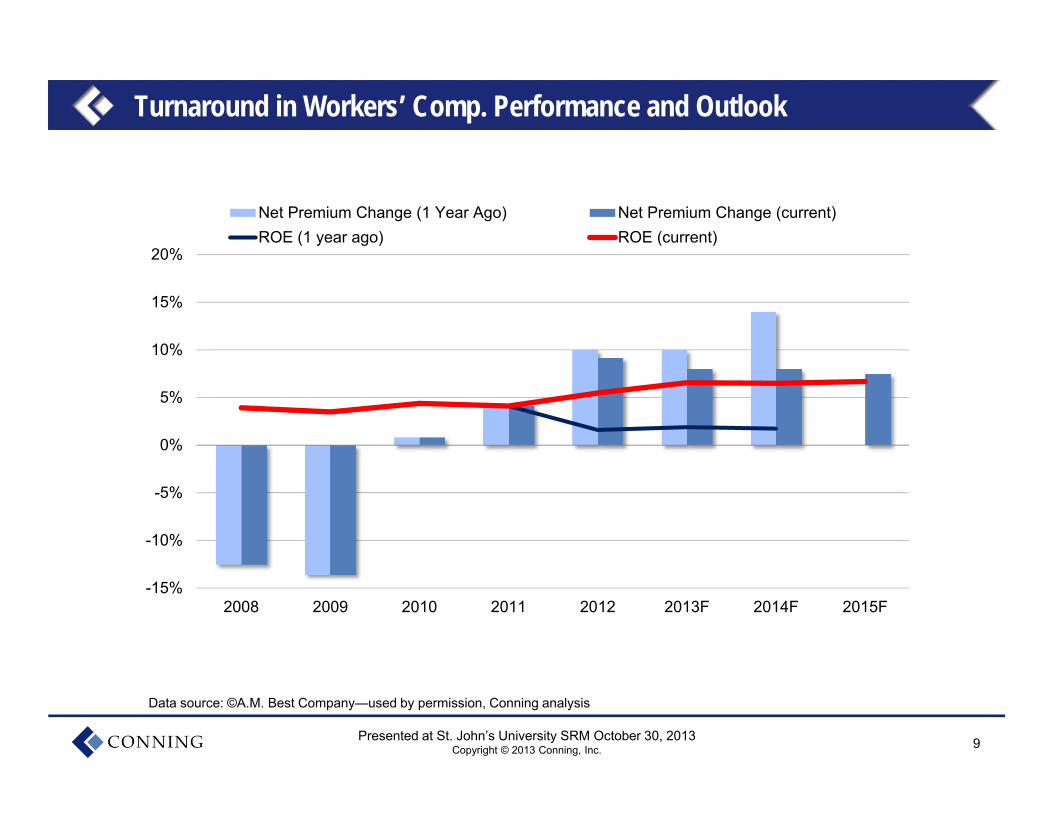
Turnaround in Workers’ Comp. Performance and Outlook
-15%
-10%
-5%
0%
5%
10%
15%
20%
2008 2009 2010 2011 2012 2013F 2014F 2015F
Net Premium Change (1 Year Ago) Net Premium Change (current)ROE (1 year ago) ROE (current)
Data source: ©A.M. Best Company—used by permission, Conning analysis
10Presented at St. John’s University SRM October 30, 2013Copyright © 2013 Conning, Inc.
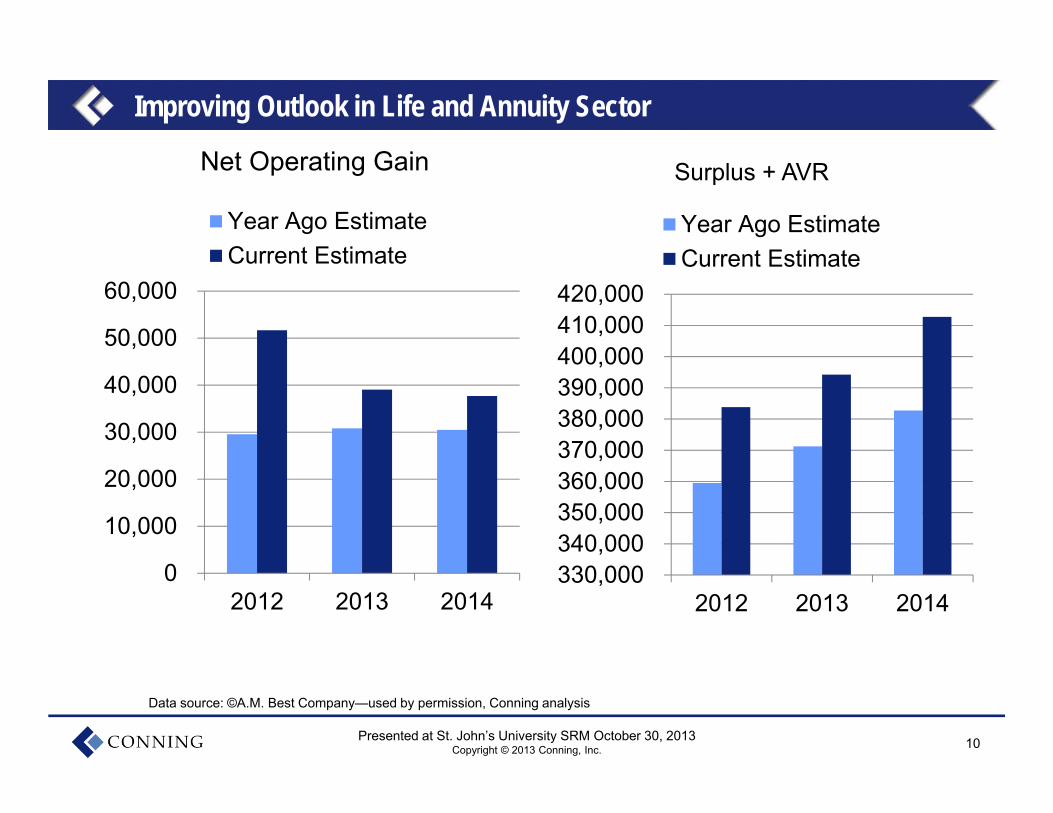
Improving Outlook in Life and Annuity Sector
Data source: ©A.M. Best Company—used by permission, Conning analysis
0
10,000
20,000
30,000
40,000
50,000
60,000
2012 2013 2014
Year Ago EstimateCurrent Estimate
Net Operating Gain
330,000340,000350,000360,000370,000380,000390,000400,000410,000420,000
2012 2013 2014
Year Ago EstimateCurrent Estimate
Surplus + AVR
11Presented at St. John’s University SRM October 30, 2013Copyright © 2013 Conning, Inc.
3%
4%
5%
6%
7%
8%
1997 1999 2001 2003 2005 2007 2009 2011 2013
Range of the Middle 50% Median Industry Book Yield
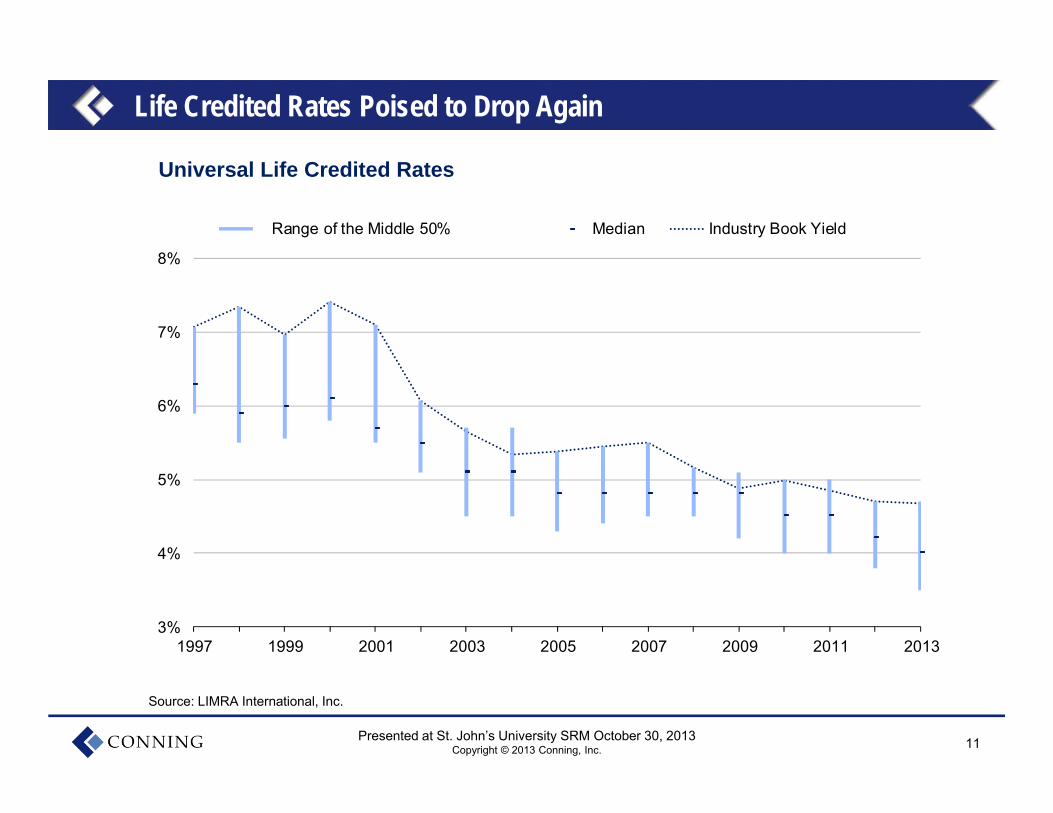
Life Credited Rates Poised to Drop Again
Source: LIMRA International, Inc.
Universal Life Credited Rates
12Presented at St. John’s University SRM October 30, 2013Copyright © 2013 Conning, Inc.
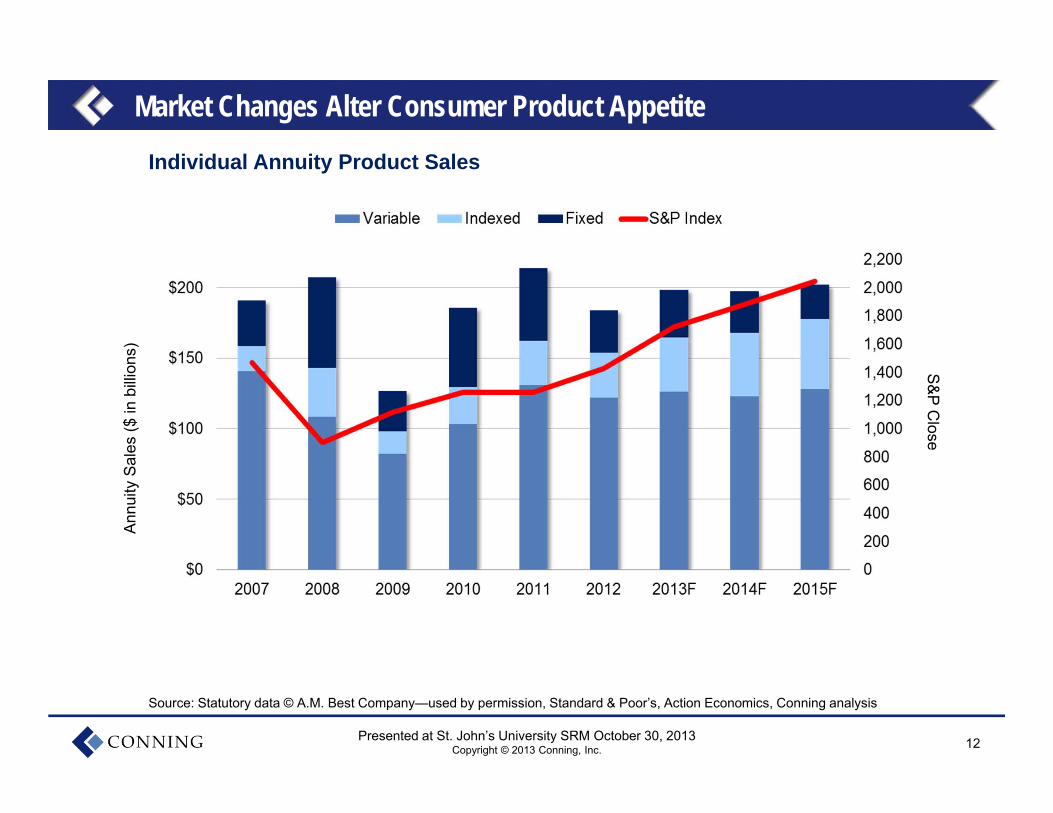
Market Changes Alter Consumer Product AppetiteA
nnui
ty S
ales
($ in
billi
ons)
S&P Close
Individual Annuity Product Sales
Source: Statutory data © A.M. Best Company—used by permission, Standard & Poor’s, Action Economics, Conning analysis
13Presented at St. John’s University SRM October 30, 2013Copyright © 2013 Conning, Inc.
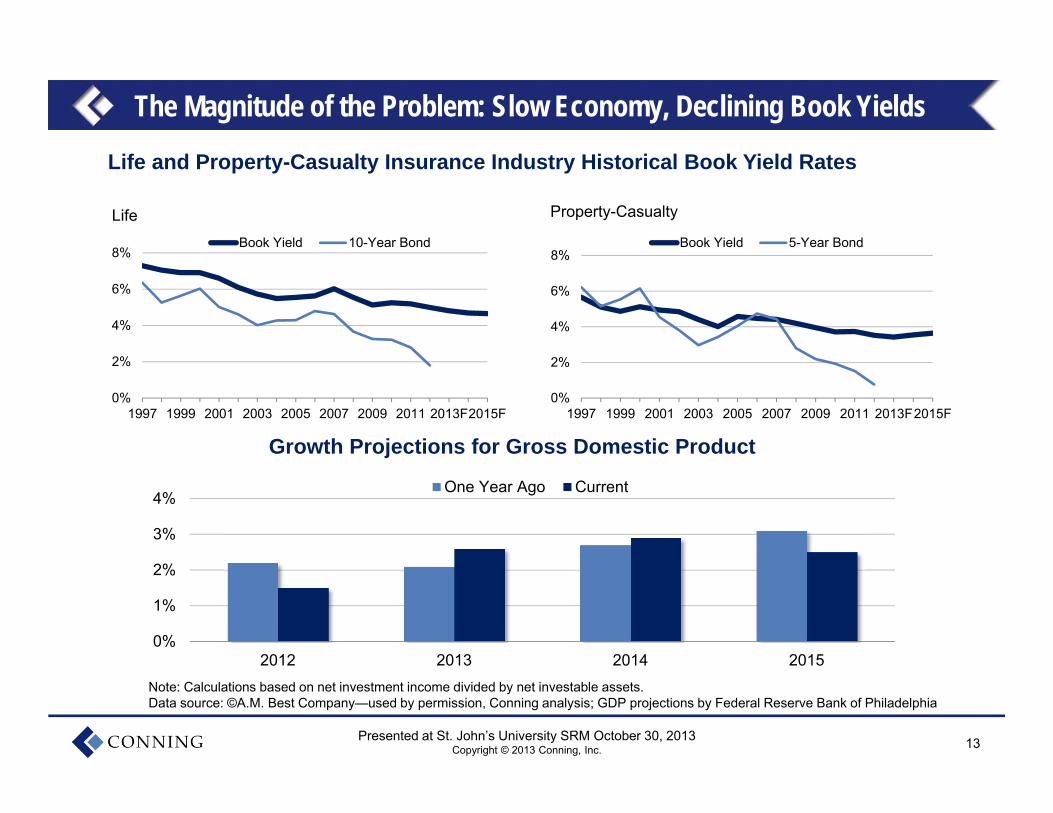
The Magnitude of the Problem: Slow Economy, Declining Book Yields
Life and Property-Casualty Insurance Industry Historical Book Yield Rates
Life Property-Casualty
0%
2%
4%
6%
8%
1997 1999 2001 2003 2005 2007 2009 2011 2013F2015F
Book Yield 5-Year Bond
0%
2%
4%
6%
8%
1997 1999 2001 2003 2005 2007 2009 2011 2013F2015F
Book Yield 10-Year Bond
Note: Calculations based on net investment income divided by net investable assets.Data source: ©A.M. Best Company—used by permission, Conning analysis; GDP projections by Federal Reserve Bank of Philadelphia
0%
1%
2%
3%
4%
2012 2013 2014 2015
One Year Ago Current
Growth Projections for Gross Domestic Product
14Presented at St. John’s University SRM October 30, 2013Copyright © 2013 Conning, Inc.
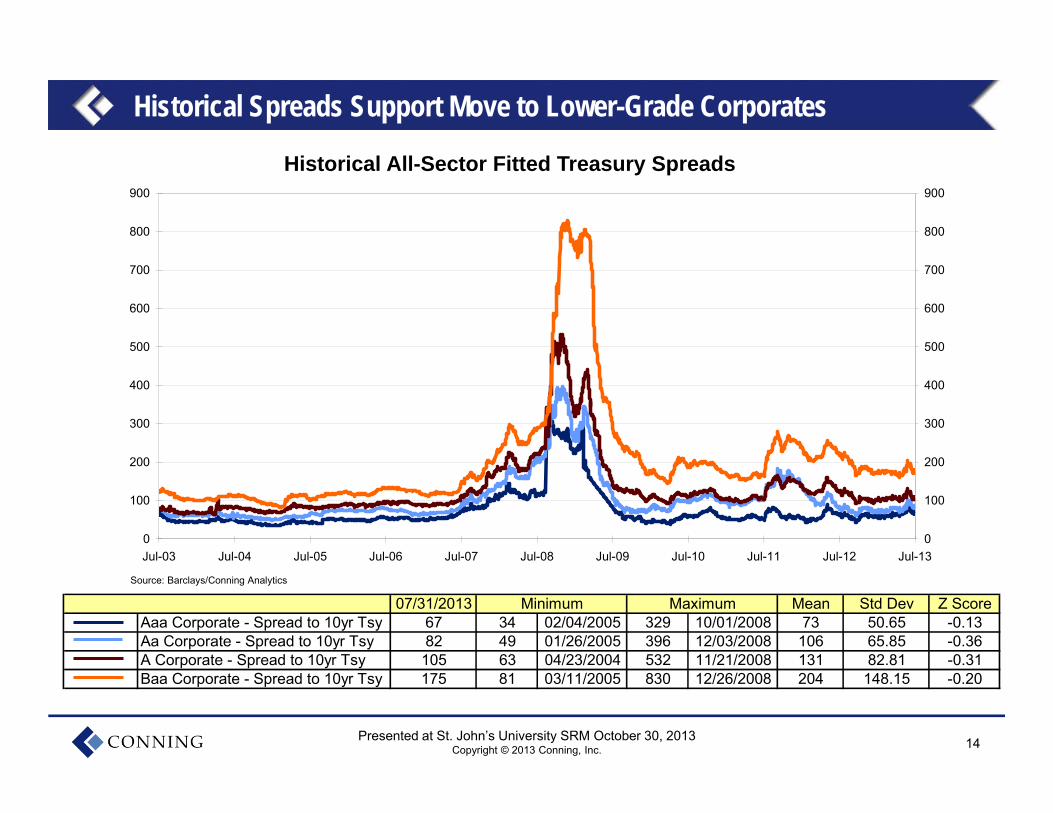
Historical All-Sector Fitted Treasury Spreads
Historical Spreads Support Move to Lower-Grade Corporates
0
100
200
300
400
500
600
700
800
900
Jul-03 Jul-04 Jul-05 Jul-06 Jul-07 Jul-08 Jul-09 Jul-10 Jul-11 Jul-12 Jul-13
Source: Barclays/Conning Analytics
0
100
200
300
400
500
600
700
800
900
07/31/2013 Mean Std Dev Z ScoreAaa Corporate - Spread to 10yr Tsy 67 34 02/04/2005 329 10/01/2008 73 50.65 -0.13Aa Corporate - Spread to 10yr Tsy 82 49 01/26/2005 396 12/03/2008 106 65.85 -0.36A Corporate - Spread to 10yr Tsy 105 63 04/23/2004 532 11/21/2008 131 82.81 -0.31Baa Corporate - Spread to 10yr Tsy 175 81 03/11/2005 830 12/26/2008 204 148.15 -0.20
Minimum Maximum
15Presented at St. John’s University SRM October 30, 2013Copyright © 2013 Conning, Inc.
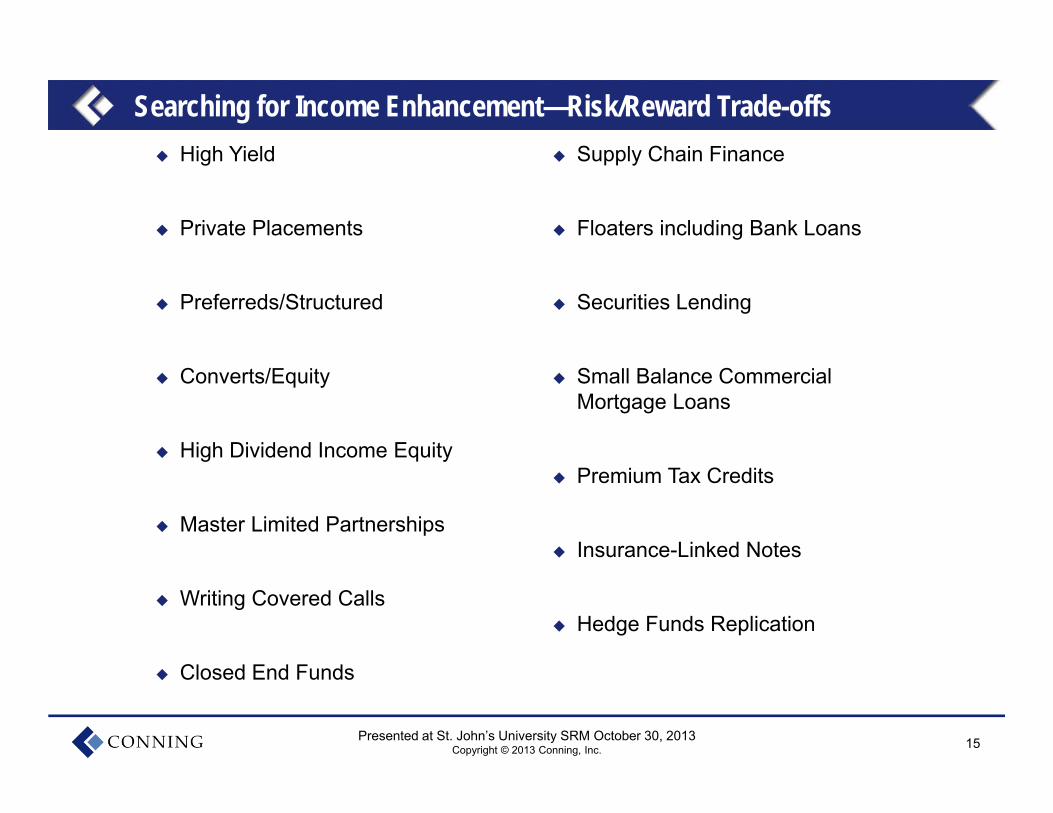
Searching for Income Enhancement—Risk/Reward Trade-offs High Yield
Private Placements
Preferreds/Structured
Converts/Equity
High Dividend Income Equity
Master Limited Partnerships
Writing Covered Calls
Closed End Funds
Supply Chain Finance
Floaters including Bank Loans
Securities Lending
Small Balance Commercial Mortgage Loans
Premium Tax Credits
Insurance-Linked Notes
Hedge Funds Replication
16Presented at St. John’s University SRM October 30, 2013Copyright © 2013 Conning, Inc.
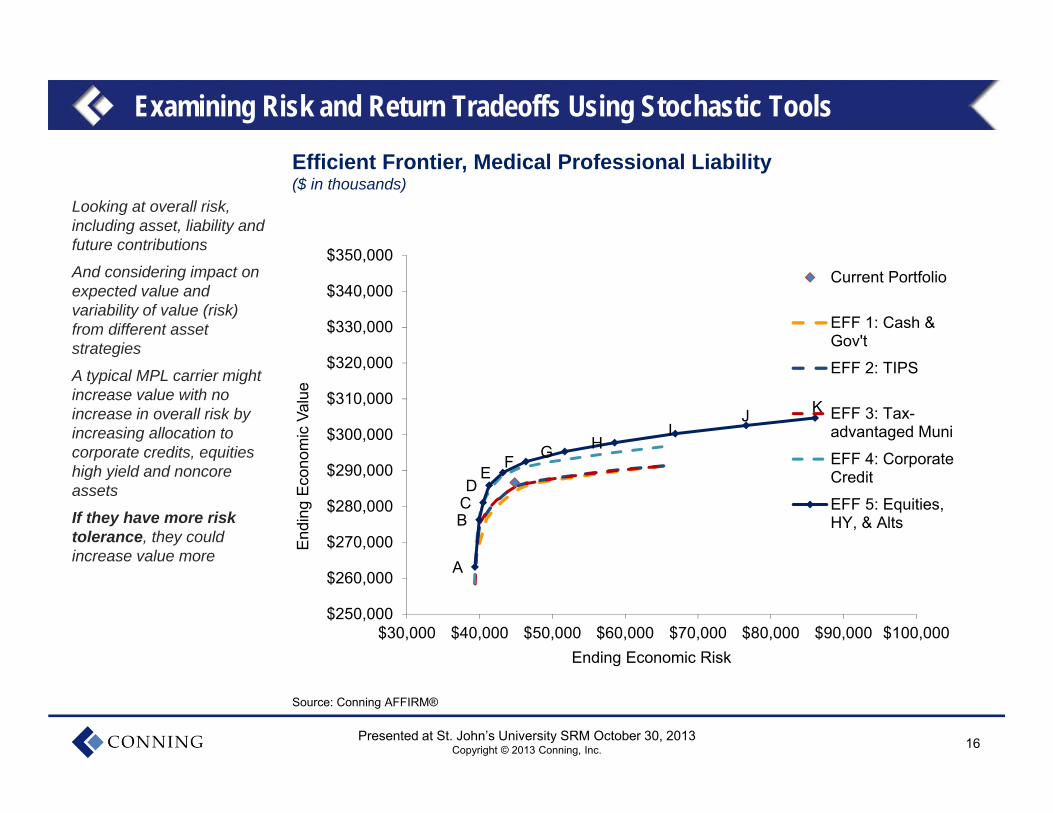
Efficient Frontier, Medical Professional Liability($ in thousands)
Source: Conning AFFIRM®
A
BCD
EF G H
IJ K
$250,000
$260,000
$270,000
$280,000
$290,000
$300,000
$310,000
$320,000
$330,000
$340,000
$350,000
$30,000 $40,000 $50,000 $60,000 $70,000 $80,000 $90,000 $100,000
End
ing
Eco
nom
ic V
alue
Ending Economic Risk
Current Portfolio
EFF 1: Cash &Gov't
EFF 2: TIPS
EFF 3: Tax-advantaged Muni
EFF 4: CorporateCredit
EFF 5: Equities,HY, & Alts
Examining Risk and Return Tradeoffs Using Stochastic Tools
Looking at overall risk, including asset, liability and future contributions
And considering impact on expected value and variability of value (risk) from different asset strategies
A typical MPL carrier might increase value with no increase in overall risk by increasing allocation to corporate credits, equities high yield and noncore assets
If they have more risk tolerance, they could increase value more
17Presented at St. John’s University SRM October 30, 2013Copyright © 2013 Conning, Inc.
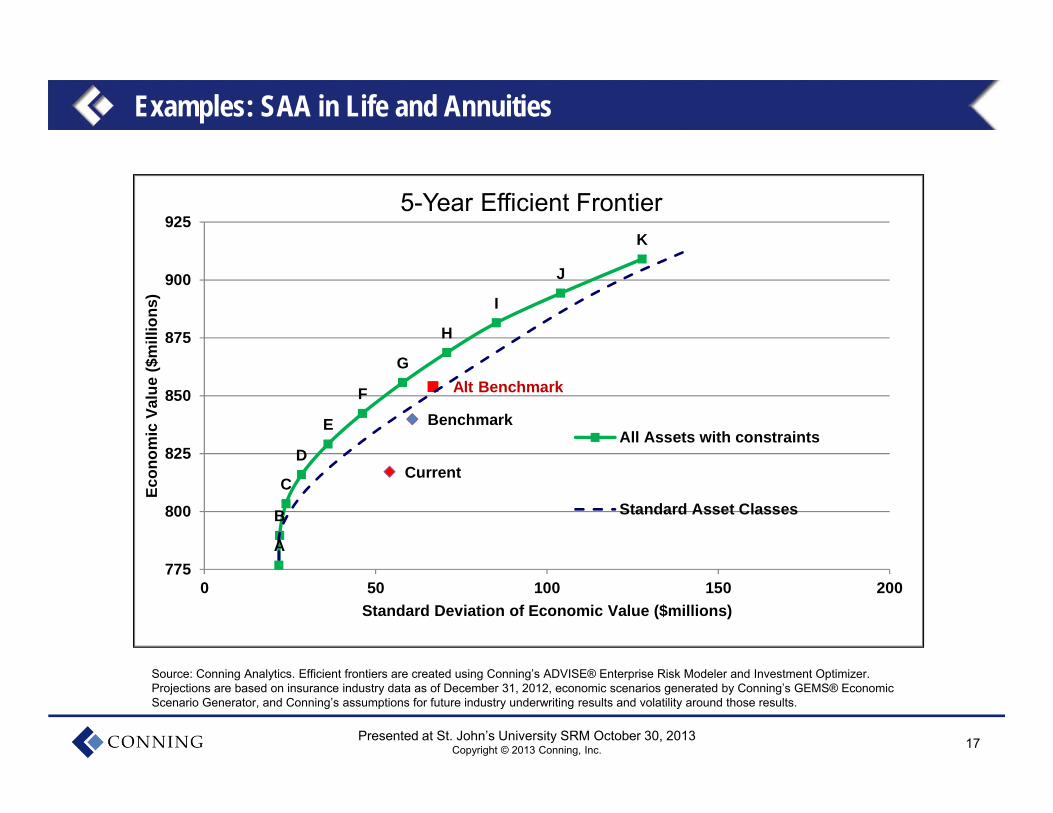
Examples: SAA in Life and Annuities
A
B
C
D
E
F
G
H
I
J
K
Current
Alt Benchmark
Benchmark
775
800
825
850
875
900
925
0 50 100 150 200
Econ
omic
Val
ue ($
mill
ions
)
Standard Deviation of Economic Value ($millions)
5-Year Efficient Frontier
All Assets with constraints
Standard Asset Classes
Source: Conning Analytics. Efficient frontiers are created using Conning’s ADVISE® Enterprise Risk Modeler and Investment Optimizer. Projections are based on insurance industry data as of December 31, 2012, economic scenarios generated by Conning’s GEMS® Economic Scenario Generator, and Conning’s assumptions for future industry underwriting results and volatility around those results.
18Presented at St. John’s University SRM October 30, 2013Copyright © 2013 Conning, Inc.
0.0
0.2
0.4
0.6
0.8
1.0
1.2
1.4
1.6
1.8
$150
$200
$250
$300
$350
$400
$450
2003 2005 2007 2009 2011 2013F2015FFinancial Leverage
SurplusPremium/SurplusReserves/Surplus
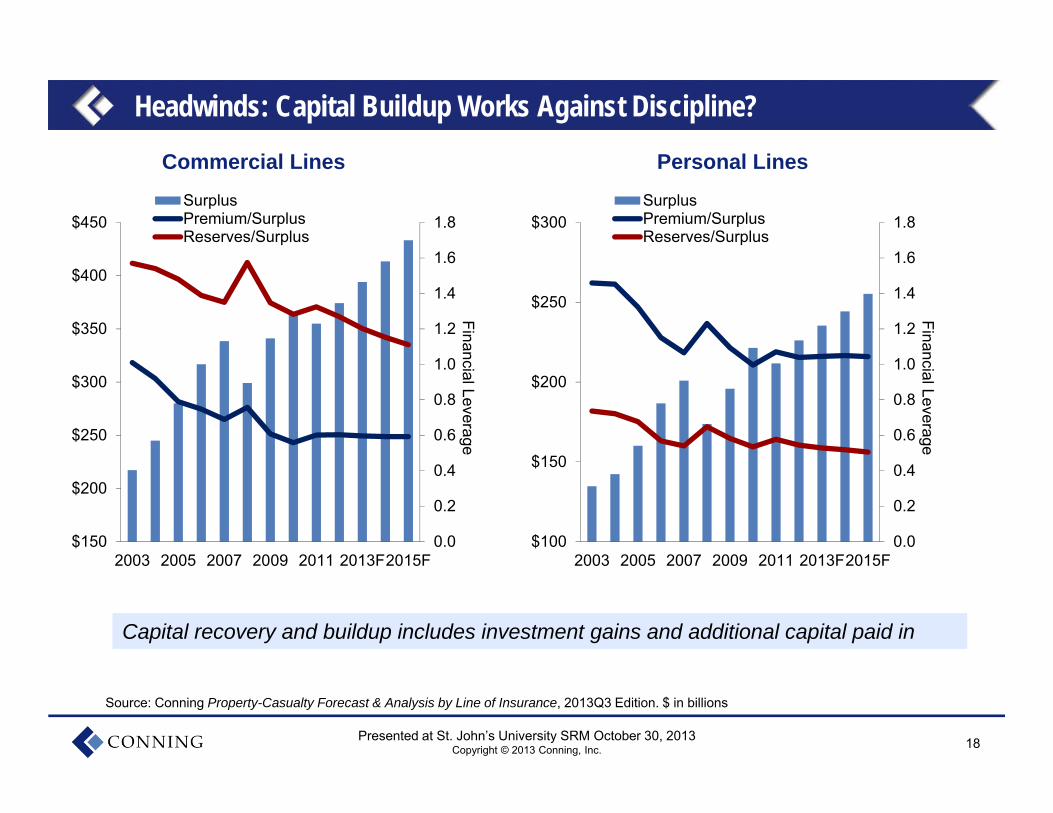
Commercial Lines Personal Lines
Source: Conning Property-Casualty Forecast & Analysis by Line of Insurance, 2013Q3 Edition. $ in billions
Capital recovery and buildup includes investment gains and additional capital paid inCapital recovery and buildup includes investment gains and additional capital paid in
0.0
0.2
0.4
0.6
0.8
1.0
1.2
1.4
1.6
1.8
$100
$150
$200
$250
$300
2003 2005 2007 2009 2011 2013F2015F
Financial Leverage
SurplusPremium/SurplusReserves/Surplus
Headwinds: Capital Buildup Works Against Discipline?
19Presented at St. John’s University SRM October 30, 2013Copyright © 2013 Conning, Inc.
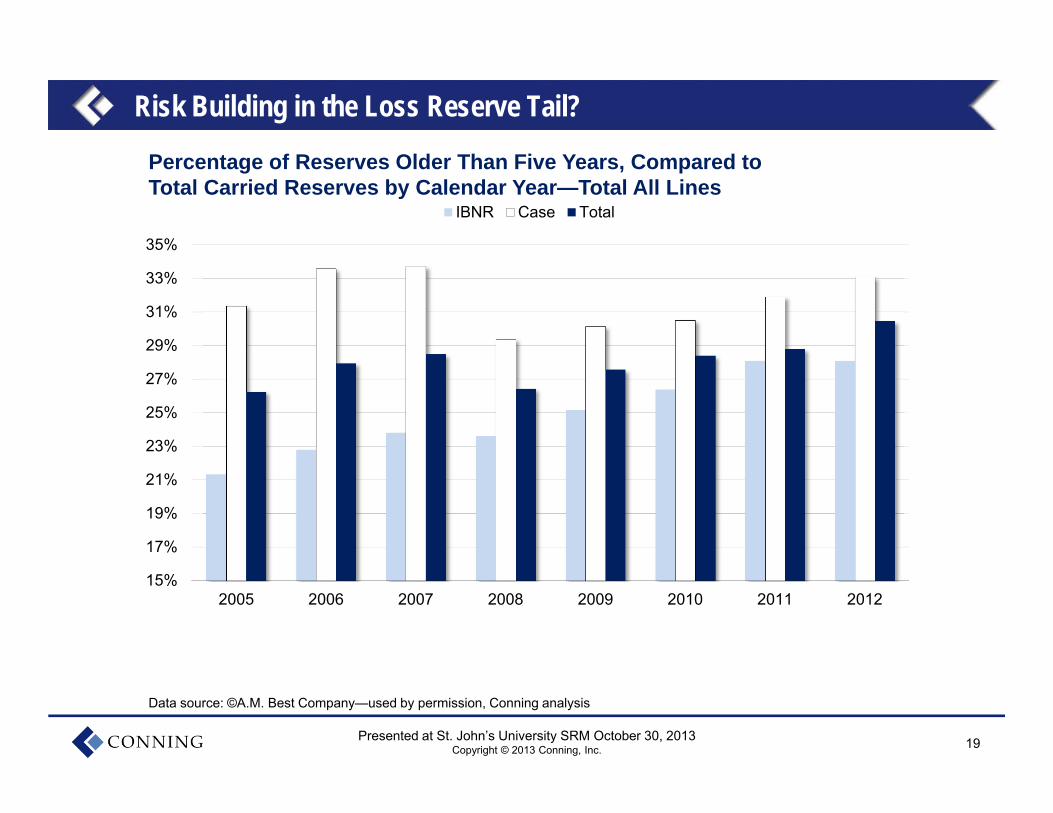
Risk Building in the Loss Reserve Tail?
15%
17%
19%
21%
23%
25%
27%
29%
31%
33%
35%
2005 2006 2007 2008 2009 2010 2011 2012
IBNR Case Total
Percentage of Reserves Older Than Five Years, Compared to Total Carried Reserves by Calendar Year—Total All Lines
Data source: ©A.M. Best Company—used by permission, Conning analysis
20Presented at St. John’s University SRM October 30, 2013Copyright © 2013 Conning, Inc.
50%
55%
60%
65%
70%
75%
1995 1996 1997 1998 1999 2000 2001 2002 2003 2004 2005 2006 2007 2008 2009 2010 2011 2012
Personal Auto Homeowners
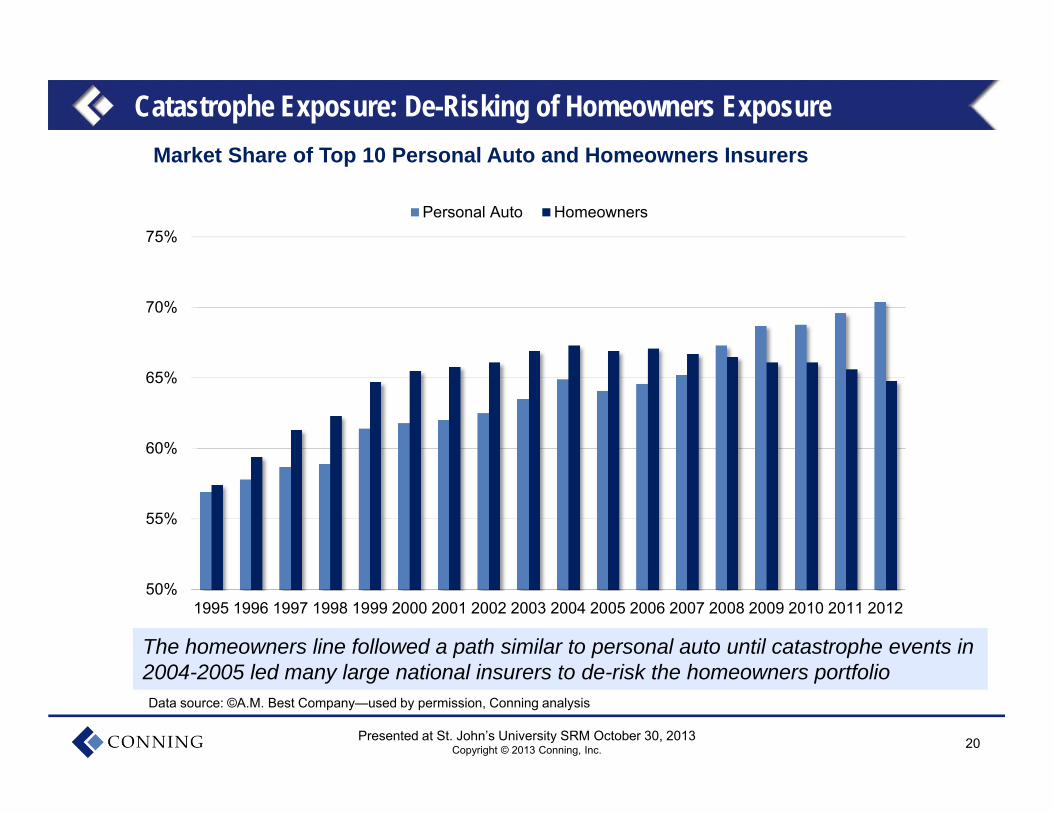
Catastrophe Exposure: De-Risking of Homeowners Exposure
Data source: ©A.M. Best Company—used by permission, Conning analysis
Market Share of Top 10 Personal Auto and Homeowners Insurers
The homeowners line followed a path similar to personal auto until catastrophe events in 2004-2005 led many large national insurers to de-risk the homeowners portfolioThe homeowners line followed a path similar to personal auto until catastrophe events in 2004-2005 led many large national insurers to de-risk the homeowners portfolio
21Presented at St. John’s University SRM October 30, 2013Copyright © 2013 Conning, Inc.
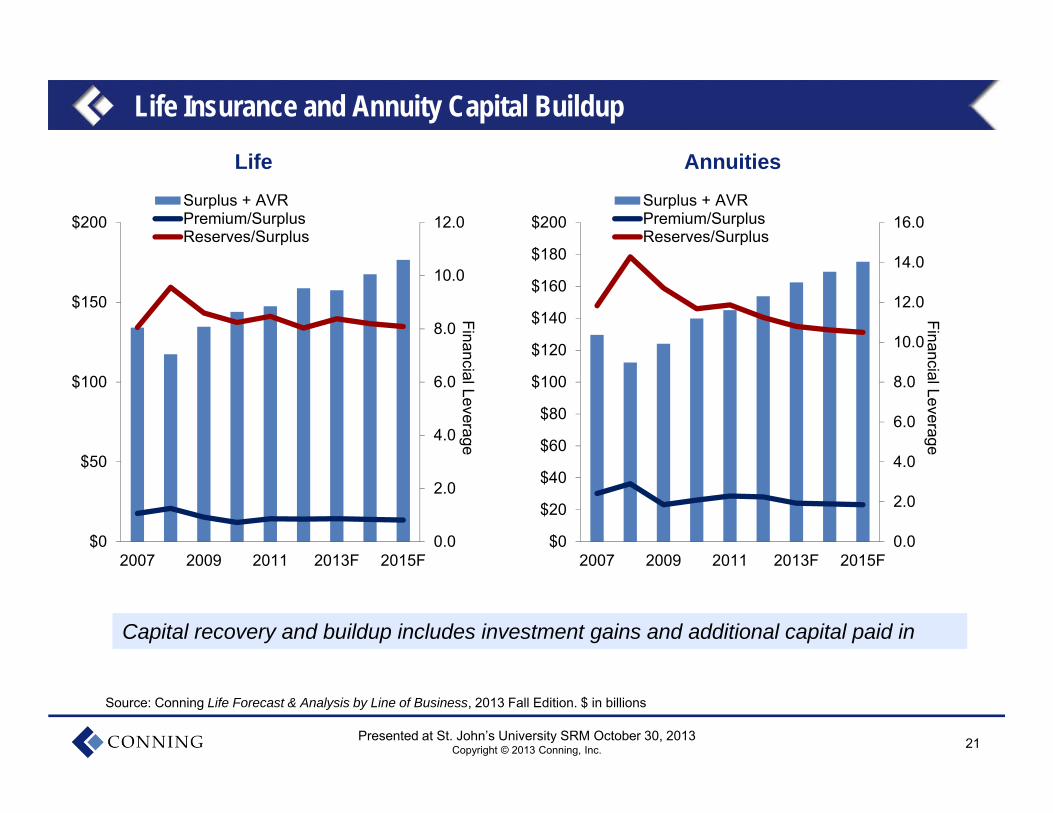
Life Insurance and Annuity Capital Buildup
Source: Conning Life Forecast & Analysis by Line of Business, 2013 Fall Edition. $ in billions
0.0
2.0
4.0
6.0
8.0
10.0
12.0
$0
$50
$100
$150
$200
2007 2009 2011 2013F 2015FFinancial Leverage
Surplus + AVRPremium/SurplusReserves/Surplus
Life Annuities
0.0
2.0
4.0
6.0
8.0
10.0
12.0
14.0
16.0
$0
$20
$40
$60
$80
$100
$120
$140
$160
$180
$200
2007 2009 2011 2013F 2015F
Financial Leverage
Surplus + AVRPremium/SurplusReserves/Surplus
Capital recovery and buildup includes investment gains and additional capital paid inCapital recovery and buildup includes investment gains and additional capital paid in
22Presented at St. John’s University SRM October 30, 2013Copyright © 2013 Conning, Inc.
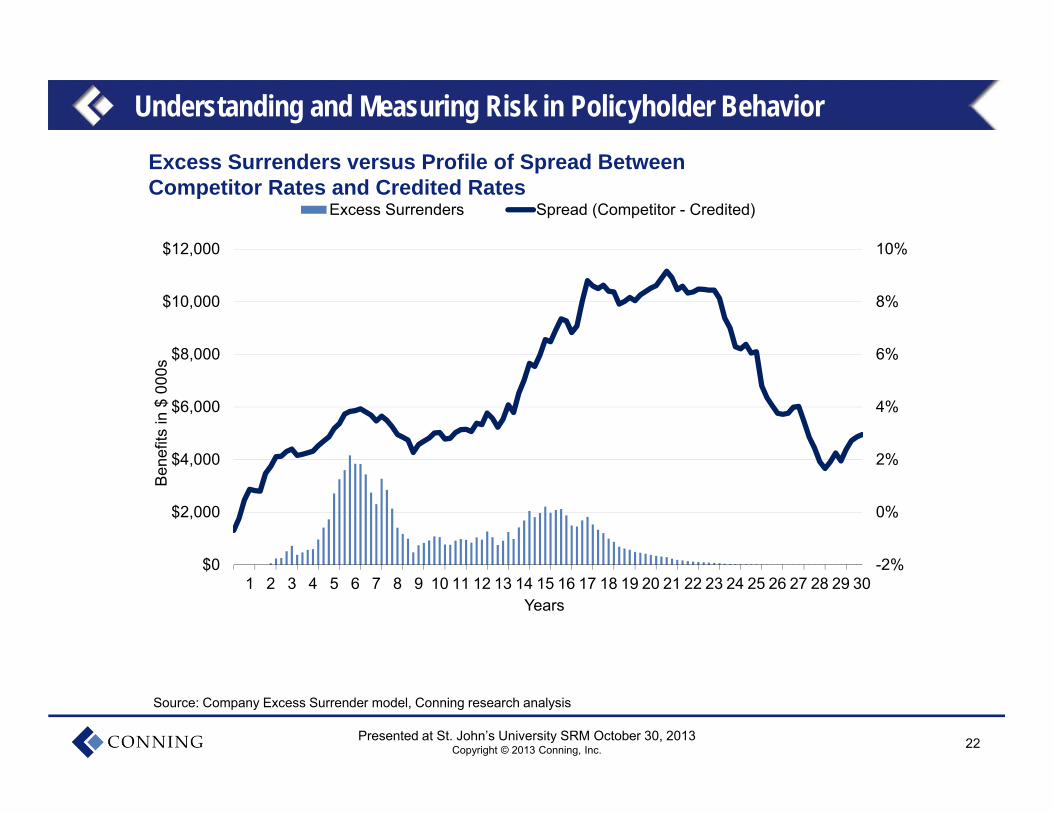
Excess Surrenders versus Profile of Spread BetweenCompetitor Rates and Credited Rates
Source: Company Excess Surrender model, Conning research analysis
Understanding and Measuring Risk in Policyholder Behavior
-2%
0%
2%
4%
6%
8%
10%
$0
$2,000
$4,000
$6,000
$8,000
$10,000
$12,000
1 2 3 4 5 6 7 8 9 10 11 12 13 14 15 16 17 18 19 20 21 22 23 24 25 26 27 28 29 30
Ben
efits
in $
000
s
Years
Excess Surrenders Spread (Competitor - Credited)
23Presented at St. John’s University SRM October 30, 2013Copyright © 2013 Conning, Inc.
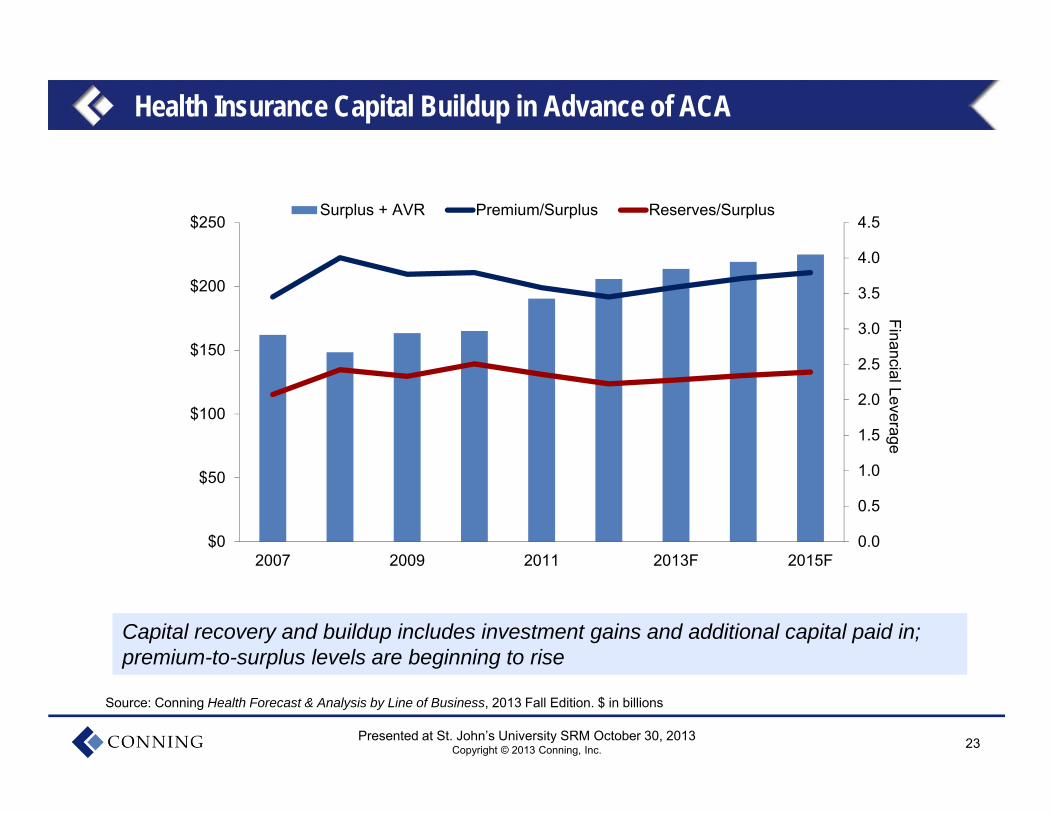
Health Insurance Capital Buildup in Advance of ACA
Source: Conning Health Forecast & Analysis by Line of Business, 2013 Fall Edition. $ in billions
0.0
0.5
1.0
1.5
2.0
2.5
3.0
3.5
4.0
4.5
$0
$50
$100
$150
$200
$250
2007 2009 2011 2013F 2015F
Financial Leverage
Surplus + AVR Premium/Surplus Reserves/Surplus
Capital recovery and buildup includes investment gains and additional capital paid in; premium-to-surplus levels are beginning to riseCapital recovery and buildup includes investment gains and additional capital paid in; premium-to-surplus levels are beginning to rise
24Presented at St. John’s University SRM October 30, 2013Copyright © 2013 Conning, Inc.
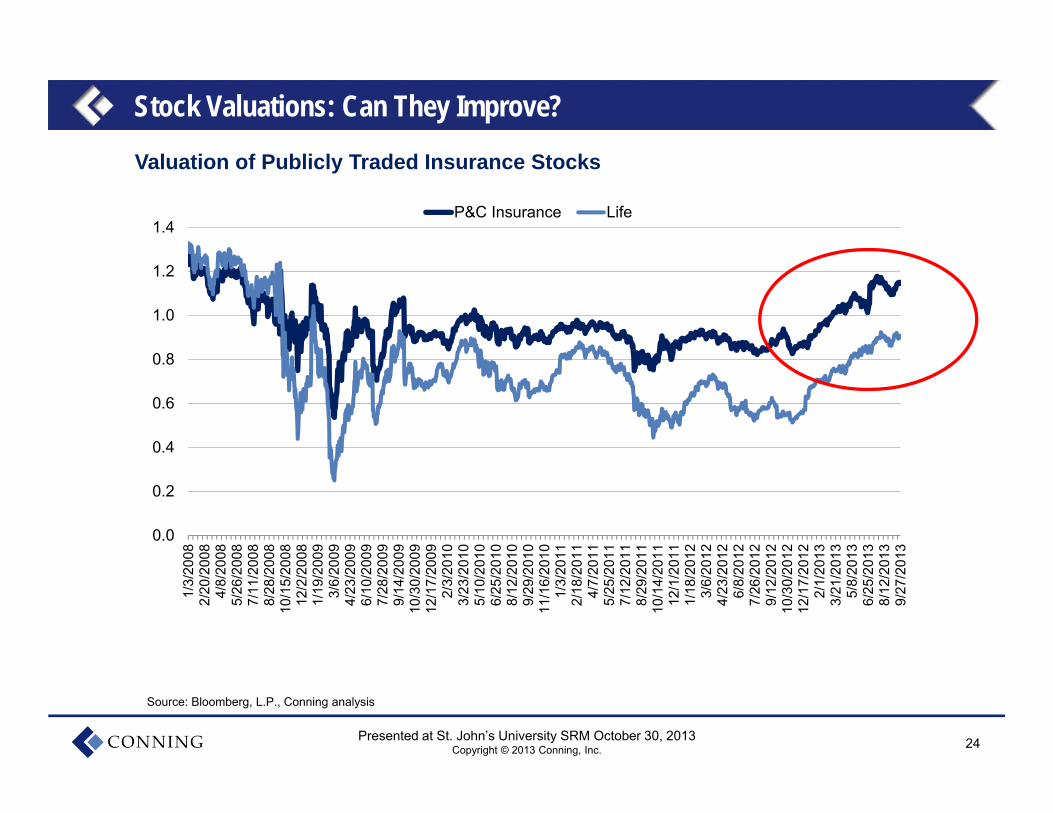
Stock Valuations: Can They Improve?
Source: Bloomberg, L.P., Conning analysis
Valuation of Publicly Traded Insurance Stocks
0.0
0.2
0.4
0.6
0.8
1.0
1.2
1.4
1/3/
2008
2/20
/200
84/
8/20
085/
26/2
008
7/11
/200
88/
28/2
008
10/1
5/20
0812
/2/2
008
1/19
/200
93/
6/20
094/
23/2
009
6/10
/200
97/
28/2
009
9/14
/200
910
/30/
2009
12/1
7/20
092/
3/20
103/
23/2
010
5/10
/201
06/
25/2
010
8/12
/201
09/
29/2
010
11/1
6/20
101/
3/20
112/
18/2
011
4/7/
2011
5/25
/201
17/
12/2
011
8/29
/201
110
/14/
2011
12/1
/201
11/
18/2
012
3/6/
2012
4/23
/201
26/
8/20
127/
26/2
012
9/12
/201
210
/30/
2012
12/1
7/20
122/
1/20
133/
21/2
013
5/8/
2013
6/25
/201
38/
12/2
013
9/27
/201
3
P&C Insurance Life
25Presented at St. John’s University SRM October 30, 2013Copyright © 2013 Conning, Inc.
Investments in Technology and Analytics Paying Off?
Technology overhaul, replacing legacy systems, moving to the cloud
Information and analytics transforming at all levels
26Presented at St. John’s University SRM October 30, 2013Copyright © 2013 Conning, Inc.
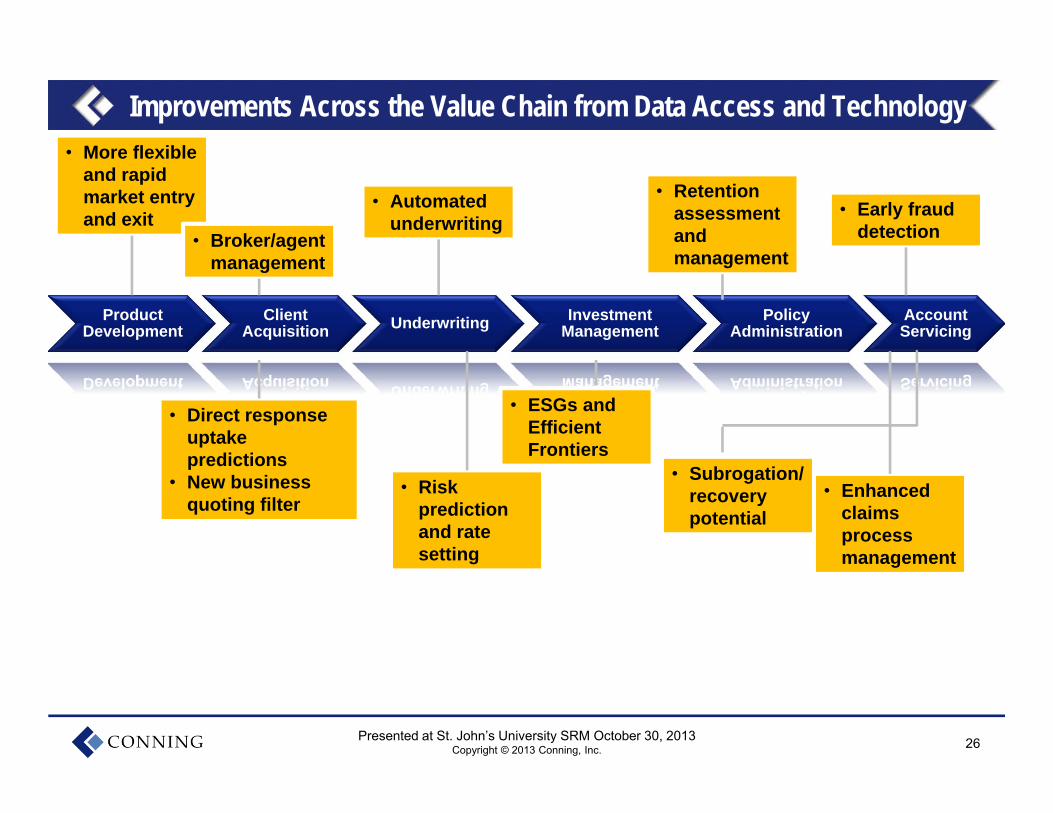
Improvements Across the Value Chain from Data Access and Technology
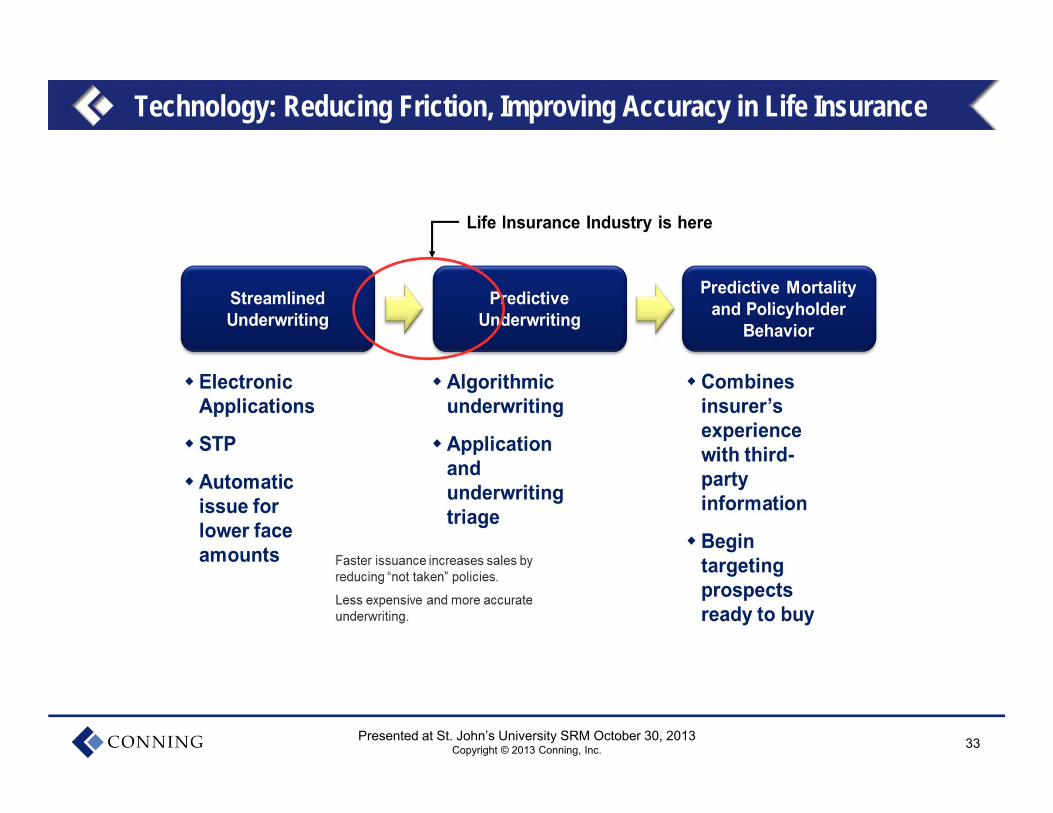
Product Development
Client Acquisition Underwriting Investment
ManagementPolicy
AdministrationAccount Servicing
• Enhanced claims process management
• Risk prediction and rate setting
• More flexible and rapid market entry and exit
• Retention assessment and management
• Direct response uptake predictions
• New business quoting filter
• Automated underwriting
• Broker/agent management
• Early fraud detection
• Subrogation/ recovery potential
• ESGs and Efficient Frontiers

27Presented at St. John’s University SRM October 30, 2013Copyright © 2013 Conning, Inc.
Amount Spent on IT Increasing—Property-Casualty Sector
$0
$1
$2
$3
$4
$5
$6
0.0%
0.2%
0.4%
0.6%
0.8%
1.0%
1.2%
2002 2003 2004 2005 2006 2007 2008 2009 2010 2011 2012
IT Expense (right scale) % of DPW % of NPW
Technology and Data Investments Paying Off?
$ in billions. Data source: © A.M. Best Company—used by permission, Conning analysis
28Presented at St. John’s University SRM October 30, 2013Copyright © 2013 Conning, Inc.
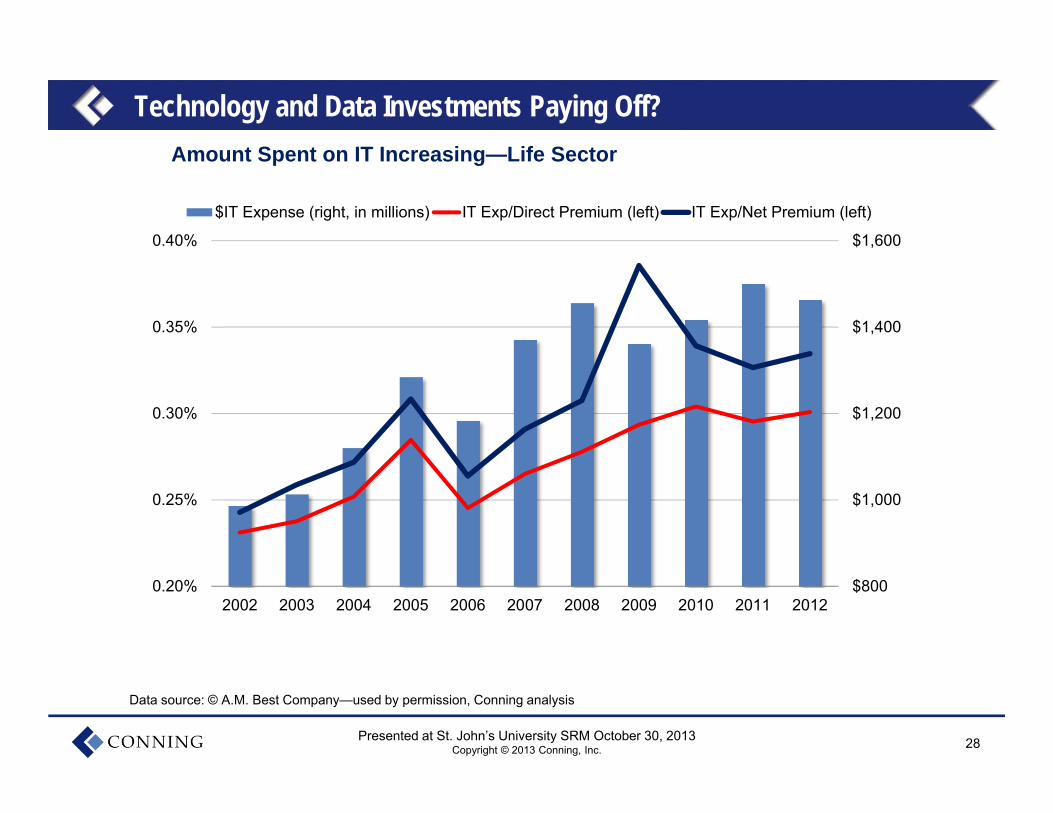
Technology and Data Investments Paying Off?
$800
$1,000
$1,200
$1,400
$1,600
0.20%
0.25%
0.30%
0.35%
0.40%
2002 2003 2004 2005 2006 2007 2008 2009 2010 2011 2012
$IT Expense (right, in millions) IT Exp/Direct Premium (left) IT Exp/Net Premium (left)
Amount Spent on IT Increasing—Life Sector
Data source: © A.M. Best Company—used by permission, Conning analysis
29Presented at St. John’s University SRM October 30, 2013Copyright © 2013 Conning, Inc.
Importance of Big Data, Advance Analytics, and Data Management
Five stages of data management Acquisition and reconciliation Integration across the enterprise Enhanced and predictive analytics Governance Data security
Vendors pick up where large companies leave off
30Presented at St. John’s University SRM October 30, 2013Copyright © 2013 Conning, Inc.
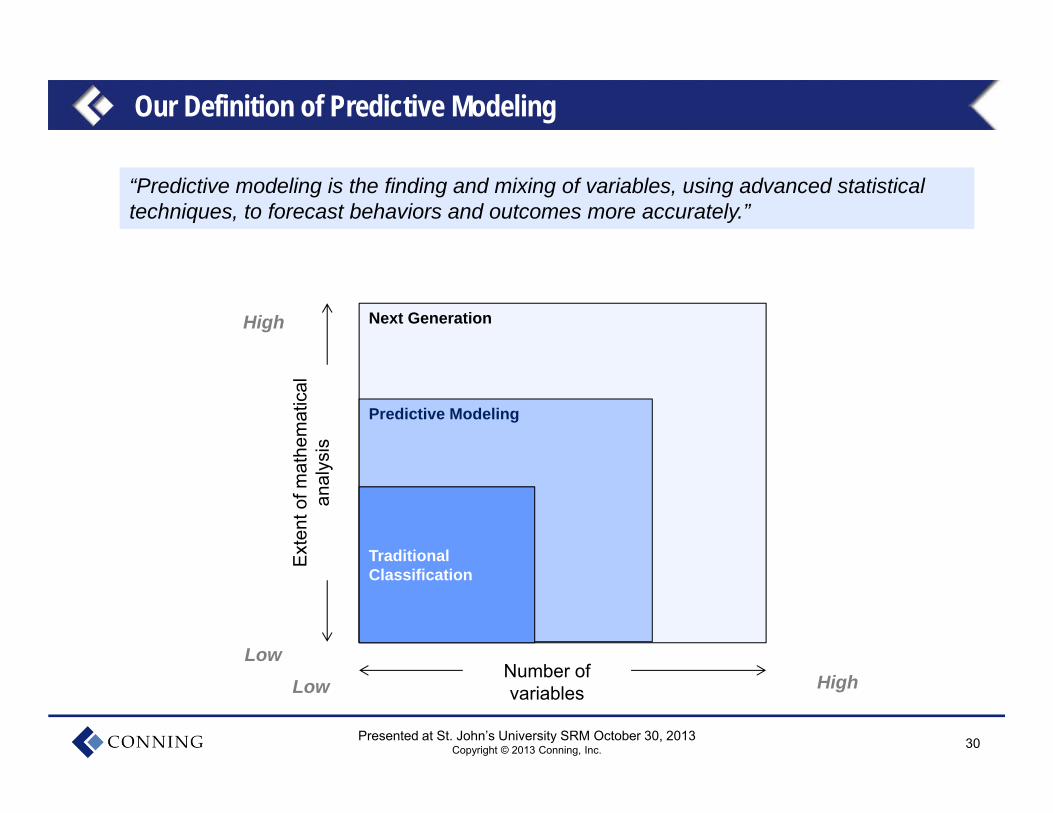
Next Generation
Our Definition of Predictive Modeling
Predictive Modeling
Traditional Classification
Ext
ent o
f mat
hem
atic
al
anal
ysis
Number of variables
High
HighLow
Low
“Predictive modeling is the finding and mixing of variables, using advanced statistical techniques, to forecast behaviors and outcomes more accurately.”“Predictive modeling is the finding and mixing of variables, using advanced statistical techniques, to forecast behaviors and outcomes more accurately.”
31Presented at St. John’s University SRM October 30, 2013Copyright © 2013 Conning, Inc.
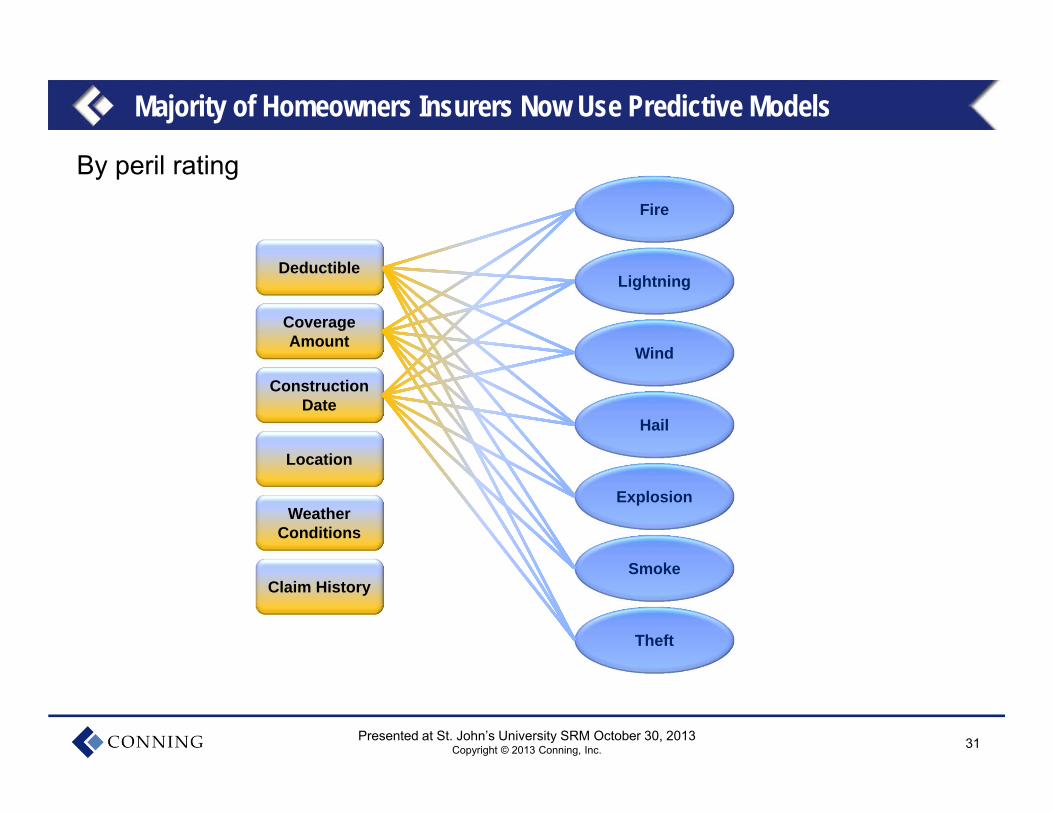
Majority of Homeowners Insurers Now Use Predictive Models
By peril rating
Deductible
Coverage Amount
Construction Date
Location
Weather Conditions
Claim History
Fire
Lightning
Wind
Hail
Explosion
Smoke
Theft
32Presented at St. John’s University SRM October 30, 2013Copyright © 2013 Conning, Inc.
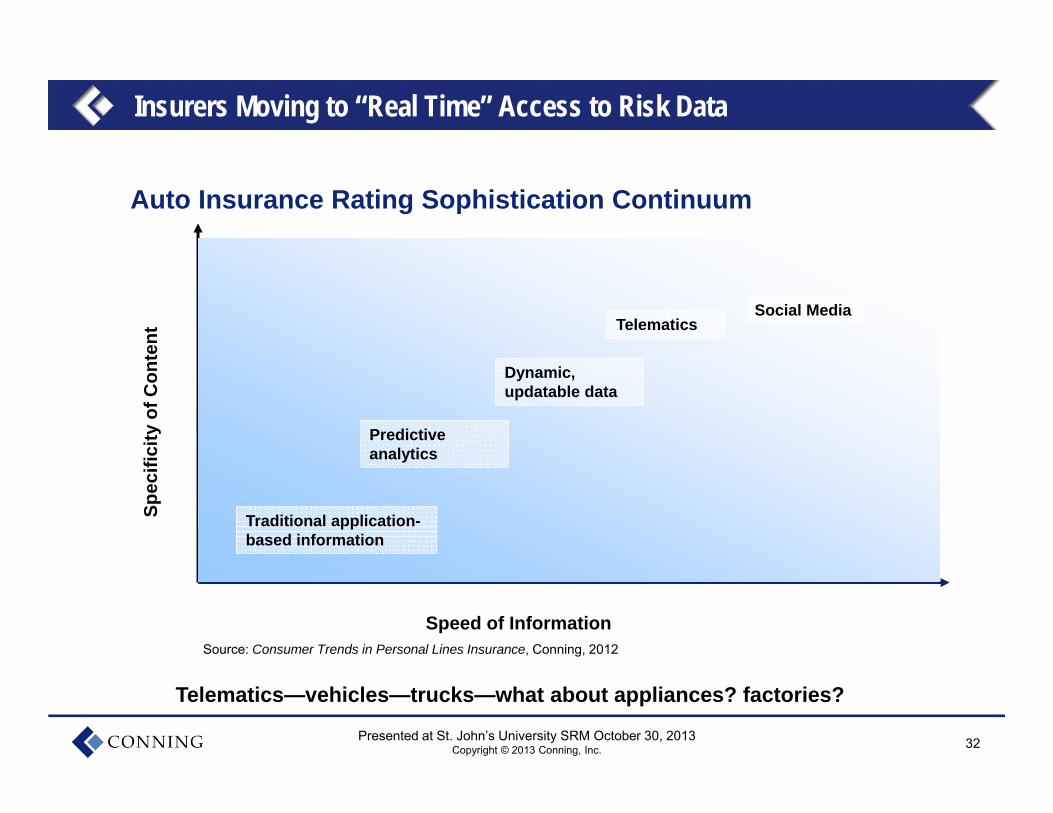
Auto Insurance Rating Sophistication Continuum
Speed of Information
Spec
ifici
ty o
f Con
tent
Traditional application-based information
Predictive analytics
Dynamic, updatable data
TelematicsSocial Media
Source: Consumer Trends in Personal Lines Insurance, Conning, 2012
Insurers Moving to “Real Time” Access to Risk Data
Telematics—vehicles—trucks—what about appliances? factories?
33Presented at St. John’s University SRM October 30, 2013Copyright © 2013 Conning, Inc.
Technology: Reducing Friction, Improving Accuracy in Life Insurance
34Presented at St. John’s University SRM October 30, 2013Copyright © 2013 Conning, Inc.
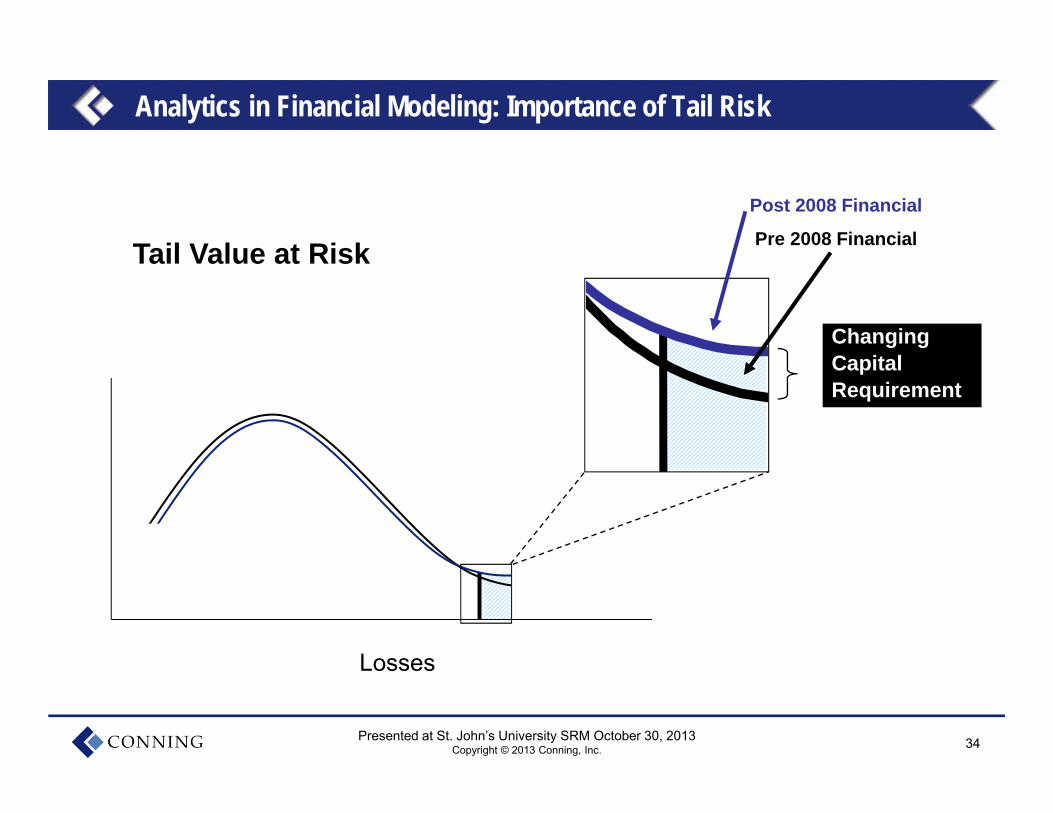
Analytics in Financial Modeling: Importance of Tail Risk
Tail Value at Risk
Losses
ChangingCapitalRequirement
Post 2008 Financial
Pre 2008 Financial
35Presented at St. John’s University SRM October 30, 2013Copyright © 2013 Conning, Inc.
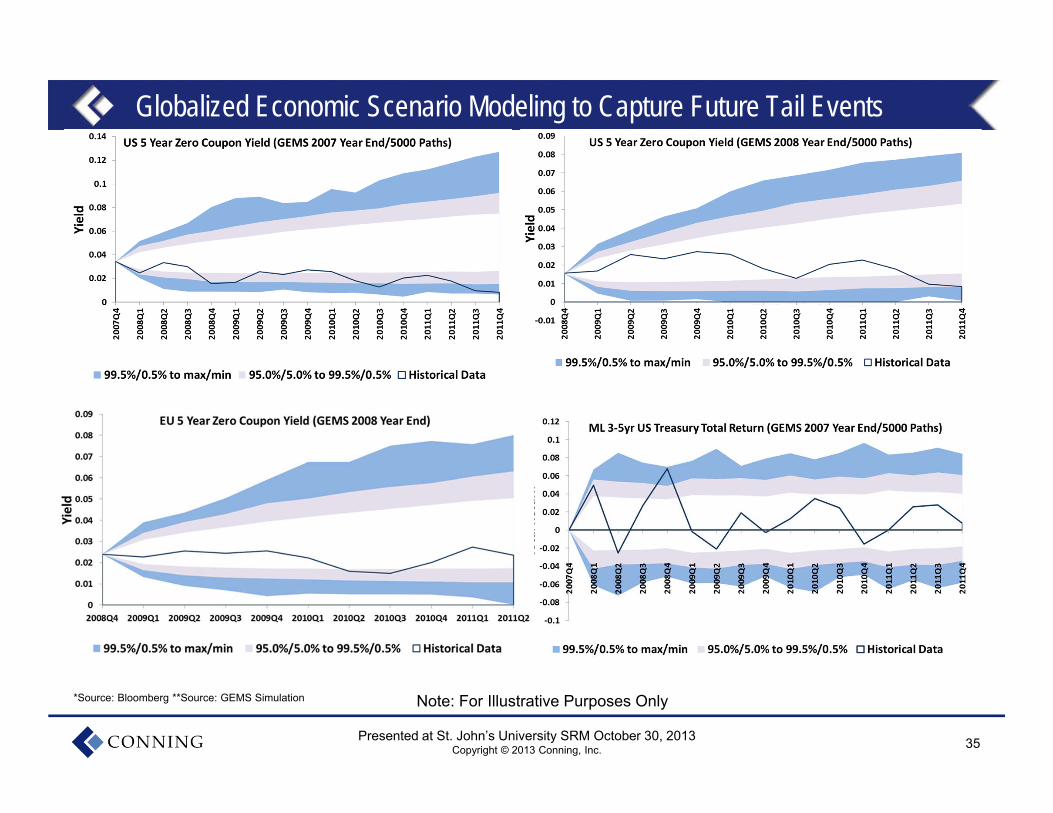
*Source: Bloomberg **Source: GEMS Simulation
Globalized Economic Scenario Modeling to Capture Future Tail Events
Note: For Illustrative Purposes Only
36Presented at St. John’s University SRM October 30, 2013Copyright © 2013 Conning, Inc.
Addressing a Changing Customer Base
Empowered customers and distribution segmentation
Service delivery arms race: mobile, digital, social networks
Middle market outperforms: targeting specialized risk and
service
New risks and new opportunities emerge—but sold, not bought
37Presented at St. John’s University SRM October 30, 2013Copyright © 2013 Conning, Inc.
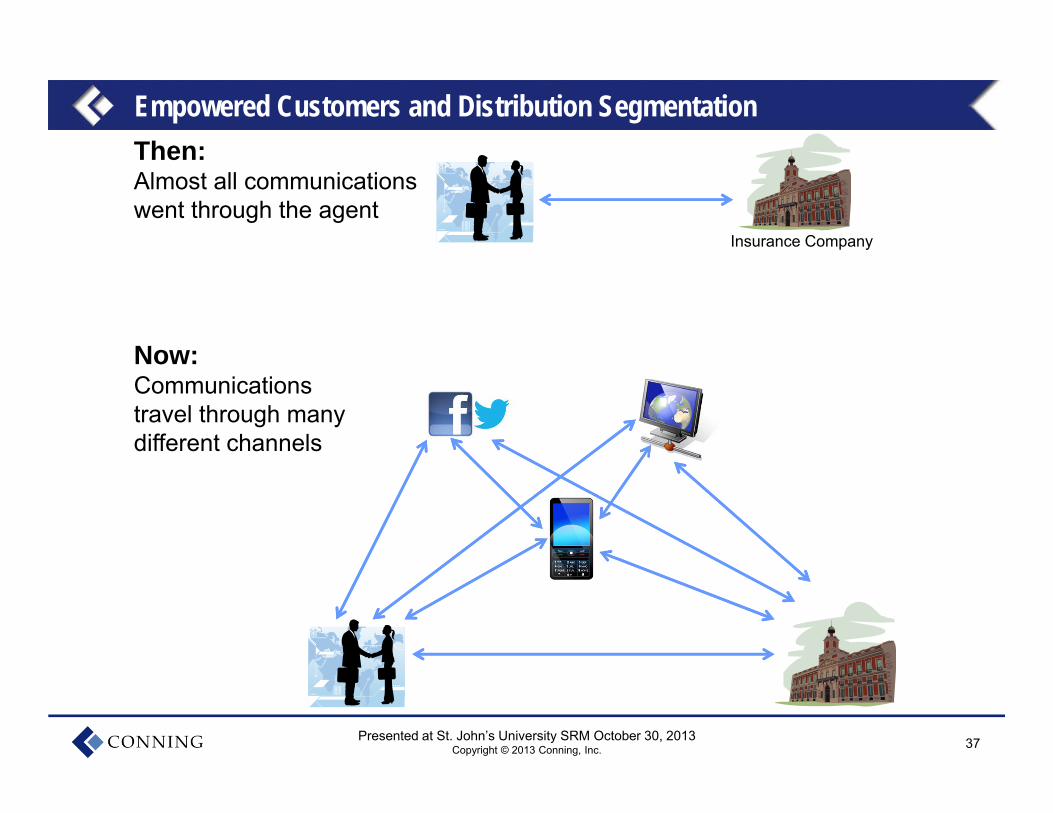
Then: Almost all communicationswent through the agent
Now:Communications travel through many different channels
Insurance Company
Empowered Customers and Distribution Segmentation
38Presented at St. John’s University SRM October 30, 2013Copyright © 2013 Conning, Inc.
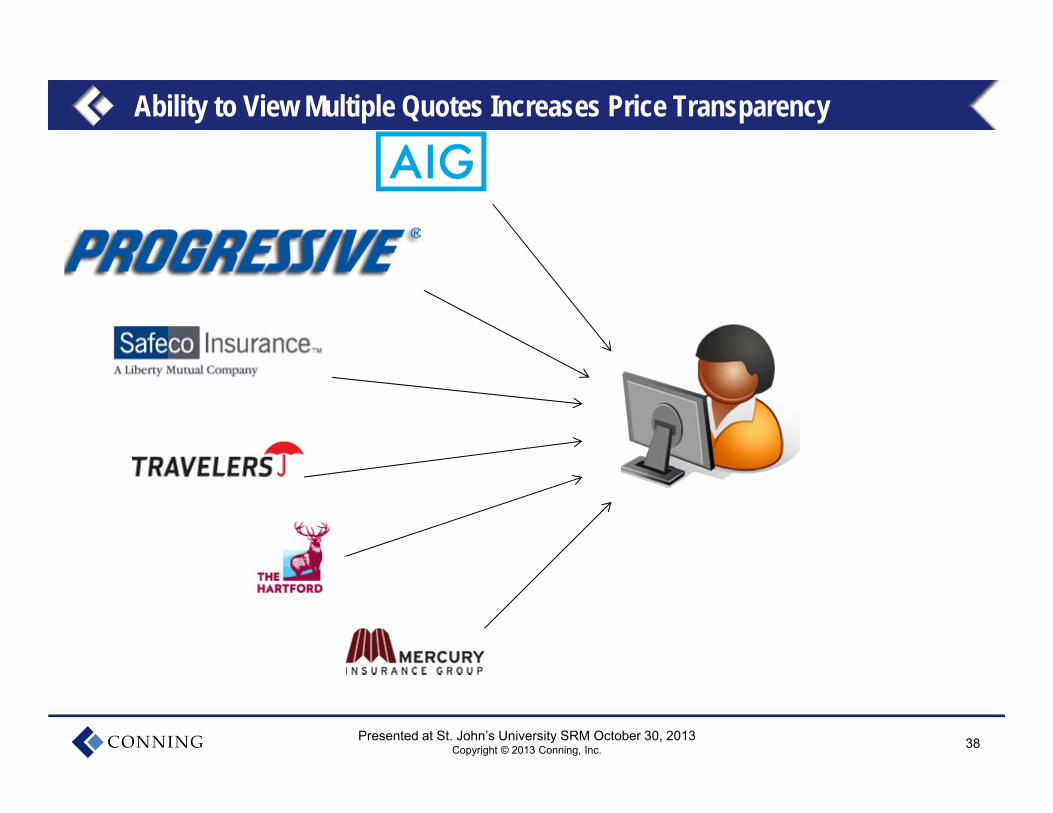
Ability to View Multiple Quotes Increases Price Transparency
39Presented at St. John’s University SRM October 30, 2013Copyright © 2013 Conning, Inc.
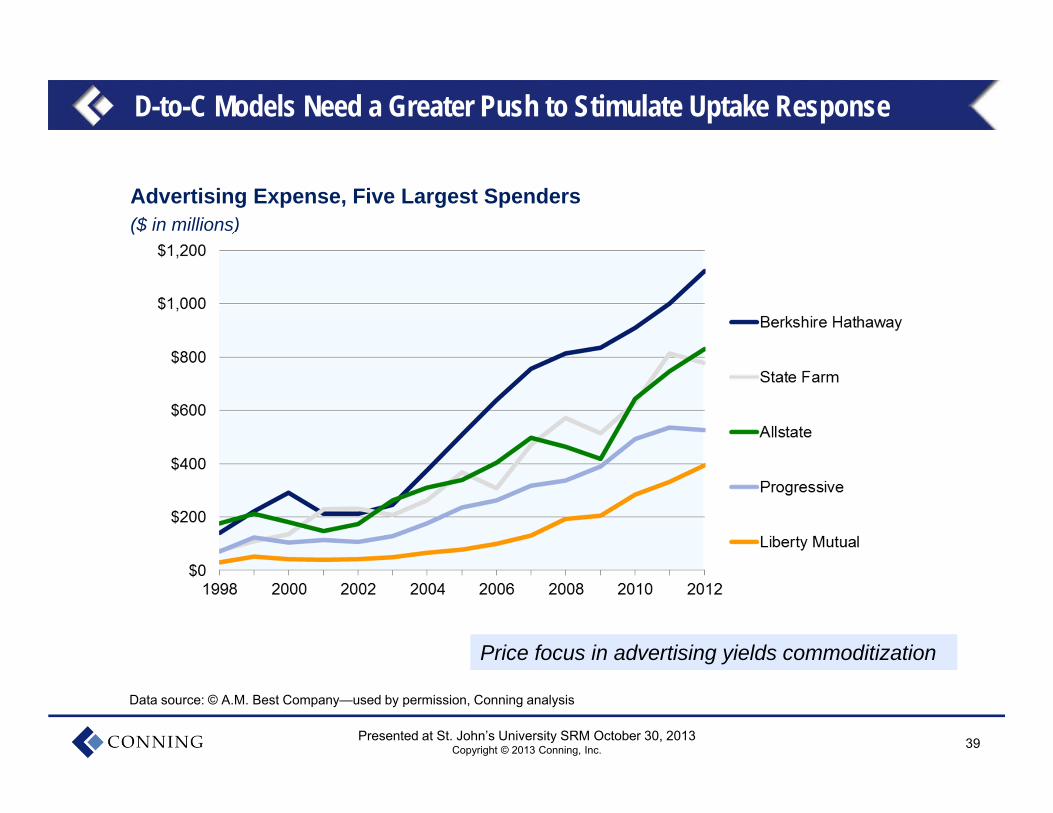
D-to-C Models Need a Greater Push to Stimulate Uptake Response
Advertising Expense, Five Largest Spenders($ in millions)
Data source: © A.M. Best Company—used by permission, Conning analysis
Price focus in advertising yields commoditization Price focus in advertising yields commoditization
40Presented at St. John’s University SRM October 30, 2013Copyright © 2013 Conning, Inc.
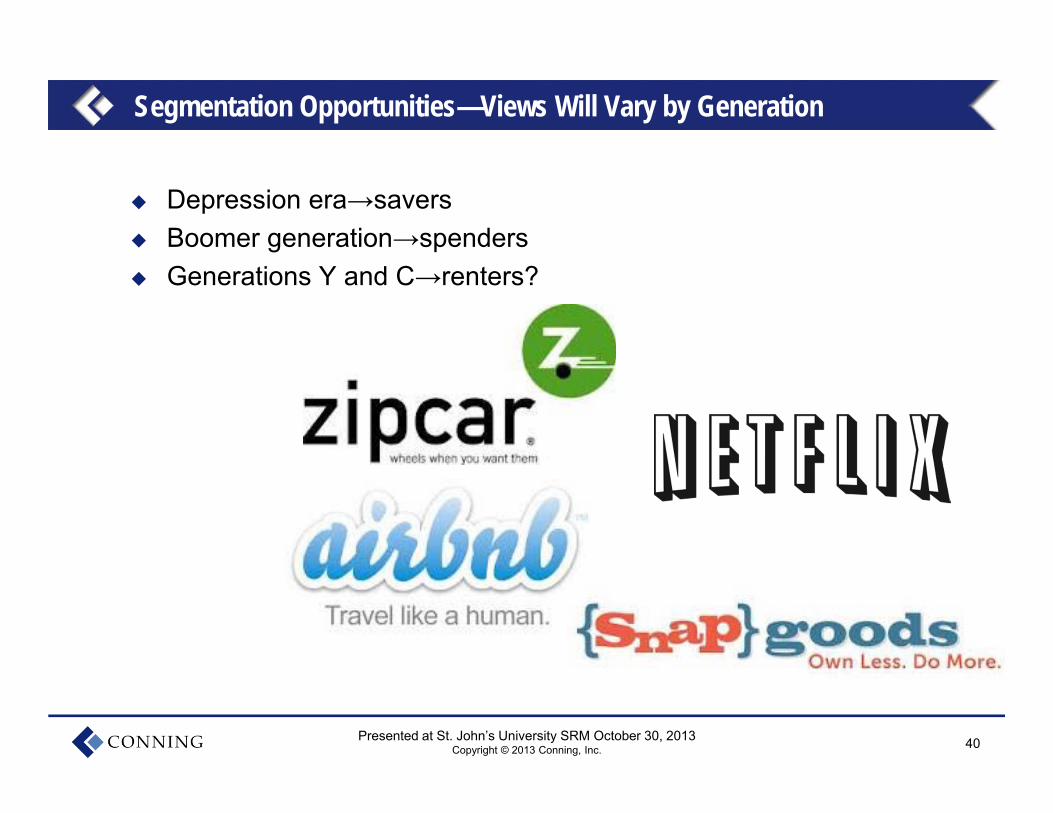
Segmentation Opportunities—Views Will Vary by Generation
Depression era→savers Boomer generation→spenders Generations Y and C→renters?
41Presented at St. John’s University SRM October 30, 2013Copyright © 2013 Conning, Inc.
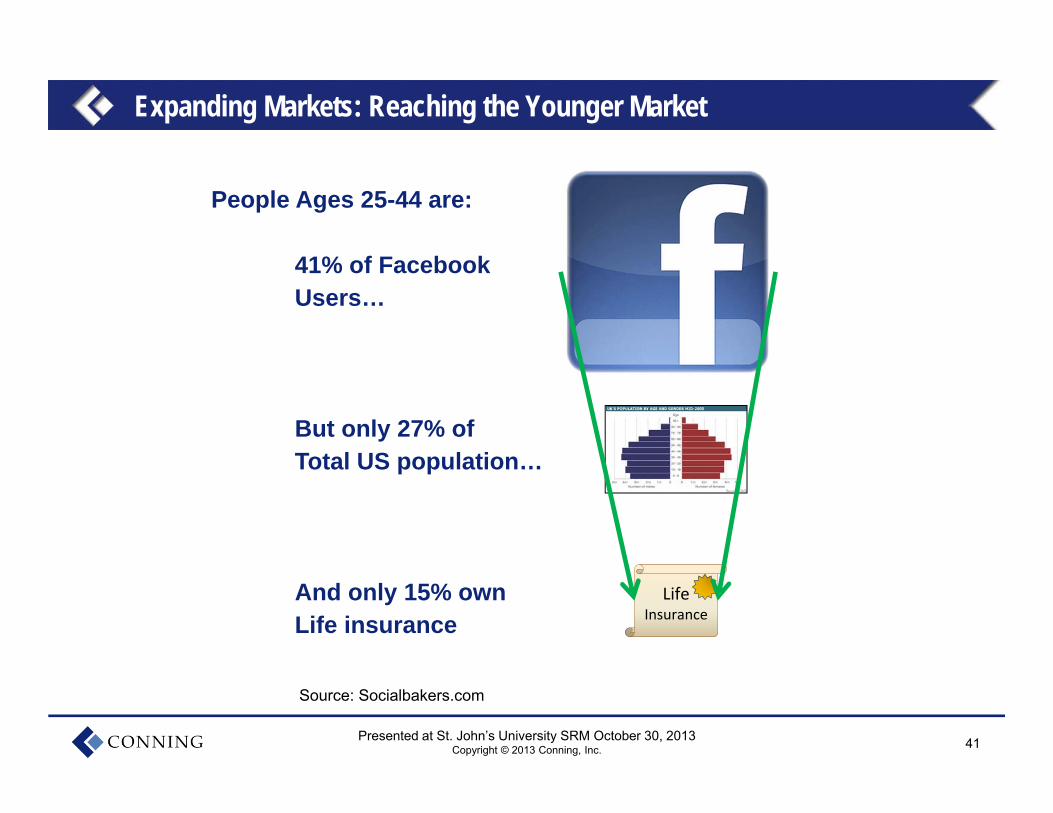
People Ages 25-44 are:
41% of Facebook Users…
But only 27% of Total US population…
And only 15% ownLife insurance
Expanding Markets: Reaching the Younger Market
Source: Socialbakers.com
Life Insurance
42Presented at St. John’s University SRM October 30, 2013Copyright © 2013 Conning, Inc.
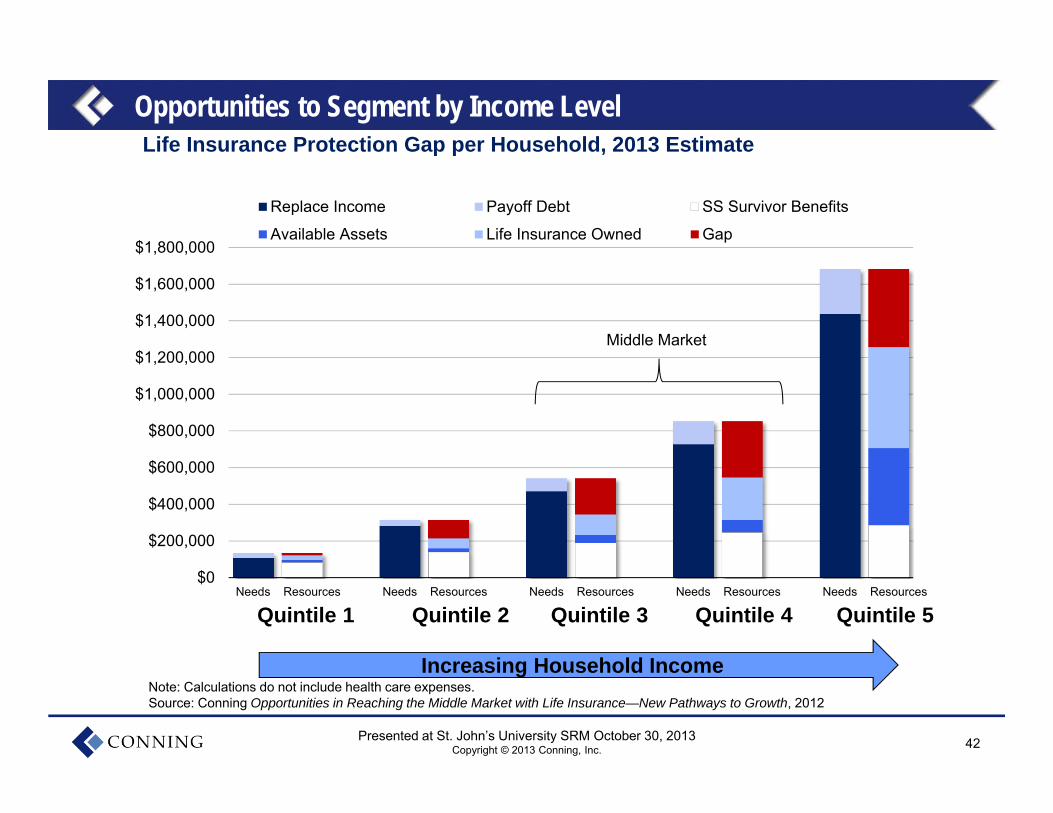
Opportunities to Segment by Income LevelLife Insurance Protection Gap per Household, 2013 Estimate
Note: Calculations do not include health care expenses.Source: Conning Opportunities in Reaching the Middle Market with Life Insurance—New Pathways to Growth, 2012
$0
$200,000
$400,000
$600,000
$800,000
$1,000,000
$1,200,000
$1,400,000
$1,600,000
$1,800,000
Needs Resources Needs Resources Needs Resources Needs Resources Needs Resources
Replace Income Payoff Debt SS Survivor Benefits
Available Assets Life Insurance Owned Gap
Quintile 1 Quintile 2 Quintile 3 Quintile 4 Quintile 5
Middle Market
Increasing Household Income
43Presented at St. John’s University SRM October 30, 2013Copyright © 2013 Conning, Inc.
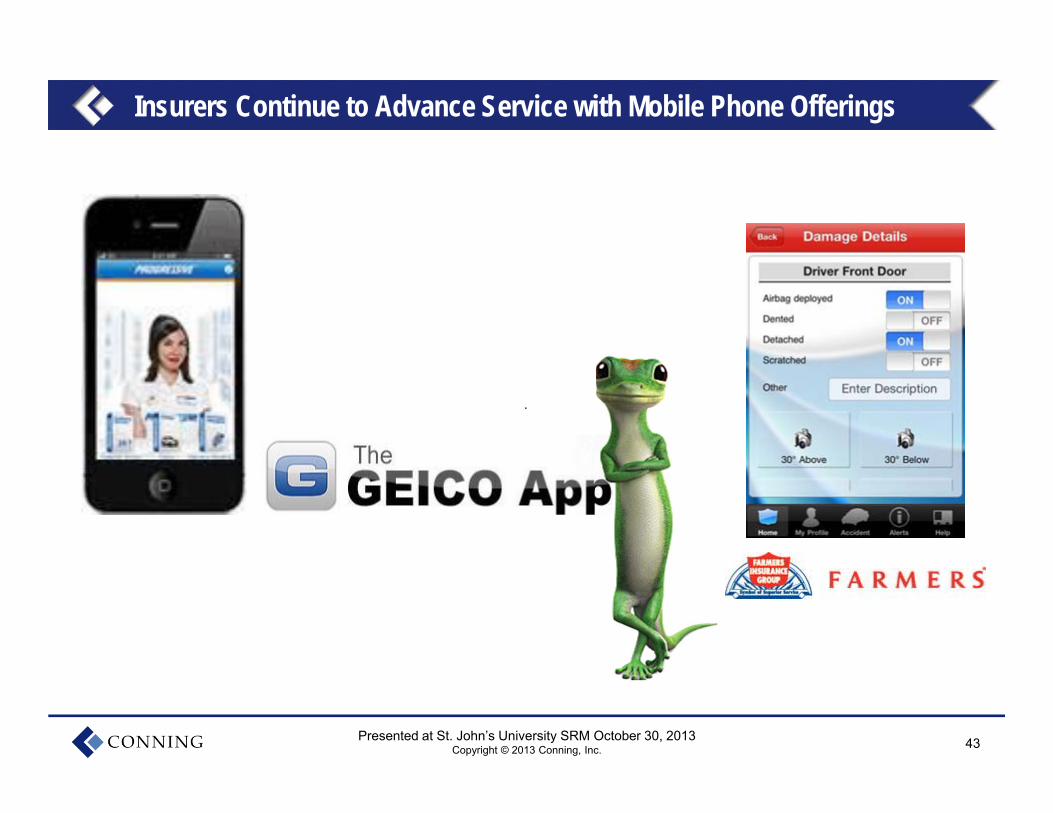
Insurers Continue to Advance Service with Mobile Phone Offerings
44Presented at St. John’s University SRM October 30, 2013Copyright © 2013 Conning, Inc.
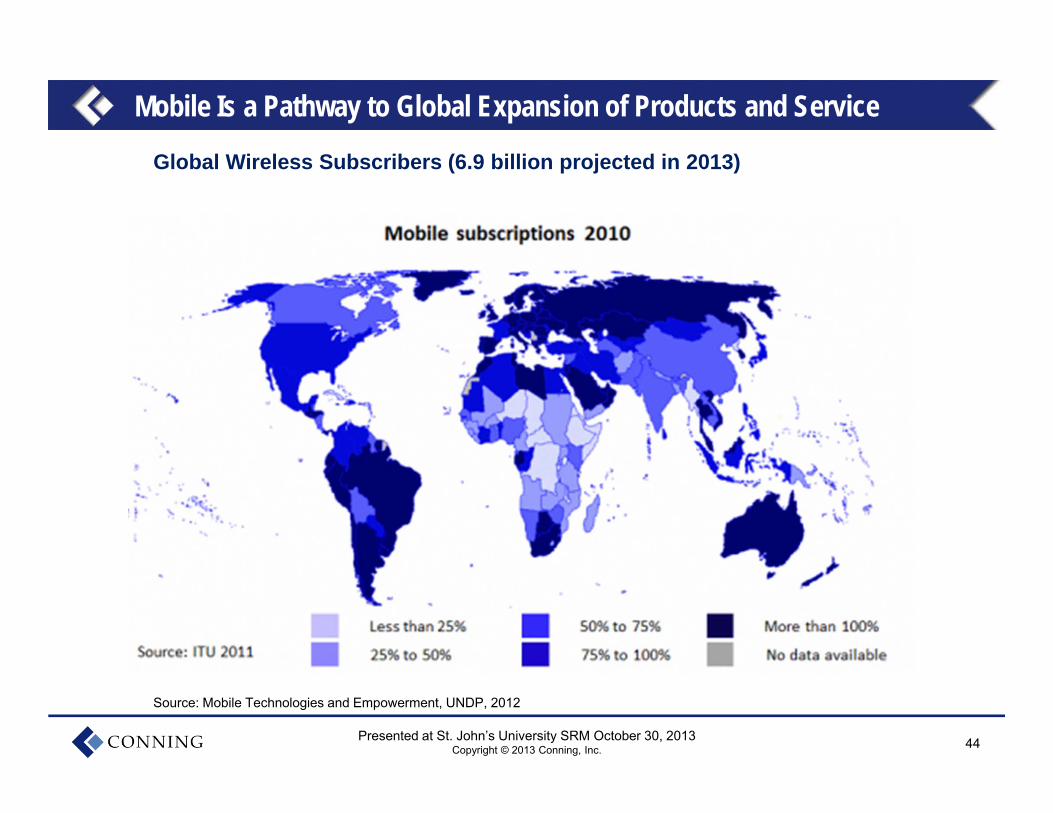
Mobile Is a Pathway to Global Expansion of Products and Service
Source: Mobile Technologies and Empowerment, UNDP, 2012
Global Wireless Subscribers (6.9 billion projected in 2013)
45Presented at St. John’s University SRM October 30, 2013Copyright © 2013 Conning, Inc.
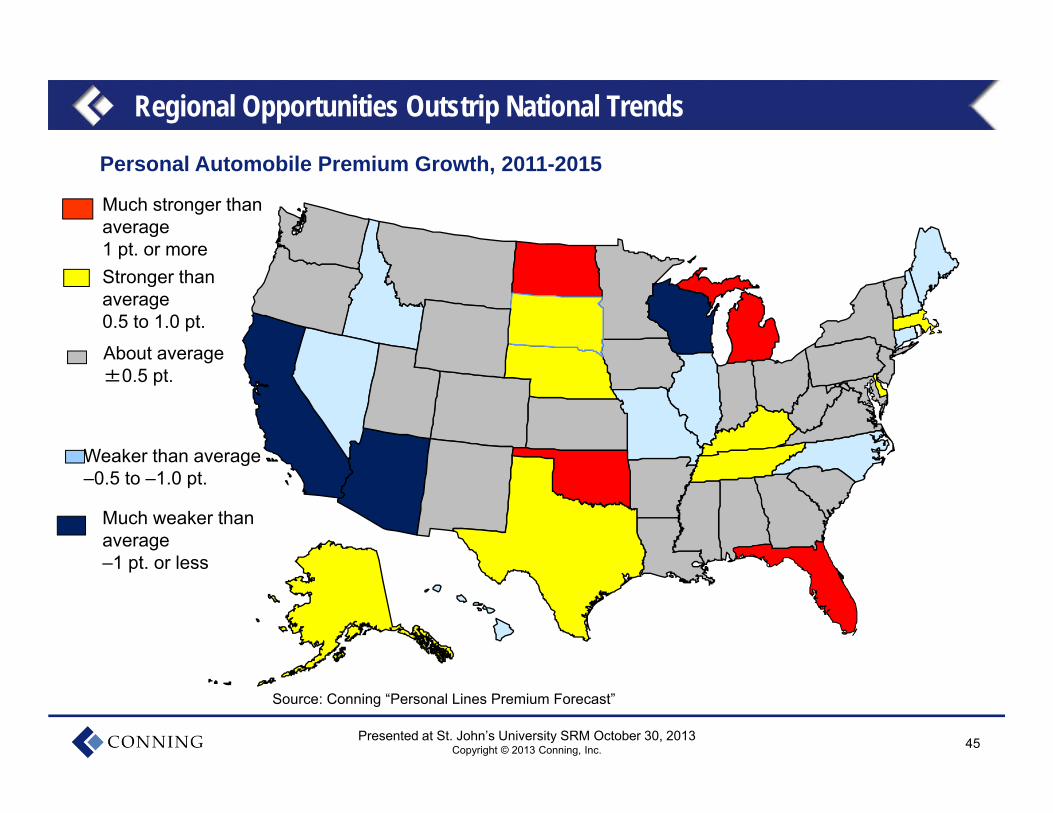
Personal Automobile Premium Growth, 2011-2015
Much stronger than average1 pt. or moreStronger than average0.5 to 1.0 pt.
About average±0.5 pt.
Weaker than average–0.5 to –1.0 pt.
Much weaker than average–1 pt. or less
Source: Conning “Personal Lines Premium Forecast”
Regional Opportunities Outstrip National Trends
46Presented at St. John’s University SRM October 30, 2013Copyright © 2013 Conning, Inc.
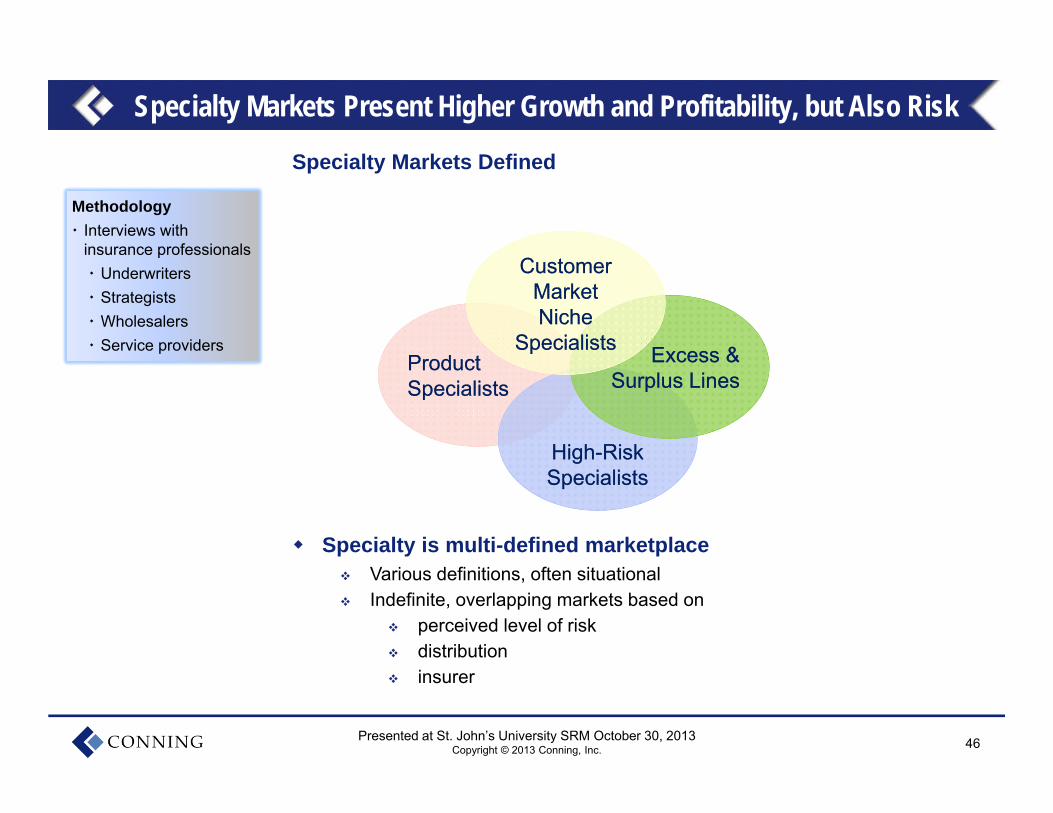
Specialty Markets Present Higher Growth and Profitability, but Also Risk
Specialty Markets Defined
Specialty is multi-defined marketplace Various definitions, often situational Indefinite, overlapping markets based on
perceived level of risk distribution insurer
Product SpecialistsProduct Specialists
High-Risk SpecialistsHigh-Risk Specialists
Excess & Surplus Lines
Excess & Surplus Lines
Customer Market Niche
Specialists
Customer Market Niche
Specialists
Methodology Interviews with
insurance professionals Underwriters Strategists Wholesalers Service providers
47Presented at St. John’s University SRM October 30, 2013Copyright © 2013 Conning, Inc.
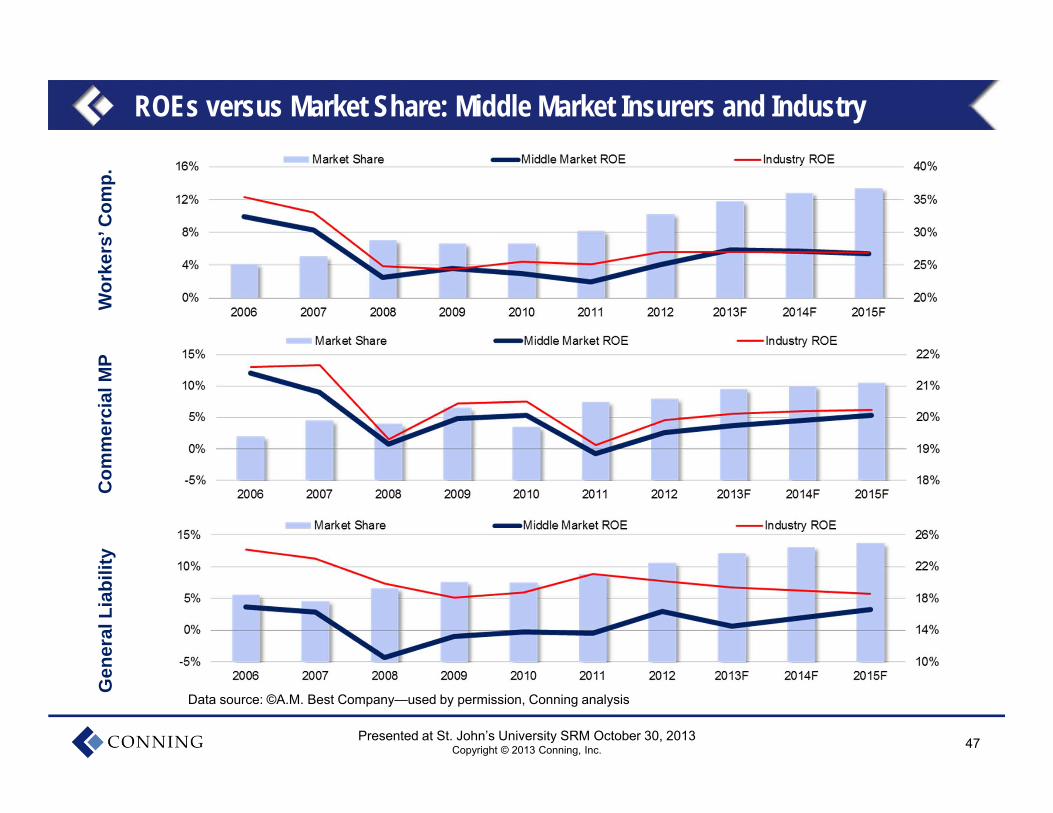
ROEs versus Market Share: Middle Market Insurers and IndustryW
orke
rs’ C
omp.
Com
mer
cial
MP
Gen
eral
Lia
bilit
y
Data source: ©A.M. Best Company—used by permission, Conning analysis
48Presented at St. John’s University SRM October 30, 2013Copyright © 2013 Conning, Inc.
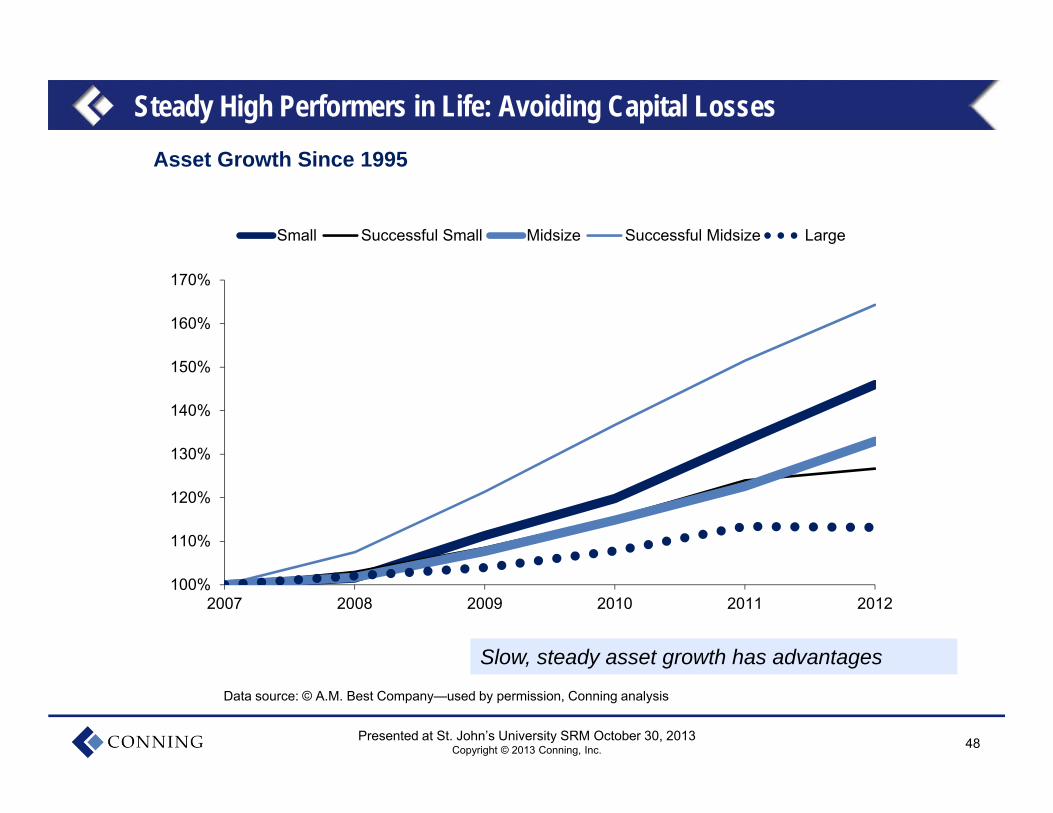
Steady High Performers in Life: Avoiding Capital LossesAsset Growth Since 1995
100%
110%
120%
130%
140%
150%
160%
170%
2007 2008 2009 2010 2011 2012
Small Successful Small Midsize Successful Midsize Large
Data source: © A.M. Best Company—used by permission, Conning analysis
Slow, steady asset growth has advantagesSlow, steady asset growth has advantages
49Presented at St. John’s University SRM October 30, 2013Copyright © 2013 Conning, Inc.
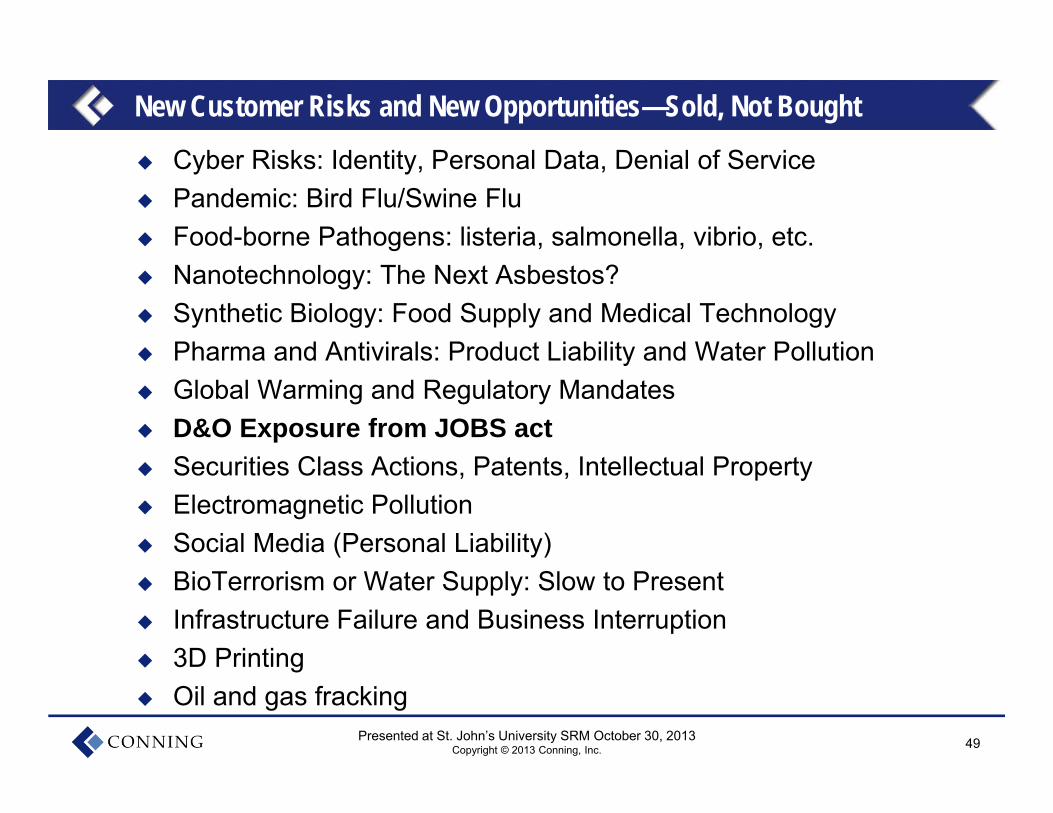
Cyber Risks: Identity, Personal Data, Denial of Service Pandemic: Bird Flu/Swine Flu Food-borne Pathogens: listeria, salmonella, vibrio, etc. Nanotechnology: The Next Asbestos? Synthetic Biology: Food Supply and Medical Technology Pharma and Antivirals: Product Liability and Water Pollution Global Warming and Regulatory Mandates D&O Exposure from JOBS act Securities Class Actions, Patents, Intellectual Property Electromagnetic Pollution Social Media (Personal Liability) BioTerrorism or Water Supply: Slow to Present Infrastructure Failure and Business Interruption 3D Printing Oil and gas fracking
New Customer Risks and New Opportunities—Sold, Not Bought
50Presented at St. John’s University SRM October 30, 2013Copyright © 2013 Conning, Inc.
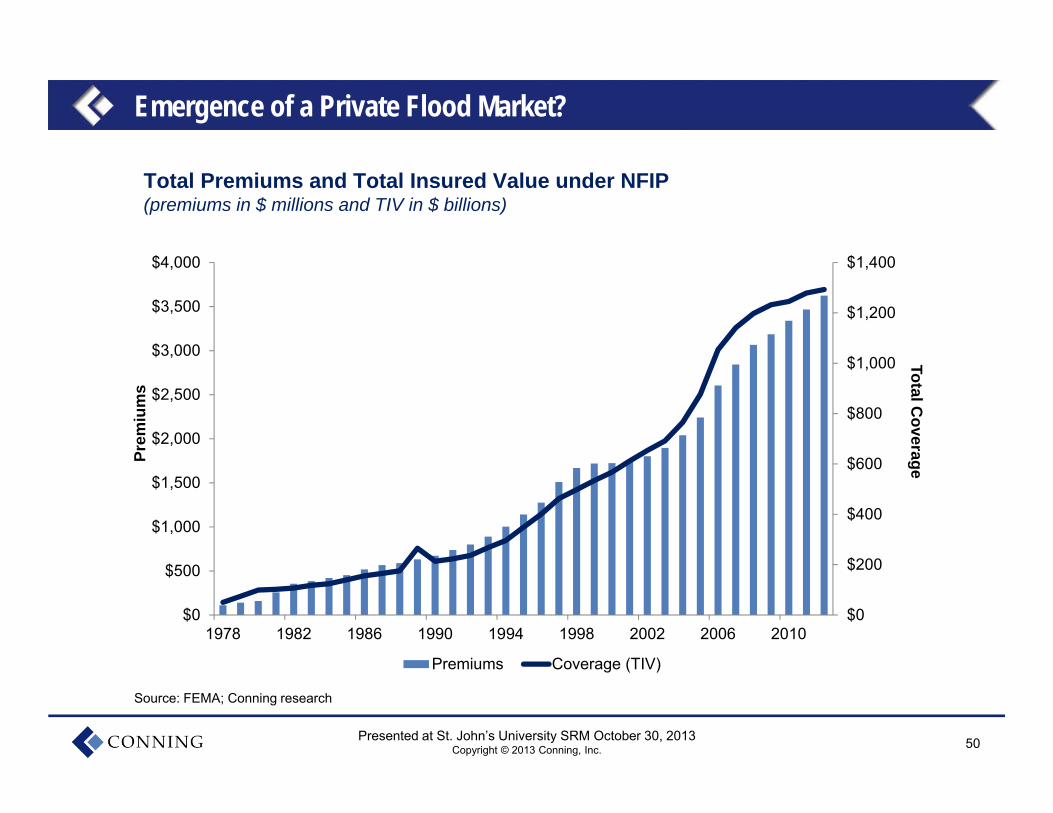
Emergence of a Private Flood Market?
$0
$200
$400
$600
$800
$1,000
$1,200
$1,400
$0
$500
$1,000
$1,500
$2,000
$2,500
$3,000
$3,500
$4,000
1978 1982 1986 1990 1994 1998 2002 2006 2010
Total Coverage
Prem
ium
s
Premiums Coverage (TIV)
Total Premiums and Total Insured Value under NFIP(premiums in $ millions and TIV in $ billions)
Source: FEMA; Conning research
51Presented at St. John’s University SRM October 30, 2013Copyright © 2013 Conning, Inc.
Customers’ own risk retention: RRGs, Captives, Deductibles
Global capital: marginalizes dedicated capital, opens new
markets
Competition from outside? Challenging the Value Proposition
Competition from Outside? Challenging the Value Proposition
52Presented at St. John’s University SRM October 30, 2013Copyright © 2013 Conning, Inc.
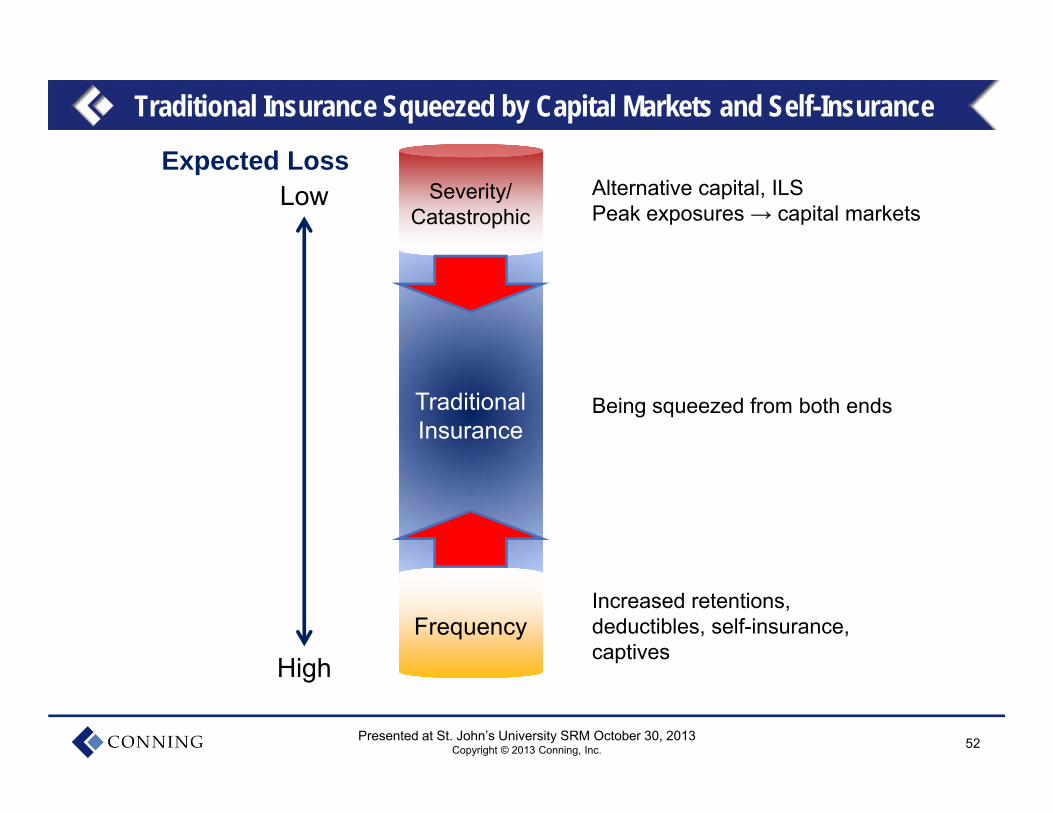
Traditional Insurance Squeezed by Capital Markets and Self-Insurance
Traditional InsuranceTraditional Insurance
Expected LossLow
High
Severity/ Catastrophic
Severity/ Catastrophic
FrequencyFrequency
Alternative capital, ILSPeak exposures → capital markets
Being squeezed from both ends
Increased retentions, deductibles, self-insurance, captives

53Presented at St. John’s University SRM October 30, 2013Copyright © 2013 Conning, Inc.
Safety Technology Is Bridging to Intelligence Features
Volvo’s City Safety Technology
Source: Volvocars.com
54Presented at St. John’s University SRM October 30, 2013Copyright © 2013 Conning, Inc.
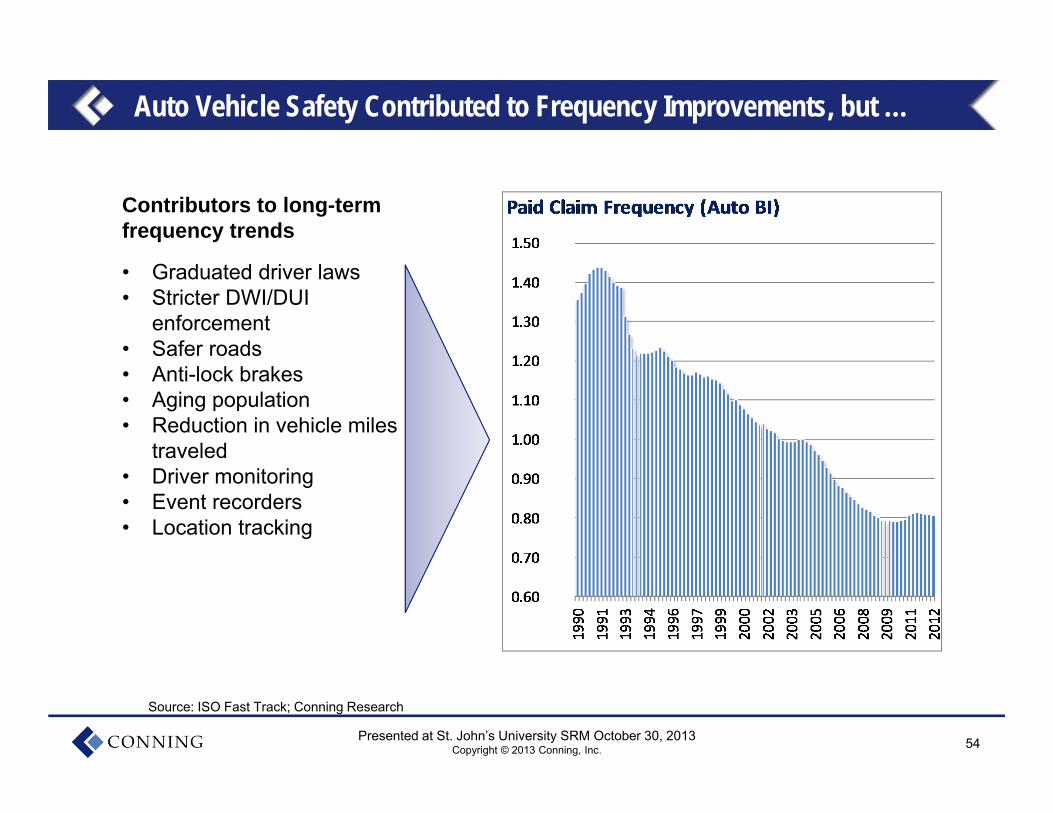
Auto Vehicle Safety Contributed to Frequency Improvements, but …
Contributors to long-term frequency trends
• Graduated driver laws• Stricter DWI/DUI
enforcement• Safer roads• Anti-lock brakes• Aging population• Reduction in vehicle miles
traveled• Driver monitoring• Event recorders• Location tracking
Source: ISO Fast Track; Conning Research
55Presented at St. John’s University SRM October 30, 2013Copyright © 2013 Conning, Inc.
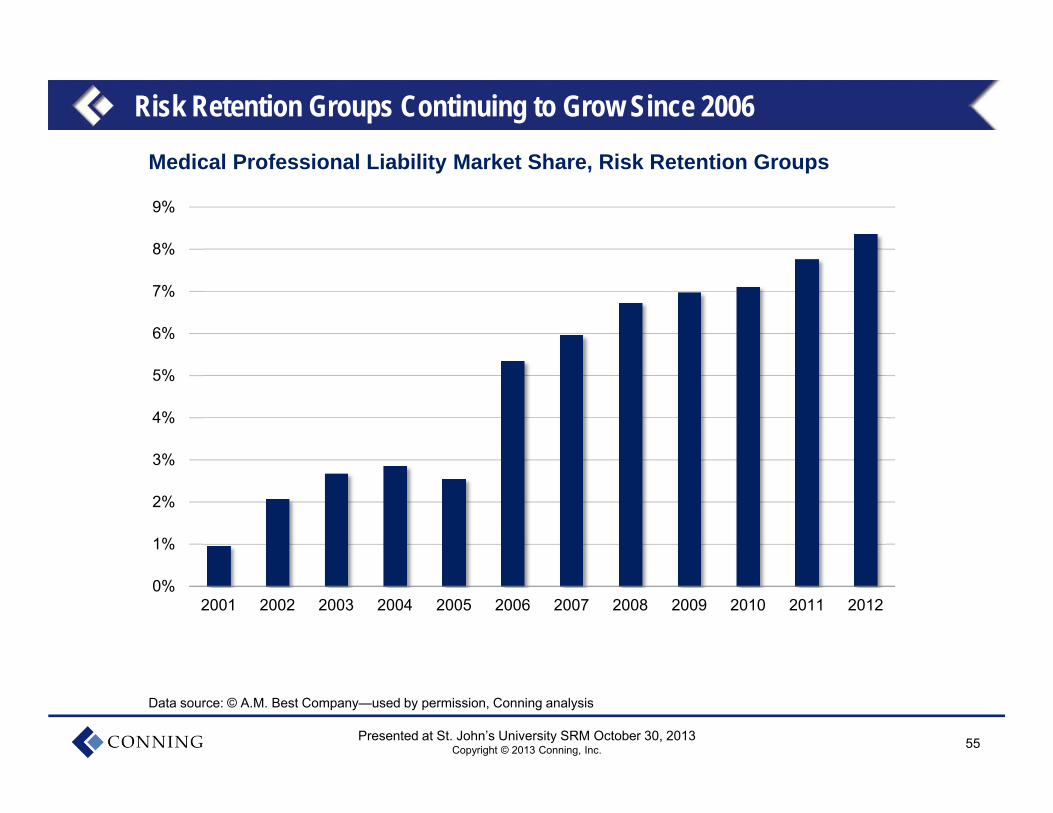
Medical Professional Liability Market Share, Risk Retention Groups
Data source: © A.M. Best Company—used by permission, Conning analysis
0%
1%
2%
3%
4%
5%
6%
7%
8%
9%
2001 2002 2003 2004 2005 2006 2007 2008 2009 2010 2011 2012
Risk Retention Groups Continuing to Grow Since 2006
56Presented at St. John’s University SRM October 30, 2013Copyright © 2013 Conning, Inc.
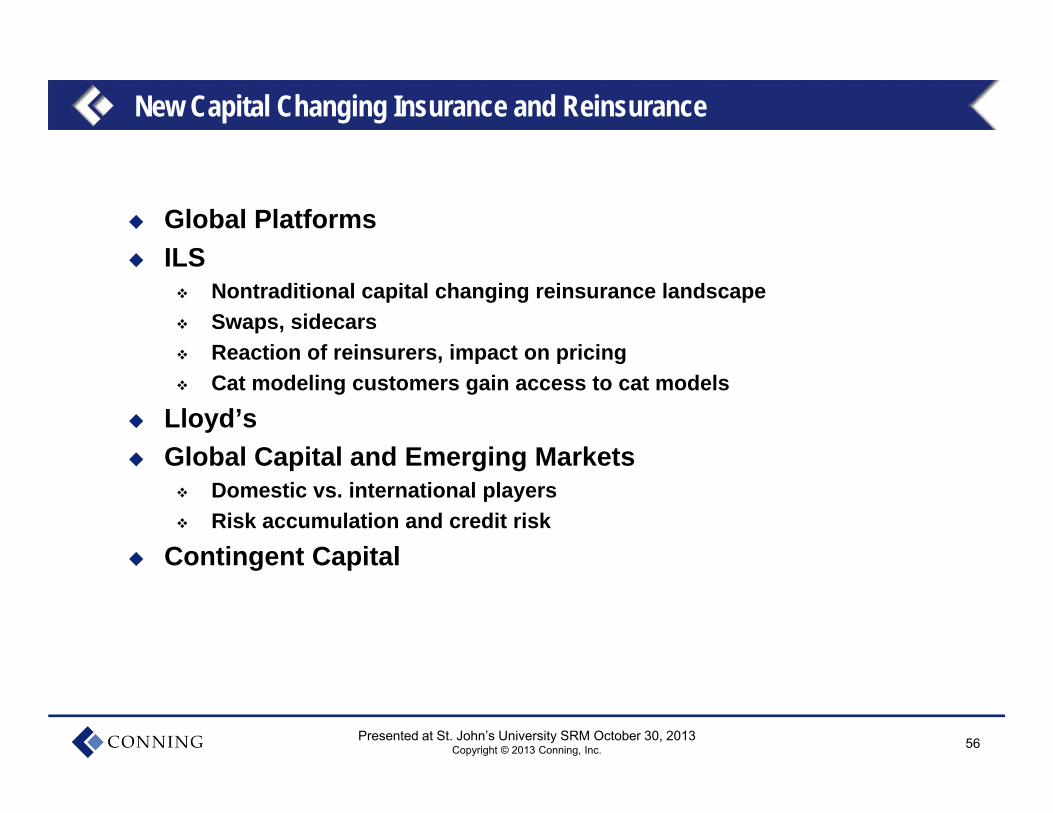
New Capital Changing Insurance and Reinsurance
Global Platforms ILS
Nontraditional capital changing reinsurance landscape Swaps, sidecars Reaction of reinsurers, impact on pricing Cat modeling customers gain access to cat models
Lloyd’s Global Capital and Emerging Markets
Domestic vs. international players Risk accumulation and credit risk
Contingent Capital
57Presented at St. John’s University SRM October 30, 2013Copyright © 2013 Conning, Inc.
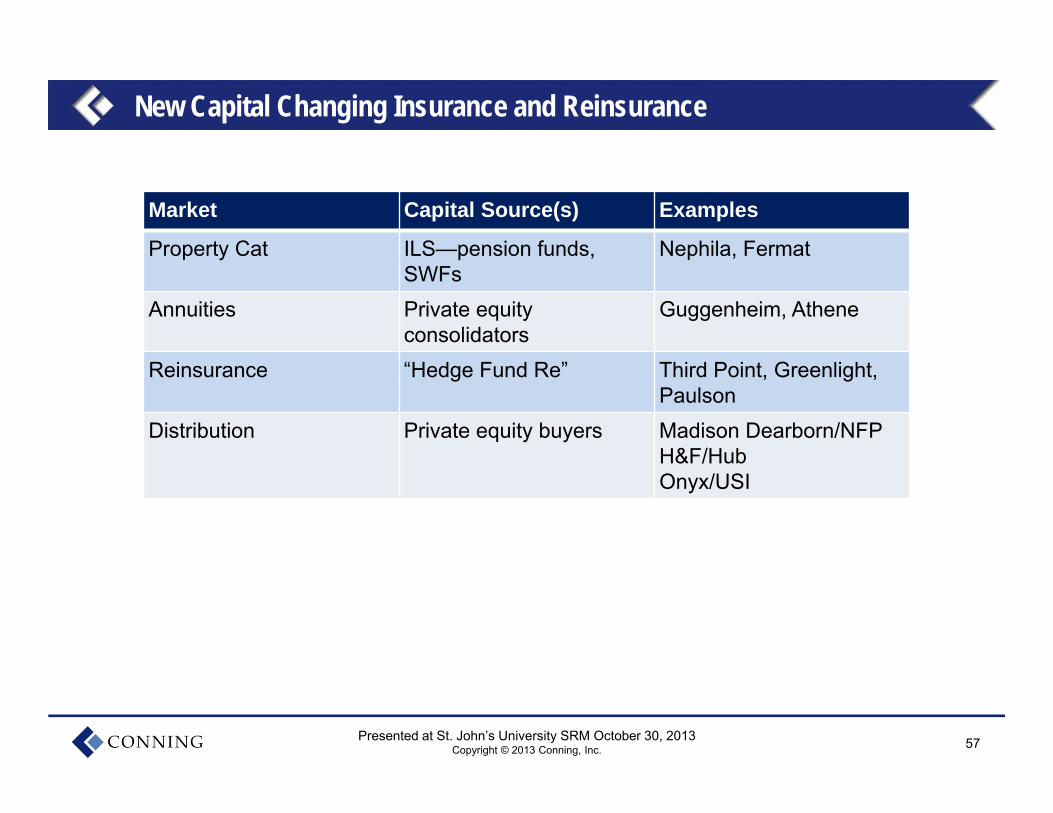
New Capital Changing Insurance and Reinsurance
Market Capital Source(s) Examples
Property Cat ILS—pension funds, SWFs
Nephila, Fermat
Annuities Private equity consolidators
Guggenheim, Athene
Reinsurance “Hedge Fund Re” Third Point, Greenlight, Paulson
Distribution Private equity buyers Madison Dearborn/NFPH&F/HubOnyx/USI
58Presented at St. John’s University SRM October 30, 2013Copyright © 2013 Conning, Inc.
Potential New Entrants Challenging the Value Proposition
Banks, brokers Alternative capital Government safety nets and subsidies
But what about….
Big Box Retailers Walmart Costco
Technology and eCommerce Google, Amazon Crowdfunding
Examples
59Presented at St. John’s University SRM October 30, 2013Copyright © 2013 Conning, Inc.
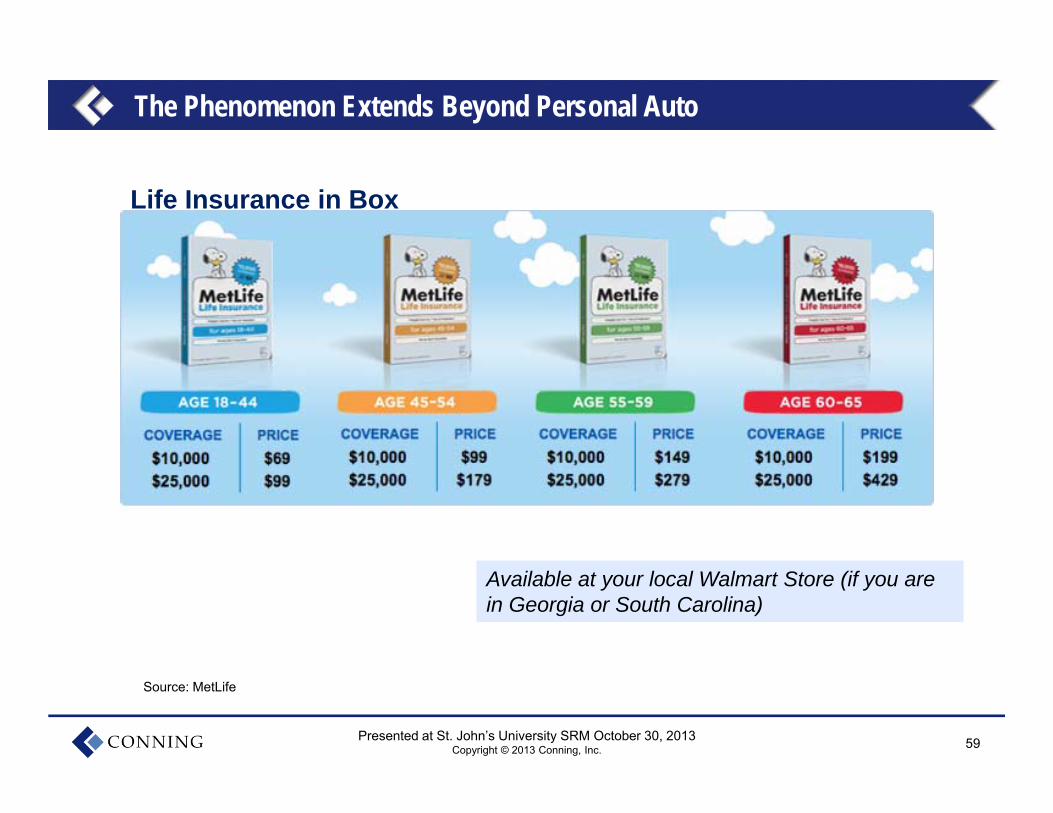
The Phenomenon Extends Beyond Personal Auto
Life Insurance in Box
Source: MetLife
Available at your local Walmart Store (if you are in Georgia or South Carolina)Available at your local Walmart Store (if you are in Georgia or South Carolina)
60Presented at St. John’s University SRM October 30, 2013Copyright © 2013 Conning, Inc.
Regulatory Complexity Challenging the Business Model
Multiple layers of jurisdiction
Competing and sometimes conflicting purposes
Opportunities for the nimble?
61Presented at St. John’s University SRM October 30, 2013Copyright © 2013 Conning, Inc.
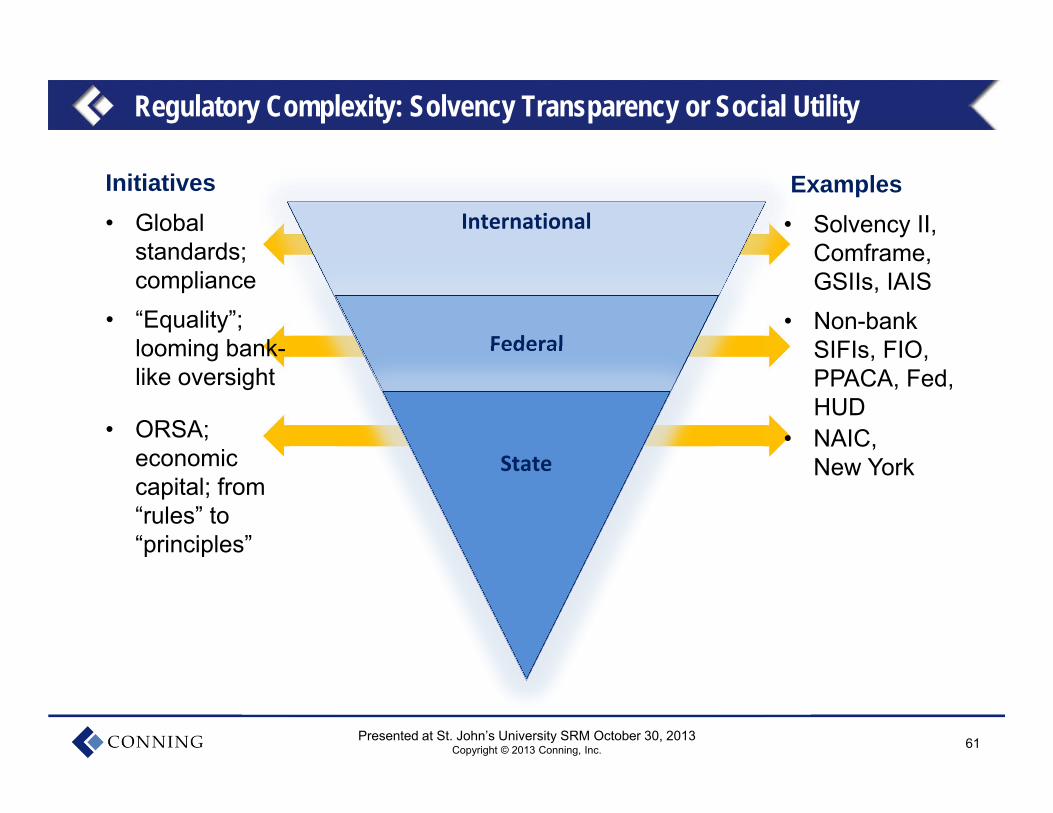
Regulatory Complexity: Solvency Transparency or Social Utility
International
Federal
State
Initiatives
• “Equality”; looming bank-like oversight
• Global standards; compliance
• ORSA; economic capital; from “rules” to “principles”
Examples
• Non-bank SIFIs, FIO, PPACA, Fed, HUD
• Solvency II, Comframe, GSIIs, IAIS
• NAIC, New York
62Presented at St. John’s University SRM October 30, 2013Copyright © 2013 Conning, Inc.
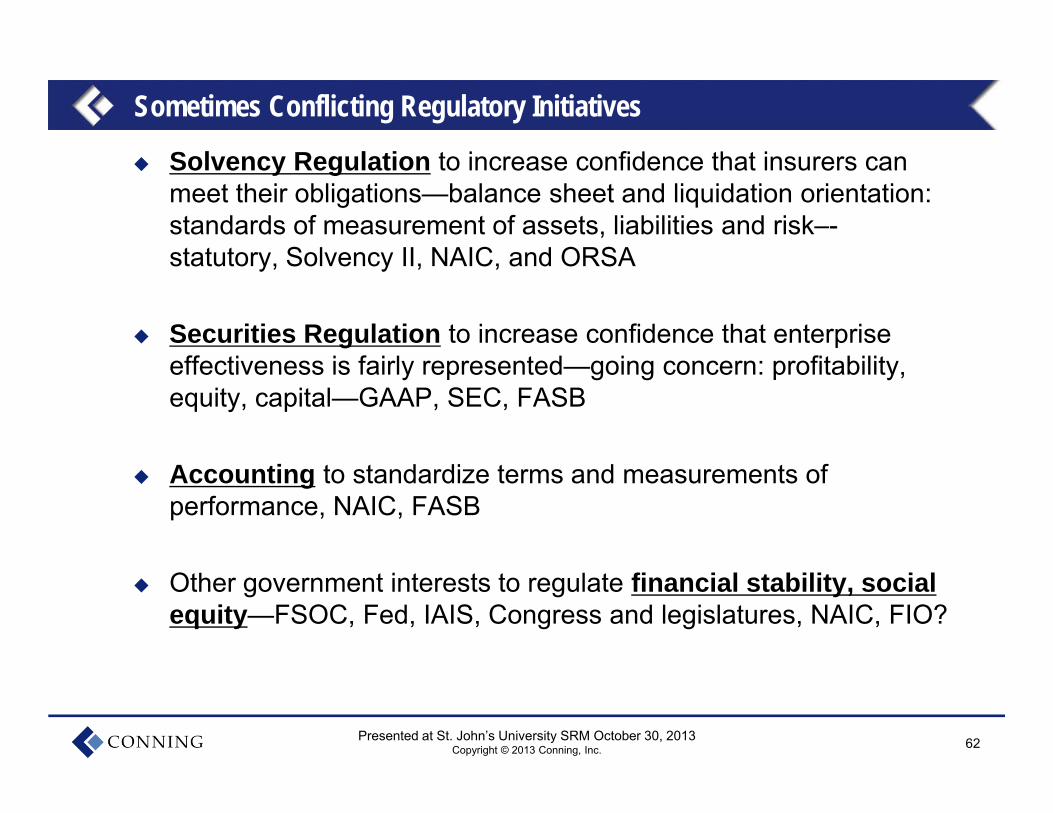
Sometimes Conflicting Regulatory Initiatives
Solvency Regulation to increase confidence that insurers can meet their obligations—balance sheet and liquidation orientation: standards of measurement of assets, liabilities and risk–-statutory, Solvency II, NAIC, and ORSA
Securities Regulation to increase confidence that enterprise effectiveness is fairly represented—going concern: profitability, equity, capital—GAAP, SEC, FASB
Accounting to standardize terms and measurements of performance, NAIC, FASB
Other government interests to regulate financial stability, social equity—FSOC, Fed, IAIS, Congress and legislatures, NAIC, FIO?
63Presented at St. John’s University SRM October 30, 2013Copyright © 2013 Conning, Inc.
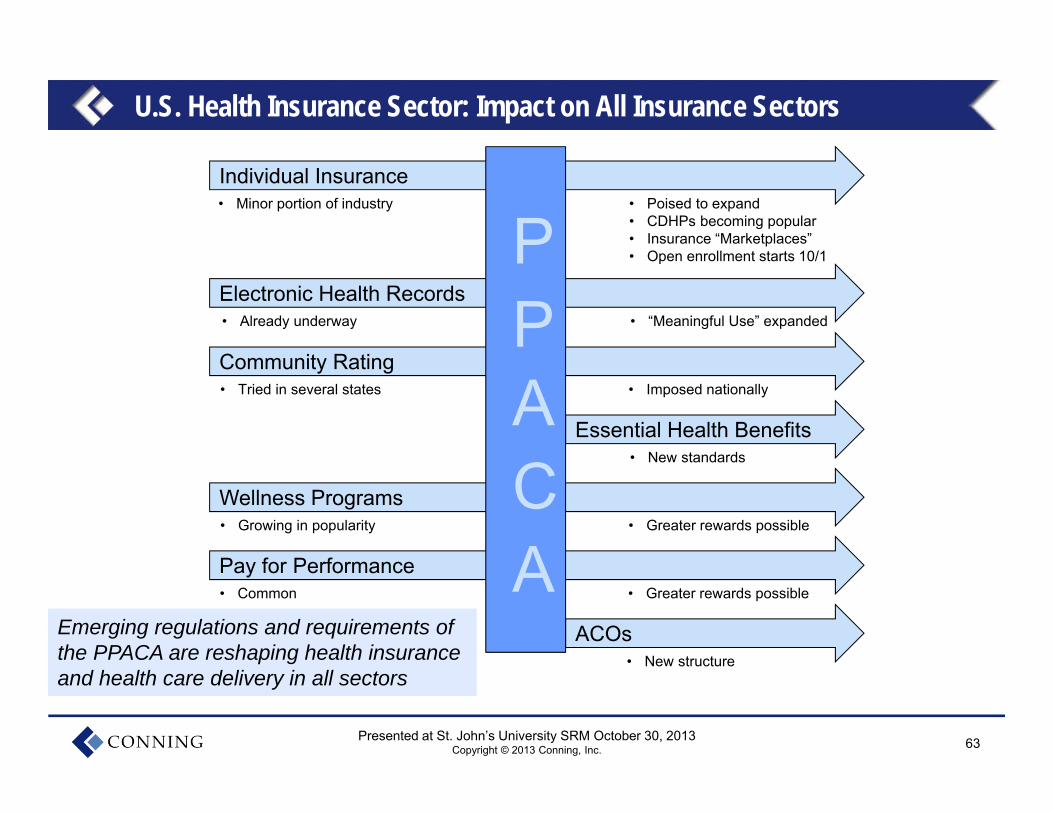
U.S. Health Insurance Sector: Impact on All Insurance Sectors
Pay for Performance
Electronic Health Records
Community Rating
Essential Health Benefits
Wellness Programs
Individual Insurance
ACOs
• Minor portion of industry • Poised to expand• CDHPs becoming popular• Insurance “Marketplaces”• Open enrollment starts 10/1
• Already underway • “Meaningful Use” expanded
• Tried in several states • Imposed nationally
• New standards
• Growing in popularity • Greater rewards possible
• Common • Greater rewards possible
• New structure
PPACA
Emerging regulations and requirements of the PPACA are reshaping health insurance and health care delivery in all sectors
Emerging regulations and requirements of the PPACA are reshaping health insurance and health care delivery in all sectors
64Presented at St. John’s University SRM October 30, 2013Copyright © 2013 Conning, Inc.
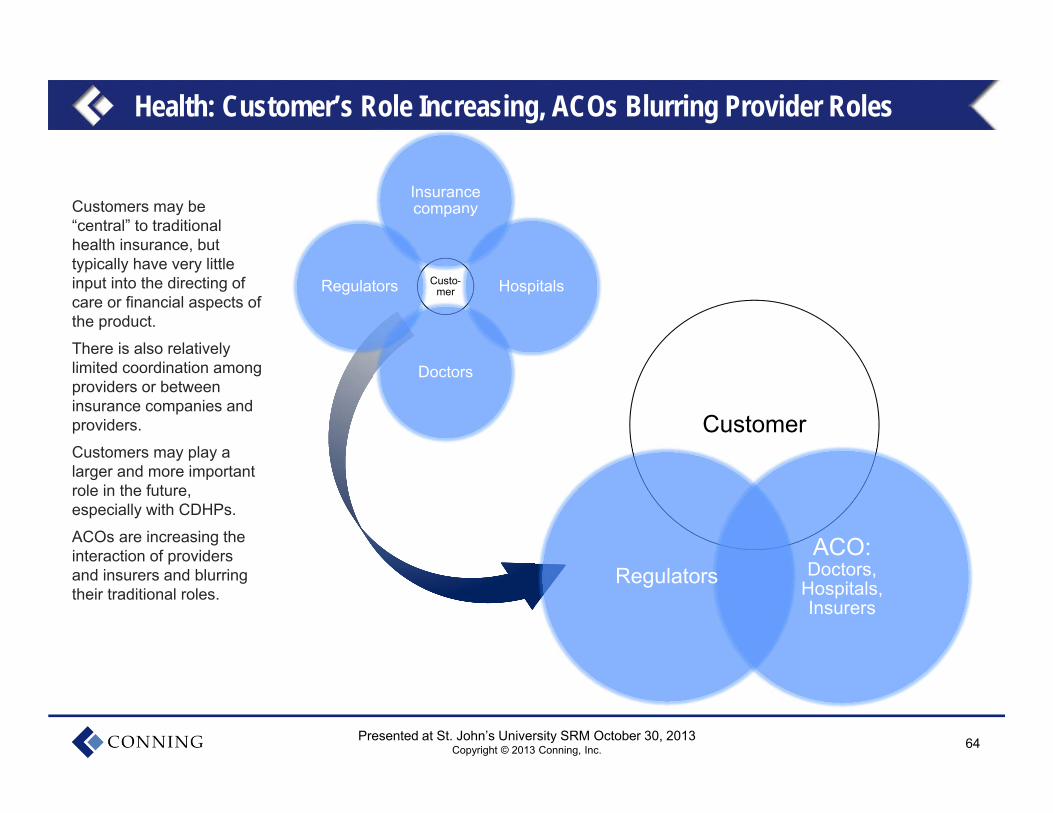
Health: Customer’s Role Increasing, ACOs Blurring Provider Roles
Custo-mer
Insurance company
Hospitals
Doctors
Regulators
Customer
ACO:Doctors,
Hospitals, Insurers
Regulators
Customers may be “central” to traditional health insurance, but typically have very little input into the directing of care or financial aspects of the product.
There is also relatively limited coordination among providers or between insurance companies and providers.
Customers may play a larger and more important role in the future, especially with CDHPs.
ACOs are increasing the interaction of providers and insurers and blurring their traditional roles.
65Presented at St. John’s University SRM October 30, 2013Copyright © 2013 Conning, Inc.
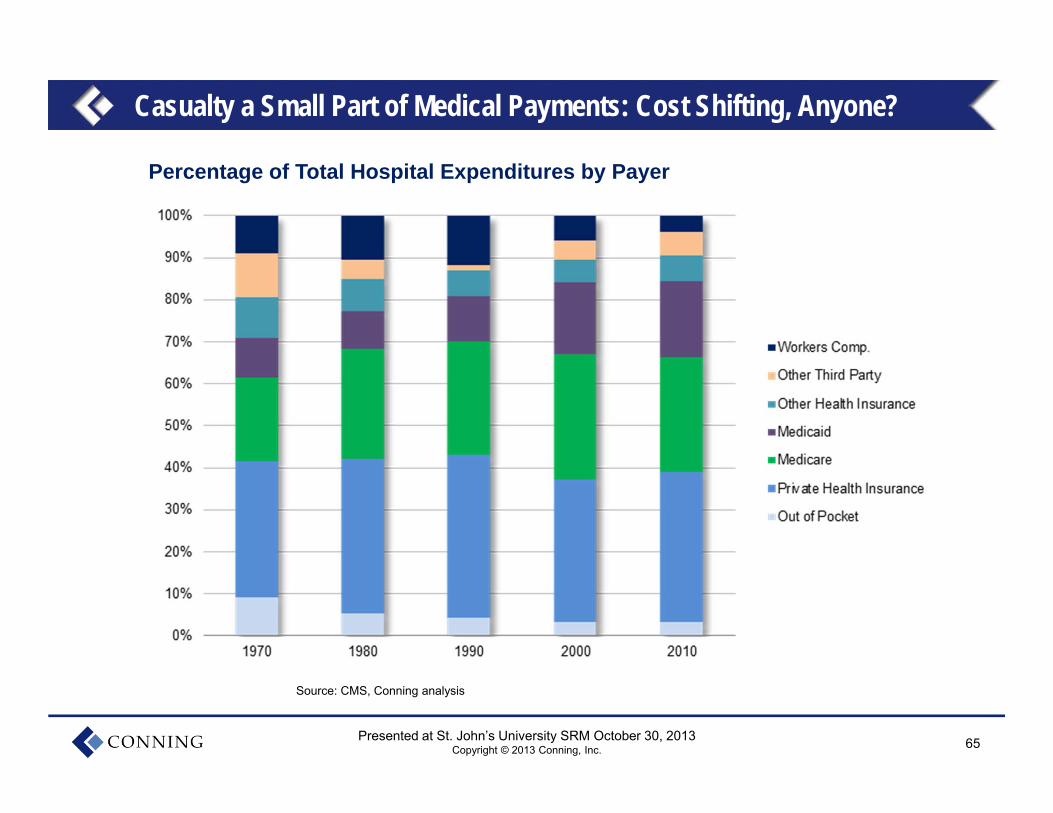
Casualty a Small Part of Medical Payments: Cost Shifting, Anyone?
Source: CMS, Conning analysis
Percentage of Total Hospital Expenditures by Payer
66Presented at St. John’s University SRM October 30, 2013Copyright © 2013 Conning, Inc.
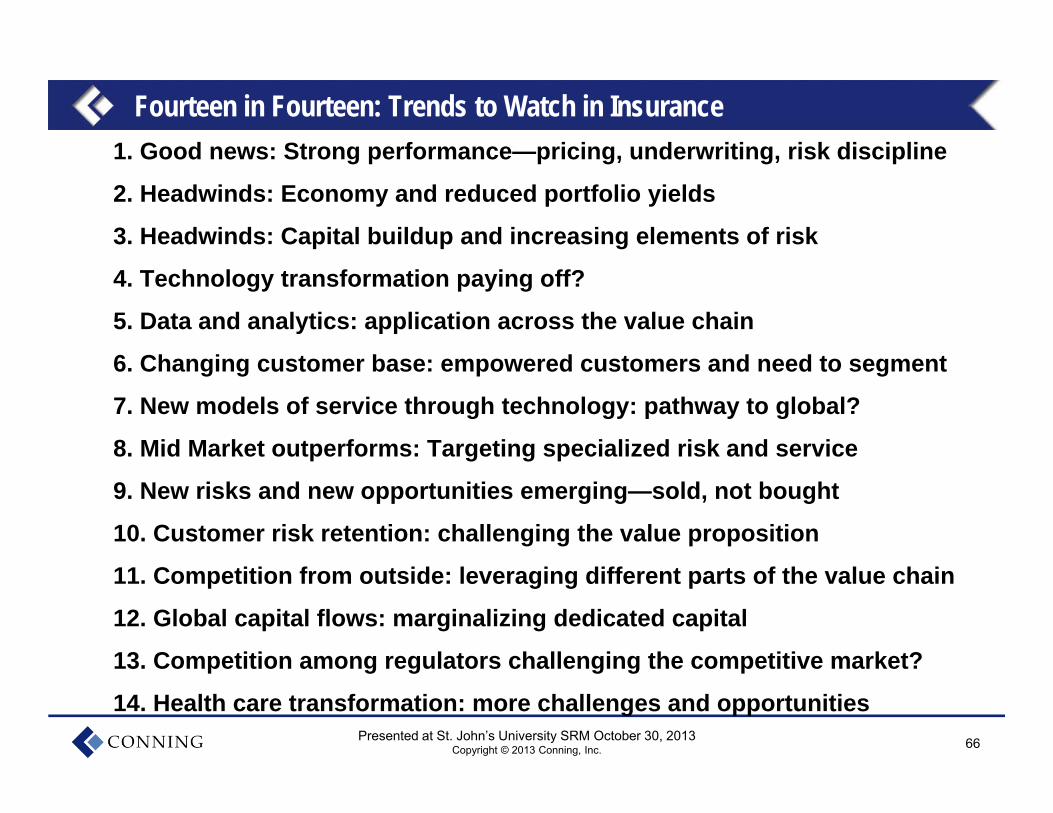
Fourteen in Fourteen: Trends to Watch in Insurance 1. Good news: Strong performance—pricing, underwriting, risk discipline
2. Headwinds: Economy and reduced portfolio yields
3. Headwinds: Capital buildup and increasing elements of risk
4. Technology transformation paying off?
5. Data and analytics: application across the value chain
6. Changing customer base: empowered customers and need to segment
7. New models of service through technology: pathway to global?
8. Mid Market outperforms: Targeting specialized risk and service
9. New risks and new opportunities emerging—sold, not bought
10. Customer risk retention: challenging the value proposition
11. Competition from outside: leveraging different parts of the value chain
12. Global capital flows: marginalizing dedicated capital
13. Competition among regulators challenging the competitive market?
14. Health care transformation: more challenges and opportunities
67Presented at St. John’s University SRM October 30, 2013Copyright © 2013 Conning, Inc.
DisclosuresConning & Company is the parent of Conning, Inc., Goodwin Capital Advisers, Inc. and Conning Investment Products, Inc., a FINRA-registered broker dealer, andan affiliate of Conning Asset Management Limited, and Cathay Conning Asset Management Limited (CCAM) (together, “Conning”). Conning is a portfoliocompany of the funds managed by Aquiline Capital Partners LLC (a New York-based private equity firm,) with offices in Hartford, Purchase, London, Cologne, andHong Kong.
Conning, Inc. and Goodwin Capital Advisers, Inc. are registered with the Securities and Exchange Commission (“SEC”) under the Investment Advisers Act of1940. Conning, Inc. is also registered with the Ontario Securities Commission. Conning Asset Management Limited is authorized and regulated by the UnitedKingdom's Financial Conduct Authority, and Cathay Conning Asset Management Limited is regulated by Hong Kong’s Securities and Futures Commission.Conning primarily provides asset management services for third-party assets. Conning predominantly invests client portfolios in fixed income strategies inaccordance with guidelines supplied by its institutional clients.
Conning, Inc. is registered as an Investment Adviser with the SEC and has noticed other jurisdictions it is conducting securities advisory business when requiredby law. In any other jurisdictions where it has not provided notice and is not exempt or excluded from those laws, it cannot transact business as an investmentadviser and may not be able to respond to individual inquiries if the response could potentially lead to a transaction in securities.
All investment performance information included within this material is historical. Past performance is not indicative of future results. Any tax related informationcontained within this presentation is for informational purposes only and should not be considered tax advice. You should consult a tax professional with anyquestions.
For complete details regarding Conning and its services, you should refer to our Form ADV Part 2, which may be obtained by calling us.
Legal Disclaimer
Copyright 2013 Conning, Inc. This document and the software described within are copyrighted with all rights reserved. No part of this document may bereproduced, transcribed, transmitted, stored in an electronic retrieval system, or translated into any language in any form by any means without the prior writtenpermission of Conning. Conning does not make any warranties, express or implied, in this document. In no event shall Conning be liable for damages of any kindarising out of the use of this document or the information contained within it.
This document contains information that is confidential or proprietary to Conning (or their direct and indirect subsidiaries). By accepting this document you agreethat: (1) if there is any pre-existing contract containing disclosure and use restrictions between your company and Conning, you and your company will use thisinformation in reliance on and subject to the terms of any such pre-existing contract; or (2) if there is no contractual relationship between you and your companyand Conning, you and your company agree to protect this information and not to reproduce, disclose or use the information in any way, except as may be requiredby law.
ADVISE®, FIRM®, and GEMS® are registered trademarks of Conning, Inc.
This material is for informational purposes only and should not be interpreted as an offer to sell, or a solicitation or recommendation of an offer to buy any security,product or service, or retain Conning for investment advisory services. This information is not intended to be nor should it be used as investment advice andshould not be copied or distributed without the prior consent of Conning.
Disclosure C11#1412415Presentation C11#1728790
About Conning
Conning (www.conning.com) is a leading investment management company for the global insurance industry, Cathay Conning Asset Management, and its Goodwin Capital Advisers subsidiary. The
Company’s unique combination of asset management, risk and capital management solutions, and insurance research helps clients achieve their financial goals through customized business and
investment strategies. The company is headquartered in Hartford, Connecticut, with additional offices in New York, London, Cologne, and Hong Kong.
Insurance Research
Conning publishes a number of insurance industry research services, including its Insurance Segment Reports semiannual line-of-business reviews; its Forecast & Analysis service, which offers a forward
look at the industry; and its well-known Strategic Study series of executive reports on key products and trends and issues of critical industry importance. All are available in print and online through our web-
based research portal Conning Library (www.conninglibrary.com).
For more information on our insurance research services, please call 888-707-1177 or visit www.conningresearch.com.
This presentation has been prepared for and distributed exclusively to specific clients of Conning. Further distribution, sale, or reproduction, in whole or in part, and by any means, is prohibited. Statements and information in this report were compiled from sources
that we consider to be reliable or are expressions of our opinion. The presentation is not intended to be complete, and we do not guarantee its accuracy. It does not constitute and must not be considered investment advice. With offices in Hartford, New York, London,
Cologne, and Hong Kong, Conning is a portfolio company of the funds managed by Aquiline Capital Partners LLC (“Aquiline”), a NewYork-based private equity firm.