u.s. fish and wildlife service region 2 contaminants program · 2000-04-19 · u.s. fish and...
TRANSCRIPT
U.S. Fish and Wildlife ServiceRegion 2
Contaminants Program
ENVIRONMENTAL CONTAMINANTS IN FISH ANDWILDLIFE OF HAVASU NATIONAL WILDLIFE
REFUGE, ARIZONA
by
Brenda J. Andrews, Kirke A. King, and Denise L. Baker
U.S. Fish and Wildlife ServiceArizona Ecological Services Field Office
2321 W. Royal Palm Road, Suite 103Phoenix, Arizona 85021
May 1997

ABSTRACT
Sediment, vegetation, clams, fish, waterbirds and waterbird eggs were collected at
Havasu National Wildlife Refuge (NWR) during April-August 1993 for organochlorine
compound and trace element analysis. Organochlorines were not detected in sediment or
clams and only low levels of DDE were recovered in coot carcasses. Current residues of
organochlorine compounds are low enough that even the most sensitive species of fish and
wildlife are not likely to be affected.
Elevated levels of several trace elements were detected throughout the Havasu NWR
ecosystem. Arsenic in clams averaged about 2.5-times background levels. Cadmium and
selenium concentrations also were elevated in clams to the point that wildlife feeding on clams
may be adversely affected. Cadmium, copper, and lead in most fish samples exceeded
background levels, but concentrations were below toxic thresholds.
Selenium was the primary element of concern and bioaccumulation of selenium
through the aquatic food chain was evident. Vegetation samples contained selenium
concentrations that exceeded levels associated with food chain accumulation that can lead to
reproductive failure in sensitive species of fish and avian herbivores. Selenium in four of five
coot livers was higher than the "normal" or background range. Concentrations of selenium in
eggs of western and Clark's grebes were two-to-four times the threshold level associated with
toxic effects and embryo teratogenesis. Selenium was pervasive throughout the ecosystem,
and levels were potentially high enough to adversely affect reproduction of fish and fish-eating
birds.
Project No.
22410-1130-2N17
TABLE OF CONTENTS

Page
1. LIST OF TABLES ........................................................................................................ iv
2. LIST OF FIGURES ........................................................................................................ v
3. INTRODUCTION .......................................................................................................... 1
4. STUDY AREA ............................................................................................................... 4
5. METHODS..................................................................................................................... 7Sample Collections .................................................................................................... 7Chemical Analysis ...................................................................................................... 8Statistical Analysis ................................................................................................... 10
6. RESULTS AND DISCUSSION.................................................................................... 12Organochlorines....................................................................................................... 12Trace Elements ........................................................................................................ 12 Trace elements in sediment ................................................................................... 12 Trace elements in spiny naiad ................................................................................ 16 Trace elements in clams ........................................................................................ 20 Trace elements in fish............................................................................................ 24 Trace elements in birds and eggs ........................................................................... 34Kidney:Liver Ratio................................................................................................... 44
7. CONCLUSIONS........................................................................................................... 45
8. ACKNOWLEDGEMENTS........................................................................................... 46
9. LITERATURE CITED ................................................................................................. 47
10. APPENDIX A: Analytical Results ............................................................................... 55
11. APPENDIX B: Graphs................................................................................................ 63
iii
LIST OF TABLES
Table Page
1. Comparison of concentrations of selected trace elements in spiny naiad (Najas marina) from Havasu National Wildlife Refuge with data from other studies in Arizona ............................................................................................................................... 17
2. Comparison of concentrations (µg/g wet weight) of selected trace elements in fish from Topock Marsh, Havasu National Wildlife Refuge, to levels reported in other studies in the lower Colorado River Valley .......................................................................... 25
3. Trace element concentrations in whole body fish (µg/g wet weight) collected from Topock Marsh, Havasu National Wildlife Refuge in 1988 and 1993..................................... 29
4. The ten highest selenium concentrations (µg/g wet weight) in fish among the 117 stations sampled nationwide in the National Contaminant Biomonitoring Program............... 31
5. Selenium concentrations (µg/g) in coot livers and kidneys from Topock Gorge, Colorado River, Havasu National Wildlife Refuge, 1993...................................................... 40
6. Sample parameters of whole body coots and liver and kidney tissues collected from Topock Gorge, Colorado River, Havasu National Wildlife Refuge, 1993 ............................. 43
7. Selenium concentrations (µg/g dry weight) in coot kidneys and livers and kidney: liver ratios from Topock Gorge, Colorado River, Havasu National Wildlife Refuge, 1993.................................................................................................................................... 44
iv

LIST OF FIGURES
Figure Page1. Location of lower Colorado River National Wildlife Refuges............................................ 32. Location of collection sites on Havasu National Wildlife Refuge ....................................... 6

vINTRODUCTION
Previous studies evaluated potential effects of selenium contamination on wildlife
along the lower Colorado River Valley where the combination of selenium-rich soils and
irrigated agricultural practices occur (Radtke et al. 1988, Rusk 1991, King et al. 1993, Lusk
1993, Welsh and Maughan 1993, Martinez 1994, McCaulou et al. 1994). Selenium in
invertebrates, fish, and waterbirds from backwater areas of the lower Colorado River within
Cibola and Imperial National Wildlife Refuges (NWRs) was potentially high enough to cause
reproductive impairment, suggesting that biomagnification of selenium in aquatic food chains
may be adversely affecting fish and endangered Yuma clapper rail (Rallus longirostris
yumanensis) populations (Rusk 1991, Lusk 1993, Martinez 1994). It is presumed the source
of selenium in the lower basin reflects influence of the upper basin where selenium is most
likely mobilized by natural weathering of seleniferous shales, combustion of coal at
hydroelectric generating stations, extraction of uranium ore and coal, and possibly irrigation-
based agriculture (Radtke et al. 1988).
While selenium concentrations in fish and wildlife of Cibola and Imperial NWRs have
been well documented, little is known about levels of selenium and other pollutants in fish and
migratory birds of the Colorado River adjacent to and within Havasu NWR, located upriver
from Cibola and Imperial NWRs. This study was designed to assess organochlorine pesticide
and trace element concentrations in fish and migratory birds of Havasu NWR and to compare
contaminant concentrations among species and among areas. Our investigation represents the
first comprehensive assessment of contaminants in fish and wildlife of Havasu NWR.
Havasu NWR is located along the Colorado River and extends for 26 miles from
Needles, California to Lake Havasu City, Arizona (Figure 1). Franklin D. Roosevelt created
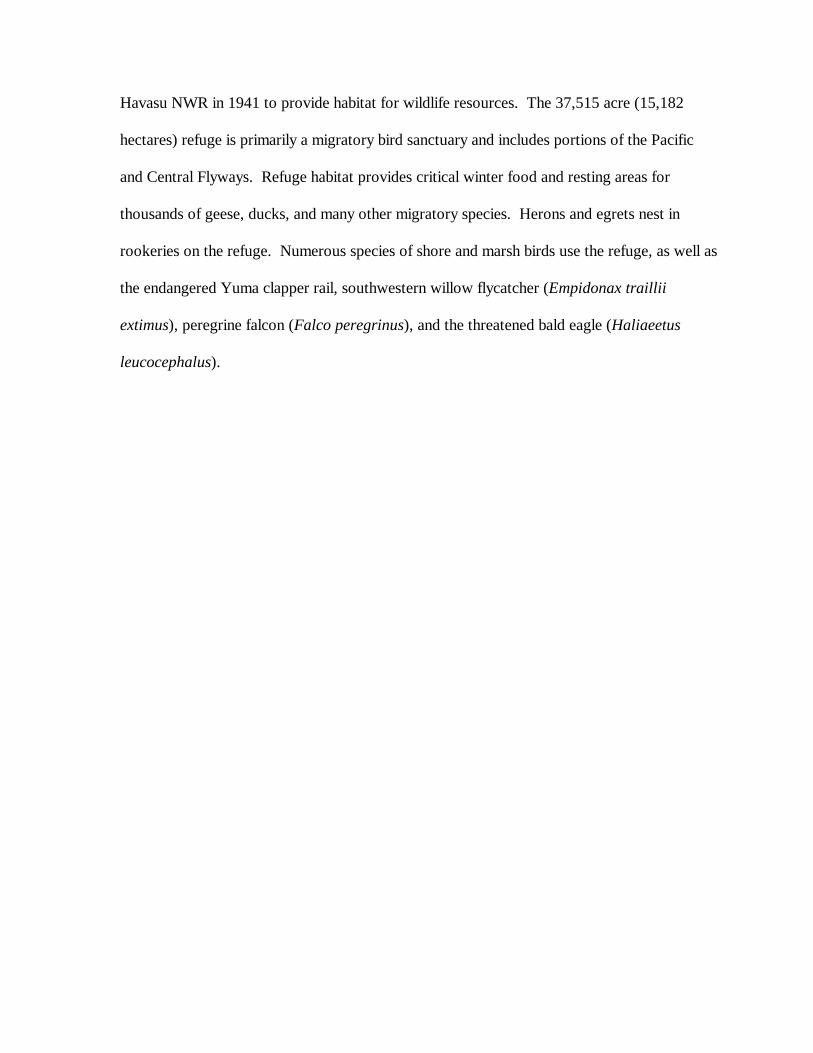
Havasu NWR in 1941 to provide habitat for wildlife resources. The 37,515 acre (15,182
hectares) refuge is primarily a migratory bird sanctuary and includes portions of the Pacific
and Central Flyways. Refuge habitat provides critical winter food and resting areas for
thousands of geese, ducks, and many other migratory species. Herons and egrets nest in
rookeries on the refuge. Numerous species of shore and marsh birds use the refuge, as well as
the endangered Yuma clapper rail, southwestern willow flycatcher (Empidonax traillii
extimus), peregrine falcon (Falco peregrinus), and the threatened bald eagle (Haliaeetus
leucocephalus).

FIGURE 1.

STUDY AREA
Topock Marsh, a 4,000-acre (1,619 hectares) wetland managed by Havasu NWR for
migratory birds, is fed by a four-mile long (6.4 kilometers) inlet canal. Water levels are
maintained by a dike with a water control outlet structure. Catfish Paradise, Pintail Slough,
North Dike, and Glory Hole lie within Topock Marsh. Pintail Slough is north of North Dike
which is the northern boundary of the marsh (Figure 2). Pintail Slough is an old meander of
the Colorado River and is managed for emergents and other vegetation commonly used by
aquatic birds for nesting, feeding, and roosting. The Colorado River forms the seven-mile (11
kilometers) long western boundary of the Topock Marsh Unit.
The Colorado River bisects the 19-mile (31 kilometers) long Topock Gorge Unit. It is
bordered by marshes isolated by emergent zones of cattail (Typha sp.) and bulrush (Scirpus
sp.). The river flows into Lake Havasu at the most southern portion of this unit. Colorado
River flows are managed by the Bureau of Reclamation and dictated by weather conditions,
irrigation interests, and hydroelectric power demands.
Samples were collected from the mainstream of the Colorado River within Topock
Gorge (Blankenship Bend, Devils Elbow) as well as backwater lakes, and from Catfish
Paradise, Glory Hole, North Dike, and Pintail Slough in Topock Marsh (Figure 2). Species
were selected for collection based on their availability and our ability to assure a
representative sample of aquatic biota on Havasu NWR. Sediment was collected from Catfish
Paradise, Glory Hole, North Dike, Pintail Slough, Devils Elbow, and Blankenship Bend.
Vegetation was taken from backwater lakes within Topock Gorge, and Asiatic clams
(Corbicula fluminea) were sampled from Catfish Paradise, Glory Hole, and North Dike. Fish
were collected from Topock Marsh and backwater areas of Topock Gorge. American coots

(Fulica americana) were also sampled from backwater lakes within Topock Gorge, and
western and Clark's grebe (Aechmophorus occidentalis, A. clarkii) eggs were removed from
nests located in backwater areas within Topock Gorge and Topock Marsh.

FIGURE 2.

METHODS
Sample collections:
Sediment, plant material, invertebrates, fish, birds, and bird eggs were collected from
Havasu NWR between April and August 1993. Five sediment subsamples were taken at each
site using a stainless steel spoon and pan, then homogenized into a single composite sample
per site. Approximately the top 10 cm of sediment was collected for each subsample.
Spoonful-aliquots of the homogenous composite mixture were placed in an acid-rinsed glass
jar, weighed, sealed with a teflon-lined lid, and placed on wet ice until the sample could be
transferred to a commercial freezer. Sediment samples were analyzed for organochlorine
pesticides and trace elements. Spiny naiad (Najas marina), a submergent aquatic plant, was
taken in backwater areas from Blankenship Bend and Devils Elbow. The uppermost portion
of two to three plants was broken by hand, composited by site, and stored in plastic zip-lock
bags prior to trace element analyses. Clams were collected by hand from three marsh mudflats
in Topock Marsh. Whole clams were frozen. Later, tissues were removed, blotted to remove
excess water, weighed, then refrozen until organochlorine and trace element analyses were
performed. Channel catfish (Ictalurus punctatus), largemouth bass (Micropterus salmoides),
and common carp (Cyprinus carpio) were collected by use of a boat-mounted electroshocking
unit and by monofilament gill nets. Fish were composited by species (n = 2-5) at each site
(with the exception of the Topock Marsh channel catfish sample, in which only one individual
was obtained and analyzed). Whole body samples were weighed and measured, wrapped in
aluminum foil, and placed on wet ice until they were transferred to a commercial freezer
where they were stored prior to trace element analyses. Five American coots were collected
from Topock Gorge by shotgun using steel shotshells and by a .22 caliber rifle. The bills,
lower legs, wingtips, feathers, and gastrointestinal tracts were removed and discarded.
Carcasses were frozen and later submitted for organochlorine analyses, and the livers and
kidneys were extracted and analyzed for trace elements. The kidneys of three coots were
submitted for selenium analysis only. There was insufficient tissue mass available from two
coot kidneys for chemical analyses due to gunshot vitiation. Western and Clark's grebe eggs
(n = 5 each) were collected, one egg per nest, and analyzed for trace elements. Eggs were
weighed and processed in accordance with the guidelines of the Patuxent Analytical Control
Facility (U. S. Fish and Wildlife Service 1990).
Chemical analysis:
Sediment, spiny naiad, clams, fish, coot livers and kidneys, and grebe eggs were
analyzed for aluminum, arsenic, barium, beryllium, boron, cadmium, chromium, copper, iron,
lead, magnesium, manganese, mercury, molybdenum, nickel, selenium, strontium, vanadium,
and zinc at Research Triangle Institute, Research Triangle Park, North Carolina. Mercury
concentrations were quantified by cold vapor atomic absorption. Arsenic and selenium were
analyzed by hydride generation atomic absorption spectrophotometry. All other elements
were quantified by using inductively coupled plasma emission spectroscropy (ICP) following
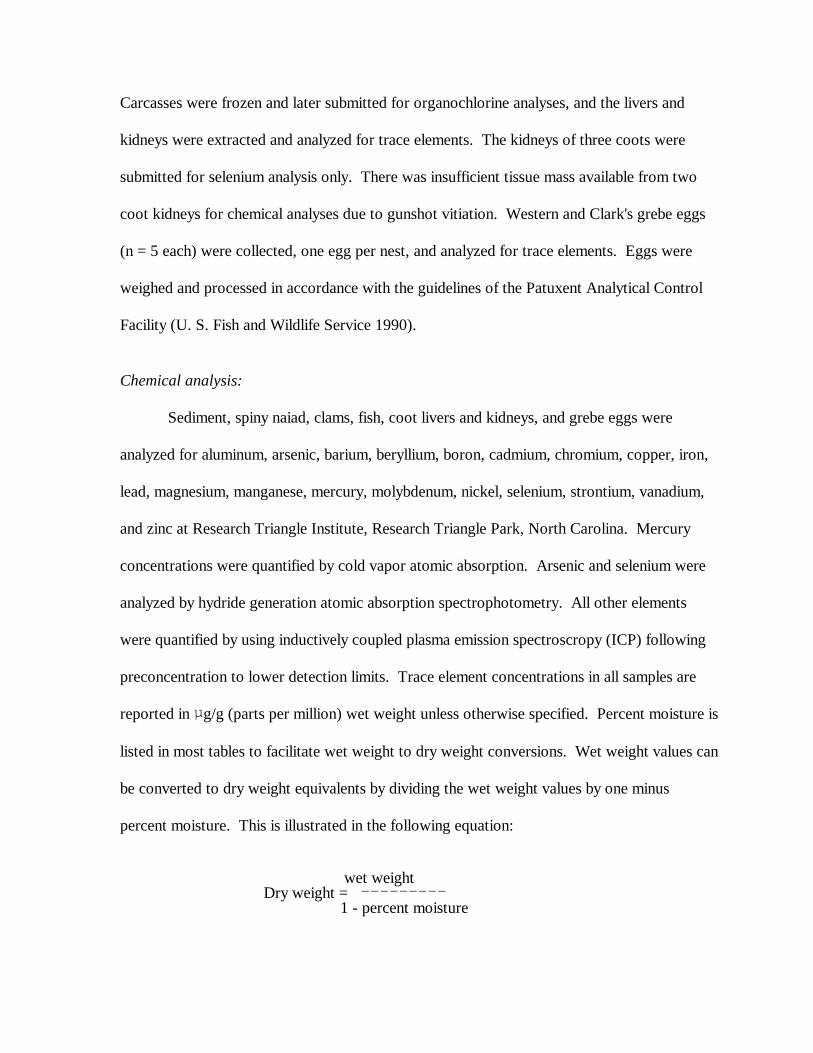
preconcentration to lower detection limits. Trace element concentrations in all samples are
reported in µg/g (parts per million) wet weight unless otherwise specified. Percent moisture is
listed in most tables to facilitate wet weight to dry weight conversions. Wet weight values can
be converted to dry weight equivalents by dividing the wet weight values by one minus
percent moisture. This is illustrated in the following equation:
wet weightDry weight = ---------
1 - percent moisture
Sediment, clams, and coot carcasses were analyzed for organochlorine compounds
including o,p'-and p,p'-DDE, o,p'-and p,p'-DDD, o,p'-and p,p'-DDT, dieldrin, heptachlor
epoxide, hexachlorobenzene (HCB), alpha, beta, delta, and gamma BHC, alpha and gamma
chlordane, oxychlordane, trans-nonachlor, cis-nonachlor, endrin, toxaphene, mirex, and total
polychlorinated biphenyls (PCB) at Mississippi State Chemical Laboratory, Mississippi State,
Mississippi. For each analysis, the sample was homogenized and mixed with anhydrous
sodium sulfate and soxhlet extracted with hexane for seven hours. The extract was then
concentrated by rotary evaporation to dryness for lipid determination. The weighed lipid
sample was dissolved in petroleum ether and extracted four times with acetonitrile saturated
with petroleum ether. Lipids were removed by Florisil column chromatography (Cromartie et
al. 1975). The column was then eluted with diethyl ether/petroleum ether and separated into
two fractions. One fraction was concentrated to appropriate volume for quantification of
residues by packed or capillary column electron capture gas chromatography. The other
fraction was concentrated and transferred to a Silicic acid chromatographic column for
additional cleanup required for separation of PCBs from other organochlorines. Each fraction
was concentrated to appropriate volume for quantification of residues by packed or megabore
column, electron capture gas chromatography. The lower limit of quantification was
0.01 µg/g for most organochlorine pesticides and 0.05 µg/g for toxaphene and PCBs.
Organochlorine compounds are expressed in µg/g wet weight unless otherwise specified.
Statistical analysis:
Whenever possible, element concentrations in fish were compared with those reported
in the National Contaminant Biomonitoring Program (NCBP) for fish collected in 1976-1984

from 117 stations nationwide (Schmitt and Brumbaugh 1990). Concentrations of an element
were considered elevated when they exceeded the 85th percentile of the nationwide geometric
mean. The 85th percentile was not based on toxicity hazard to fish, but provided a frame of
reference to identify elements of potential concern. However, caution should be exercised
when comparing the 85th percentile to selenium levels in fish collected from the western
United States. Generally, levels of selenium occur at lower concentrations in the eastern
states and, subsequently, lower the 85th percentile. We have, in addition to using NCBP data,
included concentrations of selenium specifically from studies in Arizona with which to
compare our data.
A set of statewide data containing background concentrations of metals in Arizona
soils was obtained by the U. S. Geological Survey (USGS) during a 14-year period from 1961
to 1975. They analyzed 47 soil samples from various locations across the state to determine
the concentration of selected metals in Arizona soils (Boerngen and Shacklette 1981). In
order to compare our sediment data from Havasu NWR with USGS data, we will refer to the
Arizona background level as the mean " two standard deviations.
The limited number of individual samples collected and analyzed in this study
necessitated the use of a Student's t-distribution to determine statistical differences between
means. T-tests were used to compare selected trace element means between western and
Clark's grebe eggs as well as to analyze coot contaminant concentrations between areas
(Havasu NWR and Imperial NWR). Samples analyzed exhibited homogeneity of variance;
therefore, log-transformation of concentrations prior to statistical analysis was not warranted.
Analysis of variance (ANOVA) employing the GLM procedure was utilized to compare
copper concentrations in carp from Topock Marsh with concentrations reported in other
recent studies of carp from Topock Marsh. Both t-tests and ANOVAs were performed
employing SAS utilizing a significance level of P # 0.05.
RESULTS AND DISCUSSION
Organochlorines:
Organochlorine compounds were not detected in sediment or clams. DDE (a
metabolite of DDT) was the only organochlorine compound recovered in coot carcasses from

Topock Gorge (Table A-1). Although the use of DDT was suspended in the United States in
1972, residues of DDE and DDT continue to occur at high levels in certain parts of the United
States (Stickel et al. 1984). Levels of DDE in coot carcasses ranged from 0.01 to 0.31 µg/g
wet weight. DDE residues in coot carcasses were generally below levels associated with
chronic poisoning and reproductive problems in most species of birds (Stickel 1973, Blus et
al. 1977). Organochlorine compounds do not appear to present environmental hazards to
clams or coots of Havasu NWR.
Trace Elements:
Trace elements in sediment:
Seventeen of nineteen trace elements were detected in sediment from six sites (Table
A-2). Aluminum was present in all sediment samples, and concentrations ranged from 2,269
to 12,580 µg/g dry weight. These levels are well below the average background level of
55,213 µg/g for Arizona soils (Boerngen and Shacklette 1981).
Arsenic concentrations ranged from 3.9 to 13.1 µg/g dry weight. These levels
bracketed the average (9.8 µg/g) of Arizona soils (Boerngen and Shacklette 1981).
Concentrations greater than 7.0 and 11.0 µg/g dry weight have been considered elevated and
heavily polluted in other areas (Ingersoll and Nelson 1989, Beyer 1990, Crayton and Jackson
1991). Four of six sediment samples from backwater sites on Havasu NWR contained
concentrations above 7.0 µg/g.
Barium was recovered at concentrations ranging from 78.2 to 282.2 µg/g dry weight
(Table A-2). Sediment with barium concentrations greater than 60 µg/g dry weight were
classified as heavily polluted in the Great Lakes harbors (Beyer 1990). Barium levels in all of
our samples exceeded this pollution classification. However, no data are available on the
threshold levels and effects of barium on fish and wildlife, therefore, interpretation of these
data is not possible. The barium concentration
(530 µg/g dry weight) reported by Radtke et al. (1988) in sediment collected from Topock
Marsh in 1986 was greater than those in our study.
Beryllium concentrations in sediment samples ranged from 0.46 to 1.59 µg/g dry
weight. These levels are near or above the Arizona soils background average of
0.52 µg/g (Boerngen and Shacklette 1981).
Boron was detected in five of six sediment samples at concentrations ranging from
7.13 to 12.29 µg/g dry weight. These levels were considerably higher than that reported by
Radtke et al. (1988) collected from Topock Marsh in 1986 (0.63 µg/g). There are no Arizona
background levels available for boron with which to compare our data.
Cadmium concentrations in sediment samples ranged from 0.37 to 1.12 µg/g (Table
A-2). Radtke et al. (1988) reported cadmium concentration in sediment from Topock Marsh
as < 2.0 µg/g. There are no Arizona background levels for cadmium with which to compare
our data.
Chromium was recovered in sediment from all six sites. Concentrations ranged from
7.49 to 17.61 µg/g dry weight (Table A-2). Radtke et al. (1988) reported chromium
concentrations in sediment collected from Topock Marsh in 1986 as 41.6 µg/g. Sediment
with chromium concentrations of 25 to 75 µg/g dry weight were classified as moderately
polluted and greater than 75 µg/g as heavily polluted in Great Lakes harbors (Beyer 1990).
The average background concentration of chromium in Arizona soils was 61.3 µg/g dry
weight (Boerngen and Shacklette 1981). Chromium concentrations in sediment samples from
this study are well below background levels. Although most chromium in sediment is
unavailable to living organisms (Eisler 1986), concentrations reported in this study indicate no

need for concern of chromium toxicity to fish and wildlife of Havasu NWR.
Copper ranged from non-detected to 34.29 µg/g in sediment samples (Table A-2).
Copper was present in sediment from all sample sites with the exception of North Dike. The
mean (16.5 µg/g) concentration reported here is consistent with that reported by Radtke et al.
(1988) from sediment samples collected in 1986 from Topock Marsh
(mean = 18.3 µg/g). Boerngen and Shacklette (1981) reported the Arizona background
average for copper as 30 µg/g dry weight.
Lead was detected in sediment at concentrations that ranged from 9.27 to
41.13 µg/g dry weight (mean = 22.9 µg/g [Table A-2]). These levels are similar to those
reported by Radtke et al. (1988) for sediment samples taken from Topock Marsh in 1986
(mean = 22.0 µg/g). Sediment with lead concentrations < 40 µg/g dry weight were classified
as non-polluted in Great Lakes harbors (Beyer 1990).
Magnesium and manganese concentrations ranged from 1,969 to 10,350 µg/g, and
56.3 to 331.2 µg/g dry weight, respectively. There are no established background levels for
either element; however, Radtke et al. (1988) reported an average manganese concentration
of 466.7 µg/g in sediment from Topock Marsh in 1986.
Nickel concentrations ranged from 6.99 to 23.54 µg/g dry weight
(mean = 14.5 µg/g [Table A-2]). Beyer (1990) considered nickel concentrations in sediment
between 20 and 50 µg/g dry weight to be moderately polluted. Radtke et al. (1988) reported
a mean nickel concentration of 17.3 µg/g in sediment collected from Topock Marsh in 1986,
and Ruiz (1994) reported a mean nickel concentration of
25.6 µg/g in sediment collected in 1993 at Bill Williams River near its confluence with the
Colorado River.
Selenium in sediment is particularly important to long-term habitat quality because

aquatic microorganisms readily mobilize selenium into food chains and thereby facilitate its
dietary exposure to fish and wildlife (Lemly and Smith 1987). Selenium was detected in five
of six sediment samples from sites within Topock Gorge and Topock Marsh. Concentrations
ranged from <0.50 to 1.26 µg/g dry weight (Table A-2). These levels are comparable to
concentrations in sediment previously collected from Topock Marsh (Radke et al. 1988, Rusk
1991, King et al. 1993). These levels are, however, slightly higher than those reported by
Ruiz (1994) in sediment from Bill Williams NWR, but well below the 4 µg/g dry weight
concentration suggested by Lemly and Smith (1987) that may cause food chain contamination.
Strontium was detected in all sediment samples at concentrations ranging from 64.7 to
260.3 µg/g dry weight (mean = 147.8 µg/g). There are no established background levels for
strontium, however, the mean strontium concentration in sediment from the confluence of the
Colorado and Bill Williams Rivers collected in 1992-93 by Ruiz (1994) was 120.3 µg/g dry
weight, a level relatively consistent with that reported here.
Zinc was recovered in sediment samples from all sites, and concentrations ranged from
17.93 to 116.5 µg/g dry weight (mean = 60.4 µg/g)(Table A-2). The mean reported here is
comparable to the findings of Radtke et al. (1988) in sediment collected from Topock Marsh
in 1986 (mean = 63.6 µg/g). There are no established background levels for zinc in Arizona
soils.
Mercury and molybdenum were not detected in any sediment samples. Sediment from
Blankenship Bend contained the highest concentration of boron. Devils Elbow sediment had
the highest concentrations of beryllium, cadmium, chromium, copper, magnesium, nickel, and
lead. The North Dike sediment sample contained the highest concentration of arsenic, and
Pintail Slough sediment had the highest concentrations of aluminum, barium, iron, manganese,
selenium, strontium, vanadium, and zinc. North Dike samples contained the lowest
concentrations of 14 trace elements while Glory Hole contained the lowest concentrations of
arsenic and selenium.
Trace elements in spiny naiad:
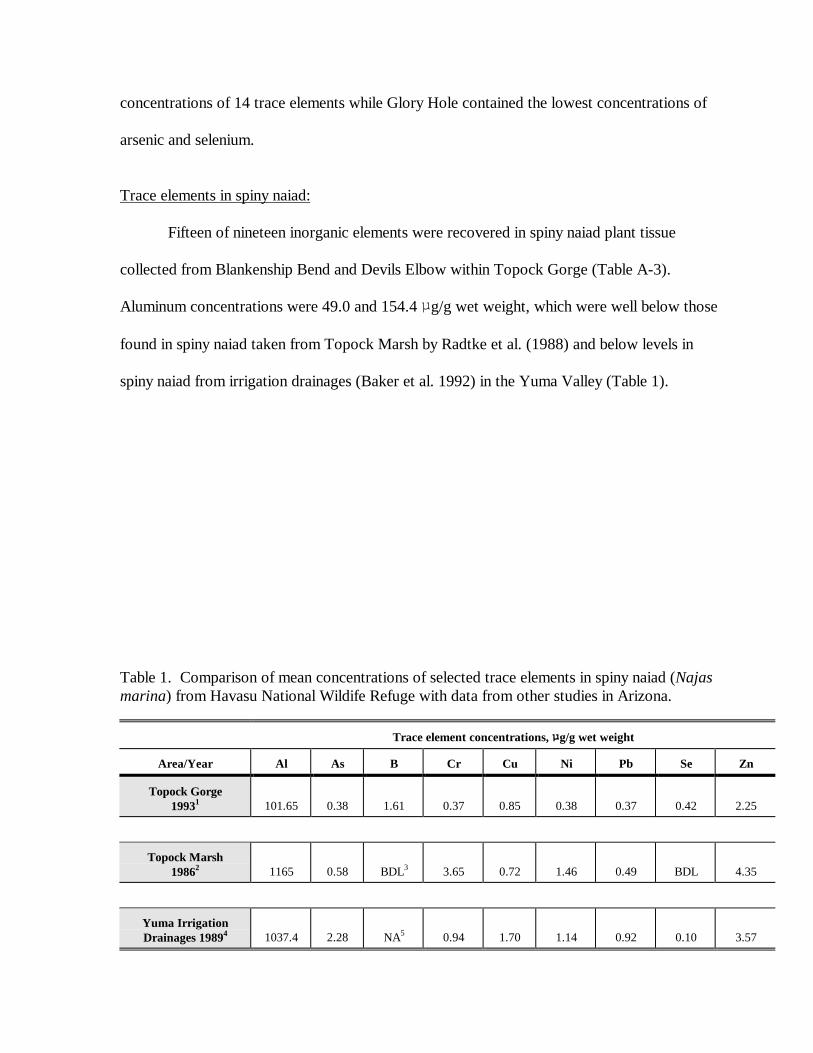
Fifteen of nineteen inorganic elements were recovered in spiny naiad plant tissue
collected from Blankenship Bend and Devils Elbow within Topock Gorge (Table A-3).
Aluminum concentrations were 49.0 and 154.4 µg/g wet weight, which were well below those
found in spiny naiad taken from Topock Marsh by Radtke et al. (1988) and below levels in
spiny naiad from irrigation drainages (Baker et al. 1992) in the Yuma Valley (Table 1).
Table 1. Comparison of mean concentrations of selected trace elements in spiny naiad (Najasmarina) from Havasu National Wildife Refuge with data from other studies in Arizona.
Trace element concentrations, µg/g wet weight
Area/Year Al As B Cr Cu Ni Pb Se Zn
Topock Gorge19931 101.65 0.38 1.61 0.37 0.85 0.38 0.37 0.42 2.25
Topock Marsh19862 1165 0.58 BDL3 3.65 0.72 1.46 0.49 BDL 4.35
Yuma IrrigationDrainages 19894 1037.4 2.28 NA5 0.94 1.70 1.14 0.92 0.10 3.57

1 This study (Concentrations represent a mean of 2 samples)2 Radtke et al. 1988 (Concentrations represent a mean of 4 samples)3 BDL - Below detection limit (Because boron was not detected in 3 of 4 samples, we report it here as BDL)4 Baker et al. 1992 (Concentrations represent a mean of 5 samples from 5 irrigation drainages in the Yuma Valley)5 NA - Data not available
Arsenic concentrations, 0.14 and 0.62 µg/g wet weight (2.07 and 5.12 µg/g dry
weight), were slightly lower than levels reported by Radtke et al. (1988) for spiny naiad
collected from Topock Marsh (Table 1), but higher than arsenic concentrations Hothem and
Ohlendorf (1989) observed in widgeongrass (Ruppia maritima) at Kesterson Reservoir (0.72
to 1.9 µg/g dry weight). Arsenic dietary concentrations as low as
30 µg/g dry weight adversely affect the growth, physiology, and development of ducklings
(Camardese et al. 1990). Eisler (1988a) suggested a dietary level of 120 µg/g wet weight may
cause adverse effects in aquatic organisms. Arsenic concentrations in our samples were well
below these threshold levels.
Barium concentrations were detected at 17.1 and 17.3 µg/g wet weight (Table
A-3) in spiny naiad, levels slightly higher than those reported by Radtke et al. (1988) from
Topock Marsh in 1986 (mean = 11.65 µg/g).
Boron was recovered at 0.96 and 2.26 µg/g wet weight (Table A-3). Three of four
spiny naiad samples collected by Radtke et al. (1988) from Topock Marsh in 1986 did not
contain detectable concentrations of boron. Boron was recovered in one sample at a
concentration of 4.8 µg/g wet weight. Because less than half of the samples Radtke et al.
(1988) collected contained detectable levels of boron, we have reported the concentration of
boron in Table 1 as below the detection limit.
Beryllium, cadmium, and mercury were not detected in spiny naiad in this study nor in
collections by Radtke et al. (1988) from Topock Marsh in 1986.

Chromium was recovered at 0.23 and 0.50 µg/g wet weight, as little as one-sixth the
concentrations reported by Radtke et al. (1988) for samples from Topock Marsh and one-half
those reported by Baker et al. (1992) for spiny naiad collected from irrigation drainages in the
Yuma Valley (Table 1).
Copper in spiny naiad was detected at 0.29 and 1.40 µg/g wet weight (Table A-3).
These levels are consistent with those Radtke et al. (1988) reported in spiny naiad collected
from Topock Marsh in 1986 and approximately one-half the concentrations Baker et al.
(1992) reported in spiny naiad collected from irrigation drainages in the Yuma Valley (Table
1).
Magnesium was present at 323.7 and 692.3 µg/g wet weight, levels slightly lower than
the mean Radtke et al. (1988) found in 1986 in Topock Marsh (872.5 µg/g wet weight).
Lead was detected at 0.20 and 0.54 µg/g and nickel at 0.18 and 0.57 µg/g wet weight.
Concentrations of both elements were lower than those presented by Radtke et al. (1988) and
Baker et al. (1992 [Table 1]).
Nickel in spiny naiad was detected at concentrations of 0.18 and 0.57 µg/g wet weight
(mean = 0.38 µg/g). This mean is well below the mean (1.46 µg/g) Radtke et al. (1988)
reported in collections of spiny naiad from Topock Marsh in 1986 (Table 1).
Selenium was recovered at 0.35 and 0.49 µg/g wet weight (5.22 and 4.06 µg/g dry
weight). These levels are well above background concentrations of 0.4 µg/g dry weight
(Ohlendorf et al. 1986a). Selenium was not dectected in spiny naiad collected from Topock
Marsh in 1986 (Radtke et al. 1988 [Table 1]). However, selenium concentrations reported in
this study are consistent with those reported by Lusk (1993) from the Colorado River within
Imperial NWR (5.72 and <4.76 µg/g dry weight). As a dietary source for waterfowl, spiny
naiad selenium levels exceeded the concentration

(3 µg/g dry weight) that may cause reproductive failure or mortality in waterfowl due to food-
chain bioconcentration (Lemly and Smith 1987).
Strontium was present in spiny naiad samples at 14.4 and 56.9 µg/g wet weight (mean
= 35.7 µg/g). This mean is less than the mean (45.5 µg/g) reported by Radtke et al. (1988)
from his collections of spiny naiad in Topock Marsh in 1986.
Vanadium was recovered at 0.17 and 0.72 µg/g wet weight (mean = 0.45 µg/g), which
is less than the mean (0.93 µg/g) reported by Radtke et al. (1988) from spiny naiad collected
from Topock Marsh in 1986.
Zinc was detected at 1.7 and 2.8 µg/g wet weight in spiny naiad collected from
Topock Gorge (Table A-3). Radtke et al. (1988) reported zinc concentrations ranging from
1.1 to 8.1 µg/g wet weight in spiny naiad collected from Topock Marsh in 1986. Baker et al.
(1992) reported concentrations ranging from 2.51 to 5.26 µg/g wet weight in spiny naiad
taken from irrigation drainages in the Yuma Valley (Table 1).
Trace elements in clams:
Trace elements detected in freshwater clams are presented in Table A-4. Aluminum
was recovered in all clam samples at comparable levels among sites. Concentrations ranged
from 177.2 to 180.4 µg/g dry weight (Table A-4), which are almost twice as high than Lusk
(1993) reported in clams collected from several backwater lakes within Imperial NWR (mean
= 92.82 µg/g). However, aluminum concentrations in our study are considerably lower than
those reported by Tadayon et al. (In press) in clams collected in 1995 from the lower
Colorado River and Yuma Valley irrigation drainwater ditches (mean = 492.67 µg/g).
Arsenic was detected at all sites within Topock Marsh at concentrations ranging from
10.23 to 11.79 µg/g dry weight. These levels were lower than those reported by Lusk (1993)
in clams collected from several backwater lakes within Imperial NWR
(mean = 16.76 µg/g). However, arsenic levels reported here are higher than those reported by
McCaulou et al. (1994) for clams collected in 1992 within Topock Marsh (geometric mean =
8.14 µg/g), as well as concentrations in clams collected from the lower Colorado River and
Yuma Valley irrigation drainwater ditches (mean = 8.6 µg/g) (Tadayon et al. In press).
Arsenic acts as a cumulative poison (Jenkins 1981) and is listed by the Environmental
Protection Agency (EPA) as one of 129 priority pollutants (Keith and Telliard 1979). The
potential for bioaccumulation or bioconcentration of arsenic is high to very high for mollusks
(Jenkins 1981). Background arsenic concentrations in biota are usually less than 1 µg/g wet
weight (3 - 4 µg/g dry weight) (Eisler 1988a). All of our samples were above this background
level. Although arsenic concentrations were within the background range in sediment, arsenic
bioaccumulated to relatively high levels in clams.
Beryllium was recovered only in the North Dike composite clam sample at a
concentration of 0.49 µg/g dry weight. Beryllium has not been an element of concern in the
lower Colorado River. Lusk (1993) and McCaulou et al. (1994) did not detect beryllium in
clams from backwater lakes within Imperial NWR or from Topock Marsh in their earlier
studies. This element may have been recovered at North Dike as a result of importation of
dike material during construction in the late 1980's.
Cadmium was detected in clams from all sites with concentrations ranging from 0.29
to 1.94 µg/g dry weight (Table A-4). The highest concentration came from the North Dike
site. Cadmium, like arsenic, acts as a cumulative poison (Jenkins 1981), and wildlife that feed
on clams with high concentrations may potentially experience cadmium toxicity causing
behavioral, growth, or physiological problems (Rompala et al. 1984). Cadmium is listed by
the EPA as a priority pollutant (Keith and Telliard 1979). It is toxic to a variety of fish and
wildlife and tends to bioaccumulate in clams (Schmitt et al. 1987). Cadmium concentrations
in clams, particularly from the North Dike site, were higher than those (mean = 0.59 µg/g dry
weight) reported by Lusk (1993) in clams from backwater lakes of the Colorado River on
Imperial NWR and higher than Topock Marsh clams collected in 1992 (McCaulou et al.
1994).
Chromium was recovered in clams only at the Glory Hole and North Dike sites at
concentrations of 1.56 and 1.96 µg/g dry weight, respectively. The organs and tissues of fish
and wildlife that contain >4.0 µg/g total chromium dry weight should be viewed as
presumptive evidence of chromium contamination (Eisler 1986). Samples in this study did not
exceed this level of concern.
Copper was detected in clams at all sites. Concentrations at the Catfish Paradise and
Glory Hole sites were similar (29.45 and 30.10 µg/g dry weight) and about one-half the
concentration in clams from the North Dike site (71.93 µg/g [Table A-4]). Lusk (1993)
reported only one site in his study that contained higher copper concentrations than those
reported at North Dike. All copper levels in clams collected by McCaulou et al. (1994) in
Topock Marsh were less than those at the North Dike site. This element may have been
recovered at elevated levels as a result of importation of the dike material during its
construction. However, copper was not detected in sediment collected from North Dike.
These differences suggest that copper in the area of North Dike may be spatially concentrated.
Lead was recovered in clams from all sites. Lead concentrations in clams from Catfish
Paradise and Glory Hole were similar at 2.86 and 2.79 µg/g dry weight (0.32 and 0.27 µg/g
wet weight). However, concentrations in clams collected from North Dike were nearly three-
times higher (7.82 µg/g dry weight, 0.69 µg/g wet weight) than concentrations at other sites.
Lead was not detected in clams collected from Topock Marsh in 1992; concentrations were

below the 0.50 µg/g wet weight lower limit of detection (McCaulou et al. 1994). Although
lead is toxic to aquatic organisms and bioaccumulates in clams (Eisler 1988b), it is not known
if lead in concentrations found at the North Dike sample represents a concentration harmful to
clams or hazardous to predators that feed on them.
Selenium is an essential trace element in animal diets, but is toxic at concentrations
only slightly above required dietary levels (Sharma and Singh 1984). Selenium concentrations
in clams from Topock Marsh ranged from 8.81 to 18.64 µg/g dry weight. Concentrations in
clams varied only slightly among sites, but all sites contained higher levels ($3 µg/g dry
weight) than that which can be potentially lethal to fish and aquatic birds that consume them
(Lemly 1993). Reductions in egg hatchability and teratogenic effects were experienced when
mallards (Anas platyrhynchos) were fed a diet containing 10 µg/g selenium (dry weight
[Heinz et al. 1987]). Birds that feed on clams in Topock Marsh could experience impaired
reproduction.
Strontium and vanadium were present in most clam samples from Topock Marsh
(Table A-4). Background levels for strontium and vanadium in molluscs and the tendency for
strontium and vanadium to bioaccumulate through the aquatic food chain are not well known.
Data are presented here as a baseline for future comparisons.
Zinc was detected in clams from all sites at concentrations that ranged from 109 to
147.4 µg/g dry weight (12.36 to 14.24 µg/g wet weight [Table A-4]). Zinc is ubiquitous in
tissues of plants and animals and is essential for normal growth and reproduction (Eisler
1993). Zinc concentrations reported here are less than those reported from 1992 collections
of clams from Topock Marsh (22.50 to 210.61 µg/g wet weight [McCaulou et al. 1994]).

Trace elements in fish:
Sixteen trace elements recovered in fish tissues are presented in Table A-5. NCBP
data are available for seven elements: arsenic, cadmium, copper, lead, mercury, selenium, and
zinc (Schmitt and Brumbaugh 1990).
Aluminum was detected in all fish samples in concentrations ranging from 6.81 to
73.6 µg/g wet weight (Table A-5). We found no consistent pattern of aluminum levels in fish
collected from Topock Gorge compared to fish collected from Topock Marsh. Aluminum
concentrations in carp and bass were higher than those reported by King et al. (1993) from
samples taken at Topock Marsh in 1989 (Table 2). However, aluminum in catfish from
Topock Marsh was twice as high in 1989 as the levels reported here.
Arsenic was recovered in four of nine whole body fish samples, and concentrations
ranged from 0.10 to 0.20 µg/g wet weight (Table A-5). All levels were below the NCBP 85th
percentile of 0.27 µg/g (Schmitt and Brumbaugh 1990). Walsh et al. (1977) considered
arsenic concentrations >0.5 µg/g wet weight a level that could harm fish. Levels in this study
were well below this harmful threshold. Arsenic concentrations in fish from Topock Marsh
were lower than those from fish collected in other studies in the lower Colorado River valley
(Table 2).
Barium was present in all samples, and concentrations ranged from 0.29 to
2.80 µg/g (Table A-5). Concentrations were highest in carp from Topock Gorge and lowest
in catfish from Topock Marsh. No comparable data are available to assess whether barium
concentrations reported in this study were elevated or within normal background range.

Table 2. Comparison of concentrations (µg/g wet weight) of selected trace elements in fish from Topock Marsh, HavasuNational Wildlife Refuge, to levels reported in other studies in the lower Colorado River Valley.
Trace element concentrations, µg/g wet weight
Area and species Al As B Cd Cu Fe Hg Se Zn
NCBP 85th percentile1 NA2 0.27 NA 0.05 1.0 NA 0.17 0.73 34.2
Topock Marsh 19933
Carp 73.6 BDL4 BDL 0.02 3.08 56.0 BDL 2.43 64.37
Largemouth bass 9.6 BDL BDL BDL 1.81 22.0 0.02 2.27 15.75
Channel catfish 6.81 BDL 0.28 BDL 0.37 53.0 BDL 1.02 14.0
Topock Marsh 1986-87 5
Carp 24.0 <0.056 13.0 BDL 0.42 54.25 BDL 1.55 54.0
Topock Marsh 19887
Carp 39.3 0.09 NA NA 0.74 71.6 0.01 1.54 45.0
Largemouth bass 7.3 0.12 NA 0.02 0.34 17.5 0.01 2.18 13.6
Channel catfish 14.5 0.10 NA 0.04 0.52 25.5 0.06 0.89 17.4
Bill Williams NWR 1992-93 8
Carp NA 0.57 NA 0.03 1.50 NA 0.06 1.42 73.1
Largemouth bass NA 0.26 NA 0.02 0.56 NA 0.13 0.80 14.3
Cibola Lake 1988-89 9
Carp 28.2 0.10 NA 0.02 0.70 38.0 0.02 1.17 48.8
Largemouth bass 8.5 0.12 NA 0.02 0.30 15.0 0.01 1.53 15.5
Channel catfish 35.9 0.09 NA 0.05 0.70 37.0 0.01 1.67 22.0
Martinez Lake 1988 10
Carp 50.4 0.10 NA 0.01 10.0 115.0 0.01 2.28 72.6
Largemouth bass 5.3 0.02 NA 0.01 0.30 15.0 0.02 2.02 16.1
1 National Contaminant Biomonitoring Program 85th Percentile (Schmitt and Brumbaugh 1990)2 Data not available3 This study

4 Below detection limit5 Radtke et al. 1988 (Concentrations represent a mean of 4 samples)6 Only one sample was above detection limit at a concentration of 0.070 µg/g.7 King et al. 19938 Ruiz 19949 King et al. 199310 King et al. 1993 (Concentrations represent a mean of 2 samples)


Boron was recovered in four of nine samples. Boron concentrations ranged from 0.18
to 0.28 µg/g (Table A-5). All whole body fish levels were comparable between species and
sites. Carp and bass from Topock Marsh, and catfish and bass from Topock Gorge, contained
less than the lower limit of detection. No comparable data are available to assess whether
boron concentrations reported in this study were elevated or within
normal background range. However, carp collected by Radtke et al. (1988) from Topock
Marsh in 1986 contained a mean concentration of 13.0 µg/g wet weight (Table 2).
Cadmium was present in five of nine samples, and concentrations ranged from 0.02 to
0.08 µg/g wet weight (Table A-5). Levels in all fish samples approached or exceeded the
NCBP 85th percentile of 0.05 µg/g (Schmitt and Brumbaugh 1990). Concentrations of
cadmium in this study were similar to those in fish collected from Topock Marsh in 1993-94
by Ruiz (1994) as well as collections in 1988 by King et al. (1993). Comparisons of levels of
trace elements among this and other studies are presented in Table 2. None of the samples in
our study contained cadmium above the 0.5 µg/g threshold considered harmful to fish and
predators (Walsh et al. 1977). Although the cadmium concentrations we found were above
background levels, these current concentrations are not considered toxic; therefore, cadmium
is not a contaminant concern at Havasu NWR.
Chromium was detected in all samples. Concentrations ranged from nearly three to
five times higher in carp from Topock Gorge (1.27 µg/g and 2.08 wet weight, 5.61 and 8.08
µg/g dry weight), than in carp from Topock Marsh (0.46 µg/g wet weight) (Table A-5).
Concentrations in bass and catfish were similar to that in carp from Topock Marsh. Available
data suggest that >4.0 µg/g dry weight chromium in fish tissues should be viewed as evidence
of chromium contamination (Eisler 1986). Two carp samples from Topock Gorge contained
>4.0 µg/g dry weight (Table A-5). Chromium concentrations in carp from our study are

considerably higher than those reported by King et al. (1993) in carp collected from from
Topock Marsh in 1988 (0.07 µg/g wet weight).
Copper was detected in all fish samples, and concentrations ranged from
0.37 µg/g in channel catfish to 3.08 µg/g wet weight in carp from Topock Marsh. Copper
concentrations in carp were significantly higher (P = 0.0035) than those reported by King et
al. (1993) and Ruiz (1994) in carp from Topock Marsh (Table 2). All but two samples were
above the NCBP 85th percentile of 1.0 µg/g (Schmitt and Brumbaugh 1990); therefore,
copper remains a contaminant of potential concern on Havasu NWR.
Iron, magnesium, and manganese are essential nutrients and were present in all fish
samples. Concentrations ranged from 22 to 162 µg/g, 191 to 338 µg/g, and 1.0 to 3.9 µg/g
wet weight, respectively (Table A-5). Background levels for these trace elements in fish and
their tendency to bioaccumulate through the aquatic food chain are not well known.
Lead was detected in six of nine samples, and concentrations ranged from 0.14 to 1.0
µg/g (Table A-5). Eighty-three percent (83%) of the samples exceeded the NCBP 85th
percentile of 0.22 µg/g. The highest level (1.0 µg/g) came from a channel catfish sample from
Topock Gorge. Lead is highly toxic to aquatic organisms, especially fish (Rompala et al.
1984). The biological effects of sublethal concentrations of lead include delayed embryonic
development, suppressed reproduction, inhibition of growth, increased mucous formation,
neurological problems, enzyme inhibition, and kidney disfunction (Rompala et al. 1984,
Leland and Kuwabara 1985). Lead concentrations in whole body fish exceeding 0.5 µg/g wet
weight have the potential to harm fish reproduction and survival (Walsh et al. 1977). Because
two samples from Topock Gorge contained lead concentrations in excess of the 0.5 µg/g
threshold level, and 83% of the fish samples exceeded normal background levels. Lead is a
contaminant of concern on Havasu NWR.
Mercury was recovered in six of nine fish samples, and concentrations ranged from
0.02 to 0.08 µg/g wet weight, all well below the NCBP 85th percentile of
0.17 µg/g. Comparing our data with those of King et al. (1993), concentrations of mercury
have remained relatively unchanged over time (Table 3). Mercury concentrations were also
relatively consistent among sites. For the protection of sensitive species of birds that regularly
consume fish and other aquatic organisms, total mercury concentrations in prey items should
probably not exceed 0.10 µg/g wet weight (Eisler 1987). None of the whole body fish
samples collected during this study approached the 0.10 µg/g level of concern. Mercury does
not appear to present a contaminant hazard to fish on Havasu NWR.
Nickel was detected in all samples, and concentrations ranged from 0.30 to
1.19 µg/g (Table A-5). Nickel concentrations >0.9 µg/g wet weight in fish can be considered
elevated (Irwin 1988). Three samples contained nickel that exceeded the 0.9 µg/g concern
level. Little information is available on the effects of nickel on fish and wildlife, and there are
no national baseline data with which to compare our data. Therefore, the significance of
nickel concentrations in whole body fish from Havasu NWR can not be established.

Table 3. Trace element concentrations in composite whole body fish (µg/g wet weight) collected from Topock Marsh, HavasuNational Wildlife Refuge in 19881 and 1993.
Sample Year Al As Cd Cr Cu Fe Hg Mn
Common carp 1988 39.3 0.09 0.05 0.07 0.74 71.6 0.01 3.4
Common carp 1993 73.6 <0.10 0.02 0.46 3.08 56 <0.02 2.0
LM bass2 1988 7.3 0.12 0.02 0.07 0.34 17.5 0.01 0.9
LM bass 1993 9.6 <0.10 <0.02 0.50 1.81 22 0.02 1.0
Channel catfish 1988 14.5 0.10 0.04 0.14 0.52 25.5 0.06 2.0
Channel catfish 1993 6.81 <0.12 <0.02 0.65 0.37 53 <0.02 1.3
1 From King et al. 19932 LM bass = Largemouth bass
Selenium was recovered in all fish samples, and concentrations ranged from 0.79 to
2.60 µg/g wet weight (Table A-5), all of which exceeded the NCBP 85th percentile of 0.73
µg/g (Schmitt and Brumbaugh 1990). Dry weight conversions of selenium levels ranged from
2.98 to 11.36 µg/g, which are nearly equal to and exceed the concentration (3.0 µg/g dry
weight) considered potentially lethal to fish and aquatic birds that consume them (Lemly
1993). Fish taken from the Colorado River within Havasu NWR contained some of the
highest mean selenium concentrations among fish sampled nationwide (Schmitt and
Brumbaugh 1990). Selenium levels of 2.0 µg/g wet weight or greater, may cause
reproductive impairment and lack of recruitment in fishes (Baumann and May 1984).
Gillespie and Baumann (1986) suggested that selenium levels of 6.9 to 7.2 µg/g wet weight is
the threshold associated with selenium induced reproductive failure of bluegills at selenium
contaminated Hyco Reservoir in North Carolina. Selenium toxicity was also responsible for
declines in the largemouth bass population at Hyco Lake. In a comprehensive summary of
selenium threshold effect levels, Lemly and Smith (1987) reported selenium induced
reproductive failure in fish associated with whole body selenium concentrations of 12 µg/g dry
weight. The selenium levels reported in this study fall well below Gillespie and Baumann's
(1986) suggested threshold level, but are near Lemly and Smith's (1987) level suggested for
reproductive failure in fish. Despite variations in suggested selenium toxicity levels, those
reported in this study are among the highest selenium concentrations reported in carp and
largemouth bass from major Arizona rivers (Radtke et al. 1988, King et al. 1991, King et al.
1993, Baker and King 1994, Ruiz 1994, King and Baker 1995). In this study, mean selenium
concentrations in fish from Havasu NWR (1.73 µg/g) exceeded the mean selenium
concentrations in fish collected in 1984 from Lake Havasu during Schmitt and Brumbaugh's
(1990) National Contaminants Biomonitoring Program (1.43 µg/g). Lake Havasu, as well as
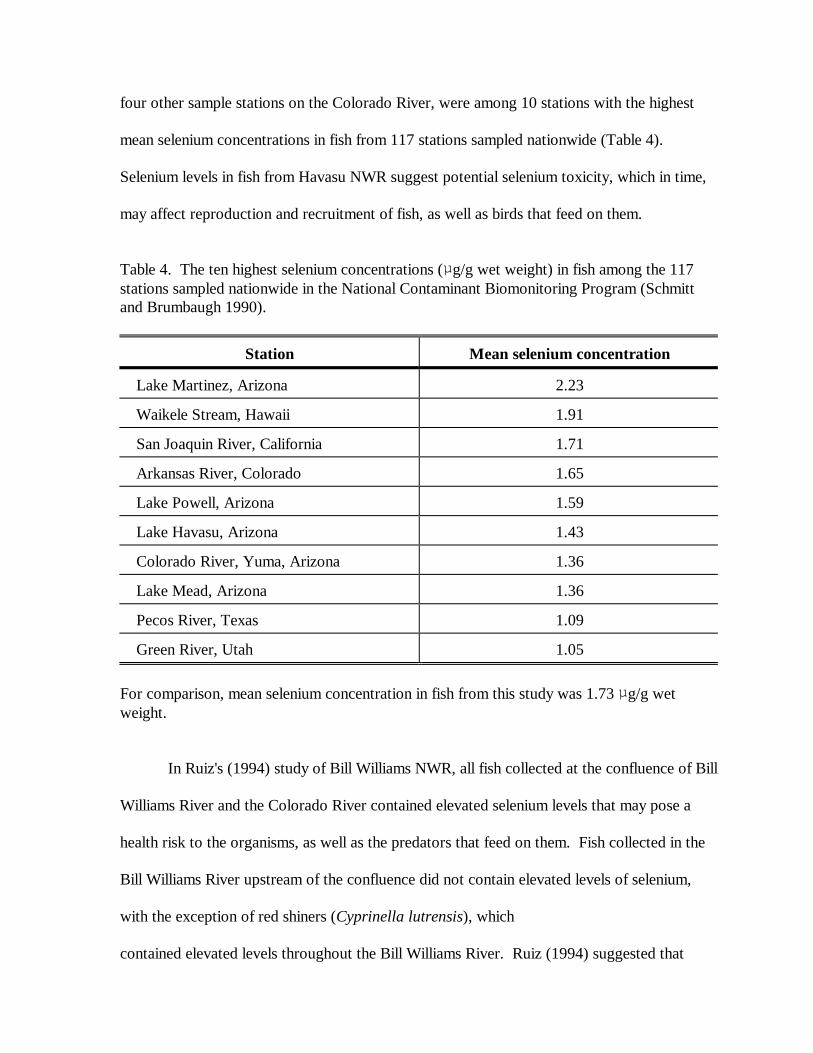
four other sample stations on the Colorado River, were among 10 stations with the highest
mean selenium concentrations in fish from 117 stations sampled nationwide (Table 4).
Selenium levels in fish from Havasu NWR suggest potential selenium toxicity, which in time,
may affect reproduction and recruitment of fish, as well as birds that feed on them.
Table 4. The ten highest selenium concentrations (µg/g wet weight) in fish among the 117stations sampled nationwide in the National Contaminant Biomonitoring Program (Schmittand Brumbaugh 1990).
Station Mean selenium concentration
Lake Martinez, Arizona 2.23
Waikele Stream, Hawaii 1.91
San Joaquin River, California 1.71
Arkansas River, Colorado 1.65
Lake Powell, Arizona 1.59
Lake Havasu, Arizona 1.43
Colorado River, Yuma, Arizona 1.36
Lake Mead, Arizona 1.36
Pecos River, Texas 1.09
Green River, Utah 1.05
For comparison, mean selenium concentration in fish from this study was 1.73 µg/g wetweight.
In Ruiz's (1994) study of Bill Williams NWR, all fish collected at the confluence of Bill
Williams River and the Colorado River contained elevated selenium levels that may pose a
health risk to the organisms, as well as the predators that feed on them. Fish collected in the
Bill Williams River upstream of the confluence did not contain elevated levels of selenium,
with the exception of red shiners (Cyprinella lutrensis), which
contained elevated levels throughout the Bill Williams River. Ruiz (1994) suggested that

elevated selenium levels in biota originate from contact with water from the Colorado
River and not from the Bill Williams River.
Strontium was present in all fish samples with concentrations ranging from 7.23 to
40.80 µg/g wet weight (Table A-5). Concentrations were highest in the carp samples and
lowest in the channel catfish samples. Concentrations of strontium in fish collected from
Havasu NWR in 1993 are within the range of those collected from other Arizona locations
(Baker and King 1994, Andrews et al. 1995, King et al. In prep, Tadayon et al. In press).
Vanadium was detected only in two of nine fish samples (Table A-5). Carp collected
from Topock Gorge contained vanadium at 0.22 to 0.30 µg/g wet weight. These levels were
low compared to those in fish collected from other Arizona locations (Baker and King 1994,
Andrews et al. 1995, Tadayon et al. In press).
Zinc was detected in all fish samples and concentrations ranged from 13.10 to 64.87
µg/g wet weight (Table A-5). All samples, except three carp, contained levels well below the
NCBP 85th percentile of 34.2 µg/g. Although zinc is an essential element, at high
concentrations, it can be toxic to fish, cause mortality, growth retardation, and reproductive
impairment (Sorenson 1991). Fish can accumulate zinc from both the surrounding water and
from their diet (Eisler 1993). Carp from Topock Gorge and Topock Marsh contained from
55.55 to 64.87 µg/g zinc, levels which are generally consistent with those from carp taken
from other areas associated with the Colorado River (Table 2). Zinc tends to bioaccumulate
more readily in carp than in most fish species (Lowe et al. 1985, Schmitt and Brumbaugh
1990); therefore, comparing zinc in Havasu NWR carp with the national background level
composed of many species of fish would not be a valid comparison.

Trace elements in birds and eggs:
Exposure of birds to trace elements can be measured by analyzing their food, eggs,
and selected body tissues. Analysis of the liver is appropriate for assessing recent exposure of
birds to most elements (Ohlendorf 1993). Selenium should be measured in both the liver and
kidneys, because the ratio of concentrations helps assess environmental exposure. Further
review of kidney:liver ratios is discussed at the end of this section.
Seventeen of nineteen trace elements were detected in coot livers. The following
discussion is limited to those elements with a propensity to bioaccumulate to potentially
harmful levels and possibly harm aquatic wildlife. However, all elements are listed in Table A-
6 for informational purposes.
Aluminum was detected in all livers. Four livers contained concentrations that ranged
from 8.65 µg/g to 14.45 µg/g dry weight. Liver tissue from the fifth coot contained an
unusually high spike of 93.0 µg/g. Because retention of aluminum in the absence of kidney
dysfunction is minimal even when dietary levels are high, aluminum concentrations in such
tissues as liver and kidney will not necessarily reflect increased exposure to aluminum
(Scheuhammer 1987). Because the toxic potential of dietary aluminum in healthy animals is
low, we do not attribute dietary origins to this elevated level in one coot. This particular bird
was collected by use of a .22 caliber rifle. It is unlikely that the aluminum spike is a result of
residual shot or the bullet having been lodged in the tissue and subsequently analyzed because
other element concentrations (i.e. copper, lead) in the coot would also have been elevated.
We are unable to explain this anomaly of an elevated aluminum concentration in the liver of
one coot.
Boron was recovered in all livers and ranged from 0.67 µg/g to 2.73 µg/g dry weight.
Mallards fed 1000 µg/g boron in a laboratory study produced 60% fewer ducklings than

controls; livers of the adults contained 33 µg/g dry weight boron (Smith and Anders 1989).
Livers of coots collected from a boron contaminated wetland in central California that was
sustained by agricultural drainwater contained 33 µg/g dry weight boron (Paveglio et al.
1992). Boron concentrations in coot livers in our study do not appear high enough to affect
reproduction or recruitment. Boron may be transmitted to eggs and adversely affect
hatchability or development of embryos (Ohlendorf et al. 1986a). Boron was recovered in
only one grebe egg (Table A-7) at a concentration slightly above the detection limit,
suggesting that boron is not of biological concern for western or Clark's grebes of Havasu
NWR.
Cadmium concentrations in coot livers ranged from 0.10 to 0.92 µg/g wet weight
(0.35 to 3.36 µg/g dry weight [Table A-6]). As a monitor of total exposure, or as an indicator
of the body burden of cadmium, the cadmium concentration of liver tissue is probably the best
measure (Scheuhammer 1987). There are no background cadmium levels for coots
specifically, but Di Giulio and Scanlon (1984) reported background cadmium concentrations
in most wild, freshwater duck species as <3 µg/g dry weight. Levels that exceed this
concentration would be indicative of increased environmental exposure to cadmium. All coot
livers analyzed in this study were well below this level of concern except one, which was only
slightly above this threshold (Table A-6). Eggs are not considered useful for assessing
exposure of birds to cadmium (Scheuhammer 1987, Leonzio and Massi 1989). Little
cadmium is transferred to eggs regardless of dietary levels consumed. Cadmium was not
detected in any grebe eggs from Havasu NWR. Cadmium concentrations are normally higher
in the liver than in eggs produced by the bird (Scheuhammer 1987, Ohlendorf 1989, 1993,
Ohlendorf and Skorupa 1989).
Copper concentrations ranged from 21.15 to 36.24 µg/g dry weight in coot livers

(Table A-6). Livers of wigeon (Anas penelope) and mallards collected from relatively
unpolluted areas in England contained mean copper concentrations of 116.3 and
114.8 µg/g dry weight, respectively (Parslow et al. 1982). The mean copper concentration
from three composites of coot livers and kidneys collected from Las Vegas NWR, New
Mexico was 36.7 µg/g dry weight (Bristol and Shomo 1993). Acute copper toxicosis in
immature Canada geese (Branta canadensis) from Indiana was associated with copper
concentrations in liver tissue that ranged from 56 to 97 µg/g wet weight (. 187 to 323 µg/g
dry weight) (Henderson and Winterfield 1974). If these values represent background levels,
copper concentrations in coot livers collected from Havasu NWR are well within "normal"
range.
Copper was detected in all grebe eggs at concentrations that ranged from 2.19 to 3.40
µg/g dry weight. Mean copper concentrations in royal tern (Sterna maxima) eggs collected in
a relatively unpolluted area (Sundown Island in Matagorda Bay) in Texas averaged 1.09 µg/g
wet weight (. 3.63 µg/g dry weight assuming 70% moisture [King et al. 1983]). Little
information is available on background copper concentrations in bird eggs; however, if the
Sundown Island copper concentrations in tern eggs represent "normal" levels, then copper
does not appear to present a biological concern to western and Clark's grebe eggs from
Havasu NWR.
Iron concentrations in western grebe eggs ranged from 97.51 to 117.1 µg/g dry
weight. Those in Clark's grebe eggs ranged from 104.6 to 148.8 µg/g (Table A-7). Although
iron levels in the grebe species are statistically different (P = 0.03), these results do not
indicate a biological significance due to the low toxicity of iron and the ability of the body to
regulate iron absorption in accordance with body needs (Morris 1987).
Lead was recovered in all coot livers, and concentrations ranged from 0.27 to
1.04 µg/g wet weight (Table A-6). Scheuhammer (1987) suggested that female birds
accumulate lead at a greater rate than males. Although our sample size is small, our data
support this assumption. Longcore et al. (1974) studied the effect of lead exposure on captive
mallards and suggested that lead levels between 6 to 20 µg/g wet weight in the liver should be
considered an indication of recent, acute lead exposure and diagnostic of active lead
intoxication. Lead concentrations in coot livers in this study were well below this threshold
level. However, Schuehammer (1987) suggested that normal background levels of lead in
tissues of adult bird species are 0.5 to 5.0 µg/g dry weight in livers. All coot livers sampled in
this study were within this range.
Lead was detected in only one grebe egg at a concentration (0.69 µg/g dry weight),
slightly above the detection limit (Table A-7). Some lead is transferred to eggs (primarily
incorporated into the eggshells), but concentrations are typically low and do not correlate well
with dietary exposure (Ohlendorf 1993). Lead does not appear to present a biological
concern for coots or grebes within Havasu NWR.
Mercury readily bioconcentrates in the food chain and accumulates in birds. Low
levels can be highly neurotoxic (Peterle 1991). Peakall and Lovett (1972) suggested that birds
at the top of freshwater food chains were those at highest risk of mercury poisoning. Mercury
was not detected in coot liver samples.
Mercury concentrations in bird eggs reflect exposure of the female to that element
(Ohlendorf et al. 1978, Scheuhammer 1987, Ohlendorf 1989). Mercury was recovered in all
western grebe eggs and in one of five Clark's grebe eggs at concentrations that ranged from
0.19 to 0.86 µg/g dry weight. Because mercury was not detected in four of five Clark's grebe
eggs, we could not statistically compare egg concentrations between species. Although these
levels are within the "normal" background range (Ohlendorf 1993), we found it interesting

that mercury concentrations in western grebe eggs were consistently higher than those in
Clark's grebe eggs (Table A-7). The reason for this difference is not clear; however, we offer
the following considerations. Food habits of the two species are similar. Their diets consist
primarily of fish, aquatic invertebrates, few amphibians, and feathers (Ehrlich et al. 1988).
However, ecological segregation between the two species is suspected. Nuechterlein (1981)
hypothesized that the two "color phases" may be segregating behaviorally into two subtly
different ecological forms specialized for feeding at different depths. (In the sixth edition of
the American Ornithologists' Union's check-list [1985], Clark's grebe was designated a
separate species from the western grebe. Prior to this separation, Clark's grebe was
considered the light color phase of the western grebe.) Previous research indicated that
Clark's grebes feed farther from shore than western grebes (Nuechterlein 1981, Ratti 1985).
If the two species of grebes are feeding at different depths, they may also be feeding on
different size and species of fish. Feerer (1977) reported that Clark's grebe females' stomachs
contained significantly smaller fish than those of western grebe females, but he found no
significant differences between males of the two species. If western and Clark's grebes feed
on different species of fish, there may be a correlation between their diet and the differing
concentrations of mercury in their eggs. Data on preferred habitats and food habits are
essential to understanding and interpreting bioaccumulation rates.
Different wintering areas of both species may also contribute to the dissimilar
concentrations of mercury in western and Clark's grebe eggs; however, Rosenberg et al.
(1991) suggested that Clark's grebes are resident on Lake Havasu with numbers remaining
relatively stable at 500 to 700 birds. Little is known about the winter distribution of Clark's
grebes except that they are less abundant than western grebes in most locations throughout
the United States and Canada (Nuechterlein and Storer 1989, Ratti 1981). Ratti (1979)
suggested a clinal variation in the relative abundance of dark- and light-phase grebes. Large
winter concentrations of western grebes occur from Lake Havasu north to Lake Mead and in
surrounding wetlands (M. Cressman, J. Kahl pers. comm). According to Rosenberg et al.
(1991), western grebes represent the bulk of Lake Havasu's wintering birds (as compared to
Clark's grebes). However, recent surveys by refuge personnel indicate a higher year-round
proportion of Clark's grebes to western grebes on Havasu NWR (C. Smith pers. comm). Data
from 1991 and 1992 Christmas Bird Counts (Lyons 1992, 1993) indicated large wintering
numbers of western grebes and few Clark's grebes in the Lake Mead area. Ratios of western
grebes to Clark's grebes were 20:1 in 1991 and 39:1 in 1992. While considering the relative
abundance of western grebes tabulated during Christmas Bird Counts, we should be cautious
ant not assume that these data accurately represent the proportion of each species for a
specific location. These data are from short-term observations that may be biased annually by
number of observers and hours observed. Further studies on differences between western and
Clark's grebes are needed, particularly on feeding habits and seasonal distribution.
Ruiz (1994) collected one Clark's grebe at the confluence of the Bill Williams River
and the Colorado River. Chemical analyses of the liver and kidney revealed 3.65 and 5.38
µg/g wet weight mercury, respectively. These levels are well below the "extremely
hazardous" concentration of 20 µg/g wet weight suggested by Finley et al. (1979). Mercury
does not appear to be a contaminant concern in western or Clark's grebes on the Colorado
River within Havasu or Bill Williams NWR.
Although selenium is an essential nutrient, this element can become toxic to fish and
wildlife at concentrations above a relatively low threshold. Relatively low concentrations of
selenium will bioaccumulate and biomagnify throughout the ecological food chain. The
effects of elevated levels of selenium levels in birds and fish can include teratogenesis,

reproductive failure, and mortality (Lemly and Smith 1987). Selenium was recovered in all
coot livers at concentrations that ranged from 2.59 to 3.39 µg/g wet weight (9.37 to 12.43
µg/g dry weight) and in kidneys ranging from 2.84 to 4.23 µg/g wet weight (17.42 to 20.05
µg/g dry weight). Selenium concentrations for coot livers and kidneys are presented in Table
5. In livers of birds from selenium "normal" environments, selenium usually averages less than
10 µg/g dry weight (Schroeder et al. 1988, Ohlendorf 1993, Skorupa et al. In review). Four
of five coot livers exceeded this "normal" or background range (Table 5). There were no
significant differences (P > 0.05) between selenium concentrations in coot tissues (livers and
kidneys) from Havasu NWR and coot tissues taken from backwater lakes on Imperial NWR
(Martinez 1994). However, selenium concentrations in coot tissues from Havasu NWR were
significantly higher (P = 0.0005, liver; P = 0.0017, kidney) than those in coots collected from
seep lakes on Imperial NWR. Martinez (1994) concluded that birds taken from backwater
lakes, had significantly higher selenium levels in their tissues than those taken from seep lakes,
regardless of species. Backwater lakes are those directly connected to the river by one or
more canals, whereas seep lakes receive water from the river only via seepage.
Table 5. Selenium concentrations (µg/g) in coot livers and kidneys from Topock Gorge,Colorado River, Havasu National Wildlife Refuge, 1993.
Liver Kidney
Sample Wet weight Dry weight Wet weight Dry weight
Coot 1 3.39 12.43 4.23 20.05
Coot 2 2.98 10.70 NA1 NA
Coot 3 3.20 12.14 2.84 18.92
Coot 4 2.59 9.37 4.03 17.42

Coot 5 3.00 11.57 NA NA
1 Insufficient tissue mass available for analysis.
Skorupa et al. (in review) reported that water bird populations with mean liver
selenium concentrations between 10 and 30 µg/g dry weight had elevated incidence of adverse
biological effects and should be studied for reproductive performance. Selenium
concentrations in adult coot livers from the highly contaminated Kesterson Reservoir averaged
>80 µg/g dry weight. All birds experienced selenosis (Ohlendorf et al. 1988). At Volta, the
control area for the Kesterson study, selenium concentrations averaged
<6 µg/g dry weight in livers of healthy adult coots.
Selenium concentrations in a Clark's grebe liver and kidney taken from Bill Williams
NWR in 1992 were 12.90 and 9.62 µg/g dry weight (Ruiz 1994). However, because grebes
are primarily piscivores (they also consume invertebrates) and coots primarily herbivores,
caution should be exercised when comparing interspecific trace element concentrations.
Species differences in selenium concentrations may be attributed to differences in food habits,
residence time, and foraging range (Ohlendorf et al. 1990, Martinez 1994, Skorupa, In
review). However, because aquatic invertebrates bioaccumulate selenium more readily than
aquatic plants (Hothem and Ohlendorf 1989, See et al. 1992), one would expect higher
selenium levels in grebes than in coots.
Dietary selenium levels are reflected in eggs of aquatic birds. Selenium concentrations
in eggs are the best predictors of reproductive impairment, but concentrations of selenium in
liver of females have been shown to be correlated with concentrations in their eggs (Paveglio
et al. 1992). Selenium concentrations in western and Clark's grebe eggs ranged from 6.60 to
11.54 µg/g dry weight, and 10.51 to
14.17 µg/g respectively (Table A-7). Elevated amounts of selenium in the diet have been
associated with decreased egg hatchability in laboratory studies of mallards and domestic
chickens (Arnold et al. 1973, Ort and Latshaw 1978, Heinz et al. 1987, Heinz and Fitzgerald
1993) and in free ranging aquatic birds at Kesterson Reservoir (Ohlendorf et al. 1986b). The
threshold level at which teratogenic or toxic effects may occur in aquatic bird eggs is 3 µg/g
dry weight (Lemly 1993). Selenium concentrations in western and Clark's grebe eggs were
two-to-four times higher than this concern level. Ohlendorf (1993) reported toxic levels of
selenium in aquatic bird eggs to be greater than 8 µg/g dry weight. Eighty percent (80%) of
grebe eggs we collected contained >8.0 µg/g selenium. Clark's grebe eggs from Topock
Marsh contained significantly (P = 0.02) higher selenium concentrations than western grebe
eggs from Topock Gorge. Previous studies (Lusk 1993, Martinez 1994) documented higher
selenium levels in biota within backwater areas on the lower Colorado River. Because
Topock Marsh exemplifies a backwater area, there may be a higher incidence of selenium
accumulation in individuals occupying the area. The majority of our sediment and fish
samples from Topock Marsh contained higher selenium levels than those from Topock Gorge.
Although wintering areas of Clark's grebes may be a consideration regarding
differences in mercury levels, it is an unlikely factor concerning selenium differences. Birds
feeding in a selenium-contaminated site will quickly accumulate high levels of selenium in their
liver and likewise, will quickly lose selenium when removed from the site (Heinz et al. 1990).
Vanadium was detected in four of five coot livers and ranged from 0.60 to
1.51 µg/g dry weight (0.15 to 0.41 µg/g wet weight [Table A-6]). Vanadium concentrations
in coot livers from Havasu NWR contained higher levels than those in livers of mallards fed a
diet containing 10 µg/g vanadium (0.06 µg/g wet weight) and lower than livers of mallards
fed a diet containing 100 µg/g vanadium (0.66 µg/g wet weight [White and Dieter 1978]).
Little information is available on the toxic effects of vanadium to aquatic birds. Double-
crested cormorants (Phalacrocorax auritus) collected from Topock Marsh in 1986 contained
vanadium concentrations in tissues of
<0.10 µg/g wet weight (below detection limit [Radtke et al. 1988]). Coots are primarily
herbivores. If levels of vanadium in spiny naiad are indicative of concentrations in aquatic
plants taken by coots, then there is little potential for bioaccumulation of vanadium to toxic
levels.
Zinc was recovered in all coot livers, and concentrations ranged from 153.6 to 212.9
µg/g dry weight (Table A-6). Little information is available on the toxicity of zinc to aquatic
birds; however, Reece et al. (1986) reported normal zinc concentrations in livers of domestic
aviary birds at 21 to 33 µg/g dry weight and toxic levels of zinc at 75 to 156 µg/g. Zinc
concentrations in coot livers collected in this study were predominantly well above those
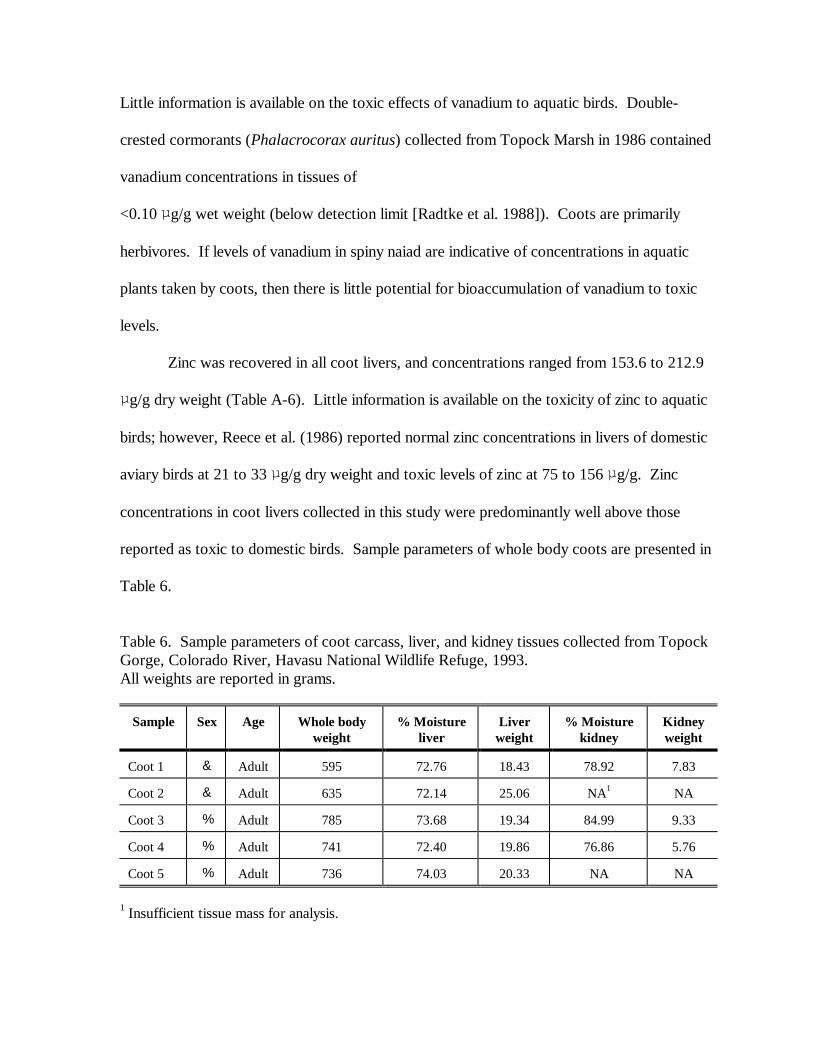
reported as toxic to domestic birds. Sample parameters of whole body coots are presented in
Table 6.
Table 6. Sample parameters of coot carcass, liver, and kidney tissues collected from TopockGorge, Colorado River, Havasu National Wildlife Refuge, 1993.All weights are reported in grams.
Sample Sex Age Whole bodyweight
% Moistureliver
Liverweight
% Moisturekidney
Kidneyweight
Coot 1 & Adult 595 72.76 18.43 78.92 7.83
Coot 2 & Adult 635 72.14 25.06 NA1 NA
Coot 3 % Adult 785 73.68 19.34 84.99 9.33
Coot 4 % Adult 741 72.40 19.86 76.86 5.76
Coot 5 % Adult 736 74.03 20.33 NA NA
1 Insufficient tissue mass for analysis.

Kidney:Liver Ratio:
Selenium accumulates in birds in the tissues associated with detoxification, such as the
liver, and elimination, such as the kidney (Fairbrother and Fowles 1990). Ratios of selenium
in kidneys and livers have been used to correct for toxicity differences among species and
diets (Ohlendorf et al. 1990). Dietary selenium levels are assumed to be "normal" when
kidney:liver ratios are greater than 1, and elevated when they are less than 1 (Ohlendorf and
Skorupa 1989, Ohlendorf et al. 1990).
All (n = 3) coots for which we were able to establish kidney:liver ratios, had ratios

greater than one. For coots 1, 3, and 4, ratios were 1.61, 1.56, and 1.86, respectively (Table
7). These ratios would suggest dietary levels were "normal" based on the criteria of
Ohlendorf et al. (1990). Selenium concentrations in coot kidneys were greater than those in
livers in this study indicating low dietary levels of selenium.
Table 7. Selenium concentrations (µg/g dry weight) in coot kidneys and livers andkidney:liver ratios from Topock Gorge, Colorado River, Havasu National Wildlife Refuge,1993.
Sample Kidney Liver Ratio
Coot 1 20.05 12.43 1.61
Coot 3 18.92 12.14 1.56
Coot 4 17.42 9.37 1.86
CONCLUSIONS
Organocholorine compounds likely do not present a threat to fish and wildlife
resources of Havasu NWR. No organochlorine compounds were recovered in sediment or
clams, and low concentrations of DDE were present in coot carcasses. In order to fully assess
the possible exposure of biota of Havasu NWR to organochlorines, fish and piscivorous birds
should be collected and analyzed.
We found several elements that may be a concern to fish and wildlife of Havasu NWR.
These include arsenic, cadmium, chromium, copper, lead, and selenium. Selenium is the

element of greatest concern in the lower Colorado River aquatic ecosystem. Elevated
selenium levels have been well documented in the lower Colorado River, particularly in areas
adjacent to Imperial and Cibola NWRs. This study documents elevated selenium levels in the
Colorado River system upstream as far as Havasu NWR.
Selenium concentrations were elevated in all biota. Spiny naiad contained
concentrations well above the background level, clams and fish had levels high enough to
possibly impair reproduction of the birds that feed on them, coot tissues contained above
background levels, and western and Clark's grebe eggs contained selenium concentrations
above the threshold level at which terotegenic or toxic effects could occur. Continued
research on levels and effects of selenium in fish and piscivorous birds, including monitoring
reproductive success and teratogenesis, should be given high priority.
ACKNOWLEDGEMENTS
We thank Brent Bristow for providing the electroshocking boat and help with fish
collections. Appreciation is also expressed to Don Henry for field assistance, and especially
Christy Smith and Brent Bristow for their Clark's grebe egg collections. We thank Havasu
National Wildlife Refuge personnel (especially Jim Good, Greg Wolf, and Christy Smith) who
graciously provided their support throughout this study. We are
grateful to Nick Carrillo for his contribution of graphical expertise. This report was reviewed
by Russ MacRae, Andrew T. Smith, Christy Smith, Stanley Wiemeyer, and Mark Wilson, who
provided numerous helpful and constructive improvements.
LITERATURE CITED
American Ornithologists' Union. 1985. Thirty-fifth supplement to the AmericanOrnithologists' Union check-list of North American birds. Auk 102:680-686.
Andrews, B. J., K. A. King, and D. L. Baker. 1995. Radionuclides and trace elementsin fish and wildlife of the Puerco and Little Colorado Rivers, Arizona. U.S.Fish Wildl. Service Contam. Report, Phoenix Ecological Services Field Office,Arizona. December 1995. 20 pp.
Arnold, R. L., O. E. Olson, and C. W. Carlson. 1973. Dietary selenium and arsenicadditions and their effects on tissue and egg selenium. Poult. Sci. 52:847-854.
Baker, D. L., and K. A. King. 1994. Environmental contaminant investigation of waterquality, sediment and biota of the Upper Gila River Basin, Arizona. U.S. FishWildl. Service Contam. Report, Phoenix Ecological Services Field Office, Arizona.
July 1994. 25 pp.
Baker, D. L., K. A. King, W. G. Kepner, and J. D. Krausmann. 1992. Pre-reconnaissance investigation of water quality, bottom sediment, and biotaassociated with irrigation drainage in Yuma Valley, Arizona. U.S. Fish Wildl.Serv. Contam. Report, Phoenix Ecological Services Field Office, Arizona.November 1992. 31 pp.
Baumann, P. C., and T. W. May. 1984. Selenium residues in fish from inland waters ofthe United States. Pages 1-16 in Workshop proceedings, The effects of trace elementson aquatic ecosystems. Vol.7. Electric Power Research Institute, Palo Alto, CA.
Beyer, W. N. 1990. Evaluating soil contamination. U.S. Fish Wildl. Serv., BiologicalRep. 90(2). 25 pp.
Blus, L. J., B. S. Neely, Jr., T. G. Lamont, and B. Mulhern. 1977. Residues oforganochlorines and heavy metals in tissues and eggs of brown pelicans, 1969-73. Pestic. Monit. J. 11:40-53.
Boerngen, J. G., and H. T. Shacklette. 1981. Chemical analyses of soils and othersurficial materials of the conterminous United States. U.S. Geol. Surv.Open-File Report 81-197, 143 pp.
Bristol, R. S., and L. S. Shomo. 1993. Contaminant investigation for Las VegasNational Wildlife Refuge, Las Vegas, New Mexico. U.S. Fish Wildl. Service Contam. Report, New Mexico Ecological Services Field Office, July 1993. 33 pp.
Camardese, M. B., D. J. Hoffman, L. J. LeCaptain, and G. W. Pendleton. 1990. Effects ofarsenate on growth and physiology in mallard ducklings. Environ. Toxicol. and Chem.9:785-795
Crayton, W. M., and R. Jackson. 1991. Preliminary Working Draft Environmental Contaminants Program, Anchorage Field Office Data Interpretation Philosophyand Associated Criteria. U.S. Fish and Wildl. Serv., 605 W. 4th Ave., Room62, Anchorage, Alaska 99501, 30 pp.
Cromartie, E., W. L. Reichel, L. N. Locke, A. A. Belisle, T. E. Kaiser, T. G. Lamont,B. M. Mulhern, R. M. Prouty, and D. M. Swineford. 1975. Residues oforganochlorine pesticides and polychlorinated biphenyls and autopsy data for baldeagles, 1971-72. Pestic. Monit. J. 9:11-14.
Di Giulio, R. T., and P. F. Scanlon. 1984. Heavy metals in tissues of waterfowl fromthe Chesapeake Bay, USA. Environ. Pollut. Ser. A, 35:29-48.
Ehrlich, P. R., D. S. Dobkin, and D. W. Wheye. 1988. The birder's handbook; a field guide to the natural history of North American birds. Simon and Schuster, Inc.,New York. 785 pp.
Eisler, R. 1986. Chromium hazards to fish, wildlife, and invertebrates: a synoptic review. U.S. Fish Wildl. Serv. Biol. Rep. 85(1.2). 46 pp.
. 1987. Mercury hazards to fish, wildlife, and invertebrates: a synopticreview. U.S. Fish Wildl. Serv. Biol. Rep. 85(1.10). 90 pp.
. 1988a. Arsenic hazards to fish, wildlife, and invertebrates: a synopticreview. U.S. Fish Wildl. Serv. Biol. Rep. 85(1.12). 92 pp.
. 1988b. Lead hazards to fish, wildlife, and invertebrates: a synoptic review.U.S. Fish Wildl. Serv. Biol. Rep. 85(1.14). 134 pp.
. 1993. Zinc hazards to fish, wildlife, and invertebrates: a synopticreview. U.S. Fish Wildl. Serv. Biol. Rep. 10. 106 pp.
Fairbrother, A., and J. Fowles. 1990. Subchronic effects of sodium selenite andselenomethionine on several immune-functions in mallards. Arch. Environ. Contam.
and Toxicol. 19:836-844.
Feerer, J. L. 1977. Niche partitioning by western grebe polymorphs. M.S. Thesis. Humbolt State University, Arcata.
Finley, M. T., W. H. Stickel, and R. E. Christensen. 1979. Mercury residues in tissuesof dead and surviving birds fed methylmercury. Bull. Environ. Contam. and Toxicol. 21:105-110.
Gillespie, R. B., and P. C. Baumann. 1986. Effects of high tissue concentrations ofselenium on reproduction by bluegills. Trans. Amer. Fish Soc. 115:208-213.
Heinz, G. H. and M. A. Fitzgerald. 1993. Reproduction of mallards following overwinterexposure to selenium. Environ. Pollut. 81:117-122.
, D. J. Hoffman, A. J. Kyrnitsky, and D. M. Weller. 1987. Reproduction in mallardsfed selenium. Environ. Toxicol. and Chem. 6:423-433.
, G. W. Pendleton, A. J. Krynitsky, and L. G. Gold. 1990. Seleniumaccumulation and elimination in mallards. Arch. of Environ. Contam. and Toxicol.
19:374-379.
Henderson, B. M., and R. W. Winterfield. 1974. Acute copper toxicosis in the Canadagoose. Avian Diseases. 19:385-387.
Hothem, R. L., and H. M. Ohlendorf. 1989. Contaminants in foods of quatic birds atKesterson Reservoir, California, 1985. Arch. Environ. Contam. and Toxicol. 18:773-786.
Ingersoll, C. G., and M. K. Nelson. 1989. Testing sediment toxicity with Hyallella
azteca (Amphibpoda) and Chironomus riparius (Diptera). Present April 16-18 atASTM STP Symposium on Aquatic Toxicology Risk Assessment, Atlanta, Georgia,
43 pp.
Irwin, R. J. 1988. Impacts of toxic chemicals on Trinity Rivers fish and wildlife.U.S. Fish Wildl. Serv. Contam. Report, Fort Worth Field Office, Texas. November
1988. 82 pp.
Jenkins, D. W. 1981. Biological monitoring of toxic trace elements. EPA Report 600/S3-80-090:1-9.
Keith, L. H., and W. A. Telliard. 1979. Priority Pollutants: I - a perspective view.Environ. Sci. and Technology. 13:416-423.
King, K. A., and D. L. Baker. 1995. Contaminants in fish and wildlife of the middleGila River, Arizona. U.S. Fish Wildl. Service Contam. Report, Phoenix Ecological
Services Field Office, Arizona. February 1995. 17 pp.
, , W. G. Kepner, and J. D. Krausmann. 1991. Contaminants in prey of bald eagles nesting in Arizona. U.S. Fish Wildl. Serv. Contam. Report, PhoenixEcological Services Field Office, Arizona. October 1991. 16 pp.
, , , and C. T. Martinez. 1993. Contaminants in sediment and fish fromNational Wildlife Refuges on the Colorado River, Arizona. U.S. Fish Wildl. Serv.Contam. Report, Phoenix Ecological Services Field Office, Arizona. August 1993. 24pp.
, C. A. Lefever, and B. M. Mulhern. 1983. Organochlorine and metal residues inroyal terns nesting on the central Texas coast. J. Field Ornithol. 54:
295-303.
Leland, H. V., and J. S. Kuwabara. 1985. Trace Metals. Pages 374-415 in G. M. Rand andS. R. Petrocelli, eds. Fundamentals of Aquatic Toxicology. Hemisphere Publ. Co., NewYork.
Lemly, A. D. 1993. Guidelines for evaluating selenium data from aquatic monitoringand assessment studies. Environ. Monit. and Assess. 28:83-100.
, and G. J. Smith. 1987. Aquatic cycling of selenium: Implications forfish and wildlife. U.S. Fish Wildl. Serv. Leaflet No. 12, Washington D.C. 10 pp.
Leonzio, C., and A. Massi. 1989. Metal biomonitoring in bird eggs: a critical experiment. Bull. Environ. Contam. and Toxicol. 43:402-406.
Longcore, J. R., L. N. Locke, G. E. Bagley, and R. Andrews. 1974. Significance of lead residues in mallard tissues. Special Scientific Report--Wildlife No 182, U.S.

Fish Wildl. Serv., Washington, D.C. 24 pp.
Lowe, T. P., T. W. May, W. G. Brumbaugh, and D. A. Kane. 1985. National contaminant biomonitoring program: Concentrations of seven elements infreshwater fish, 1978-81. Arch. Environ. Contam. and Toxicol. 14:363-388.
Lusk, J. D. 1993. Selenium in aquatic habitats at Imperial National Wildlife Refuge.M.S. Thesis, University of Arizona, Tucson. 151 pp.
Lyons, C. 1992. American Birds. Henderson, NV 46:929-939.
. 1993. American Birds. Henderson, NV 47:900.
Martinez, C. T. 1994. Selenium levels in selected species of aquatic birds on ImperialNational Wildlife Refuge. M.S. Thesis, University of Arizona, Tucson. 74 pp.
McCaulou, T., W. J. Matter, and O. E. Maughan. 1994. Corbiculae fluminea as a bioindicator on the lower Colorado River. Final Report. Arizona CooperativeFishery Research Unit, Tucson, Arizona. 66 pp.
Morris, E. R. 1987. Iron. Pages 79-126 in W. Mertz, ed. Trace Elements in Human andAnimal Nutrition. Fifth ed. Academic Press, Inc., San Diego, CA.
Nuechterlein, G. L. 1981. Courtship behavior and reproductive isolation between Western grebe color morphs. Auk 98:335-349.
, and R. W. Storer. 1989. Mate feeding by western and Clark's grebes. Condor 91:37-42.
Ohlendorf, H. M. 1989. Bioaccumulation and effects of selenium in wildlife. Pages 133-177 in L. W. Jacobs, ed. Selenium in agriculture and the environment. SSSA Spec. Publ. 23. Am. Soc. Agronomy and Soil Sc. Soc. of Am., Madison, WI.
. 1993. Marine birds and trace elements in the temperate North Pacific. Pages 232-240 in K. Vermeer, K. T. Briggs, K. H. Morgan, and D. Siegel-Causey, eds. The status, ecology, and conservation of marine birds of the North Pacific. Can. Wildl. Rev. Spec. Publ., Ottawa.
, and J. P. Skorupa. 1989. Selenium in relation to wildlife andagricultural drainage water. Pages 314-338 in S.C. Carapella, Jr. ed. Proceedings of
the Fourth International Symposium on Uses of Selenium and Tellurium. Banff Alberta,May 7-10, 1989. Selenium-Tellurium Development Association, Inc.,
Darien, CT.
, D. J. Hoffman, M. K. Saiki, and T. W. Aldrich. 1986a. Embryonic mortality andabnormalities of aquatic birds: Apparent impacts of selenium
from irrigation drainwater. Sci. Total Environ. 52:49-63.

, R. L. Hothem, C. M. Bunck, T. W. Aldrich, and J. F. Moore. 1986b. Relationships between selenium concentrations and avian reproduction. Trans. North Am. Wildl. and Natural Resources Conf. 51:330-342.
, , , and K. C. Marois. 1990. Bioaccumulation of selenium in birds atKesterson Reservoir, California. Arch. of Environ. Contam. and Toxicol. 19:495-507.
, A. W. Kilness, J. L. Simmons, R. K. Stroud, D. J. Hoffman, andJ. F. Moore. 1988. Selenium toxicosis in wild aquatic birds. J. Toxicol. Environ.
Health. 24:67-92.
, R. W. Risebrough, and K. Vermeer. 1978. Exposure of marine birds to environmental pollutants. U.S. Fish Wildl. Serv., Wildl. Res. Rep. No. 9. 40 pp.
Ort, J. F., and J. D. Latshaw. 1978. The toxic level of sodium selenite in the diet oflaying chickens. J. Nutri. 108(1):114-120.
Parslow, J. L. F., G. J. Thomas, and T. D. Williams. 1982. Heavy metals in the livers ofwaterfowl from Ouse Washes, England. Environ. Pollut. (Series A) 29:317- 327.
Paveglio, F. L., C. M. Bunck, and G. H. Heinz. 1992. Selenium and boron in aquatic birds from central California. J. Wildl. Manage. 56:31-42.
Peakall, D. B., and R. J. Lovett. 1972. Mercury: its occurrence and effects in theenvironment. Bioscience. 22:20-25.
Peterle, T. J. 1991. Wildlife Toxicology. Van Nostrand Reinhold, New York, xxi + 322pp.
Radtke, D. B., W. G. Kepner, and R. J. Effertz. 1988. Reconnaissance investigation ofwater quality, bottom sediment, and biota associated with irrigation drainage in the
lower Colorado River Valley, Arizona, California, and Nevada, 1986-87. U.S. Geol. Surv.Water-Resour. Invest. Report 88-4002. Tucson, AZ. 77 pp.
Ratti, J. T. 1979. Reproductive separation and isolating mechanisms between sympatricdark- and light-phase western grebes. Auk 96:573-586.
. 1981. Identification and distribution of Clark's grebe. Western Birds12:41-46.
. 1985. A test of water depth niche partitioning by western grebe colormorphs. Auk 102:635-637.
Reece, R. L., D. B. Dickson, P. J. Burrowes. 1986. Zinc toxicity (new wire disease) in aviary birds. Australian Veterinary J. 63(6):199.
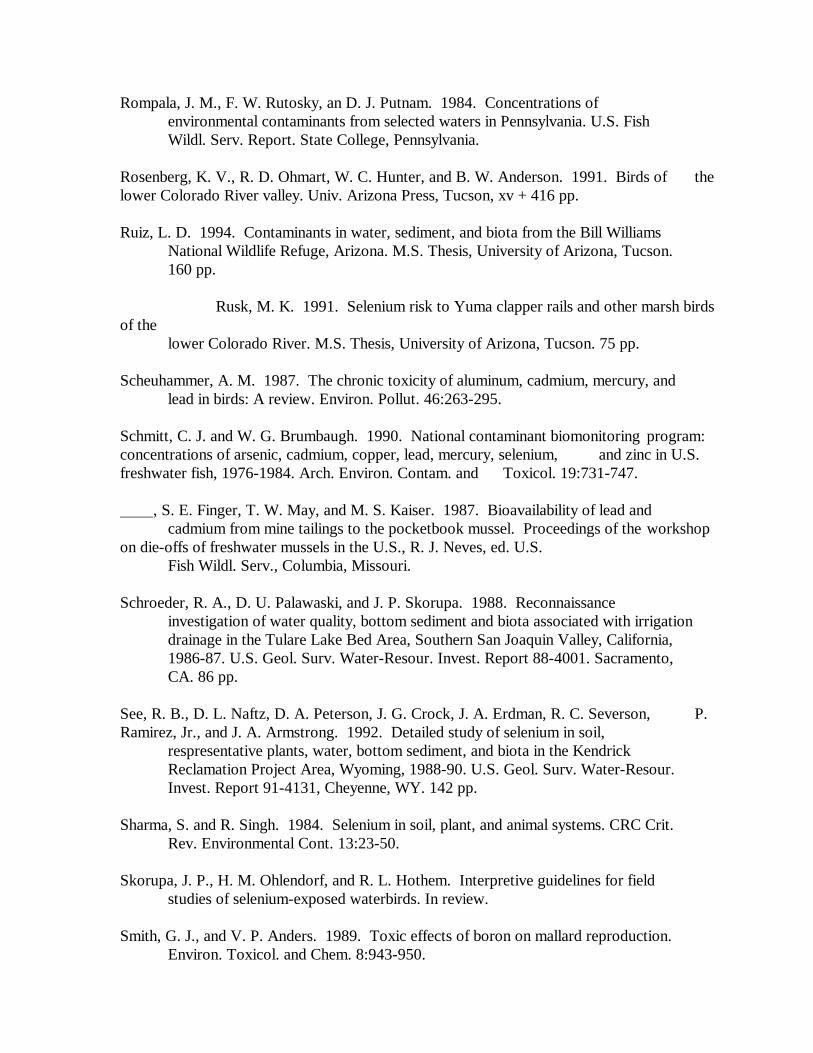
Rompala, J. M., F. W. Rutosky, an D. J. Putnam. 1984. Concentrations of environmental contaminants from selected waters in Pennsylvania. U.S. Fish Wildl. Serv. Report. State College, Pennsylvania.
Rosenberg, K. V., R. D. Ohmart, W. C. Hunter, and B. W. Anderson. 1991. Birds of thelower Colorado River valley. Univ. Arizona Press, Tucson, xv + 416 pp.
Ruiz, L. D. 1994. Contaminants in water, sediment, and biota from the Bill WilliamsNational Wildlife Refuge, Arizona. M.S. Thesis, University of Arizona, Tucson.160 pp.
Rusk, M. K. 1991. Selenium risk to Yuma clapper rails and other marsh birdsof the
lower Colorado River. M.S. Thesis, University of Arizona, Tucson. 75 pp.
Scheuhammer, A. M. 1987. The chronic toxicity of aluminum, cadmium, mercury, and lead in birds: A review. Environ. Pollut. 46:263-295.
Schmitt, C. J. and W. G. Brumbaugh. 1990. National contaminant biomonitoring program:concentrations of arsenic, cadmium, copper, lead, mercury, selenium, and zinc in U.S.freshwater fish, 1976-1984. Arch. Environ. Contam. and Toxicol. 19:731-747.
, S. E. Finger, T. W. May, and M. S. Kaiser. 1987. Bioavailability of lead andcadmium from mine tailings to the pocketbook mussel. Proceedings of the workshop
on die-offs of freshwater mussels in the U.S., R. J. Neves, ed. U.S.Fish Wildl. Serv., Columbia, Missouri.
Schroeder, R. A., D. U. Palawaski, and J. P. Skorupa. 1988. Reconnaissance investigation of water quality, bottom sediment and biota associated with irrigationdrainage in the Tulare Lake Bed Area, Southern San Joaquin Valley, California,1986-87. U.S. Geol. Surv. Water-Resour. Invest. Report 88-4001. Sacramento, CA. 86 pp.
See, R. B., D. L. Naftz, D. A. Peterson, J. G. Crock, J. A. Erdman, R. C. Severson, P.Ramirez, Jr., and J. A. Armstrong. 1992. Detailed study of selenium in soil,
respresentative plants, water, bottom sediment, and biota in the KendrickReclamation Project Area, Wyoming, 1988-90. U.S. Geol. Surv. Water-Resour. Invest. Report 91-4131, Cheyenne, WY. 142 pp.
Sharma, S. and R. Singh. 1984. Selenium in soil, plant, and animal systems. CRC Crit. Rev. Environmental Cont. 13:23-50.
Skorupa, J. P., H. M. Ohlendorf, and R. L. Hothem. Interpretive guidelines for field studies of selenium-exposed waterbirds. In review.
Smith, G. J., and V. P. Anders. 1989. Toxic effects of boron on mallard reproduction.Environ. Toxicol. and Chem. 8:943-950.

Sorenson, E. M. 1991. Metal Poisoning in Fish. CRC Press, Inc. Boca Raton, Florida,pp 119-174.
Stickel, L. F. 1973. Pesticide residues in birds and mammals. Pages 254-312 in C. A.Edwards, ed. Environmental Pollution by Pesticides. Plenum Press, New York.
Stickel, W. H., L. F. Stickel, R. A. Dyrland, and D. L. Hughes. 1984. DDE in birds:Lethal residues and loss rates. Arch. Environ. Contam. and Toxicol. 13:1-6.
Tadayon, S., K. King, B. Andrews, and B. Roberts. Field screening of water quality, bottom sediment, and biota associated with irrigation drainage in the YumaValley, Arizona, 1995. U.S. Geol. Surv. Water-Resour. Invest. Report. Tucson,
AZ. In press.
U. S. Fish and Wildlife Service. 1990. Patuxent Analytical Control Facility referencemanual. U.S. Fish and Wildlife Service, Laurel, MD. 119 pp.
Walsh, D. F., B. L. Berger and J. R. Bean. 1977. Mercury, arsenic, lead, cadmium, andselenium residues in fish. 1971-1973 - National Pesticide Monitoring Program. Pestic.Monit. J. 11:5-134.
Welsh, D., and O. E. Maughan. 1993. Selenium in aquatic habitats at Cibola NationalWildlife Refuge. Final Report. Arizona Cooperative Fishery Research Unit, Tucson, Arizona. 132 pp.
White, D. H., and M. P. Dieter. 1978. Effects of dietary vanadium in mallard ducks.J. Toxicol. Environ. Health. 4:43-50.

APPENDIX A

Analytical Results
Table A-1. DDE residues (µg/g) in American coot (Fulica americana) carcasses collectedfrom Topock Gorge, Havasu National Wildlife Refuge, 1993.
Sample Sex Age Whole bodyweight (g)
Carcassweight1 (g)
Percentmoisture
Percentlipid
DDE(dry weight)
Coot 1 & Adult 595 336 66.8 13.4 0.93
Coot 2 & Adult 635 326 75.6 2.9 0.04
Coot 3 % Adult 785 434 68.8 8.2 0.06
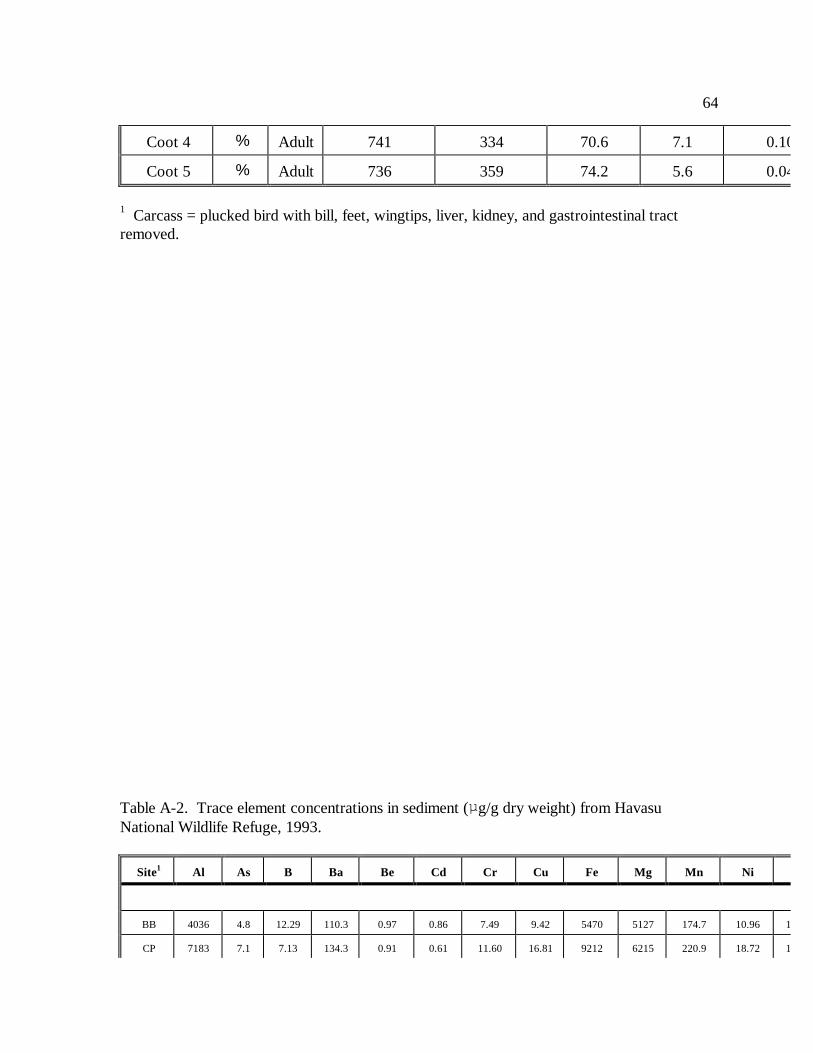
64
Coot 4 % Adult 741 334 70.6 7.1 0.10
Coot 5 % Adult 736 359 74.2 5.6 0.04
1 Carcass = plucked bird with bill, feet, wingtips, liver, kidney, and gastrointestinal tractremoved.
Table A-2. Trace element concentrations in sediment (µg/g dry weight) from HavasuNational Wildlife Refuge, 1993.
Site1 Al As B Ba Be Cd Cr Cu Fe Mg Mn Ni
BB 4036 4.8 12.29 110.3 0.97 0.86 7.49 9.42 5470 5127 174.7 10.96 13.21
CP 7183 7.1 7.13 134.3 0.91 0.61 11.60 16.81 9212 6215 220.9 18.72 15.53

65
DE 11080 9.3 7.25 265.1 1.59 1.12 17.61 34.29 14610 10350 315.5 23.54 41.13
GH 5345 3.9 8.86 145.9 0.78 0.60 9.16 13.02 7600 7551 307.5 10.56 20.10
ND 2269 13.1 <4.81 78.2 0.46 0.37 8.25 <4.81 3994 1969 56.3 6.99 9.27
PS 12580 8.6 10.01 282.2 0.94 0.42 12.53 23.06 15090 10170 331.2 16.40 38.29
1 BB - Blankenship Bend; CP - Catfish Paradise; DE - Devils Elbow; GH - Glory Hole; ND -North Dike; PS - Pintail Slough
Mercury and molybdenum were not detected in any samples.
Table A-3. Trace element concentrations (µg/g wet weight / dry weight) in spiny naiad(Najas marina) from Topock Gorge, Havasu National Wildlife Refuge, 1993.
Site1 Al As B Ba Cr Cu Fe Mn Mg Ni Pb
DE 154.4 0.62 2.26 17.1 0.50 1.4 236.0 37.3 692.3 0.57 0.54

66
1270 5.12 18.6 140.6 4.09 11.5 1941 306.9 5693 4.69 4.41
BB 48.9737.6
0.142.07
0.9614.48
17.3260
0.233.47
0.294.41
74.21117
13.1198
323.74875
0.182.66
0.202.95
1 DE - Devils Elbow BB - Blankenship Bend
Beryllium, cadmium, mercury, and molybdenum were not detected in any samples.
Table A-4. Trace element concentrations (µg/g wet weight / µg/g dry weight) in Asiaticclams (Corbicula fluminea) from Topock Marsh, Havasu National Wildlife Refuge, 1993.
Site1 Al As Ba Be Cd Cr Cu Fe Mg Mn Mo Ni
CP 20.46180.4
1.1610.23
4.4439.19
BDL2
BDL0.030.29
BDLBDL
3.3429.45
41.36364.7
144.91278
13.54119.4
BDLBDL
0.655.73
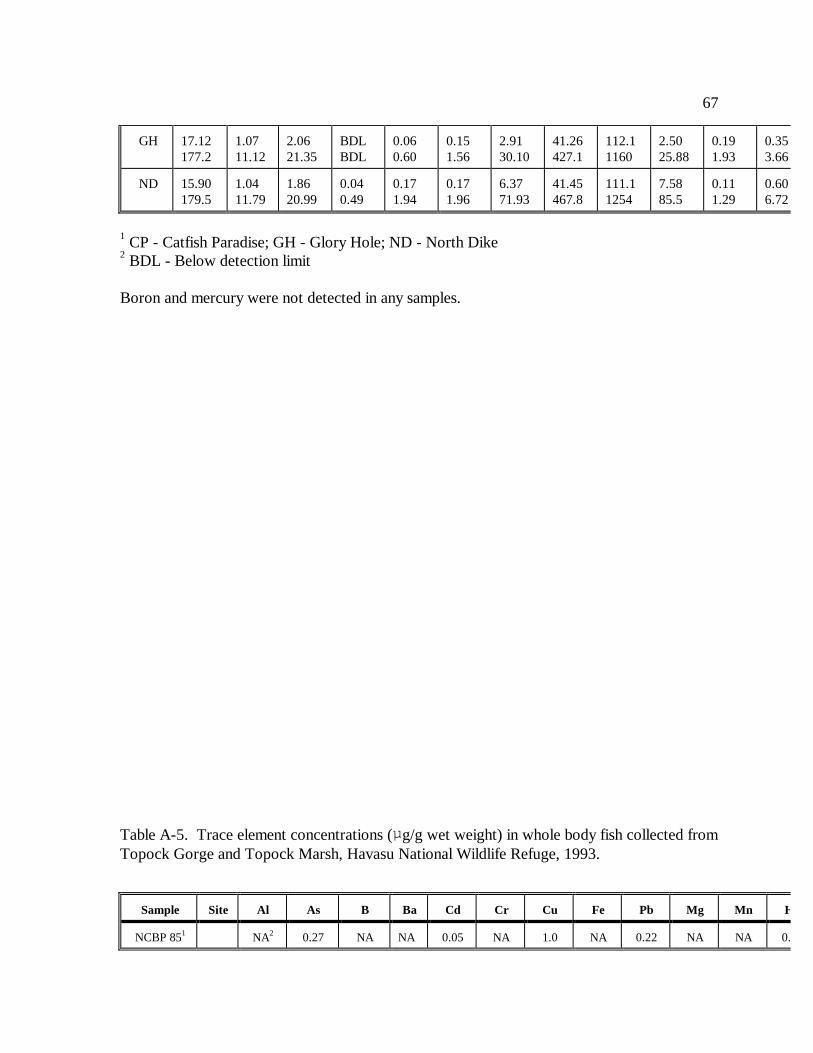
67
GH 17.12177.2
1.0711.12
2.0621.35
BDLBDL
0.060.60
0.151.56
2.9130.10
41.26427.1
112.11160
2.5025.88
0.191.93
0.353.66
ND 15.90179.5
1.0411.79
1.8620.99
0.040.49
0.171.94
0.171.96
6.3771.93
41.45467.8
111.11254
7.5885.5
0.111.29
0.606.72
1 CP - Catfish Paradise; GH - Glory Hole; ND - North Dike2 BDL - Below detection limit
Boron and mercury were not detected in any samples.
Table A-5. Trace element concentrations (µg/g wet weight) in whole body fish collected fromTopock Gorge and Topock Marsh, Havasu National Wildlife Refuge, 1993.
Sample Site Al As B Ba Cd Cr Cu Fe Pb Mg Mn Hg
NCBP 851 NA2 0.27 NA NA 0.05 NA 1.0 NA 0.22 NA NA 0.17

68
CRP3 TG4 43.1 <0.11 0.18 2.53 0.02 1.27 ..1.80 107 0.22 283 3.0 0.03
CRP TG 53.2 0.16 0.18 2.80 0.08 2.08 1.86 129 0.80 282 3.9 0.05
CRP TM5 73.6 <0.10 <0.11 2.53 0.02 0.46 3.08 56 0.36 338 2.0 <0.02
LMB6 TG 15.4 0.10 <0.10 1.97 <0.02 0.64 2.92 162 0.14 325 2.6 0.08
LMB TG 9.6 <0.12 <0.18 1.19 0.06 0.44 1.78 27 <0.12 270 1.3 0.05
LMB TM 9.6 <0.10 <0.11 0.99 <0.02 0.50 1.81 22 <0.11 288 1.0 0.02
CC7 TG 14.0 0.20 0.22 0.62 <0.03 0.40 1.32 39 0.24 220 1.7 0.04
CC TG 16.2 0.19 <0.13 2.52 0.03 0.39 0.53 42 1.0 225 1.7 <.03
CC TM 6.81 <0.12 0.28 0.29 <0.02 0.65 0.37 53 <0.12 191 1.3 <0.02
1 National Contaminant Biomonitoring Program 85th Percentile (Schmitt and Brumbaugh 1990).2 Data not available.3 CRP = Common carp (Cyprinus carpio)4 TG = Topock Gorge5 TM = Topock Marsh6 LMB = Largemouth bass (Micropterus salmoides)7 CC = Channel catfish (Ictalurus punctatus)
Vanadium was detected in common carp from Topock Gorge at 0.30 and 0.22 µg/g.Beryllium was not detected in any samples.
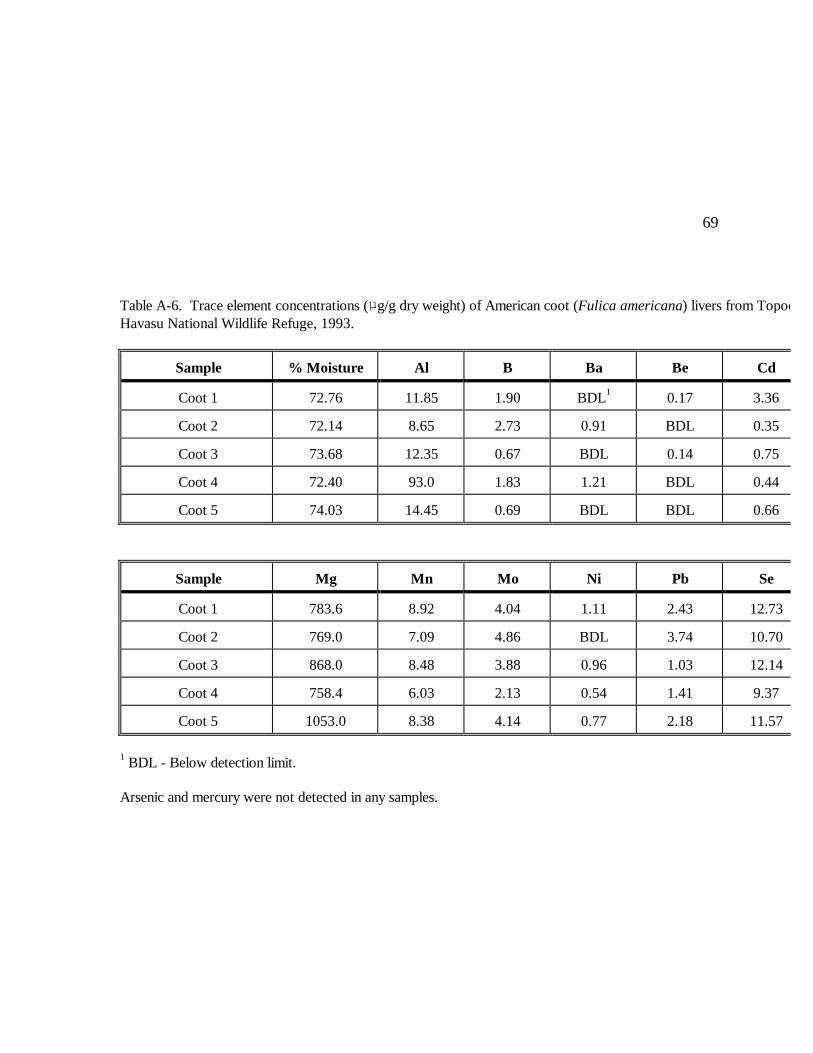
69
Table A-6. Trace element concentrations (µg/g dry weight) of American coot (Fulica americana) livers from Topock Gorge, Colorado River,Havasu National Wildlife Refuge, 1993.
Sample % Moisture Al B Ba Be Cd
Coot 1 72.76 11.85 1.90 BDL1 0.17 3.36
Coot 2 72.14 8.65 2.73 0.91 BDL 0.35
Coot 3 73.68 12.35 0.67 BDL 0.14 0.75
Coot 4 72.40 93.0 1.83 1.21 BDL 0.44
Coot 5 74.03 14.45 0.69 BDL BDL 0.66
Sample Mg Mn Mo Ni Pb Se
Coot 1 783.6 8.92 4.04 1.11 2.43 12.73
Coot 2 769.0 7.09 4.86 BDL 3.74 10.70
Coot 3 868.0 8.48 3.88 0.96 1.03 12.14
Coot 4 758.4 6.03 2.13 0.54 1.41 9.37
Coot 5 1053.0 8.38 4.14 0.77 2.18 11.57
1 BDL - Below detection limit.
Arsenic and mercury were not detected in any samples.
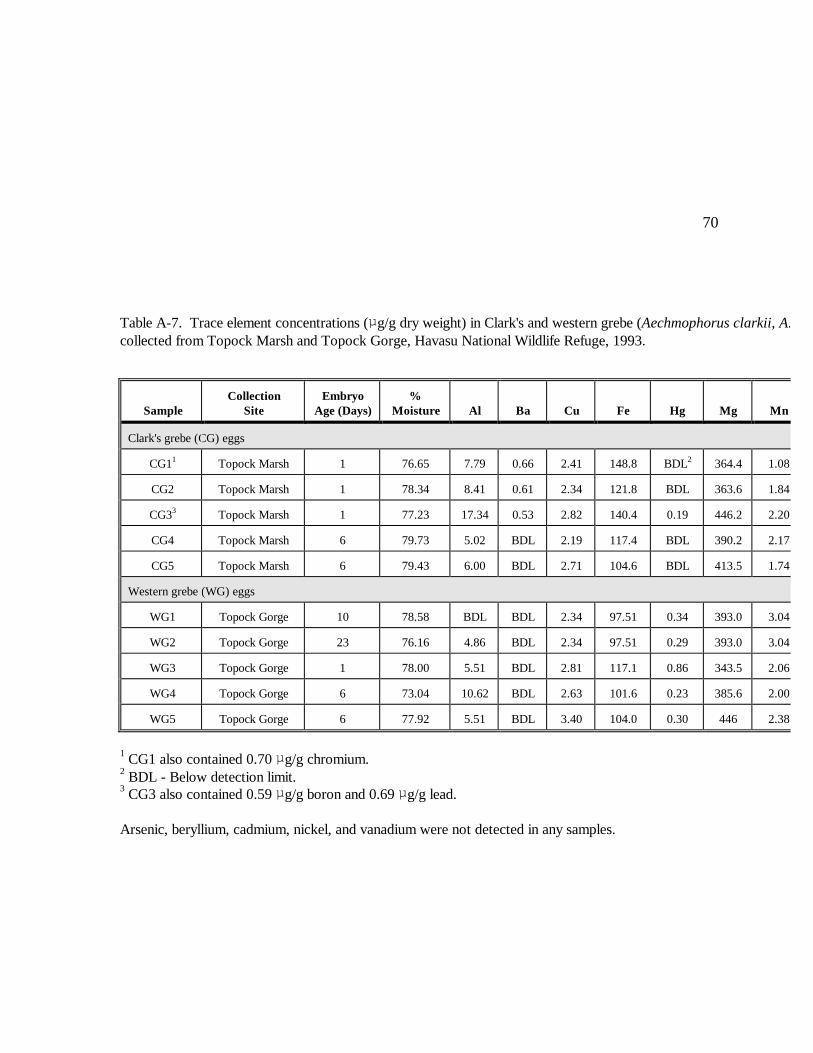
70
Table A-7. Trace element concentrations (µg/g dry weight) in Clark's and western grebe (Aechmophorus clarkii, A. occidentaliscollected from Topock Marsh and Topock Gorge, Havasu National Wildlife Refuge, 1993.
SampleCollection
SiteEmbryo
Age (Days)%
Moisture Al Ba Cu Fe Hg Mg Mn
Clark's grebe (CG) eggs
CG11 Topock Marsh 1 76.65 7.79 0.66 2.41 148.8 BDL2 364.4 1.08
CG2 Topock Marsh 1 78.34 8.41 0.61 2.34 121.8 BDL 363.6 1.84
CG33 Topock Marsh 1 77.23 17.34 0.53 2.82 140.4 0.19 446.2 2.20
CG4 Topock Marsh 6 79.73 5.02 BDL 2.19 117.4 BDL 390.2 2.17
CG5 Topock Marsh 6 79.43 6.00 BDL 2.71 104.6 BDL 413.5 1.74
Western grebe (WG) eggs
WG1 Topock Gorge 10 78.58 BDL BDL 2.34 97.51 0.34 393.0 3.04
WG2 Topock Gorge 23 76.16 4.86 BDL 2.34 97.51 0.29 393.0 3.04
WG3 Topock Gorge 1 78.00 5.51 BDL 2.81 117.1 0.86 343.5 2.06
WG4 Topock Gorge 6 73.04 10.62 BDL 2.63 101.6 0.23 385.6 2.00
WG5 Topock Gorge 6 77.92 5.51 BDL 3.40 104.0 0.30 446 2.38
1 CG1 also contained 0.70 µg/g chromium.2 BDL - Below detection limit.3 CG3 also contained 0.59 µg/g boron and 0.69 µg/g lead.
Arsenic, beryllium, cadmium, nickel, and vanadium were not detected in any samples.

71