u.s. feeder cattle prices: effects of finance and risk,...
TRANSCRIPT
Journal ofAgricultural and Resource Economics 26(2):463-477Copyright 2001 Western Agricultural Economics Association
U.S. Feeder Cattle Prices:Effects of Finance and Risk,
Cow-Calf and Feedlot Technologies,and Mexican Feeder Imports
John M. Marsh
Analysis of U.S. feeder steer prices normally includes fed cattle prices and feed graincosts. An expanded econometric model which investigates finance cost, profit risk,hay cost, technology, and Mexican feeder cattle import shares is estimated. Resultsindicate statistical significance of nearly all variables. The increase in feeder importshares contributed to $0.60/cwt of the $24.48/cwt decline in real feeder price from1980-1999. Improved technology in producing feeder calves has reduced feeder pricesmore substantially, by $4.86/cwt from 1980-1999. Increased feedlot technologythrough cost savings has increased feeder price. Feedlot risk management and macro-economic policies affecting the U.S. prime interest rate could continue to affect feederprices.
Key words: feeder cattle, import shares, interest, price impacts, risk, technology
Introduction
Beef producers determine their breeding herd size by many factors, with one criticalfactor being expected price of feeder cattle (Foster and Burt; Jarvis; Marsh 1999; Rosen,Murphy, and Scheinkman; Rucker, Burt, and LaFrance; Schmitz). Similarly, feederprices largely influence the decisions of beef operators purchasing feeder cattle forbackgrounding or finishing programs (Anderson and Trapp; Shonkwiler and Hinckley).With feeder cattle prices playing crucial roles in production and marketing decisions,factors determining expected levels of these prices are critical information.
The purpose of this article is to develop a derived demand and primary supply modelof the U.S. feeder cattle sector and econometrically estimate the equilibrium U.S. feedercattle price. Three new aspects are emphasized here: (a) quantifying domestic informa-tion excluded from previous research, (b) evaluating the effects of Mexican feeder cattleimport shares, and (c) assessing the effects of cow-calf and feedlot technologies. Cow-calftechnology in the current analysis refers mainly to genetics and health and nutritionfactors affecting weaning weights and calving percentages. Feedlot technology primarilyreflects management practices, health and nutrition, mechanization, etc. influencingefficiency of weight gains in cattle finishing.
Structural modeling in the beef sector typically has focused on retail, slaughter, andmarketing margin levels (Arzac and Wilkinson; Azzam and Anderson; Brester and
John M. Marsh is professor, Department of Agricultural Economics and Economics, Montana State University, Bozeman. Thiswork was supported by the Montana Agricultural Experiment Station (Journal Series No. 2001-45). The author gratefullyacknowledges the helpful comments of two anonymous reviewers.
Review coordinated by Russell Tronstad.
Journal ofAgricultural and Resource Economics
Wohlgenant; Dunn and Heien; Eales; Freebairn and Rausser; Holloway; Koontz andGarcia; Marsh 1988; Moschini and Meilke; Wohlgenant). Several studies have modeledthe feeder cattle sector (Anderson and Trapp; Brester and Marsh 1983; Buccola; Shonk-wiler and Hinckley), but, with the exception of Anderson and Trapp, previous work is
dated. In addition, analyses examining demand and supply behavior have often beenlimited to factors in the slaughter cattle and feed grain markets, ignoring other marketinfluences.
Normally, feeder cattle prices respond to changes in slaughter cattle prices and feed
costs (Anderson and Trapp; Buccola; Shonkwiler and Hinckley). However, it is hypothe-sized that decision making related to firm behavior in producing and adding value to
feeder cattle behooves the assessment of other factors which affect feeder prices. Vari-
ables excluded from previous econometric work but included in this model are finance
costs, profit risk, cow-calf and feedlot technologies, and U.S. imports of feeder cattle.Their importance reflects changing price discovery and marketing programs, breeding
and nutrition programs, cattle finishing capacity, and production and marketingefficiencies. Results of this empirical study provide important information to cow-calfproducers, backgrounders, and cattle finishers whose purchase or sale decisions dependon future expectations of feeder calf and yearling prices.
Background Information
Although factors in the fed cattle market and feed grain market normally play importantroles in determining feeder cattle demand and prices, other economic factors warrantattention. Because of the finance requirements of feeder cattle production, retained own-ership, and cattle finishing (Duncan et al.), the opportunity cost of capital is likely to beimportant in affecting feeder prices. Ignoring interest costs in models of feeder demand(price) could result in specification errors due to their cost importance and market
volatility. For example, in 1998, interest cost in Great Plains custom finishing averaged
about 17% of total cost of gain [U.S. Department of Agriculture (USDA), LDP report],and from 1970-1998, the standard deviation of the prime interest rate was about 33%
of its mean value (Congress of the U.S., Council of Economic Advisors).Profitability risk in cattle feeding has also largely been ignored in models of feeder
prices. However, risk factors in beef margin analyses have been addressed (Holt; Schroe-
ter and Azzam). Profitability risk in cattle finishing, which affects feeder prices, can be
managed through futures hedging of feed grains and fed cattle, yet basis volatility is
significant [Livestock Marketing Information Center (LMIC)]. Production risks related
to weight gain and the inherent seasonality of fed cattle prices can also make hedgingfed cattle difficult. Consequently, profitability risk in cattle finishing persists. From
1970 to 1998, the standard deviation of the ratio of fed steer price to corn price (proxy
for feedlot profitability) was about 24% of its mean value.Technological changes in the beef sector, often associated with meat packing and
retailing (Nelson and Hahn), have also occurred in feeder cattle production and cattlefinishing. Feeder production technology has principally been concerned with breedinggenetics and management of health and nutrition which have increased calving ratesand calfweaning weights; finishing technology has involved scale economies and feeding
efficiency which have reduced capital costs per head and cost per pound of gain (Boggsand Merkel; Duncan et al.; Kuchler and McClelland). One measure of cow-calftechnology
464 December 2001
Equilibrium Feeder Cattle Prices 465
would be beef cow productivity, or U.S. steer and heifer carcass pounds produced percow, adjusted for live cattle imports (Marsh 1999). Similarly, one measure offeedlot tech-nology would be growth in large capacity feedlots, often associated with technologicalchange in finishing (Kuchler and McClelland).'
In recent years, U.S. imports of live cattle have been controversial, particularly fedcattle imports from Canada (Brester and Marsh 1999). Likewise, U.S. imports of feedercattle from Mexico have concerned producers (Peel), particularly in the 1992-1995period with record levels of Mexican imports and declining real prices. Feeder cattleimports are largely a function of size of Mexican cattle inventories, weather in Mexico,U.S. cattle prices, and excess capacity in U.S. cattle finishing (Peel). USDA data showfeeder cattle imports from Mexico have increased substantially, i.e., from 196.1 thousandhead in 1975 to a peak of nearly 1.7 million head in 1995 (USDA 2001). Imports ofCanadian feeder cattle are relatively small, but there is also a lack of consistent datafor this cattle class. Import market share, defined as Mexican feeder cattle imports asa percentage of total U.S. feeder supplies, permits evaluating the foreign influence onU.S. feeder price.
Model Framework
Estimating price behavior in the U.S. feeder cattle sector requires developing the struc-ture of derived demand and primary supply. For expediency, inverse demand and supplyfunctions are specified in order to derive the arguments of equilibrium feeder price.Inverse structural demand and supply is commonly used in agricultural commoditymodels, particularly if production quantities are considered predetermined and marketprices are endogenous (Dunn and Heien; Eales; Huang). In the current model, marketparticipants in the feeder sector include producers of feeder cattle (the suppliers, or cow-calf and yearling operators) and cattle finishers (the demanders, or operators finishingsteers and heifersnd on grain concentrate rations). Competitive markets are a assumed; i.e.,individual cow-calfproducers face perfectly elastic demands and individual cattle finish-ers face perfectly elastic supplies.
The following equations describe the theoretical structure of the feeder cattle sector:
(1) Pf = pf(Qi, Psd P I, R Tf) (inverse demand),
(2) P = fQ, Ph I, 7) (inverse supply),
(3) Qf - Qf - Qf (market clearing),
(4) P4 Pa f Pf (market clearing).
The dependent variables, Pf and Pf, are respective demand and supply prices of med-ium No. 1 feeder steers, 750-800 pounds, Oklahoma City (dollars/cwt); Qf and Qf are
1 An ideal measure of cow-calf productivity would be calf weaning weights. However, consistent time-series data on anaggregate basis are not published. Consequently, the calculation of output per breeding cow (employed in this study) usessteer and heifer dressed weights which reflect breeding genetics. Likewise, an ideal measure of finishing technology wouldbe feeding efficiency such as pounds of grain to yield one pound of weight gain, but these time-series data are also lacking.Therefore, growth in large feedlots is assumed to proxy increased finishing technology due to factors such as scale economies,feed processing, and nutrition management.
Marsh
Journal ofAgricultural and Resource Economics
respective total quantities demanded and supplied of U.S. feeder cattle-with total
consisting of one-year lagged U.S. calf crop and current imports of Mexican feeder cattle(million head); P, is price of Choice 2-4, 1,100-1,300 pounds, U.S. slaughter steers,
Nebraska direct (dollars/cwt); P, is price of No. 2 yellow corn, Central Illinois (dollars/
bushel); Ph is U.S. average price of mixed grass and alfalfa hay (dollars/ton); I is U.S.
prime interest rate (percent); R is feedlot profitability risk, given as a two-year moving
average of the ratio of U.S. slaughter steer price to U.S. corn price (sum of the ratioslagged one and two periods divided by 2.0); Tf is technology in cattle finishing, proxiedby total fed cattle marketed from large feedlots with more than 32,000 head divided bythe number of these feedlots (in the 13 states of AZ, CA, CO, ID, IL, IA, KS, MN, NE,
OK, SD, TX, and WA); and T, is technology at the cow-calf production level, proxied by
U.S. beef cow productivity.Productivity is defined as: [(Steer Slaughter x Average Dressed Weight of Steers +
Heifer Slaughter x Average Dressed Weight of Heifers) - (Canadian Fed Cattle Imports
x Average Dressed Weight of Steers + Mexican Feeder Cattle Imports-x-Average Dressed
Weight of Heifers)] - (U.S. Beef Cow Inventories x 0.95).2 The multiplication factor of
0.95 is used since it is assumed 95% of January 1 beef cow inventories will calve. BecauseUSDA estimates of commercial steer and heifer slaughter include cattle imports, esti-mated imports (carcass weight) from Canada and Mexico are necessarily subtracted toyield steer and heifer carcass pounds produced from the U.S. breeding herd. Light feeders
are imported from Mexico, and value added primarily occurs in U.S. feedlots.Equation (1) represents the input demand price for feeder cattle in the 700-800 pound
weight range by domestic cattle finishers. Demand price depends on feeder quantitiesdemanded (Qf), output price (P5), input costs (Pa, I), profitability risk (R), and feedlottechnology (Tf). Feeder quantities demanded are aggregated for domestic feeders andimported feeders. It is assumed that changes in import quantities of Mexican feederswill affect U.S. feeder price no differently than changes in quantities of U.S.-bornfeeders. Feeder cattle imports as a percentage of total U.S. feeder supplies are used toevaluate the foreign impact on price.3 The expected impact of Qf on feeder price is neg-ative. Output price of slaughter steers (Ps) is expected to positively affect feeder price,as higher slaughter prices increase feedlot profitability and the demand for feeders.Similarly, the input costs of corn (feed price) and capital (interest rate) are expected to
negatively affect feeder price, as higher corn prices or interest rates decrease feedlotprofitability and feeder cattle demand.
Profit risk (R), defined as a two-year moving average, represents volatility in cattlefinishing profits (Marsh 1999). Moving-average variables are often used to measure the
effects of risk in regression analysis (Brester and Musick; Hooper and Kohlhagen).
2 Although feeder imports from Mexico are primarily light steers, average dressed weights of heifers (rather than steers)were used in calculating total carcass weight of finished Mexican cattle. Genetics, lighter placement weights, and about 25%of imports being spayed heifers may indicate average dressed weights of finished Mexican feeders are close to the U.S. heiferaverage, although arguments may support it either way.
3 It might be argued that Mexican feeder imports are not identical quality as U.S.-born and raised feeders. However,quality of the U.S. calf crop, the major component of Qf, is also heterogeneous. Therefore, the addition of Mexican feedersto U.S. feeder cattle inventories (which is a small percentage) is not expected to change the quality distribution of Qf.Based on this assumption, feeder cattle imports are not specified as a separate regressor in equation (5). In this structuralmodel, import shares are assumed to be predetermined-i.e., causes of changes in U.S. feeder imports are not quantified;the model requires only that exogenous changes have occurred and that import shares imply a feeder quantity impacton price.
466 December 2001
Equilibrium Feeder Cattle Prices 467
Assuming cattle finishers are risk averse, an increase in profitability risk is expected
to shift derived feeder demand to the left, hence reducing feeder price. Finishing technol-
ogy (Tf), represented by growth in marketings per large feedlot (>32,000 head), proxies
unit cost changes that would shift derived demand for feeders. Under competitive
conditions, an increase in productivity due to technology would increase feeder price as
cost savings are passed on to feeder producers.Equation (2), or inverse supply, represents the U.S. supply price of feeder cattle. Sup-
ply price (Pj) depends on quantity of feeder cattle supplied (Q), input costs of interest
(I) and hay (Ph), and ranch-level technology (T,). 4 Hay prices in many areas of the U.S.
are relevant costs in maintaining beef cow herds and retaining ownership of calves
(Rucker, Burt, and LaFrance). Hay prices may also reflect weather and forage range
conditions. For example, increase ad hay costs would be commensurate with poor pasture
and forage conditions caused by inadequate rainfall, which, with lagged adjustments,
could affect feeder supplies. Interest rate or the cost of capital could affect expansion or
contraction of cow herds, and hence quantities of feeders produced. From a production
standpoint, increases in the input prices of capital and hay would shift the supply curve
of feeder cattle to the left. Technology at the cow-calf level, which increases weaning
weights and reduces unit costs, would theoretically shift the supply curve of feeders to
the right, decreasing feeder price.
Empirical Model and Estimation
Structural demand and supply equations (1) and (2) and market-clearing price and
quantity equations (3) and (4) are used to solve for equilibrium feeder prices. Because
of production lags caused by biological growth, feeder supplies are assumed predeter-
mined. Substituting equilibrium quantity and price variables, Qf and Pf, from respective
equations (3) and (4) into equations (1) and (2) and solving, gives:
(5) Pf = g(Qf,P, P,, PPh I, R , T,, i).
Equation (5) describes the demand-supply arguments expected to determine the behavior
of equilibrium feeder cattle prices. A stochastic error term (p) with assumed classical
properties is appended. The equation appears as a reduced form, with the expected mar-
ginal impact of each variable consistent with its described structural impact. Because
interest rate appears in both the demand and supply equations, the sign of its net effectis indeterminate.
Although feeder cattle supplies are assumed predetermined, joint dependency was
tested in equation (5) due to specifying slaughter steer price as a regressor. Shifts in the
dependent variable of feeder steer price (an input cost in cattle finishing) could be trans-
mitted to the cattle finisher's output price. A Hausman specification test for slaughter
4 One reviewer raised a valid point concerning feeder cattle supplies. Conceptually they should be represented by USDAestimates of feeder cattle supplies (outside feedlots) rather than lagged calf crop because the latter may fail to account forstocker industry impacts of timing of feeder cattle supplies and breeding heifer retention. However, the USDA only publishesthese feeder supply data back to 1979, and analysts indicate these estimates are suspect due to classification changes overtime. Additionally, the estimates provide no information about the market share of Mexican feeder imports. Consequently,lagged calf crop and Mexican imports are used in this study to represent potential feeder cattle supplies that could enterfeedlots within the year. This variable could overstate the feeder supply impacts in the empirical price model.
Marsh
Journal ofAgricultural and Resource Economics
price was confirming since the null hypothesis of no simultaneous equation bias wasrejected at the a = .05 significance level.5
Other tests were conducted on the model. In summary, they include the following:(a) the Jarque-Bera test failed to reject the null hypothesis of normally distributedresiduals, (b) White's test failed to reject the null hypothesis of homoskedastic errors,(c) the Durbin-Watson test indicated a negative AR(1) error structure, and (d) resultsof the Ramsey RESET test failed to reject the null hypothesis of a correctly specifiedequation. Using EViews 3.1 software, iterative two-stage least squares (2SLS) with anAR(1) error correction was the estimator employed.6 The model variables are assumedto enter equation (5) multiplicatively; therefore, double-log transformations are used inthe estimation.
Dynamics
The underlying demand and supply structure of equation (5) may be dynamic, character-ized by distributed lags. The dynamics are based on expectations of buyers and sellersas well as biological and technological factors that produce lag adjustments in cattledemand and supply prices (Marsh 1988; Rucker, Burt, and LaFrance). In pre-test esti-mation, the equation was specified with contemporaneous and first-order lags of theright-hand-side variables (except profitability risk), a first-order lag on the dependentvariable, and an AR(1) error term. This structure approximated a Koyck or geometricdistributed lag model (Pindyck and Rubinfeld). Based on a significance level of a = .10,the Koyck term was omitted but the t - 1 lags were retained for cow-calf technology, hayprice, and interest rate. Period t was omitted for these variables. Period t was retainedfor corn price, slaughter price, feeder quantities, and feedlot technology, while the t -1lags were omitted. This parsimonious lag structure constituted the empirical model tobe estimated.
Data
Annual data from 1970 through 1999 are used to estimate the model. All price variablesand the interest rate are expressed in real terms, deflated by the Producer Price Index(PPI, 1982 = 100). Price variables (feeder, slaughter, and corn), U.S. calf crop, Mexicanfeeder imports, and variables used in constructing beef cow productivity were obtainedfrom the USDA's Red Meats Yearbook (on disc), the USDA's Livestock, Dairy, and PoultrySituation and Outlook (LDP) reports, and the Livestock Marketing Information Center(LMIC). Data on feedlot marketings and number of feedlots (13 states, > 32,000 head)were also obtained from the LMIC. Hay price was taken from the USDA's Agricultural
5 For confirmation of its exogeneity, the Hausman specification test was applied to U.S. feeder cattle supplies (Qf) becauseof the feeder import component. The result was failure to reject the null hypothesis of no simultaneity at the a = .05 level ofsignificance. All equation variables were also tested for nonstationarity by the augmented Dickey-Fuller (ADF) unit root test.The null hypothesis of unit roots could not be rejected for any variable. The ADF test of the equation residuals found a cointe-grated relationship; however, DeJong et al. argue these tests have low power in small samples. Furthermore, Johnston andDiNardo (p. 317) demonstrate that if a model contains simultaneous relationships, nonstationarity and cointegration are notof concern and traditional simultaneous estimation methods are appropriate. As a result, equation (5) is estimated in data-level form.
6 The instruments used for 2SLS were the exogenous variables of the equation plus external variables of real beef by-product value, wholesale quantities of pork and poultry, real labor costs in food processing, and real consumer expenditures.
468 December 2001
Equilibrium Feeder Cattle Prices 469
Statistics. The PPI and prime interest rate were derived from the Economic Report of
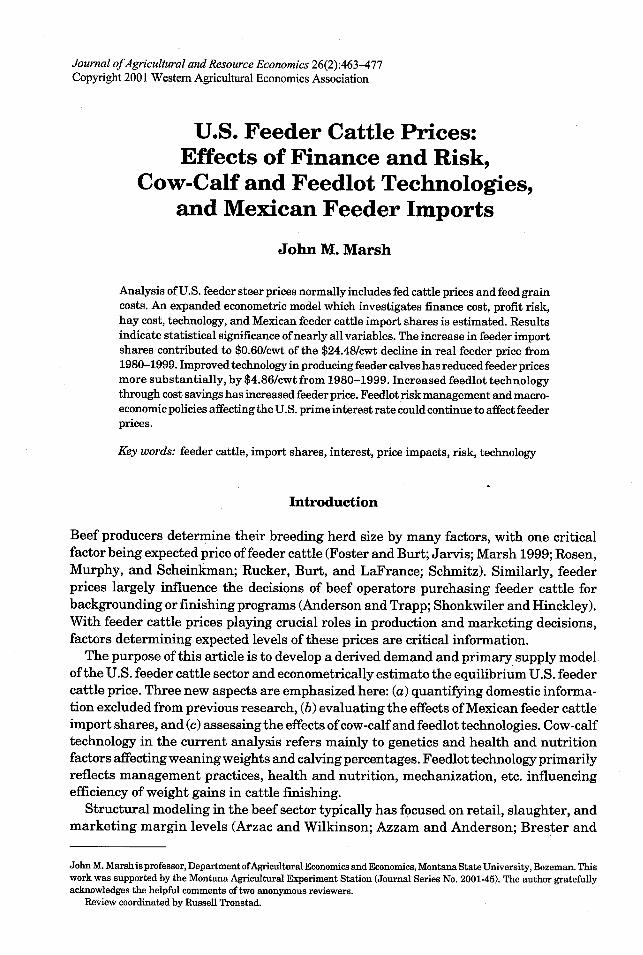
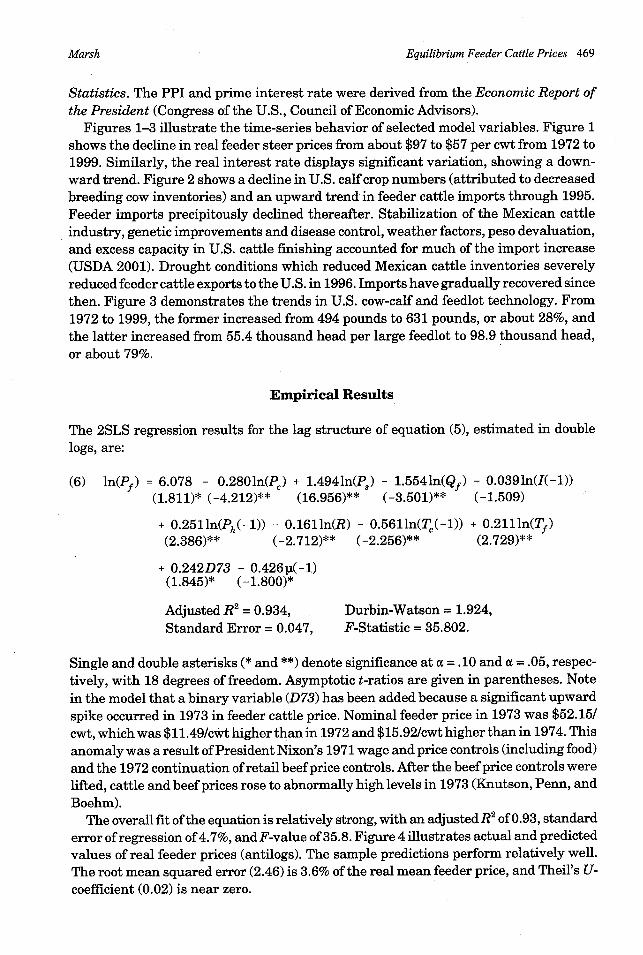
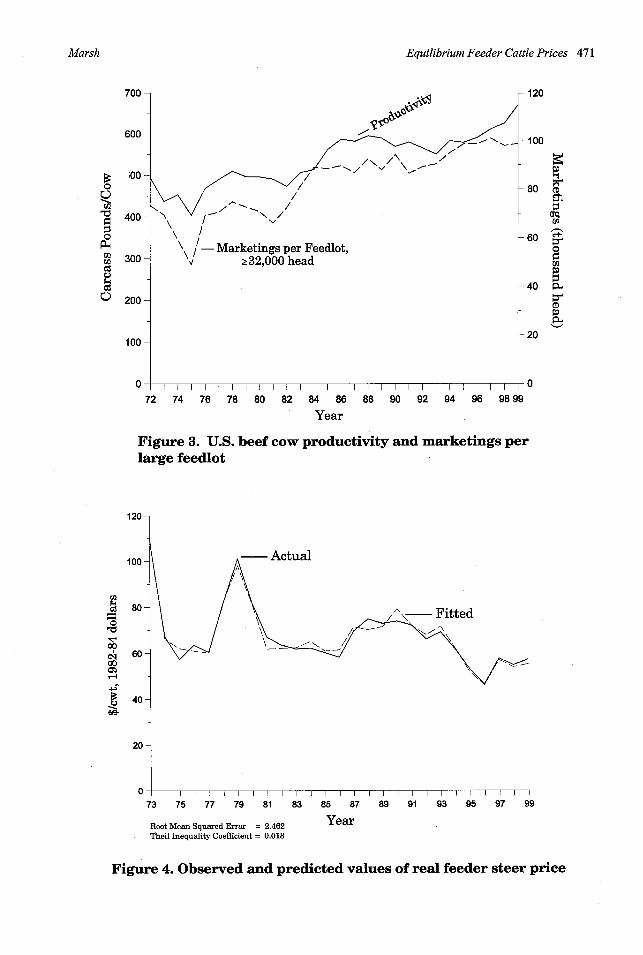
the President (Congress of the U.S., Council of Economic Advisors).Figures 1-3 illustrate the time-series behavior of selected model variables. Figure 1
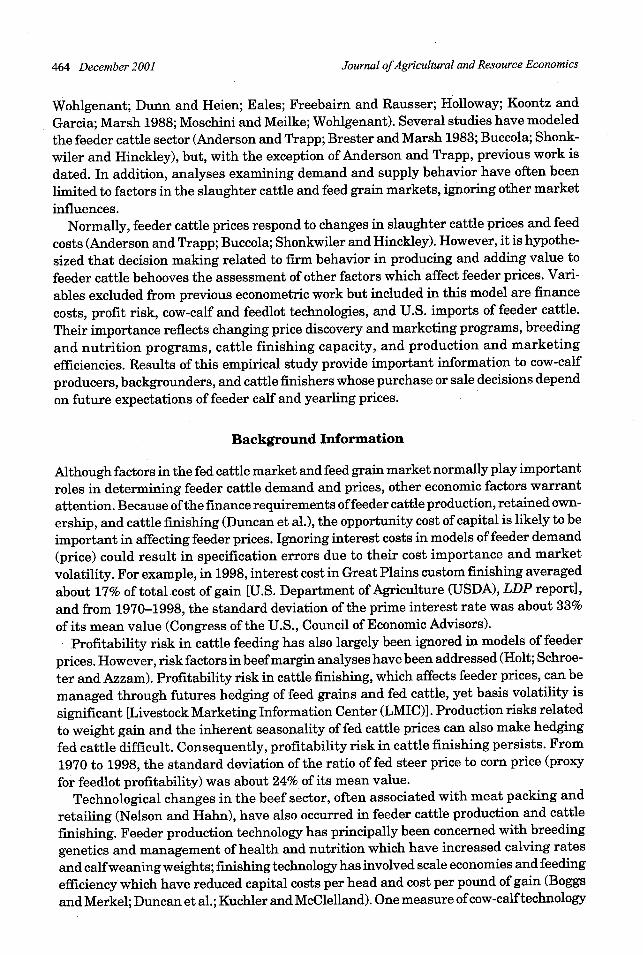
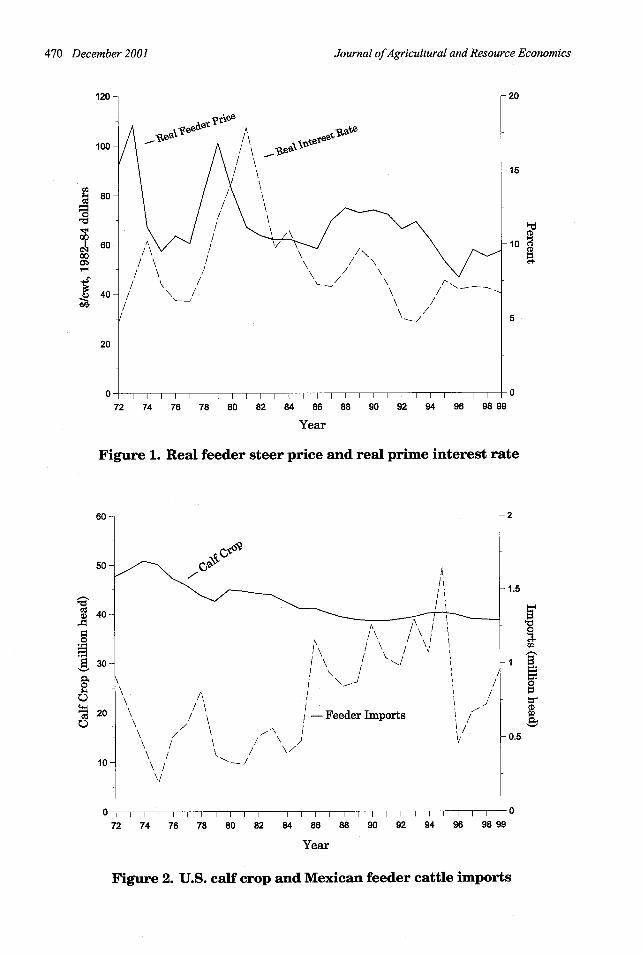
shows the decline in real feeder steer prices from about $97 to $57 per cwt from 1972 to1999. Similarly, the real interest rate displays significant variation, showing a down-ward trend. Figure 2 shows a decline in U.S. calf crop numbers (attributed to decreasedbreeding cow inventories) and an upward trend in feeder cattle imports through 1995.
Feeder imports precipitously declined thereafter. Stabilization of the Mexican cattleindustry, genetic improvements and disease control, weather factors, peso devaluation,and excess capacity in U.S. cattle finishing accounted for much of the import increase
(USDA 2001). Drought conditions which reduced Mexican cattle inventories severely
reduced feeder cattle exports to the U.S. in 1996. Imports have gradually recovered since
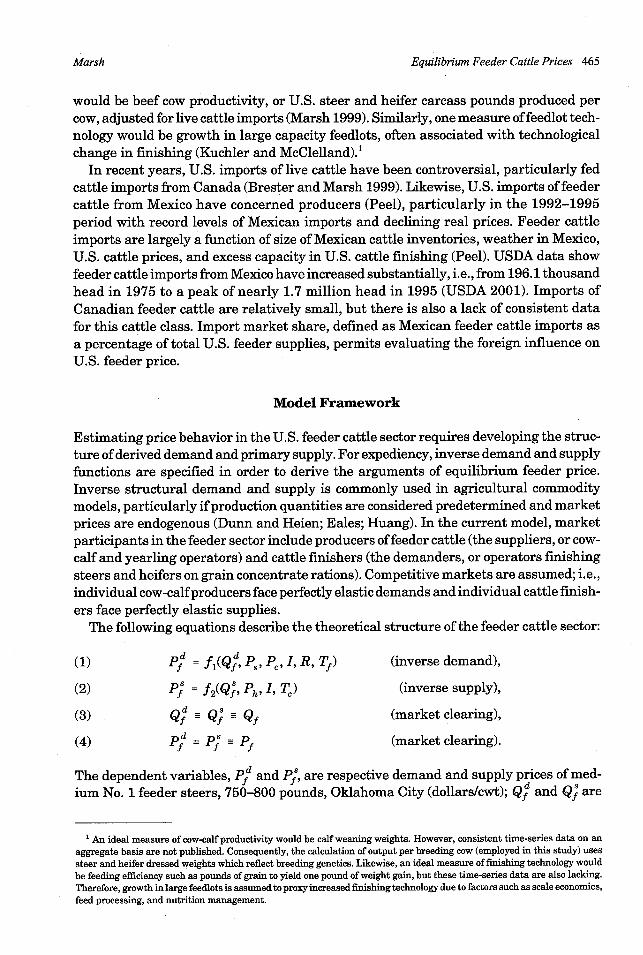
then. Figure 3 demonstrates the trends in U.S. cow-calf and feedlot technology. From1972 to 1999, the former increased from 494 pounds to 631 pounds, or about 28%, and
the latter increased from 55.4 thousand head per large feedlot to 98.9 thousand head,
or about 79%.
Empirical Results
The 2SLS regression results for the lag structure of equation (5), estimated in double
logs, are:
(6) ln(Pf) = 6.078 - 0.2801n(P,) + 1.4941n(P,) - 1.5541n(Qf) - 0.0391n(I(-1))(1.811)* (-4.212)** (16.956)** (-3.501)** (-1.509)
+ 0.2511n(Ph(-1)) - 0.1611n(R) - 0.5611n(T,(-1)) + 0.2111n(Tf)(2.386)** (-2.712)** (-2.256)** (2.729)**
+ 0.242D73 - 0.426i(-1)(1.845)* (-1.800)*
Adjusted R2 = 0.934, Durbin-Watson = 1.924,
Standard Error = 0.047, F-Statistic = 35.802.
Single and double asterisks (* and **) denote significance at a = .10 and a = .05, respec-tively, with 18 degrees of freedom. Asymptotic t-ratios are given in parentheses. Note
in the model that a binary variable (D73) has been added because a significant upwardspike occurred in 1973 in feeder cattle price. Nominal feeder price in 1973 was $52.15/cwt, which was $11.49/cwt higher than in 1972 and $15.92/cwt higher than in 1974. Thisanomaly was a result of President Nixon's 1971 wage and price controls (including food)and the 1972 continuation of retail beef price controls. After the beef price controls were
lifted, cattle and beef prices rose to abnormally high levels in 1973 (Knutson, Penn, and
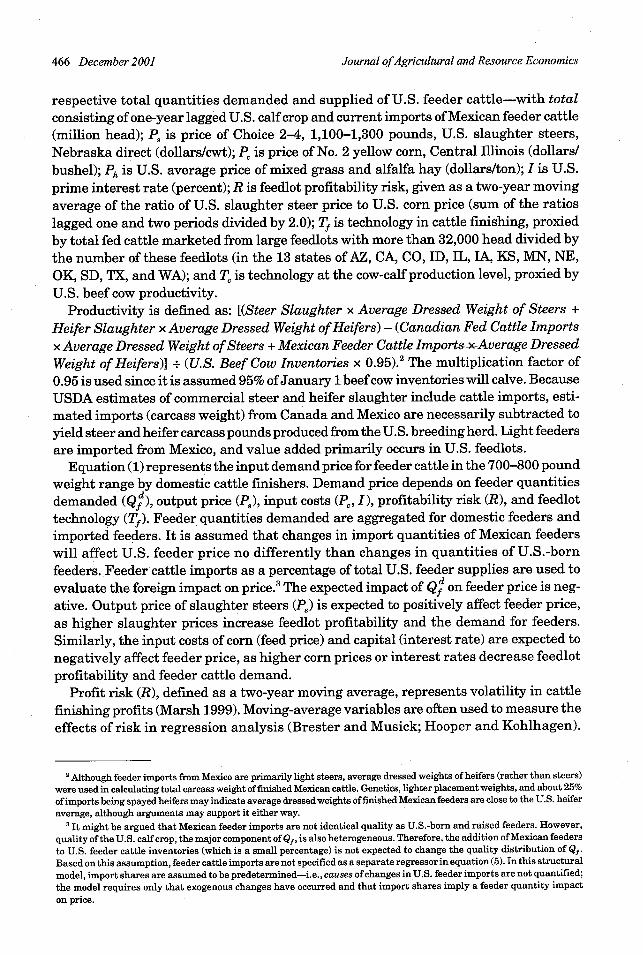
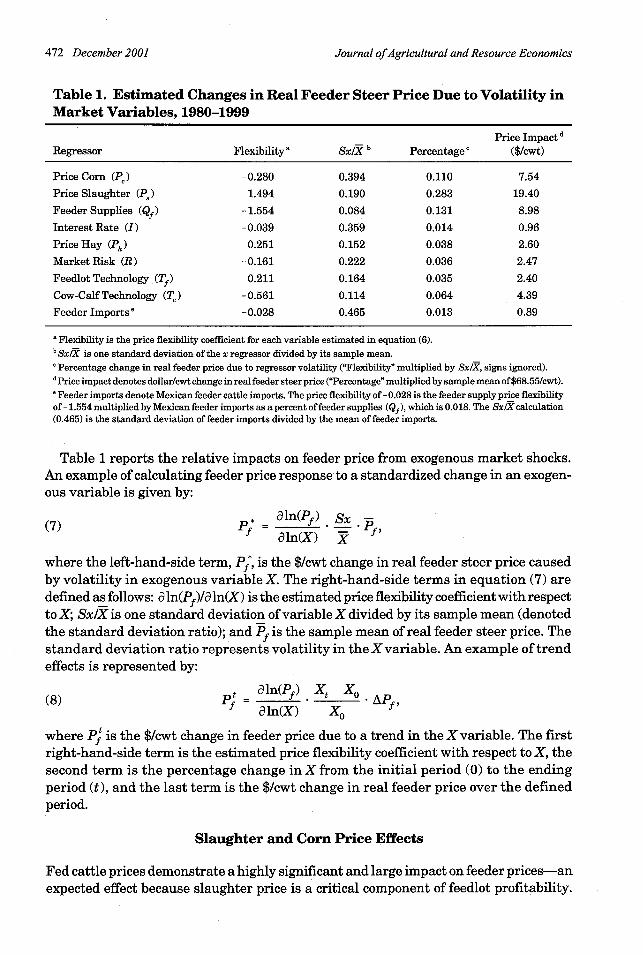
Boehm).The overall fit of the equation is relatively strong, with an adjustedR2 of 0.93, standard
error of regression of 4.7%, and F-value of 35.8. Figure 4 illustrates actual and predictedvalues of real feeder prices (antilogs). The sample predictions perform relatively well.
The root mean squared error (2.46) is 3.6% of the real mean feeder price, and Theil's U-coefficient (0.02) is near zero.
Marsh
Journal ofAgricultural and Resource Economics
ICD
(o
72 74 76 78 80 82 '84 86 88 90 92 94 96 98 99
Year
Figure 1. Real feeder steer price and real prime interest rate
\ I/
\ I\ /V
I II /-}" '
/ '\ /, " /
~\ / '// \ /'~~~~~~~~~I \I
// \ / -- FeederImports (
\ \ / 2/ \ / \ ) I/
/ \/' I
I I I I I I I II I I I I I I I I I I I I I I I I
-2
-1.5
-1
o0
0X0-
-0.5
72 74 76 78 80 82 84 86 88 90 92 94 96 98 99
Year
Figure 2. U.S. calf crop and Mexican feeder cattle imports
1
1
Ca,
0Cd
rld
00
IIcxq00
r-l
-4.1
1U -
50-
a 40-40
o 30-
oV
20-
0
10-
n -rE I i- nI
470 December 2001
,,
I - FI I I I .
Equilibrium Feeder Cattle Prices 471
lf.fA
,-0
O
0
wC.
I
F
,1ZU
100
cd 800o
00c 6000
3 40
20
20
0
CDCI)
0
Ci)
wPD
72 74 76 78 80 82 84 86 88 90 92 94 96 98 99
Year
'igure 3. U.S. beef cow productivity and marketings perarge feedlot
Actual
_ /`\ Fitted
73 75 77 79 81 83 85 87 89 91 93 95 97 99
YearRoot Mean Squared Error = 2.462 YearTheil Inequality Coefficient = 0.018
Figure 4. Observed and predicted values of real feeder steer price
Marsh
J--'A
Journal ofAgricultural and Resource Economics
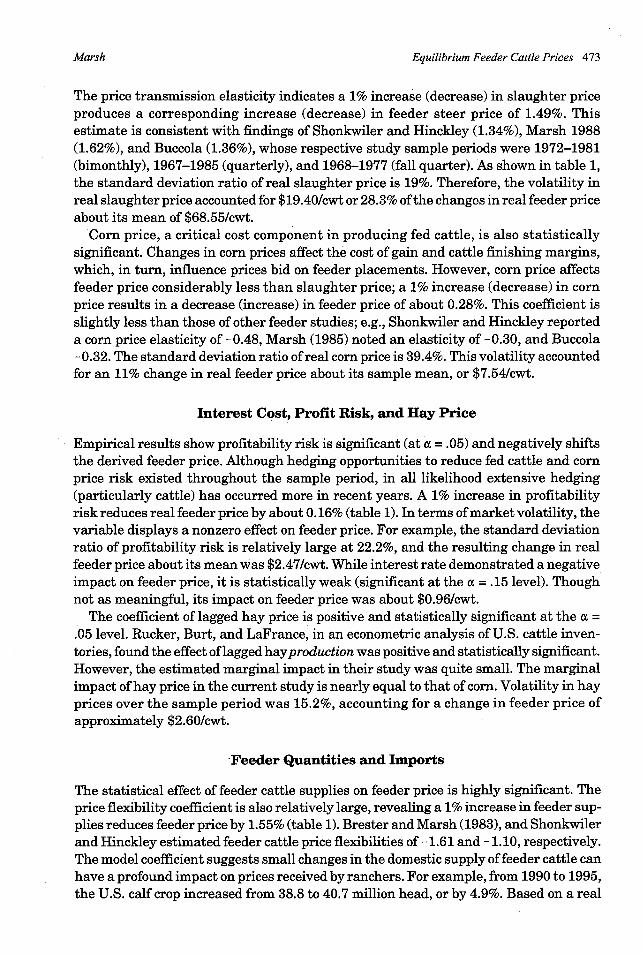
Table 1. Estimated Changes in Real Feeder Steer Price Due to Volatility inMarket Variables, 1980-1999
Price Impact dRegressor Flexibility Sx/X b Percentage ($/cwt)
Price Corn (PC) -0.280 0.394 0.110 7.54
Price Slaughter (P,) 1.494 0.190 0.283 19.40
Feeder Supplies (Qf) -1.554 0.084 0.131 8.98
Interest Rate (I) -0.039 0.359 0.014 0.96
Price Hay (Ph) 0.251 0.152 0.038 2.60
Market Risk (R) -0.161 0.222 0.036 2.47
Feedlot Technology (Tf) 0.211 0.164 0.035 2.40
Cow-Calf Technology (T7) -0.561 0.114 0.064 4.39
Feeder Imports -0.028 0.465 0.013 0.89
a Flexibility is the price flexibility coefficient for each variable estimated in equation (6).bSx/X is one standard deviation of the x regressor divided by its sample mean.' Percentage change in real feeder price due to regressor volatility ("Flexibility" multiplied by Sx/X, signs ignored).d Price impact denotes dollar/cwt change in real feeder steer price ("Percentage" multiplied by sample mean of $68.55/cwt).Feeder imports denote Mexican feeder cattle imports. The price flexibility of -0.028 is the feeder supply price flexibility
of -1.554 multiplied by Mexican feeder imports as a percent of feeder supplies (Qf ), which is 0.018. The Sx/X calculation(0.465) is the standard deviation of feeder imports divided by the mean of feeder imports.
Table 1 reports the relative impacts on feeder price from exogenous market shocks.An example of calculating feeder price response to a standardized change in an exogen-ous variable is given by:
( aln(Pf) Sx(7) p.
aln(X) x
where the left-hand-side term, Pf, is the $/cwt change in real feeder steer price causedby volatility in exogenous variable X. The right-hand-side terms in equation (7) aredefined as follows: a ln(Pf)/3 ln(X) is the estimated price flexibility coefficient with respectto X; Sx/X is one standard deviation of variable X divided by its sample mean (denotedthe standard deviation ratio); and Pf is the sample mean of real feeder steer price. Thestandard deviation ratio represents volatility in the X variable. An example of trendeffects is represented by:
(8) At = 8ln(Pf) X t -X Apf(8) p; . . ^ . ,f aln(X) X 0
where P] is the $/cwt change in feeder price due to a trend in the X variable. The firstright-hand-side term is the estimated price flexibility coefficient with respect to X, thesecond term is the percentage change in X from the initial period (0) to the endingperiod (t), and the last term is the $/cwt change in real feeder price over the definedperiod.
Slaughter and Corn Price Effects
Fed cattle prices demonstrate a highly significant and large impact on feeder prices-anexpected effect because slaughter price is a critical component of feedlot profitability.
472 December 2001
Equilibrium Feeder Cattle Prices 473
The price transmission elasticity indicates a 1% increase (decrease) in slaughter priceproduces a corresponding increase (decrease) in feeder steer price of 1.49%. Thisestimate is consistent with findings of Shonkwiler and Hinckley (1.34%), Marsh 1988(1.62%), and Buccola (1.36%), whose respective study sample periods were 1972-1981(bimonthly), 1967-1985 (quarterly), and 1968-1977 (fall quarter). As shown in table 1,the standard deviation ratio of real slaughter price is 19%. Therefore, the volatility inreal slaughter price accounted for $19.40/cwt or 28.3% of the changes in real feeder priceabout its mean of $68.55/cwt.
Corn price, a critical cost component in producing fed cattle, is also statisticallysignificant. Changes in corn prices affect the cost of gain and cattle finishing margins,which, in turn, influence prices bid on feeder placements. However, corn price affectsfeeder price considerably less than slaughter price; a 1% increase (decrease) in cornprice results in a decrease (increase) in feeder price of about 0.28%. This coefficient isslightly less than those of other feeder studies; e.g., Shonkwiler and Hinckley reporteda corn price elasticity of -0.48, Marsh (1985) noted an elasticity of -0.30, and Buccola-0.32. The standard deviation ratio of real corn price is 39.4%. This volatility accountedfor an 11% change in real feeder price about its sample mean, or $7.54/cwt.
Interest Cost, Profit Risk, and Hay Price
Empirical results show profitability risk is significant (at a = .05) and negatively shiftsthe derived feeder price. Although hedging opportunities to reduce fed cattle and cornprice risk existed throughout the sample period, in all likelihood extensive hedging(particularly cattle) has occurred more in recent years. A 1% increase in profitabilityrisk reduces real feeder price by about 0.16% (table 1). In terms of market volatility, thevariable displays a nonzero effect on feeder price. For example, the standard deviationratio of profitability risk is relatively large at 22.2%, and the resulting change in realfeeder price about its mean was $2.47/cwt. While interest rate demonstrated a negativeimpact on feeder price, it is statistically weak (significant at the a = .15 level). Thoughnot as meaningful, its impact on feeder price was about $0.96/cwt.
The coefficient of lagged hay price is positive and statistically significant at the a =.05 level. Rucker, Burt, and LaFrance, in an econometric analysis of U.S. cattle inven-tories, found the effect of lagged hayproduction was positive and statistically significant.However, the estimated marginal impact in their study was quite small. The marginalimpact of hay price in the current study is nearly equal to that of corn. Volatility in hayprices over the sample period was 15.2%, accounting for a change in feeder price ofapproximately $2.60/cwt.
-Feeder Quantities and Imports
The statistical effect of feeder cattle supplies on feeder price is highly significant. Theprice flexibility coefficient is also relatively large, revealing a 1% increase in feeder sup-plies reduces feeder price by 1.55% (table 1). Brester and Marsh (1983), and Shonkwilerand Hinckley estimated feeder cattle price flexibilities of - 1.61 and - 1.10, respectively.The model coefficient suggests small changes in the domestic supply of feeder cattle canhave a profound impact on prices received by ranchers. For example, from 1990 to 1995,the U.S. calf crop increased from 38.8 to 40.7 million head, or by 4.9%. Based on a real
Marsh
Journal ofAgricultural and Resource Economics
mean feeder price of $66.19/cwt for this period, the increase in the U.S. calf crop meanta $4.95/cwt drop in the real feeder price. The volatility or standard deviation ratio offeeder supplies was 8.4%, which resulted in a relatively large change in feeder price of$8.98/cwt.
Concerns about the effects of Canadian slaughter cattle imports on U.S. fed cattleprices are paralleled by concerns about the impact of Mexican feeder cattle imports onU.S. feeder cattle prices. Although U.S. feeder cattle imports have substantially increased,they remain a small percentage of total feeder cattle supplies. From 1975 to 1995, feeder
cattle imports increased from 196.1 thousand head to 1.65 million head, or from 0.38%
to 3.96% of U.S. feeder cattle supplies. Declines in feeder imports have occurred since
1995. For the sample period, U.S. feeder imports as a percentage of total feeder supplies
averaged 1.8%, but were higher at 2% for the 1980-1999 period.One approach to evaluating the effect of feeder cattle imports on U.S. feeder price
would be to hypothetically eliminate the average level of imports. To illustrate, considerapplying the model results to the 2% import share during the 1980-1999 period. Assum-ing domestic feeder supplies are unchanged, a zero Mexican import share (hence, lesstotal feeder supplies) indicates real feeder price would have averaged $2/cwt higherduring this period (based on $64.37/cwt real mean price).
Another approach would be to consider a change in market share. For example, from1980 to 1999, the feeder import share increased by 1.6% and real feeder price declined
by $24.48/cwt. This approach implies the increased import share contributed to about
$0.60/cwt, or 2.5% of the real feeder price decline. Volatility in feeder cattle imports was
relatively large (46.5%), which resulted in the feeder import share causing real feeder
price to change by approximately $0.89/cwt about its mean. Work by Cockerham, basedon 1973-1992 monthly data, showed that increased imports of 400 to 500 pound Mexicanfeeder calves decreased U.S. feeder calf price by an average of $0.38/cwt in 1992 dollars,
with the decrease actually ranging as high as $1.98/cwt based on maximum monthly
imports. Although these results involve different time periods and weight ranges com-
pared to the current annual model, they corroborate findings of nonzero price impacts
of Mexican feeder imports.
Technology
The coefficient of beef cow productivity is negative and statistically significant at thea = .05 level. This technology is primarily rooted in breeding genetics and managementof health and nutrition at the farm level. However, since the productivity measure
involves dressed weights, it also reflects weight gains in feedlots. Consequently, it is
noted that output per beef cow can reflect management beyond the farm level. Tech-nology improvements affecting supplies are expected to decrease market price. Modelresults report a relatively large response from beef cow productivity. A 1% increase
reduces feeder steer price by 0.56% (table 1). In terms of its market volatility, produc-
tivity changes perturbed real feeder price by $4.39/cwt about its mean. From a trend
standpoint, beef cow productivity increased by a substantial 35.5% from 1980 to 1999.
Consequently, its effect on feeder price was not trivial. Of the $24.48/cwt decrease in
real feeder price for this period, $4.86/cwt is attributed to cow-calf technology.The coefficient of finishing technology represented by feedlot size is positive and statis-
tically significant at the a = .05 level. Based on the positive coefficient, a 1% increase in
474 December 2001
Equilibrium Feeder Cattle Prices 475
feedlot size increases feeder price by 0.21%. Thus, on a national basis, cost efficiencies
of large feedlots appear to benefit cow-calf producers. Another aspect of efficiency, notnecessarily captured by feedlot size, may be improved (hotter) feed rations which haveincreased feedlot turnover.
Conclusions
This econometric analysis of equilibrium feeder cattle prices shows that economicfactors beyond slaughter and feed grain prices-interest rate, profit risk, hay cost,and ranch and feedlot technologies-have important impacts on feeder cattle price.
For example, standard deviation ratios indicate these other variables collectivelyaffect real feeder price by $12.82/cwt, which is about 66% of the major effect of
slaughter price. The collective effect of cow-calf and feedlot technologies was about
90% of the volatility effect of corn prices. Based on the model results, reduction of
feeder cattle imports would increase feeder price. For example, if the Mexican feederimport share had been reduced to its minimum value (0.70%) during the 1980-1999
period, U.S. feeder price would have increased by about $0.70/cwt. This estimate does
not account for any domestic supply response. Growth in large feedlots, representing
cost-saving technological change in cattle finishing, has positively affected feeder
prices. The study findings confirm this growth prevented feeder prices from declining
by about $2.04/cwt from 1980-1999.Technological adoption in the cow-calf sector, primarily through breeding genetics,
has substantially increased. Model results disclose that increases in carcass pounds per
beef cow substantially contributed to declines in real feeder prices. These productivityincreases accounted for nearly 20% of the decline in real feeder price from 1980-1999.
Consequently, increases in domestic and export demand for beef products (which affect
slaughter price) are necessary to offset decreases in real feeder price caused by techno-
logical advances that increase beef pounds.Based on model results, fluctuations in the prime interest rate which influence the
cost of capital could affect feeder prices. Although the effect of interest rate on 700-800
pound cattle placed in feedlots was marginal, the impact could be greater on prices of
lighter weight feeders that begin with stocker grazing and end with grain finishing (i.e.,
larger carrying costs). The significance of feedlot profit risk suggests risk management
policies, such as forward pricing mechanisms which reduce the price risk associated
with feed grains and fed cattle, could improve feeder cattle demand and result in price
gains to cow-calf operators.
[Received September 2000; final revision received August 2001.]
References
Anderson, J. D., and J. N. Trapp. "An Analysis of the Effect of Corn Prices on Feeder Cattle Prices." InProceedings of NCR-134 Conference: Applied Commodity Price Analysis, Forecasting, and MarketRisk Management, ed., B. W. Brorsen, pp. 240-54. Dept. ofAgr. Econ., Oklahoma State University,Stillwater, 1997.
Arzac, E. R., and M. Wilkinson. "A Quarterly Econometric Model of United States Livestock and FeedGrain Markets and Some of Its Policy Implications." Amer. J. Agr. Econ. 61(May 1979):297-308.
Marsh
Journal ofAgricultural and Resource Economics
Azzam, A. M., and D. G. Anderson. "Assessing Competition in Meatpacking: Economic History, Theory,and Evidence." Pub. No. GIPSA-RR-96-6, Packers and Stockyards Programs, Grain Inspection,Packers and Stockyards Administration, USDA, Washington DC, May 1996.
Boggs, D. L., and R. A. Merkel. Live Animal Carcass Evaluation and Selection Manual, 3rd ed. DubuqueIA: Kendall/Hunt Publishing Co., 1990.
Brester, G. W., and J. M. Marsh. "A Statistical Model of the Primary and Derived Market Levels in theU.S. Beef Industry." West. J. Agr. Econ. 8(1983):34-49.
. "U.S. Beef and Cattle Imports and Exports: Data Issues and Impacts on Cattle Prices." PolicyIssues Pap. No. 9, Trade Research Center, Montana State University, Bozeman, April 1999.
Brester, G. W., and D. C. Musick. "The Effect of Market Concentration on Lamb Marketing Margins."J. Agr. and Appl. Econ. 27(July 1995):172-83.
Brester, G. W., and M. K. Wohlgenant. "Estimating Interrelated Demands for Meats Using NewMeasures for Ground and Table Cut Beef." Amer. J. Agr. Econ. 73(November 1991):1182-94.
Buccola, S. T. "An Approach to the Analysis of Feeder Cattle Price Differentials." Amer. J. Agr. Econ.62(August 1980):574-80.
Cockerham, L. L. "The Impact of the North American Free Trade Agreement on the U.S. Feeder CattleMarket." Unpub. M.S. thesis, Dept. of Agr. Econ., Oklahoma State University, Stillwater, 1995.
Congress of the U.S., Council of Economic Advisors. Economic Report of the President. Washington DC:Government Printing Office, February 1998.
DeJong, D. N., J. C. Nankervis, N. E. Savin, and C. H. Whiteman. "Integration versus Trend Station-arity in Time Series." Econometrics 60(March 1992):423-34.
Duncan R. M., R. D. Taylor, D. M. Saxowsky, and W. W. Koo. "Economic Feasibility of the CattleFeeding Industry in the Northern Plains and Western Lake States." Agr. Econ. Rep. No. 370, Dept.of Agr. Econ., North Dakota State University, March 1997.
Dunn, J., and D. Heien. "The Demand for Farm Output." West. J. Agr. Econ. 10(July1985):13-22.Eales, J. S. "The Inverse Lewbel Demand System." J. Agr. and Resour. Econ. 19(July 1994):173-82.Foster, K. A., and 0. R. Burt. "A Dynamic Model of Investment in the U.S. Beef-Cattle Industry." J.
Bus. and Econ. Statis. 10(0ctober 1992):419-26.Freebairn, J. W., and G. C. Rausser. "Effects of Changes in the Level of U.S. Beef Imports." Amer. J.
Agr. Econ. 57(November 1975):676-88.Holloway, G. J. "The Farm-Retail Price Spread in an Imperfectly Competitive Food Industry." Amer.
J. Agr. Econ. 73(November 1991):979-89.Holt, M. "Risk Response in the Beef Marketing Channel: A Multivariate Generalized ARCH-M
Approach."Amer. J. Agr. Econ. 75(August 1993):559-71.Hooper, P., and S. W. Kohlhagen. "The Effects of Exchange Rate Risk and Uncertainty on the Prices
and Volume of International Trade." J. Internat. Econ. 8(November 1978):483-511.Huang, K. S. "An Inverse Demand System for U.S. Composite Foods."Amer. J. Agr. Econ. 70(November
1988):902-08.Jarvis, L. S. "Cattle as Capital Goods and Ranchers as Portfolio Managers: An Application to the Argen-
tine Cattle Sector." J. Polit. Econ. 82(May/June 1974):489-520.Johnston, J., and J. DiNardo. Econometric Methods, 4th ed. New York: McGraw-Hill Companies, Inc.,
1997.Knutson, R. D., J. B. Penn, and W. T. Boehm. Agricultural and Feed Policy, 2nd ed. Englewood Cliffs
NJ: Prentice-Hall, 1990.Koontz, S. R., and P. Garcia. "Meat-Packer Conduct in Fed Cattle Pricing: Multiple-Market Oligopsony
Power." J. Agr. and Resour. Econ. 22(July 1997):87-103.Kuchler, F., and J. McClelland. "Issues Raised by New Agricultural Technologies: Livestock Growth
Hormones." Agr. Econ. Rep. No. 608, USDA/Economic Research Service, Washington DC, April1989.
Livestock Marketing Information Center (LMIC). Various annual livestock data. Western State Exten-sion Services in Cooperation with USDA. Lakewood CO, May 1999.
Marsh, J. M. "Monthly Price Premiums and Discounts Between Steer Calves and Yearlings." Amer. J.Agr. Econ. 67(May 1985):307-14.
. "The Effects of the Dairy Termination Program on Live Cattle and Wholesale Beef Prices."Amer. J. Agr. Econ. 70(November 1988):919-28.
476 December 2001
Marsh Equilibrium Feeder Cattle Prices 477
. "The Effects of Breeding Stock Productivity on the U.S. Beef Cattle Cycle."Amer. J. Agr. Econ.81(May 1999):335-46.
Moschini, G., and K D. Meilke. "Modeling the Pattern of Change in U.S. Meat Demand."Amer. J. Agr.Econ. 71(May 1989):253-61.
Nelson, K., and W. Hahn. "Concentration in the U.S. Beef Packing Industry." Livestock, Dairy, andPoultry Situation and Outlook. Pub. No. LDP-M-53, USDA/Economic Research Service, WashingtonDC, 17 August 1998.
Peel, D. S. "U.S. and Mexican Cattle and Beef Trade." Paper presented at Tri-National ResearchSymposium, "NAFTA and Agriculture: Is the Experiment Working?" San Antonio TX, 1-2 November1996.
Pindyck, R. S., and D. L. Rubinfeld. Econometric Models and Economic Forecasts, 4th ed. Boston: Irwin/McGraw-Hill, 1998.
Rosen, S., K. Murphy, and J. Scheinkman. "Cattle Cycles." J. Polit. Econ. 102(June 1994):468-92.Rucker, R. R., 0. R. Burt, and J. T. LaFrance. "An Econometric Model of Cattle Inventories." Amer. J.
Agr. Econ. 66(May 1984):131-44.Schmitz, J. D. "Dynamics of Beef Cow Herd Size: An Inventory Approach."Amer. J. Agr. Econ. 79(May
1997):532-42.Schroeter, J., and A. Azzam. "Marketing Margins, Market Power, and Price Uncertainty."Amer. J. Agr.
Econ. 73(November 1991):990-99.Shonkwiler, J. S., and S. Hinckley. "A Generalized Supply Response/Factor Demand Model and Its
Application to the Feeder Cattle Market." West. J. Agr. Econ. 10(December 1985):245-53.U.S. Department of Agriculture, Economic Research Service. Livestock, Dairy, and Poultry Situation
and Outlook (LDP). USDA/ERS, Washington DC. Various issues, 1980-99.--- .Red Meats Yearbook Statistical Series, 1970-1997. Statis. Bull. No. 921, USDA/ERS, Washing-
ton DC, February 1997. Online at http://usda.mannlib.cornell.edu/data-sets/livestock/94006/.. "Mexican Cattle Exports to U.S.: Current Perspectives." In Agricultural Outlook. USDA/ERS,
Washington DC, June/July 2001.U.S. Department ofAgriculture, National Agricultural Statistics Service. Agricultural Statistics. Wash-
ington DC: Government Printing Office, 1999.Wohlgenant, M. K "Demand for Farm Output in a Complete System of Demand Functions." Amer. J.
Agr. Econ. 71(May 1989):241-52.