u.s. department of commerce fy 2015, the department will continue making improvements to strengthen...
TRANSCRIPT
FY 2014 AGENCY FINANCIAL REPORT
U.S. DEPARTMENT OF COMMERCE

This report can be found on the Internet at http://www.osec.doc.gov/ofm/OFM_Publications.html.
If you have questions or comments regarding this report, please call the Department’s Office of Financial
Management at (202) 482-1207 or email Atisha Burks at [email protected] or Gordon Alston at [email protected].
Office of Financial Management
U.S. Department of Commerce
1401 Constitution Avenue, NW
Washington, DC 20230
(202) 482-1207
U.S. DEPARTMENT OF COMMERCE FY 2014 AGENCY FINANCIAL REPORT
HISTORY AND ENABLING LEGISLATION
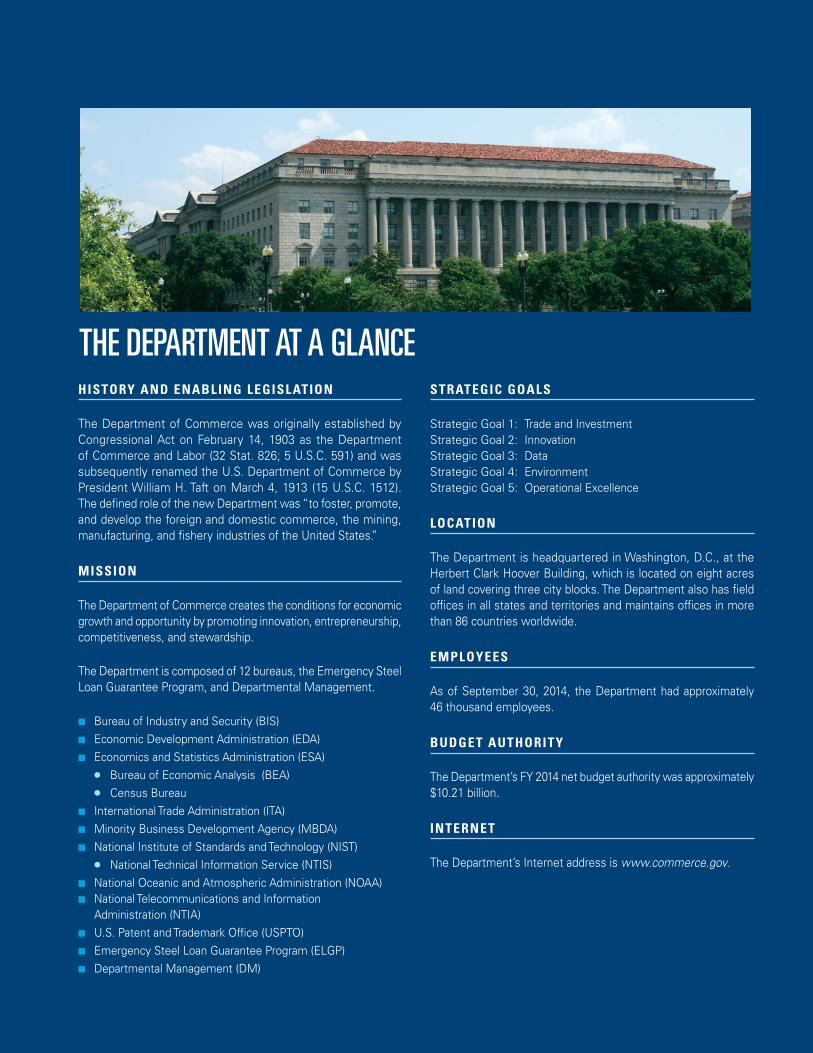
The Department of Commerce was originally established by Congressional Act on February 14, 1903 as the Department of Commerce and Labor (32 Stat. 826; 5 U.S.C. 591) and was subsequently renamed the U.S. Department of Commerce by President William H. Taft on March 4, 1913 (15 U.S.C. 1512). The defined role of the new Department was “to foster, promote, and develop the foreign and domestic commerce, the mining, manufacturing, and fishery industries of the United States.”
MISSION
The Department of Commerce creates the conditions for economic growth and opportunity by promoting innovation, entrepreneurship, competitiveness, and stewardship.
The Department is composed of 12 bureaus, the Emergency Steel Loan Guarantee Program, and Departmental Management.
■ Bureau of Industry and Security (BIS) ■ Economic Development Administration (EDA) ■ Economics and Statistics Administration (ESA)
● Bureau of Economic Analysis (BEA) ● Census Bureau
■ International Trade Administration (ITA) ■ Minority Business Development Agency (MBDA) ■ National Institute of Standards and Technology (NIST)
● National Technical Information Service (NTIS) ■ National Oceanic and Atmospheric Administration (NOAA)■ National Telecommunications and Information
Administration (NTIA) ■ U.S. Patent and Trademark Office (USPTO) ■ Emergency Steel Loan Guarantee Program (ELGP)■ Departmental Management (DM)
STRATEGIC GOALS
Strategic Goal 1: Trade and InvestmentStrategic Goal 2: Innovation Strategic Goal 3: DataStrategic Goal 4: EnvironmentStrategic Goal 5: Operational Excellence
LOCATION
The Department is headquartered in Washington, D.C., at the Herbert Clark Hoover Building, which is located on eight acres of land covering three city blocks. The Department also has field offices in all states and territories and maintains offices in more than 86 countries worldwide.
EMPLOYEES
As of September 30, 2014, the Department had approximately 46 thousand employees.
BUDGET AUTHORITY
The Department’s FY 2014 net budget authority was approximately $10.21 billion.
INTERNET
The Department’s Internet address is www.commerce.gov.
THE DEPARTMENT AT A GLANCE
TABLE OF CONTENTSMessage from Secretary Pritzker IV
How to Use this Report VI
Management’s Discussion and Analysis 1
Mission and Organization 2
The Department of Commerce Process for Strategic Planning and Performance Reporting 3
FY 2014 Performance Summary 6
Management Controls 9
Secretary’s Statement of Assurance 9
Federal Managers’ Financial Integrity Act (FMFIA) of 1982 10
Federal Financial Management Improvement Act (FFMIA) of 1996 15
Report on Audit Follow-up 15
Biennial Review of Fees 15
Financial Management and Analysis 16
Analysis of FY 2014 Financial Condition and Results 22
Summary of Stewardship Information 31
Financial Section 33
Message from the Chief Financial Officer 34
Independent Auditors’ Report 35
Principal Financial Statements 47
Consolidated Balance Sheets 48
Consolidated Statements of Net Cost 49
Consolidated Statements of Changes in Net Position 50
Combined Statements of Budgetary Resources 51
Notes to the Financial Statements 53
Required Supplementary Information (Unaudited) 107
Required Supplementary Stewardship Information (Unaudited) 113
Other Information 123
Schedule of Spending (Unaudited) 124
OIG Report on Management and Performance Challenges 125
Summary of Financial Statement Audit and Management Assurances 127
Improper Payments Information Act (IPIA) of 2002, as Amended, Reporting Details 128
Freeze the Footprint 138
Glossary of Acronyms 139
Acknowledgements 142
FY 20 14 AGENCY F I NANC IAL REPORT | I I I
MESSAGE FROM SECRETARY PRITZKER
Iam pleased to present the Department of Commerce’s Agency
Financial Report (AFR) for fiscal year (FY) 2014. The AFR is an
opportunity for us to highlight the Department’s accomplishments
and challenges in FY 2014. This report also provides information on
our financial management and performance.
Since I joined the Department as Secretary, I have met with over 1,200
business leaders and one-third of Fortune 500 CEOs; I have traveled
to more than 20 countries; and everywhere I go, the message is clear:
America is Open for Business. And it is the Department’s mission
to keep our country moving in the right direction, to help create the
conditions for economic growth, and to expand opportunity for all of
our businesses and entrepreneurs.
In FY 2014, the Department continued to help American businesses grow, compete, and thrive. We launched our
strategic plan, focused on the priority areas of trade and investment, innovation, data, and environment. This plan
provides a broad foundation for spurring greater prosperity for businesses large and small, supporting a resilient
private sector that has created more than 10 million jobs over 55 straight months of growth.
Our 46,000 employees continue to play a crucial role. They are dedicated public servants who are committed to the
important work of serving American businesses, communities, and our citizens. Their work truly epitomizes the
idea of “mission first, people always.”
The Commerce Department also remains committed to operational excellence—another part of our strategic plan—
as we continue to focus on being accountable to the public in everything we do. This report provides an important
window of transparency for our key stakeholders and the American public to assess our financial information and
performance for this past year.
Our financial management systems have been found to be in substantial compliance with the Federal Financial
Management Improvement Act (FFMIA) of 1996. In accordance with Office of Management and Budget (OMB)
Circulars A-136 and A-11, the financial and performance data published in this report are substantially complete
and reliable.
I V | FY 20 14 AGENCY F I NANC IAL REPORT

These data provide an accurate and transparent accounting of the Department’s financial situation and high-level
performance results. For the 16th year in a row, the independent auditors tasked with reviewing our financial statements
have provided an unmodified opinion. However, the Department received significant deficiencies relating to needed
improvement in two areas: (1) accounting for the Economic Development Administration (EDA) accrued grants needs
improvement, and (2) Department-wide information technology, relating to segregation of duties, access controls, and
configuration management. In FY 2015, the Department will continue making improvements to strengthen controls to
our accrued grants and information technology areas.
The Federal Managers’ Financial Integrity Act of 1982 (FMFIA) and OMB Circular A-123 provide the framework within
which Departmental and operating unit managers may determine whether adequate internal controls are in place and
operating as they should. We rely on a wide range of studies conducted by programmatic and administrative managers,
the Office of Inspector General, the Government Accountability Office, and others to assist in this effort. Based on
activities undertaken during FY 2014, the Department is able to provide an unqualified statement of assurance that its
internal controls and financial management systems meet the objectives of FMFIA.
More detailed performance information and results will be released in the 2016 Congressional Budget Submission in
February 2015.
I am proud of the work we do and the progress we have made. I hope you find this report useful.
Penny PritzkerSecretary of CommerceNovember 14, 2014
FY 20 14 AGENCY F I NANC IAL REPORT | V
M E S S A G E F R O M S E C R E T A R Y P R I T Z K E R
HOW TO USE THIS REPORT
This Agency Financial Report (AFR) for the fiscal year ended September 30 (FY) 2014 provides the Department of Commerce’s financial and summary performance information in accordance with
OMB Circular A-136, Financial Reporting Requirements.
The Department has chosen to produce an AFR. The Department will provide performance results in the FY 2016 Congressional Budget in conjunction with performance plan information as the “FY 2016 Annual Performance Report” for each bureau and will post it on the Department’s website at http://www.osec.doc.gov/bmi/budget/.
The Department’s annual AFR is available on the Department’s website at http://www.osec.doc.gov/ofm/OFM_Publications.html. The Department welcomes feedback on the form and content of this report.
This report is organized into the following major components:
Statement from the Secretary of commerce
The Secretary’s statement includes an assessment of the reliability and completeness of the financial and summary performance information presented in the report and a statement of assurance on the Department’s management controls as required by the Federal Managers’ Financial Integrity Act (FMFIA).
management’S DiScuSSion anD analySiS (mD&a)This section provides an overview of the financial and summary-level performance information contained in the Performance Summary, Financial Section, and Other Information. The MD&A includes an overview of the summary of the performance process and current status of systems, internal control weaknesses, information on the Department’s financial management, and analysis of FY 2014 financial condition and results.
financial Section
This section contains details of the Department’s finances in FY 2014. A message from the Department’s Chief Financial Officer (CFO) is followed by the independent auditors’ report, audited financial statements and notes, and required supplementary information.
other information
This section provides an overview of spending, a discussion of management challenges, improper payments information, a federal real property “Freeze the Footprint” report, and a glossary of acronyms.
MANAgEMENT’S DiSCUSSiON AND
ANAlySiS
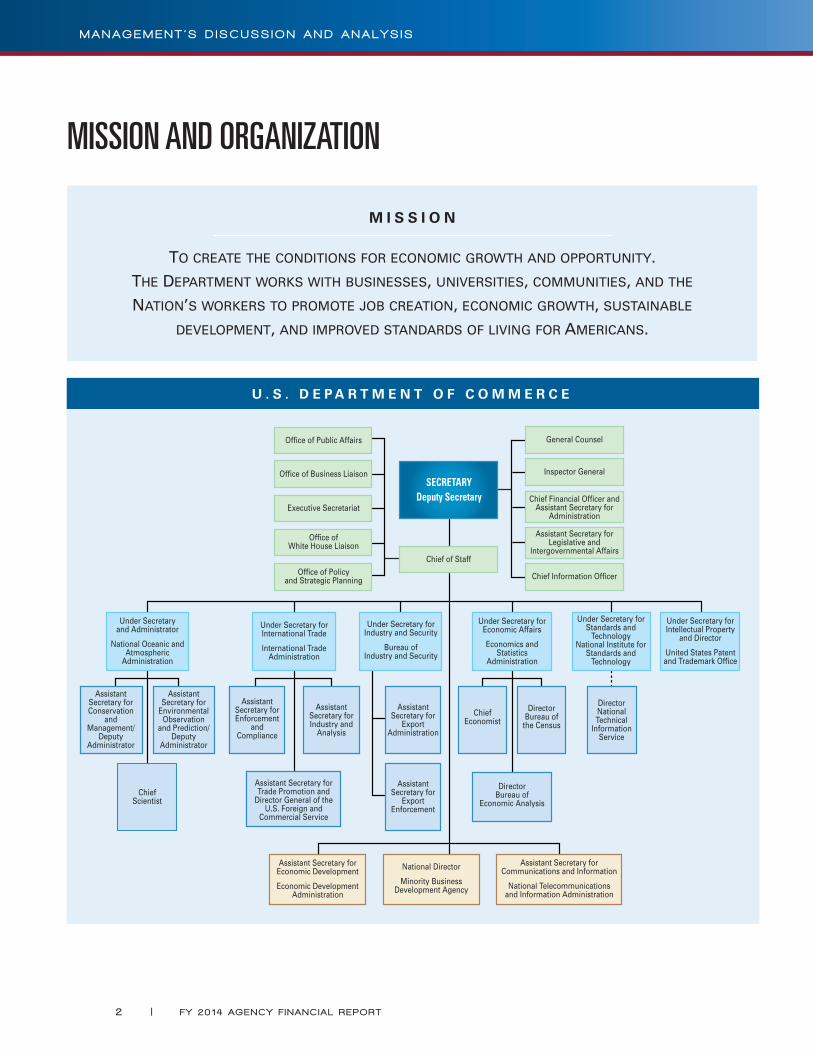
MISSION AND ORGANIZATION
M I S S I O N
To creaTe The condiTions for economic growTh and opporTuniTy.
The deparTmenT works wiTh businesses, universiTies, communiTies, and The
naTion’s workers To promoTe job creaTion, economic growTh, susTainable
developmenT, and improved sTandards of living for americans.
U . S . D E P A R T M E N T O F C O M M E R C E
Chief Financial Officer andAssistant Secretary for
Administration
Chief Information Officer
Office of Public Affairs
Office of Business Liaison
Office ofWhite House Liaison
Office of Policyand Strategic Planning
SECRETARYDeputy Secretary
Under Secretary forInternational Trade
International TradeAdministration
Under Secretary forIndustry and Security
Bureau ofIndustry and Security
AssistantSecretary for
ExportAdministration
AssistantSecretary for
ExportEnforcement
ChiefEconomist
DirectorBureau of
the Census
AssistantSecretary for Enforcement
and Compliance
AssistantSecretary forIndustry and
Analysis
Assistant Secretary for Trade Promotion and
Director General of the U.S. Foreign and
Commercial Service
Under Secretary forEconomic Affairs
Economics andStatistics
Administration
Director Bureau of
Economic Analysis
Assistant Secretary forEconomic Development
Economic DevelopmentAdministration
National Director
Minority BusinessDevelopment Agency
Assistant Secretary forCommunications and Information
National Telecommunicationsand Information Administration
Under Secretary forIntellectual Property
and Director
United States Patentand Trademark Office
Executive Secretariat
Chief of Staff
Assistant Secretary forLegislative and
Intergovernmental Affairs
Inspector General
General Counsel
DirectorNational Technical
Information Service
Under Secretary forStandards and
TechnologyNational Institute for
Standards andTechnology
Under Secretaryand Administrator
National Oceanic andAtmospheric
Administration
ChiefScientist
AssistantSecretary forConservation
andManagement/
DeputyAdministrator
AssistantSecretary for
EnvironmentalObservation
and Prediction/ Deputy
Administrator
2 | FY 20 14 AGENCY F I NANC IAL REPORT
M A N A G E M E N T ’ S D I S C U S S I O N A N D A N A L Y S I S
THE DEPARTMENT OF COMMERCE PROCESS FOR STRATEGIC PLANNING AND PERFORMANCE REPORTING
BACKGROUND ON THE FY 2014 – FY 2018 STRATEGIC PLAN
The Department of Commerce FY 2014 – FY 2018 strategic planning process was re-engineered in the summer of FY 2013. Newly confirmed, Secretary Penny Pritzker began her tenure with a national listening tour of businesses, Departmental leadership, and staff. The tour produced the outline of a new vision for the Department. The vision is a major departure from the previous strategic plan and has five goal areas: Trade and Investment, Innovation, Environment, Data, and Operational Excellence.
The outline the Office of the Secretary produced was refined and expanded upon by multi-bureau executive teams. The final product, published in March of FY 2014, requires an unprecedented level of bureau collaboration. All but three of 18 strategic objectives involve more than one bureau; 12 involve three or more.
The bureau leadership development/writing teams became multi-bureau implementation teams that wrote action plans for each objective. The action plans included initiatives, initiative owners, milestones, and due dates. The action plans are on an online Executive Dashboard. The dashboard has been supplemented by a “Tracker” which lists actions that the Office of the Secretary regularly monitors.
ROUTINE MONITORING OF THE STRATEGIC PLAN
The Department’s Executive Management Team (EMT) monitors the strategic plan and refines strategies and tactics on an ongoing basis. The EMT meets every other week and includes the administration-appointed bureau leaders, the Secretary, her chief of staff, the Deputy Secretary, and principals of the Office of the Secretary. The Deputy Secretary chairs the meeting. At every EMT meeting, one to three strategic objectives are reviewed. Progress, challenges, and risks are discussed and benefit from the collective talents and resources of the group. Strategies and tactics may be revised or enhanced to accelerate progress or reduce risks.
There are several mechanisms that are used to report and review strategic plan performance indicators and aligned program specific indicators. EMT presentations on strategic objectives include data on leading and lagging performance metrics. Data on those metrics are posted to the online Executive Dashboard available to the EMT, senior career leaders, and their staff. Data on Agency Priority Goals (APG), initiatives singled out for emphasis, and Cross-Agency Priority Goals (CAP), multi-agency priorities, are posted to a public website www.performance.gov. Before the data and explanations are published to the site, the tracking information is reviewed by both bureau and Department leadership and the Office of Management and Budget (OMB). Bureaus have internal bureau centric metric review processes and data on mission support initiatives (Human Resources, Acquisition, Information Technology, etc.) are tracked on online dashboards and reviewed at team meetings.
FY 20 14 AGENCY F I NANC IAL REPORT | 3
M A N A G E M E N T ’ S D I S C U S S I O N A N D A N A L Y S I S
ANNUAL STRATEGIC REVIEW PROCESS
Apart from the EMT review of strategic objectives, in FY 2014 the Department conducted an annual strategic review as required by OMB Circular A-11. FY 2014 was the first year federal agencies conducted these reviews following new guidance from OMB and the Federal Performance Improvement Council. The approach will evolve as it is used. The Department’s reviews were conducted in the following four steps:
●● a survey of the appointed and career leaders to obtain their independent assessment of risks and challenges for each objective;
●● a management retreat to discuss key issues identified in the surveys;
●● development of action plans based on recommendations from the retreat; and
●● synthesis of analysis from the EMT presentations, surveys, retreat recommendations, and action plans into a written assessment that categorized objectives as having: exceptional progress, progress as planned, or significant challenges.
Action plans for the strategic objectives will continue to be refined using the analysis from the strategic reviews and input at the EMT meetings. The strategic reviews and budget process will also generate a list of research and evaluation subjects that will be used to develop an agenda for developing “evidence” that can be used in refining operations.
On the following page is a summary of the strategic goals and objectives established in the FY 2014 – FY 2018 Strategic Plan. The strategic plan can be found at http://www.commerce.gov/sites/default/files/documents/2014/march/doc_fy2014-2018_strategic_plan.pdf.
4 | FY 20 14 AGENCY F I NANC IAL REPORT
M A N A G E M E N T ’ S D I S C U S S I O N A N D A N A L Y S I S
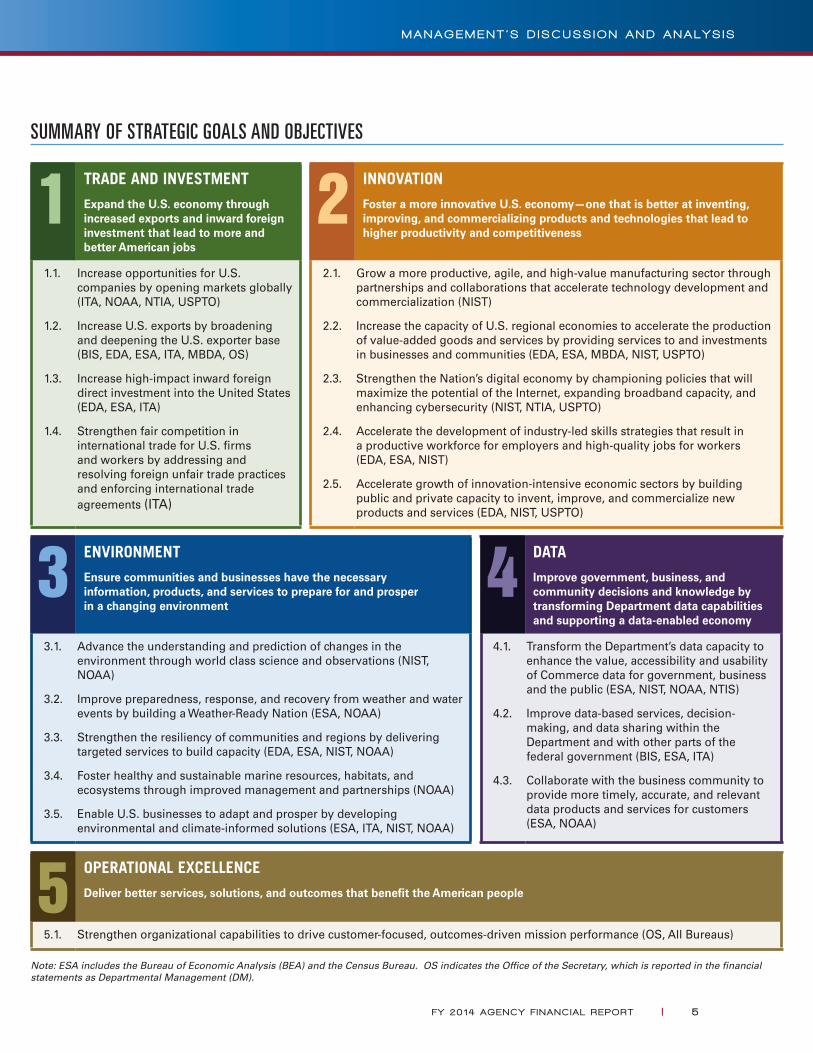
SUMMARY OF STRATEGIC GOALS AND OBJECTIVES
1 TRADE AND INVESTMENT
Expand the U.S. economy through increased exports and inward foreign investment that lead to more and better American jobs
2 INNOVATION
Foster a more innovative U.S. economy—one that is better at inventing, improving, and commercializing products and technologies that lead to higher productivity and competitiveness
1.1. Increase opportunities for U.S. companies by opening markets globally (ITA, NOAA, NTIA, USPTO)
1.2. Increase U.S. exports by broadening and deepening the U.S. exporter base (BIS, EDA, ESA, ITA, MBDA, OS)
1.3. Increase high-impact inward foreign direct investment into the United States (EDA, ESA, ITA)
1.4. Strengthen fair competition in international trade for U.S. firms and workers by addressing and resolving foreign unfair trade practices and enforcing international trade agreements (ITA)
2.1. Grow a more productive, agile, and high-value manufacturing sector through partnerships and collaborations that accelerate technology development and commercialization (NIST)
2.2. Increase the capacity of U.S. regional economies to accelerate the production of value-added goods and services by providing services to and investments in businesses and communities (EDA, ESA, MBDA, NIST, USPTO)
2.3. Strengthen the Nation’s digital economy by championing policies that will maximize the potential of the Internet, expanding broadband capacity, and enhancing cybersecurity (NIST, NTIA, USPTO)
2.4. Accelerate the development of industry-led skills strategies that result in a productive workforce for employers and high-quality jobs for workers (EDA, ESA, NIST)
2.5. Accelerate growth of innovation-intensive economic sectors by building public and private capacity to invent, improve, and commercialize new products and services (EDA, NIST, USPTO)
3 ENVIRONMENT
Ensure communities and businesses have the necessary information, products, and services to prepare for and prosper in a changing environment
4 DATA
Improve government, business, and community decisions and knowledge by transforming Department data capabilities and supporting a data-enabled economy
3.1. Advance the understanding and prediction of changes in the environment through world class science and observations (NIST, NOAA)
3.2. Improve preparedness, response, and recovery from weather and water events by building a Weather-Ready Nation (ESA, NOAA)
3.3. Strengthen the resiliency of communities and regions by delivering targeted services to build capacity (EDA, ESA, NIST, NOAA)
3.4. Foster healthy and sustainable marine resources, habitats, and ecosystems through improved management and partnerships (NOAA)
3.5. Enable U.S. businesses to adapt and prosper by developing environmental and climate-informed solutions (ESA, ITA, NIST, NOAA)
4.1. Transform the Department’s data capacity to enhance the value, accessibility and usability of Commerce data for government, business and the public (ESA, NIST, NOAA, NTIS)
4.2. Improve data-based services, decision-making, and data sharing within the Department and with other parts of the federal government (BIS, ESA, ITA)
4.3. Collaborate with the business community to provide more timely, accurate, and relevant data products and services for customers (ESA, NOAA)
5 OPERATIONAL EXCELLENCE
Deliver better services, solutions, and outcomes that benefit the American people
5.1. Strengthen organizational capabilities to drive customer-focused, outcomes-driven mission performance (OS, All Bureaus)
Note: ESA includes the Bureau of Economic Analysis (BEA) and the Census Bureau. OS indicates the Office of the Secretary, which is reported in the financial statements as Departmental Management (DM).
FY 20 14 AGENCY F I NANC IAL REPORT | 5
M A N A G E M E N T ’ S D I S C U S S I O N A N D A N A L Y S I S
FY 2014 PERFORMANCE SUMMARY
OVERVIEW OF PERFORMANCE
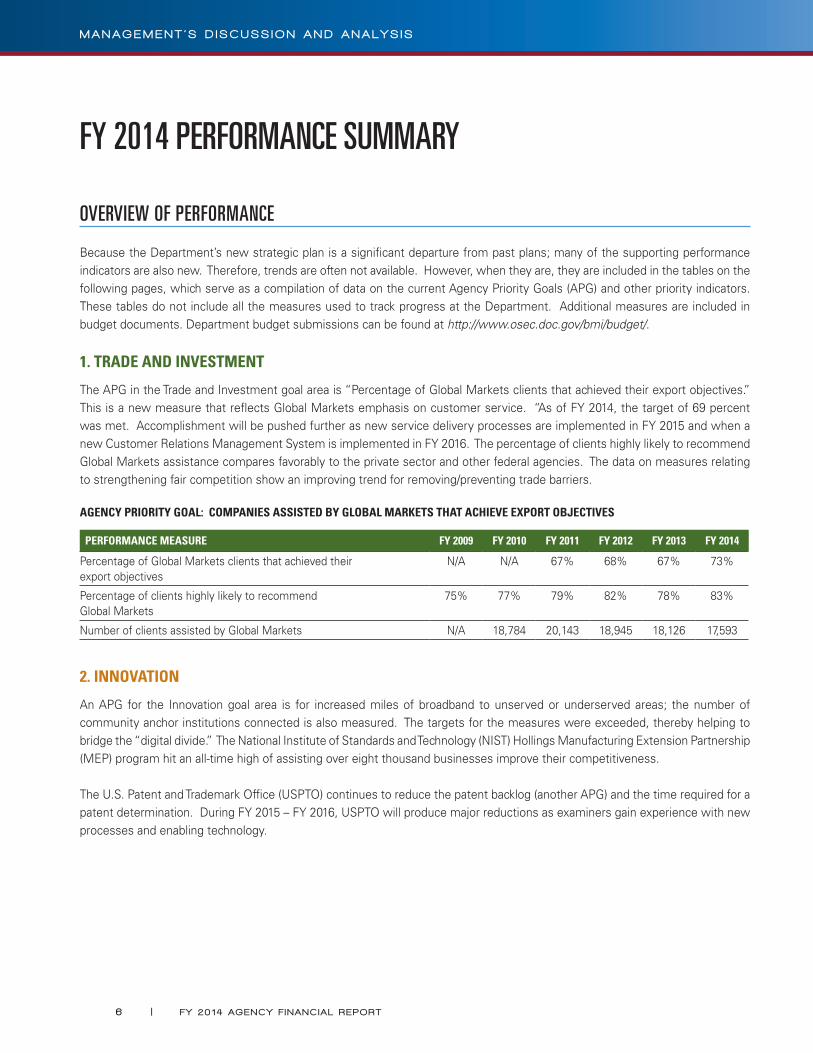
Because the Department’s new strategic plan is a significant departure from past plans; many of the supporting performance indicators are also new. Therefore, trends are often not available. However, when they are, they are included in the tables on the following pages, which serve as a compilation of data on the current Agency Priority Goals (APG) and other priority indicators. These tables do not include all the measures used to track progress at the Department. Additional measures are included in budget documents. Department budget submissions can be found at http://www.osec.doc.gov/bmi/budget/.
1. TRADE AND INVESTMENT
The APG in the Trade and Investment goal area is “Percentage of Global Markets clients that achieved their export objectives.” This is a new measure that reflects Global Markets emphasis on customer service. “As of FY 2014, the target of 69 percent was met. Accomplishment will be pushed further as new service delivery processes are implemented in FY 2015 and when a new Customer Relations Management System is implemented in FY 2016. The percentage of clients highly likely to recommend Global Markets assistance compares favorably to the private sector and other federal agencies. The data on measures relating to strengthening fair competition show an improving trend for removing/preventing trade barriers.
AGENCY PRIORITY GOAL: COMPANIES ASSISTED BY GLOBAL MARKETS THAT ACHIEVE EXPORT OBJECTIVES
PERFORMANCE MEASURE FY 2009 FY 2010 FY 2011 FY 2012 FY 2013 FY 2014
Percentage of Global Markets clients that achieved their export objectives
N/A N/A 67% 68% 67% 73%
Percentage of clients highly likely to recommend Global Markets
75% 77% 79% 82% 78% 83%
Number of clients assisted by Global Markets N/A 18,784 20,143 18,945 18,126 17,593
2. INNOVATION
An APG for the Innovation goal area is for increased miles of broadband to unserved or underserved areas; the number of community anchor institutions connected is also measured. The targets for the measures were exceeded, thereby helping to bridge the “digital divide.” The National Institute of Standards and Technology (NIST) Hollings Manufacturing Extension Partnership (MEP) program hit an all-time high of assisting over eight thousand businesses improve their competitiveness.
The U.S. Patent and Trademark Office (USPTO) continues to reduce the patent backlog (another APG) and the time required for a patent determination. During FY 2015 – FY 2016, USPTO will produce major reductions as examiners gain experience with new processes and enabling technology.
6 | FY 20 14 AGENCY F I NANC IAL REPORT
M A N A G E M E N T ’ S D I S C U S S I O N A N D A N A L Y S I S
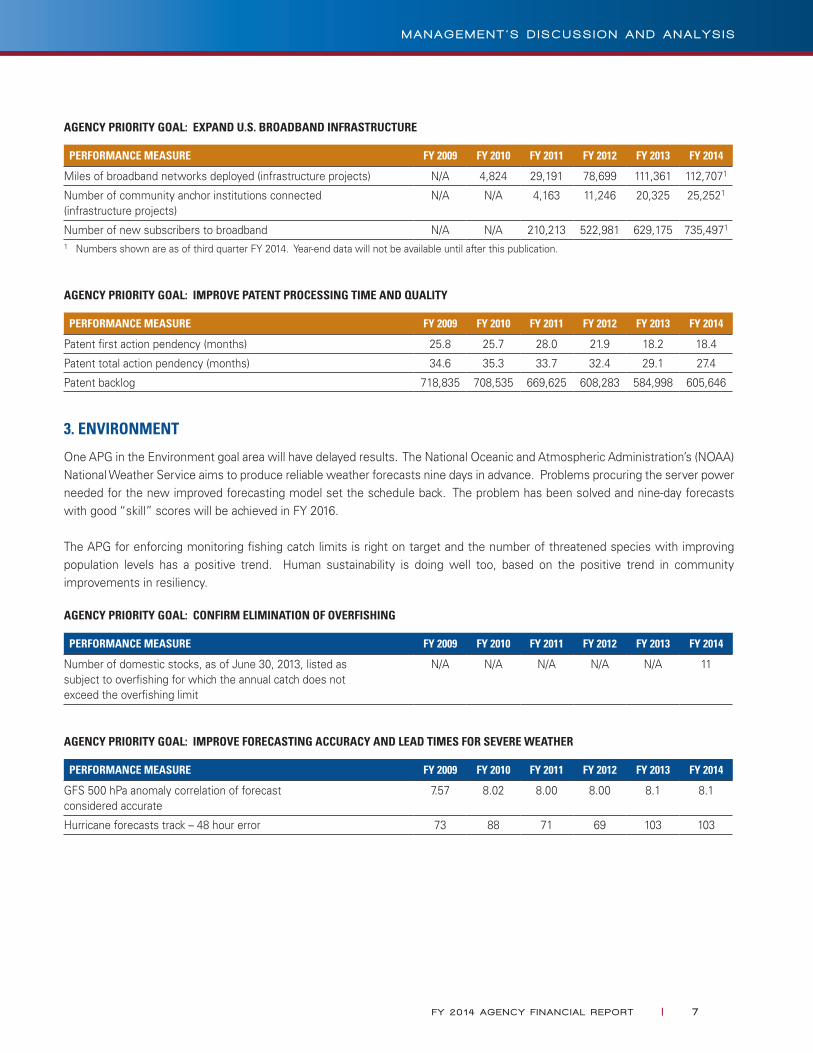
AGENCY PRIORITY GOAL: EXPAND U.S. BROADBAND INFRASTRUCTURE
PERFORMANCE MEASURE FY 2009 FY 2010 FY 2011 FY 2012 FY 2013 FY 2014
Miles of broadband networks deployed (infrastructure projects) N/A 4,824 29,191 78,699 111,361 112,7071
Number of community anchor institutions connected (infrastructure projects)
N/A N/A 4,163 11,246 20,325 25,2521
Number of new subscribers to broadband N/A N/A 210,213 522,981 629,175 735,4971
1 Numbers shown are as of third quarter FY 2014. Year-end data will not be available until after this publication.
AGENCY PRIORITY GOAL: IMPROVE PATENT PROCESSING TIME AND QUALITY
PERFORMANCE MEASURE FY 2009 FY 2010 FY 2011 FY 2012 FY 2013 FY 2014
Patent first action pendency (months) 25.8 25.7 28.0 21.9 18.2 18.4
Patent total action pendency (months) 34.6 35.3 33.7 32.4 29.1 27.4
Patent backlog 718,835 708,535 669,625 608,283 584,998 605,646
3. ENVIRONMENT
One APG in the Environment goal area will have delayed results. The National Oceanic and Atmospheric Administration’s (NOAA) National Weather Service aims to produce reliable weather forecasts nine days in advance. Problems procuring the server power needed for the new improved forecasting model set the schedule back. The problem has been solved and nine-day forecasts with good “skill” scores will be achieved in FY 2016.
The APG for enforcing monitoring fishing catch limits is right on target and the number of threatened species with improving population levels has a positive trend. Human sustainability is doing well too, based on the positive trend in community improvements in resiliency.
AGENCY PRIORITY GOAL: CONFIRM ELIMINATION OF OVERFISHING
PERFORMANCE MEASURE FY 2009 FY 2010 FY 2011 FY 2012 FY 2013 FY 2014
Number of domestic stocks, as of June 30, 2013, listed as subject to overfishing for which the annual catch does not exceed the overfishing limit
N/A N/A N/A N/A N/A 11
AGENCY PRIORITY GOAL: IMPROVE FORECASTING ACCURACY AND LEAD TIMES FOR SEVERE WEATHER
PERFORMANCE MEASURE FY 2009 FY 2010 FY 2011 FY 2012 FY 2013 FY 2014
GFS 500 hPa anomaly correlation of forecast considered accurate
7.57 8.02 8.00 8.00 8.1 8.1
Hurricane forecasts track – 48 hour error 73 88 71 69 103 103
FY 20 14 AGENCY F I NANC IAL REPORT | 7
M A N A G E M E N T ’ S D I S C U S S I O N A N D A N A L Y S I S
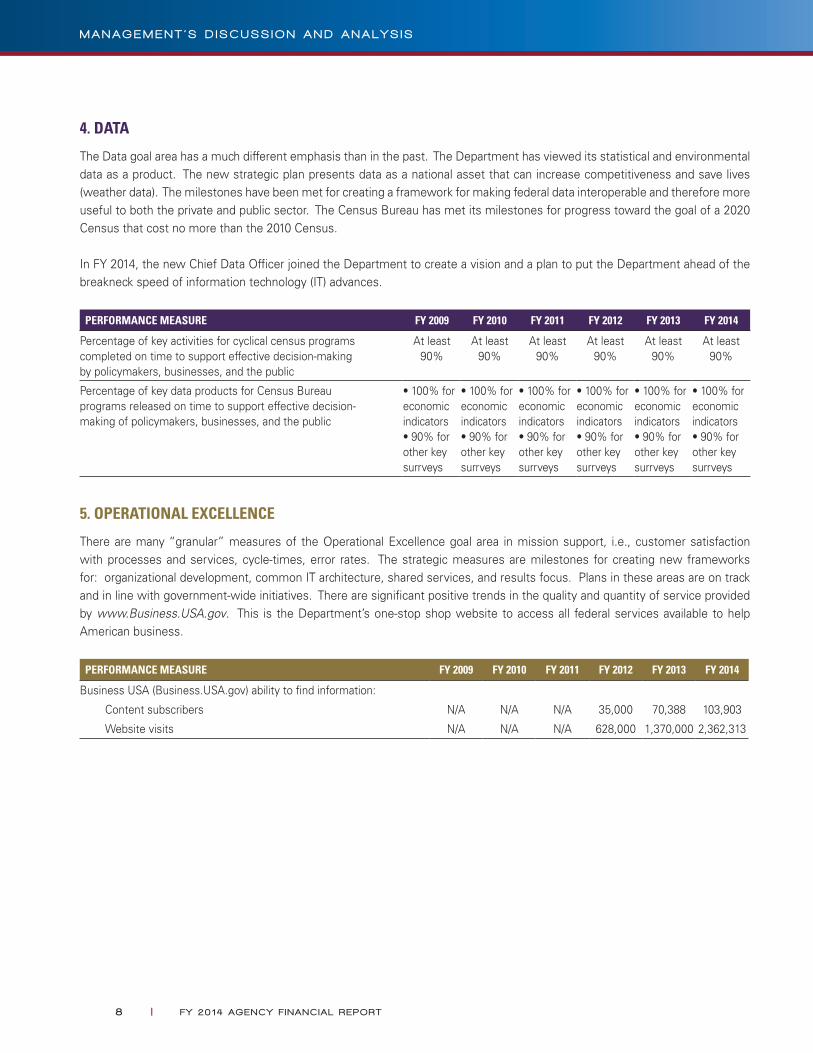
4. DATA
The Data goal area has a much different emphasis than in the past. The Department has viewed its statistical and environmental data as a product. The new strategic plan presents data as a national asset that can increase competitiveness and save lives (weather data). The milestones have been met for creating a framework for making federal data interoperable and therefore more useful to both the private and public sector. The Census Bureau has met its milestones for progress toward the goal of a 2020 Census that cost no more than the 2010 Census.
In FY 2014, the new Chief Data Officer joined the Department to create a vision and a plan to put the Department ahead of the breakneck speed of information technology (IT) advances.
PERFORMANCE MEASURE FY 2009 FY 2010 FY 2011 FY 2012 FY 2013 FY 2014
Percentage of key activities for cyclical census programs completed on time to support effective decision-making by policymakers, businesses, and the public
At least 90%
At least 90%
At least 90%
At least 90%
At least 90%
At least 90%
Percentage of key data products for Census Bureau programs released on time to support effective decision-making of policymakers, businesses, and the public
• 100% for economic indicators • 90% for other key surrveys
• 100% for economic indicators • 90% for other key surrveys
• 100% for economic indicators • 90% for other key surrveys
• 100% for economic indicators • 90% for other key surrveys
• 100% for economic indicators • 90% for other key surrveys
• 100% for economic indicators • 90% for other key surrveys
5. OPERATIONAL EXCELLENCE
There are many “granular” measures of the Operational Excellence goal area in mission support, i.e., customer satisfaction with processes and services, cycle-times, error rates. The strategic measures are milestones for creating new frameworks for: organizational development, common IT architecture, shared services, and results focus. Plans in these areas are on track and in line with government-wide initiatives. There are significant positive trends in the quality and quantity of service provided by www.Business.USA.gov. This is the Department’s one-stop shop website to access all federal services available to help American business.
PERFORMANCE MEASURE FY 2009 FY 2010 FY 2011 FY 2012 FY 2013 FY 2014
Business USA (Business.USA.gov) ability to find information:
Content subscribers N/A N/A N/A 35,000 70,388 103,903
Website visits N/A N/A N/A 628,000 1,370,000 2,362,313
8 | FY 20 14 AGENCY F I NANC IAL REPORT
M A N A G E M E N T ’ S D I S C U S S I O N A N D A N A L Y S I S
MANAGEMENT CONTROLS
T he Department’s management is responsible for establishing and maintaining effective internal control
and financial management systems that meet the objectives of the Federal Managers’ Financial Integrity
Act (FMFIA). During FY 2014, the Department assessed its internal control over the effectiveness and
efficiency of operations and compliance with applicable laws and regulations in accordance with Office of
Management and Budget (OMB) Circular A-123, Management’s Responsibility for Internal Control. Based
on the results of this evaluation, the Department can provide reasonable assurance that its internal control
over the effectiveness and efficiency of operations and compliance with applicable laws and regulations as
of September 30, 2014 was operating effectively and no material weaknesses were found in the design or
operation of the internal controls.
In addition, the Department conducted its assessment of the effectiveness of internal control over financial
reporting, which includes safeguarding of assets and compliance with applicable laws and regulations,
in accordance with the requirements of Appendix A of OMB Circular A-123. Based on the results of this
evaluation, the Department can provide reasonable assurance that its internal control over financial reporting
as of June 30, 2014 was operating effectively and no material weaknesses were found in the design or
operation of the internal control over financial reporting. Furthermore, no material weaknesses related to
internal control over financial reporting were identified between July 1 and September 30.
Based on reviews conducted by the Department, it has been able to determine that its financial systems are
in conformance with government-wide requirements.
Penny Pritzker
Secretary of Commerce
November 14, 2014
FY 20 14 AGENCY F I NANC IAL REPORT | 9
M A N A G E M E N T ’ S D I S C U S S I O N A N D A N A L Y S I S
FEDERAL MANAGERS’ FINANCIAL INTEGRITY ACT (FMFIA) OF 1982
The objective of the Department’s management control system is to provide reasonable assurance that:
●● Obligations and costs are in compliance with applicable laws;
●● Assets are safeguarded against waste, loss, and unauthorized use of appropriations;
●● Revenues and expenditures applicable to the Department’s operations are properly recorded and accounted for, permitting accurate accounts, reliable financial reports, and full accountability for assets; and
●● Programs are efficiently and effectively carried out in accordance with applicable laws and management policy.
During FY 2014, the Department reviewed its management control system in accordance with the requirements of FMFIA, and OMB and Departmental guidelines.
SECTION 2 OF FMFIA – INTERNAL MANAGEMENT CONTROLS
Section 2 of FMFIA requires that federal agencies report, on the basis of annual assessments, any material weaknesses that have been identified in connection with their internal and administrative controls. The efficiency of the Department’s operations is continually evaluated using information obtained from reviews conducted by the U.S. Government Accountability Office (GAO) and the Office of Inspector General (OIG), evaluations conducted by other federal agencies such as the U.S. Office of Personnel Management (OPM), and other specifically requested studies. The diverse reviews that took place during FY 2014 relative to non-financial controls provide assurance that Departmental systems and management controls comply with standards established under FMFIA.
Key Administrative and Management Internal Control Activities
In compliance with FMFIA, the following information regarding the adequacy of management and internal control systems relative to management and internal controls in FY 2014 is detailed below.
HUMAN RESOURCE MANAGEMENT
Strategic Human Capital Management. The Department developed a strategic approach to accountability in human capital management that proactively addresses the challenges of aligning human capital strategies with Department strategies, and to improve leadership, knowledge management, acquisition of talent, and performance.
Oversight and Accountability Audits. In accordance with Title 5, U.S. Code § 1104(a)(2) and Executive Order 13197, Government-wide Accountability for Merit Systems Principles; Workforce Information, dated January 18, 2001, the Office of Human Resources Accountability coordinated, trained, and led the Department Human Capital Audit Team successfully through eight Delegated Examining on-site audits at the servicing human resources office. In addition, the audit team conducted two Human Capital Framework (HCF) assessments.
The Department Human Capital Audit Team monitors and audits/evaluates the results of its human capital management policies, programs, and activities by analyzing compliance with merit system principles, federal regulations, OPM standards, and Departmental policy. During FY 2015, eight Delegated Examining and two HCF audits will be conducted.
1 0 | FY 20 14 AGENCY F I NANC IAL REPORT
M A N A G E M E N T ’ S D I S C U S S I O N A N D A N A L Y S I S
Protecting Personally Identifiable Information (PII). A quarterly analysis is conducted by an independent third-party vendor of all Department employee identities to ensure no organized misuse by fraudsters is occurring. In relation to specific breach or potential breach incidents, reports of “Harm” or “No Harm” are provided by the vendor to indicate if misuse of any employee identities is occurring as a result of the specific incident(s).
ACQUISITION MANAGEMENT
The Office of Acquisition Management’s (OAM) internal control process is based on OMB-prescribed guidance on acquisition assessment with the following cornerstones:
1. Organization Alignment and Leadership;
2. Policies and Processes;
3. Human Capital; and
4. Information Management and Leadership.
OAM’s structure directly addresses major initiatives such as implementation of the scalable framework for acquisition management, strategic sourcing initiatives and acquisition/administrative savings, risk management, and cost analysis and oversight.
USASpending.gov. USAspending.gov, a single searchable website that is accessible to the public, receives and displays data pertaining to amounts awarded for federally sponsored projects during a given budget period. One of the main source systems which provides information to the USAspending.gov website is the Federal Procurement Data System (FPDS). The Department annually reviews and certifies its procurement data captured in FPDS in accordance with Office of Federal Procurement Policy guidance. This activity certifies the completeness, quality, accuracy, and timeliness of the Department’s data in FPDS. Accuracy is measured by reviewing a random sample of records for data elements prescribed by OMB. The Department has consistently maintained an accuracy rating of 95 percent or above.
In addition, OAM conducts a quarterly FPDS verification and validation process. The quarterly reviews are used to evaluate the accuracy of the Department data in FPDS throughout the year. Data elements with accuracy rates that fall below 95 percent are identified and targeted for improvement. The quarterly review process has helped to improve the accuracy of procurement data in FPDS.
The Department’s grant-making bureaus have engaged in considerable effort to improve the reliability and accuracy of USAspending.gov financial assistance award data. Each bureau has developed and implemented a comprehensive process to validate USAspending.gov prime federal award financial assistance data through a comparison against Federal Award Identification Numbers in their respective financial systems prior to uploading the data to USAspending.gov.
Purchase Card Program. OAM continuously monitors and updates internal control measures and processes to manage the Department’s Purchase Card Program, certifies that the appropriate policies and controls are in place, and corrective actions have been taken to mitigate the risk of fraud and inappropriate charge card practices.
In FY 2014, the Department continued its implementation efforts to enhance policy requirements and implement structured procedures. Enhancements to the purchase card program included development of customized virtual online training courses to highlight Department-specific policies and procedures of the program and enhance user training by
FY 20 14 AGENCY F I NANC IAL REPORT | 1 1
M A N A G E M E N T ’ S D I S C U S S I O N A N D A N A L Y S I S
providing realistic scenario-based examples, updating the Commerce Acquisition Management (CAM) Chapter to address audit findings, a bureau management review to assess strengths and weaknesses of bureau programs, and development of a cardholder community newsletter to improve policy communication to the cardholder community.
American Reinvestment and Recovery Act (ARRA) Funds Management:Federally Awarded Contracts – Recipient reporting for ARRA awards was repealed by Congress as of February 1, 2014. Therefore, the January 2014 reporting cycle was the last required reporting submission for ARRA awards and all input into FederalReporting.gov ceased on March 19, 2014. As part of the transparency and accountability initiative, the Department regularly provided summaries of reporting compliance results and issues to the Department Senior Accountable Official for ARRA and to OMB. Beginning in FY 2013, the Department implemented a reconciliation process on awards that were marked as having a Final Report submission which involved validating that the data reported and reflected on USASpending.gov were accurate and complete. By the sunset of the ARRA reporting era, OAM completed reconciliation on 84 percent of the Department Final Report submissions.
Financial Assistance – As of March 19, 2014, ARRA reporting was officially terminated. Since 2009, OAM’s Grants Management Division provided oversight for 483 grants valued at nearly $5 billion and coordinated the accurate and timely reporting of those dollars obligated and spent under ARRA. Additionally, the OAM Grants Management Division conducted weekly teleconferences with key bureau ARRA reporting personnel and provided them feedback on reporting issues and any new ARRA policies that had been issued.
Hurricane Sandy Funds Management:Disaster Relief Act (Hurricane Sandy) Supplemental Funding – Supplemental funding received under the Disaster Relief Act (Hurricane Sandy) received comprehensive programmatic and administrative attention throughout the Department in order to achieve the legislative goals attributable to it. All Hurricane Sandy funds received by the Department were awarded or otherwise expended solely for authorized purposes, in as prompt and efficient manner as possible while safeguarding against fraud, waste, and abuse. Reporting associated with this funding is being performed transparently and comprehensively. Monitoring has been and will continue to be conducted to ensure the recipient is meeting goals as stated in its application and as incorporated into award documents, and will also focus on the effects Hurricane Sandy funding has had and will prospectively have on economic indicators.
FACILITIES MANAGEMENT
GAO has designated federal real property management as a high risk issue since 2003 due to long standing challenges, including unreliable data reported in the Federal Real Property Profile (FRPP).
In July 2014, GAO issued a report which concluded that data problems related to federal real property continue to be an issue. While OMB or the U.S. General Services Administration has not issued specific guidance regarding data quality improvements in 2014, the FRPP Guidance was released in July 2014.
The 2014 FRPP guidance includes several changes intended to improve the consistency of reporting among agencies. These changes include revised definitions, modified data elements, and standardized processes and procedures for collecting and reporting data. The Office of Real Property Programs (ORPP) is currently reviewing all asset records in the Department’s Federal Real Property Management System (FRPMS) and has requested each bureau to individually certify and validate its data for accuracy and completeness.
1 2 | FY 20 14 AGENCY F I NANC IAL REPORT
M A N A G E M E N T ’ S D I S C U S S I O N A N D A N A L Y S I S
Also in an effort to improve data quality, personal identity verification cards will be required to gain access to Department networks and allow it to more accurately count the number of contractor and federal employees in its facilities. As a result, ORPP will have more accurate data necessary to calculate Department facility utilization rates that are reported in its OMB performance measures. Finally, in an effort to report more accurate data, ORPP directed the Department to improve its facility annual operating cost reporting by extracting data available in the Department’s financial system.
INFORMATION TECHNOLOGY (IT) SECURITY RECEIVES CONTINUED FOCUS
The Office of the Chief Information Officer (OCIO) conducts reviews of its IT investments to ensure their efficiency and effectiveness in support of the Department’s missions. The Department, following OMB policies and guidelines, and complying with Federal Information Security Management Act (FISMA) requirements, oversees and manages IT resources by establishing and implementing policies and controls to mitigate IT risks. In FY 2014, the Department made improvements to elevate the IT security program and address deficiencies in continuous monitoring, configuration, and vulnerability management and IT security general awareness and role-based training.
Accomplishments resulting from the Department’s efforts to address the deficiencies include developing a Cyber Strategic Plan in support of the Department’s missions and goals through FY 2018; and adopting a revised IT Security Program Policy and additional policies and guidance on safeguarding information on foreign travel, access and use, and telework. The Department continued to implement an Enterprise Cybersecurity Monitoring and Operations (ECMO) tool to monitor and track continuous monitoring of IT security-related events throughout the Department.
The Department launched an Enterprise Security Oversight Center (ESOC) and continued making improvements to the Department’s Computer Incident Response Team (CIRT), and also worked with personnel with significant IT security roles and responsibilities through the CIOs’ Council, the IT Security Coordinating Committee, and the IT Audit Working Group to devise enterprise-wide solutions to deficiencies.
While these enhancements will allow the Department to elevate its IT security posture, more work remains to be accomplished. Despite these improvements, the OIG found that critical security controls remain unimplemented, including remote access control, flaw remediation, and secure configuration settings in the FY 2014 FISMA Audits. The OIG acknowledges progress the Department has made implementing ECMO and ESOC and improving the CIRT, which are critical to maintaining general network hygiene, implementing continuous monitoring, providing timely cyber situational awareness, and addressing cyber incidents across the Department. However, the OIG encourages the Department to make a concerted effort to expedite ECMO deployment and maintain a fully operational and stable IT infrastructure at its headquarters.
IT ACCOMPLISHMENTS TOWARD FMFIA
To ensure that the Department effectively manages the ongoing IT security concerns, the OCIO has been developing a Cyber Security Strategic Plan to strengthen its IT security posture and operations. Additionally, the OCIO security office continues to conduct rigorous IT security compliance reviews based on FISMA requirements, OMB policy, National Institute of Standards and Technology (NIST) standards and guidelines, and previous OIG recommendations.
FY 20 14 AGENCY F I NANC IAL REPORT | 1 3
M A N A G E M E N T ’ S D I S C U S S I O N A N D A N A L Y S I S
Other Internal Control Enhancement Activities Continue
During FY 2014, the Department’s OMB Circular A-123 Appendix A review and assessment included the following:
●● Utilized the Senior Management Council to implement, direct and oversee the assessment process; and the Senior Assessment Team to develop OMB Circular A-123 planning documentation, administer internal control test plans, and monitor and review the test work;
●● Conducted risk assessment to include additional testing cycles;
●● Updated Departmental sampling plan and Department-wide testing templates for selected key processes/sub-processes;
●● Had each of the Department’s bureaus complete an entity-level controls assessment as required by OMB Circular A-123, Appendix A;
●● Utilized contractor assistance in implementing the requirements of OMB Memorandum M-13-21 and evaluating internal controls over travel card management;
●● Utilized contractor assistance to perform an analysis of the internal control over NIST’s grants and accounts payable accrual sub-processes. The final analysis will include a summary of the revised grants and accounts payable accrual sub-processes, enhanced reconciliations, and the process for future evaluations;
●● Analyzed the results of the overall effort to assess and document the adequacy of the Department’s internal controls in order to develop the annual statement of assurance issued by the Secretary and published in the Agency Financial Report;
●● Consolidated and analyzed the OMB Circular A-123 Appendix A review lead sheet at each of the applicable Department bureaus, including assessing and documenting the findings and recommendations for corrective actions (if applicable) at the Department level;
●● Performed reviews of working papers for select processes/cycles at the Census Bureau and the National Oceanic and Atmospheric Administration for completeness, accuracy, reliability, adequacy, and adherence to the Department’s Implementation Plan, Sampling Plan, and Work Paper Guide; and
●● Furthered the initiative to establish an Office of Forensic Accounting. Through contractor support, the Department has focused on developing and solidifying an end-to-end monitoring process involving the analyses of Purchase Card, Travel Card, and Payroll processes within the Department.
SECTION 4 OF FMFIA – INTERNAL CONTROLS OVER FINANCIAL MANAGEMENT SYSTEMS
The Department has reported no material weaknesses under FMFIA Section 4 in recent years. Based on reviews conducted by the Department and its bureaus for FY 2014, the financial systems in the Department are compliant with GAO principles and standards, the requirements of the Chief Financial Officers Act, and OMB requirements.
1 4 | FY 20 14 AGENCY F I NANC IAL REPORT
M A N A G E M E N T ’ S D I S C U S S I O N A N D A N A L Y S I S

FEDERAL FINANCIAL MANAGEMENT IMPROVEMENT ACT (FFMIA) OF 1996
U nder FFMIA, the Department is required to have financial management systems that comply with federal financial management system requirements, federal accounting standards, and the U.S. Government Standard General Ledger at the transaction level. In FY 2014, the Department remained in compliance with FFMIA.
REPORT ON AUDIT FOLLOW-UP
T he Inspector General Act, as amended, requires that the Secretary report to Congress on the final action taken for Inspector General audits. This report covers Commerce Department audit follow-up activities for the period June 1, 2013, through May 31, 2014.
SUMMARY OF ACTIVITY ON AUDIT REPORTSJUNE 1, 2013 THROUGH MAY 31, 2014
DISALLOWED COSTS1FUNDS TO BE PUT TO
BETTER USE2NONMONETARY
REPORTS3 TOTAL
NUMBER OF REPORTS DOLLARS
NUMBER OF REPORTS DOLLARS
NUMBER OF REPORTS REPORTS
Beginning Balance4 32 $46,668,970 8 $65,605,120 25 65
New Reports 16 4,336,874 4 163,515,149 13 33
Total Reports 48 51,005,844 12 229,120,269 37 98
Reports Closed (17) (10,303,653) (4) (5,495,642) (18) (39)
Ending Balance 31 $40,702,191 8 $223,624,627 20 59
1. Disallowed costs are questioned costs that management has sustained or agreed should not be charged to the government. 2. “Funds to be Put to Better Use” are funds that could be used more efficiently if management took action to implement and
complete the recommendation. Audits with “Funds to be Put to Better Use” may be non-federal audits of individual grant awards or performance audits of grant programs or other programs. Thus, the amount of “Funds to be Put to Better Use” among audits can vary widely.
3. Includes management, contract, grant, loan, and financial statement audits with nonmonetary recommendations.4. The beginning balances reflect correction of user entry errors since the last reporting period. Corrective actions are
planned to prevent similar errors in the future.
BIENNIAL REVIEW OF FEES
OMB Circular A-25 Revised, User Charges, requires the biennial review of agency programs to determine whether fees should be charged for government goods or services, and to ascertain that existing charges are adjusted to reflect unanticipated changes in costs or market values.
The Department’s bureaus conduct reviews of its programs at least biennially, with some bureaus conducting annual reviews. The Department is in compliance with the requirement to adjust its fees to meet the Circular A-25 Revised requirement of full-cost recovery for user charges.
FY 20 14 AGENCY F I NANC IAL REPORT | 1 5
M A N A G E M E N T ’ S D I S C U S S I O N A N D A N A L Y S I S
FINANCIAL MANAGEMENT AND ANALYSIS
Under the Secretary’s leadership, the Department is continuing to give the highest priority to providing accurate financial data to its internal and external customers, and to its accountability for all assets. Ensuring that there are strong internal controls throughout the Department remains a priority. The Department has created a financial
management environment that complies with federal laws and regulations and that provides its executives with timely, accurate financial and performance information. This is evidenced with the Department continuing to receive unqualified audit opinions, maintaining a single integrated financial system, and continuing its compliance with the Federal Financial Management Improvement Act (FFMIA).
Highlights of accomplishments for FY 2014 and future initiatives are discussed further below.
FINANCIAL MANAGEMENT SYSTEMS
The Department maintains an FFMIA-compliant financial management system, the Commerce Business Systems (CBS). CBS provides reliable, timely information within a sophisticated security infrastructure. The system is capable of producing both financial and budget reports from information generated within the financial management system. CBS consists of a Core Financial System, including the Commerce Purchase Card System and the Budget and Execution Data Warehouse. CBS is interfaced with the Commerce Standard Acquisition and Reporting System, the U.S. Department of Agriculture’s National Finance Center Payroll System, and the U.S. Department of the Treasury’s (Treasury) Automated Standard Application for Payments (ASAP).
The financial information from CBS is integrated in the Corporate Database for consolidated financial reporting, resulting in a single integrated financial management system. The Corporate Database is a commercial, off-the-shelf software package for consolidating financial data and producing financial reports. The Corporate Database is an integrated solution that provides financial statements and Adjusted Trial Balances reported at the Department, bureau, and Treasury Appropriation/Fund Group level. It also provides the ability to perform data analysis and produce the Department’s footnotes, financial analysis reports, and other additional information required for the government-wide financial statements.
During FY 2014, the Department accomplished the following initiatives:
●● Initiated Planning phase for the Business Application Solutions (BAS) project that will modernize the Department’s financial and business systems;
●● Completed the design, development, and testing of the Six-Digit Standard General Ledger, Accelerated Payments to Small Businesses, Summary Level Transfer, and ASAP modifications to CBS and deployed into production;
●● Completed several technical CBS upgrades, including Fusion Middleware/WebLogic and Single Sign On to Oracle Access Manager upgrade; completed the Oracle Database Migration to 11g and the upgrade of production environment hardware and operating system for the National Oceanic and Atmospheric Administration (NOAA), National Institute of Standards and Technology (NIST), and Census Bureau;
1 6 | FY 20 14 AGENCY F I NANC IAL REPORT
M A N A G E M E N T ’ S D I S C U S S I O N A N D A N A L Y S I S
●● Deployed online dashboards, tools, processes, and standardized templates improving the efficiency, effectiveness, governance, management, and delivery of the Chief Financial Officer and Assistant Secretary for Administration (CFO/ASA) capabilities and services; and
●● Conducted design and development activities for the Department’s Executive Dashboard application. The Executive Dashboard provides a Department-wide, executive-level overview of the Department’s highest priority and highest risk mission and administrative initiatives.
In FY 2015 and beyond, the Department will continue its efforts to enhance its financial systems. The Department plans to accomplish the following:
●● Complete Planning phase and begin Phase I implementation for BAS; and
●● Complete the design, development, and testing of the Governmentwide Treasury Account Symbol Adjusted Trial Balance System (GTAS), Payment Application Modernization, ASAP Phase 2, and Shared Accounting Module modifications to CBS and deploy into production.
FINANCIAL REPORTING AND POLICY
The Department accomplished the following initiatives:
●● Implemented early, effective FY 2014, Federal Accounting Standard Advisory Board (FASAB) Statement of Federal Financial Accounting Standards (SFFAS) 42, Deferred Maintenance and Repairs, Amending Statements of Federal Financial Accounting Standards 6, 14, 29 and 32, to improve the measurement and reporting of deferred maintenance and repairs;
●● Implemented early, effective FY 2014, FASAB SFFAS 44, Accounting for Impairment of General Property, Plant, and Equipment Remaining in Use, which establishes accounting and financial reporting standards for impairment of General Property, Plant, and Equipment (PP&E) remaining in use, except for internal use software;
●● Quarterly financial metrics were compiled, analyzed, and reported to individual bureaus, which also included a status report comparing bureau results with Departmental goals. The results of bureaus’ metrics and any corrective actions needed were discussed at the bureau CFO’s individual monthly meetings;
●● Completed and issued a significant revision of Chapter 7, Administrative Control of Funds, of the Department’s Accounting Principles and Standards Handbook;
●● Each of the Department’s bureaus/reporting entities updated their scheduled improper payment risk assessments covering all programs/activities as required by the Office of Management and Budget (OMB) Circular A-123, Management’s Responsibility for Internal Control, Appendix C, Requirements for Effective Measurement and Remediation of Improper Payments. These improper payment risk assessments of the entity’s programs/activities also include assessments of the control, procurement, and grants management environments, and are now in the continuous process stage of being updated every three years, unless significant changes occur, in which case an assessment will be updated quicker;
FY 20 14 AGENCY F I NANC IAL REPORT | 1 7
M A N A G E M E N T ’ S D I S C U S S I O N A N D A N A L Y S I S
●● A contractor prepared a Statistical Sampling and Estimation Plan for NOAA Disaster Relief Appropriations Act FY 2013 disbursements in order to yield a statistically valid improper payments estimate, and performed FY 2013 disbursements testing in accordance with the plan, which did not identify any improper payments; and
●● Applicable bureaus prepared Credit Management and Debt Collection Plans which set forth their plans for effectively managing credit extension, account servicing, portfolio management, and delinquent debt collection—these plans will be updated at least every five years.
In FY 2015 and beyond, the Department plans to accomplish the following:
●● Complete an analysis of the Department’s capitalization thresholds for General Property, Plant, and Equipment, to determine if existing capitalization thresholds are appropriate or should be revised;
●● Continue to work with Treasury to ensure proper implementation of GTAS effective FY 2015;
●● Complete bureaus’ implementations of reporting Treasury Appropriation Symbols and Business Event Type Codes for each individual transaction for intragovernmental payments, collections, and disbursements; and
●● Prepare biennial Credit Program Reviews for active credit programs.
GRANT MANAGEMENT
Under the CFO/ASA, the Office of Acquisition Management (OAM) is responsible for the Department’s enterprise-wide grants management policy, projects, and oversight. The Department’s focus is to standardize policy and procedures for its grant and cooperative agreement programs in order to strengthen compliance, work toward a single automated grants management system, and enhance/formalize workforce education. Targeted efforts continue to transform the decentralized Department grants management community into an effective and efficient partnership.
In FY 2014, the Department started migrating the Economic Development Administration (EDA) and NIST to NOAA’s Grants Online. Grants Online is designed to facilitate efficiencies through standardized business processes and provide a direct interface to other Departmental systems and with grant recipients. It continues to demonstrate significant success in reducing paperwork, increasing accountability, and simplifying the post award process.
The Department’s Grants Overview revealed the significant backlog of expired and unexpired financial assistance awards that are pending closeout but the recipient organization is no longer in existence or is unresponsive to bureau notifications and requests for information and documentation relative to the closeout of the award. As a result of this team’s efforts, the Policy for the Unilateral Termination and/or Administrative Closeout of Certain Financial Assistance Awards when a Recipient is No longer in Existence or is Unresponsive to Bureau Notifications and Requests for Information was implemented in August 2013. As of July 31, 2014, the implantation of this notice has resulted in 79 of these types of grants being administratively closed and/or terminated.
OAM/Grants Management Division (GMD) is coordinating Department implementation of the requirements of the Omni-circular issued by OMB on December 26, 2013. The Omni-circular requires agencies to modify grant business processes to achieve the President’s goals of streamlining federal programs to establish more efficient and user friendly
18 | FY 20 14 AGENCY F I NANC IAL REPORT
M A N A G E M E N T ’ S D I S C U S S I O N A N D A N A L Y S I S
requirements for Department customers. Pursuant to the requirements of the Omni-circular, OAM/GMD has collaborated with partners in the Department grants community to create an implementation plan that was submitted to OMB in June 2014. Additionally, OAM/GMD is working with General Counsel and grant-making agencies of the Department to make modifications required to align Department financial assistance guidance with the requirements of the Omni-circular.
HUMAN CAPITAL
Both the President and Congress recognize that the federal workforce is central to the delivery of services to the U.S. public. Acknowledging that people are the key to mission accomplishment, Departmental leadership continues to implement and evaluate programs to ensure that there is succession planning in the area of financial management. Internships, leadership development programs, technical training opportunities, telework, and succession plans are used as vehicles for making progress in the recruitment, development, and retention of a highly-skilled and diverse workforce.
In FY 2014, the Department hosted 18 Pathway Program interns as accountants and budget analysts, including three new hires and seven who were converted to permanent positions. Trainees were located within finance and accounting offices in the Bureau of Economic Analysis (BEA), Census Bureau, EDA, the International Trade Administration (ITA), and NIST.
To maintain a highly-skilled financial management workforce, the Department’s retention and succession strategies include the increased use of telework and development of succession plans. In FY 2014, approximately 46 percent of accounting and budgeting employees engaged in telework, which increased from 32 percent in FY 2013. Telework is used by the Department to position itself as an “employer of choice” in attracting qualified employees, facilitating employee work/life balance, increasing employee satisfaction and engagement, and potentially increasing employee productivity. Additionally, the Office of the Secretary’s Office of Financial Management fulfilled its planned action that was incorporated into the FY 2014 CFO/ASA’s Succession Plan.
RECEIVABLES WITH THE PUBLIC AND DEBT COLLECTION MANAGEMENT
The Department provides policies and procedures for the management and collection of non-tax debts owed to Departmental entities in its debt collection regulations, Commerce Debt Collection. This adopts and incorporates all provisions of the Federal Claims Collections Standards (FCCS), which were jointly published by Treasury and the U.S. Department of Justice. The Department’s debt collection regulations supplement FCCS by prescribing procedures, consistent with FCCS, as necessary and appropriate for Departmental debt collection management operations. FCCS clarifies and simplifies federal debt collection procedures and reflects changes under the Debt Collection Improvement Act of 1996 and the General Accounting Office Act of 1996. The Department also provides guidance for debt collection management in its Credit and Debt Management Operating Standards and Procedures Handbook, to ensure that consistent debt collection management practices are established and followed throughout the Department, and to establish and enhance Departmental debt collection management practices.
Applicable bureaus prepared, in 2014, Credit Management and Debt Collection Plans, which set forth their plans for effectively managing credit extension, account servicing, and debt collection management. These plans are updated at least every five years.
FY 20 14 AGENCY F I NANC IAL REPORT | 1 9
M A N A G E M E N T ’ S D I S C U S S I O N A N D A N A L Y S I S
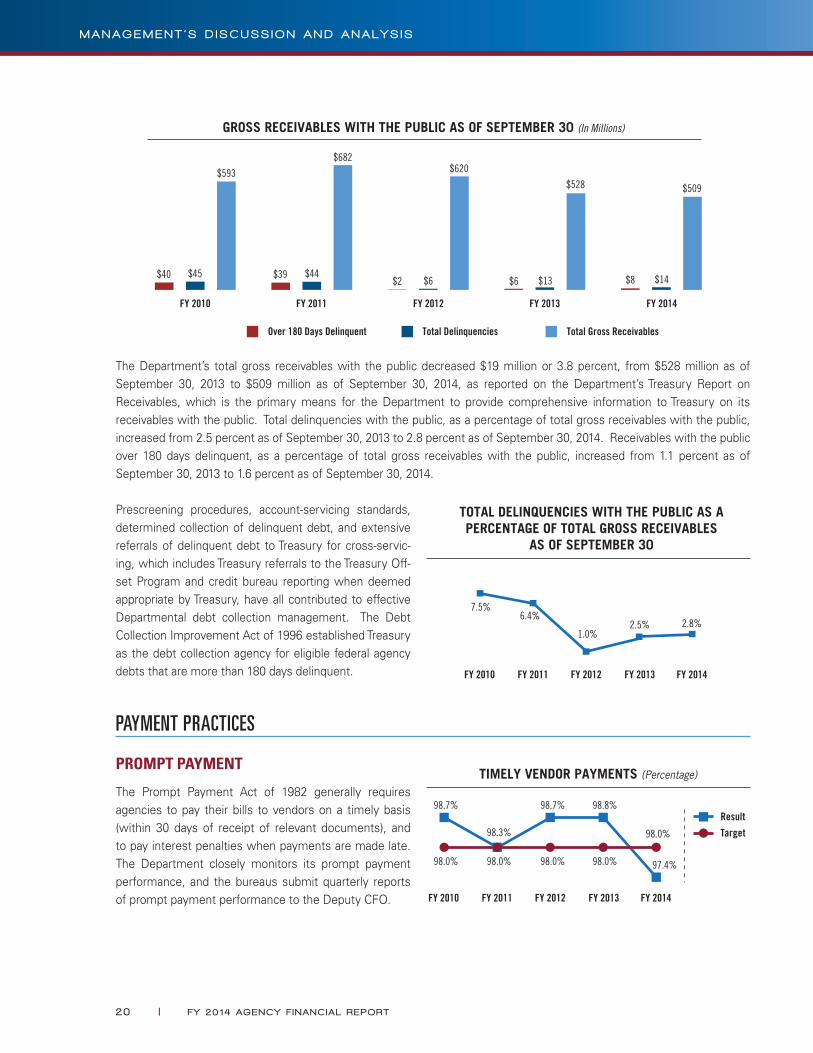
The Department’s total gross receivables with the public decreased $19 million or 3.8 percent, from $528 million as of September 30, 2013 to $509 million as of September 30, 2014, as reported on the Department’s Treasury Report on Receivables, which is the primary means for the Department to provide comprehensive information to Treasury on its receivables with the public. Total delinquencies with the public, as a percentage of total gross receivables with the public, increased from 2.5 percent as of September 30, 2013 to 2.8 percent as of September 30, 2014. Receivables with the public over 180 days delinquent, as a percentage of total gross receivables with the public, increased from 1.1 percent as of September 30, 2013 to 1.6 percent as of September 30, 2014.
Prescreening procedures, account-servicing standards, determined collection of delinquent debt, and extensive referrals of delinquent debt to Treasury for cross-servic-ing, which includes Treasury referrals to the Treasury Off-set Program and credit bureau reporting when deemed appropriate by Treasury, have all contributed to effective Departmental debt collection management. The Debt Collection Improvement Act of 1996 established Treasury as the debt collection agency for eligible federal agency debts that are more than 180 days delinquent.
PAYMENT PRACTICES
PROMPT PAYMENT
The Prompt Payment Act of 1982 generally requires agencies to pay their bills to vendors on a timely basis (within 30 days of receipt of relevant documents), and to pay interest penalties when payments are made late. The Department closely monitors its prompt payment performance, and the bureaus submit quarterly reports of prompt payment performance to the Deputy CFO.
20 | FY 20 14 AGENCY F I NANC IAL REPORT
M A N A G E M E N T ’ S D I S C U S S I O N A N D A N A L Y S I S
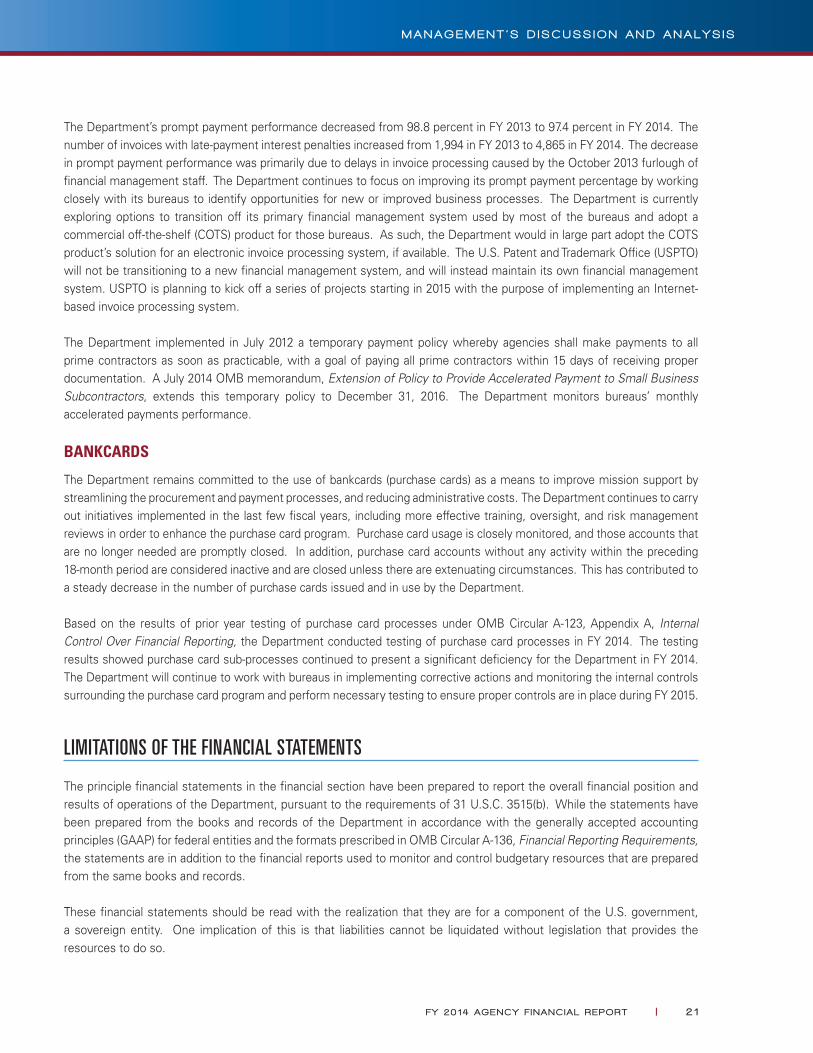
The Department’s prompt payment performance decreased from 98.8 percent in FY 2013 to 97.4 percent in FY 2014. The number of invoices with late-payment interest penalties increased from 1,994 in FY 2013 to 4,865 in FY 2014. The decrease in prompt payment performance was primarily due to delays in invoice processing caused by the October 2013 furlough of financial management staff. The Department continues to focus on improving its prompt payment percentage by working closely with its bureaus to identify opportunities for new or improved business processes. The Department is currently exploring options to transition off its primary financial management system used by most of the bureaus and adopt a commercial off-the-shelf (COTS) product for those bureaus. As such, the Department would in large part adopt the COTS product’s solution for an electronic invoice processing system, if available. The U.S. Patent and Trademark Office (USPTO) will not be transitioning to a new financial management system, and will instead maintain its own financial management system. USPTO is planning to kick off a series of projects starting in 2015 with the purpose of implementing an Internet-based invoice processing system.
The Department implemented in July 2012 a temporary payment policy whereby agencies shall make payments to all prime contractors as soon as practicable, with a goal of paying all prime contractors within 15 days of receiving proper documentation. A July 2014 OMB memorandum, Extension of Policy to Provide Accelerated Payment to Small Business Subcontractors, extends this temporary policy to December 31, 2016. The Department monitors bureaus’ monthly accelerated payments performance.
BANKCARDS
The Department remains committed to the use of bankcards (purchase cards) as a means to improve mission support by streamlining the procurement and payment processes, and reducing administrative costs. The Department continues to carry out initiatives implemented in the last few fiscal years, including more effective training, oversight, and risk management reviews in order to enhance the purchase card program. Purchase card usage is closely monitored, and those accounts that are no longer needed are promptly closed. In addition, purchase card accounts without any activity within the preceding 18-month period are considered inactive and are closed unless there are extenuating circumstances. This has contributed to a steady decrease in the number of purchase cards issued and in use by the Department.
Based on the results of prior year testing of purchase card processes under OMB Circular A-123, Appendix A, Internal Control Over Financial Reporting, the Department conducted testing of purchase card processes in FY 2014. The testing results showed purchase card sub-processes continued to present a significant deficiency for the Department in FY 2014. The Department will continue to work with bureaus in implementing corrective actions and monitoring the internal controls surrounding the purchase card program and perform necessary testing to ensure proper controls are in place during FY 2015.
LIMITATIONS OF THE FINANCIAL STATEMENTS
The principle financial statements in the financial section have been prepared to report the overall financial position and results of operations of the Department, pursuant to the requirements of 31 U.S.C. 3515(b). While the statements have been prepared from the books and records of the Department in accordance with the generally accepted accounting principles (GAAP) for federal entities and the formats prescribed in OMB Circular A-136, Financial Reporting Requirements, the statements are in addition to the financial reports used to monitor and control budgetary resources that are prepared from the same books and records.
These financial statements should be read with the realization that they are for a component of the U.S. government, a sovereign entity. One implication of this is that liabilities cannot be liquidated without legislation that provides the resources to do so.
FY 20 14 AGENCY F I NANC IAL REPORT | 2 1
M A N A G E M E N T ’ S D I S C U S S I O N A N D A N A L Y S I S
ANALYSIS OF FY 2014 FINANCIAL CONDITION AND RESULTS
FINANCIAL HIGHLIGHTS
(Dollars In Thousands)Percentage
Change FY 2014 FY 2013
Condensed Balance Sheets:
As of September 30, 2014 and 2013
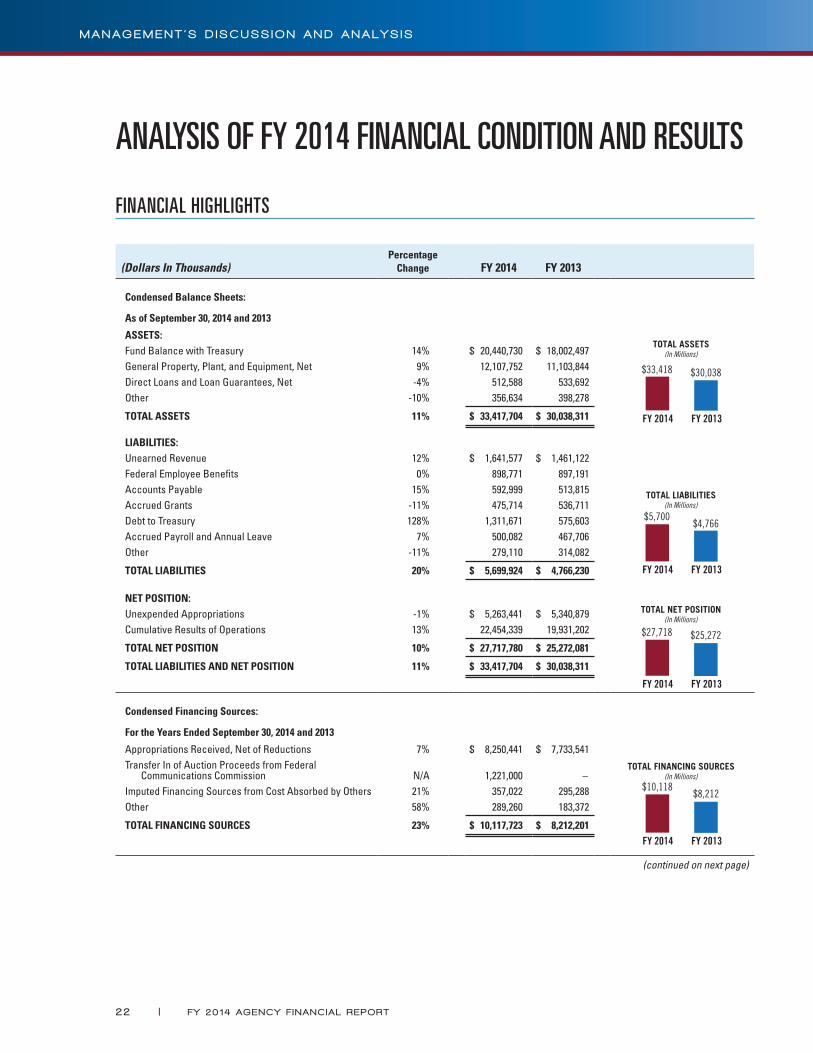
ASSETS:Fund Balance with Treasury 14% $ 20,440,730 $ 18,002,497General Property, Plant, and Equipment, Net 9% 12,107,752 11,103,844Direct Loans and Loan Guarantees, Net -4% 512,588 533,692Other -10% 356,634 398,278
TOTAL ASSETS 11% $ 33,417,704 $ 30,038,311
LIABILITIES:Unearned Revenue 12% $ 1,641,577 $ 1,461,122Federal Employee Benefits 0% 898,771 897,191Accounts Payable 15% 592,999 513,815Accrued Grants -11% 475,714 536,711Debt to Treasury 128% 1,311,671 575,603Accrued Payroll and Annual Leave 7% 500,082 467,706Other -11% 279,110 314,082
TOTAL LIABILITIES 20% $ 5,699,924 $ 4,766,230
NET POSITION:Unexpended Appropriations -1% $ 5,263,441 $ 5,340,879Cumulative Results of Operations 13% 22,454,339 19,931,202
TOTAL NET POSITION 10% $ 27,717,780 $ 25,272,081
TOTAL LIABILITIES AND NET POSITION 11% $ 33,417,704 $ 30,038,311
Condensed Financing Sources:
For the Years Ended September 30, 2014 and 2013
Appropriations Received, Net of Reductions 7% $ 8,250,441 $ 7,733,541Transfer In of Auction Proceeds from Federal
Communications Commission N/A 1,221,000 –
Imputed Financing Sources from Cost Absorbed by Others 21% 357,022 295,288Other 58% 289,260 183,372
TOTAL FINANCING SOURCES 23% $ 10,117,723 $ 8,212,201
(continued on next page)
22 | FY 20 14 AGENCY F I NANC IAL REPORT
M A N A G E M E N T ’ S D I S C U S S I O N A N D A N A L Y S I S
(continued from previous page)
(Dollars In Thousands)Percentage
Change FY 2014 FY 2013
Condensed Statements of Net Cost:
For the Years Ended September 30, 2014 and 2013
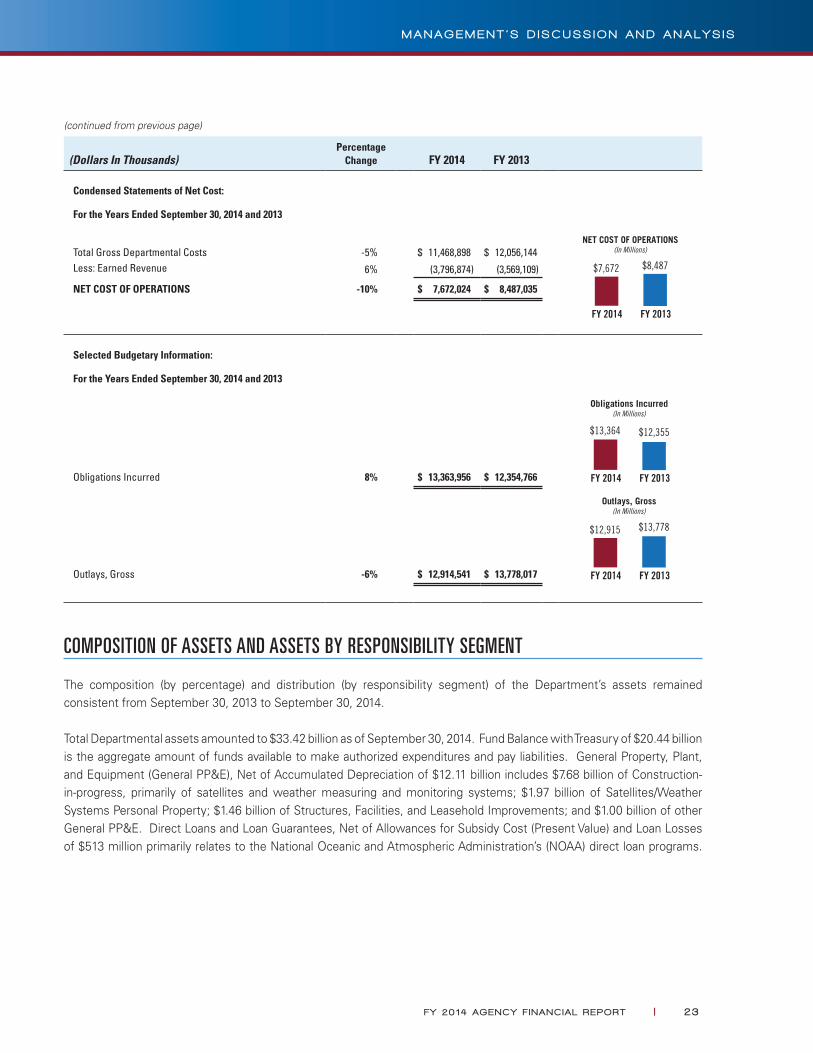
Total Gross Departmental Costs -5% $ 11,468,898 $ 12,056,144Less: Earned Revenue 6% (3,796,874) (3,569,109)
NET COST OF OPERATIONS -10% $ 7,672,024 $ 8,487,035
Selected Budgetary Information:
For the Years Ended September 30, 2014 and 2013
Obligations Incurred 8% $ 13,363,956 $ 12,354,766
Outlays, Gross -6% $ 12,914,541 $ 13,778,017
COMPOSITION OF ASSETS AND ASSETS BY RESPONSIBILITY SEGMENT
The composition (by percentage) and distribution (by responsibility segment) of the Department’s assets remained consistent from September 30, 2013 to September 30, 2014.
Total Departmental assets amounted to $33.42 billion as of September 30, 2014. Fund Balance with Treasury of $20.44 billion is the aggregate amount of funds available to make authorized expenditures and pay liabilities. General Property, Plant, and Equipment (General PP&E), Net of Accumulated Depreciation of $12.11 billion includes $7.68 billion of Construction-in-progress, primarily of satellites and weather measuring and monitoring systems; $1.97 billion of Satellites/Weather Systems Personal Property; $1.46 billion of Structures, Facilities, and Leasehold Improvements; and $1.00 billion of other General PP&E. Direct Loans and Loan Guarantees, Net of Allowances for Subsidy Cost (Present Value) and Loan Losses of $513 million primarily relates to the National Oceanic and Atmospheric Administration’s (NOAA) direct loan programs.
FY 20 14 AGENCY F I NANC IAL REPORT | 23
M A N A G E M E N T ’ S D I S C U S S I O N A N D A N A L Y S I S
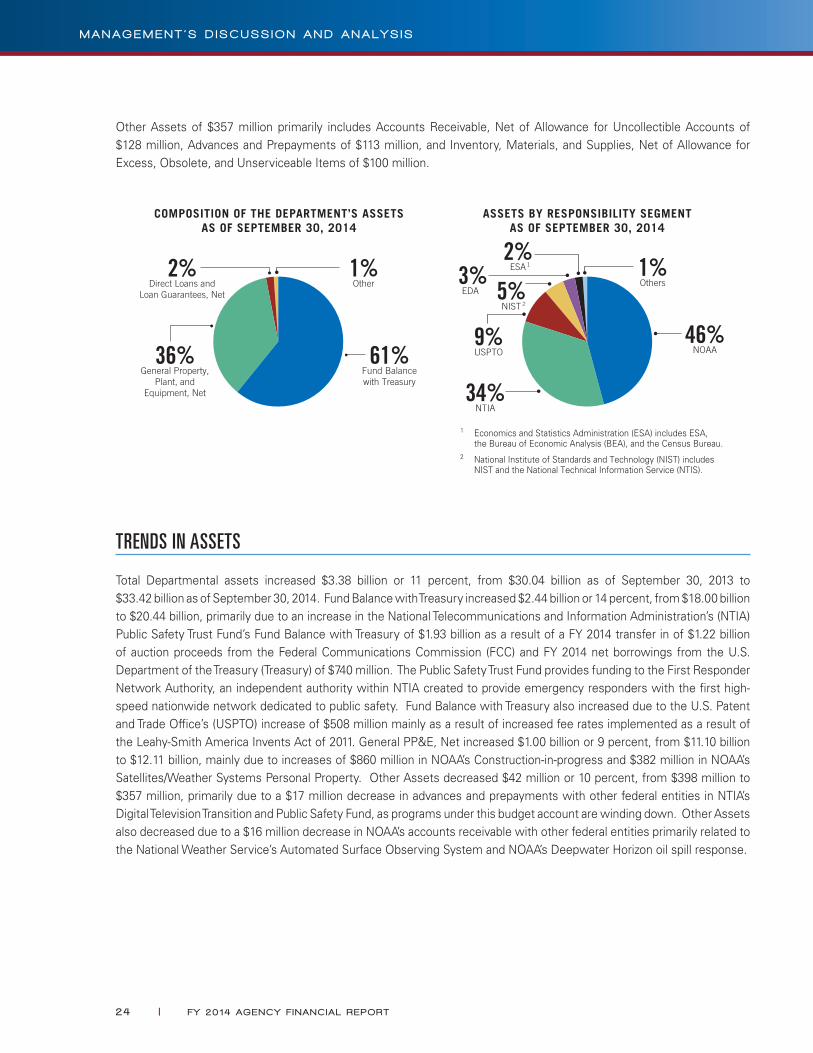
Other Assets of $357 million primarily includes Accounts Receivable, Net of Allowance for Uncollectible Accounts of $128 million, Advances and Prepayments of $113 million, and Inventory, Materials, and Supplies, Net of Allowance for Excess, Obsolete, and Unserviceable Items of $100 million.
TRENDS IN ASSETS
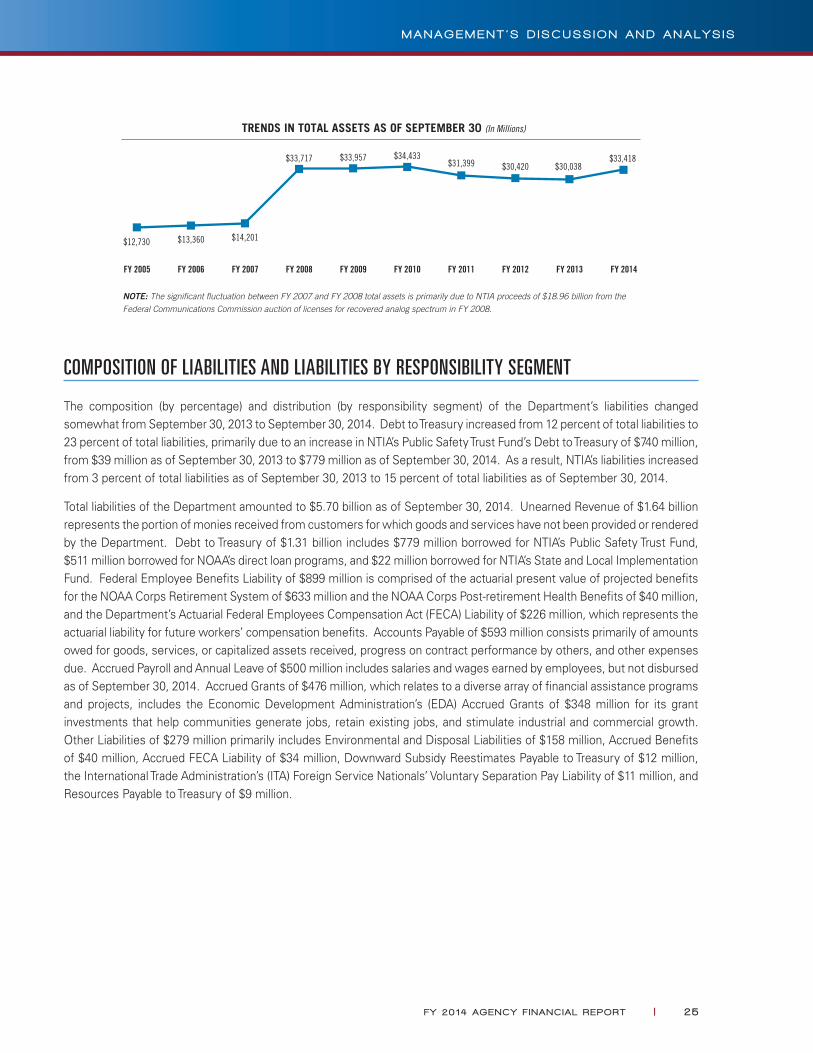
Total Departmental assets increased $3.38 billion or 11 percent, from $30.04 billion as of September 30, 2013 to $33.42 billion as of September 30, 2014. Fund Balance with Treasury increased $2.44 billion or 14 percent, from $18.00 billion to $20.44 billion, primarily due to an increase in the National Telecommunications and Information Administration’s (NTIA) Public Safety Trust Fund’s Fund Balance with Treasury of $1.93 billion as a result of a FY 2014 transfer in of $1.22 billion of auction proceeds from the Federal Communications Commission (FCC) and FY 2014 net borrowings from the U.S. Department of the Treasury (Treasury) of $740 million. The Public Safety Trust Fund provides funding to the First Responder Network Authority, an independent authority within NTIA created to provide emergency responders with the first high-speed nationwide network dedicated to public safety. Fund Balance with Treasury also increased due to the U.S. Patent and Trade Office’s (USPTO) increase of $508 million mainly as a result of increased fee rates implemented as a result of the Leahy-Smith America Invents Act of 2011. General PP&E, Net increased $1.00 billion or 9 percent, from $11.10 billion to $12.11 billion, mainly due to increases of $860 million in NOAA’s Construction-in-progress and $382 million in NOAA’s Satellites/Weather Systems Personal Property. Other Assets decreased $42 million or 10 percent, from $398 million to $357 million, primarily due to a $17 million decrease in advances and prepayments with other federal entities in NTIA’s Digital Television Transition and Public Safety Fund, as programs under this budget account are winding down. Other Assets also decreased due to a $16 million decrease in NOAA’s accounts receivable with other federal entities primarily related to the National Weather Service’s Automated Surface Observing System and NOAA’s Deepwater Horizon oil spill response.
24 | FY 20 14 AGENCY F I NANC IAL REPORT
M A N A G E M E N T ’ S D I S C U S S I O N A N D A N A L Y S I S
COMPOSITION OF LIABILITIES AND LIABILITIES BY RESPONSIBILITY SEGMENT
The composition (by percentage) and distribution (by responsibility segment) of the Department’s liabilities changed somewhat from September 30, 2013 to September 30, 2014. Debt to Treasury increased from 12 percent of total liabilities to 23 percent of total liabilities, primarily due to an increase in NTIA’s Public Safety Trust Fund’s Debt to Treasury of $740 million, from $39 million as of September 30, 2013 to $779 million as of September 30, 2014. As a result, NTIA’s liabilities increased from 3 percent of total liabilities as of September 30, 2013 to 15 percent of total liabilities as of September 30, 2014.
Total liabilities of the Department amounted to $5.70 billion as of September 30, 2014. Unearned Revenue of $1.64 billion represents the portion of monies received from customers for which goods and services have not been provided or rendered by the Department. Debt to Treasury of $1.31 billion includes $779 million borrowed for NTIA’s Public Safety Trust Fund, $511 million borrowed for NOAA’s direct loan programs, and $22 million borrowed for NTIA’s State and Local Implementation Fund. Federal Employee Benefits Liability of $899 million is comprised of the actuarial present value of projected benefits for the NOAA Corps Retirement System of $633 million and the NOAA Corps Post-retirement Health Benefits of $40 million, and the Department’s Actuarial Federal Employees Compensation Act (FECA) Liability of $226 million, which represents the actuarial liability for future workers’ compensation benefits. Accounts Payable of $593 million consists primarily of amounts owed for goods, services, or capitalized assets received, progress on contract performance by others, and other expenses due. Accrued Payroll and Annual Leave of $500 million includes salaries and wages earned by employees, but not disbursed as of September 30, 2014. Accrued Grants of $476 million, which relates to a diverse array of financial assistance programs and projects, includes the Economic Development Administration’s (EDA) Accrued Grants of $348 million for its grant investments that help communities generate jobs, retain existing jobs, and stimulate industrial and commercial growth. Other Liabilities of $279 million primarily includes Environmental and Disposal Liabilities of $158 million, Accrued Benefits of $40 million, Accrued FECA Liability of $34 million, Downward Subsidy Reestimates Payable to Treasury of $12 million, the International Trade Administration’s (ITA) Foreign Service Nationals’ Voluntary Separation Pay Liability of $11 million, and Resources Payable to Treasury of $9 million.
FY 20 14 AGENCY F I NANC IAL REPORT | 25
M A N A G E M E N T ’ S D I S C U S S I O N A N D A N A L Y S I S
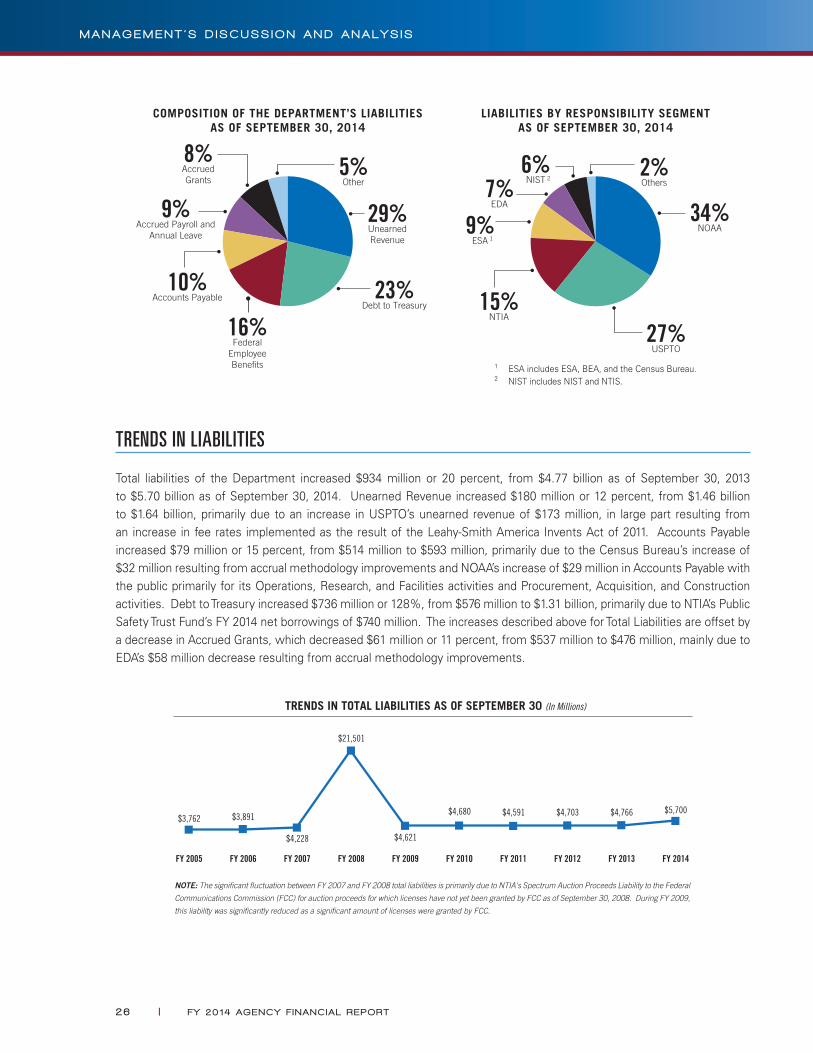
TRENDS IN LIABILITIES
Total liabilities of the Department increased $934 million or 20 percent, from $4.77 billion as of September 30, 2013 to $5.70 billion as of September 30, 2014. Unearned Revenue increased $180 million or 12 percent, from $1.46 billion to $1.64 billion, primarily due to an increase in USPTO’s unearned revenue of $173 million, in large part resulting from an increase in fee rates implemented as the result of the Leahy-Smith America Invents Act of 2011. Accounts Payable increased $79 million or 15 percent, from $514 million to $593 million, primarily due to the Census Bureau’s increase of $32 million resulting from accrual methodology improvements and NOAA’s increase of $29 million in Accounts Payable with the public primarily for its Operations, Research, and Facilities activities and Procurement, Acquisition, and Construction activities. Debt to Treasury increased $736 million or 128%, from $576 million to $1.31 billion, primarily due to NTIA’s Public Safety Trust Fund’s FY 2014 net borrowings of $740 million. The increases described above for Total Liabilities are offset by a decrease in Accrued Grants, which decreased $61 million or 11 percent, from $537 million to $476 million, mainly due to EDA’s $58 million decrease resulting from accrual methodology improvements.
26 | FY 20 14 AGENCY F I NANC IAL REPORT
M A N A G E M E N T ’ S D I S C U S S I O N A N D A N A L Y S I S
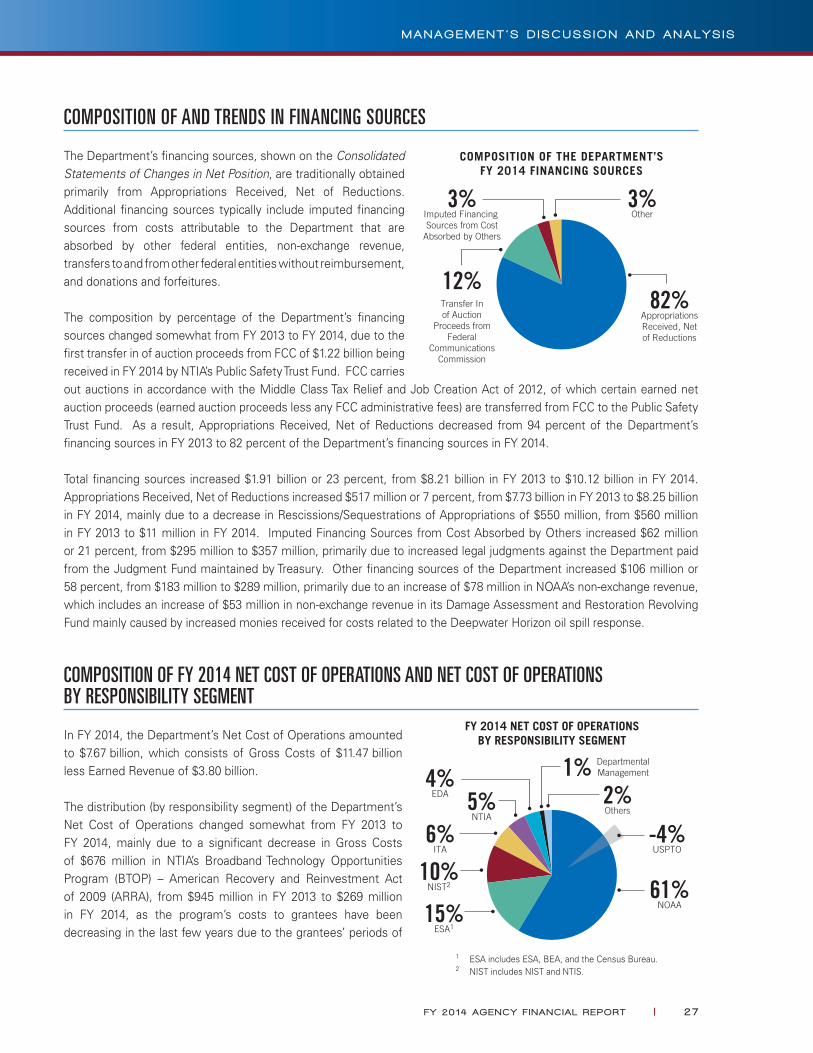
COMPOSITION OF AND TRENDS IN FINANCING SOURCES
The Department’s financing sources, shown on the Consolidated Statements of Changes in Net Position, are traditionally obtained primarily from Appropriations Received, Net of Reductions. Additional financing sources typically include imputed financing sources from costs attributable to the Department that are absorbed by other federal entities, non-exchange revenue, transfers to and from other federal entities without reimbursement, and donations and forfeitures.
The composition by percentage of the Department’s financing sources changed somewhat from FY 2013 to FY 2014, due to the first transfer in of auction proceeds from FCC of $1.22 billion being received in FY 2014 by NTIA’s Public Safety Trust Fund. FCC carries out auctions in accordance with the Middle Class Tax Relief and Job Creation Act of 2012, of which certain earned net auction proceeds (earned auction proceeds less any FCC administrative fees) are transferred from FCC to the Public Safety Trust Fund. As a result, Appropriations Received, Net of Reductions decreased from 94 percent of the Department’s financing sources in FY 2013 to 82 percent of the Department’s financing sources in FY 2014.
Total financing sources increased $1.91 billion or 23 percent, from $8.21 billion in FY 2013 to $10.12 billion in FY 2014. Appropriations Received, Net of Reductions increased $517 million or 7 percent, from $7.73 billion in FY 2013 to $8.25 billion in FY 2014, mainly due to a decrease in Rescissions/Sequestrations of Appropriations of $550 million, from $560 million in FY 2013 to $11 million in FY 2014. Imputed Financing Sources from Cost Absorbed by Others increased $62 million or 21 percent, from $295 million to $357 million, primarily due to increased legal judgments against the Department paid from the Judgment Fund maintained by Treasury. Other financing sources of the Department increased $106 million or 58 percent, from $183 million to $289 million, primarily due to an increase of $78 million in NOAA’s non-exchange revenue, which includes an increase of $53 million in non-exchange revenue in its Damage Assessment and Restoration Revolving Fund mainly caused by increased monies received for costs related to the Deepwater Horizon oil spill response.
COMPOSITION OF FY 2014 NET COST OF OPERATIONS AND NET COST OF OPERATIONS BY RESPONSIBILITY SEGMENT
In FY 2014, the Department’s Net Cost of Operations amounted to $7.67 billion, which consists of Gross Costs of $11.47 billion less Earned Revenue of $3.80 billion.
The distribution (by responsibility segment) of the Department’s Net Cost of Operations changed somewhat from FY 2013 to FY 2014, mainly due to a significant decrease in Gross Costs of $676 million in NTIA’s Broadband Technology Opportunities Program (BTOP) – American Recovery and Reinvestment Act of 2009 (ARRA), from $945 million in FY 2013 to $269 million in FY 2014, as the program’s costs to grantees have been decreasing in the last few years due to the grantees’ periods of
FY 20 14 AGENCY F I NANC IAL REPORT | 27
M A N A G E M E N T ’ S D I S C U S S I O N A N D A N A L Y S I S
performance being in the later stages. As a result, NTIA’s Net Cost of Operations decreased from 12 percent of total Net Cost of Operations in FY 2013 to 5 percent of total Net Cost of Operations in FY 2014.
Note: The Gross Costs and Earned Revenue amounts presented in the following paragraphs include transactions with other Departmental entities (intra-Departmental transactions).
NOAA’s FY 2014 Net Cost of Operations was $4.67 billion (Gross Costs of $4.91 billion less Earned Revenue of $234 million). NOAA’s mission relates to science, service, and stewardship—to understand and predict changes in climate, weather, oceans, and coasts; to share that knowledge and information with others; and to conserve and manage coastal and marine ecosystems and resources. NOAA’s Gross Costs include costs related to improving weather, water quality, and climate reporting and forecasting; and enabling informed decision-making through an expanded understanding of the U.S. economy, society, and environment by providing data, standards, and services. NOAA also develops and procures satellite systems, aircraft, and ships to provide information to determine weather patterns and predict weather forecasts. Gross Costs also support NOAA’s efforts to promote economically-sound environmental stewardship and science, including developing sustainable and resilient fisheries, habitats, and species; supporting climate adaption and mitigation; and supporting coastal communities that are environmentally and economically sustainable.
USPTO’s FY 2014 Net Cost of Operations of $(286) million (Gross Costs of $2.73 billion less Earned Revenue of $3.02 billion) relates to its patents and trademark programs. USPTO is the federal agency for granting U.S. patents and registering trademarks. The strength and vitality of the U.S. economy depends directly on effective mechanisms that protect new ideas and investments in innovation and creativity. USPTO advises the President, the Secretary of Commerce, and U.S. government agencies on intellectual property (IP) policy, protection, and enforcement; and promotes the stronger and more effective IP protection around the world. USPTO furthers effective IP protection for U.S. innovators and entrepreneurs worldwide by working with other federal agencies to secure strong IP provisions in free trade and other international agreements. It also provides training, education, and capacity building programs designed to foster respect for IP and encourage the development of strong IP enforcement regimes by U.S. trading partners.
The Economics and Statistics Administration’s (ESA) FY 2014 Net Cost of Operations was $1.14 billion (Gross Costs of $1.41 billion less Earned Revenue of $268 million), which includes ESA, the Bureau of Economic Analysis (BEA), and Census Bureau. ESA plays three key roles within the Department. ESA provides timely economic analysis, disseminates national economic indicators, and oversees BEA and the Census Bureau. BEA promotes a better understanding of the U.S. economy by providing timely, relevant, and accurate economic accounts data in an objective and cost-effective manner. The Census Bureau’s FY 2014 Net Cost of Operations was $1.04 billion (Gross Costs of $1.30 billion less Earned Revenue of $264 million). The Census Bureau serves as the leading source of quality data about the Nation’s people and economy. Data the Census Bureau collects includes the Population and Housing Census (every 10 years), Economic Census (every 5 years), Census of Governments (every 5 years), American Community Survey (annually), demographic and economic surveys provided to survey sponsors, and economic indicators.
The National Institute of Standards and Technology’s (NIST) FY 2014 Net Cost of Operations was $775 million (Gross Costs of $1.04 billion less Earned Revenue of $263 million), which includes NIST and the National Technical Information Service (NTIS). NIST’s FY 2014 Net Cost of Operations was $777 million (Gross Costs of $926 million less Earned Revenue of $148 million). NIST promotes U.S. innovation and industrial competitiveness by advancing measurement science, standards, and technology in ways that enhance economic security and improve the Nation’s quality of life. NIST’s Gross Costs include costs for its NIST Laboratories program. The NIST Laboratories conducts world-class research, often in close collaboration with industry, which advances the Nation’s technology infrastructure and helps U.S. companies continually improve products and services. NTIS serves as the largest central resource for government-funded scientific, technical, engineering, and
28 | FY 20 14 AGENCY F I NANC IAL REPORT
M A N A G E M E N T ’ S D I S C U S S I O N A N D A N A L Y S I S

business related information available today. For more than 60 years, NTIS has assured businesses, universities, and the public timely access to approximately 3 million publications covering over 350 subject areas. NTIS promotes the Nation’s economic growth by providing access to information that stimulates innovation and discovery.
ITA’s FY 2014 Net Cost of Operations was $459 million (Gross Costs of $481 million less Earned Revenue of $21 million). ITA strengthens the competitiveness of U.S. industry, promotes trade and investment, and ensures fair trade through the rigorous enforcement of the Nation’s trade laws and agreements. ITA works to improve the global business environment and helps U.S. organizations compete at home and abroad. ITA supports the President’s recovery agenda and the National Export Initiative to sustain economic growth and support American jobs.
NTIA’s FY 2014 Net Cost of Operations was $371 million (Gross Costs of $410 million less Earned Revenue of $39 million). NTIA is the federal agency that is principally responsible for advising the President on telecommunications and information policy issues. NTIA’s programs and policymaking focus largely on expanding broadband Internet access and adoption in America, expanding the use of spectrum by all users, and ensuring that the Internet remains an engine for continued innovation and economic growth. NTIA’s activities include managing the federal use of spectrum and identifying additional spectrum for commercial use, and administering grant programs that further the deployment and use of broadband and other technologies in America.
EDA’s FY 2014 Net Cost of Operations was $296 million (Gross Costs of $298 million less Earned Revenue of $3 million). EDA leads the federal economic development agenda by promoting innovation and competitiveness, preparing American regions for growth and success in the worldwide economy. EDA plays a critical role in fostering regional economic development efforts in communities across the nation. Through strategic investments that foster job creation and attract private investment, EDA supports development in economically distressed areas of the U.S. EDA works directly with local economic development officials to make grant investments that are well-defined, timely, and linked to a long-term, sustainable economic development strategy.
FY 2014 Net Cost of Operations for Departmental Management (DM) was $110 million (Gross Costs of $344 million less Earned Revenue of $234 million), which includes Gifts and Bequests, Herbert C. Hoover Building Renovation Project, Office of Inspector General, Salaries and Expenses, and Working Capital Fund. DM’s objective is to develop and provide policies and procedures for administrative planning, oversight, coordination, direction, and guidance to ensure implementation of the Department’s mission.
FY 2014 Net Cost of Operations for the other Departmental bureaus was $132 million (Gross Costs of $134 million less Earned Revenue of $2 million), which is comprised of the Bureau of Industry and Security (BIS) and the Minority Business Development Agency (MBDA). BIS advances U.S. national security, foreign policy, and economic objectives by ensuring an effective export control and treaty compliance system and promoting continued U.S. strategic technology leadership. MBDA helps to create and sustain U.S. jobs by promoting the growth and global competitiveness of businesses owned and operated by minority entrepeneurs.
TRENDS IN NET COST OF OPERATIONS
The Department’s Net Cost of Operations decreased by $815 million or 10 percent, from $8.49 billion in FY 2013 to $7.67 billion in FY 2014. Total Gross Departmental Costs decreased by $587 million or 5 percent, from $12.06 billion in FY 2013 to $11.47 billion in FY 2014. The decrease in Gross Costs was mainly due to a significant decrease in Gross Costs of $676 million in NTIA’s BTOP – ARRA as previously described in the Composition of FY 2014 Net Cost of Operations and Net Cost of Operations by Responsibility Segment section above. The Department’s Earned Revenue increased by
FY 20 14 AGENCY F I NANC IAL REPORT | 29
M A N A G E M E N T ’ S D I S C U S S I O N A N D A N A L Y S I S
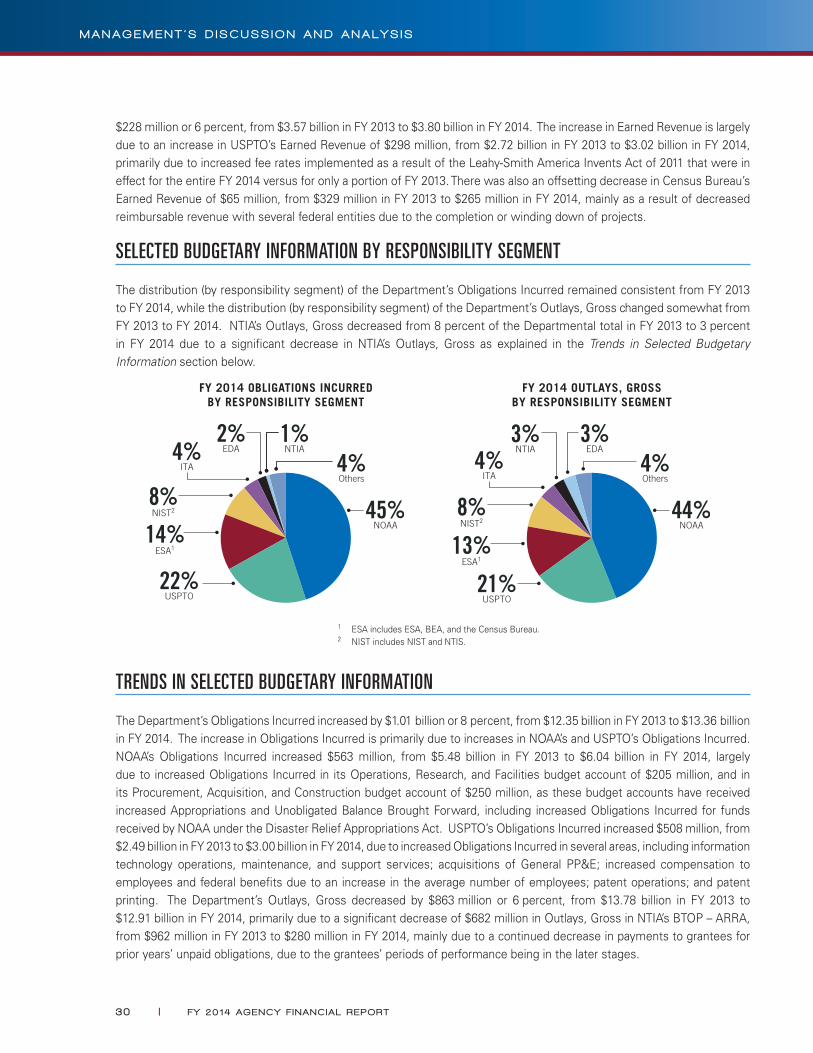
$228 million or 6 percent, from $3.57 billion in FY 2013 to $3.80 billion in FY 2014. The increase in Earned Revenue is largely due to an increase in USPTO’s Earned Revenue of $298 million, from $2.72 billion in FY 2013 to $3.02 billion in FY 2014, primarily due to increased fee rates implemented as a result of the Leahy-Smith America Invents Act of 2011 that were in effect for the entire FY 2014 versus for only a portion of FY 2013. There was also an offsetting decrease in Census Bureau’s Earned Revenue of $65 million, from $329 million in FY 2013 to $265 million in FY 2014, mainly as a result of decreased reimbursable revenue with several federal entities due to the completion or winding down of projects.
SELECTED BUDGETARY INFORMATION BY RESPONSIBILITY SEGMENT
The distribution (by responsibility segment) of the Department’s Obligations Incurred remained consistent from FY 2013 to FY 2014, while the distribution (by responsibility segment) of the Department’s Outlays, Gross changed somewhat from FY 2013 to FY 2014. NTIA’s Outlays, Gross decreased from 8 percent of the Departmental total in FY 2013 to 3 percent in FY 2014 due to a significant decrease in NTIA’s Outlays, Gross as explained in the Trends in Selected Budgetary Information section below.
TRENDS IN SELECTED BUDGETARY INFORMATION
The Department’s Obligations Incurred increased by $1.01 billion or 8 percent, from $12.35 billion in FY 2013 to $13.36 billion in FY 2014. The increase in Obligations Incurred is primarily due to increases in NOAA’s and USPTO’s Obligations Incurred. NOAA’s Obligations Incurred increased $563 million, from $5.48 billion in FY 2013 to $6.04 billion in FY 2014, largely due to increased Obligations Incurred in its Operations, Research, and Facilities budget account of $205 million, and in its Procurement, Acquisition, and Construction budget account of $250 million, as these budget accounts have received increased Appropriations and Unobligated Balance Brought Forward, including increased Obligations Incurred for funds received by NOAA under the Disaster Relief Appropriations Act. USPTO’s Obligations Incurred increased $508 million, from $2.49 billion in FY 2013 to $3.00 billion in FY 2014, due to increased Obligations Incurred in several areas, including information technology operations, maintenance, and support services; acquisitions of General PP&E; increased compensation to employees and federal benefits due to an increase in the average number of employees; patent operations; and patent printing. The Department’s Outlays, Gross decreased by $863 million or 6 percent, from $13.78 billion in FY 2013 to $12.91 billion in FY 2014, primarily due to a significant decrease of $682 million in Outlays, Gross in NTIA’s BTOP – ARRA, from $962 million in FY 2013 to $280 million in FY 2014, mainly due to a continued decrease in payments to grantees for prior years’ unpaid obligations, due to the grantees’ periods of performance being in the later stages.
30 | FY 20 14 AGENCY F I NANC IAL REPORT
M A N A G E M E N T ’ S D I S C U S S I O N A N D A N A L Y S I S
SUMMARY OF STEWARDSHIP INFORMATION
STEWARDSHIP ASSETS
The Department has certain resources entrusted to it and certain stewardship responsibilities it assumes. The physical properties of Stewardship Assets resemble those of the General Property, Plant, and Equipment that is capitalized traditionally in the financial statements of federal entities. Given the nature of these assets, federal
standard-setting bodies have determined that valuation is unduly burdensome and matching costs with specific periods is not meaningful. Therefore, federal accounting standards require the disclosure of the nature and quantity of these assets. The National Oceanic and Atmospheric Administration (NOAA) is the primary bureau within the Department that maintains Stewardship Assets, while the National Institute of Standards and Technology (NIST) and the Census Bureau also maintains Stewardship Assets.
NOAA maintains the following Stewardship Assets: Heritage Assets (Galveston Laboratory; National Marine Fisheries Service (NMFS) St. George Sealing Plant; NMFS Cottage M, St. George; NMFS St. Paul Old Clinic/Hospital; NMFS Aquarium; and Great Lakes Environmental Research Laboratory, Lake Michigan Field Station); 13 National Marine Sanctuaries; 4 Marine National Monuments (Marianas Trench, Pacific Remote Islands, Rose Atoll, and Papahãnaumokuãkea); Aleutian Islands Habitat Conservation Area; NOAA Habitat Blueprint (7 Habitat Focus Areas); and Collection-type Heritage Assets, primarily included in the NOAA Central Library (mainly books, journals, publications, photographs, and motion pictures) and Thunder Bay Sanctuary Research Collection (data cards, photograph negatives, document copies, photographs, books, and other items).
NIST maintains Collection-type Heritage Assets under its Museum and History Program, which collects, preserves, and exhibits artifacts, such as scientific instruments, equipment, objects, and records of significance to NIST and predecessor agencies. The Census Bureau maintains Collection-type Heritage Assets that help illustrate the social, educational, and cultural heritage of the Census Bureau, including artifacts, artwork, books, films, instruments, records, publications, manuscripts, photographs, and maps.
STEWARDSHIP INVESTMENTS
Stewardship investments are substantial investments made by the federal government for the benefit of the Nation, but are not physical assets owned by the federal government. Though treated as expenses when incurred to determine the Department’s Net Cost of Operations, these items merit special treatment, so that users of federal financial reports know the extent of investments that are made for the long-term benefit of the Nation.
Investments in Non-federal Physical Property: These investments are for the purchase, construction, or major renovation of physical property owned by state and local governments. The Economic Development Administration (EDA) and NOAA have significant investments in non-federal physical property. EDA’s investments in FY 2014 totaled $266 million and included its Public Works program ($114 million), Disaster Recovery ($99 million), Economic Adjustment Assistance program ($42 million), and Global Climate Change Mitigation Incentive Fund ($11 million). NOAA’s investments in FY 2014 totaled $2 million and included the National Estuarine Research Reserves ($1 million) and the Coastal and Estuarine Land Conservation Program ($1 million).
FY 20 14 AGENCY F I NANC IAL REPORT | 3 1
M A N A G E M E N T ’ S D I S C U S S I O N A N D A N A L Y S I S

Investments in Human Capital: These investments are for education and training programs that are intended to increase or maintain national economic productive capacity and produce outputs and outcomes that provide evidence of the constant or increasing national productive capacity. These investments exclude education and training expenses for federal civilian and military personnel. The most significant investments in human capital are by NOAA, whose investments in FY 2014 totaled $23 million and included the Educational Partnership Program ($14 million), the Ernest F. Hollings Undergraduate Scholarship Program ($6 million), the National Sea Grant College Program ($1 million), the National Estuarine Research Reserve Program ($1 million), and the Southeast Fisheries Science Center’s Recruiting Training Research Program ($1 million).
Investments in Research and Development (R&D): These investments include investments in basic research, applied research, and development, which are made with the expectation of maintaining or increasing national economic productive capacity, or yielding other future economic or societal benefits. The only significant investments in R&D are by NIST and NOAA. NIST’s investments in FY 2014 totaled $665 million, and included $658 million for its NIST Laboratories Program and $7 million for its Technology Innovation Program. NOAA’s investments in FY 2014 totaled $460 million, which included Environmental and Climate ($294 million), Fisheries ($43 million), Marine Operations and Maintenance and Aircraft Services ($30 million), Weather Service ($29 million), and Other ($64 million).
32 | FY 20 14 AGENCY F I NANC IAL REPORT
M A N A G E M E N T ’ S D I S C U S S I O N A N D A N A L Y S I S

Financial Section
MESSAGE FROM THE CHIEF FINANCIAL OFFICER
This FY 2014 Agency Financial Report provides financial and high-level program performance information to enable the Department’s stakeholders to understand and evaluate the Department’s achievements relative to its mission and resources. The Department is committed to operational excellence, with a focus on providing outstanding service to
our customers. This includes providing the public with highlights of our performance, and detailed financial information. This report also fulfills several statutory requirements, including the Reports Consolidation Act of 2000, the Chief Financial Officers Act, the Federal Managers’ Financial Integrity Act (FMFIA), and the Government Management Reform Act.
For FY 2014, the Department achieved an unmodified audit opinion for the sixteenth consecutive year. The Department was able to eliminate the significant deficiency related to the accounting for property at the National Oceanic and Atmospheric Administration. However, while making progress towards its elimination, the Department continues to have a significant deficiency relating to needed improvement in Department-wide information technology (IT), relating to segregation of duties, access controls, and configuration management. The Department also received a significant deficiency related to improvements needed in the accounting for the Economic Development Administration’s accrued grants. We will continue to take corrective actions to strengthen controls to our accrued grants and IT areas in FY 2015.
The Department will continue enhancing financial and non-financial controls under FMFIA and Office of Management and Budget (OMB) Circular A-123. The Department has provided an unqualified statement of assurance that its internal controls and financial management systems meet the objectives of FMFIA, and that internal controls operated effectively.
The Department’s leadership continues its commitment to improving the capacity to deliver our mission with customer focused outcomes. This starts with our most important assets—our people. The Department’s employees are committed to the Commerce mission and public service, and leadership is committed to engaging and empowering them to maximize their talents through continuous learning, collaboration, and innovation.
This includes providing an up-to-date work environment and IT services that support collaboration amongst our employees in order to unleash their potential and creativity to solve common challenges. The Department’s headquarters, the Herbert C. Hoover Building, is undergoing a critical renovation that will support this environment. Our Office of the Chief Information Officer is modernizing our tools to enable best-in-class service through enterprise solutions, while also safeguarding against cyber threats.
The Department’s management is also committed to looking at more efficient and effective ways to manage our processes as an enterprise for our key services. This includes using data to better manage for results and exploring opportunities for increased collaboration. This will not only allow for improved service delivery, but also smarter and more efficient, effective use of taxpayer resources.
Ellen HerbstChief Financial Officer and Assistant Secretary for AdministrationNovember 14, 2014
34 | FY 20 14 AGENCY F I NANC IAL REPORT

F I N A N C I A L S E C T I O N
independent
auditorS’ report
November 14, 2014 INFORMATION MEMORANDUM FOR THE SECRETARY
FROM: Todd J. Zinser SUBJECT: Department of Commerce FY 2014 Consolidated Financial
Statements—Final Report No. OIG-15-008-A
I am pleased to provide you with the attached audit report, which presents an unmodified opinion on the Department of Commerce’s FY 2014 consolidated financial statements. KPMG LLP, an independent public accounting firm, performed the audit in accordance with U.S. generally accepted government auditing standards and Office of Management and Budget Bulletin 14-02, Audit Requirements for Federal Financial Statements.
In its audit of the Department, KPMG
determined that the financial statements were fairly presented in all material respects and in conformity with U.S. generally accepted accounting principles;
identified two significant deficiencies in internal control over financial reporting related to the Department’s information technology controls and accounting for Economic Development Administration’s accrued grants, which were not considered to be material weaknesses;
identified a reportable instance of noncompliance with the Antideficiency Act, at the Census Bureau, and three potential Antideficiency Act compliance matters currently under review; and
found no instances in which the Department’s financial management systems did not substantially comply with the requirements of the Federal Financial Management Improvement Act of 1996.
Todd J. Zinser
36 | FY 20 14 AGENCY F I NANC IAL REPORT
I N D E P E N D E N T A U D I T O R S ’ R E P O R T
My office oversaw the audit performance. We reviewed KPMG’s report and related documentation and made inquiries of its representatives. Our review disclosed no instances where KPMG did not comply, in all material respects, with U.S. generally accepted government auditing standards. However, our review— as differentiated from an audit in accordance with these standards—was not intended to enable us to express, and we do not express, any opinion on the Department’s consolidated financial statements, conclusions about the effectiveness of internal control, or conclusions on compliance with laws, regulations, contracts, and grant agreements. KPMG is solely responsible for the attached audit report, dated November 14, 2014, and the conclusions expressed in it.
We appreciate the cooperation and courtesies extended to KPMG during the audit.
Attachment
FY 20 14 AGENCY F I NANC IAL REPORT | 37
I N D E P E N D E N T A U D I T O R S ’ R E P O R T
Independent Auditors’ Report
Inspector General, U.S. Department of Commerce and Secretary, U.S. Department of Commerce:
Report on the Financial Statements
We have audited the accompanying consolidated financial statements of the U.S. Department of Commerce (Department), which comprise the consolidated balance sheets as of September 30, 2014 and 2013, and the related consolidated statements of net cost and changes in net position, and combined statements of budgetary resources for the years then ended, and the related notes to the consolidated financial statements.
Management’s Responsibility for the Financial Statements
Management is responsible for the preparation and fair presentation of these consolidated financial statements in accordance with U.S. generally accepted accounting principles; this includes the design, implementation, and maintenance of internal control relevant to the preparation and fair presentation of consolidated financial statements that are free from material misstatement, whether due to fraud or error.
Auditors’ Responsibility
Our responsibility is to express an opinion on these consolidated financial statements based on our audits. We conducted our audits in accordance with auditing standards generally accepted in the United States of America; the standards applicable to financial audits contained in Government Auditing Standards issued by the Comptroller General of the United States; and Office of Management and Budget (OMB) Bulletin No. 14-02, Audit Requirements for Federal Financial Statements. Those standards and OMB Bulletin No. 14-02 require that we plan and perform the audit to obtain reasonable assurance about whether the consolidated financial statements are free from material misstatement.
An audit involves performing procedures to obtain audit evidence about the amounts and disclosures in the consolidated financial statements. The procedures selected depend on the auditors’ judgment, including the assessment of the risks of material misstatement of the consolidated financial statements, whether due to fraud or error. In making those risk assessments, the auditor considers internal control relevant to the entity’s preparation and fair presentation of the consolidated financial statements in order to design audit procedures that are appropriate in the circumstances, but not for the purpose of expressing an opinion on the effectiveness of the entity’s internal control. Accordingly, we express no such opinion. An audit also includes evaluating the appropriateness of accounting policies used and the reasonableness of significant accounting estimates made by management, as well as evaluating the overall presentation of the consolidated financial statements.
We believe that the audit evidence we have obtained is sufficient and appropriate to provide a basis for our audit opinion.
KPMG LLPSuite 120001801 K Street, NWWashington, DC 20006
KPMG LLP is a Delaware limited liability partnership, the U.S. member firm of KPMG International Cooperative (“KPMG International”), a Swiss entity.
38 | FY 20 14 AGENCY F I NANC IAL REPORT
I N D E P E N D E N T A U D I T O R S ’ R E P O R T
U.S. Department of Commerce Independent Auditors’ Report November 14, 2014 Page 2 of 8
Opinion on the Financial Statements
In our opinion, the consolidated financial statements referred to above present fairly, in all material respects, the financial position of the U.S. Department of Commerce as of September 30, 2014 and 2013, and its net costs, changes in net position, and budgetary resources for the years then ended in accordance with U.S. generally accepted accounting principles.
Other Matters
Required Supplementary Information
U.S. generally accepted accounting principles require that the information in the Management’s Discussion and Analysis (including the Financial Management and Analysis section), Required Supplementary Information, and Required Supplementary Stewardship Information sections be presented to supplement the basic consolidated financial statements. Such information, although not a part of the basic consolidated financial statements, is required by the Federal Accounting Standards Advisory Board who considers it to be an essential part of financial reporting for placing the basic consolidated financial statements in an appropriate operational, economic, or historical context. We have applied certain limited procedures to the required supplementary information in accordance with auditing standards generally accepted in the United States of America, which consisted of inquiries of management about the methods of preparing the information and comparing the information for consistency with management’s responses to our inquiries, the basic consolidated financial statements, and other knowledge we obtained during our audits of the basic consolidated financial statements. We do not express an opinion or provide any assurance on the information because the limited procedures do not provide us with sufficient evidence to express an opinion or provide any assurance.
Other Information
Our audits were conducted for the purpose of forming an opinion on the basic consolidated financial statements as a whole. The information in the Message from Secretary Pritzker, the How to Use this Report section, the Message from the Chief Financial Officer, the Analysis of FY 2014 Financial Condition and Results section, the Other Information section, and the Appendices are presented for purposes of additional analysis and are not a required part of the basic consolidated financial statements. Such information has not been subjected to the auditing procedures applied in the audits of the basic consolidated financial statements, and accordingly, we do not express an opinion or provide any assurance on it.
Other Reporting Required by Government Auditing Standards
Internal Control Over Financial Reporting
In planning and performing our audit of the consolidated financial statements as of and for the year ended September 30, 2014, we considered the Department’s internal control over financial reporting (internal control) to determine the audit procedures that are appropriate in the circumstances for the purpose of expressing our opinion on the consolidated financial statements, but not for the purpose of expressing an opinion on the effectiveness of the Department’s internal control. Accordingly, we do not express an opinion on the effectiveness of the Department’s internal control. We did not test all internal controls relevant to operating objectives as broadly defined by the Federal Managers’ Financial Integrity Act of 1982.
FY 20 14 AGENCY F I NANC IAL REPORT | 39
I N D E P E N D E N T A U D I T O R S ’ R E P O R T
U.S. Department of Commerce Independent Auditors’ Report November 14, 2014 Page 3 of 8
A deficiency in internal control exists when the design or operation of a control does not allow management or employees, in the normal course of performing their assigned functions, to prevent, or detect and correct, misstatements on a timely basis. A material weakness is a deficiency, or a combination of deficiencies, in internal control, such that there is a reasonable possibility that a material misstatement of the entity’s financial statements will not be prevented, or detected and corrected, on a timely basis. A significant deficiency is a deficiency, or a combination of deficiencies, in internal control that is less severe than a material weakness, yet important enough to merit attention by those charged with governance.
Our consideration of internal control was for the limited purpose described in the first paragraph of this section and was not designed to identify all deficiencies in internal control that might be material weaknesses or significant deficiencies and therefore, material weaknesses or significant deficiencies may exist that were not identified. Given these limitations, during our audit we did not identify any deficiencies in internal control that we consider to be material weaknesses. However, we did identify certain deficiencies in internal control, described below and in more detail in Exhibit I that we consider to be significant deficiencies.
Information technology (IT) access, configuration management and segregation of duties controls need improvement. During fiscal year 2014, while we noted continued progress towards remediating the prior year significant deficiency, the underlying control deficiencies relating to systems access, configuration management, and segregation of duties continue to require improvement. Specifically, the Department needs to continue making improvements in its general IT controls to fully ensure that financial data processed on the Department’s systems has integrity, is securely maintained, and is available only to authorized users.
Accounting for Economic Development Administration (EDA) accrued grants needs improvement. During fiscal year 2014, the National Oceanic and Atmospheric Administration (NOAA), one of EDA’s service providers, worked with EDA to refine the EDA grant accrual estimation methodology. However, NOAA and EDA did not establish an effective review process to ensure that the underlying data and assumptions in the grant accrual methodology are appropriate and the overall calculation is accurate. EDA needs to continue making improvements in the calculation and review of the EDA accrued grants.
Compliance and Other Matters
As part of obtaining reasonable assurance about whether the Department’s consolidated financial statements are free from material misstatement, we performed tests of its compliance with certain provisions of laws, regulations, contracts, and grant agreements, noncompliance with which could have a direct and material effect on the determination of financial statement amounts, and certain provisions of other laws and regulations specified in OMB Bulletin No. 14-02. However, providing an opinion on compliance with those provisions was not an objective of our audit, and accordingly, we do not express such an opinion. The results of our tests disclosed instances of noncompliance or other matters that are required to be reported under Government Auditing Standards or OMB Bulletin No. 14-02 and which are described below.
Antideficiency Act - During our fiscal year 2014 financial statement audit, the Department informed us that it had reached a conclusion that the U.S. Census Bureau’s obligation of FY 2011
40 | FY 20 14 AGENCY F I NANC IAL REPORT
I N D E P E N D E N T A U D I T O R S ’ R E P O R T

U.S. Department of Commerce Independent Auditors’ Report November 14, 2014 Page 4 of 8
funds in advance of their appropriation in the amount of $262,000 was an ADA violation. The obligations were charged to an incorrect fund code, which at the time had not received an appropriation. Accordingly, the Department has reported this violation of the Antideficiency Act, as required by Sections 1351 and 1517(b) of Title 31, of the United States Code.
Other Matters: The Department also informed us of potential Antideficiency Act compliance matters that are being reviewed by the Department’s Office of the Secretary and the Department’s Office of General Counsel as follows: (i) potential incorrect use of budgetary funding sources to support its programs; (ii) accepting terms of agreement on purchases made through the internet; and, (iii) an indemnification clause. Because these reviews are not complete, the ultimate outcomes of these potential matters are not presently known.
We also performed tests of its compliance with certain provisions referred to in Section 803(a) of the Federal Financial Management Improvement Act of 1996 (FFMIA). Providing an opinion on compliance with FFMIA was not an objective of our audit, and accordingly, we do not express such an opinion. The results of our tests of FFMIA disclosed no instances in which the Department’s financial management systems did not substantially comply with the: (1) Federal financial management systems requirements, (2) applicable Federal accounting standards, and (3) the United States Government Standard General Ledger at the transaction level.
The Department’s Responses to Findings
The Department’s responses to the findings identified in our audit are described in Exhibit I. The Department’s responses were not subjected to the auditing procedures applied in the audit of the consolidated financial statements and, accordingly, we express no opinion on the responses.
Purpose of the Other Reporting Required by Government Auditing Standards
The purpose of the communication described in the Other Reporting Required by Government Auditing Standards section is solely to describe the scope of our testing of internal control and compliance and the result of that testing, and not to provide an opinion on the effectiveness of the Department’s internal control or compliance. Accordingly, this communication is not suitable for any other purpose.
November 14, 2014
FY 20 14 AGENCY F I NANC IAL REPORT | 4 1
I N D E P E N D E N T A U D I T O R S ’ R E P O R T
U.S. Department of Commerce Independent Auditors’ Report November 14, 2014 Page 5 of 8
Exhibit I – Significant Deficiencies A. Information Technology Access, Configuration Management and Segregation of Duties Controls Need Improvement Information security is recognized as a top management challenge for the Department. For several years, the Department’s Office of Inspector General, and departmental self-assessments have identified weaknesses in the Department’s general information technology (IT) controls. During our FY 2014 financial statement audit, DOC implemented corrective actions to address the prior year deficiencies. However, the timing of implementation of the actions and remaining steps continue to indicate areas of improvement. Accordingly, we identified repeat deficiencies during fiscal year 2014 that continue to require management’s attention regarding the Department’s general IT controls related to financial systems. The general IT controls that we consider to be, collectively, a significant deficiency under standards issued by the American Institute of Certified Public Accountants and Government Auditing Standards, and our related findings, are as follows: Access controls. In close concert with an organization’s entity-wide information security program,
access controls for general support systems and applications should provide reasonable assurance that computer resources such as data files, application programs, and computer-related facilities and equipment are protected against unauthorized modification, disclosure, or loss. Access controls are facilitated by an organization’s entity-wide security program. Such controls include physical controls, such as keeping computers in locked rooms to limit physical access, and logical controls, such as security software programs designed to prevent or detect unauthorized access to data. Similar to security management, inadequate access controls diminish the reliability and integrity of computerized data and increase the risk of destruction or inappropriate disclosure of information.
The objectives of limiting access are to ensure that users have only the access needed to perform their duties; that access to sensitive resources, such as security software programs, is limited to few individuals; and that employees are restricted from performing incompatible functions or duties beyond their responsibility. This is reiterated by Federal guidelines. For example, the OMB Circular A-130 and supporting National Institute of Standards and Technology publications provide guidance related to the maintenance of technical access controls. In addition, the Department’s IT Security Program Policy contains requirements for operating Department IT devices in a secure manner.
We noted that access controls should be improved, primarily in the areas of: 1) reviewing user accounts to appropriately disable and recertify financial system, database and operating system accounts, 2) strengthening password controls, 3) ensuring compliance with audit log review requirements, 4) enforcing multi-factor authentication, and 5) improving incident response reporting. We recognize that the Department and its bureaus have certain compensating controls in place to help reduce the risk of the identified weaknesses, and we considered those compensating controls as part of our overall consolidated financial statement audit.
42 | FY 20 14 AGENCY F I NANC IAL REPORT
I N D E P E N D E N T A U D I T O R S ’ R E P O R T
U.S. Department of Commerce Independent Auditors’ Report November 14, 2014 Page 6 of 8
Exhibit I – Significant Deficiencies, continued Configuration management. Configuration management involves the identification and management
of security features for all hardware, software, and firmware components of an information system at a given point and systematically controls configuration changes throughout the system’s life cycle. Configuration settings and the related configuration management is a key component of many IT systems to ensure that hardware, software and firmware programs, and program modifications are properly authorized, tested, and approved, and that access to and distribution of programs is carefully controlled. Configuration settings may affect the design, implementation and/or operating effectiveness of application controls and may be subject to change control procedures to maintain the integrity of the application controls. Without proper controls, there is a risk that security features could be inadvertently or deliberately omitted or turned off, or that processing irregularities or malicious code could be introduced into the IT environment.
We noted that configuration management controls should be improved, primarily in the areas of: 1) enhancing policy and procedures for the review of certain code files over key financial statement areas, and 2) addressing patch and configuration management vulnerabilities. We recognize that the Department and its bureaus have certain compensating controls in place to help reduce the risk of the identified weaknesses, and we considered those compensating controls as part of our overall consolidated financial statement audit.
Segregation of Duties. A subset of internal control objectives is the safeguarding of assets, which
includes controls over segregation of duties to minimize opportunities for individuals to be in a position to both perpetrate and conceal errors or fraud in the normal course of operations. Responsibilities for authorizing transactions, recording transactions, and maintaining custody of assets should be assigned to different individuals. Key areas of concern from an IT perspective involve duties among major operating and programming activities, including duties performed by users, application programmers, and data center staff. Policies outlining individual responsibilities should be documented, communicated, and enforced. Proper segregation of duties requires effective supervision and review by management, as well as formal operating procedures.
We noted that segregation of duties controls should be improved, primarily in the area of appropriately segregating duties within the production environment. We recognize that the Department and its bureau identified certain compensating controls in place to help reduce the risk of the identified weaknesses, and we considered those compensating controls as part of our overall consolidated financial statement audit.
Recommendations We provided the Department specific recommendations to improve its general IT control related to financial systems in a separate limited distribution general IT controls report, issued as part of the fiscal year 2014 consolidated financial statement audit. The Department should monitor bureau actions to ensure effective implementation of our recommendations and to ensure continued compliance with the Federal Financial Management Improvement Act of 1996.
FY 20 14 AGENCY F I NANC IAL REPORT | 43
I N D E P E N D E N T A U D I T O R S ’ R E P O R T
U.S. Department of Commerce Independent Auditors’ Report November 14, 2014 Page 7 of 8
Exhibit I – Significant Deficiencies, continued Management’s Response The Department concurs. We will develop corrective action plans and ensure timely implementation to address KPMG’s recommendations. B. Accounting for EDA Accrued Grants Needs Improvement Based on our prior year findings, NOAA, one of EDA’s service providers, worked with EDA to refine the EDA grant accrual estimation methodology. All of the programs were analyzed individually, with the exception of grants related to disaster relief grant programs, which were analyzed collectively. NOAA and EDA determined that the spending patterns of the disaster relief grant programs vary and it would be best to estimate the grant accrual by grouping the grant programs in homogenous pools/categories. However, EDA, in coordination with NOAA, did not establish an effective review process to ensure that the underlying data and assumptions in the grant accrual methodology are appropriate and the overall calculation is accurate. Specifically, we noted that: In some instances, the grant accrual amount calculated exceeded the undelivered order balance in the
general ledger for certain fund code/ fiscal years, resulting in an overstatement of $55.1 million. Seven instances where the disbursement activity was incorrectly included in the grant accrual
calculation, instead of the undelivered order activity. Based on our analysis of the average disbursement frequency of EDA’s grants, the year-end grant
accrual may be overstated by $146 million. Subsequent to our review and inquiry, management performed a similar analysis but disaggregated the average disbursement frequency by award, year, and type of activity and estimated the potential overstatement to be $54.7 million. We were unable to test the underlying data associated with this estimate as management’s analysis was not received timely.
We do not believe that the financial statements are materially misstated as a result of these errors. However, improvements are needed in the calculation and review of EDA’s accrued grants. Management is performing further analysis to determine what actions are needed to improve the accrual process for future years. Recommendations We recommend that EDA: 1. Finance and grant program offices, with the assistance of NOAA, identify and document the nature of
the spending patterns of the grant programs, other grant program trends, changes in grant programs
44 | FY 20 14 AGENCY F I NANC IAL REPORT
I N D E P E N D E N T A U D I T O R S ’ R E P O R T
U.S. Department of Commerce Independent Auditors’ Report November 14, 2014 Page 8 of 8
Exhibit I – Significant Deficiencies, continued and other relevant factors to develop EDA’s grant accrual methodology.
2. Test the completeness and accuracy of the underlying data used to determine the grant accrual. 3. Develop and implement policies requiring an EDA reviewer, with the assistance of NOAA, to:
Agree each of the inputs and data from the accrual methodology to appropriate supporting documentation.
Compare the accrual to other program information, such as grant obligations, undelivered orders, grant expenses, frequency and time period of grant disbursements.
Compare actual results to estimates to demonstrate accuracy of the methodology. Verify the mathematical accuracy of the grant accrual calculation.
4. Require reviewer(s) to document the procedures performed to review the grant accrual methodology, the assumptions used, and the reasonableness of the results.
5. Implement a process for monitoring and validating the accrual subsequent to the end of the reporting period.
6. Review the actions performed by NOAA, on behalf of EDA, related to the EDA grant accrual. Management’s Response
The Department concurs. We will develop corrective action plans and ensure timely implementation to address KPMG’s recommendations.
FY 20 14 AGENCY F I NANC IAL REPORT | 45
I N D E P E N D E N T A U D I T O R S ’ R E P O R T

46 | FY 20 14 AGENCY F I NANC IAL REPORT
I N D E P E N D E N T A U D I T O R S ’ R E P O R T

F I N A N C I A L S E C T I O N
principal
Financial
StatementS
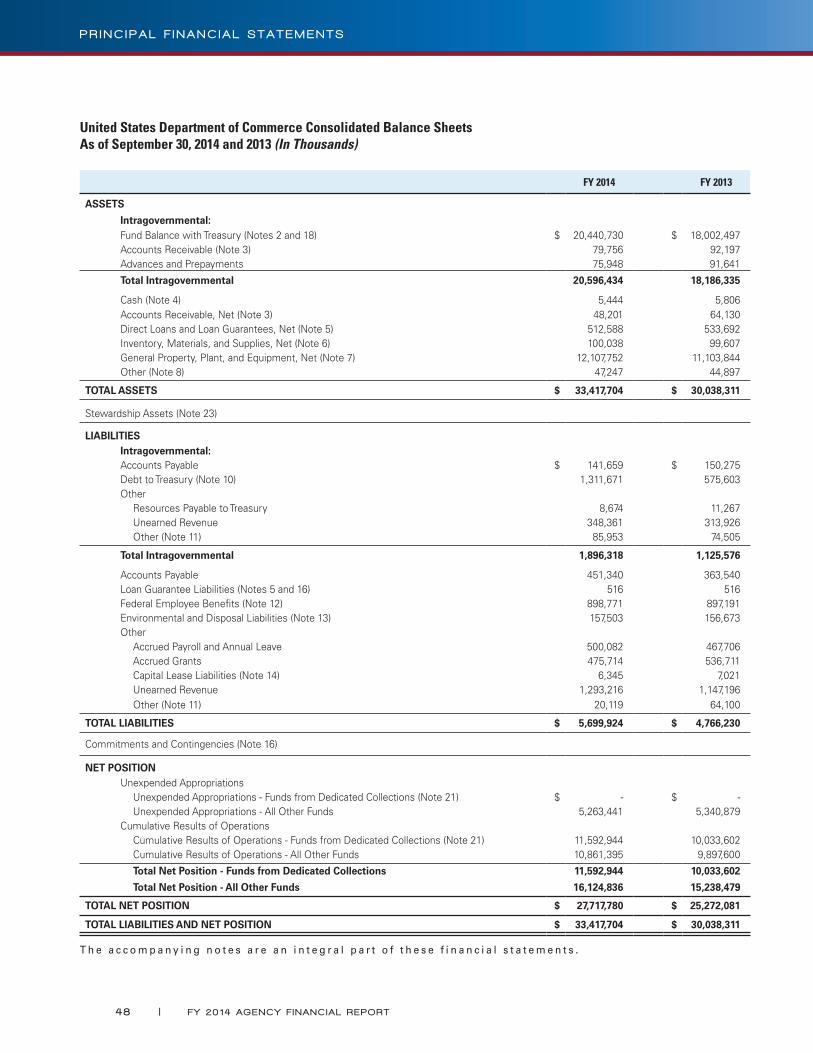
United States Department of Commerce Consolidated Balance SheetsAs of September 30, 2014 and 2013 (In Thousands)
FY 2014 FY 2013
ASSETS
Intragovernmental:Fund Balance with Treasury (Notes 2 and 18) $ 20,440,730 $ 18,002,497Accounts Receivable (Note 3) 79,756 92,197Advances and Prepayments 75,948 91,641
Total Intragovernmental 20,596,434 18,186,335
Cash (Note 4) 5,444 5,806Accounts Receivable, Net (Note 3) 48,201 64,130Direct Loans and Loan Guarantees, Net (Note 5) 512,588 533,692Inventory, Materials, and Supplies, Net (Note 6) 100,038 99,607General Property, Plant, and Equipment, Net (Note 7) 12,107,752 11,103,844Other (Note 8) 47,247 44,897
TOTAL ASSETS $ 33,417,704 $ 30,038,311
Stewardship Assets (Note 23)
LIABILITIESIntragovernmental:Accounts Payable $ 141,659 $ 150,275Debt to Treasury (Note 10) 1,311,671 575,603Other Resources Payable to Treasury 8,674 11,267 Unearned Revenue 348,361 313,926 Other (Note 11) 85,953 74,505
Total Intragovernmental 1,896,318 1,125,576
Accounts Payable 451,340 363,540 Loan Guarantee Liabilities (Notes 5 and 16) 516 516 Federal Employee Benefits (Note 12) 898,771 897,191 Environmental and Disposal Liabilities (Note 13) 157,503 156,673 Other Accrued Payroll and Annual Leave 500,082 467,706 Accrued Grants 475,714 536,711 Capital Lease Liabilities (Note 14) 6,345 7,021 Unearned Revenue 1,293,216 1,147,196 Other (Note 11) 20,119 64,100
TOTAL LIABILITIES $ 5,699,924 $ 4,766,230
Commitments and Contingencies (Note 16)
NET POSITION Unexpended Appropriations Unexpended Appropriations - Funds from Dedicated Collections (Note 21) $ - $ - Unexpended Appropriations - All Other Funds 5,263,441 5,340,879Cumulative Results of Operations Cumulative Results of Operations - Funds from Dedicated Collections (Note 21) 11,592,944 10,033,602 Cumulative Results of Operations - All Other Funds 10,861,395 9,897,600
Total Net Position - Funds from Dedicated Collections 11,592,944 10,033,602
Total Net Position - All Other Funds 16,124,836 15,238,479
TOTAL NET POSITION $ 27,717,780 $ 25,272,081
TOTAL LIABILITIES AND NET POSITION $ 33,417,704 $ 30,038,311
T h e a c c o m p a n y i n g n o t e s a r e a n i n t e g r a l p a r t o f t h e s e f i n a n c i a l s t a t e m e n t s .
48 | FY 20 14 AGENCY F I NANC IAL REPORT
P R I N C I P A L F I N A N C I A L S T A T E M E N T S
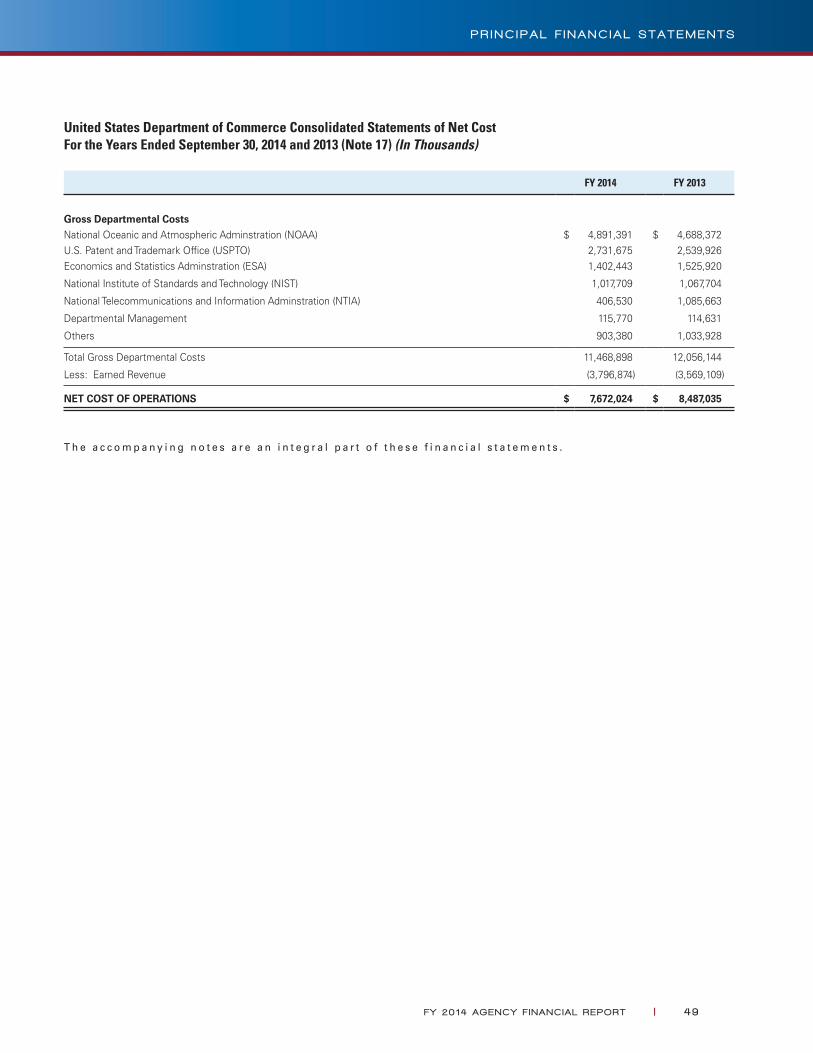
United States Department of Commerce Consolidated Statements of Net CostFor the Years Ended September 30, 2014 and 2013 (Note 17) (In Thousands)
FY 2014 FY 2013
Gross Departmental CostsNational Oceanic and Atmospheric Adminstration (NOAA) $ 4,891,391 $ 4,688,372U.S. Patent and Trademark Office (USPTO) 2,731,675 2,539,926Economics and Statistics Adminstration (ESA) 1,402,443 1,525,920
National Institute of Standards and Technology (NIST) 1,017,709 1,067,704
National Telecommunications and Information Adminstration (NTIA) 406,530 1,085,663
Departmental Management 115,770 114,631
Others 903,380 1,033,928
Total Gross Departmental Costs 11,468,898 12,056,144
Less: Earned Revenue (3,796,874) (3,569,109)
NET COST OF OPERATIONS $ 7,672,024 $ 8,487,035
T h e a c c o m p a n y i n g n o t e s a r e a n i n t e g r a l p a r t o f t h e s e f i n a n c i a l s t a t e m e n t s .
FY 20 14 AGENCY F I NANC IAL REPORT | 49
P R I N C I P A L F I N A N C I A L S T A T E M E N T S
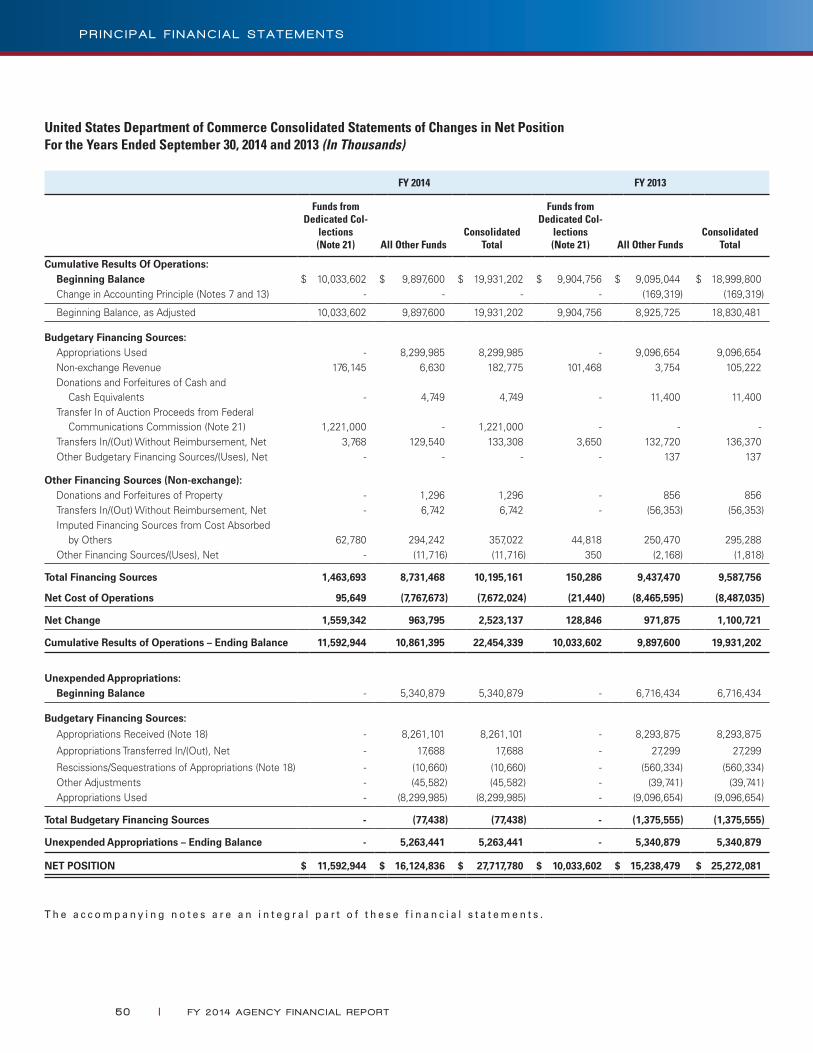
United States Department of Commerce Consolidated Statements of Changes in Net Position For the Years Ended September 30, 2014 and 2013 (In Thousands)
FY 2014 FY 2013
Funds from Dedicated Col-
lections(Note 21) All Other Funds
Consolidated Total
Funds from Dedicated Col-
lections(Note 21)
All Other Funds
Consolidated Total
Cumulative Results Of Operations: Beginning Balance $ 10,033,602 $ 9,897,600 $ 19,931,202 $ 9,904,756 $ 9,095,044 $ 18,999,800 Change in Accounting Principle (Notes 7 and 13) - - - - (169,319) (169,319)
Beginning Balance, as Adjusted 10,033,602 9,897,600 19,931,202 9,904,756 8,925,725 18,830,481
Budgetary Financing Sources: Appropriations Used - 8,299,985 8,299,985 - 9,096,654 9,096,654 Non-exchange Revenue 176,145 6,630 182,775 101,468 3,754 105,222 Donations and Forfeitures of Cash and Cash Equivalents - 4,749 4,749 - 11,400 11,400 Transfer In of Auction Proceeds from Federal Communications Commission (Note 21) 1,221,000
- 1,221,000 - -
-
Transfers In/(Out) Without Reimbursement, Net 3,768 129,540 133,308 3,650 132,720 136,370 Other Budgetary Financing Sources/(Uses), Net - - - - 137 137
Other Financing Sources (Non-exchange): Donations and Forfeitures of Property - 1,296 1,296 - 856 856 Transfers In/(Out) Without Reimbursement, Net - 6,742 6,742 - (56,353) (56,353) Imputed Financing Sources from Cost Absorbed by Others 62,780 294,242 357,022 44,818 250,470 295,288 Other Financing Sources/(Uses), Net - (11,716) (11,716) 350 (2,168) (1,818)
Total Financing Sources 1,463,693 8,731,468 10,195,161 150,286 9,437,470 9,587,756
Net Cost of Operations 95,649 (7,767,673) (7,672,024) (21,440) (8,465,595) (8,487,035)
Net Change 1,559,342 963,795 2,523,137 128,846 971,875 1,100,721
Cumulative Results of Operations – Ending Balance 11,592,944 10,861,395 22,454,339 10,033,602 9,897,600 19,931,202
Unexpended Appropriations: Beginning Balance - 5,340,879 5,340,879 - 6,716,434 6,716,434
Budgetary Financing Sources:
Appropriations Received (Note 18) - 8,261,101 8,261,101 - 8,293,875 8,293,875
Appropriations Transferred In/(Out), Net - 17,688 17,688 - 27,299 27,299
Rescissions/Sequestrations of Appropriations (Note 18) - (10,660) (10,660) - (560,334) (560,334) Other Adjustments - (45,582) (45,582) - (39,741) (39,741) Appropriations Used - (8,299,985) (8,299,985) - (9,096,654) (9,096,654)
Total Budgetary Financing Sources - (77,438) (77,438) - (1,375,555) (1,375,555)
Unexpended Appropriations – Ending Balance - 5,263,441 5,263,441 - 5,340,879 5,340,879
NET POSITION $ 11,592,944 $ 16,124,836 $ 27,717,780 $ 10,033,602 $ 15,238,479 $ 25,272,081
T h e a c c o m p a n y i n g n o t e s a r e a n i n t e g r a l p a r t o f t h e s e f i n a n c i a l s t a t e m e n t s .
50 | FY 20 14 AGENCY F I NANC IAL REPORT
P R I N C I P A L F I N A N C I A L S T A T E M E N T S
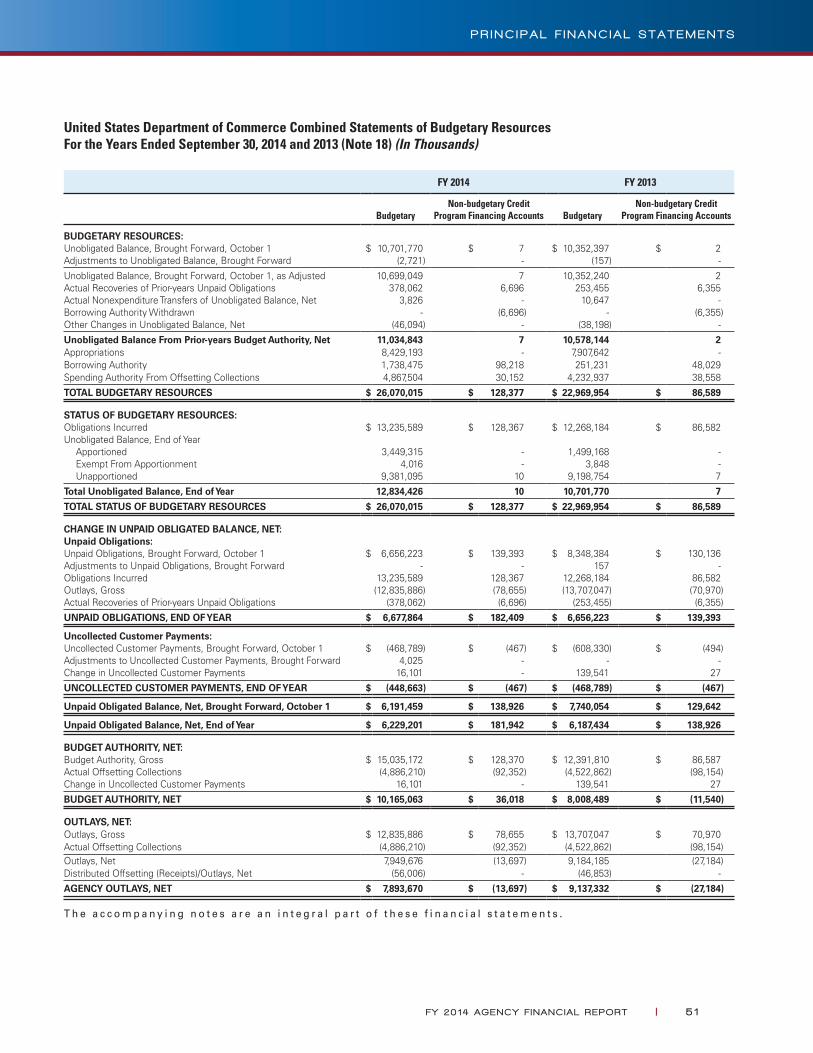
United States Department of Commerce Combined Statements of Budgetary Resources For the Years Ended September 30, 2014 and 2013 (Note 18) (In Thousands)
FY 2014 FY 2013
BudgetaryNon-budgetary Credit
Program Financing Accounts BudgetaryNon-budgetary Credit
Program Financing Accounts
BUDGETARY RESOURCES:Unobligated Balance, Brought Forward, October 1 $ 10,701,770 $ 7 $ 10,352,397 $ 2Adjustments to Unobligated Balance, Brought Forward (2,721) - (157) -
Unobligated Balance, Brought Forward, October 1, as Adjusted 10,699,049 7 10,352,240 2Actual Recoveries of Prior-years Unpaid Obligations 378,062 6,696 253,455 6,355Actual Nonexpenditure Transfers of Unobligated Balance, Net 3,826 - 10,647 -Borrowing Authority Withdrawn - (6,696) - (6,355)Other Changes in Unobligated Balance, Net (46,094) - (38,198) -
Unobligated Balance From Prior-years Budget Authority, Net 11,034,843 7 10,578,144 2Appropriations 8,429,193 - 7,907,642 -Borrowing Authority 1,738,475 98,218 251,231 48,029Spending Authority From Offsetting Collections 4,867,504 30,152 4,232,937 38,558
TOTAL BUDGETARY RESOURCES $ 26,070,015 $ 128,377 $ 22,969,954 $ 86,589
STATUS OF BUDGETARY RESOURCES:Obligations Incurred $ 13,235,589 $ 128,367 $ 12,268,184 $ 86,582Unobligated Balance, End of Year Apportioned 3,449,315 - 1,499,168 - Exempt From Apportionment 4,016 - 3,848 - Unapportioned 9,381,095 10 9,198,754 7
Total Unobligated Balance, End of Year 12,834,426 10 10,701,770 7
TOTAL STATUS OF BUDGETARY RESOURCES $ 26,070,015 $ 128,377 $ 22,969,954 $ 86,589
CHANGE IN UNPAID OBLIGATED BALANCE, NET:Unpaid Obligations:Unpaid Obligations, Brought Forward, October 1 $ 6,656,223 $ 139,393 $ 8,348,384 $ 130,136Adjustments to Unpaid Obligations, Brought Forward - - 157 -Obligations Incurred 13,235,589 128,367 12,268,184 86,582Outlays, Gross (12,835,886) (78,655) (13,707,047) (70,970)Actual Recoveries of Prior-years Unpaid Obligations (378,062) (6,696) (253,455) (6,355)
UNPAID OBLIGATIONS, END OF YEAR $ 6,677,864 $ 182,409 $ 6,656,223 $ 139,393
Uncollected Customer Payments: Uncollected Customer Payments, Brought Forward, October 1 $ (468,789) $ (467) $ (608,330) $ (494)Adjustments to Uncollected Customer Payments, Brought Forward 4,025 - - -Change in Uncollected Customer Payments 16,101 - 139,541 27
UNCOLLECTED CUSTOMER PAYMENTS, END OF YEAR $ (448,663) $ (467) $ (468,789) $ (467)
Unpaid Obligated Balance, Net, Brought Forward, October 1 $ 6,191,459 $ 138,926 $ 7,740,054 $ 129,642
Unpaid Obligated Balance, Net, End of Year $ 6,229,201 $ 181,942 $ 6,187,434 $ 138,926
BUDGET AUTHORITY, NET:Budget Authority, Gross $ 15,035,172 $ 128,370 $ 12,391,810 $ 86,587Actual Offsetting Collections (4,886,210) (92,352) (4,522,862) (98,154)Change in Uncollected Customer Payments 16,101 - 139,541 27
BUDGET AUTHORITY, NET $ 10,165,063 $ 36,018 $ 8,008,489 $ (11,540)
OUTLAYS, NET:Outlays, Gross $ 12,835,886 $ 78,655 $ 13,707,047 $ 70,970Actual Offsetting Collections (4,886,210) (92,352) (4,522,862) (98,154)Outlays, Net 7,949,676 (13,697) 9,184,185 (27,184)Distributed Offsetting (Receipts)/Outlays, Net (56,006) - (46,853) -
AGENCY OUTLAYS, NET $ 7,893,670 $ (13,697) $ 9,137,332 $ (27,184)
T h e a c c o m p a n y i n g n o t e s a r e a n i n t e g r a l p a r t o f t h e s e f i n a n c i a l s t a t e m e n t s .
FY 20 14 AGENCY F I NANC IAL REPORT | 5 1
P R I N C I P A L F I N A N C I A L S T A T E M E N T S

52 | FY 20 14 AGENCY F I NANC IAL REPORT
P R I N C I P A L F I N A N C I A L S T A T E M E N T S
F I N A N C I A L S E C T I O N
noteS to the Financial StatementS
NOTES TO THE FINANCIAL STATEMENTS(All Tables are Presented in Thousands Unless Otherwise Stated)
NOTE 1. SUMMARY OF SIGNIFICANT ACCOUNTING POLICIES
A Reporting Entity
The Department of Commerce (the Department) is a cabinet-level agency of the Executive Branch of the U.S. government. Established in 1903 to promote U.S. business and trade, the Department’s broad range of responsibilities includes predicting the weather, granting patents and registering trademarks, measuring economic growth, gathering and disseminating
statistical data, expanding U.S. exports, developing innovative technologies, helping local communities improve their economic development capabilities, promoting minority entrepreneurial activities, and monitoring the stewardship of national assets. The Department is composed of 12 bureaus, the Emergency Steel Loan Guarantee Program, and Departmental Management.
For the Consolidated Statements of Net Cost, the Department’s entities have been grouped together as follows:
●● National Oceanic and Atmospheric Administration (NOAA)
●● U.S. Patent and Trademark Office (USPTO)
●● Economics and Statistics Administration (ESA) — based on organizational structure
●● Bureau of Economic Analysis (BEA)
●● Census Bureau
●● National Institute of Standards and Technology (NIST) — based on organizational structure
●● National Technical Information Service (NTIS)
●● National Telecommunications and Information Administration (NTIA)1
●● Departmental Management (DM)
●● Franchise Fund
●● Gifts and Bequests (G&B)●● Herbert C. Hoover Building (HCHB) Renovation Project
●● Office of Inspector General (OIG)
●● Salaries and Expenses (S&E)
●● Working Capital Fund (WCF)●● Others
●● Bureau of Industry and Security (BIS)
●● Economic Development Administration (EDA)
●● Emergency Steel Loan Guarantee Program (ELGP)
●● International Trade Administration (ITA)
●● Minority Business Development Agency (MBDA)
1 The Middle Class Tax Relief and Job Creation Act of 2012 created the First Responder Network Authority as an independent authority within
NTIA, to provide emergency responders with the first high-speed, nationwide network dedicated to public safety.
54 | FY 20 14 AGENCY F I NANC IAL REPORT
N O T E S T O T H E F I N A N C I A L S T A T E M E N T S
B Basis of Accounting and Presentation
The Department’s fiscal year ends September 30. These financial statements reflect both accrual and budgetary accounting transactions. Under the accrual method of accounting, revenues are recognized when earned and expenses are recognized when incurred, without regard to the receipt or payment of cash. Budgetary accounting is designed to recognize the obligation of funds according to legal requirements, which in many cases is made prior to the occurrence of an accrual-based transaction. Budgetary accounting is essential for compliance with legal constraints and controls over the use of federal funds.
These financial statements have been prepared from the accounting records of the Department in conformance with U.S. generally accepted accounting principles (GAAP) and the form and content for entity financial statements specified by the Office of Management and Budget (OMB) in Revised Circular A-136, Financial Reporting Requirements. GAAP for federal entities are the standards prescribed by the Federal Accounting Standards Advisory Board, which is the official body for setting the accounting standards of the U.S. government.
Throughout these financial statements, intragovernmental assets, liabilities, earned revenue, and costs have been classified according to the type of entity with whom the transactions were made. Intragovernmental assets and liabilities are those from or to other federal entities. Intragovernmental earned revenue represents collections or accruals of revenue from other federal entities, and intragovernmental costs are payments or accruals to other federal entities.
The Department has allocation transfer transactions with other federal agencies as both a transferring (parent) entity and as a receiving (child) entity. Allocation transfers are legal delegations by one department of its authority to obligate budget authority and outlay funds to another department. A separate fund account (allocation account) is created in the U.S. Department of the Treasury (Treasury) as a subset of the parent fund account for tracking and reporting purposes. All allocation transfers of balances are credited to this account, and subsequent obligations and outlays incurred by the child entity are charged to this allocation account as they execute the delegated activity on behalf of the parent entity. Generally, all financial activity related to these allocation transfers (e.g., budget authority, obligations, and outlays) is reported in the financial statements of the parent entity, from which the underlying legislative authority, appropriations, and budget apportionments are derived. EDA allocates funds, as the parent, to the U.S. Department of Agriculture’s Rural Development Administration. Therefore, all financial activity related to these EDA funds are reported in the Department’s financial statements. NOAA, EDA, the Census Bureau, and BEA have received allocation transfers, as the child, from the U.S. General Services Administration (GSA), U.S. Environmental Protection Agency, Delta Regional Authority, Appalachian Regional Commission, and the Northern Border Regional Commission. Activity relating to these child allocation transfers is not reported in the Department’s financial statements, except that the Department has recognized Imputed Costs and Imputed Financing Sources From Cost Absorbed by Others for expenses, as the child, under GSA’s Federal Buildings Fund.
C Funds from Dedicated Collections
Funds from Dedicated Collections are financed by specifically identified revenues, often supplemented by other financing sources that are originally provided to the federal government by a non-federal source, which remain available over time. These specifically identified revenues and other financing sources are required by statute to be used for designated activities, benefits, or purposes, and must be accounted for separately from the government’s general revenues.
Funds from Dedicated Collections include general funds, public enterprise revolving funds (not including credit reform financing funds), special funds, and a trust fund. (See Note 21, Funds from Dedicated Collections.)
FY 20 14 AGENCY F I NANC IAL REPORT | 55
N O T E S T O T H E F I N A N C I A L S T A T E M E N T S
D Elimination of Intra-entity and Intra-Departmental Transactions and Balances
Transactions and balances within a reporting entity (intra-entity) have been eliminated from the financial statements, except as noted below. Transactions and balances among the Department’s entities (intra-Departmental) have been eliminated from the Consolidated Balance Sheets, the Consolidated Statements of Net Cost, and the Consolidated Statements of Changes in Net Position. The Statements of Budgetary Resources are presented on a combined basis; therefore, intra-Departmental and intra-entity transactions and balances have not been eliminated from these statements.
E Fund Balance with Treasury
Fund Balance with Treasury is the aggregate amount of funds in the Department’s accounts with Treasury. Deposit Funds include amounts held in customer deposit accounts.
Treasury processes cash receipts and disbursements for the Department’s domestic operations. Cash receipts and disbursements for the Department’s overseas operations are primarily processed by the U.S. Department of State’s financial service centers.
F Accounts Receivable, Net
Accounts Receivable are recognized primarily when the Department performs reimbursable services or sells goods. Accounts Receivable are reduced to net realizable value by an Allowance for Uncollectible Accounts. This allowance is estimated periodically using methods such as the identification of specific delinquent receivables, and the analysis of aging schedules and historical trends adjusted for current market conditions.
G Advances and Prepayments
Advances are payments the Department has made to cover a part or all of a grant recipient’s anticipated expenses, or are advance payments for the cost of goods and services to be acquired. For grant awards, the recipient is required to periodically (monthly or quarterly) report the amount of costs incurred. Prepayments are payments the Department has made to cover certain periodic expenses before those expenses are incurred, such as subscriptions and rent. Advances and Prepayments are included in Other Assets.
H Direct Loans and Loan Guarantees, Net
A direct loan is recorded as a receivable after the Department disburses funds to a borrower. The Department also makes loan guarantees with respect to the payment of all or part of the principal or interest on debt obligations of non-federal borrowers to non-federal lenders. A borrower-defaulted loan guaranteed by the Department is recorded as a receivable from the borrower after the Department disburses funds to the lender.
Interest Receivable generally represents uncollected interest income earned on loans. For past-due loans, only up to 180 days of interest income is generally recorded.
Foreclosed Property is acquired primarily through foreclosure and voluntary conveyance, and is recorded at the fair market value at the time of acquisition. Foreclosed Property is adjusted to the current fair market value each fiscal year-end.
56 | FY 20 14 AGENCY F I NANC IAL REPORT
N O T E S T O T H E F I N A N C I A L S T A T E M E N T S

Direct Loans and Loan Guarantees Obligated before October 1, 1991 (pre-FY 1992): Loans Receivable are reduced by an Allowance for Loan Losses, which is based on an analysis of each loan’s outstanding balance. The value of each receivable, net of any Allowance for Loan Losses, is supported by the values of pledged collateral and other assets available for liquidation, and by the Department’s analysis of financial information of parties against whom the Department has recourse for the collection of these receivables.
The Economic Development Revolving Fund is required to make annual interest payments to Treasury after each fiscal year-end, based on its outstanding receivables as of September 30.
Direct Loans and Loan Guarantees Obligated after September 30, 1991 (post-FY 1991): Post-FY 1991 obligated direct loans and loan guarantees and the resulting receivables are governed by the Federal Credit Reform Act of 1990.
For a direct or guaranteed loan disbursed during a fiscal year, a subsidy cost is initially recognized. Subsidy costs are intended to estimate the long-term cost to the U.S. government of its loan programs. The subsidy cost equals the present value of estimated cash outflows over the life of the loan, minus the present value of estimated cash inflows, discounted at the applicable Treasury interest rate. Administrative costs such as salaries are not included in the subsidy costs. Subsidy costs can arise from interest rate differentials, interest subsidies, delinquencies and defaults, loan origination and other fees, and other cash flows. The Department calculates its subsidy costs based on a model created and provided by OMB.
A Loan Receivable is recorded at the present value of the estimated cash inflows less cash outflows. The difference between the outstanding principal of the loan and the present value of its net cash inflows is recorded as the Allowance for Subsidy Cost. A subsidy reestimate is normally performed annually, as of September 30. The subsidy reestimate takes into account all factors that may have affected the estimated cash flows. Any adjustment resulting from the reestimate is recognized as a subsidy expense (or a reduction in subsidy expense). The portion of the Allowance for Subsidy Cost related to subsidy modifications and reestimates is calculated annually, as of September 30.
The amount of any downward subsidy reestimates as of September 30 must be disbursed to Treasury in the subsequent fiscal year. Appropriations are normally obtained in the following fiscal year for any upward subsidy reestimates.
I Inventory, Materials, and Supplies, Net
Inventory, Materials, and Supplies, Net are stated at the lower of cost or net realizable value primarily under the average, weighted-average, and first-in, first-out methods, and are adjusted for the results of physical inventories. Inventory, Materials, and Supplies are expensed when consumed. There are no restrictions on their sale, use, or disposition.
J General Property, Plant, and Equipment, Net
General Property, Plant, and Equipment, Net (General PP&E) is composed of capital assets used in providing goods or services. General PP&E is stated at full cost, including all costs related to acquisition, delivery, and installation, less Accumulated Depreciation. Acquisitions of General PP&E include assets purchased, or assets acquired through other means such as through transfer in from another federal entity, donation, devise (a will or clause of a will disposing of property), judicial process, exchange between a federal entity and a non-federal entity, and forfeiture. General PP&E also includes assets acquired through capital leases, which are initially recorded at the amount recognized as a liability for the capital lease at its inception.
FY 20 14 AGENCY F I NANC IAL REPORT | 57
N O T E S T O T H E F I N A N C I A L S T A T E M E N T S

Capitalization Thresholds:
Single-asset Acquisitions: The Department’s policy is to capitalize single-asset acquisitions of General PP&E if the useful life is two years or more and the dollar amount meets the entity’s single-asset acquisition capitalization threshold. Based on a Department-wide capitalization thresholds review, which reflects materiality and cost-benefit analyses, the Department’s single-asset acquisition capitalization thresholds are as follows: NOAA—$200 thousand or more; NIST and USPTO—$50 thousand or more; and all other bureaus and Departmental Management—$25 thousand or more, except that NTIA’s First Responder Network Authority has a single-asset acquisition capitalization threshold of $5 thousand.
Personal Property Bulk Acquisitions: NOAA has a personal property bulk acquisition capitalization threshold of $1 million, and all other bureaus and Departmental Management have a personal property bulk acquisition capitalization threshold of $250 thousand, except that USPTO has a furniture bulk acquisition capitalization threshold of $50 thousand and NTIA’s First Responder Network Authority has a personal property bulk acquisition capitalization threshold of $50 thousand.
General PP&E not meeting the applicable capitalization threshold is expensed.
Depreciation: Depreciation is recognized on a straight-line basis over the estimated useful life of the asset with the exception of leasehold improvements, which are depreciated over the remaining life of the lease or over the useful life of the improvement, whichever is shorter. Land and Construction-in-progress are not depreciated.
Real Property: GSA provides most of the facilities in which the Department operates, and generally charges rent based on comparable commercial rental rates. Accordingly, GSA-owned properties are not included in the Department’s General PP&E. The Department’s real property primarily consists of facilities for NIST and NOAA. Land Improvements consist of a retaining wall to protect against shoreline erosion.
Construction-in-progress: Costs for the construction, modification, or modernization of General PP&E are initially recorded as Construction-in-progress. The Department’s construction-in-progress consists primarily of satellites under development for NOAA, and major laboratory renovations and construction projects under development for NIST. Upon completion of the work, the costs are transferred to the appropriate General PP&E account.
Effective FY 2013, for the completion of satellites, the Department elected to change its method of accounting for transferring costs from Construction-in-progress to completed General PP&E. Historically, the Department generally views satellites as operational when all NOAA’s instruments associated with satellites are declared operational; however, in certain cases, effective FY 2013, NOAA will declare certain instruments operational if the instruments are not interdependent.
K Notes Receivable
Notes Receivable, included in Other Assets, arise through the NOAA sale of foreclosed property to non-federal parties. The property is used as collateral, and an Allowance for Uncollectible Amounts is established if the net realizable value of the collateral is less than the outstanding balance of the Notes Receivable. An analysis of the collectability of receivables is performed periodically. Any gains realized through the sale of foreclosed property are initially deferred and recognized in proportion to the percentage of principal repaid.
58 | FY 20 14 AGENCY F I NANC IAL REPORT
N O T E S T O T H E F I N A N C I A L S T A T E M E N T S

L Non-entity Assets
Non-entity assets are assets held by the Department that are not available for use in its operations, and for which a liability has been recorded. Non-entity Fund Balance with Treasury includes customer deposits held by the Department until customer orders are received, and monies payable to the Treasury General Fund for custodial activity and loan programs. Non-entity Direct Loans and Loan Guarantees, Net includes EDA’s Drought Loan Portfolio; the amount of the portfolio is also recorded as Resources Payable to Treasury.
M Liabilities
A liability for federal accounting purposes is a probable and measurable future outflow or other sacrifice of resources as a result of past transactions or events.
Accounts Payable: Accounts Payable are amounts primarily owed for goods, services, or capitalized assets received, progress on contract performance by others, and other expenses due.
Debt to Treasury: The Department has borrowed funds from Treasury through the Fisheries Finance Financing Account for various NOAA direct loan programs, through the Fishing Vessel Obligation Guarantee (FVOG) loan guarantee program, and through NTIA’s Public Safety Trust Fund, and State and Local Implementation Fund. To simplify interest calculations, the Fisheries Finance Financing Account and FVOG borrowings are dated October 1. Interest rates are based on a weighted average of rates during the term of the borrowed funds. The weighted average rate for each cohort’s borrowing is recalculated at the end of each fiscal year during which disbursements are made. Annual interest payments on unpaid principal balances as of September 30 are required. Principal repayments are required only at maturity, but are permitted at any time during the term of the loan. The Department’s primary financing source for repayments of Debt to Treasury is the collection of principal on the associated Loans Receivable, and deposits from public safety communications and electromagnetic spectrum auction proceeds. Balances of any borrowed but undisbursed Fisheries Finance Financing Account and FVOG funds will earn interest at the same rate used in calculating interest expense. The amounts borrowed by NTIA are interest-free. The amounts reported for Debt to Treasury include accrued interest payable. See Note 10, Debt to Treasury, for information regarding maturity dates.
Resources Payable to Treasury: Resources Payable to Treasury includes liquidating fund assets in excess of liabilities that are being held as working capital for the Economic Development Revolving Fund loan programs and the FVOG loan guarantee program. EDA’s Drought Loan Portfolio is a non-entity asset; therefore, the amount of the Portfolio is also recorded as Resources Payable to Treasury. The Drought Loan Portfolio collections are returned to the Treasury General Fund annually, and the liability is reduced accordingly.
Unearned Revenue: Unearned Revenue is the portion of monies received for which goods and services have not yet been provided or rendered by the Department. Revenue is recognized as reimbursable costs are incurred, and the Unearned Revenue balance is reduced accordingly. Unearned Revenue also includes the balances of customer deposit accounts held by the Department. The intragovernmental Unearned Revenue primarily relates to monies collected in advance under reimbursable agreements. The majority of the Unearned Revenue with the public represents patent and trademark application and user fees that are pending action.
Accrued FECA Liability: The Federal Employees Compensation Act (FECA) provides income and medical cost protection to covered federal civilian employees injured on the job, to employees who have incurred work-related occupational diseases, and to beneficiaries of employees whose deaths are attributable to job-related injuries or occupational diseases. The FECA program is administered by the U.S. Department of Labor (DOL), which pays valid claims against the Department and subsequently seeks reimbursement from the Department for these paid claims. Accrued FECA Liability, included in Intragovernmental Other Liabilities, represents amounts due to DOL for claims paid on behalf of the Department.
FY 20 14 AGENCY F I NANC IAL REPORT | 59
N O T E S T O T H E F I N A N C I A L S T A T E M E N T S
Loan Guarantee Liabilities: Post-FY 1991 obligated loan guarantees are governed by the Federal Credit Reform Act of 1990. For a guaranteed loan disbursed during a fiscal year, a subsidy cost is initially recognized. Subsidy costs are intended to estimate the long-term cost to the U.S. government of its loan programs. The subsidy cost equals the present value of estimated cash outflows over the lives of the loans, minus the present value of estimated cash inflows, discounted at the applicable Treasury interest rate. Administrative costs such as salaries are not included in the subsidy costs. Subsidy costs can arise from interest rate differentials, interest subsidies, delinquencies and defaults, loan origination and other fees, and other cash flows. The Department calculates its subsidy costs based on a model created and provided by OMB.
For a non-acquired guaranteed loan outstanding, the present value of the estimated cash inflows less cash outflows of the loan guarantee is recognized as a Loan Guarantee Liability. The Loan Guarantee Liability is normally reestimated annually each fiscal year, as of September 30. The subsidy reestimate takes into account all factors that may have affected the estimated cash flows. Any adjustment resulting from the reestimate is recognized as a subsidy expense (or a reduction in subsidy expense).
Federal Employee Benefits:
Actuarial FECA Liability: Actuarial FECA Liability represents the liability for future workers’ compensation (FWC) benefits, which includes the expected liability for death, disability, medical, and miscellaneous costs for approved cases. The liability is determined by DOL annually, as of September 30, using a method that utilizes historical benefits payment patterns related to a specific incurred period to predict the ultimate payments related to that period. Projected annual payments were discounted to present value based on OMB’s interest rate assumptions which were interpolated to reflect the average duration in years for income payments and medical payments.
To provide more specifically for the effects of inflation on the liability for FWC benefits, wage inflation factors (Cost of Living Allowance) and medical inflation factors (Consumer Price Index - Medical) are applied to the calculation of projected future benefits. The actual rates for these factors are also used to adjust the historical payments to current-year constant dollars.
The model’s resulting projections are analyzed by DOL to ensure that the amounts are reliable. The analysis is based on four tests: 1) a sensitivity analysis of the model to economic assumptions; 2) a comparison of the percentage change in the liability amount to the percentage change in the actual incremental payments; 3) a comparison of the incremental paid losses per case (a measure of case severity) in chargeback year to the average pattern observed during the most current three chargeback years; and 4) a comparison of the estimated liability per case in the projection to the average pattern for the projections of the most recent three years.
NOAA Corps Retirement System Liability and NOAA Corps Post-retirement Health Benefits Liability: These liabilities are recorded at the actuarial present value of projected benefits, calculated annually, as of September 30. The actuarial cost method used to determine these liabilities is the aggregate entry age normal method. Under this method, the actuarial present value of projected benefits is allocated on a level basis over the earnings or the service of the group between entry age and assumed exit ages. The portion of this actuarial present value allocated to the valuation year is called the normal cost. For purposes of calculating the normal cost, certain actuarial assumptions utilized for the actual valuation of U.S. Military Retirement System are used. Actuarial gains and losses, and prior and past service costs, if any, are recognized immediately in the fiscal year they occur, without amortization. The medical claim rates used for the NOAA Corps Post-retirement Health Benefits Liability actuarial calculations are based on the claim rates used for the U.S. Department of Defense Medicare-Eligible Retiree Health Care Fund actuarial valuations. Demographic assumptions appropriate to covered personnel are also used. For background information about these plans, see Note 1.Q, Employee Retirement Benefits.
60 | FY 20 14 AGENCY F I NANC IAL REPORT
N O T E S T O T H E F I N A N C I A L S T A T E M E N T S

Environmental and Disposal Liabilities: The Department has incurred asbestos-related cleanup costs related to the costs of removing, containing, and/or disposing of asbestos-containing materials from property, plant, and equipment; specifically, from facilities owned by NIST and NOAA, and from ships owned by NOAA. Effective FY 2013, as described in Note 13, Environmental and Disposal Liabilities, the Department implemented Technical Bulletin 2006-1, Recognition and Measurement of Asbestos-related Cleanup Costs, which clarifies required recognition of liabilities and expenses for asbestos-related cleanup costs. The Department has estimated its liabilities for asbestos-related cleanup costs for both friable and nonfriable asbestos-related cleanup costs. Estimates of asbestos-related cleanup costs are reviewed periodically, and updated as appropriate, to account for actual or estimated increases or decreases in asbestos-containing materials, material changes due to inflation or deflation, and changes in regulations, plans, and/or technology.
NIST operates a nuclear reactor licensed by the U.S. Nuclear Regulatory Commission, in accordance with NIST’s mission of setting standards and examining new technologies. The Department currently estimates the cost of decommissioning this facility to be $78.9 million. The NIST decommissioning estimate includes an assumption that an offsite waste disposal facility will become available, when needed, estimated in 2029. Currently, an offsite disposal location has not been identified, and the NIST environmental liability cost estimate includes an amount approved by the Nuclear Regulatory Commission for offsite waste disposal. The total estimated decommissioning cost is being accrued on a straight-line basis over the expected life of the facility. Under current legislation, funds to cover the expense of decommissioning the facility’s nuclear reactor should be requested in a separate appropriation when the decommissioning date becomes relatively certain.
The Department has incurred cleanup costs related to the costs of removing, containing, and/or disposing of hazardous waste from facilities used by NOAA. The Department has estimated its liabilities for environmental cleanup costs at all NOAA-used facilities, including the decommissioning of ships. The largest of NOAA’s environmental liabilities relates to the cleanup of the Pribilof Islands in Alaska, which contains waste from the U.S. Department of Defense’s use during World War II. The Department does not recognize a liability for environmental cleanup costs for NOAA-used facilities that are less than $25 thousand per project. When an estimate of cleanup costs includes a range of possible costs, the most likely cost is reported. When no cost is more likely than another, the lowest estimated cost in the range is reported. The liability is reduced as progress payments are made.
The Department may have liabilities associated with lead-based paints at certain NOAA facilities. The Department has scheduled surveys to assess the potential for liabilities for lead-based paint contamination. All known issues, however, are contained, and NOAA facilities meet current environmental standards. No cost estimates are presently available for facilities that have not yet been assessed for lead-based paint issues.
Accrued Payroll and Annual Leave: These categories include salaries, wages, and other compensation earned by employees, but not disbursed as of September 30. Annually, as of September 30, the balances of Accrued Annual Leave are adjusted to reflect current pay rates. Sick leave and other types of non-vested leave are expensed as taken.
Accrued Grants: The Department administers a diverse array of financial assistance programs and projects concerned with the entire spectrum of business and economic development efforts that promote activities such as expanding U.S. exports, creating jobs, contributing to economic growth, developing innovative technologies, promoting minority entrepreneurship, protecting coastal oceans, providing weather services, managing worldwide environmental data, and using telecommunications and information technologies to better provide public services. Disbursements of funds under the Department’s grant programs are generally made when requested by grantees. These drawdown requests may be received and fulfilled before grantees make the program expenditures. When the Department has disbursed funds but the grant recipient has not yet reported expenditures, these disbursements are recorded as advances. If a recipient, however, reports program expenditures that have not been advanced by the Department by September 30, such amounts are recorded as grant expenses and grants payable as of September 30.
FY 20 14 AGENCY F I NANC IAL REPORT | 6 1
N O T E S T O T H E F I N A N C I A L S T A T E M E N T S

Capital Lease Liabilities: Capital leases are leases for property, plant, and equipment that transfer substantially all the benefits and risks of ownership to the Department.
Contingent Liabilities and Contingencies: A contingency is an existing condition, situation, or set of circumstances involving uncertainty as to possible gain or loss. The uncertainty will ultimately be resolved when one or more future events occur or fail to occur. A contingent liability (included in Other Liabilities) and an expense are recognized when a past event has occurred, and a future outflow or other sacrifice of resources is measurable and probable. A contingency is considered probable when the future confirming event or events are more likely than not to occur, with the exception of pending or threatened litigation and unasserted claims. For pending or threatened litigation and unasserted claims, the future confirming event or events are likely to occur. A contingency is disclosed in the Notes to the Financial Statements if any of the conditions for liability recognition are not met and there is at least a reasonable possibility that a loss or an additional loss may have been incurred. A contingency is considered reasonably possible when the chance of the future confirming event or events occurring is more than remote but less than probable. A contingency is not recognized as a contingent liability and an expense nor disclosed in the Notes to the Financial Statements when the chance of the future event or events occurring is remote. A contingency is considered remote when the chance of the future event or events occurring is slight.
Liabilities Not Covered by Budgetary Resources: These are liabilities for which congressional actions are needed before budgetary resources can be provided. The Department anticipates that liabilities not covered by budgetary resources will be funded from future budgetary resources when required. These amounts are detailed in Note 15.
Under accrual accounting, the expense for annual leave is recognized when the leave is earned. However, for most of the Department’s fund groups, appropriations are provided to pay for the leave when it is taken. As a result, budgetary resources do not cover a large portion of Accrued Annual Leave.
The Department generally receives budgetary resources for Federal Employee Benefits when they are needed for disbursements.
N Commitments
Commitments are preliminary actions that will ultimately result in an obligation to the U.S. government if carried through, such as purchase requisitions, estimated travel orders, or unsigned contracts/grants. Major long-term commitments are disclosed in Note 16, Commitments and Contingencies.
O Net Position
Net Position is the residual difference between assets and liabilities, and is composed of Unexpended Appropriations and Cumulative Results of Operations.
Unexpended Appropriations represent the total amount of unexpended budget authority that is classified as appropriations, both obligated and unobligated. Unexpended Appropriations is increased for Appropriations Received, is reduced for Appropriations Used, and is adjusted for other changes in appropriations, such as transfers and rescissions. Cumulative Results of Operations is the net result of the Department’s operations since inception.
62 | FY 20 14 AGENCY F I NANC IAL REPORT
N O T E S T O T H E F I N A N C I A L S T A T E M E N T S
P Revenues and Other Financing Sources
Appropriations Used: Most of the Department’s operating funds are provided by congressional appropriations of budget authority. The Department receives appropriations on annual, multiple-fiscal year, and no-year bases. Upon expiration of an annual or multiple-fiscal year appropriation, the obligated and unobligated balances retain their fiscal year identity, and are maintained separately within an expired account. The unobligated balances can be used to make legitimate obligation adjustments, but are otherwise not available for expenditures. Annual and multiple-fiscal year appropriations are canceled at the end of the fifth fiscal year after expiration. No-year appropriations do not expire. Appropriations of budget authority are recognized as used when costs are incurred, for example, when goods and services are received or benefits and grants are provided.
Exchange and Non-exchange Revenue: The Department classifies revenue as either exchange revenue or non-exchange revenue. Exchange revenue is derived from transactions in which both the government and the other party receive value, including processing patents and registering trademarks, the sale of weather data, nautical charts, and navigation information, and other sales of goods and services. This revenue is presented on the Department’s Consolidated Statements of Net Cost, and serves to reduce the reported cost of operations borne by the taxpayer. Non-exchange revenue is derived from the government’s sovereign right to demand payment, including fines for violations of fisheries and marine protection laws. Non-exchange revenue is recognized when a specifically identifiable, legally enforceable claim to resources arises, and to the extent that collection is probable and the amount is reasonably estimable. This revenue is not considered to reduce the cost of the Department’s operations and is therefore reported on the Consolidated Statements of Changes in Net Position.
In certain cases, law or regulation sets the prices charged by the Department, and, for program and other reasons, the Department may not receive full cost (e.g., the processing of patents and registering of trademarks, and the sale of weather data, nautical charts, and navigation information). Prices set for products and services offered through the Department’s working capital funds are intended to recover the full costs incurred by these activities.
Imputed Financing Sources from Cost Absorbed by Others (and Related Imputed Costs): In certain cases, operating costs of the Depart ment are paid for in full or in part by funds appropriated to other federal entities. For example, Civil Service Retirement System pension benefits for applicable Departmental employees are paid for in part by the U.S. Office of Personnel Management (OPM), and certain legal judgments against the Department are paid for in full from the Judgment Fund maintained by Treasury. The Department includes applicable Imputed Costs on the Consolidated Statements of Net Cost. In addition, an Imputed Financing Source from Cost Absorbed by Others is recognized on the Consolidated Statements of Changes in Net Position.
Transfers In/(Out): Intragovernmental transfers of budget authority (i.e., appropriated funds) or of assets without reimbursement are recorded at book value.
Q Employee Retirement Benefits
Civil Service Retirement System (CSRS) and Federal Employees Retirement System (FERS): Most employees of the Department participate in either the CSRS or FERS defined-benefit pension plans. FERS went into effect on January 1, 1987. FERS and Social Security automatically cover most employees hired after December 31, 1983. Employees hired prior to January 1, 1984 could elect to either join FERS and Social Security, or remain in CSRS.
The Department is not responsible for and does not report CSRS or FERS assets, accumulated plan benefits, or liabilities applicable to its employees. OPM, which administers the plans, is responsible for and reports these amounts.
FY 20 14 AGENCY F I NANC IAL REPORT | 63
N O T E S T O T H E F I N A N C I A L S T A T E M E N T S
For CSRS-covered regular employees, the Department was required to make contributions to the plan equal to 7 percent of an employee’s basic pay. Employees contributed 7 percent of basic pay. For each fiscal year, OPM calculates the U.S. government’s service cost for covered employees, which is an estimate of the amount of funds, that, if accumulated annually and invested over an employee’s career, would be enough to pay that employee’s future benefits. Since the U.S. government’s estimated service cost exceeds contributions made by employer agencies and covered employees, this plan is not fully funded by the Department and its employees. The Department has recognized an Imputed Cost and an Imputed Financing Source From Cost Absorbed by Others for the difference between the estimated service cost and the contributions made by the Department and its covered employees.
For FERS-covered regular employees, for employees hired prior to January 1, 2013, the Department was required to make contributions of 11.9 percent of basic pay. Employees contributed 0.8 percent of basic pay. Effective January 1, 2013, for new regular employees as defined in Public Law 112-96, Section 5001, the Department was required to make contributions of 9.6 percent of basic pay. Employees contributed 3.1 percent of basic pay. Section 401 of the Bipartisan Budget Act of 2013, signed into law by the President on December 26, 2013, made another change to FERS. Beginning January 1, 2014, new regular employees (as designated in the statute) have to pay higher employee contributions, an increase of 1.3 percent of salary above the percentage set for the FERS Revised Annuity Employee. Under this law, the employee contribution increased to 4.4 percent. The Department’s contribution remained at 9.6 percent. For each fiscal year, OPM calculates the U.S. government’s service cost for covered employees. Since the U.S. government’s estimated service cost exceeds contributions made by employer agencies and covered employees, this plan was not fully funded by the Department and its employees. The Department has recognized an Imputed Cost and an Imputed Financing Source From Cost Absorbed by Others for the difference between the estimated service cost and the contributions made by the Department and its covered employees.
Employees participating in FERS are covered under the Federal Insurance Contributions Act (FICA), for which the Department contributes a matching amount to the Social Security Administration.
NOAA Corps Retirement System: Active-duty officers of the NOAA Corps are covered by the NOAA Corps Retirement System, an unfunded, pay-as-you-go, defined-benefit plan administered by the Department. Participants do not contribute to this plan. Plan benefits are based primarily on years of service and compensation. Participants, as of September 30, 2014, included 318 active duty officers, 376 nondisability retiree annuitants, 15 disability retiree annuitants, and 51 surviving families. Key provisions include voluntary nondisability retirement after 20 years of active service, disability retirement, optional survivor benefits, Consumer Price Index (CPI) optional survivor benefits, and CPI adjustments for benefits.
Foreign Service Retirement and Disability System, and the Foreign Service Pension System: Foreign Commercial Officers are covered by the Foreign Service Retirement and Disability System and the Foreign Service Pension System. ITA makes contributions to the systems based on a percentage of an employee’s pay. Both systems are multi-employer plans administered by the U.S. Department of State. The Department is not responsible for and does not report plan assets, accumulated plan benefits, or liabilities applicable to its employees. The U.S. Department of State, which administers the plan, is responsible for and reports these amounts.
Thrift Savings Plan (TSP): Employees covered by CSRS and FERS are eligible to contribute to the U.S. government’s TSP, administered by the Federal Retirement Thrift Investment Board. A TSP account is automatically established for FERS-covered employees, and the Department makes a mandatory contribution of one percent of basic pay. The Department also makes matching contributions of up to four percent of basic pay for FERS-covered employees. FERS and CSRS-covered employees have no limit on the percentage of pay contributed to their TSP account. However, the total employee regular contribution for 2014 and 2013 may not exceed the IRS limit of $17.5 thousand. The Department makes no matching contributions for CSRS-covered employees. TSP participants age 50 or older who are already contributing the maximum amount of contributions for which they are eligible may also make catch-up contributions, subject to the IRS dollar limit for catch-up contributions.
64 | FY 20 14 AGENCY F I NANC IAL REPORT
N O T E S T O T H E F I N A N C I A L S T A T E M E N T S
Federal Employees Health Benefit (FEHB) Program: Most Departmental employees are enrolled in the FEHB Program, which provides post-retirement health benefits. OPM administers this program and is responsible for the reporting of liabilities. Employer agencies and covered employees are not required to make any contributions for post-retirement health benefits. OPM calculates the U.S. government’s service cost for covered employees each fiscal year. The Department has recognized the entire service cost of these post-retirement health benefits for covered employees as an Imputed Cost and an Imputed Financing Source From Cost Absorbed by Others.
NOAA Corps Post-retirement Health Benefits: Active-duty officers of the NOAA Corps are covered by the health benefits program for the NOAA Corps, which provides post-retirement health benefits. This is a pay-as-you-go plan administered by the Department. Participants do not make any contributions to this plan.
Federal Employees Group Life Insurance (FEGLI) Program: Most Department employees are entitled to participate in the FEGLI Program. Participating employees can obtain basic term life insurance, with the employee paying two-thirds of the cost and the Department paying one-third. Additional coverage is optional, to be paid fully by the employee. The basic life coverage may be continued into retirement if certain requirements are met. OPM administers this program and is responsible for the reporting of liabilities. For each fiscal year, OPM calculates the U.S. government’s service cost for the post-retirement portion of basic life coverage. Because the Department’s contributions to the basic life coverage are fully allocated by OPM to the pre-retirement portion of coverage, the Department has recognized the entire service cost of the post-retirement portion of basic life coverage as an Imputed Cost and an Imputed Financing Source From Cost Absorbed by Others.
R Use of Estimates
The preparation of financial statements requires the Department to make estimates and assumptions that affect these financial statements. Actual results may differ from those estimates.
S Tax Status
The Department is not subject to federal, state, or local income taxes. Accordingly, no provision for income taxes is recorded.
T Fiduciary Activities
Fiduciary activities are the collection or receipt, and the management, protection, accounting, and disposition by the U.S. government of cash or other assets in which non-federal individuals or entities have an ownership interest that the U.S. government must uphold. Fiduciary cash and other assets are not assets of the U.S. government, and, accordingly, are not recognized in the accompanying consolidated financial statements.
The Department’s fiduciary activities consist of the following:
The Patent Cooperation Treaty authorizes USPTO to collect patent filing and search fees on behalf of the World Intellectual Property Organization (WIPO), European Patent Office, Korean Intellectual Property Office, Russian Intellectual Property Organization, and the Australian Patent Office, from U.S. citizens requesting an international patent. The Madrid Protocol Implementation Act authorizes USPTO to collect trademark application fees on behalf of the International Bureau of WIPO from U.S. citizens requesting an international trademark. These fiduciary activities are reported in Note 20.
FY 20 14 AGENCY F I NANC IAL REPORT | 65
N O T E S T O T H E F I N A N C I A L S T A T E M E N T S
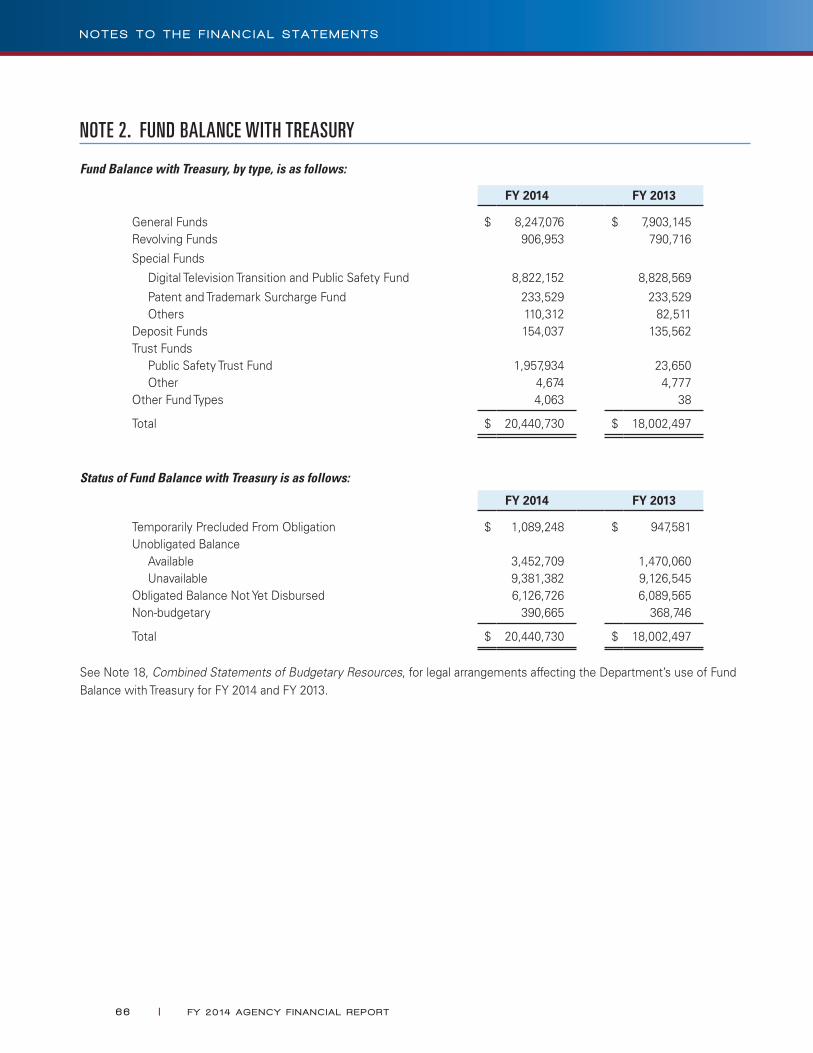
NOTE 2. FUND BALANCE WITH TREASURY
Fund Balance with Treasury, by type, is as follows:
FY 2014 FY 2013
General Funds $ 8,247,076 $ 7,903,145Revolving Funds 906,953 790,716
Special Funds
Digital Television Transition and Public Safety Fund 8,822,152 8,828,569
Patent and Trademark Surcharge Fund 233,529 233,529 Others 110,312 82,511Deposit Funds 154,037 135,562Trust Funds Public Safety Trust Fund 1,957,934 23,650 Other 4,674 4,777Other Fund Types 4,063 38
Total $ 20,440,730 $ 18,002,497
Status of Fund Balance with Treasury is as follows:
FY 2014 FY 2013
Temporarily Precluded From Obligation $ 1,089,248 $ 947,581Unobligated Balance Available 3,452,709 1,470,060 Unavailable 9,381,382 9,126,545Obligated Balance Not Yet Disbursed 6,126,726 6,089,565Non-budgetary 390,665 368,746
Total $ 20,440,730 $ 18,002,497
See Note 18, Combined Statements of Budgetary Resources, for legal arrangements affecting the Department’s use of Fund Balance with Treasury for FY 2014 and FY 2013.
66 | FY 20 14 AGENCY F I NANC IAL REPORT
N O T E S T O T H E F I N A N C I A L S T A T E M E N T S
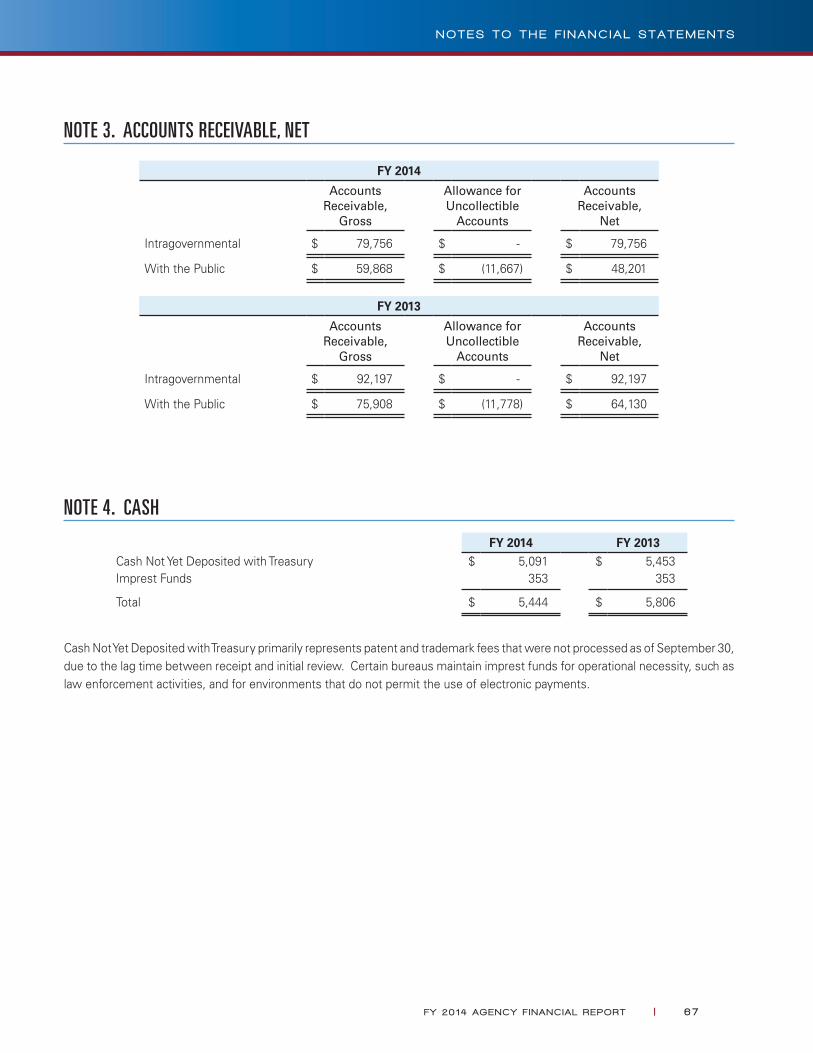
NOTE 3. ACCOUNTS RECEIVABLE, NET
FY 2014
Accounts Receivable,
Gross
Allowance for Uncollectible
Accounts
Accounts Receivable,
Net
Intragovernmental $ 79,756 $ - $ 79,756
With the Public $ 59,868 $ (11,667) $ 48,201
FY 2013
Accounts Receivable,
Gross
Allowance for Uncollectible
Accounts
Accounts Receivable,
Net
Intragovernmental $ 92,197 $ - $ 92,197
With the Public $ 75,908 $ (11,778) $ 64,130
NOTE 4. CASH
FY 2014 FY 2013Cash Not Yet Deposited with Treasury $ 5,091 $ 5,453Imprest Funds 353 353
Total $ 5,444 $ 5,806
Cash Not Yet Deposited with Treasury primarily represents patent and trademark fees that were not processed as of September 30, due to the lag time between receipt and initial review. Certain bureaus maintain imprest funds for operational necessity, such as law enforcement activities, and for environments that do not permit the use of electronic payments.
FY 20 14 AGENCY F I NANC IAL REPORT | 67
N O T E S T O T H E F I N A N C I A L S T A T E M E N T S

NOTE 5. DIRECT LOANS AND LOAN GUARANTEES, NET
The Department operates the following direct loan and loan guarantee programs:
Direct Loan Programs:EDA Drought Loan PortfolioEDA Economic Development Revolving FundNOAA Alaska Purse Seine Fishery Buyback LoansNOAA Bering Sea and Aleutian Islands Non-Pollock Buyback LoansNOAA Bering Sea Pollock Fishery BuybackNOAA Coastal Energy Impact Program (CEIP)NOAA Crab Buyback LoansNOAA Federal Gulf of Mexico Reef Fish Buyback Loans1
NOAA Fisheries Finance Individual Fishing Quota (IFQ) LoansNOAA Fisheries Finance Traditional LoansNOAA Fisheries Loan FundNOAA New England Groundfish Buyback Loans1
NOAA New England Lobster Buyback Loans1
NOAA Pacific Groundfish Buyback Loans1 No loans have been issued under these programs as of September 30, 2014.
Loan Guarantee Programs:EDA Economic Development Revolving FundELGP-Steel Emergency Steel Loan Guarantee ProgramNOAA Fishing Vessel Obligation Guarantee Program (FVOG Program)
NOAA’s Fisheries Finance Loan programs provide direct loans for certain fisheries costs, including vessels, shoreside facilities, aquaculture, and Individual Fishing Quota (IFQ). Vessel financing is available for the purchase of used vessels or the reconstruction of vessels. Refinancing is available for existing debt obligations. The purpose of these loan programs is to contribute to stable fisheries and fishing communities, and ensure that fisheries are sustainable economic resources. NOAA’s various buyback loan programs address excess fishing capacity which decreases fisheries earnings, complicates fisheries management, and imperils fisheries conservation. Buyback loans are issued to fisheries to permanently remove vessels and/or permits and thus lower fishing effort in overcapitalized fisheries. Loans are repaid from fees collected on the ex-vessel value of the catch in the fishery.
68 | FY 20 14 AGENCY F I NANC IAL REPORT
N O T E S T O T H E F I N A N C I A L S T A T E M E N T S
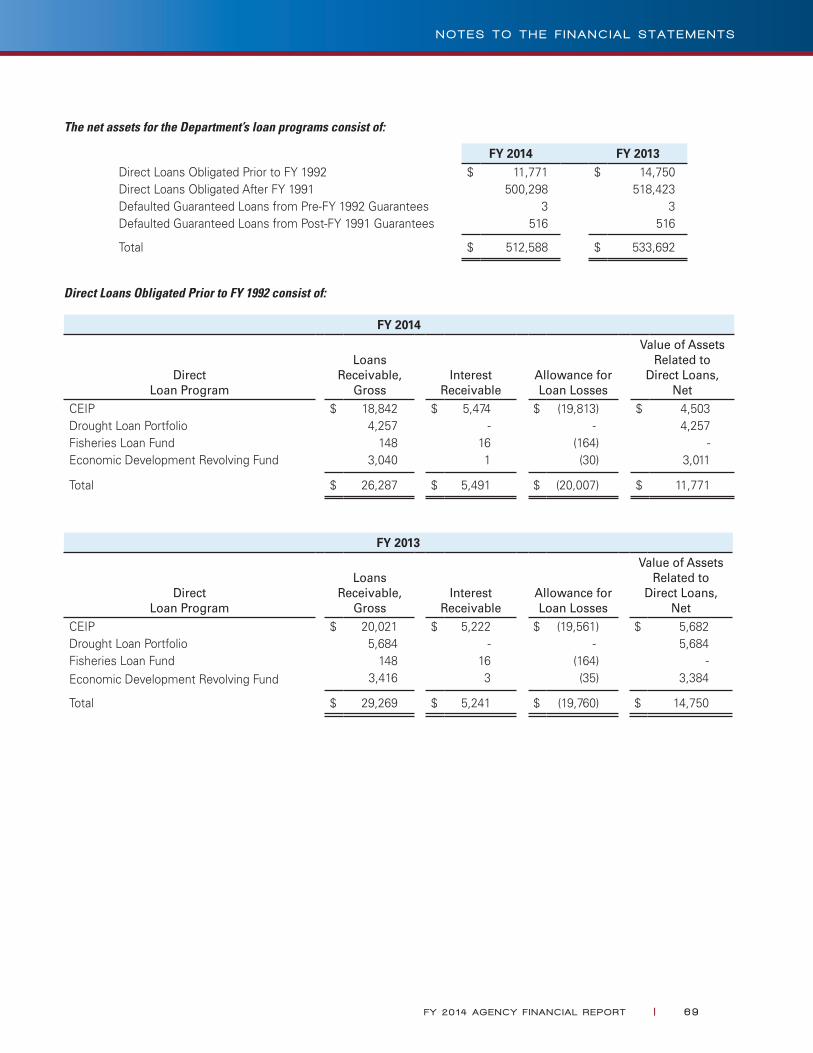
The net assets for the Department’s loan programs consist of:
FY 2014 FY 2013Direct Loans Obligated Prior to FY 1992 $ 11,771 $ 14,750Direct Loans Obligated After FY 1991 500,298 518,423Defaulted Guaranteed Loans from Pre-FY 1992 Guarantees 3 3Defaulted Guaranteed Loans from Post-FY 1991 Guarantees 516 516
Total $ 512,588 $ 533,692
Direct Loans Obligated Prior to FY 1992 consist of:
FY 2014
Direct Loan Program
Loans Receivable,
GrossInterest
ReceivableAllowance for Loan Losses
Value of Assets Related to
Direct Loans, Net
CEIP $ 18,842 $ 5,474 $ (19,813) $ 4,503Drought Loan Portfolio 4,257 - - 4,257Fisheries Loan Fund 148 16 (164) -Economic Development Revolving Fund 3,040 1 (30) 3,011
Total $ 26,287 $ 5,491 $ (20,007) $ 11,771
FY 2013
Direct Loan Program
Loans Receivable,
GrossInterest
ReceivableAllowance for Loan Losses
Value of Assets Related to
Direct Loans, Net
CEIP $ 20,021 $ 5,222 $ (19,561) $ 5,682Drought Loan Portfolio 5,684 - - 5,684Fisheries Loan Fund 148 16 (164) -Economic Development Revolving Fund 3,416 3 (35) 3,384
Total $ 29,269 $ 5,241 $ (19,760) $ 14,750
FY 20 14 AGENCY F I NANC IAL REPORT | 69
N O T E S T O T H E F I N A N C I A L S T A T E M E N T S
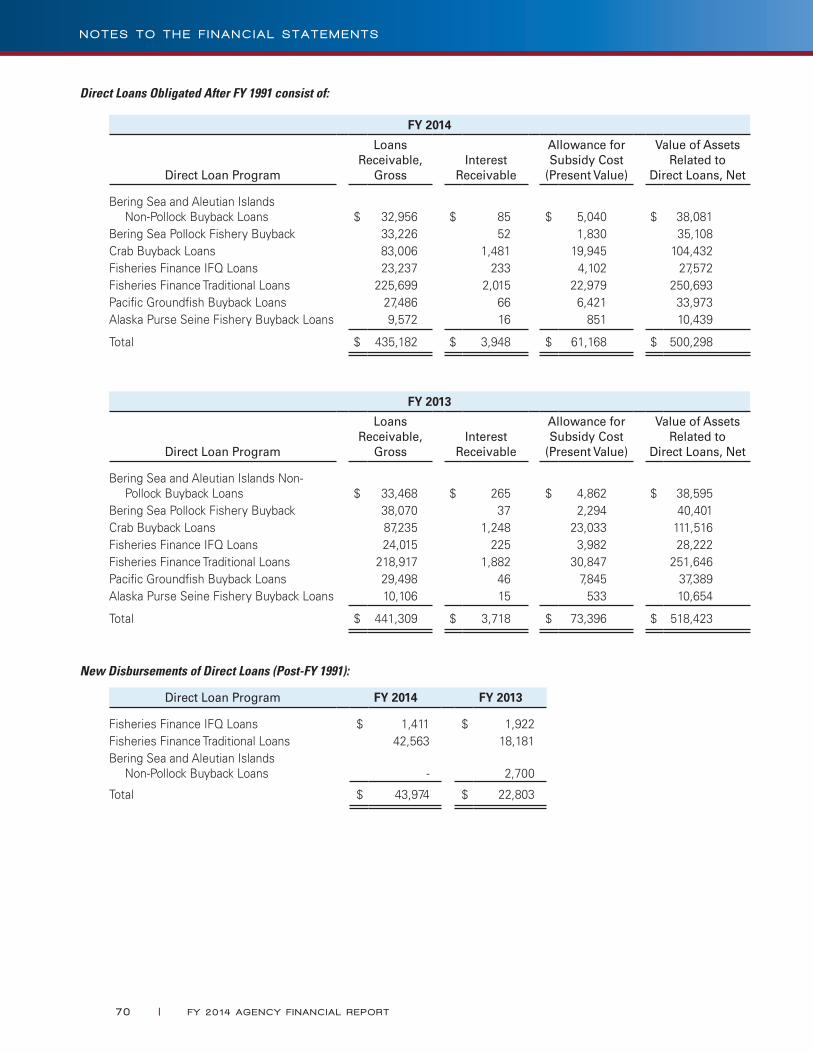
Direct Loans Obligated After FY 1991 consist of:
FY 2014
Direct Loan Program
Loans Receivable,
GrossInterest
Receivable
Allowance for Subsidy Cost
(Present Value)
Value of Assets Related to
Direct Loans, Net
Bering Sea and Aleutian Islands Non-Pollock Buyback Loans $ 32,956 $ 85 $ 5,040 $ 38,081
Bering Sea Pollock Fishery Buyback 33,226 52 1,830 35,108Crab Buyback Loans 83,006 1,481 19,945 104,432Fisheries Finance IFQ Loans 23,237 233 4,102 27,572Fisheries Finance Traditional Loans 225,699 2,015 22,979 250,693Pacific Groundfish Buyback Loans 27,486 66 6,421 33,973Alaska Purse Seine Fishery Buyback Loans 9,572 16 851 10,439
Total $ 435,182 $ 3,948 $ 61,168 $ 500,298
FY 2013
Direct Loan Program
Loans Receivable,
GrossInterest
Receivable
Allowance for Subsidy Cost
(Present Value)
Value of Assets Related to
Direct Loans, Net
Bering Sea and Aleutian Islands Non-Pollock Buyback Loans $ 33,468 $ 265 $ 4,862 $ 38,595
Bering Sea Pollock Fishery Buyback 38,070 37 2,294 40,401Crab Buyback Loans 87,235 1,248 23,033 111,516Fisheries Finance IFQ Loans 24,015 225 3,982 28,222Fisheries Finance Traditional Loans 218,917 1,882 30,847 251,646Pacific Groundfish Buyback Loans 29,498 46 7,845 37,389Alaska Purse Seine Fishery Buyback Loans 10,106 15 533 10,654
Total $ 441,309 $ 3,718 $ 73,396 $ 518,423
New Disbursements of Direct Loans (Post-FY 1991):
Direct Loan Program FY 2014 FY 2013
Fisheries Finance IFQ Loans $ 1,411 $ 1,922Fisheries Finance Traditional Loans 42,563 18,181Bering Sea and Aleutian Islands
Non-Pollock Buyback Loans - 2,700
Total $ 43,974 $ 22,803
70 | FY 20 14 AGENCY F I NANC IAL REPORT
N O T E S T O T H E F I N A N C I A L S T A T E M E N T S

Subsidy Expense for Direct Loans by Program and Component:
Subsidy Expense for New Disbursements of Direct Loans:
FY 2014
Direct Loan ProgramInterest RateDifferential Defaults
Fees and Other
Collections Other TotalFisheries Finance IFQ Loans $ (5,366) $ 28 $ (217) $ 1,836 $ (3,719)Fisheries Finance Traditional Loans (233) 2 (6) 85 (152)
Total $ (5,599) $ 30 $ (223) $ 1,921 $ (3,871)
FY 2013
Direct Loan ProgramInterest RateDifferential Defaults
Fees and Other
Collections Other TotalFisheries Finance IFQ Loans $ (419) $ 4 $ (13) $ 176 $ (252)Fisheries Finance Traditional Loans (2,628) 11 (86) 804 (1,899)Bering Sea and Aleutian Islands
Non-Pollock Buyback Loans (843) 870 - - 27
Total $ (3,890) $ 885 $ (99) $ 980 $ (2,124)
Modifications and Reestimates:
FY 2014 FY 2014
Direct Loan ProgramTotal
ModificationsInterest RateReestimates
TechnicalReestimates
TotalReestimates
Bering Sea and Aleutian Islands Non-Pollock Buyback Loans $ - $ - $ (594) $ (594)
Bering Sea Pollock Fishery Buyback - - (3) (3)Crab Buyback Loans - - 2,883 2,883Fisheries Finance IFQ Loans - - (328) (328)Fisheries Finance Traditional Loans - - 9,125 9,125Pacific Groundfish Buyback Loans - - 1,200 1,200Alaska Purse Seine Fishery Buyback Loans - - (399) (399)
Total $ - $ - $ 11,884 $ 11,884
FY 2013 FY 2013
Direct Loan ProgramTotal
ModificationsInterest RateReestimates
TechnicalReestimates
TotalReestimates
Bering Sea and Aleutian Islands Non-Pollock Buyback Loans $ - $ - $ 1,206 $ 1,206
Bering Sea Pollock Fishery Buyback - - 30 30Crab Buyback Loans - - 618 618Fisheries Finance IFQ Loans - - (3) (3)Fisheries Finance Traditional Loans - - (953) (953)Fisheries Finance Traditional Loans - - (465) (465)Alaska Purse Seine Fishery Buyback Loans - - (462) (462)
Total $ - $ - $ (29) $ (29)
FY 20 14 AGENCY F I NANC IAL REPORT | 7 1
N O T E S T O T H E F I N A N C I A L S T A T E M E N T S
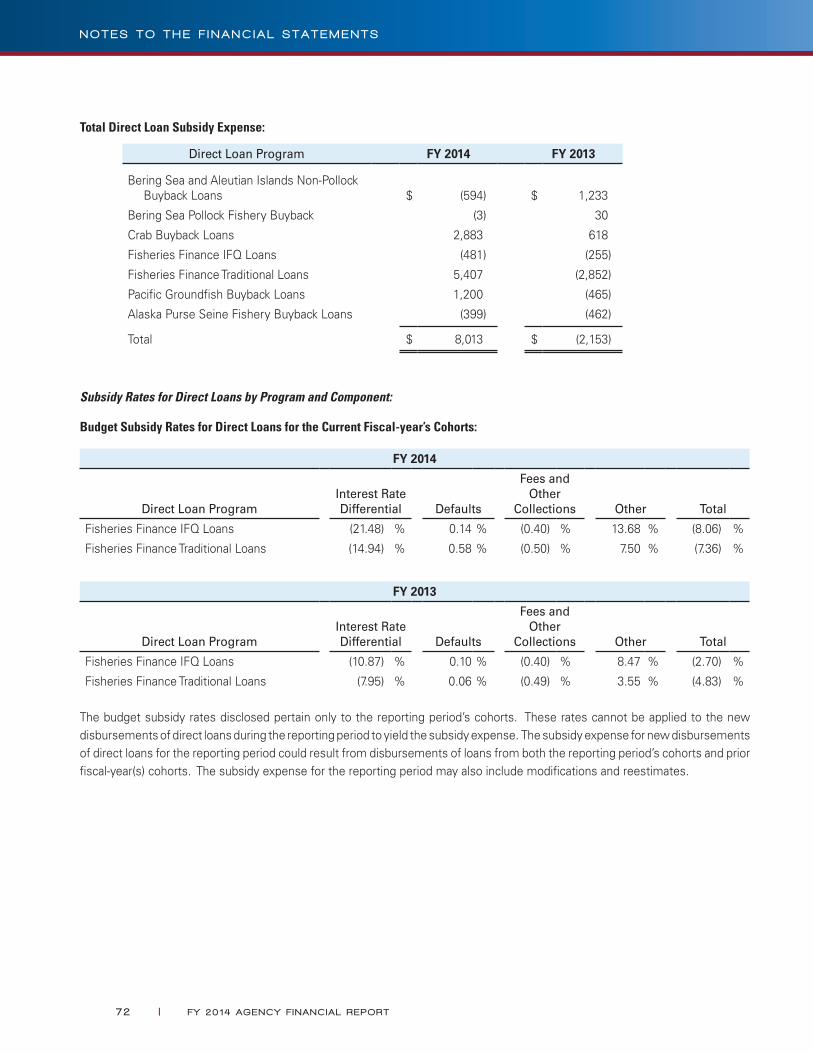
Total Direct Loan Subsidy Expense:
Direct Loan Program FY 2014 FY 2013
Bering Sea and Aleutian Islands Non-Pollock Buyback Loans $ (594) $ 1,233
Bering Sea Pollock Fishery Buyback (3) 30
Crab Buyback Loans 2,883 618
Fisheries Finance IFQ Loans (481) (255)
Fisheries Finance Traditional Loans 5,407 (2,852)
Pacific Groundfish Buyback Loans 1,200 (465)
Alaska Purse Seine Fishery Buyback Loans (399) (462)
Total $ 8,013 $ (2,153)
Subsidy Rates for Direct Loans by Program and Component:
Budget Subsidy Rates for Direct Loans for the Current Fiscal-year’s Cohorts:
FY 2014
Direct Loan ProgramInterest RateDifferential Defaults
Fees and Other
Collections Other Total
Fisheries Finance IFQ Loans (21.48) % 0.14 % (0.40) % 13.68 % (8.06) %
Fisheries Finance Traditional Loans (14.94) % 0.58 % (0.50) % 7.50 % (7.36) %
FY 2013
Direct Loan ProgramInterest RateDifferential Defaults
Fees and Other
Collections Other Total
Fisheries Finance IFQ Loans (10.87) % 0.10 % (0.40) % 8.47 % (2.70) %
Fisheries Finance Traditional Loans (7.95) % 0.06 % (0.49) % 3.55 % (4.83) %
The budget subsidy rates disclosed pertain only to the reporting period’s cohorts. These rates cannot be applied to the new disbursements of direct loans during the reporting period to yield the subsidy expense. The subsidy expense for new disbursements of direct loans for the reporting period could result from disbursements of loans from both the reporting period’s cohorts and prior fiscal-year(s) cohorts. The subsidy expense for the reporting period may also include modifications and reestimates.
72 | FY 20 14 AGENCY F I NANC IAL REPORT
N O T E S T O T H E F I N A N C I A L S T A T E M E N T S
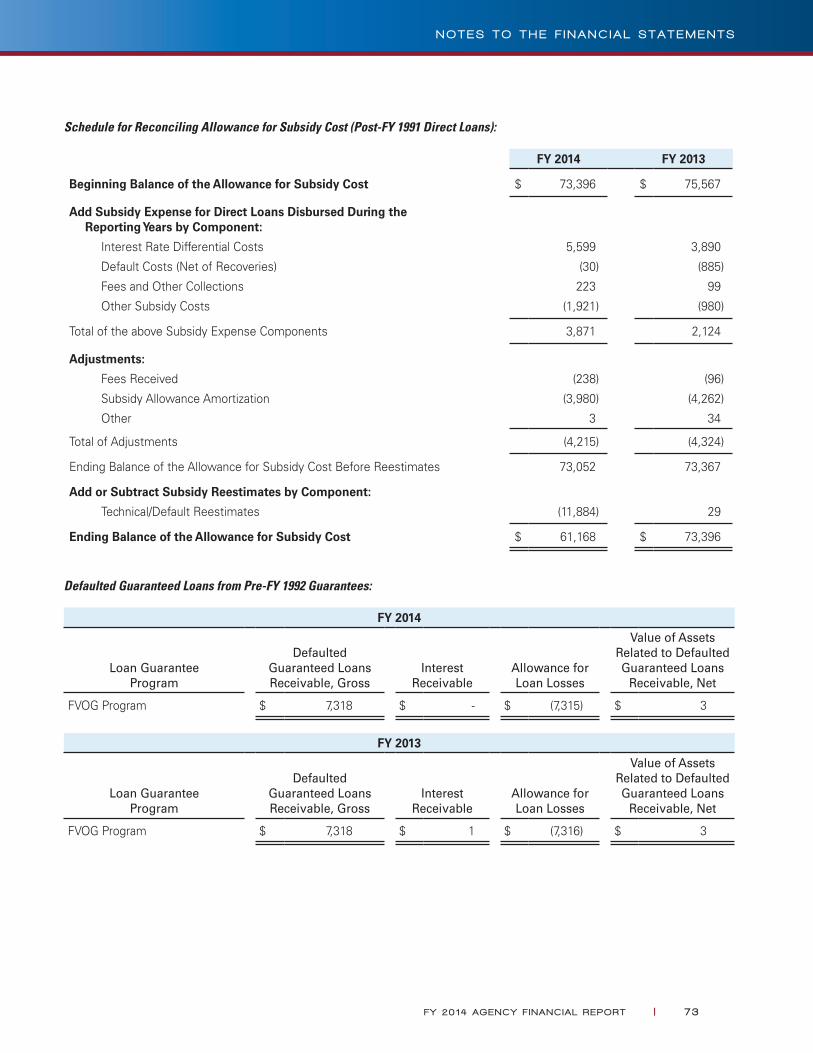
Schedule for Reconciling Allowance for Subsidy Cost (Post-FY 1991 Direct Loans):
FY 2014 FY 2013
Beginning Balance of the Allowance for Subsidy Cost $ 73,396 $ 75,567
Add Subsidy Expense for Direct Loans Disbursed During the Reporting Years by Component:
Interest Rate Differential Costs 5,599 3,890
Default Costs (Net of Recoveries) (30) (885)
Fees and Other Collections 223 99
Other Subsidy Costs (1,921) (980)
Total of the above Subsidy Expense Components 3,871 2,124
Adjustments:
Fees Received (238) (96)
Subsidy Allowance Amortization (3,980) (4,262)
Other 3 34
Total of Adjustments (4,215) (4,324)
Ending Balance of the Allowance for Subsidy Cost Before Reestimates 73,052 73,367
Add or Subtract Subsidy Reestimates by Component:
Technical/Default Reestimates (11,884) 29
Ending Balance of the Allowance for Subsidy Cost $ 61,168 $ 73,396
Defaulted Guaranteed Loans from Pre-FY 1992 Guarantees:
FY 2014
Loan GuaranteeProgram
DefaultedGuaranteed Loans Receivable, Gross
InterestReceivable
Allowance for Loan Losses
Value of Assets Related to Defaulted Guaranteed Loans
Receivable, Net
FVOG Program $ 7,318 $ - $ (7,315) $ 3
FY 2013
Loan GuaranteeProgram
DefaultedGuaranteed Loans Receivable, Gross
InterestReceivable
Allowance for Loan Losses
Value of Assets Related to Defaulted Guaranteed Loans
Receivable, Net
FVOG Program $ 7,318 $ 1 $ (7,316) $ 3
FY 20 14 AGENCY F I NANC IAL REPORT | 73
N O T E S T O T H E F I N A N C I A L S T A T E M E N T S

Defaulted Guaranteed Loans from Post-FY 1991 Guarantees:
FY 2014
Loan GuaranteeProgram
DefaultedGuaranteed Loans Receivable, Gross
InterestReceivable
Allowance for Subsidy Cost
(Present Value)
Value of Assets Related to Defaulted Guaranteed Loans
Receivable, Net
FVOG Program $ 14,128 $ 1,254 $ (14,866) $ 516
FY 2013
Loan GuaranteeProgram
DefaultedGuaranteed Loans Receivable, Gross
InterestReceivable
Allowance for Subsidy Cost
(Present Value)
Value of Assets Related to Defaulted Guaranteed Loans
Receivable, Net
FVOG Program $ 14,128 $ 1,254 $ (14,866) $ 516
Loan Guarantees:
Guaranteed Loans Outstanding:
Outstanding non-acquired guaranteed loans as of September 30, 2014 and 2013, which are not reflected in the financial statements, are as follows:
FY 2014 FY 2013
Loan GuaranteeProgram
OutstandingPrincipal of
Guaranteed Loans,Face Value
Amount of Outstanding
Principal Guaranteed
OutstandingPrincipal of
Guaranteed Loans,Face Value
Amount of Outstanding
Principal Guaranteed
FVOG Program $ 157 $ 157 $ 1,195 $ 1,195
New Guaranteed Loans Disbursed:
There were no new guaranteed loans disbursed during FY 2014 and FY 2013.
Loan Guarantee Liabilities:
FY 2014 FY 2013
Loan Guarantee Program
Loan Guarantee Liabilities for Post-
FY 1991 Guarantees, Present Value
Loan Guarantee Liabilities for Post-
FY 1991 Guarantees, Present Value
FVOG Program $ 516 $ 516
74 | FY 20 14 AGENCY F I NANC IAL REPORT
N O T E S T O T H E F I N A N C I A L S T A T E M E N T S
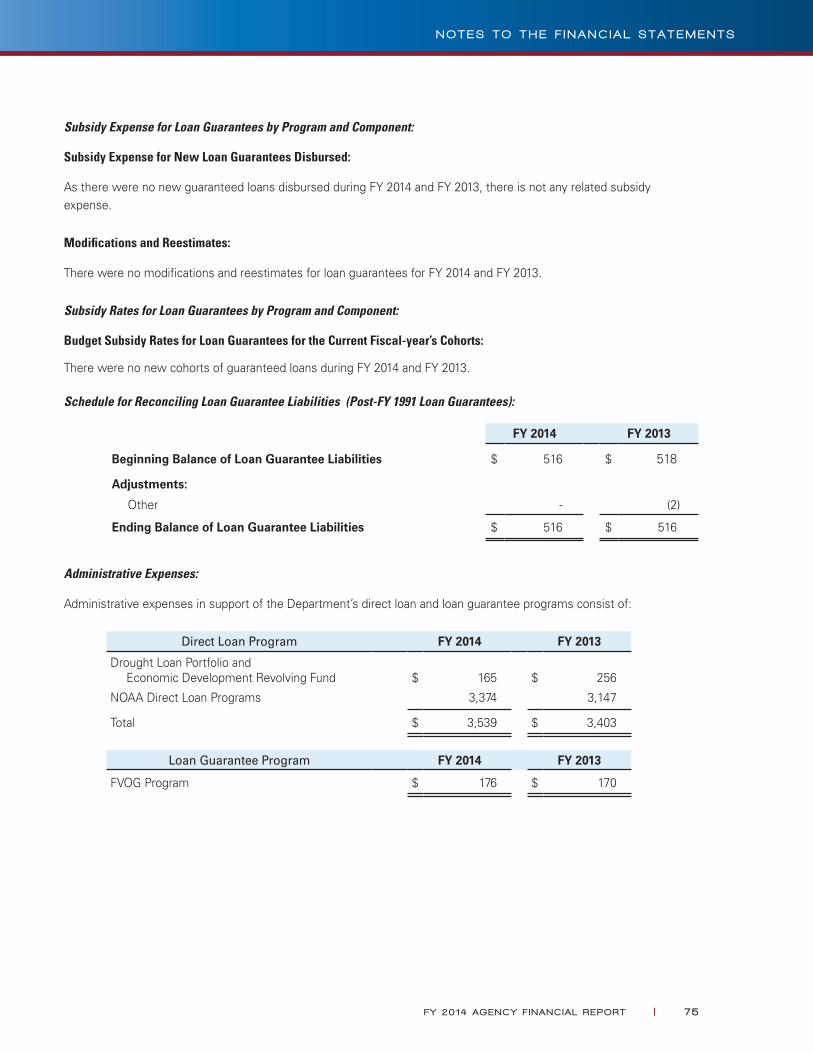
Subsidy Expense for Loan Guarantees by Program and Component:
Subsidy Expense for New Loan Guarantees Disbursed:
As there were no new guaranteed loans disbursed during FY 2014 and FY 2013, there is not any related subsidy expense.
Modifications and Reestimates:
There were no modifications and reestimates for loan guarantees for FY 2014 and FY 2013.
Subsidy Rates for Loan Guarantees by Program and Component:
Budget Subsidy Rates for Loan Guarantees for the Current Fiscal-year’s Cohorts:
There were no new cohorts of guaranteed loans during FY 2014 and FY 2013.
Schedule for Reconciling Loan Guarantee Liabilities (Post-FY 1991 Loan Guarantees):
FY 2014 FY 2013
Beginning Balance of Loan Guarantee Liabilities $ 516 $ 518
Adjustments:
Other - (2)
Ending Balance of Loan Guarantee Liabilities $ 516 $ 516
Administrative Expenses:
Administrative expenses in support of the Department’s direct loan and loan guarantee programs consist of:
Direct Loan Program FY 2014 FY 2013
Drought Loan Portfolio and Economic Development Revolving Fund $ 165 $ 256
NOAA Direct Loan Programs 3,374 3,147
Total $ 3,539 $ 3,403
Loan Guarantee Program FY 2014 FY 2013
FVOG Program $ 176 $ 170
FY 20 14 AGENCY F I NANC IAL REPORT | 75
N O T E S T O T H E F I N A N C I A L S T A T E M E N T S

NOTE 6. INVENTORY, MATERIALS, AND SUPPLIES, NET
Category Cost Flow Assumption FY 2014 FY 2013
Inventory
Items Held for Current Sale
NIST Standard Reference Materials Average $ 22,379 $ 22,087
Other Various 325 305
Allowance for Excess, Obsolete, and Unserviceable Items (73) (60)
Total Inventory, Net 22,631 22,332
Materials and Supplies
Items Held for Use
NOAA’s National Logistics Support Center Weighted-average 51,020 51,507
Other Various 5,100 5,168
Items Held for Repair
NOAA’s National Reconditioning Center Weighted-average 36,332 39,761
Allowance for Excess, Obsolete, and Unserviceable Items (15,045) (19,161)
Total Materials and Supplies, Net 77,407 77,275
Total $ 100,038 $ 99,607
NIST’s Standard Reference Materials Program provides reference materials for quality assurance of measurements, while NOAA’s Materials and Supplies are primarily repair parts for weather forecasting equipment.
76 | FY 20 14 AGENCY F I NANC IAL REPORT
N O T E S T O T H E F I N A N C I A L S T A T E M E N T S
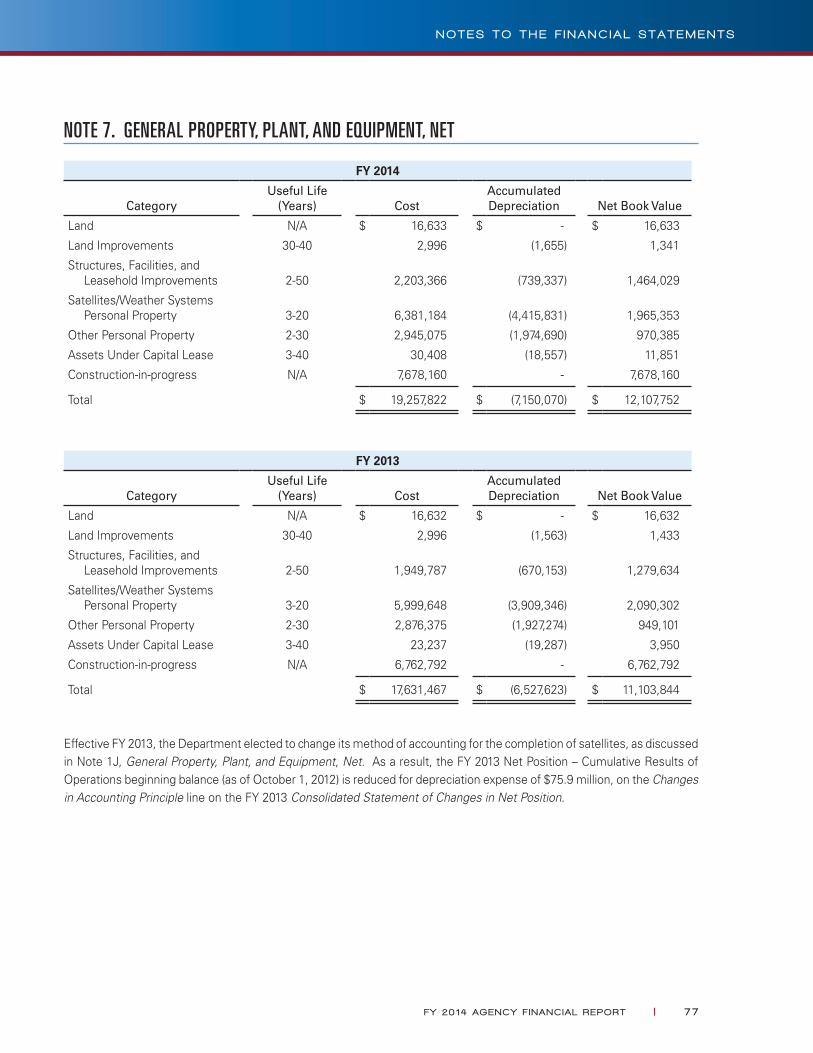
NOTE 7. GENERAL PROPERTY, PLANT, AND EQUIPMENT, NET
FY 2014
CategoryUseful Life
(Years) CostAccumulatedDepreciation Net Book Value
Land N/A $ 16,633 $ - $ 16,633
Land Improvements 30-40 2,996 (1,655) 1,341
Structures, Facilities, and Leasehold Improvements 2-50 2,203,366 (739,337) 1,464,029
Satellites/Weather Systems Personal Property 3-20 6,381,184 (4,415,831) 1,965,353
Other Personal Property 2-30 2,945,075 (1,974,690) 970,385
Assets Under Capital Lease 3-40 30,408 (18,557) 11,851
Construction-in-progress N/A 7,678,160 - 7,678,160
Total $ 19,257,822 $ (7,150,070) $ 12,107,752
FY 2013
CategoryUseful Life
(Years) CostAccumulatedDepreciation Net Book Value
Land N/A $ 16,632 $ - $ 16,632
Land Improvements 30-40 2,996 (1,563) 1,433
Structures, Facilities, and Leasehold Improvements 2-50 1,949,787 (670,153) 1,279,634
Satellites/Weather Systems Personal Property 3-20 5,999,648 (3,909,346) 2,090,302
Other Personal Property 2-30 2,876,375 (1,927,274) 949,101
Assets Under Capital Lease 3-40 23,237 (19,287) 3,950
Construction-in-progress N/A 6,762,792 - 6,762,792
Total $ 17,631,467 $ (6,527,623) $ 11,103,844
Effective FY 2013, the Department elected to change its method of accounting for the completion of satellites, as discussed in Note 1J, General Property, Plant, and Equipment, Net. As a result, the FY 2013 Net Position – Cumulative Results of Operations beginning balance (as of October 1, 2012) is reduced for depreciation expense of $75.9 million, on the Changes in Accounting Principle line on the FY 2013 Consolidated Statement of Changes in Net Position.
FY 20 14 AGENCY F I NANC IAL REPORT | 77
N O T E S T O T H E F I N A N C I A L S T A T E M E N T S
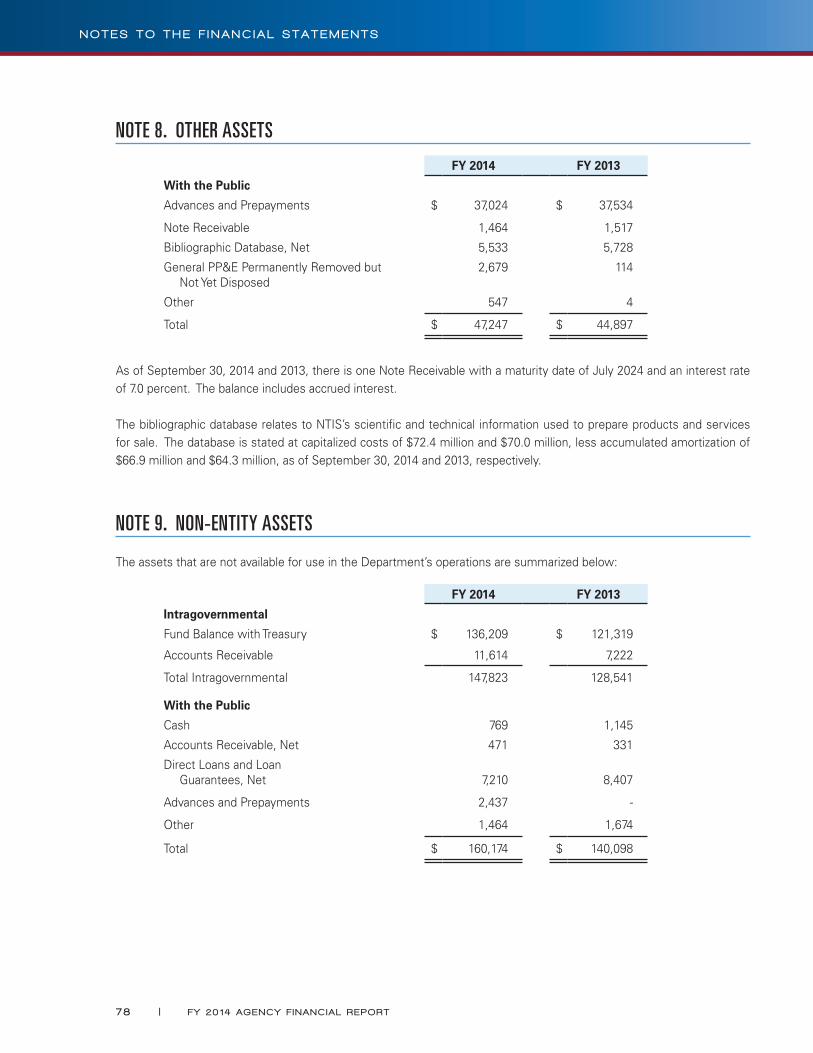
NOTE 8. OTHER ASSETS
FY 2014 FY 2013
With the Public
Advances and Prepayments $ 37,024 $ 37,534
Note Receivable 1,464 1,517
Bibliographic Database, Net 5,533 5,728
General PP&E Permanently Removed but Not Yet Disposed
2,679 114
Other 547 4
Total $ 47,247 $ 44,897
As of September 30, 2014 and 2013, there is one Note Receivable with a maturity date of July 2024 and an interest rate of 7.0 percent. The balance includes accrued interest.
The bibliographic database relates to NTIS’s scientific and technical information used to prepare products and services for sale. The database is stated at capitalized costs of $72.4 million and $70.0 million, less accumulated amortization of $66.9 million and $64.3 million, as of September 30, 2014 and 2013, respectively.
NOTE 9. NON-ENTITY ASSETS
The assets that are not available for use in the Department’s operations are summarized below:
FY 2014 FY 2013
Intragovernmental
Fund Balance with Treasury $ 136,209 $ 121,319
Accounts Receivable 11,614 7,222
Total Intragovernmental 147,823 128,541
With the Public
Cash 769 1,145
Accounts Receivable, Net 471 331
Direct Loans and Loan Guarantees, Net 7,210 8,407
Advances and Prepayments 2,437 -
Other 1,464 1,674
Total $ 160,174 $ 140,098
78 | FY 20 14 AGENCY F I NANC IAL REPORT
N O T E S T O T H E F I N A N C I A L S T A T E M E N T S
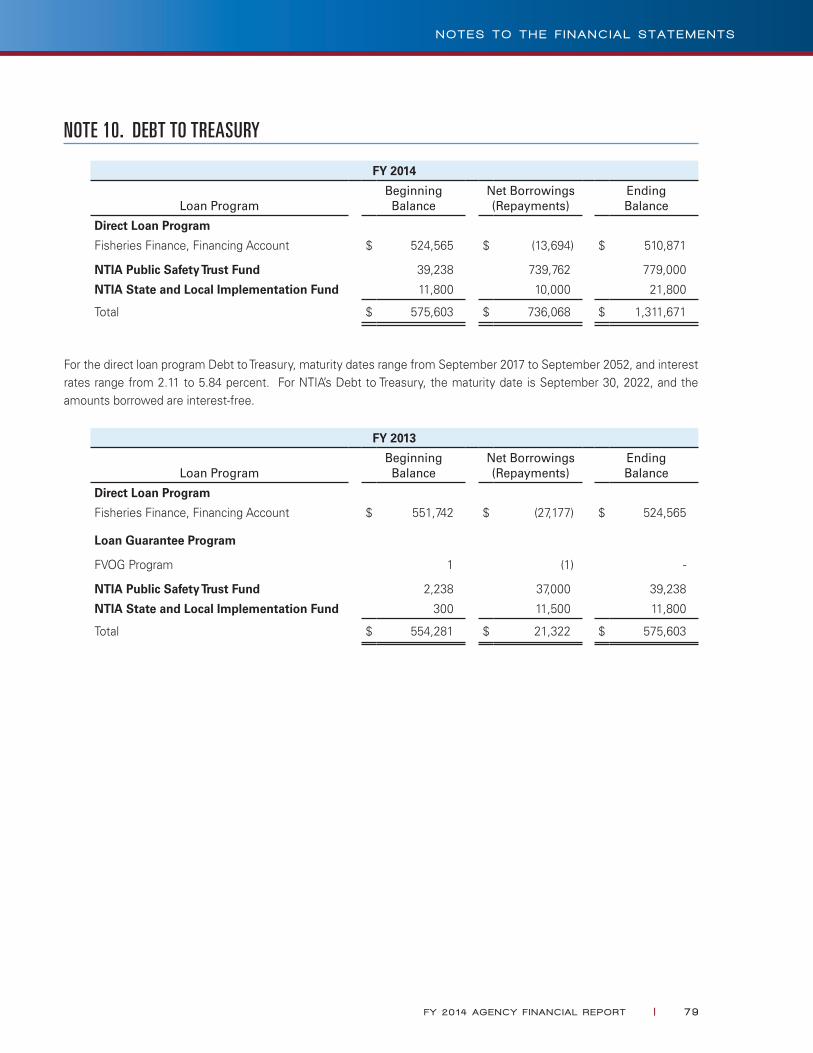
NOTE 10. DEBT TO TREASURY
FY 2014
Loan ProgramBeginningBalance
Net Borrowings (Repayments)
Ending Balance
Direct Loan Program
Fisheries Finance, Financing Account $ 524,565 $ (13,694) $ 510,871
NTIA Public Safety Trust Fund 39,238 739,762 779,000
NTIA State and Local Implementation Fund 11,800 10,000 21,800
Total $ 575,603 $ 736,068 $ 1,311,671
For the direct loan program Debt to Treasury, maturity dates range from September 2017 to September 2052, and interest rates range from 2.11 to 5.84 percent. For NTIA’s Debt to Treasury, the maturity date is September 30, 2022, and the amounts borrowed are interest-free.
FY 2013
Loan ProgramBeginningBalance
Net Borrowings (Repayments)
Ending Balance
Direct Loan Program
Fisheries Finance, Financing Account $ 551,742 $ (27,177) $ 524,565
Loan Guarantee Program
FVOG Program 1 (1) -
NTIA Public Safety Trust Fund 2,238 37,000 39,238
NTIA State and Local Implementation Fund 300 11,500 11,800
Total $ 554,281 $ 21,322 $ 575,603
FY 20 14 AGENCY F I NANC IAL REPORT | 79
N O T E S T O T H E F I N A N C I A L S T A T E M E N T S

NOTE 11. OTHER LIABILITIES
FY 2014 FY 2013
Current PortionNon-current
Portion Total Total
Intragovernmental
Accrued FECA Liability $ 24,896 $ 8,612 $ 33,508 $ 35,505
Accrued Benefits 39,718 - 39,718 30,608
Custodial Activity 62 299 361 230
Downward Subsidy Reestimates Payable to Treasury 11,614 - 11,614 7,222
Other 752 - 752 940
Total $ 77,042 $ 8,911 $ 85,953 $ 74,505
With the Public
ITA Foreign Service Nationals’ Voluntary Separation Pay $ 2,558 $ 8,678 $ 11,236 $ 12,222
Contingent Liabilities (Note 16) 409 - 409 625
Employment-related 1,416 - 1,416 5,842
Other 7,058 - 7,058 45,411
Total $ 11,441 $ 8,678 $ 20,119 $ 64,100
The Current Portion represents liabilities expected to be paid by September 30, 2015, while the Non-current Portion represents liabilities expected to be paid after September 30, 2015.
80 | FY 20 14 AGENCY F I NANC IAL REPORT
N O T E S T O T H E F I N A N C I A L S T A T E M E N T S

NOTE 12. FEDERAL EMPLOYEE BENEFITS
FY 2014 FY 2013
Actuarial FECA Liability $ 226,371 $ 242,691
NOAA Corps Retirement System Liability 632,800 612,200
NOAA Corps Post-retirement Health Benefits Liability 39,600 42,300
Total $ 898,771 $ 897,191
Actuarial FECA Liability:
Actuarial FECA liability is calculated annually, as of September 30. For discounting projected annual future benefit payments to present value, the interest rate assumptions used by DOL were as follows:
FY 2014 FY 2013
Year 1 3.46% 2.73%
Year 2 and Thereafter 3.46% 3.13%
The wage inflation factors (Cost of Living Allowance) and medical inflation factors (Consumer Price Index - Medical) applied to the calculation of projected future benefits, and also used to adjust the methodology’s historical payments to current-year constant dollars, were as follows:
FY 2014
Fiscal YearCost of Living
AllowanceConsumer Price Index - Medical
2015 1.73% 2.93%
2016 2.17% 3.76%
2017 2.13% 3.86%
2018 2.23% 3.90%
2019 2.30% 3.90%
FY 2013
Fiscal YearCost of Living
AllowanceConsumer Price Index - Medical
2014 1.67% 3.46%
2015 1.80% 3.82%
2016 2.20% 3.83%
2017 2.20% 3.82%
2018 2.20% 3.82%
FY 20 14 AGENCY F I NANC IAL REPORT | 8 1
N O T E S T O T H E F I N A N C I A L S T A T E M E N T S
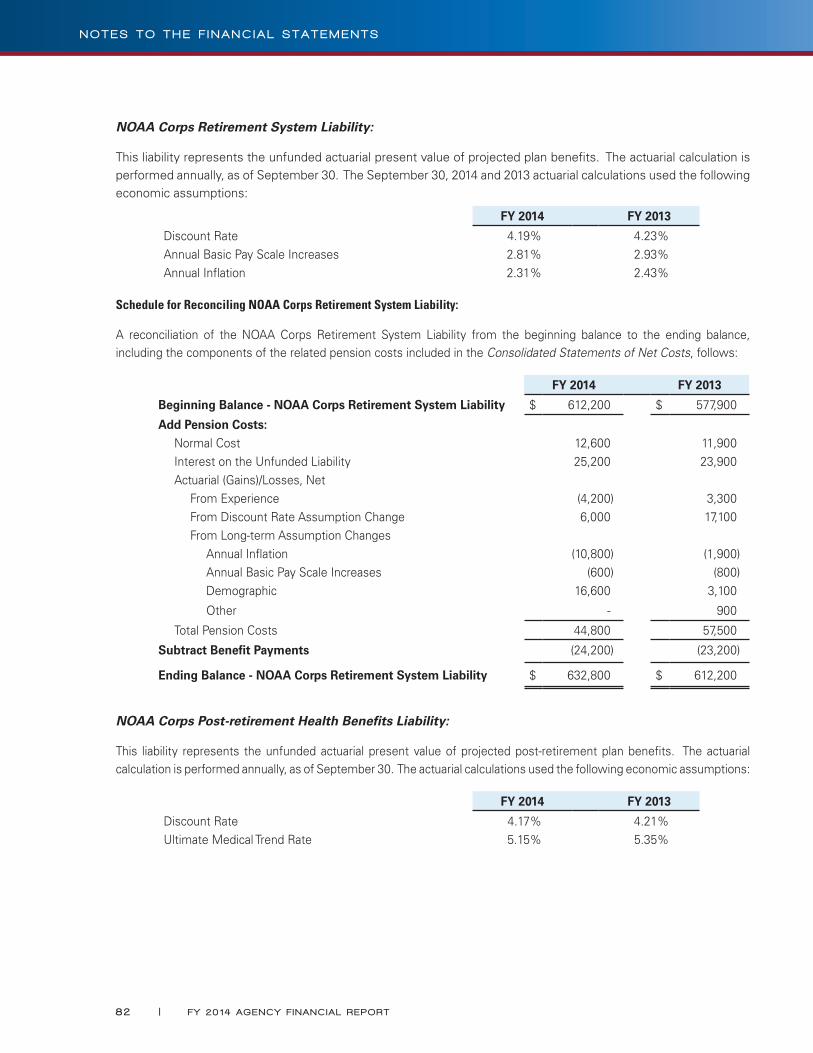
NOAA Corps Retirement System Liability:
This liability represents the unfunded actuarial present value of projected plan benefits. The actuarial calculation is performed annually, as of September 30. The September 30, 2014 and 2013 actuarial calculations used the following economic assumptions:
FY 2014 FY 2013
Discount Rate 4.19% 4.23%Annual Basic Pay Scale Increases 2.81% 2.93%Annual Inflation 2.31% 2.43%
Schedule for Reconciling NOAA Corps Retirement System Liability:
A reconciliation of the NOAA Corps Retirement System Liability from the beginning balance to the ending balance, including the components of the related pension costs included in the Consolidated Statements of Net Costs, follows:
FY 2014 FY 2013
Beginning Balance - NOAA Corps Retirement System Liability $ 612,200 $ 577,900
Add Pension Costs:Normal Cost 12,600 11,900Interest on the Unfunded Liability 25,200 23,900Actuarial (Gains)/Losses, Net
From Experience (4,200) 3,300From Discount Rate Assumption Change 6,000 17,100From Long-term Assumption Changes
Annual Inflation (10,800) (1,900)Annual Basic Pay Scale Increases (600) (800)Demographic 16,600 3,100
Other - 900
Total Pension Costs 44,800 57,500
Subtract Benefit Payments (24,200) (23,200)
Ending Balance - NOAA Corps Retirement System Liability $ 632,800 $ 612,200
NOAA Corps Post-retirement Health Benefits Liability:
This liability represents the unfunded actuarial present value of projected post-retirement plan benefits. The actuarial calculation is performed annually, as of September 30. The actuarial calculations used the following economic assumptions:
FY 2014 FY 2013
Discount Rate 4.17% 4.21%Ultimate Medical Trend Rate 5.15% 5.35%
82 | FY 20 14 AGENCY F I NANC IAL REPORT
N O T E S T O T H E F I N A N C I A L S T A T E M E N T S

Schedule for Reconciling NOAA Corps Post-retirement Health Benefits Liability:
A reconciliation of the NOAA Corps Post-retirement Health Benefits Liability from the beginning balance to the ending balance, including the components of the related post-retirement health benefits costs included in the Consolidated Statements of Net Costs, follows:
FY 2014 FY 2013
Beginning Balance - NOAA Corps Post-retirement Health Benefits Liability $ 42,300 $ 45,100
Add Health Benefits Costs:Normal Cost 1,300 1,400 Interest on the Unfunded Liability 1,800 1,800Actuarial (Gains)/Losses, Net
From Experience 800 1,200From Discount Rate Assumption Change 200 600From Long-term Assumption Changes
Medical Claims Costs (4,500) (5,300)Other 300 100
Total Health Benefits Costs (100) (200)
Subtract Benefit Payments (2,600) (2,600)
Ending Balance - NOAA Corps Post-retirement Health Benefits Liability $ 39,600 $ 42,300
NOTE 13. ENVIRONMENTAL AND DISPOSAL LIABILITIES
FY 2014 FY 2013
Asbestos-related Cleanup Costs $ 85,907 $ 95,832Nuclear Reactor 60,122 56,232Pribilof Islands 1,950 2,074Non-reactor Radiological Facilities 7,320 -Other 2,204 2,535
Total $ 157,503 $ 156,673
The Department has incurred asbestos-related cleanup costs related to the costs of removing, containing, and/or disposing of asbestos-containing materials from property, plant, and equipment, specifically from facilities owned by NIST and NOAA and from ships owned by NOAA. Effective FY 2013, the Department implemented Technical Bulletin 2006-1, Recognition and Measurement of Asbestos-related Cleanup Costs, which clarifies required recognition of liabilities and expenses for asbestos-related cleanup costs. Prior to this technical bulletin, most federal entities had recognized liabilities for the removal of asbestos that posed an immediate health threat (i.e., friable asbestos), but many federal entities had not prepared an estimate of cleanup costs for the future removal of asbestos that did not pose an immediate health threat (i.e., nonfriable asbestos). The Federal Accounting Standards Advisory Board determined that additional guidance was needed to clarify that federal entities need to estimate all asbestos-related cleanup costs, and not just those costs related to asbestos that require immediate cleanup. The FY 2013 beginning liability balance (as of October 1, 2012) for asbestos-related cleanup costs of $93.4 million is recorded as a Change in Accounting Principle on the FY 2013 Consolidated Statement of Changes in Net Position.
FY 20 14 AGENCY F I NANC IAL REPORT | 83
N O T E S T O T H E F I N A N C I A L S T A T E M E N T S

NOTE 14. LEASES
Capital Leases:
Assets under capital leases are as follows:
FY 2014 FY 2013
Structures, Facilities, and Leasehold Improvements $ 18,527 $ 22,957
Equipment 11,881 280
Less: Accumulated Depreciation (18,557) (19,287)
Net Assets Under Capital Leases $ 11,851 $ 3,950
Capital Lease Liabilities are primarily related to NOAA. NOAA has real property capital leases covering both land and buildings. The majority of these leases are for weather forecasting offices, but the leases are also for radar system sites, river forecasting centers, and National Weather Service enforcement centers. NOAA’s real property capital leases range from 10 to 40 years.
Capital Lease Liabilities:
Future payments due under capital leases are as follows:
FY 2014
General PP&E Category
Fiscal Year Real Property Personal Property Total
2015 $ 1,956 $ 1,280 $ 3,236
2016 904 449 1,353
2017 839 449 1,288
2018 839 - 839
2019 551 - 551
Thereafter 7,940 - 7,940
Total Future Lease Payments 13,029 2,178 15,207
Less: Imputed Interest (6,741) (39) (6,780)
Less: Executory Costs (2,082) - (2,082)
Net Capital Lease Liabilities $ 4,206 $ 2,139 $ 6,345
84 | FY 20 14 AGENCY F I NANC IAL REPORT
N O T E S T O T H E F I N A N C I A L S T A T E M E N T S
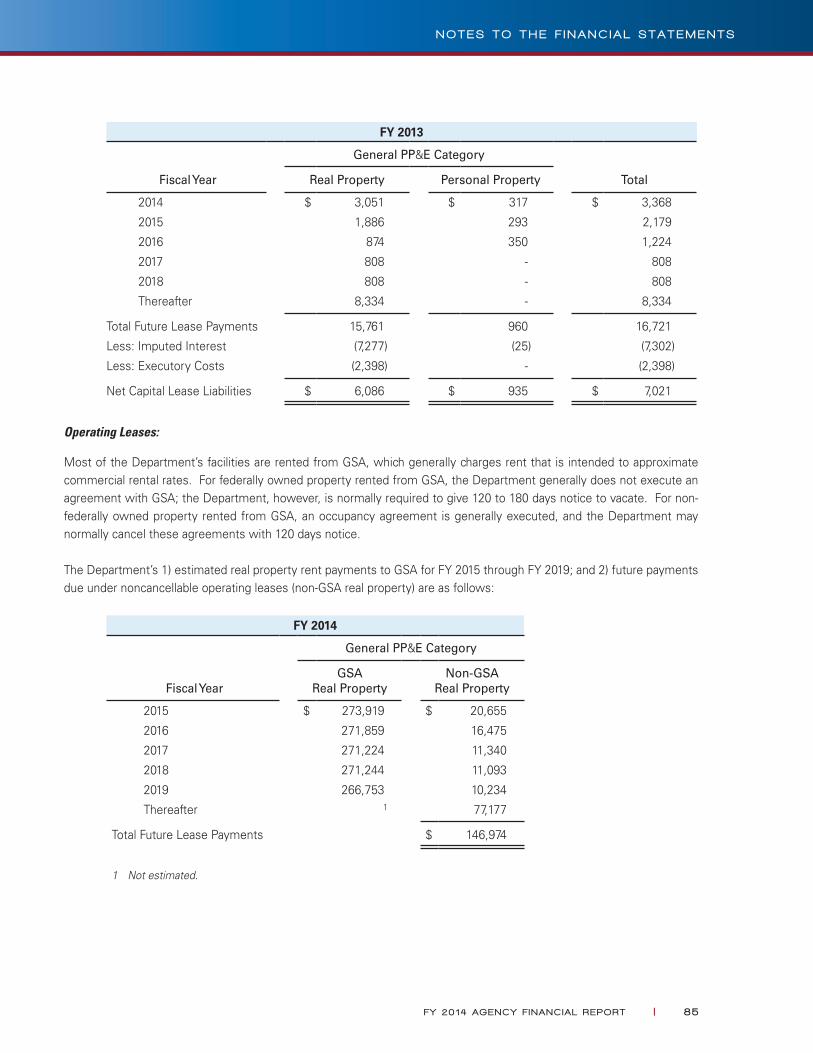
FY 2013
General PP&E Category
Fiscal Year Real Property Personal Property Total
2014 $ 3,051 $ 317 $ 3,368
2015 1,886 293 2,179
2016 874 350 1,224
2017 808 - 808
2018 808 - 808
Thereafter 8,334 - 8,334
Total Future Lease Payments 15,761 960 16,721
Less: Imputed Interest (7,277) (25) (7,302)
Less: Executory Costs (2,398) - (2,398)
Net Capital Lease Liabilities $ 6,086 $ 935 $ 7,021
Operating Leases:
Most of the Department’s facilities are rented from GSA, which generally charges rent that is intended to approximate commercial rental rates. For federally owned property rented from GSA, the Department generally does not execute an agreement with GSA; the Department, however, is normally required to give 120 to 180 days notice to vacate. For non-federally owned property rented from GSA, an occupancy agreement is generally executed, and the Department may normally cancel these agreements with 120 days notice.
The Department’s 1) estimated real property rent payments to GSA for FY 2015 through FY 2019; and 2) future payments due under noncancellable operating leases (non-GSA real property) are as follows:
FY 2014
General PP&E Category
Fiscal YearGSA
Real PropertyNon-GSA
Real Property
2015 $ 273,919 $ 20,655
2016 271,859 16,475
2017 271,224 11,340
2018 271,244 11,093
2019 266,753 10,234
Thereafter 1 77,177
Total Future Lease Payments $ 146,974
1 Not estimated.
FY 20 14 AGENCY F I NANC IAL REPORT | 85
N O T E S T O T H E F I N A N C I A L S T A T E M E N T S
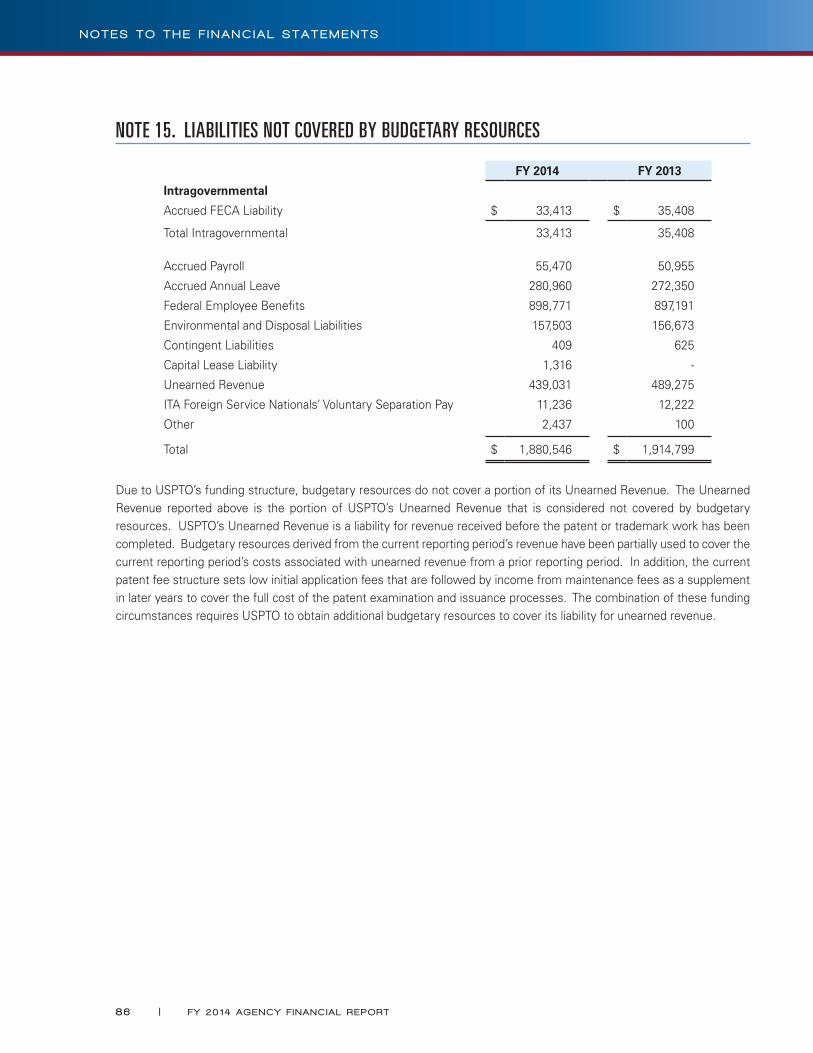
NOTE 15. LIABILITIES NOT COVERED BY BUDGETARY RESOURCES
FY 2014 FY 2013
Intragovernmental
Accrued FECA Liability $ 33,413 $ 35,408
Total Intragovernmental 33,413 35,408
Accrued Payroll 55,470 50,955
Accrued Annual Leave 280,960 272,350
Federal Employee Benefits 898,771 897,191
Environmental and Disposal Liabilities 157,503 156,673
Contingent Liabilities 409 625
Capital Lease Liability 1,316 -
Unearned Revenue 439,031 489,275
ITA Foreign Service Nationals’ Voluntary Separation Pay 11,236 12,222
Other 2,437 100
Total $ 1,880,546 $ 1,914,799
Due to USPTO’s funding structure, budgetary resources do not cover a portion of its Unearned Revenue. The Unearned Revenue reported above is the portion of USPTO’s Unearned Revenue that is considered not covered by budgetary resources. USPTO’s Unearned Revenue is a liability for revenue received before the patent or trademark work has been completed. Budgetary resources derived from the current reporting period’s revenue have been partially used to cover the current reporting period’s costs associated with unearned revenue from a prior reporting period. In addition, the current patent fee structure sets low initial application fees that are followed by income from maintenance fees as a supplement in later years to cover the full cost of the patent examination and issuance processes. The combination of these funding circumstances requires USPTO to obtain additional budgetary resources to cover its liability for unearned revenue.
86 | FY 20 14 AGENCY F I NANC IAL REPORT
N O T E S T O T H E F I N A N C I A L S T A T E M E N T S
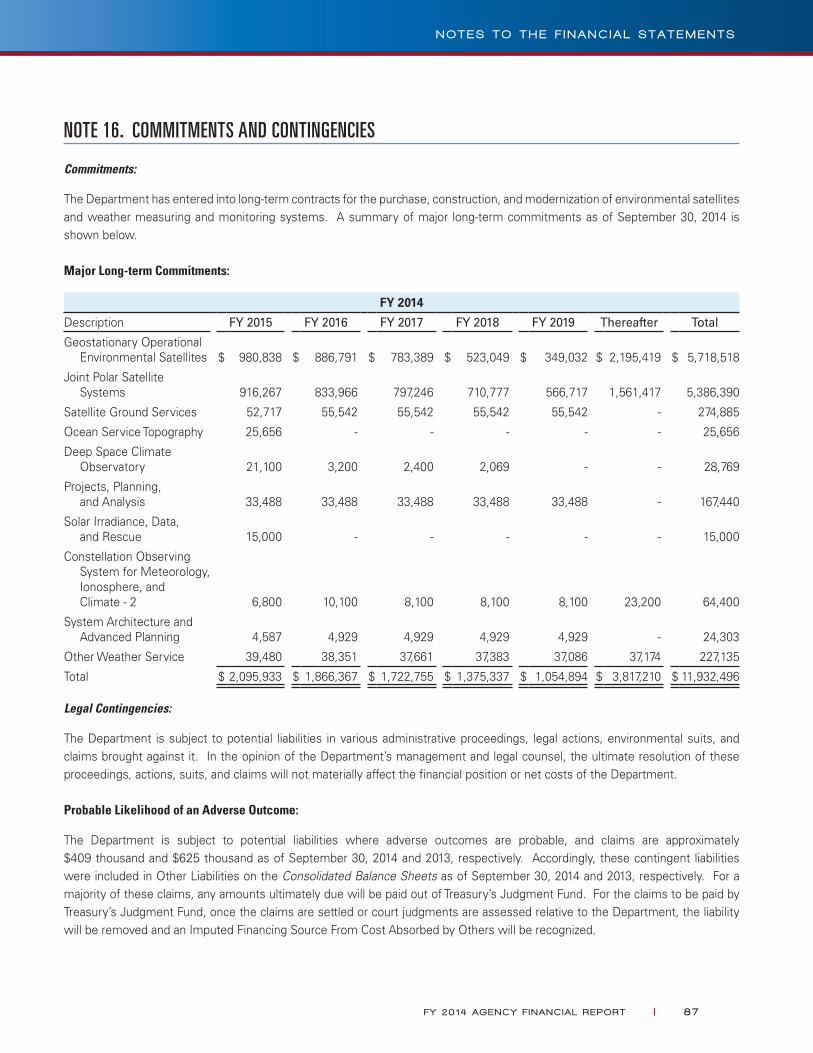
NOTE 16. COMMITMENTS AND CONTINGENCIES
Commitments:
The Department has entered into long-term contracts for the purchase, construction, and modernization of environmental satellites and weather measuring and monitoring systems. A summary of major long-term commitments as of September 30, 2014 is shown below.
Major Long-term Commitments:
FY 2014
Description FY 2015 FY 2016 FY 2017 FY 2018 FY 2019 Thereafter Total
Geostationary Operational Environmental Satellites $ 980,838 $ 886,791 $ 783,389 $ 523,049 $ 349,032 $ 2,195,419 $ 5,718,518
Joint Polar Satellite Systems 916,267 833,966 797,246 710,777 566,717 1,561,417 5,386,390
Satellite Ground Services 52,717 55,542 55,542 55,542 55,542 - 274,885
Ocean Service Topography 25,656 - - - - - 25,656
Deep Space Climate Observatory 21,100 3,200 2,400 2,069 - - 28,769
Projects, Planning, and Analysis 33,488 33,488 33,488 33,488 33,488 - 167,440
Solar Irradiance, Data, and Rescue 15,000 - - - - - 15,000
Constellation Observing System for Meteorology, Ionosphere, and Climate - 2 6,800 10,100 8,100 8,100 8,100 23,200 64,400
System Architecture and Advanced Planning 4,587 4,929 4,929 4,929 4,929 - 24,303
Other Weather Service 39,480 38,351 37,661 37,383 37,086 37,174 227,135
Total $ 2,095,933 $ 1,866,367 $ 1,722,755 $ 1,375,337 $ 1,054,894 $ 3,817,210 $ 11,932,496
Legal Contingencies:
The Department is subject to potential liabilities in various administrative proceedings, legal actions, environmental suits, and claims brought against it. In the opinion of the Department’s management and legal counsel, the ultimate resolution of these proceedings, actions, suits, and claims will not materially affect the financial position or net costs of the Department.
Probable Likelihood of an Adverse Outcome:
The Department is subject to potential liabilities where adverse outcomes are probable, and claims are approximately $409 thousand and $625 thousand as of September 30, 2014 and 2013, respectively. Accordingly, these contingent liabilities were included in Other Liabilities on the Consolidated Balance Sheets as of September 30, 2014 and 2013, respectively. For a majority of these claims, any amounts ultimately due will be paid out of Treasury’s Judgment Fund. For the claims to be paid by Treasury’s Judgment Fund, once the claims are settled or court judgments are assessed relative to the Department, the liability will be removed and an Imputed Financing Source From Cost Absorbed by Others will be recognized.
FY 20 14 AGENCY F I NANC IAL REPORT | 87
N O T E S T O T H E F I N A N C I A L S T A T E M E N T S

Reasonably Possible Likelihood of an Adverse Outcome:
The Department and other federal agencies are subject to potential liabilities for a variety of environmental cleanup costs, many of which are associated with the Second World War, at various sites within the U.S. Since some of the potential liabilities represent claims with no stated amount, the exact amount of total potential liabilities is unknown, but may exceed $267.2 million as of September 30, 2014. For these potential liabilities, it is reasonably possible that an adverse outcome will result. It is not possible, however, to speculate as to a range of loss. In the absence of a settlement agreement, decree, or judgment, there is neither an allocation of response costs between the U.S. government and other potentially responsible parties, nor is there an attribution of such costs to or among the federal agencies implicated in the claims. Although the Department has been implicated as a responsible party, the U.S. Department of Justice was unable to provide an amount for these potential liabilities that is attributable to the Department. Of these potential liabilities, all will be funded by Treasury’s Judgment Fund, if any amounts are ultimately due.
The Department and other federal agencies are subject to other potential liabilities. Since some of the potential liabilities represent claims with no stated amount, the exact amount of total potential liabilities is unknown, but may exceed $540.6 million as of September 30, 2014. For these potential liabilities, it is reasonably possible that an adverse outcome will result. It is not possible, however, to speculate as to a range of loss. Of these potential liabilities, most will be funded by Treasury’s Judgment Fund, if any amounts are ultimately due.
Guaranteed Loan Contingencies:
Fishing Vessels Obligation Guarantee Program: This loan guarantee program has outstanding non-acquired guaranteed loans (fully guaranteed by the Department) as of September 30, 2014 and 2013, with outstanding principal balances totaling $157 thousand and $1.2 million, respectively. A loan guarantee liability of $516 thousand is recorded for the outstanding guarantees as of September 30, 2014 and 2013.
Restructuring the National Polar-orbiting Operational Environmental Satellite System (NPOESS) to the Joint Polar Satellite System (JPSS):
In 2010, the Executive Office of the President directed the restructure of the government’s approach to meeting its polar-orbiting environmental data collection needs, to put the critical program on a more sustainable path towards success and announced NOAA and the Air Force will cease the joint procurement of NPOESS.
NOAA, with the National Aeronautics and Space Administration (NASA) as its acquisition agent, is responsible for JPSS, which will fly in the afternoon orbit. The U.S. Department of Defense is responsible for the early morning orbit, and will continue to provide observations in the midmorning. The agencies will continue to partner in those areas that have been successful in the past, such as sharing a common ground system. NOAA and NASA will continue to partner to ensure a successful way forward for the respective programs, while utilizing international partnerships to sustain and enhance weather and climate observation from space.
The restructuring effort primarily occurred in FY 2011. During this time, NOAA and the Air Force continued to work together to decide which program components will transfer to NOAA to become part of JPSS. During FY 2011, the following equipment and instruments were transferred to NOAA under the NASA/NOAA Memorandum of Understanding and NASA contracts: 1) ground systems equipment; 2) the Ozone Mapping and Profiler Suite (OMPS); 3) the Cross-track Infrared Sounder; and 4) the Visible Infrared Imaging Radiometer Suite Flight Model 2 for JPSS-1. As a result of the restructuring efforts, NOAA recorded additional impairment costs totaling $98.3 million in FY 2012.
88 | FY 20 14 AGENCY F I NANC IAL REPORT
N O T E S T O T H E F I N A N C I A L S T A T E M E N T S
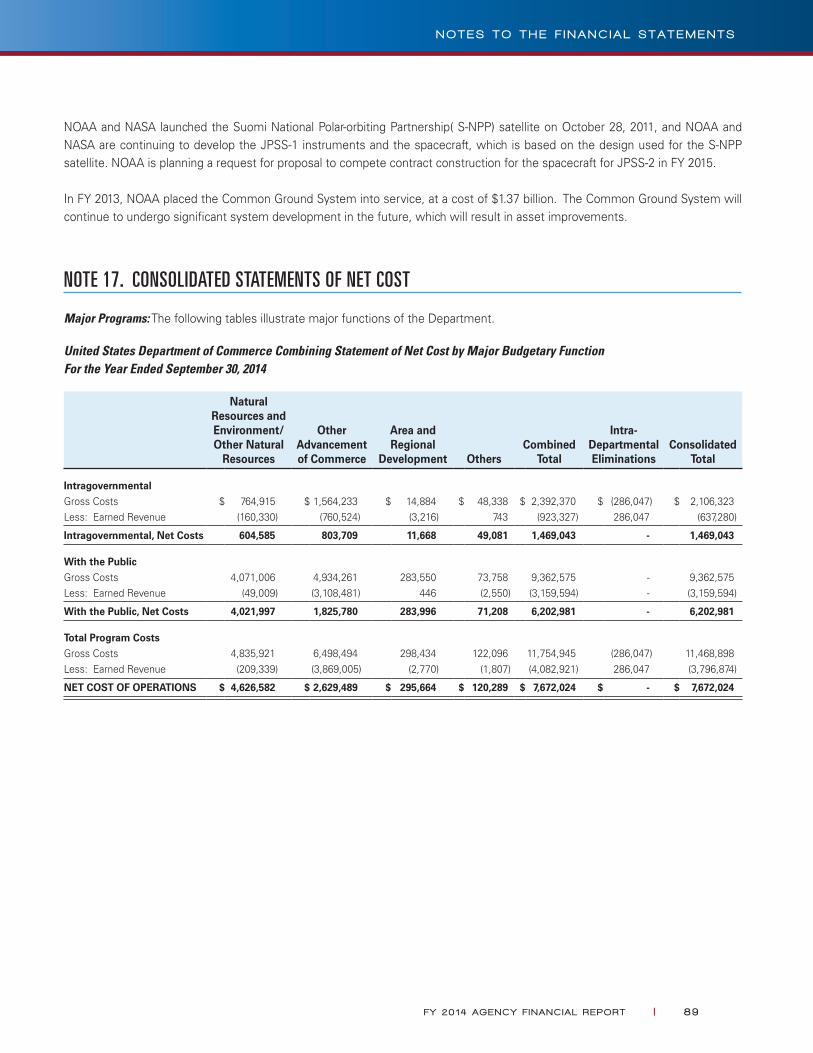
NOAA and NASA launched the Suomi National Polar-orbiting Partnership( S-NPP) satellite on October 28, 2011, and NOAA and NASA are continuing to develop the JPSS-1 instruments and the spacecraft, which is based on the design used for the S-NPP satellite. NOAA is planning a request for proposal to compete contract construction for the spacecraft for JPSS-2 in FY 2015.
In FY 2013, NOAA placed the Common Ground System into service, at a cost of $1.37 billion. The Common Ground System will continue to undergo significant system development in the future, which will result in asset improvements.
NOTE 17. CONSOLIDATED STATEMENTS OF NET COST
Major Programs: The following tables illustrate major functions of the Department.
United States Department of Commerce Combining Statement of Net Cost by Major Budgetary Function For the Year Ended September 30, 2014
Natural Resources and Environment/Other Natural
Resources
Other Advancement of Commerce
Area and Regional
Development Others Combined
Total
Intra-Departmental Eliminations
Consolidated Total
IntragovernmentalGross Costs $ 764,915 $ 1,564,233 $ 14,884 $ 48,338 $ 2,392,370 $ (286,047) $ 2,106,323Less: Earned Revenue (160,330) (760,524) (3,216) 743 (923,327) 286,047 (637,280)
Intragovernmental, Net Costs 604,585 803,709 11,668 49,081 1,469,043 - 1,469,043
With the PublicGross Costs 4,071,006 4,934,261 283,550 73,758 9,362,575 - 9,362,575Less: Earned Revenue (49,009) (3,108,481) 446 (2,550) (3,159,594) - (3,159,594)
With the Public, Net Costs 4,021,997 1,825,780 283,996 71,208 6,202,981 - 6,202,981
Total Program CostsGross Costs 4,835,921 6,498,494 298,434 122,096 11,754,945 (286,047) 11,468,898Less: Earned Revenue (209,339) (3,869,005) (2,770) (1,807) (4,082,921) 286,047 (3,796,874)
NET COST OF OPERATIONS $ 4,626,582 $ 2,629,489 $ 295,664 $ 120,289 $ 7,672,024 $ - $ 7,672,024
FY 20 14 AGENCY F I NANC IAL REPORT | 89
N O T E S T O T H E F I N A N C I A L S T A T E M E N T S
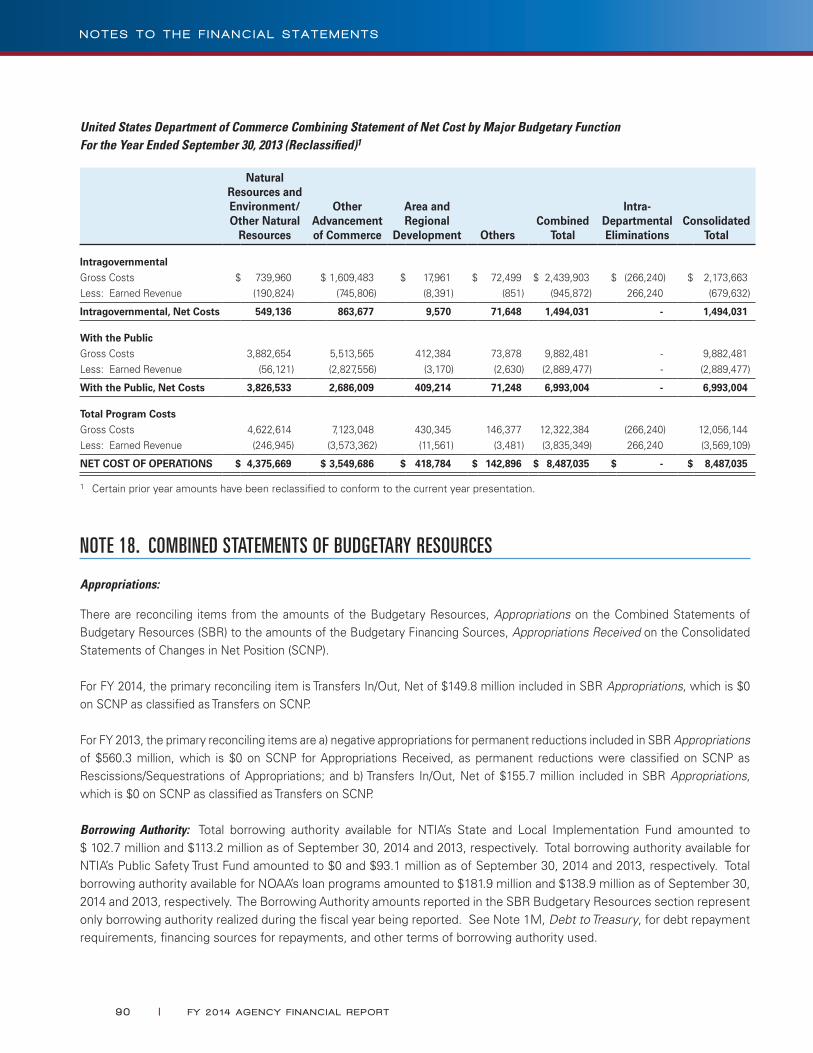
United States Department of Commerce Combining Statement of Net Cost by Major Budgetary Function For the Year Ended September 30, 2013 (Reclassified)1
Natural Resources and Environment/Other Natural
Resources
Other Advancement of Commerce
Area and Regional
Development Others Combined
Total
Intra-Departmental Eliminations
Consolidated Total
IntragovernmentalGross Costs $ 739,960 $ 1,609,483 $ 17,961 $ 72,499 $ 2,439,903 $ (266,240) $ 2,173,663Less: Earned Revenue (190,824) (745,806) (8,391) (851) (945,872) 266,240 (679,632)
Intragovernmental, Net Costs 549,136 863,677 9,570 71,648 1,494,031 - 1,494,031
With the PublicGross Costs 3,882,654 5,513,565 412,384 73,878 9,882,481 - 9,882,481Less: Earned Revenue (56,121) (2,827,556) (3,170) (2,630) (2,889,477) - (2,889,477)
With the Public, Net Costs 3,826,533 2,686,009 409,214 71,248 6,993,004 - 6,993,004
Total Program CostsGross Costs 4,622,614 7,123,048 430,345 146,377 12,322,384 (266,240) 12,056,144Less: Earned Revenue (246,945) (3,573,362) (11,561) (3,481) (3,835,349) 266,240 (3,569,109)
NET COST OF OPERATIONS $ 4,375,669 $ 3,549,686 $ 418,784 $ 142,896 $ 8,487,035 $ - $ 8,487,035
1 Certain prior year amounts have been reclassified to conform to the current year presentation.
NOTE 18. COMBINED STATEMENTS OF BUDGETARY RESOURCES
Appropriations:
There are reconciling items from the amounts of the Budgetary Resources, Appropriations on the Combined Statements of Budgetary Resources (SBR) to the amounts of the Budgetary Financing Sources, Appropriations Received on the Consolidated Statements of Changes in Net Position (SCNP).
For FY 2014, the primary reconciling item is Transfers In/Out, Net of $149.8 million included in SBR Appropriations, which is $0 on SCNP as classified as Transfers on SCNP.
For FY 2013, the primary reconciling items are a) negative appropriations for permanent reductions included in SBR Appropriations of $560.3 million, which is $0 on SCNP for Appropriations Received, as permanent reductions were classified on SCNP as Rescissions/Sequestrations of Appropriations; and b) Transfers In/Out, Net of $155.7 million included in SBR Appropriations, which is $0 on SCNP as classified as Transfers on SCNP.
Borrowing Authority: Total borrowing authority available for NTIA’s State and Local Implementation Fund amounted to $ 102.7 million and $113.2 million as of September 30, 2014 and 2013, respectively. Total borrowing authority available for NTIA’s Public Safety Trust Fund amounted to $0 and $93.1 million as of September 30, 2014 and 2013, respectively. Total borrowing authority available for NOAA’s loan programs amounted to $181.9 million and $138.9 million as of September 30, 2014 and 2013, respectively. The Borrowing Authority amounts reported in the SBR Budgetary Resources section represent only borrowing authority realized during the fiscal year being reported. See Note 1M, Debt to Treasury, for debt repayment requirements, financing sources for repayments, and other terms of borrowing authority used.
90 | FY 20 14 AGENCY F I NANC IAL REPORT
N O T E S T O T H E F I N A N C I A L S T A T E M E N T S
Permanent, Indefinite Appropriations: All of the Department’s reporting entities have one or more permanent, indefinite appropriations to finance operations. Permanent, indefinite appropriations are appropriations that are available until expended.
Permanent Reductions to Budgetary Resources: Permanent reductions to the Department’s budgetary resources under Public Laws 113-76 and 112-96 amounted to $10.9 million for FY 2014, while permanent reductions for FY 2013 under Public Laws 113-6 and 113-2 amounted to $560.3 million. These permanent reductions are included in the SBR Budgetary Resources section, and are also included on the Rescissions/Sequestrations lines of the SCNP when applicable.
Legal arrangements affecting the Department’s use of Unobligated Balances of Budget Authority and/or Fund Balance with Treasury during FY 2014 and FY 2013 include the following:
●● The Department’s Deposit Funds, reported in Note 2, Fund Balance with Treasury, are not available to finance operating activities. These funds are also included in Note 2 on the line Non-budgetary (breakdown by status).
●● The Department’s Fund Balance with Treasury as of September 30, 2014 and 2013 includes $790.1 million of USPTO offsetting collections exceeding the current fiscal year and prior fiscal years’ appropriations. USPTO may use these funds only as authorized by the U.S. Congress, and only as made available by the issuance of a Treasury warrant. These funds are included in Note 2 on the lines General Funds (breakdown by type) and Temporarily Precluded From Obligation (breakdown by status).
●● The Omnibus Budget Reconciliation Act of 1990 established surcharges on certain statutory patent fees collected by USPTO. Subsequent legislation extended the surcharges through September 30, 1998. These surcharges were deposited into the Patent and Trademark Surcharge Fund, a Special Fund Receipt Account at Treasury. USPTO may use monies from this account only as authorized by Congress and made available by the issuance of a Treasury warrant. As of September 30, 2014 and 2013, $233.5 million is held in the Patent and Trademark Surcharge Fund. These funds are included in Note 2 on the lines Patent and Trademark Surcharge Fund - Special Funds section (breakdown by type), and Non-budgetary (breakdown by status).
●● The Department’s Fund Balance with Treasury as of September 30, 2014 and 2013 includes $147.7 million of USPTO sequestered funds temporarily not available. These funds are included in Note 2 on the lines General Funds (breakdown by type) and Temporarily Precluded from Obligation (breakdown by status).
●● For loan programs prior to the Federal Credit Reform Act of 1990 (pre-FY 1992 loans), most or all liquidating fund unobligated balances in excess of working capital needs are required to be transferred to Treasury as soon as practicable during the following fiscal year.
●● For direct loan programs under the Federal Credit Reform Act of 1990 (post-FY 1991 loans) that have outstanding debt to Treasury, regulations require that most unobligated balances be returned to Treasury on September 30 or require that the borrowing authority be cancelled on September 30.
●● For loan guarantee programs under the Federal Credit Reform Act of 1990 that have outstanding debt to Treasury, regulations require that unobligated balances in excess of the outstanding guaranteed loans’ principal and interest be returned to Treasury on September 30.
Comparison to Budget of the U.S. Government: There are no material differences between the amounts reported in the FY 2013 and FY 2012 Combined Statements of Budgetary Resources and the actual FY 2013 and FY 2012 amounts reported in the FY 2015 and FY 2014 budgets of the U.S. government, respectively. The President’s Budget that will report actual amounts for FY 2014 has not yet been published.
FY 20 14 AGENCY F I NANC IAL REPORT | 9 1
N O T E S T O T H E F I N A N C I A L S T A T E M E N T S

Apportionment Categories of Obligations Incurred:
Category A apportionments distribute budgetary resources by fiscal quarters, whereas Category B apportionments typically distribute budgetary resources by activities, projects, objects, or a combination of these categories.
The amounts of Direct (i.e., derived from Appropriations) and Reimbursable (i.e., derived from Spending Authority From Offsetting Collections) Obligations Incurred by apportionment category are as follows:
FY 2014
Direct Reimbursable Total
Category A $ 2,905,239 $ 3,488,090 $ 6,393,329
Category B 5,910,848 1,219,303 7,130,151
Exempt from Apportionment (159,524) - (159,524)
Total Obligations Incurred $ 8,656,563 $ 4,707,393 $ 13,363,956
FY 2013
Direct Reimbursable Total
Category A $ 2,661,918 $ 2,988,976 $ 5,650,894
Category B 5,582,690 939,840 6,522,530
Exempt from Apportionment 181,342 - 181,342
Total Obligations Incurred $ 8,425,950 $ 3,928,816 $ 12,354,766
Undelivered Orders: Undelivered orders were $5.81 billion and $5.73 billion as of September 30, 2014 and 2013, respectively.
NOTE 19. CUSTODIAL NONEXCHANGE ACTIVITY
NOAA receives interest, penalties, and fines primarily related to its past due Accounts Receivable, while BIS receives civil monetary penalties from private entities that violate the Export Administration Act (EAA). These collections are required to be transferred to Treasury. For FY 2014, the Department has custodial nonexchange revenue of $63.2 million; custodial nonexchange revenue of $361 thousand was payable to Treasury as of September 30, 2014. For FY 2013, the Department had custodial nonexchange revenue of $6.5 million; custodial nonexchange revenue of $229 thousand was payable to Treasury as of September 30, 2013. The increase in custodial nonexchange revenue from FY 2013 to FY 2014, is primarily due to increased civil monetary penalties levied against private entities under EAA.
92 | FY 20 14 AGENCY F I NANC IAL REPORT
N O T E S T O T H E F I N A N C I A L S T A T E M E N T S
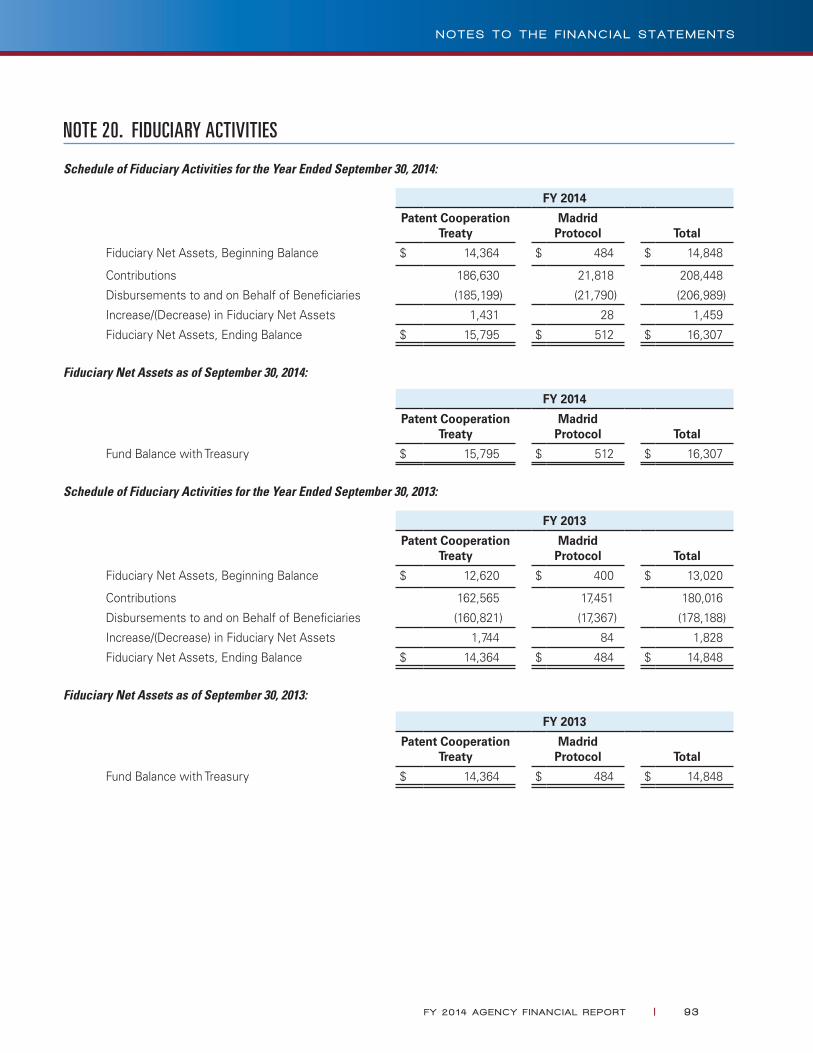
NOTE 20. FIDUCIARY ACTIVITIES
Schedule of Fiduciary Activities for the Year Ended September 30, 2014:
FY 2014
Patent Cooperation Treaty
Madrid Protocol Total
Fiduciary Net Assets, Beginning Balance $ 14,364 $ 484 $ 14,848
Contributions 186,630 21,818 208,448
Disbursements to and on Behalf of Beneficiaries (185,199) (21,790) (206,989)
Increase/(Decrease) in Fiduciary Net Assets 1,431 28 1,459
Fiduciary Net Assets, Ending Balance $ 15,795 $ 512 $ 16,307
Fiduciary Net Assets as of September 30, 2014:
FY 2014
Patent Cooperation Treaty
Madrid Protocol Total
Fund Balance with Treasury $ 15,795 $ 512 $ 16,307
Schedule of Fiduciary Activities for the Year Ended September 30, 2013:
FY 2013
Patent Cooperation Treaty
Madrid Protocol Total
Fiduciary Net Assets, Beginning Balance $ 12,620 $ 400 $ 13,020
Contributions 162,565 17,451 180,016
Disbursements to and on Behalf of Beneficiaries (160,821) (17,367) (178,188)
Increase/(Decrease) in Fiduciary Net Assets 1,744 84 1,828
Fiduciary Net Assets, Ending Balance $ 14,364 $ 484 $ 14,848
Fiduciary Net Assets as of September 30, 2013:
FY 2013
Patent Cooperation Treaty
Madrid Protocol Total
Fund Balance with Treasury $ 14,364 $ 484 $ 14,848
FY 20 14 AGENCY F I NANC IAL REPORT | 93
N O T E S T O T H E F I N A N C I A L S T A T E M E N T S
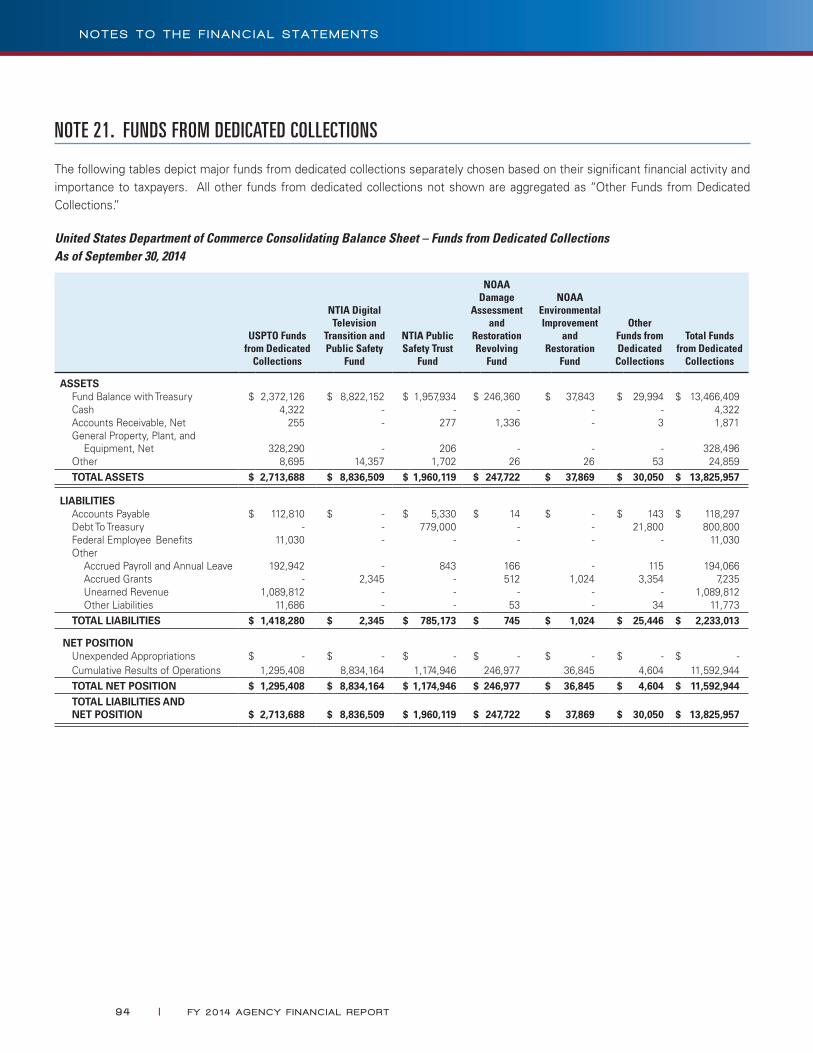
NOTE 21. FUNDS FROM DEDICATED COLLECTIONS
The following tables depict major funds from dedicated collections separately chosen based on their significant financial activity and importance to taxpayers. All other funds from dedicated collections not shown are aggregated as “Other Funds from Dedicated Collections.”
United States Department of Commerce Consolidating Balance Sheet – Funds from Dedicated Collections As of September 30, 2014
USPTO Funds from Dedicated
Collections
NTIA Digital Television
Transition and Public Safety
Fund
NTIA Public Safety Trust
Fund
NOAA Damage
Assessment and
Restoration Revolving
Fund
NOAA Environmental Improvement
and Restoration
Fund
Other Funds from Dedicated
Collections
Total Funds from Dedicated
Collections
ASSETS Fund Balance with Treasury $ 2,372,126 $ 8,822,152 $ 1,957,934 $ 246,360 $ 37,843 $ 29,994 $ 13,466,409Cash 4,322 - - - - - 4,322Accounts Receivable, Net 255 - 277 1,336 - 3 1,871General Property, Plant, and
Equipment, Net 328,290 - 206 - - - 328,496Other 8,695 14,357 1,702 26 26 53 24,859
TOTAL ASSETS $ 2,713,688 $ 8,836,509 $ 1,960,119 $ 247,722 $ 37,869 $ 30,050 $ 13,825,957
LIABILITIES Accounts Payable $ 112,810 $ - $ 5,330 $ 14 $ - $ 143 $ 118,297 Debt To Treasury - - 779,000 - - 21,800 800,800 Federal Employee Benefits 11,030 - - - - - 11,030 Other
Accrued Payroll and Annual Leave 192,942 - 843 166 - 115 194,066 Accrued Grants - 2,345 - 512 1,024 3,354 7,235 Unearned Revenue 1,089,812 - - - - - 1,089,812 Other Liabilities 11,686 - - 53 - 34 11,773
TOTAL LIABILITIES $ 1,418,280 $ 2,345 $ 785,173 $ 745 $ 1,024 $ 25,446 $ 2,233,013
NET POSITION Unexpended Appropriations $ - $ - $ - $ - $ - $ - $ - Cumulative Results of Operations 1,295,408 8,834,164 1,174,946 246,977 36,845 4,604 11,592,944 TOTAL NET POSITION $ 1,295,408 $ 8,834,164 $ 1,174,946 $ 246,977 $ 36,845 $ 4,604 $ 11,592,944 TOTAL LIABILITIES AND
NET POSITION $ 2,713,688 $ 8,836,509 $ 1,960,119 $ 247,722 $ 37,869 $ 30,050 $ 13,825,957
94 | FY 20 14 AGENCY F I NANC IAL REPORT
N O T E S T O T H E F I N A N C I A L S T A T E M E N T S
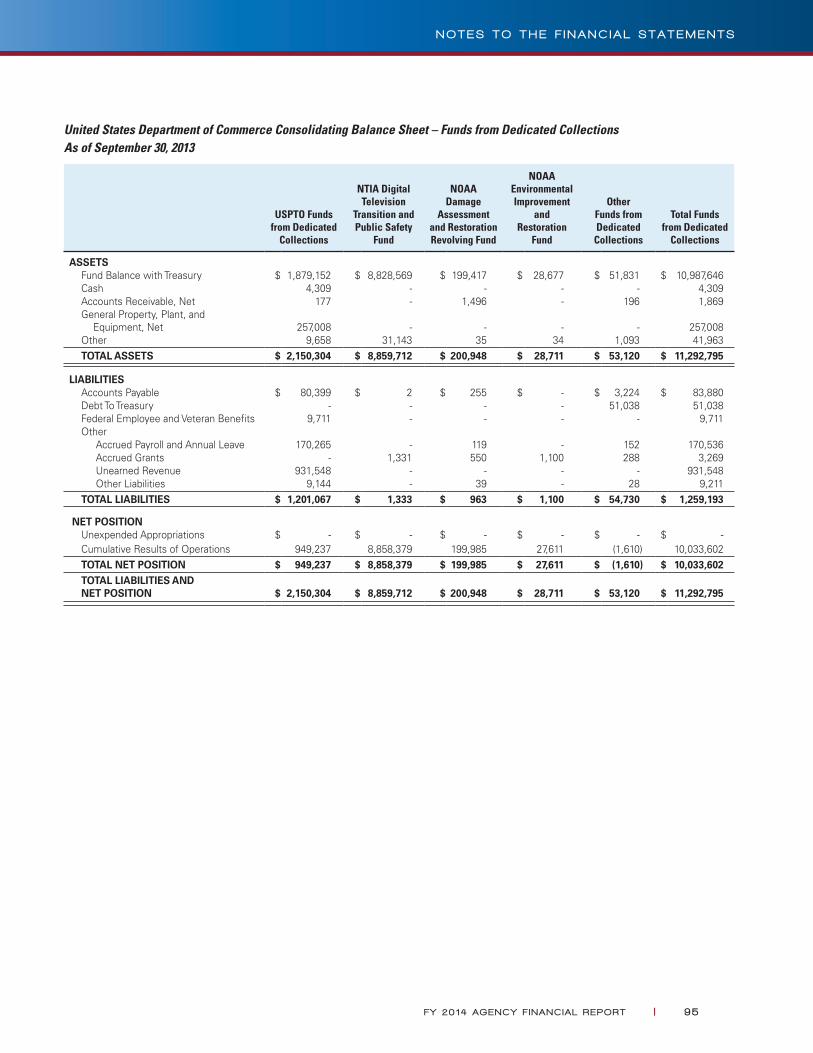
United States Department of Commerce Consolidating Balance Sheet – Funds from Dedicated Collections As of September 30, 2013
USPTO Funds from Dedicated
Collections
NTIA Digital Television
Transition and Public Safety
Fund
NOAA Damage
Assessment and Restoration Revolving Fund
NOAA Environmental Improvement
and Restoration
Fund
Other Funds from Dedicated
Collections
Total Funds from Dedicated
Collections
ASSETS Fund Balance with Treasury $ 1,879,152 $ 8,828,569 $ 199,417 $ 28,677 $ 51,831 $ 10,987,646Cash 4,309 - - - - 4,309Accounts Receivable, Net 177 - 1,496 - 196 1,869General Property, Plant, and
Equipment, Net 257,008 - - - - 257,008Other 9,658 31,143 35 34 1,093 41,963
TOTAL ASSETS $ 2,150,304 $ 8,859,712 $ 200,948 $ 28,711 $ 53,120 $ 11,292,795
LIABILITIES Accounts Payable $ 80,399 $ 2 $ 255 $ - $ 3,224 $ 83,880 Debt To Treasury - - - - 51,038 51,038 Federal Employee and Veteran Benefits 9,711 - - - - 9,711 Other Accrued Payroll and Annual Leave 170,265 - 119 - 152 170,536 Accrued Grants - 1,331 550 1,100 288 3,269 Unearned Revenue 931,548 - - - - 931,548 Other Liabilities 9,144 - 39 - 28 9,211 TOTAL LIABILITIES $ 1,201,067 $ 1,333 $ 963 $ 1,100 $ 54,730 $ 1,259,193
NET POSITION Unexpended Appropriations $ - $ - $ - $ - $ - $ - Cumulative Results of Operations 949,237 8,858,379 199,985 27,611 (1,610) 10,033,602 TOTAL NET POSITION $ 949,237 $ 8,858,379 $ 199,985 $ 27,611 $ (1,610) $ 10,033,602 TOTAL LIABILITIES AND
NET POSITION $ 2,150,304 $ 8,859,712 $ 200,948 $ 28,711 $ 53,120 $ 11,292,795
FY 20 14 AGENCY F I NANC IAL REPORT | 95
N O T E S T O T H E F I N A N C I A L S T A T E M E N T S

United States Department of Commerce Consolidating Statement of Net Cost – Funds from Dedicated Collections For the Year Ended September 30, 2014
USPTO Funds from Dedicated
Collections
NTIA Digital Television
Transition and Public Safety
Fund
NTIA Public Safety Trust
Fund
NOAA Damage
Assessment and
Restoration Revolving Fund
NOAA Environmental Improvement
and Restoration
Fund
Other Funds from Dedicated
Collections
Total Funds from Dedicated
Collections
IntragovernmentalGross Costs $ 584,745 $ 14,732 $ 8,649 $ 1,859 $ - $ 1,464 $ 611,449Less: Earned Revenue (9,102) - (277) - - - (9,379)Intragovernmental, Net Costs 575,643 14,732 8,372 1,859 - 1,464 602,070
With the PublicGross Costs 2,147,634 9,483 19,663 105,194 9,159 20,091 2,311,224Less: Earned Revenue (3,008,943) - - - - - (3,008,943)With the Public, Net Costs (861,309) 9,483 19,663 105,194 9,159 20,091 (697,719)
Total Program CostsGross Costs 2,732,379 24,215 28,312 107,053 9,159 21,555 2,922,683Less: Earned Revenue (3,018,045) - (277) - - - (3,018,322)
NET COST OF OPERATIONS $ (285,666) $ 24,215 $ 28,035 $ 107,053 $ 9,159 $ 21,555 $ (95,649)
United States Department of Commerce Consolidating Statement of Net Cost – Funds from Dedicated Collections For the Year Ended September 30, 2013
USPTO Funds from Dedicated
Collections
NTIA Digital Television
Transition and Public Safety
Fund
NOAA Damage
Assessment and Restoration Revolving Fund
NOAA Environmental Improvement
and Restoration
Fund
Other Funds from Dedicated
Collections
Total Funds from Dedicated
Collections
IntragovernmentalGross Costs $ 540,346 $ 40,815 $ 3,007 $ - $ 2,677 $ 586,845Less: Earned Revenue (8,841) - - - - (8,841)Intragovernmental, Net Costs 531,505 40,815 3,007 - 2,677 578,004
With the PublicGross Costs 2,000,081 9,370 110,034 7,456 27,626 2,154,567Less: Earned Revenue (2,711,131) - - - - (2,711,131)With the Public, Net Costs (711,050) 9,370 110,034 7,456 27,626 (556,564)
Total Program CostsGross Costs 2,540,427 50,185 113,041 7,456 30,303 2,741,412Less: Earned Revenue (2,719,972) - - - - (2,719,972)
NET COST OF OPERATIONS $ (179,545) $ 50,185 $ 113,041 $ 7,456 $ 30,303 $ 21,440
96 | FY 20 14 AGENCY F I NANC IAL REPORT
N O T E S T O T H E F I N A N C I A L S T A T E M E N T S
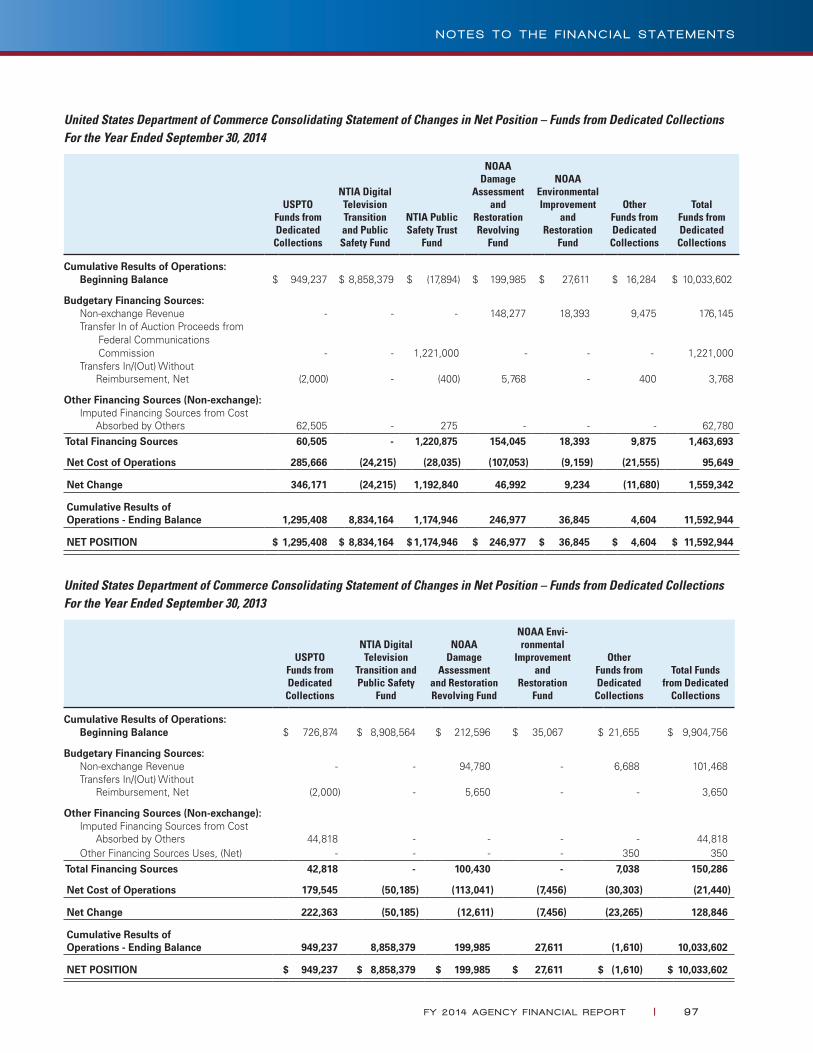
United States Department of Commerce Consolidating Statement of Changes in Net Position – Funds from Dedicated CollectionsFor the Year Ended September 30, 2014
USPTO Funds from Dedicated
Collections
NTIA Digital Television Transition and Public Safety Fund
NTIA Public Safety Trust
Fund
NOAA Damage
Assessment and
Restoration Revolving
Fund
NOAA Environmental Improvement
and Restoration
Fund
Other Funds from Dedicated
Collections
Total Funds from Dedicated
Collections
Cumulative Results of Operations: Beginning Balance $ 949,237 $ 8,858,379 $ (17,894) $ 199,985 $ 27,611 $ 16,284 $ 10,033,602
Budgetary Financing Sources: Non-exchange Revenue - - - 148,277 18,393 9,475 176,145 Transfer In of Auction Proceeds from Federal Communications Commission - - 1,221,000 - -
- 1,221,000
Transfers In/(Out) Without Reimbursement, Net (2,000) - (400) 5,768 - 400 3,768
Other Financing Sources (Non-exchange): Imputed Financing Sources from Cost
Absorbed by Others 62,505 - 275 - - - 62,780 Total Financing Sources 60,505 - 1,220,875 154,045 18,393 9,875 1,463,693
Net Cost of Operations 285,666 (24,215) (28,035) (107,053) (9,159) (21,555) 95,649
Net Change 346,171 (24,215) 1,192,840 46,992 9,234 (11,680) 1,559,342
Cumulative Results of Operations - Ending Balance 1,295,408 8,834,164 1,174,946 246,977 36,845 4,604 11,592,944
NET POSITION $ 1,295,408 $ 8,834,164 $1,174,946 $ 246,977 $ 36,845 $ 4,604 $ 11,592,944
United States Department of Commerce Consolidating Statement of Changes in Net Position – Funds from Dedicated CollectionsFor the Year Ended September 30, 2013
USPTO Funds from Dedicated
Collections
NTIA Digital Television
Transition and Public Safety
Fund
NOAA Damage
Assessment and Restoration Revolving Fund
NOAA Envi-ronmental
Improvement and
Restoration Fund
Other Funds from Dedicated
Collections
Total Funds from Dedicated
Collections
Cumulative Results of Operations: Beginning Balance $ 726,874 $ 8,908,564 $ 212,596 $ 35,067 $ 21,655 $ 9,904,756
Budgetary Financing Sources: Non-exchange Revenue - - 94,780 - 6,688 101,468
Transfers In/(Out) Without Reimbursement, Net (2,000) - 5,650 - - 3,650
Other Financing Sources (Non-exchange): Imputed Financing Sources from Cost
Absorbed by Others 44,818 - - - - 44,818Other Financing Sources Uses, (Net) - - - - 350 350
Total Financing Sources 42,818 - 100,430 - 7,038 150,286
Net Cost of Operations 179,545 (50,185) (113,041) (7,456) (30,303) (21,440)
Net Change 222,363 (50,185) (12,611) (7,456) (23,265) 128,846
Cumulative Results of Operations - Ending Balance 949,237 8,858,379 199,985 27,611 (1,610) 10,033,602
NET POSITION $ 949,237 $ 8,858,379 $ 199,985 $ 27,611 $ (1,610) $ 10,033,602
FY 20 14 AGENCY F I NANC IAL REPORT | 97
N O T E S T O T H E F I N A N C I A L S T A T E M E N T S
Below is a description of major Funds from Dedicated Collections shown in the tables on the previous pages.
The USPTO Funds from Dedicated Collections consist of its Salaries and Expenses Fund, Patent and Trademark Fee Reserve Fund, and Patent and Trademark Surcharge Fund.
The Salaries and Expenses Fund contains monies used for the administering of the laws relevant to patents and trademarks and advising the Secretary of Commerce, the President of the United States, and the Administration on patent, trademark, and copyright protection, and trade-related aspects of intellectual property. This fund is used for USPTO’s three core business activities – granting patents; registering trademarks; and intellectual property policy, protection, and enforcement – that promote the use of intellectual property rights as a means of achieving economic prosperity. These activities give innovators, businesses, and entrepreneurs the protection and encouragement they need to turn their creative ideas into tangible products, and also provide protection for their inventions and trademarks. USPTO may use monies from this account only as authorized by Congress.
The Patent and Trademark Fee Reserve Fund results from a provision that requires USPTO to deposit all patent and trademark fees collected in excess of the annual appropriation amount into the fund. Funds made available may only be used for expenses of the office relating to the processing of patent applications and for other activities, services, and materials relating to patents and applicable administrative costs.
The Patent and Trademark Surcharge Fund, a Special Fund Receipt Account at Treasury, is discussed in Note 18, Combined Statements of Budgetary Resources. USPTO may use monies from this account only as authorized by Congress and made available by the issuance of a Treasury warrant.
The NTIA Digital Television Transition and Public Safety Fund makes digital television available to every home in America, improves communications between local, state, and federal agencies, allows smaller television stations to broadcast digital television, and improves how warnings are received when disasters occur. NTIA received initial funding from borrowings from the Bureau of Public Debt, and repaid the Bureau of Public Debt from the proceeds of the auction of recovered analog spectrum which was completed in March 2008. The proceeds from the auction provide funding for several programs, and $7.36 billion was transferred in September 2009 to the General Fund of the Treasury as required by the Deficit Reduction Act of 2005 (Public Law 109-171). The Department understands that Congress’ intent is for the Fund to further transfer funds beyond the needs of its programs to the General Fund of the Treasury. As of September 30, 2014, the Fund has a Net Position, Cumulative Results of Operations balance of $8.83 billion. The law establishing this program can be found in the Deficit Reduction Act of 2005, Sections 3001-3014.
The NTIA Public Safety Trust Fund was created as a result of The Middle Class Tax Relief and Job Creation Act of 2012 (Act). The Act provides up to $7.00 billion in funding to be derived from the proceeds of Federal Communications Commission (FCC) auctions of spectrum licenses, to be deposited into the Public Safety Trust Fund. Prior to the receipt of auction proceeds from FCC, the Act provides authority to NTIA to borrow up to $2.00 billion from Treasury, interest-free. The Act directs the use of auction proceeds in an order of priority. After certain uses, $7.00 billion of auction proceeds are dedicated to public safety, including providing funding for the First Responder Network Authority (FirstNet), an independent authority within NTIA. The amounts borrowed are to be repaid from the auction proceeds. FirstNet shall ensure the establishment of a nationwide, interoperable broadband network to help police, firefighters, emergency medical service professionals, and other public safety officials stay safe and do their jobs.
98 | FY 20 14 AGENCY F I NANC IAL REPORT
N O T E S T O T H E F I N A N C I A L S T A T E M E N T S
The Federal Communications Commission (FCC) carries out auctions in accordance with the Act, of which certain earned net auction proceeds (earned auction proceeds less any FCC administrative fees) are transferred from FCC to the Public Safety Trust Fund. A transfer in from FCC becomes a budgetary financing source on the Consolidated Statement of Changes in Net Position and a budgetary resource on the Combined Statement of Budgetary Resources (SBR) when the transfer in is provided as a budgetary resource by OMB. The first transfer in from FCC of $1.22 billion was received in FY 2014 and is included as a budgetary financing source on the FY 2014 Consolidated Statement of Changes in Net Position and as a budgetary resource on the FY 2014 SBR (Budget Authority, Appropriations). The Public Safety Trust Fund repaid $1.22 billion of Debt to Treasury in FY 2014, leaving a Debt to Treasury balance of $779 million as of September 30, 2014. This repayment of debt was included as a negative budgetary resource of $1.22 billion on the FY 2014 SBR (Budget Authority, Appropriations).
The NOAA Damage Assessment and Restoration Revolving Fund receives monies for the reimbursement of expenses related to oil or hazardous substance spill response activities, or natural resource damages assessment, restoration, rehabilitation, replacement, or acquisition activities conducted by NOAA. The recovered sums by a federal, state, indian, or foreign trustee for natural resource damages is retained by the trustee and is only used to reimburse or pay costs incurred by the trustee for the damaged natural resources. The law establishing the Damage Assessment and Restoration Revolving Fund can be found in 33 USC Section 2706.
The NOAA Environmental Improvement and Restoration Fund makes available interest that was earned in the Fund in the previous fiscal year. 80 percent of such amounts shall be made available to be equally divided among the Directors of the National Park Service, the United States Fish and Wildlife Service, the Bureau of Land Management, and the Chief of the Forest Service for high-priority deferred maintenance and repairs and modernization of facilities that directly enhance the experience of visitors, including natural, cultural, recreational, and historic resources protection projects in National Parks, National Wildlife Refuges, and public lands, and for payment to the State of Louisiana and its lessees for oil and gas drainage in the West Delta field. 20 percent of such amounts shall be made available to the Secretary of Commerce for the purpose of carrying out marine research activities in the North Pacific. The law establishing the Environmental Improvement and Restoration Fund can be found at 43 USC Section 1474d.
NOTE 22. RECONCILIATION OF NET COST OF OPERATIONS TO BUDGET
The Reconciliation of Net Cost of Operations to Budget reconciles the Department’s Resources Used to Finance Activities (first section), which consists of the budgetary basis of accounting Net Obligations plus the proprietary basis of accounting Other Resources, to the proprietary basis of accounting Net Cost of Operations. The second section, Resources Used to Finance Items Not Part of Net Cost of Operations, reverses out items included in the first section that are not included in Net Cost of Operations. The third section, Components of Net Cost of Operations that Will Not Require or Generate Resources in the Current Period, adds items included in Net Cost of Operations that are not included in the first section.
The third section’s subsection, Components Requiring or Generating Resources in Future Periods, includes costs reported in the current period that are included in the Liabilities Not Covered by Budgetary Resources reported in Note 15. This subsection does not include costs reported in prior fiscal years that are also included in Liabilities Not Covered by Budgetary Resources.
FY 20 14 AGENCY F I NANC IAL REPORT | 99
N O T E S T O T H E F I N A N C I A L S T A T E M E N T S

The reconciliations of Net Cost of Operations to Budget for FY 2014 and 2013 are as follows:
FY 2014 FY 2013
Resources Used to Finance Activities:
Budgetary Resources Obligated:Obligations Incurred $ 13,363,956 $ 12,354,766Less: Spending Authority From Offsetting Collections and Actual Recoveries of Prior-years Unpaid Obligations (5,282,414) (4,531,305)
Obligations Net of Offsetting Collections and Actual Recoveries 8,081,542 7,823,461Less: Distributed Offsetting (Receipts)/Outlays, Net (56,006) (46,853)
Net Obligations 8,025,536 7,776,608
Other Resources: Donations and Forfeitures of Property 1,296 856Transfers In/(Out) Without Reimbursement, Net 6,742 (56,353)Imputed Financing Sources From Cost Absorbed by Others 357,022 295,288Other Financing Sources/(Uses), Net (11,716) (1,818)
Net Other Resources Used to Finance Activities 353,344 237,973
Total Resources Used to Finance Activities 8,378,880 8,014,581
Resources Used to Finance Items Not Part of Net Cost of Operations:
Change in Budgetary Resources Obligated for Goods, Services, and Benefits Ordered but Not Yet Provided (75,928) 1,619,746Resources that Fund Expenses Recognized in Prior Periods (1,995) (1,819)Budgetary Obligations for Downward Subsidy Reestimates Payable to Treasury (7,361) (21,447)Budgetary Offsetting Collections and Receipts that Do Not Affect Net Cost of Operations: Distributed Offsetting (Receipts)/Outlays, Net (excludes Clearing Accounts’ Gross Costs) 56,006 46,853 Credit Program Collections which Increase Loan Guarantee Liabilities or Allowance for Subsidy Cost 66,792 68,158 Budgetary Financing Sources/(Uses), Net 83,440 (113,241)Resources that Finance the Acquisition of Assets (2,115,341) (2,032,544)Other Resources or Adjustments to Net Obligated Resources that Do Not Affect Net Cost of Operations: Change in Unfilled Customer Orders 210,548 4,502 Donations and Forfeitures of Property (1,296) (856) Transfers In/(Out) Without Reimbursement, Net (6,742) 56,353 Other Financing Sources/(Uses), Net 11,716 1,818 Other (3,115) (5,027)
Total Resources Used to Finance Items Not Part of Net Cost of Operations (1,783,276) (377,504)
Total Resources Used to Finance Net Cost of Operations 6,595,604 7,637,077
(continued on next page)
1 00 | FY 20 14 AGENCY F I NANC IAL REPORT
N O T E S T O T H E F I N A N C I A L S T A T E M E N T S
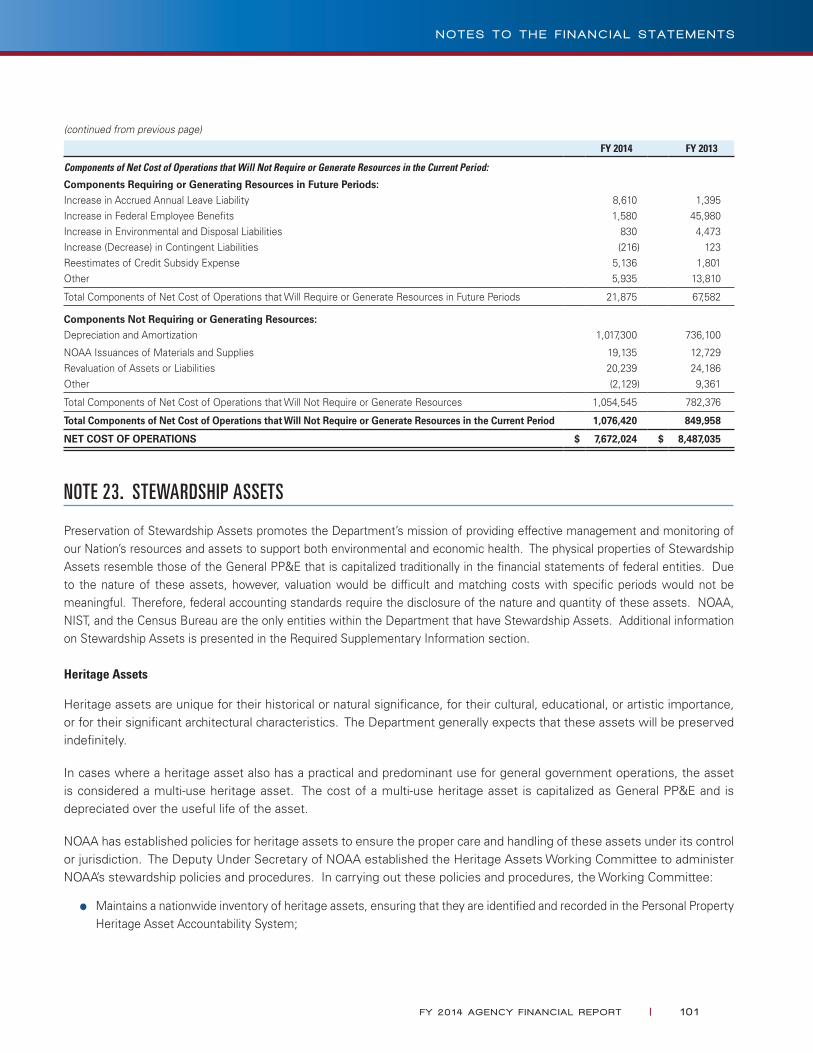
(continued from previous page)
FY 2014 FY 2013
Components of Net Cost of Operations that Will Not Require or Generate Resources in the Current Period:
Components Requiring or Generating Resources in Future Periods:Increase in Accrued Annual Leave Liability 8,610 1,395Increase in Federal Employee Benefits 1,580 45,980Increase in Environmental and Disposal Liabilities 830 4,473Increase (Decrease) in Contingent Liabilities (216) 123Reestimates of Credit Subsidy Expense 5,136 1,801Other 5,935 13,810
Total Components of Net Cost of Operations that Will Require or Generate Resources in Future Periods 21,875 67,582
Components Not Requiring or Generating Resources:Depreciation and Amortization 1,017,300 736,100
NOAA Issuances of Materials and Supplies 19,135 12,729Revaluation of Assets or Liabilities 20,239 24,186Other (2,129) 9,361
Total Components of Net Cost of Operations that Will Not Require or Generate Resources 1,054,545 782,376
Total Components of Net Cost of Operations that Will Not Require or Generate Resources in the Current Period 1,076,420 849,958
NET COST OF OPERATIONS $ 7,672,024 $ 8,487,035
NOTE 23. STEWARDSHIP ASSETS
Preservation of Stewardship Assets promotes the Department’s mission of providing effective management and monitoring of our Nation’s resources and assets to support both environmental and economic health. The physical properties of Stewardship Assets resemble those of the General PP&E that is capitalized traditionally in the financial statements of federal entities. Due to the nature of these assets, however, valuation would be difficult and matching costs with specific periods would not be meaningful. Therefore, federal accounting standards require the disclosure of the nature and quantity of these assets. NOAA, NIST, and the Census Bureau are the only entities within the Department that have Stewardship Assets. Additional information on Stewardship Assets is presented in the Required Supplementary Information section.
Heritage Assets
Heritage assets are unique for their historical or natural significance, for their cultural, educational, or artistic importance, or for their significant architectural characteristics. The Department generally expects that these assets will be preserved indefinitely.
In cases where a heritage asset also has a practical and predominant use for general government operations, the asset is considered a multi-use heritage asset. The cost of a multi-use heritage asset is capitalized as General PP&E and is depreciated over the useful life of the asset.
NOAA has established policies for heritage assets to ensure the proper care and handling of these assets under its control or jurisdiction. The Deputy Under Secretary of NOAA established the Heritage Assets Working Committee to administer NOAA’s stewardship policies and procedures. In carrying out these policies and procedures, the Working Committee:
●● Maintains a nationwide inventory of heritage assets, ensuring that they are identified and recorded in the Personal Property Heritage Asset Accountability System;
FY 20 14 AGENCY F I NANC IAL REPORT | 1 0 1
N O T E S T O T H E F I N A N C I A L S T A T E M E N T S
●● Establishes nationwide NOAA policies, procedures, and standards for the preservation, security, handling, storage, and display of NOAA heritage assets;
●● Tracks and updates each loan of NOAA heritage assets, including assigning current values and inventory numbers, and reporting the current conditions of heritage assets;
●● Determines the feasibility of new asset loans, such as meters, standard tide gauges, portraits, and books for exhibit loans; and
●● Collects heritage assets and properties of historic, cultural, artistic, or educational significance to NOAA.
Heritage Assets maintained by NOAA include Galveston Laboratory, National Marine Fisheries Service (NMFS) St. George Sealing Plant, NMFS Cottage M, St. George, NMFS St. Paul Old Clinic/Hospital, NMFS Aquarium, and the Great Lakes Environmental Research Laboratory/Lake Michigan Field Station.
Stewardship National Marine Sanctuaries, Marine National Monuments, Conservation Area, and Habitat Blueprint
Written policy statements or permit guidelines for the National Marine Sanctuaries and Marine National Monuments have been developed for the areas of acoustic impacts, artificial reefs, climate change, invasive species, and marine debris. The Office of Marine National Sanctuaries answers the most frequently asked questions related to alternative energy and oil and gas policy decisions for national marine sanctuaries.
NOAA maintains the following Stewardship Assets:
National Marine Sanctuaries: In 1972, Congress passed the Marine Protection, Research, and Sanctuaries Act (Act) in response to a growing awareness of the intrinsic environmental and cultural value of coastal waters. The Act authorized the Secretary of Commerce to designate special nationally-significant areas of the marine environment as national marine sanctuaries.
These protected waters provide a secure habitat for species close to extinction, and also protect historically significant shipwrecks and prehistoric artifacts. National marine sanctuaries are also used for recreation (e.g., boating, diving, and sport fishing), and support valuable commercial industries such as fishing and kelp harvesting. As of September 30, 2014, 13 National Marine Sanctuaries, which include both coastal and offshore areas, have been designated, covering a total area of nearly 33 thousand square miles.
Marine National Monuments: NOAA’s Marine National Monument Program implements the January 2009 Presidential Proclamations that established three Pacific Marine National Monuments —the Marianas Trench, Pacific Remote Islands, and Rose Atoll, and also co-manages the Papahãnaumokuãkea Marine National Monument, created in 2006. The Marine National Monuments were created to protect the abundant and diverse coral, fish, and seabird populations; to facilitate exploration and scientific research; and to promote public education regarding the value of these national treasures. The establishment of the Monuments provides the opportunity to protect areas of outstanding scientific, cultural, conservation, and aesthetic value, and provide for the long-term preservation of these natural and cultural legacies.
Aleutian Islands Habitat Conservation Area: On July 28, 2006, NOAA formally established the Aleutian Islands Habitat Conservation Area in Alaska, which covers nearly 370,000 square miles and may harbor among the highest diversity of deep-water corals in the world. The conservation area established a network of fishing closures in the Aleutian Islands and Gulf of Alaska, and protects habitat for deep-water corals and other sensitive features that are slow to recover once disturbed by fishing gear or other activities. Six small areas that include fragile coral gardens discovered by NOAA Fisheries Service scientists are closed to all bottom-contact fishing gear. This effort is part of a network of new marine protected areas in Alaskan waters designed to protect essential fish habitat and prevent any further damage of the area.
1 02 | FY 20 14 AGENCY F I NANC IAL REPORT
N O T E S T O T H E F I N A N C I A L S T A T E M E N T S

NOAA Habitat Blueprint: Protecting our natural infrastructure is vital to protecting our communities and their economies as well as fisheries and recreational opportunities along our coasts. With continued widespread loss and deterioration of coastal and marine habitats, we are in danger of losing this infrastructure. Congress has charged NOAA with protecting habitat for fish, threatened and endangered species, marine mammals, and other natural resources within the coastal zone. NOAA needs to increase the sustainability and productivity of our fisheries by focusing on the habitat that fish need to spawn and grow, as well as protecting the coastal resources on which our communities depend. Recognizing the need for more concerted efforts to conserve, protect, and restore habitat, NOAA developed the NOAA Habitat Blueprint to build on existing programs, prioritize its activities, and guide its future actions. This is being accomplished by creating Habitat Focus Areas. There are currently seven Habitat Focus Areas:
●● Penobscot River Watershed
●● Choptank River Watershed
●● Muskegon Lake
●● St. Louis River Estuary
●● Manell-Geus, Guam Watershed
●● West Hawaii
●● Russian River
Collection-type Heritage Assets:
NOAA:
NOAA’s collection-type heritage assets are comprised primarily of books, journals, publications, photographs and motion pictures, manuscripts, records, nautical chart plates, and artifacts. Many of these heritage assets are maintained by the NOAA Central Library (Library). As evidenced by a search of international catalogs, 35 to 50 percent of the Library’s collection is unique. Historically, 40 percent of the items catalogued are not found anywhere else. Many older books cannot be replaced. The works include 17th century works of Francis Bacon and Robert Boyle, 18th century works of Daniel Bernouilli, Daniel Defoe, and Pierre Bougher, and 19th and 20th century works of Benjamin Franklin and George Washington Carver. The Library has an extensive collection of historical Coast and Geodetic Survey materials (from 1807) and Weather Bureau materials (from the 1830s), including foreign and historical meteorological data, information on instruments, and metadata.
NOAA’s collection-type heritage assets include items in the Thunder Bay Sanctuary Research Collection (Collection). In 2004, the Thunder Bay National Marine Sanctuary (jointly managed by NOAA and the State of Michigan to protect and interpret a nationally significant collection of shipwrecks and other maritime heritage resources) established an agreement with the Alpena County George N. Fletcher Public Library to jointly manage this Collection. Amassed over a period of more than 40 years by historian C. Patrick Labadie, the Collection includes information about such diverse subjects as Great Lakes ports and waterways, docks, cargoes, ships, shipbuilders, owners and fleets, machinery and rigging, notable maritime personalities, and shipwrecks. Special features of the Collection are extensive collections of 1) data cards listing most of the ships on the Great Lakes before year 1900, a roster of some 15 thousand vessels complete with descriptive data and highlights of the ships’ careers and their ultimate losses; and 2) ship photograph negatives of 19th and 20th century Great Lakes ships. Heritage assets also include copies of vessel ownership documents, contemporary ship photographs, books, and other items documenting the Great Lakes history.
NOAA’s collection-type heritage assets also include items in the National Climatic Data Center Library. Heritage assets include 1) books, manuals, and slides; 2) thermometers, gauges, and radiosondes; and 3) laboratory equipment.
FY 20 14 AGENCY F I NANC IAL REPORT | 1 03
N O T E S T O T H E F I N A N C I A L S T A T E M E N T S
Historical artifacts are designated collection-type heritage assets if they help illustrate the social, educational, and cultural heritage of NOAA and its predecessor agencies (Coast and Geodetic Survey, U.S. Fish Commission, the Weather Bureau, the Institutes for Environmental Research, the Environmental Science Services Administration, etc.). These include, but are not limited to, bells, gyrocompasses, brass citations, flags, pennants, chronometers, ship seals, clocks, compasses, fittings, miscellaneous ship fragments, lithographic plates, barometers, rain gauges, and any items that represent the uniqueness of the mission of NOAA and its predecessor agencies.
NOAA’s Logistics Office continually conducts inventories of its collection-type heritage assets. Many items that were once classified as an individual collection are now included in existing collections. Other items are now deemed as not meeting the heritage asset criteria.
NIST:
NIST currently maintains collection-type heritage assets under its Museum and History Program, which collects, preserves, and exhibits artifacts, such as scientific instruments, equipment, objects, and records of significance to NIST and predecessor agencies. This program provides institutional memory and demonstrates the contributions of NIST to the development of standards measurement, technology, and science. The Information Services Office (ISO) maintains the historical archives and rare book collection, and oversees the oral history program. The historical archives and rare book collection contain titles that are considered “classics” of historical scientific interest, books by prominent scientists, and books by NIST authors or about NIST work. Titles are recommended for inclusion by ISO staff and customers. Materials are not specifically purchased for the collection nor are funds specifically allocated for the collection. Photos and manuscripts include images of NIST staff, facilities, and artifacts that demonstrate NIST history and accomplishments.
NIST’s Museum and History Program has policies in place for acquisitions and loans. Objects are either on display or in storage and are not used by visitors. Archives, including the historical book collection, are used according to established research library policies and procedures. When considering artifacts for accession, the following criteria are considered:
●● Direct connection to NIST program activity;
●● Direct connection to a NIST prominent person;
●● Physical size; and
●● Safety considerations.
Archive material is not loaned. Artifacts are rarely loaned, but can be loaned within established policies and procedures for educational purposes, scholarly research, and limited public exhibition to qualified institutions. The loan policy packet for these artifacts includes an introduction to the NIST Loan Program, Borrower Checklist, Artifact Loan Request, NIST Loan Policy, Insurance Requirements, Facilities Report, Outgoing Loan Agreement, Condition Report Form, and Outgoing Loan Process.
ISO promotes the history of NIST through a program that collects, organizes, and preserves records of enduring value and encourages and supports their use by researchers. The policies and procedures cover such topics as submitting reference inquiries, regulations for use of the archives collection, scope of archives collection, criteria for accepting archival material, providing physical and bibliographic access, preservation, and reviewing the collection.
1 04 | FY 20 14 AGENCY F I NANC IAL REPORT
N O T E S T O T H E F I N A N C I A L S T A T E M E N T S
Census Bureau:
Collection-type heritage assets maintained by the Census Bureau are items considered unique for their historical, cultural, educational, technological, methodological, or artistic importance. They help illustrate the social, educational, and cultural heritage of the Census Bureau. Some items because of their age or obvious historical significance are inherently historical artifacts.
The Census Bureau has developed a Project Charter that outlines policies and procedures for the acquisition and removal of Census Bureau’s heritage assets. The Census Bureau Heritage Assets Committee decides if an item meets the criteria for a heritage asset based on the uniqueness, historical age, and/or if the item helps to illustrate the Census Bureau’s historic contributions to the Nation’s growth. If the item is deemed a heritage asset, the applicable property management office will ensure the heritage asset is catalogued and stored in a safe, secure environment, allowing for appropriate preservation and conservation. All necessary actions will be taken to reduce deterioration of heritage assets due to environmental conditions, and to limit damage, loss, and misuse of heritage assets. The Committee meets on a regular basis to determine if any heritage assets should be removed from the approved list, or if a newly arrived item should be classified as a heritage asset. Once a determination has been made to no longer classify an item as a heritage asset, the Census Bureau will follow any applicable established policies and procedures for surplus property.
FY 20 14 AGENCY F I NANC IAL REPORT | 1 05
N O T E S T O T H E F I N A N C I A L S T A T E M E N T S
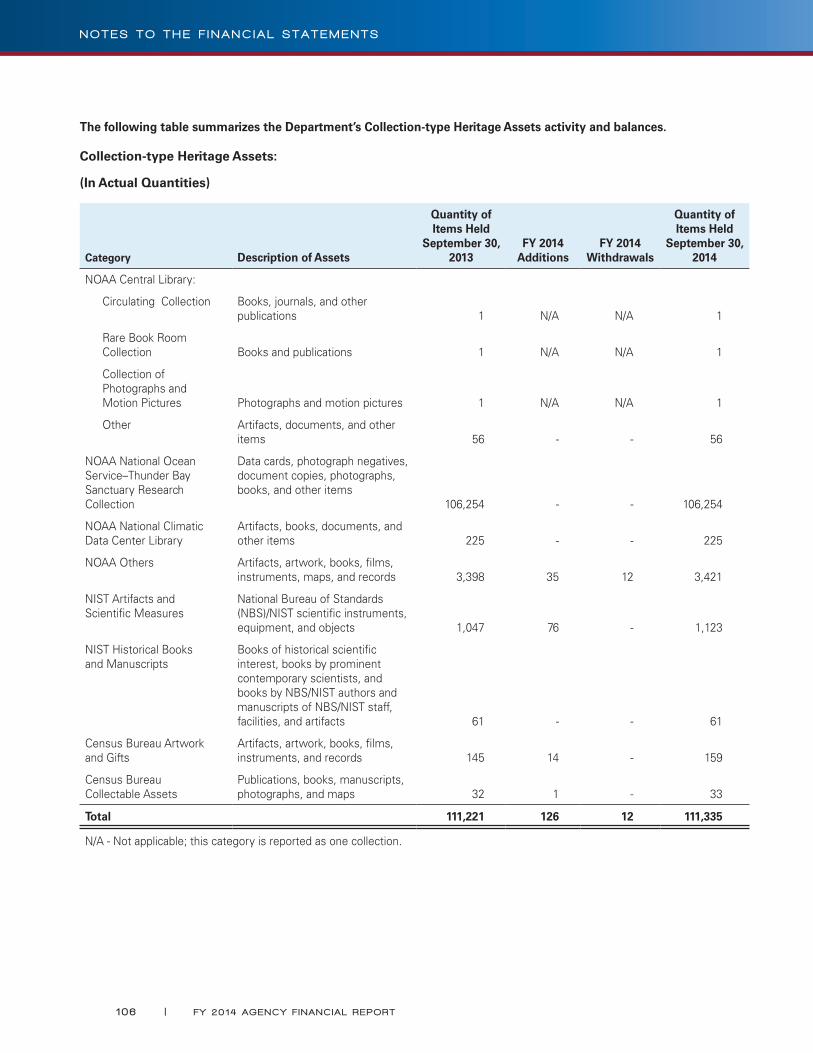
The following table summarizes the Department’s Collection-type Heritage Assets activity and balances.
Collection-type Heritage Assets:
(In Actual Quantities)
Category Description of Assets
Quantity of Items Held
September 30, 2013
FY 2014 Additions
FY 2014 Withdrawals
Quantity of Items Held
September 30, 2014
NOAA Central Library:
Circulating Collection Books, journals, and other publications 1 N/A N/A 1
Rare Book Room Collection Books and publications 1 N/A N/A 1
Collection of Photographs and Motion Pictures Photographs and motion pictures 1 N/A N/A 1
Other Artifacts, documents, and other items 56 - - 56
NOAA National Ocean Service–Thunder Bay Sanctuary Research Collection
Data cards, photograph negatives, document copies, photographs, books, and other items
106,254 - - 106,254
NOAA National Climatic Data Center Library
Artifacts, books, documents, and other items 225 - - 225
NOAA Others Artifacts, artwork, books, films, instruments, maps, and records 3,398 35 12 3,421
NIST Artifacts and Scientific Measures
National Bureau of Standards (NBS)/NIST scientific instruments, equipment, and objects 1,047 76 - 1,123
NIST Historical Books and Manuscripts
Books of historical scientific interest, books by prominent contemporary scientists, and books by NBS/NIST authors and manuscripts of NBS/NIST staff, facilities, and artifacts 61 - - 61
Census Bureau Artwork and Gifts
Artifacts, artwork, books, films, instruments, and records 145 14 - 159
Census Bureau Collectable Assets
Publications, books, manuscripts, photographs, and maps 32 1 - 33
Total 111,221 126 12 111,335
N/A - Not applicable; this category is reported as one collection.
1 06 | FY 20 14 AGENCY F I NANC IAL REPORT
N O T E S T O T H E F I N A N C I A L S T A T E M E N T S

F I N A N C I A L S E C T I O N
requiredSupplementary
inFormation(unaudited)
REQUIRED SUPPLEMENTARY INFORMATION (Unaudited)
A Deferred Maintenance and Repairs
Deferred Maintenance and Repairs (DM&R) are maintenance and repairs that were not performed when they should have been, that were scheduled and not performed, or that were delayed for a future period. Maintenance and Repairs are activities directed towards keeping Property, Plant, and Equipment (PP&E) in acceptable operating condition. These activities include preventive maintenance, normal repairs, replacement of parts and structural components, and other activities needed to preserve the asset so that it can deliver acceptable performance and achieve its expected life. Maintenance and Repairs exclude activities aimed at expanding the capacity of an asset or otherwise upgrading it to serve needs different from, or significantly greater, than those originally intended. Critical maintenance is defined as those projects where the required maintenance and repairs will have a critical impact on the public access, functionality and mission support, health and safety, and life cycle cost of a facility if the maintenance or repairs is not performed. The significant portions of Departmental DM&R relate to PP&E of both the National Oceanic and Atmospheric Administration (NOAA) and the National Institute of Standards and Technology (NIST). These two entities represent 96 percent of the Department’s General PP&E, Net balance as of September 30, 2014.
NOAA:
NOAA measures DM&R using Condition Assessment Surveys which are periodic visual (i.e., physical) inspections of PP&E and heritage assets to determine their current condition and estimated cost to correct any deficiencies. NOAA schedules its surveys, for real property on a cyclical basis, with each appropriate asset being surveyed every five years. For DM&R reporting purposes, NOAA completed a condition survey of the entire applicable inventory of its real property in FY 2011. The first complete cycle of annual testing of a fifth of the real property inventory will be completed no later than 2016. Exceptions to the five-year cycle would be where factors indicate that a greater frequency of review is prudent for reasons such as age and/or poor condition. NOAA schedules it surveys for personal property on an annual basis.
NOAA will perform Condition Assessment Surveys as necessary to measure and report DM&R for capitalized personal property, NOAA-owned buildings (including those fully depreciated), non-capitalized heritage assets, and capital leases that NOAA has executed and where NOAA has the financial responsibility for operations and maintenance of the asset. NOAA will additionally perform condition assessment surveys for capitalized personal property. For financial reporting purposes, NOAA does not report on DM&R of structures, non-heritage non-capitalized buildings, non-capitalized personal property, or stewardship land as they represent less than 10 percent of the acquisition value of NOAA’s DM&R inventory and therefore are considered immaterial. DM&R cost estimates will only be reported for individual real property items with estimates greater than $50 thousand. DM&R on capitalized personal property is reported with an estimated project cost of $25 thousand or more.
NOAA prioritizes maintenance and repair projects to sustain its inventory in good operating condition, including maintaining warranties. DM&R is impacted by funding shortfalls. As such, NOAA selects projects that will remedy life safety deficiencies and minimize risk of mission failure as real property enables the accomplishment of the mission. DM&R projects will not be addressed without a funding initiative. NOAA generally does not perform investment analyses in selecting projects. For financial reporting purposes, NOAA does not report on DM&R of structures, non-heritage non-capitalized buildings, non-capitalized personal property, or stewardship land as they represent less than 10% of the acquisition value our inventory and therefore are considered immaterial.
1 08 | FY 20 14 AGENCY F I NANC IAL REPORT
R E Q U I R E D S U P P L E M E N T A R Y I N F O R M A T I O N ( U N A U D I T E D )
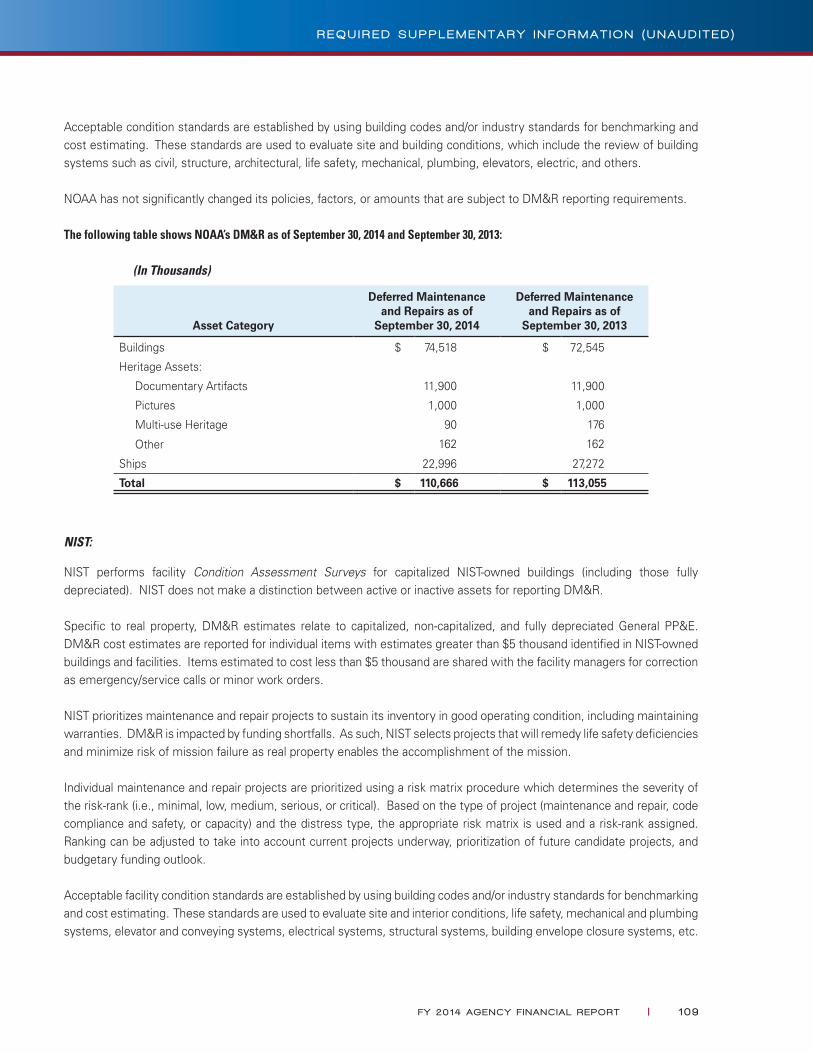
Acceptable condition standards are established by using building codes and/or industry standards for benchmarking and cost estimating. These standards are used to evaluate site and building conditions, which include the review of building systems such as civil, structure, architectural, life safety, mechanical, plumbing, elevators, electric, and others.
NOAA has not significantly changed its policies, factors, or amounts that are subject to DM&R reporting requirements.
The following table shows NOAA’s DM&R as of September 30, 2014 and September 30, 2013:
(In Thousands)
Asset Category
Deferred Maintenance and Repairs as of
September 30, 2014
Deferred Maintenance and Repairs as of
September 30, 2013
Buildings $ 74,518 $ 72,545
Heritage Assets:
Documentary Artifacts 11,900 11,900
Pictures 1,000 1,000
Multi-use Heritage 90 176
● Other 162 162
Ships 22,996 27,272
Total $ 110,666 $ 113,055
NIST:
NIST performs facility Condition Assessment Surveys for capitalized NIST-owned buildings (including those fully depreciated). NIST does not make a distinction between active or inactive assets for reporting DM&R.
Specific to real property, DM&R estimates relate to capitalized, non-capitalized, and fully depreciated General PP&E. DM&R cost estimates are reported for individual items with estimates greater than $5 thousand identified in NIST-owned buildings and facilities. Items estimated to cost less than $5 thousand are shared with the facility managers for correction as emergency/service calls or minor work orders.
NIST prioritizes maintenance and repair projects to sustain its inventory in good operating condition, including maintaining warranties. DM&R is impacted by funding shortfalls. As such, NIST selects projects that will remedy life safety deficiencies and minimize risk of mission failure as real property enables the accomplishment of the mission.
Individual maintenance and repair projects are prioritized using a risk matrix procedure which determines the severity of the risk-rank (i.e., minimal, low, medium, serious, or critical). Based on the type of project (maintenance and repair, code compliance and safety, or capacity) and the distress type, the appropriate risk matrix is used and a risk-rank assigned. Ranking can be adjusted to take into account current projects underway, prioritization of future candidate projects, and budgetary funding outlook.
Acceptable facility condition standards are established by using building codes and/or industry standards for benchmarking and cost estimating. These standards are used to evaluate site and interior conditions, life safety, mechanical and plumbing systems, elevator and conveying systems, electrical systems, structural systems, building envelope closure systems, etc.
FY 20 14 AGENCY F I NANC IAL REPORT | 1 09
R E Q U I R E D S U P P L E M E N T A R Y I N F O R M A T I O N ( U N A U D I T E D )
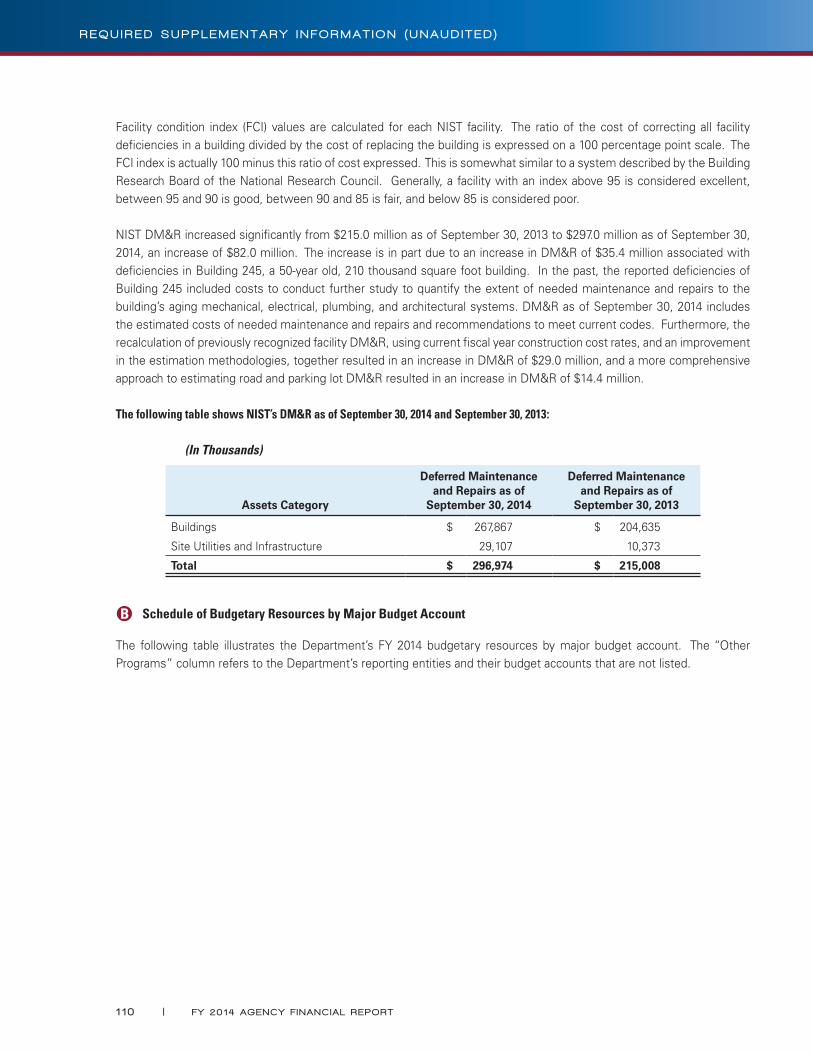
Facility condition index (FCI) values are calculated for each NIST facility. The ratio of the cost of correcting all facility deficiencies in a building divided by the cost of replacing the building is expressed on a 100 percentage point scale. The FCI index is actually 100 minus this ratio of cost expressed. This is somewhat similar to a system described by the Building Research Board of the National Research Council. Generally, a facility with an index above 95 is considered excellent, between 95 and 90 is good, between 90 and 85 is fair, and below 85 is considered poor.
NIST DM&R increased significantly from $215.0 million as of September 30, 2013 to $297.0 million as of September 30, 2014, an increase of $82.0 million. The increase is in part due to an increase in DM&R of $35.4 million associated with deficiencies in Building 245, a 50-year old, 210 thousand square foot building. In the past, the reported deficiencies of Building 245 included costs to conduct further study to quantify the extent of needed maintenance and repairs to the building’s aging mechanical, electrical, plumbing, and architectural systems. DM&R as of September 30, 2014 includes the estimated costs of needed maintenance and repairs and recommendations to meet current codes. Furthermore, the recalculation of previously recognized facility DM&R, using current fiscal year construction cost rates, and an improvement in the estimation methodologies, together resulted in an increase in DM&R of $29.0 million, and a more comprehensive approach to estimating road and parking lot DM&R resulted in an increase in DM&R of $14.4 million.
The following table shows NIST’s DM&R as of September 30, 2014 and September 30, 2013:
(In Thousands)
Assets Category
Deferred Maintenance and Repairs as of
September 30, 2014
Deferred Maintenance and Repairs as of
September 30, 2013
Buildings $ 267,867 $ 204,635
Site Utilities and Infrastructure 29,107 10,373
Total $ 296,974 $ 215,008
B Schedule of Budgetary Resources by Major Budget Account
The following table illustrates the Department’s FY 2014 budgetary resources by major budget account. The “Other Programs” column refers to the Department’s reporting entities and their budget accounts that are not listed.
1 1 0 | FY 20 14 AGENCY F I NANC IAL REPORT
R E Q U I R E D S U P P L E M E N T A R Y I N F O R M A T I O N ( U N A U D I T E D )
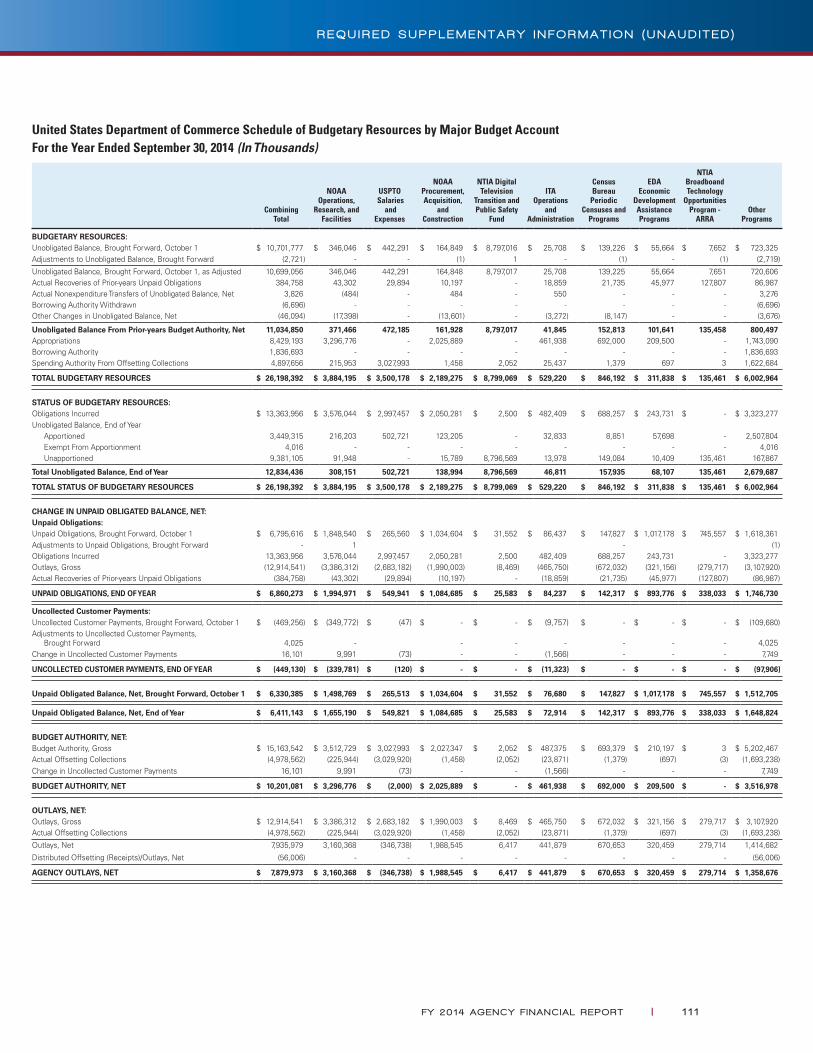
United States Department of Commerce Schedule of Budgetary Resources by Major Budget Account For the Year Ended September 30, 2014 (In Thousands)
Combining Total
NOAAOperations,
Research, andFacilities
USPTO Salaries
andExpenses
NOAAProcurement,Acquisition,
and Construction
NTIA Digital Television
Transition and Public Safety
Fund
ITAOperations
andAdministration
Census Bureau
Periodic Censuses and
Programs
EDA Economic
Development AssistancePrograms
NTIA Broadboand Technology
Opportunities Program -
ARRAOther
Programs
BUDGETARY RESOURCES:Unobligated Balance, Brought Forward, October 1 $ 10,701,777 $ 346,046 $ 442,291 $ 164,849 $ 8,797,016 $ 25,708 $ 139,226 $ 55,664 $ 7,652 $ 723,325Adjustments to Unobligated Balance, Brought Forward (2,721) - - (1) 1 - (1) - (1) (2,719)Unobligated Balance, Brought Forward, October 1, as Adjusted 10,699,056 346,046 442,291 164,848 8,797,017 25,708 139,225 55,664 7,651 720,606Actual Recoveries of Prior-years Unpaid Obligations 384,758 43,302 29,894 10,197 - 18,859 21,735 45,977 127,807 86,987Actual Nonexpenditure Transfers of Unobligated Balance, Net 3,826 (484) - 484 - 550 - - - 3,276Borrowing Authority Withdrawn (6,696) - - - - - - - - (6,696)Other Changes in Unobligated Balance, Net (46,094) (17,398) - (13,601) - (3,272) (8,147) - - (3,676)
Unobligated Balance From Prior-years Budget Authority, Net 11,034,850 371,466 472,185 161,928 8,797,017 41,845 152,813 101,641 135,458 800,497Appropriations 8,429,193 3,296,776 - 2,025,889 - 461,938 692,000 209,500 - 1,743,090Borrowing Authority 1,836,693 - - - - - - - - 1,836,693Spending Authority From Offsetting Collections 4,897,656 215,953 3,027,993 1,458 2,052 25,437 1,379 697 3 1,622,684
TOTAL BUDGETARY RESOURCES $ 26,198,392 $ 3,884,195 $ 3,500,178 $ 2,189,275 $ 8,799,069 $ 529,220 $ 846,192 $ 311,838 $ 135,461 $ 6,002,964
STATUS OF BUDGETARY RESOURCES:Obligations Incurred $ 13,363,956 $ 3,576,044 $ 2,997,457 $ 2,050,281 $ 2,500 $ 482,409 $ 688,257 $ 243,731 $ - $ 3,323,277Unobligated Balance, End of Year
Apportioned 3,449,315 216,203 502,721 123,205 - 32,833 8,851 57,698 - 2,507,804Exempt From Apportionment 4,016 - - - - - - - - 4,016Unapportioned 9,381,105 91,948 - 15,789 8,796,569 13,978 149,084 10,409 135,461 167,867
Total Unobligated Balance, End of Year 12,834,436 308,151 502,721 138,994 8,796,569 46,811 157,935 68,107 135,461 2,679,687
TOTAL STATUS OF BUDGETARY RESOURCES $ 26,198,392 $ 3,884,195 $ 3,500,178 $ 2,189,275 $ 8,799,069 $ 529,220 $ 846,192 $ 311,838 $ 135,461 $ 6,002,964
CHANGE IN UNPAID OBLIGATED BALANCE, NET:Unpaid Obligations:Unpaid Obligations, Brought Forward, October 1 $ 6,795,616 $ 1,848,540 $ 265,560 $ 1,034,604 $ 31,552 $ 86,437 $ 147,827 $ 1,017,178 $ 745,557 $ 1,618,361Adjustments to Unpaid Obligations, Brought Forward - 1 - (1)Obligations Incurred 13,363,956 3,576,044 2,997,457 2,050,281 2,500 482,409 688,257 243,731 - 3,323,277Outlays, Gross (12,914,541) (3,386,312) (2,683,182) (1,990,003) (8,469) (465,750) (672,032) (321,156) (279,717) (3,107,920)Actual Recoveries of Prior-years Unpaid Obligations (384,758) (43,302) (29,894) (10,197) - (18,859) (21,735) (45,977) (127,807) (86,987)
UNPAID OBLIGATIONS, END OF YEAR $ 6,860,273 $ 1,994,971 $ 549,941 $ 1,084,685 $ 25,583 $ 84,237 $ 142,317 $ 893,776 $ 338,033 $ 1,746,730
Uncollected Customer Payments:Uncollected Customer Payments, Brought Forward, October 1 $ (469,256) $ (349,772) $ (47) $ - $ - $ (9,757) $ - $ - $ - $ (109,680)Adjustments to Uncollected Customer Payments,
Brought Forward 4,025 - - - - - - - 4,025Change in Uncollected Customer Payments 16,101 9,991 (73) - - (1,566) - - - 7,749
UNCOLLECTED CUSTOMER PAYMENTS, END OF YEAR $ (449,130) $ (339,781) $ (120) $ - $ - $ (11,323) $ - $ - $ - $ (97,906)
Unpaid Obligated Balance, Net, Brought Forward, October 1 $ 6,330,385 $ 1,498,769 $ 265,513 $ 1,034,604 $ 31,552 $ 76,680 $ 147,827 $ 1,017,178 $ 745,557 $ 1,512,705
Unpaid Obligated Balance, Net, End of Year $ 6,411,143 $ 1,655,190 $ 549,821 $ 1,084,685 $ 25,583 $ 72,914 $ 142,317 $ 893,776 $ 338,033 $ 1,648,824
BUDGET AUTHORITY, NET:Budget Authority, Gross $ 15,163,542 $ 3,512,729 $ 3,027,993 $ 2,027,347 $ 2,052 $ 487,375 $ 693,379 $ 210,197 $ 3 $ 5,202,467Actual Offsetting Collections (4,978,562) (225,944) (3,029,920) (1,458) (2,052) (23,871) (1,379) (697) (3) (1,693,238)Change in Uncollected Customer Payments 16,101 9,991 (73) - - (1,566) - - - 7,749
BUDGET AUTHORITY, NET $ 10,201,081 $ 3,296,776 $ (2,000) $ 2,025,889 $ - $ 461,938 $ 692,000 $ 209,500 $ - $ 3,516,978
OUTLAYS, NET:Outlays, Gross $ 12,914,541 $ 3,386,312 $ 2,683,182 $ 1,990,003 $ 8,469 $ 465,750 $ 672,032 $ 321,156 $ 279,717 $ 3,107,920Actual Offsetting Collections (4,978,562) (225,944) (3,029,920) (1,458) (2,052) (23,871) (1,379) (697) (3) (1,693,238)
Outlays, Net 7,935,979 3,160,368 (346,738) 1,988,545 6,417 441,879 670,653 320,459 279,714 1,414,682
Distributed Offsetting (Receipts)/Outlays, Net (56,006) - - - - - - - - (56,006)
AGENCY OUTLAYS, NET $ 7,879,973 $ 3,160,368 $ (346,738) $ 1,988,545 $ 6,417 $ 441,879 $ 670,653 $ 320,459 $ 279,714 $ 1,358,676
FY 20 14 AGENCY F I NANC IAL REPORT | 1 1 1
R E Q U I R E D S U P P L E M E N T A R Y I N F O R M A T I O N ( U N A U D I T E D )

1 1 2 | FY 20 14 AGENCY F I NANC IAL REPORT
R E Q U I R E D S U P P L E M E N T A R Y I N F O R M A T I O N ( U N A U D I T E D )
F I N A N C I A L S E C T I O N
required Supplementary StewardShipinFormation
(unaudited)
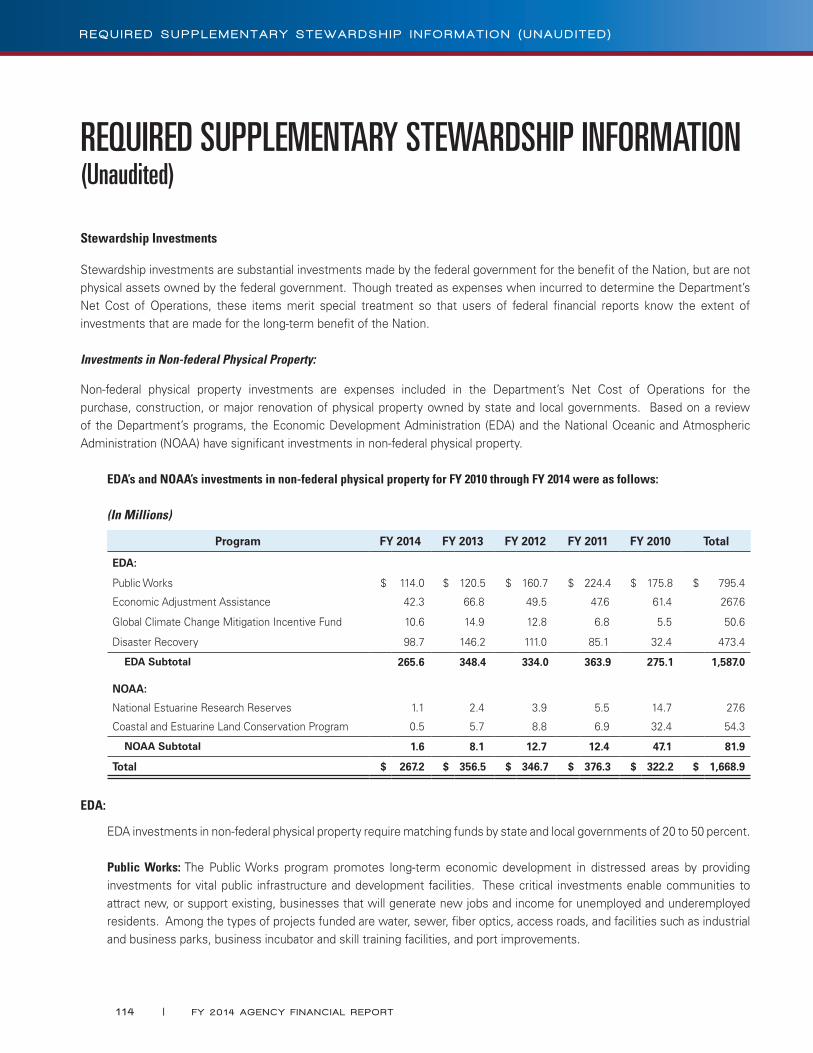
REQUIRED SUPPLEMENTARY STEWARDSHIP INFORMATION (Unaudited)
Stewardship Investments
Stewardship investments are substantial investments made by the federal government for the benefit of the Nation, but are not physical assets owned by the federal government. Though treated as expenses when incurred to determine the Department’s Net Cost of Operations, these items merit special treatment so that users of federal financial reports know the extent of investments that are made for the long-term benefit of the Nation.
Investments in Non-federal Physical Property:
Non-federal physical property investments are expenses included in the Department’s Net Cost of Operations for the purchase, construction, or major renovation of physical property owned by state and local governments. Based on a review of the Department’s programs, the Economic Development Administration (EDA) and the National Oceanic and Atmospheric Administration (NOAA) have significant investments in non-federal physical property.
EDA’s and NOAA’s investments in non-federal physical property for FY 2010 through FY 2014 were as follows:
(In Millions)
Program FY 2014 FY 2013 FY 2012 FY 2011 FY 2010 Total
EDA:
Public Works $ 114.0 $ 120.5 $ 160.7 $ 224.4 $ 175.8 $ 795.4
Economic Adjustment Assistance 42.3 66.8 49.5 47.6 61.4 267.6
Global Climate Change Mitigation Incentive Fund 10.6 14.9 12.8 6.8 5.5 50.6
Disaster Recovery 98.7 146.2 111.0 85.1 32.4 473.4
EDA Subtotal 265.6 348.4 334.0 363.9 275.1 1,587.0
NOAA:
National Estuarine Research Reserves 1.1 2.4 3.9 5.5 14.7 27.6
Coastal and Estuarine Land Conservation Program 0.5 5.7 8.8 6.9 32.4 54.3
NOAA Subtotal 1.6 8.1 12.7 12.4 47.1 81.9
Total $ 267.2 $ 356.5 $ 346.7 $ 376.3 $ 322.2 $ 1,668.9
EDA:
EDA investments in non-federal physical property require matching funds by state and local governments of 20 to 50 percent.
Public Works: The Public Works program promotes long-term economic development in distressed areas by providing investments for vital public infrastructure and development facilities. These critical investments enable communities to attract new, or support existing, businesses that will generate new jobs and income for unemployed and underemployed residents. Among the types of projects funded are water, sewer, fiber optics, access roads, and facilities such as industrial and business parks, business incubator and skill training facilities, and port improvements.
1 1 4 | FY 20 14 AGENCY F I NANC IAL REPORT
R E Q U I R E D S U P P L E M E N T A R Y S T E W A R D S H I P I N F O R M A T I O N ( U N A U D I T E D )

Economic Adjustment Assistance: The Economic Adjustment Assistance program provides flexible investments for communities facing sudden or severe economic distress to diversify and stabilize their economies. Factors that seriously threaten the economic survival of communities include plant closures, military base closures or realignments, defense laboratory or contractor downsizings, natural resource depletion, out-migration, under-employment, and the impacts of foreign trade.
Global Climate Change Mitigation Incentive Fund (GCCMIF): The GCCMIF program finances projects that foster economic development by advancing the green economy in distressed communities and projects that develop and use products and services that contribute to economic growth and alleviate economic distress by respecting and revitalizing the environment. The GCCMIF program supports projects that create jobs through, and increase private capital investment in, efforts to limit the Nation’s dependence on fossil fuels, enhance energy efficiency, curb greenhouse gas emissions, and protect natural systems.
Disaster Recovery: EDA supports the repair of infrastructure and economic development related facilities damaged by floods and other natural disasters. Funding for Disaster Recovery is generally through supplemental appropriations from Congress for recovery efforts to save, sustain, and preserve private enterprise and job creation in economically distressed communities.
NOAA:
National Estuarine Research Reserves (NERR): The NERR system consists of 28 estuarine reserves protected by federal, state, and local partnerships that work to preserve and protect the Nation’s estuaries. The NERR system helps to fulfill NOAA’s stewardship mission to sustain healthy coasts by improving the Nation’s understanding and stewardship of estuaries. Estuarine reserves are the areas where freshwater from rivers meet the ocean. These areas are known as bays, swamps, sloughs, and sounds. These important coastal habitats are used as spawning grounds and nurseries for the Nation’s commercial fish and shellfish. Estuaries filter much of the polluted runoff from rivers and streams that would otherwise contaminate oceans. The reserves were created with the passage of the Coastal Zone Management Act of 1972, and, as of September 30, 2014, encompassed approximately 1.4 million acres of estuarine waters, wetlands, and uplands. The most recent reserve, Lake Superior, WI, was designated on October 26, 2010. NERRs are state-operated and managed in cooperation with NOAA. NOAA’s investments in non-federal physical property are for the acquisition of lands and development or construction of facilities, auxiliary structures, and public access routes for any NERR site.
Coastal and Estuarine Land Conservation Program: This program was established under the Commerce, Justice, and State Appropriations Act of 2002, “for the purpose of protecting important coastal and estuarine areas that have significant conservation, recreation, ecological, historical, or aesthetic values, or that are threatened by conversion from their natural or recreational state to other uses.” The investments in non-federal physical property include matching grants awarded to state and local governments for land acquisition in coastal and estuarine areas. Since FY 2002, matching grants have been directed to 212 such projects.
Coastal Zone Management Fund: The Coastal Zone Management Program is authorized by the Coastal Zone Management Act of 1972, and administered at the federal level by NOAA’s Office of Ocean and Coastal Resource Management. NOAA’s financing supports various coastal states in their redevelopment of deteriorating and urbanized waterfronts and ports, as well as providing for public access to beaches and coastal areas. The state and local governments receive funding for these investments through NOAA grant expenditures, for the purpose of preservation or restoration of coastal resources and habitats. There is currently not in place a mechanism for the state and local governments to determine and report to NOAA the amount of monies they expend for the investments in non-federal physical property. The Department, accordingly, cannot report the amount of investments in non-federal physical property for the Coastal Zone Management Fund.
FY 20 14 AGENCY F I NANC IAL REPORT | 1 1 5
R E Q U I R E D S U P P L E M E N T A R Y S T E W A R D S H I P I N F O R M A T I O N ( U N A U D I T E D )
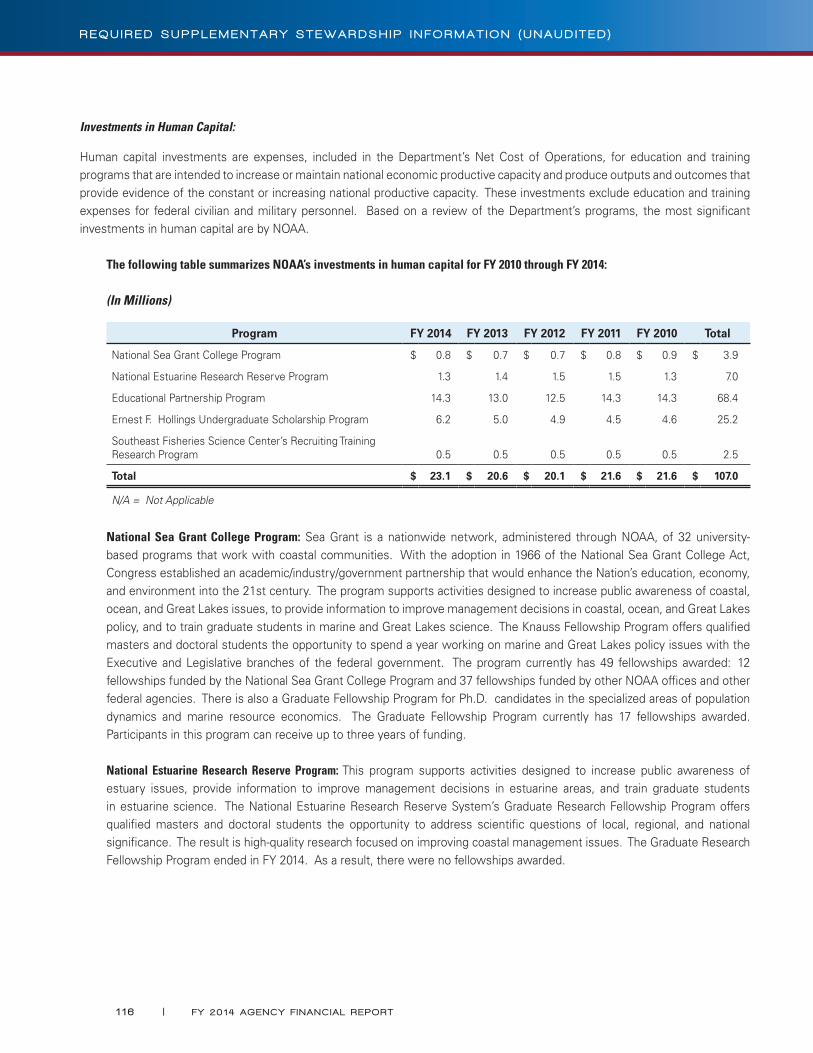
Investments in Human Capital:
Human capital investments are expenses, included in the Department’s Net Cost of Operations, for education and training programs that are intended to increase or maintain national economic productive capacity and produce outputs and outcomes that provide evidence of the constant or increasing national productive capacity. These investments exclude education and training expenses for federal civilian and military personnel. Based on a review of the Department’s programs, the most significant investments in human capital are by NOAA.
The following table summarizes NOAA’s investments in human capital for FY 2010 through FY 2014:
(In Millions)
Program FY 2014 FY 2013 FY 2012 FY 2011 FY 2010 Total
National Sea Grant College Program $ 0.8 $ 0.7 $ 0.7 $ 0.8 $ 0.9 $ 3.9
National Estuarine Research Reserve Program 1.3 1.4 1.5 1.5 1.3 7.0
Educational Partnership Program 14.3 13.0 12.5 14.3 14.3 68.4
Ernest F. Hollings Undergraduate Scholarship Program 6.2 5.0 4.9 4.5 4.6 25.2
Southeast Fisheries Science Center’s Recruiting Training Research Program 0.5 0.5 0.5 0.5 0.5 2.5
Total $ 23.1 $ 20.6 $ 20.1 $ 21.6 $ 21.6 $ 107.0
N/A = Not Applicable
National Sea Grant College Program: Sea Grant is a nationwide network, administered through NOAA, of 32 university-based programs that work with coastal communities. With the adoption in 1966 of the National Sea Grant College Act, Congress established an academic/industry/government partnership that would enhance the Nation’s education, economy, and environment into the 21st century. The program supports activities designed to increase public awareness of coastal, ocean, and Great Lakes issues, to provide information to improve management decisions in coastal, ocean, and Great Lakes policy, and to train graduate students in marine and Great Lakes science. The Knauss Fellowship Program offers qualified masters and doctoral students the opportunity to spend a year working on marine and Great Lakes policy issues with the Executive and Legislative branches of the federal government. The program currently has 49 fellowships awarded: 12 fellowships funded by the National Sea Grant College Program and 37 fellowships funded by other NOAA offices and other federal agencies. There is also a Graduate Fellowship Program for Ph.D. candidates in the specialized areas of population dynamics and marine resource economics. The Graduate Fellowship Program currently has 17 fellowships awarded. Participants in this program can receive up to three years of funding.
National Estuarine Research Reserve Program: This program supports activities designed to increase public awareness of estuary issues, provide information to improve management decisions in estuarine areas, and train graduate students in estuarine science. The National Estuarine Research Reserve System’s Graduate Research Fellowship Program offers qualified masters and doctoral students the opportunity to address scientific questions of local, regional, and national significance. The result is high-quality research focused on improving coastal management issues. The Graduate Research Fellowship Program ended in FY 2014. As a result, there were no fellowships awarded.
1 1 6 | FY 20 14 AGENCY F I NANC IAL REPORT
R E Q U I R E D S U P P L E M E N T A R Y S T E W A R D S H I P I N F O R M A T I O N ( U N A U D I T E D )
Educational Partnership Program: The NOAA Educational Partnership Program with Minority Serving Institutions (MSI) provides financial assistance through competitive processes to minority serving institutions that support research and training of students in NOAA-related sciences. The program’s goal is to increase the number of trained and graduated students from underrepresented communities in science and technology directly related to NOAA’s mission. The EPP/MSI also seeks to increase collaborative research efforts between NOAA scientists and researchers at minority serving academic institutions. In FY 2014, the Cooperative Science Center awarded 104 degrees to students.
Ernest F. Hollings Undergraduate Scholarship Program: This program was established in 2005 to (1) increase undergraduate training in oceanic and atmospheric science, research, technology, and education, and foster multidisciplinary training opportunities; (2) increase public understanding and support for stewardship of the ocean and atmosphere and improve environmental literacy; (3) recruit and prepare students for public service careers with NOAA and other agencies at the federal, state, and local levels of government; and (4) recruit and prepare students for careers as teachers and educators in oceanic and atmospheric science and to improve scientific and environmental education in the U.S. In FY 2014, the program added 105 students.
Southeast Fisheries Science Center’s (SEFSC) Recruiting Training Research Program: This is a joint program between NOAA’s National Marine Fisheries Service (NMFS) and the University of Florida. The program had resided at Virginia Tech before moving to the University of Florida in December of 2011. The objectives of the program are the following: (1) to recruit top undergraduate and graduate students into the field of fisheries population dynamics and careers with NMFS; (2) to train graduate students; and (3) to conduct population dynamics and stock assessment research in support of the NMFS mission. The program also offers graduate courses and workshops in computer programming, simulation modeling, and fish population dynamics.
In FY 2014, 5 graduate students conducted SEFSC related research as part of the program, and 15 outstanding undergraduate students from across the country participated in a week long undergraduate workshop. In addition, a total of 7 University of Florida graduate students were funded or partially funded by the Recruiting Training Research Program.
Investments in Research and Development (R&D):
Investments in R&D are expenses that are included in the Department’s Net Cost of Operations. The investments are divided into three categories: (1) basic research, the systematic study to gain knowledge or understanding of the fundamental aspects of phenomena and of observable facts without specific applications toward processes or products in mind; (2) applied research, the systematic study to gain knowledge or understanding necessary for determining the means by which a recognized and specific need may be met; and (3) development, the systematic use of the knowledge and understanding gained from research for the production of useful materials, devices, systems, or methods, including the design and development of prototypes and processes. The investments are made with the expectation of maintaining or increasing national economic productive capacity, or yielding other future economic or societal benefits. Based on a review of the Department’s programs, the only significant investments in R&D are by the National Institute of Standards and Technology (NIST) and NOAA.
FY 20 14 AGENCY F I NANC IAL REPORT | 1 1 7
R E Q U I R E D S U P P L E M E N T A R Y S T E W A R D S H I P I N F O R M A T I O N ( U N A U D I T E D )
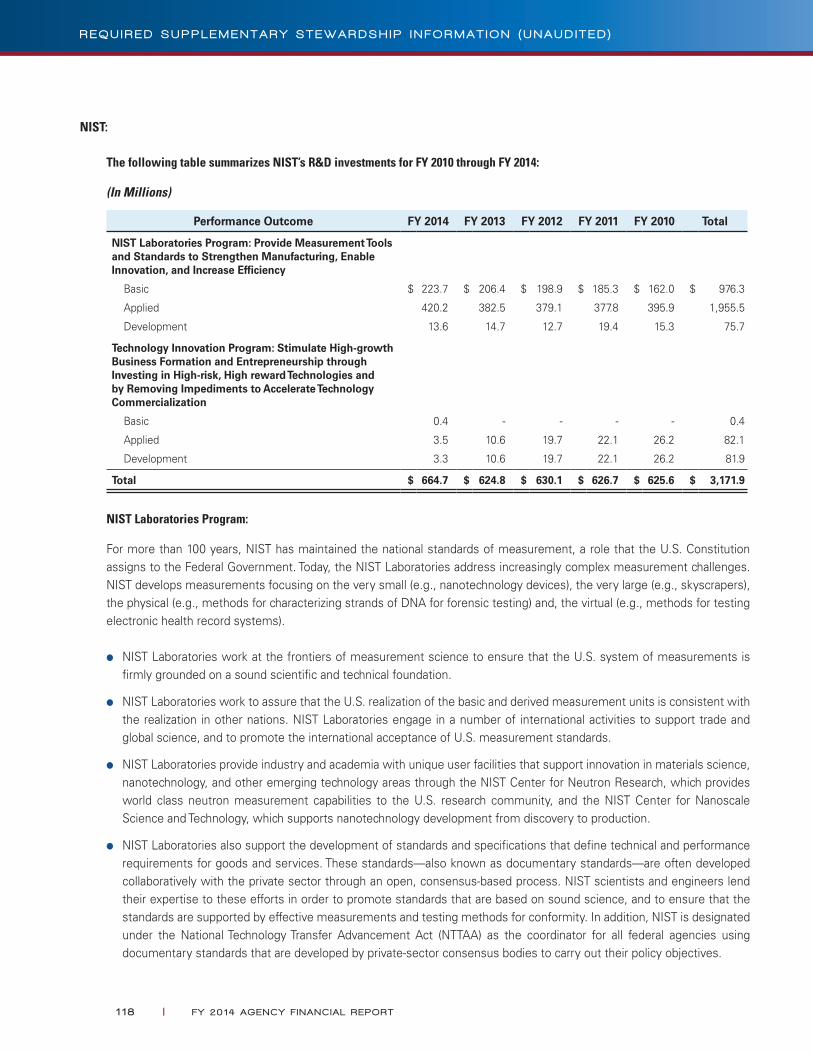
NIST:
The following table summarizes NIST’s R&D investments for FY 2010 through FY 2014:
(In Millions)
Performance Outcome FY 2014 FY 2013 FY 2012 FY 2011 FY 2010 Total
NIST Laboratories Program: Provide Measurement Tools and Standards to Strengthen Manufacturing, Enable Innovation, and Increase Efficiency
Basic $ 223.7 $ 206.4 $ 198.9 $ 185.3 $ 162.0 $ 976.3
Applied 420.2 382.5 379.1 377.8 395.9 1,955.5
Development 13.6 14.7 12.7 19.4 15.3 75.7
Technology Innovation Program: Stimulate High-growth Business Formation and Entrepreneurship through Investing in High-risk, High reward Technologies and by Removing Impediments to Accelerate Technology Commercialization
Basic 0.4 - - - - 0.4
Applied 3.5 10.6 19.7 22.1 26.2 82.1
Development 3.3 10.6 19.7 22.1 26.2 81.9
Total $ 664.7 $ 624.8 $ 630.1 $ 626.7 $ 625.6 $ 3,171.9
NIST Laboratories Program:
For more than 100 years, NIST has maintained the national standards of measurement, a role that the U.S. Constitution assigns to the Federal Government. Today, the NIST Laboratories address increasingly complex measurement challenges. NIST develops measurements focusing on the very small (e.g., nanotechnology devices), the very large (e.g., skyscrapers), the physical (e.g., methods for characterizing strands of DNA for forensic testing) and, the virtual (e.g., methods for testing electronic health record systems).
●● NIST Laboratories work at the frontiers of measurement science to ensure that the U.S. system of measurements is firmly grounded on a sound scientific and technical foundation.
●● NIST Laboratories work to assure that the U.S. realization of the basic and derived measurement units is consistent with the realization in other nations. NIST Laboratories engage in a number of international activities to support trade and global science, and to promote the international acceptance of U.S. measurement standards.
●● NIST Laboratories provide industry and academia with unique user facilities that support innovation in materials science, nanotechnology, and other emerging technology areas through the NIST Center for Neutron Research, which provides world class neutron measurement capabilities to the U.S. research community, and the NIST Center for Nanoscale Science and Technology, which supports nanotechnology development from discovery to production.
●● NIST Laboratories also support the development of standards and specifications that define technical and performance requirements for goods and services. These standards—also known as documentary standards—are often developed collaboratively with the private sector through an open, consensus-based process. NIST scientists and engineers lend their expertise to these efforts in order to promote standards that are based on sound science, and to ensure that the standards are supported by effective measurements and testing methods for conformity. In addition, NIST is designated under the National Technology Transfer Advancement Act (NTTAA) as the coordinator for all federal agencies using documentary standards that are developed by private-sector consensus bodies to carry out their policy objectives.
1 18 | FY 20 14 AGENCY F I NANC IAL REPORT
R E Q U I R E D S U P P L E M E N T A R Y S T E W A R D S H I P I N F O R M A T I O N ( U N A U D I T E D )
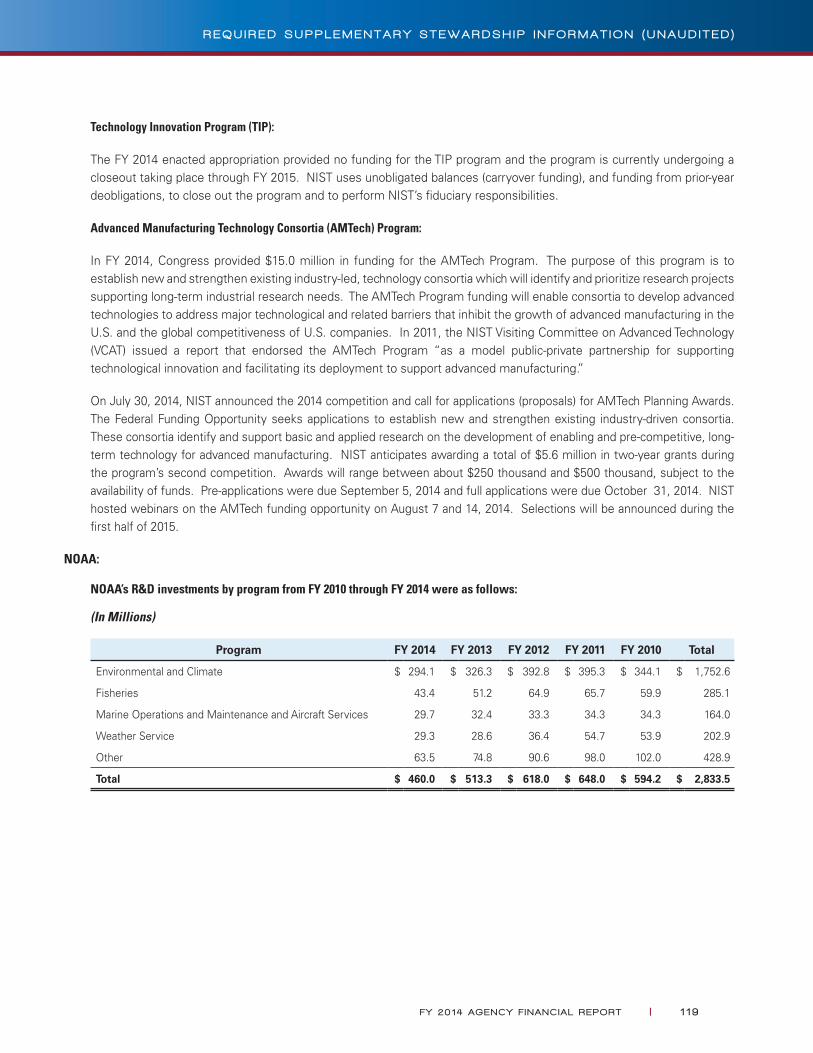
Technology Innovation Program (TIP):
The FY 2014 enacted appropriation provided no funding for the TIP program and the program is currently undergoing a closeout taking place through FY 2015. NIST uses unobligated balances (carryover funding), and funding from prior-year deobligations, to close out the program and to perform NIST’s fiduciary responsibilities.
Advanced Manufacturing Technology Consortia (AMTech) Program:
In FY 2014, Congress provided $15.0 million in funding for the AMTech Program. The purpose of this program is to establish new and strengthen existing industry-led, technology consortia which will identify and prioritize research projects supporting long-term industrial research needs. The AMTech Program funding will enable consortia to develop advanced technologies to address major technological and related barriers that inhibit the growth of advanced manufacturing in the U.S. and the global competitiveness of U.S. companies. In 2011, the NIST Visiting Committee on Advanced Technology (VCAT) issued a report that endorsed the AMTech Program “as a model public-private partnership for supporting technological innovation and facilitating its deployment to support advanced manufacturing.”
On July 30, 2014, NIST announced the 2014 competition and call for applications (proposals) for AMTech Planning Awards. The Federal Funding Opportunity seeks applications to establish new and strengthen existing industry-driven consortia. These consortia identify and support basic and applied research on the development of enabling and pre-competitive, long-term technology for advanced manufacturing. NIST anticipates awarding a total of $5.6 million in two-year grants during the program’s second competition. Awards will range between about $250 thousand and $500 thousand, subject to the availability of funds. Pre-applications were due September 5, 2014 and full applications were due October 31, 2014. NIST hosted webinars on the AMTech funding opportunity on August 7 and 14, 2014. Selections will be announced during the first half of 2015.
NOAA:
NOAA’s R&D investments by program from FY 2010 through FY 2014 were as follows:
(In Millions)
Program FY 2014 FY 2013 FY 2012 FY 2011 FY 2010 Total
Environmental and Climate $ 294.1 $ 326.3 $ 392.8 $ 395.3 $ 344.1 $ 1,752.6
Fisheries 43.4 51.2 64.9 65.7 59.9 285.1
Marine Operations and Maintenance and Aircraft Services 29.7 32.4 33.3 34.3 34.3 164.0
Weather Service 29.3 28.6 36.4 54.7 53.9 202.9
Other 63.5 74.8 90.6 98.0 102.0 428.9
Total $ 460.0 $ 513.3 $ 618.0 $ 648.0 $ 594.2 $ 2,833.5
FY 20 14 AGENCY F I NANC IAL REPORT | 1 1 9
R E Q U I R E D S U P P L E M E N T A R Y S T E W A R D S H I P I N F O R M A T I O N ( U N A U D I T E D )
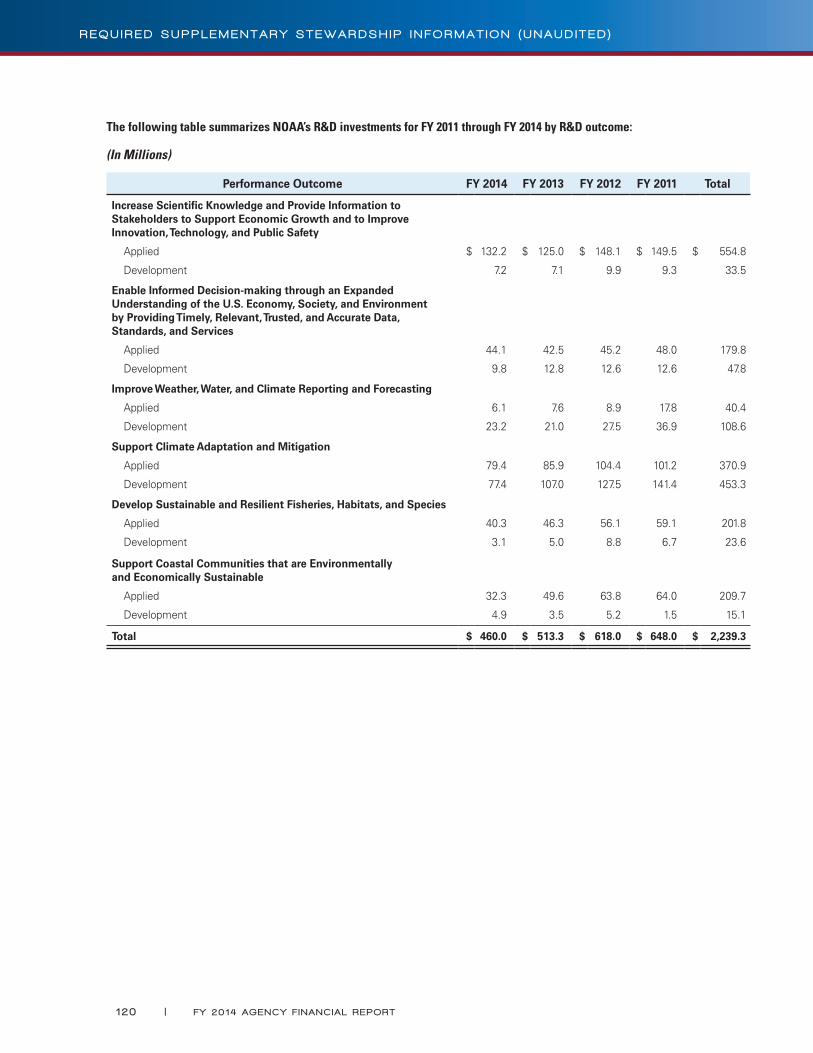
The following table summarizes NOAA’s R&D investments for FY 2011 through FY 2014 by R&D outcome:
(In Millions)
Performance Outcome FY 2014 FY 2013 FY 2012 FY 2011 Total
Increase Scientific Knowledge and Provide Information to Stakeholders to Support Economic Growth and to Improve Innovation, Technology, and Public Safety
Applied $ 132.2 $ 125.0 $ 148.1 $ 149.5 $ 554.8
Development 7.2 7.1 9.9 9.3 33.5
Enable Informed Decision-making through an Expanded Understanding of the U.S. Economy, Society, and Environment by Providing Timely, Relevant, Trusted, and Accurate Data, Standards, and Services
Applied 44.1 42.5 45.2 48.0 179.8
Development 9.8 12.8 12.6 12.6 47.8
Improve Weather, Water, and Climate Reporting and Forecasting
Applied 6.1 7.6 8.9 17.8 40.4
Development 23.2 21.0 27.5 36.9 108.6
Support Climate Adaptation and Mitigation
Applied 79.4 85.9 104.4 101.2 370.9
Development 77.4 107.0 127.5 141.4 453.3
Develop Sustainable and Resilient Fisheries, Habitats, and Species
Applied 40.3 46.3 56.1 59.1 201.8
Development 3.1 5.0 8.8 6.7 23.6
Support Coastal Communities that are Environmentally and Economically Sustainable
Applied 32.3 49.6 63.8 64.0 209.7
Development 4.9 3.5 5.2 1.5 15.1
Total $ 460.0 $ 513.3 $ 618.0 $ 648.0 $ 2,239.3
1 20 | FY 20 14 AGENCY F I NANC IAL REPORT
R E Q U I R E D S U P P L E M E N T A R Y S T E W A R D S H I P I N F O R M A T I O N ( U N A U D I T E D )
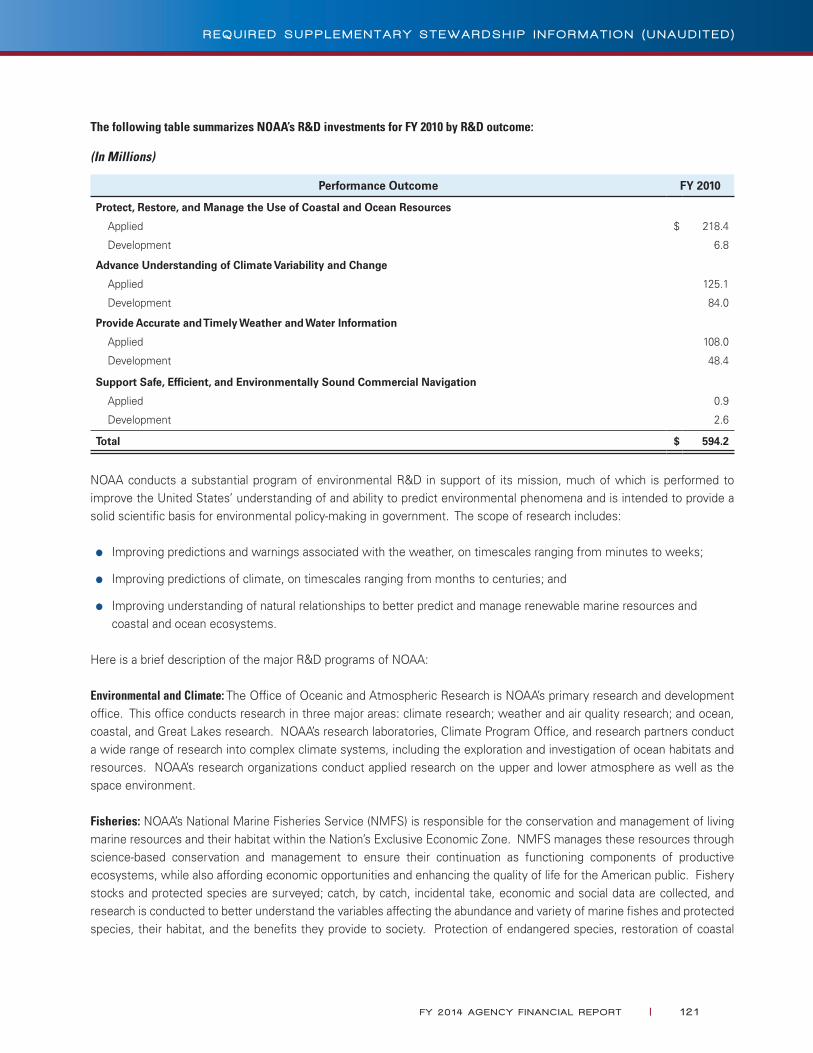
The following table summarizes NOAA’s R&D investments for FY 2010 by R&D outcome:
(In Millions)
Performance Outcome FY 2010
Protect, Restore, and Manage the Use of Coastal and Ocean Resources
Applied $ 218.4
Development 6.8
Advance Understanding of Climate Variability and Change
Applied 125.1
Development 84.0
Provide Accurate and Timely Weather and Water Information
Applied 108.0
Development 48.4
Support Safe, Efficient, and Environmentally Sound Commercial Navigation
Applied 0.9
Development 2.6
Total $ 594.2
NOAA conducts a substantial program of environmental R&D in support of its mission, much of which is performed to improve the United States’ understanding of and ability to predict environmental phenomena and is intended to provide a solid scientific basis for environmental policy-making in government. The scope of research includes:
●● Improving predictions and warnings associated with the weather, on timescales ranging from minutes to weeks;
●● Improving predictions of climate, on timescales ranging from months to centuries; and
●● Improving understanding of natural relationships to better predict and manage renewable marine resources and coastal and ocean ecosystems.
Here is a brief description of the major R&D programs of NOAA:
Environmental and Climate: The Office of Oceanic and Atmospheric Research is NOAA’s primary research and development office. This office conducts research in three major areas: climate research; weather and air quality research; and ocean, coastal, and Great Lakes research. NOAA’s research laboratories, Climate Program Office, and research partners conduct a wide range of research into complex climate systems, including the exploration and investigation of ocean habitats and resources. NOAA’s research organizations conduct applied research on the upper and lower atmosphere as well as the space environment.
Fisheries: NOAA’s National Marine Fisheries Service (NMFS) is responsible for the conservation and management of living marine resources and their habitat within the Nation’s Exclusive Economic Zone. NMFS manages these resources through science-based conservation and management to ensure their continuation as functioning components of productive ecosystems, while also affording economic opportunities and enhancing the quality of life for the American public. Fishery stocks and protected species are surveyed; catch, by catch, incidental take, economic and social data are collected, and research is conducted to better understand the variables affecting the abundance and variety of marine fishes and protected species, their habitat, and the benefits they provide to society. Protection of endangered species, restoration of coastal
FY 20 14 AGENCY F I NANC IAL REPORT | 1 2 1
R E Q U I R E D S U P P L E M E N T A R Y S T E W A R D S H I P I N F O R M A T I O N ( U N A U D I T E D )

and estuarine fishery habitats, and enforcement of fishery regulations are primary NOAA activities. The research and management of living marine resources is conducted in partnership with states, tribes, universities, other countries, international organizations, and a broad range of stakeholders who benefit from the use and existence of living marine resources and their habitat.
Marine Operations and Maintenance and Aircraft Services: These efforts support NOAA’s programs requiring operating days and flight hours to collect data at sea and in the air. NOAA’s Marine and Aviation Operations manage a wide variety of specialized aircraft and ships to complete NOAA’s environmental and scientific missions. The aircraft collect the environmental and geographic data essential to NOAA hurricane and other weather and atmospheric research, conduct aerial surveys for hydrologic research to help predict flooding potential from snowmelt, and provide support to NOAA’s fishery research and marine mammal assessment programs. NOAA’s ship fleet provides oceanographic and atmospheric research and fisheries research vessels to support NOAA’s strategic plan elements and mission.
Weather Service: The National Weather Service conducts applied research and development, building upon research conducted by NOAA laboratories and the academic community. Applied meteorological and hydrological research is integral to providing more timely and accurate weather, water, and climate services to the public.
Other Programs: As a national lead for coastal stewardship, National Ocean Service promotes a wide range of research activities to create the strong science foundation required to advance the sustainable use of precious coastal systems. Understanding of the coastal environment is enhanced through coastal ocean activities that support science and resource management programs. The National Environmental Satellite Data and Information Service, through its Office of Research and Applications, conducts atmospheric, climatological, and oceanic research into the use of satellite data for monitoring environmental characteristics and their changes. It also provides guidance for the development and evolution of spacecraft and sensors to meet future needs.
1 22 | FY 20 14 AGENCY F I NANC IAL REPORT
R E Q U I R E D S U P P L E M E N T A R Y S T E W A R D S H I P I N F O R M A T I O N ( U N A U D I T E D )

other inFormation
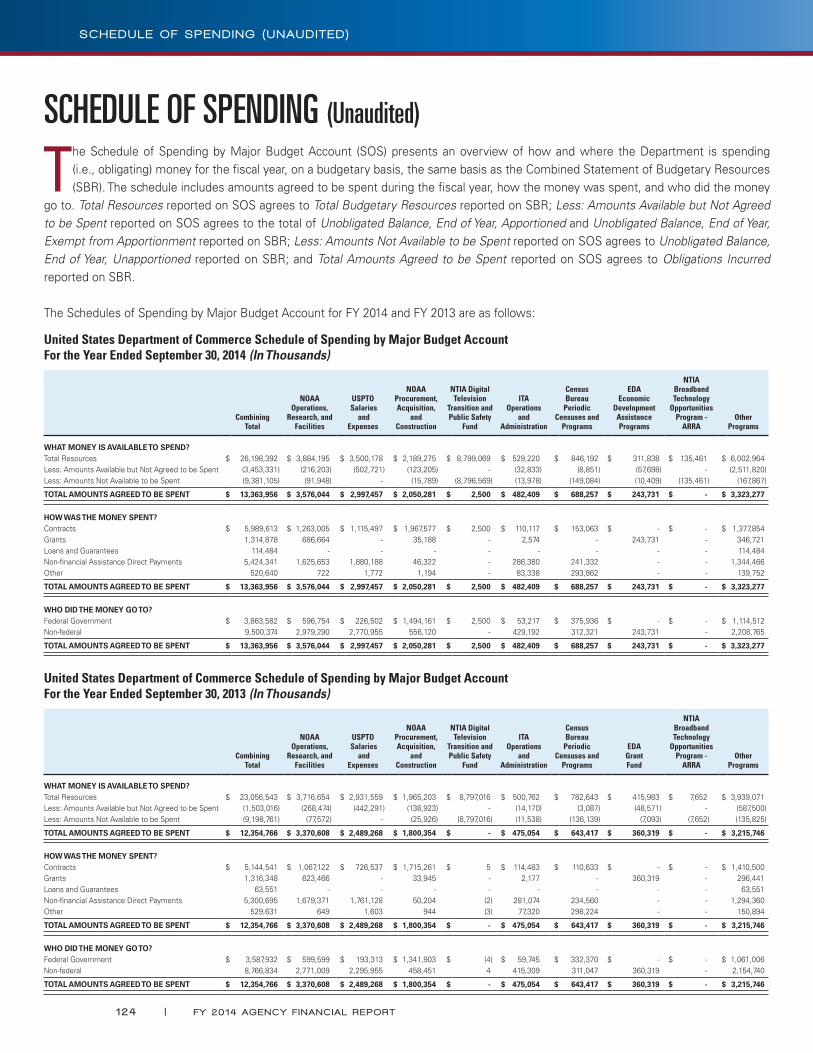
SCHEDULE OF SPENDING (Unaudited)
The Schedule of Spending by Major Budget Account (SOS) presents an overview of how and where the Department is spending (i.e., obligating) money for the fiscal year, on a budgetary basis, the same basis as the Combined Statement of Budgetary Resources (SBR). The schedule includes amounts agreed to be spent during the fiscal year, how the money was spent, and who did the money
go to. Total Resources reported on SOS agrees to Total Budgetary Resources reported on SBR; Less: Amounts Available but Not Agreed to be Spent reported on SOS agrees to the total of Unobligated Balance, End of Year, Apportioned and Unobligated Balance, End of Year, Exempt from Apportionment reported on SBR; Less: Amounts Not Available to be Spent reported on SOS agrees to Unobligated Balance, End of Year, Unapportioned reported on SBR; and Total Amounts Agreed to be Spent reported on SOS agrees to Obligations Incurred reported on SBR.
The Schedules of Spending by Major Budget Account for FY 2014 and FY 2013 are as follows:
United States Department of Commerce Schedule of Spending by Major Budget Account For the Year Ended September 30, 2014 (In Thousands)
Combining Total
NOAAOperations,
Research, andFacilities
USPTO Salaries
andExpenses
NOAAProcurement,Acquisition,
and Construction
NTIA Digital Television
Transition and Public Safety
Fund
ITAOperations
andAdministration
Census Bureau
Periodic Censuses and
Programs
EDA Economic
Development Assistance Programs
NTIA Broadband Technology
Opportunities Program -
ARRAOther
Programs
WHAT MONEY IS AVAILABLE TO SPEND?Total Resources $ 26,198,392 $ 3,884,195 $ 3,500,178 $ 2,189,275 $ 8,799,069 $ 529,220 $ 846,192 $ 311,838 $ 135,461 $ 6,002,964Less: Amounts Available but Not Agreed to be Spent (3,453,331) (216,203) (502,721) (123,205) - (32,833) (8,851) (57,698) - (2,511,820)Less: Amounts Not Available to be Spent (9,381,105) (91,948) - (15,789) (8,796,569) (13,978) (149,084) (10,409) (135,461) (167,867)
TOTAL AMOUNTS AGREED TO BE SPENT $ 13,363,956 $ 3,576,044 $ 2,997,457 $ 2,050,281 $ 2,500 $ 482,409 $ 688,257 $ 243,731 $ - $ 3,323,277
HOW WAS THE MONEY SPENT?Contracts $ 5,989,613 $ 1,263,005 $ 1,115,497 $ 1,967,577 $ 2,500 $ 110,117 $ 153,063 $ - $ - $ 1,377,854Grants 1,314,878 686,664 - 35,188 - 2,574 - 243,731 - 346,721Loans and Guarantees 114,484 - - - - - - - - 114,484Non-financial Assistance Direct Payments 5,424,341 1,625,653 1,880,188 46,322 - 286,380 241,332 - - 1,344,466Other 520,640 722 1,772 1,194 - 83,338 293,862 - - 139,752
TOTAL AMOUNTS AGREED TO BE SPENT $ 13,363,956 $ 3,576,044 $ 2,997,457 $ 2,050,281 $ 2,500 $ 482,409 $ 688,257 $ 243,731 $ - $ 3,323,277
WHO DID THE MONEY GO TO?Federal Government $ 3,863,582 $ 596,754 $ 226,502 $ 1,494,161 $ 2,500 $ 53,217 $ 375,936 $ - $ - $ 1,114,512Non-federal 9,500,374 2,979,290 2,770,955 556,120 - 429,192 312,321 243,731 - 2,208,765
TOTAL AMOUNTS AGREED TO BE SPENT $ 13,363,956 $ 3,576,044 $ 2,997,457 $ 2,050,281 $ 2,500 $ 482,409 $ 688,257 $ 243,731 $ - $ 3,323,277
United States Department of Commerce Schedule of Spending by Major Budget Account For the Year Ended September 30, 2013 (In Thousands)
Combining Total
NOAAOperations,
Research, andFacilities
USPTO Salaries
andExpenses
NOAAProcurement,Acquisition,
and Construction
NTIA Digital Television
Transition and Public Safety
Fund
ITAOperations
andAdministration
Census Bureau
Periodic Censuses and
Programs
EDAGrantFund
NTIA Broadband Technology
Opportunities Program -
ARRAOther
Programs
WHAT MONEY IS AVAILABLE TO SPEND?Total Resources $ 23,056,543 $ 3,716,654 $ 2,931,559 $ 1,965,203 $ 8,797,016 $ 500,762 $ 782,643 $ 415,983 $ 7,652 $ 3,939,071Less: Amounts Available but Not Agreed to be Spent (1,503,016) (268,474) (442,291) (138,923) - (14,170) (3,087) (48,571) - (587,500)Less: Amounts Not Available to be Spent (9,198,761) (77,572) - (25,926) (8,797,016) (11,538) (136,139) (7,093) (7,652) (135,825)
TOTAL AMOUNTS AGREED TO BE SPENT $ 12,354,766 $ 3,370,608 $ 2,489,268 $ 1,800,354 $ - $ 475,054 $ 643,417 $ 360,319 $ - $ 3,215,746
HOW WAS THE MONEY SPENT?Contracts $ 5,144,541 $ 1,067,122 $ 726,537 $ 1,715,261 $ 5 $ 114,483 $ 110,633 $ - $ - $ 1,410,500Grants 1,316,348 623,466 - 33,945 - 2,177 - 360,319 - 296,441Loans and Guarantees 63,551 - - - - - - - - 63,551Non-financial Assistance Direct Payments 5,300,695 1,679,371 1,761,128 50,204 (2) 281,074 234,560 - - 1,294,360Other 529,631 649 1,603 944 (3) 77,320 298,224 - - 150,894
TOTAL AMOUNTS AGREED TO BE SPENT $ 12,354,766 $ 3,370,608 $ 2,489,268 $ 1,800,354 $ - $ 475,054 $ 643,417 $ 360,319 $ - $ 3,215,746
WHO DID THE MONEY GO TO?Federal Government $ 3,587,932 $ 599,599 $ 193,313 $ 1,341,903 $ (4) $ 59,745 $ 332,370 $ - $ - $ 1,061,006Non-federal 8,766,834 2,771,009 2,295,955 458,451 4 415,309 311,047 360,319 - 2,154,740
TOTAL AMOUNTS AGREED TO BE SPENT $ 12,354,766 $ 3,370,608 $ 2,489,268 $ 1,800,354 $ - $ 475,054 $ 643,417 $ 360,319 $ - $ 3,215,746
1 24 | FY 20 14 AGENCY F I NANC IAL REPORT
SCHEDULE OF SPEND ING (UNAUD I TED )
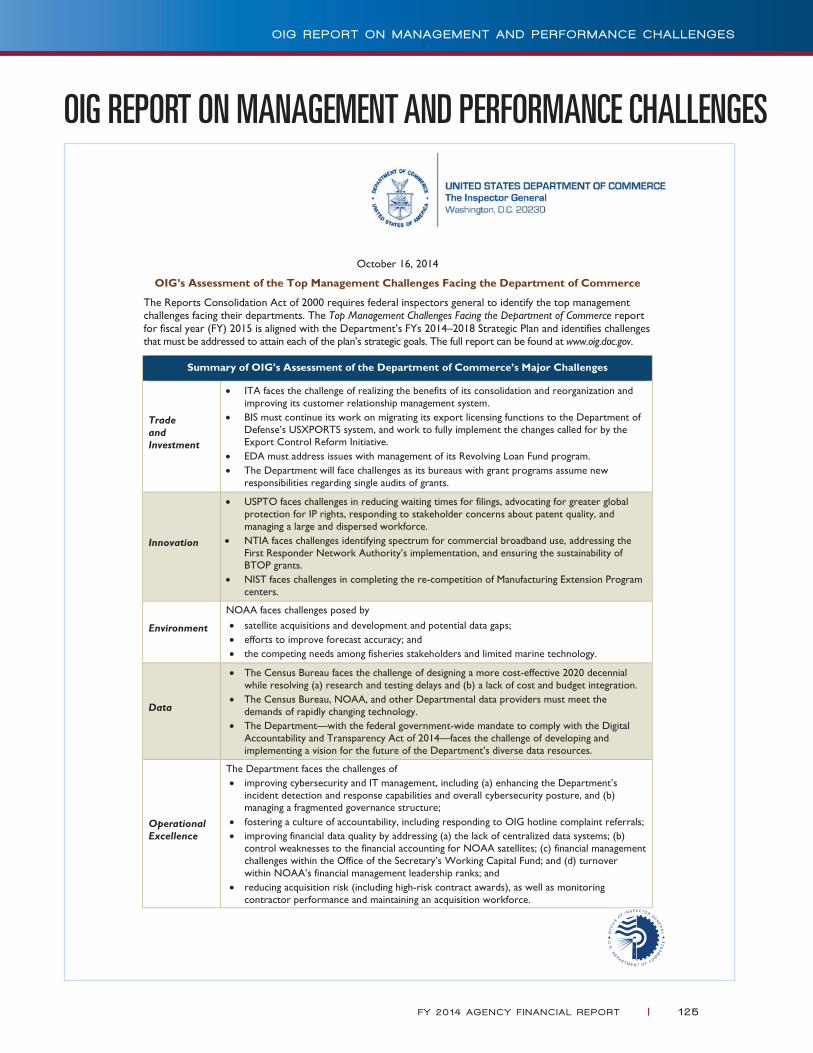
October 16, 2014
OIG’s Assessment of the Top Management Challenges Facing the Department of Commerce
The Reports Consolidation Act of 2000 requires federal inspectors general to identify the top management challenges facing their departments. The Top Management Challenges Facing the Department of Commerce report for fiscal year (FY) 2015 is aligned with the Department’s FYs 2014–2018 Strategic Plan and identifies challenges that must be addressed to attain each of the plan’s strategic goals. The full report can be found at www.oig.doc.gov.
Summary of OIG’s Assessment of the Department of Commerce’s Major Challenges
Trade and Investment
• ITA faces the challenge of realizing the benefits of its consolidation and reorganization and improving its customer relationship management system.
• BIS must continue its work on migrating its export licensing functions to the Department of Defense’s USXPORTS system, and work to fully implement the changes called for by the Export Control Reform Initiative.
• EDA must address issues with management of its Revolving Loan Fund program. • The Department will face challenges as its bureaus with grant programs assume new
responsibilities regarding single audits of grants.
Innovation
• USPTO faces challenges in reducing waiting times for filings, advocating for greater global protection for IP rights, responding to stakeholder concerns about patent quality, and managing a large and dispersed workforce.
• NTIA faces challenges identifying spectrum for commercial broadband use, addressing the First Responder Network Authority’s implementation, and ensuring the sustainability of BTOP grants.
• NIST faces challenges in completing the re-competition of Manufacturing Extension Program centers.
Environment
NOAA faces challenges posed by • satellite acquisitions and development and potential data gaps; • efforts to improve forecast accuracy; and • the competing needs among fisheries stakeholders and limited marine technology.
Data
• The Census Bureau faces the challenge of designing a more cost-effective 2020 decennial while resolving (a) research and testing delays and (b) a lack of cost and budget integration.
• The Census Bureau, NOAA, and other Departmental data providers must meet the demands of rapidly changing technology.
• The Department—with the federal government-wide mandate to comply with the Digital Accountability and Transparency Act of 2014—faces the challenge of developing and implementing a vision for the future of the Department’s diverse data resources.
Operational Excellence
The Department faces the challenges of • improving cybersecurity and IT management, including (a) enhancing the Department’s
incident detection and response capabilities and overall cybersecurity posture, and (b) managing a fragmented governance structure;
• fostering a culture of accountability, including responding to OIG hotline complaint referrals; • improving financial data quality by addressing (a) the lack of centralized data systems; (b)
control weaknesses to the financial accounting for NOAA satellites; (c) financial management challenges within the Office of the Secretary’s Working Capital Fund; and (d) turnover within NOAA’s financial management leadership ranks; and
• reducing acquisition risk (including high-risk contract awards), as well as monitoring contractor performance and maintaining an acquisition workforce.
OIG REPORT ON MANAGEMENT AND PERFORMANCE CHALLENGES
FY 20 14 AGENCY F I NANC IAL REPORT | 1 25
O IG REPORT ON MANAGEMENT AND PERFORMANCE CHALLENGES

1 26 | FY 20 14 AGENCY F I NANC IAL REPORT
O IG REPORT ON MANAGEMENT AND PERFORMANCE CHALLENGES
October 27, 2014 MEMORANDUM FOR: Todd J. Zinser Inspector General FROM: Penny Pritzker Secretary of Commerce SUBJECT: OIG Report “Top Management Challenges Facing the Department of Commerce” in FY 2015 Thank you for the Office of the Inspector General’s work in assessing the major management and performance challenges facing the Department as we begin the new fiscal year. We appreciate OIG’s audit and investigative work throughout the year. The alignment of challenges to the Department’s strategic plan will be particularly valuable to us in driving progress within our five priority areas. The Department’s bureaus continue to provide excellent service working with American businesses, communities, and private citizens to spur innovation; promote trade and investment; foster use of data; and provide critical environmental information, products, and services. OIG's work will help us do this in the most effective and efficient way possible. We are committed to focusing our resources on the issues related to these challenges as we work toward implementing our strategic plan in FY 2015.
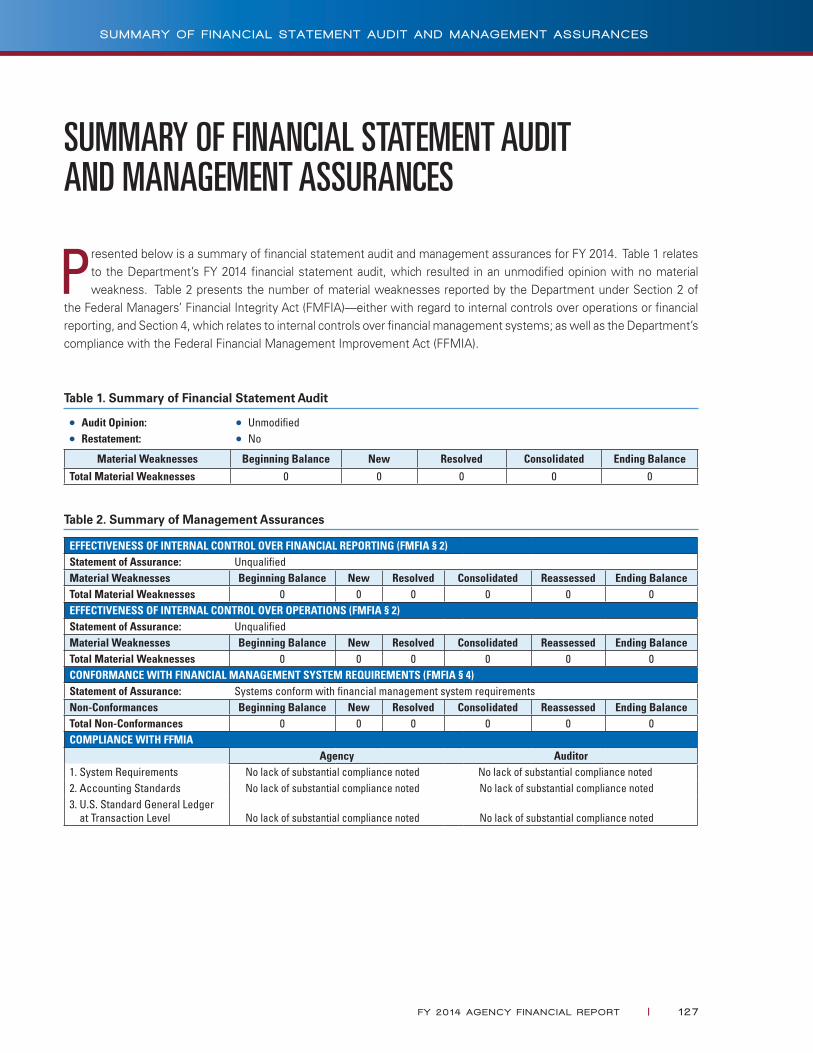
SUMMARY OF FINANCIAL STATEMENT AUDIT AND MANAGEMENT ASSURANCES
Presented below is a summary of financial statement audit and management assurances for FY 2014. Table 1 relates to the Department’s FY 2014 financial statement audit, which resulted in an unmodified opinion with no material weakness. Table 2 presents the number of material weaknesses reported by the Department under Section 2 of
the Federal Managers’ Financial Integrity Act (FMFIA)—either with regard to internal controls over operations or financial reporting, and Section 4, which relates to internal controls over financial management systems; as well as the Department’s compliance with the Federal Financial Management Improvement Act (FFMIA).
Table 1. Summary of Financial Statement Audit
●● Audit Opinion: ●● Unmodified●● Restatement: ●● No
Material Weaknesses Beginning Balance New Resolved Consolidated Ending Balance
Total Material Weaknesses 0 0 0 0 0
Table 2. Summary of Management Assurances
EFFECTIVENESS OF INTERNAL CONTROL OVER FINANCIAL REPORTING (FMFIA § 2)Statement of Assurance: UnqualifiedMaterial Weaknesses Beginning Balance New Resolved Consolidated Reassessed Ending BalanceTotal Material Weaknesses 0 0 0 0 0 0EFFECTIVENESS OF INTERNAL CONTROL OVER OPERATIONS (FMFIA § 2)Statement of Assurance: UnqualifiedMaterial Weaknesses Beginning Balance New Resolved Consolidated Reassessed Ending BalanceTotal Material Weaknesses 0 0 0 0 0 0CONFORMANCE WITH FINANCIAL MANAGEMENT SYSTEM REQUIREMENTS (FMFIA § 4)Statement of Assurance: Systems conform with financial management system requirementsNon-Conformances Beginning Balance New Resolved Consolidated Reassessed Ending BalanceTotal Non-Conformances 0 0 0 0 0 0COMPLIANCE WITH FFMIA
Agency Auditor1. System Requirements No lack of substantial compliance noted No lack of substantial compliance noted2. Accounting Standards No lack of substantial compliance noted No lack of substantial compliance noted3. U.S. Standard General Ledger at Transaction Level
No lack of substantial compliance noted
No lack of substantial compliance noted
FY 20 14 AGENCY F I NANC IAL REPORT | 1 27
SUMMARY OF F I NANC IAL STATEMENT AUD I T AND MANAGEMENT ASSURANCES
I PIA of 2002, as amended by the Improper Payments Elimination and Recovery Act (IPERA) of 2010 and the Improper Payments Elimination and Recovery Improvement Act of 2012, requires agencies to periodically review all programs and activities and identify those that may be susceptible to significant improper payments, take multiple actions when
programs and activities are identified as susceptible to significant improper payments, and annually report information on their improper payments monitoring and minimization efforts. Office of Management and Budget (OMB) Circular A-123, Management’s Responsibility for Internal Control, Appendix C, Requirements for Effective Measurement and Remediation of Improper Payments, provides guidance to agencies to comply with IPIA, as amended, and for agency improper payments efforts. The Department has not identified any programs or activities susceptible to significant improper payments nor any significant problems with improper payments.
On January 29, 2013, the President signed into law the Disaster Relief Appropriations Act (Act), which provides a total of $50.5 billion in aid for Hurricane Sandy disaster victims and their communities. The National Oceanic and Atmospheric Administration (NOAA) received $326 million of funds under the Act for Hurricane Sandy recovery and other disaster-related activities. Pursuant to OMB Memorandum M-13-07, Accountability for Funds Provided by the Disaster Relief Appropriations Act (March 12, 2013), the Department in March 2013 submitted its final plan for accountability, internal controls, and other requirements for funds provided to NOAA by the Act. The Act sets forth that programs and activities receiving funds under the Act shall be deemed to be susceptible to significant improper payments for the purposes of requirements under IPIA of 2002, as amended, and are required to calculate and report an improper payments estimate for the FY 2014 reporting period, to the extent possible. The Department submitted to OMB in June 2014 a sampling methodology plan for FY 2013 disbursements made under the Act by NOAA. In September 2014, testing of FY 2013 disbursements was performed by an independent contractor. See Section II, Statistical Sampling, for a brief discussion of the statistical sampling process performed, and see Section IV, Improper Payments Reporting, for the statistical sampling results of the FY 2013 disbursements testing.
The Department recognizes the importance of maintaining adequate internal controls to ensure proper payments, and the Department’s commitment to continuous improvement in the overall disbursement management process remains very strong. Each of the Department’s payment offices has implemented policies and procedures to detect and prevent improper payments. For FY 2015 and beyond, the Department will continue its efforts to ensure the integrity of its disbursements.
I. Risk Assessment. Briefly describe the risk assessment(s) performed (including the risk factors examined, if appropriate) subsequent to completing a full program inventory. List the risk-susceptible programs (i.e., programs that have a significant risk of improper payments based on statutory thresholds) identified by the agency risk assessments or required by OMB to be included (OMB may determine, on a case-by-case basis, that certain programs that do not meet the thresholds requirements may still be subject to the annual reporting requirements). Any programs that had been previously identified in the former Section 57 of OMB Circular A-11, Preparation, Submission, and Execution of the Budget, shall continue to report improper payment estimates, unless OMB has granted relief from reporting requirements (as discussed in OMB Circular A-123, Appendix C). Highlight any changes to the risk assessment methodology or results that occurred since the last report.
The Department annually conducts an assessment of the effectiveness of internal control over financial reporting, in compliance with OMB Circular A-123. Furthermore, every three years, the assessment includes a review of internal controls
IMPROPER PAYMENTS INFORMATION ACT (IPIA) OF 2002, AS AMENDED, REPORTING DETAILS
1 28 | FY 20 14 AGENCY F I NANC IAL REPORT
I MPROPER PAYMENTS I N FORMAT ION ACT ( I P I A ) O F 2002 , AS AMENDED , REPORT I NG DETA I LS

over disbursement processes, including Department-wide sample testing of disbursements for improper payments and for appropriate internal control attributes. The most recent review performed indicated that internal controls over disbursement processes were sound.
Each of the Department’s bureaus/reporting entities periodically completes or updates, over a one to three-year period (depending on the size of the entity), improper payments risk assessments covering all of its programs/activities as required by OMB Circular A-123, Appendix C. These improper payments risk assessments of the entity’s programs/activities also include assessments of the control, procurement, and grants management environments. The improper payments risk assessments performed thus far revealed no program or activity susceptible to significant improper payments.
The results of Departmental assessments revealed no risk-susceptible programs/activities, and demonstrated that, overall, the Department has strong internal controls over disbursement processes and the risk of significant improper payments is low.
II. Statistical Sampling. Any agency that has programs or activities that are susceptible to significant improper payments shall briefly describe the statistical sampling process conducted to estimate the improper payment rate for each program identified with a significant risk of improper payments. Please highlight any changes to the statistical sampling process that have occurred since the last report.
As previously discussed, an independent contractor performed statistical sampling of FY 2013 NOAA disbursements of funds received under the Disaster Relief Appropriations Act, in order to yield a statistically valid improper payments estimate, as required by OMB Circular A-123, Appendix C. The independent contractor obtained the population of FY 2013 disbursements, excluding disbursements within the federal government, and determined a pilot (that later could be expanded if necessary) single-stage stratified random sample using the absolute value of the disbursement amount to define the stratum dollar ranges. Stratified samples are highly efficient designs that allow required confidence and precision levels to be reached with smaller samples when compared to simple random sampling. A single certainty or take-all stratum was defined for disbursement amounts that are large relative to the rest of the population, to help ensure that large amounts would be covered in the sample review as well as help improve the precision of the statistical estimates at the time of estimation. The independent contractor tested each sample item selected for improper payments—see Section IV, Improper Payments Reporting, for a discussion of the statistical sampling results of the FY 2013 disbursements testing—and determined that the pilot sample did not need to be expanded.
III. Corrective Actions. Any agency that has programs or activities that are susceptible to significant improper payments shall describe the corrective action plans for:
a. Reducing the estimated improper payment rate and amount for each type of root cause identified. Agencies shall report root causes information (including error rate and error amount) based on the following three categories: Administrative and Documentation errors; Authentication and Medical Necessity errors; and Verification errors. This discussion must include the corrective action(s), planned or taken, most likely to significantly reduce future improper payments due to each type of error an agency identifies, the planned or actual completion date of these actions, and the results of the actions taken to address these root causes. If efforts are ongoing, it is appropriate to include that information in this section, and to highlight current efforts, including key milestones. Agencies may also report root cause information based on additional categories, or sub-categories of the three categories listed above, if available.
FY 20 14 AGENCY F I NANC IAL REPORT | 1 29
I MPROPER PAYMENTS I N FORMAT ION ACT ( I P I A ) O F 2002 , AS AMENDED , REPORT I NG DETA I LS
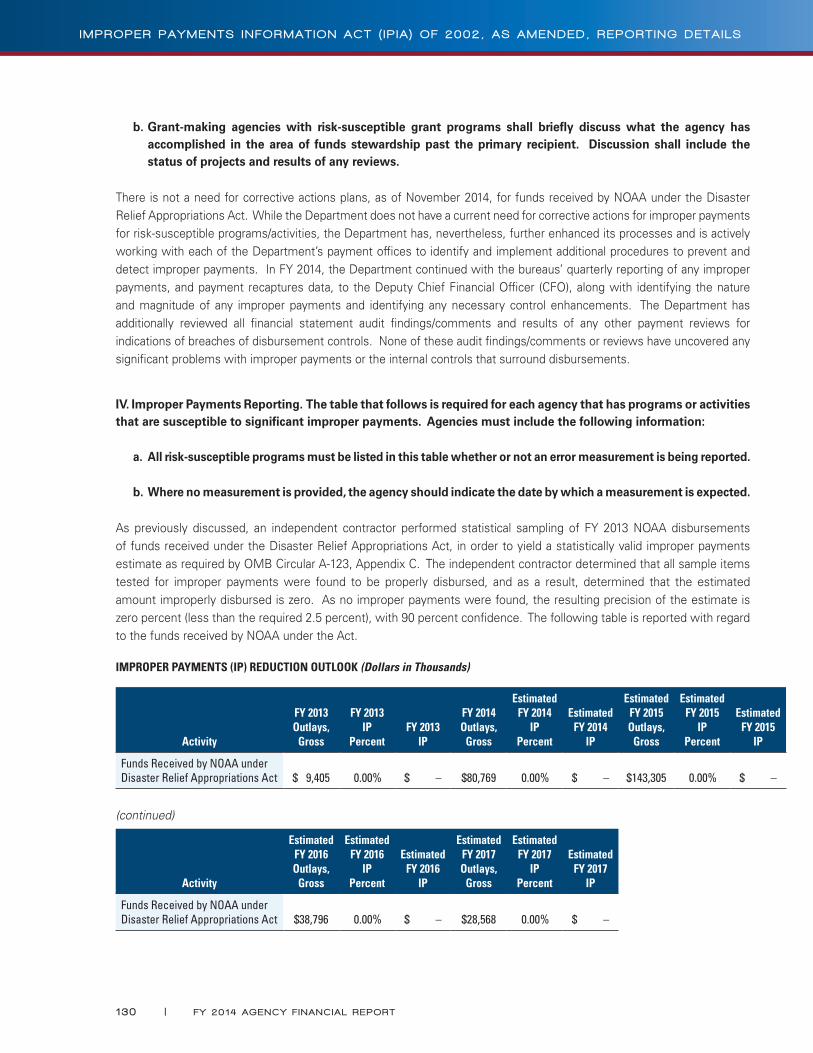
b. Grant-making agencies with risk-susceptible grant programs shall briefly discuss what the agency has accomplished in the area of funds stewardship past the primary recipient. Discussion shall include the status of projects and results of any reviews.
There is not a need for corrective actions plans, as of November 2014, for funds received by NOAA under the Disaster Relief Appropriations Act. While the Department does not have a current need for corrective actions for improper payments for risk-susceptible programs/activities, the Department has, nevertheless, further enhanced its processes and is actively working with each of the Department’s payment offices to identify and implement additional procedures to prevent and detect improper payments. In FY 2014, the Department continued with the bureaus’ quarterly reporting of any improper payments, and payment recaptures data, to the Deputy Chief Financial Officer (CFO), along with identifying the nature and magnitude of any improper payments and identifying any necessary control enhancements. The Department has additionally reviewed all financial statement audit findings/comments and results of any other payment reviews for indications of breaches of disbursement controls. None of these audit findings/comments or reviews have uncovered any significant problems with improper payments or the internal controls that surround disbursements.
IV. Improper Payments Reporting. The table that follows is required for each agency that has programs or activities that are susceptible to significant improper payments. Agencies must include the following information:
a. All risk-susceptible programs must be listed in this table whether or not an error measurement is being reported.
b. Where no measurement is provided, the agency should indicate the date by which a measurement is expected.
As previously discussed, an independent contractor performed statistical sampling of FY 2013 NOAA disbursements of funds received under the Disaster Relief Appropriations Act, in order to yield a statistically valid improper payments estimate as required by OMB Circular A-123, Appendix C. The independent contractor determined that all sample items tested for improper payments were found to be properly disbursed, and as a result, determined that the estimated amount improperly disbursed is zero. As no improper payments were found, the resulting precision of the estimate is zero percent (less than the required 2.5 percent), with 90 percent confidence. The following table is reported with regard to the funds received by NOAA under the Act.
IMPROPER PAYMENTS (IP) REDUCTION OUTLOOK (Dollars in Thousands)
Activity
FY 2013 Outlays,
Gross
FY 2013 IP
PercentFY 2013
IP
FY 2014Outlays,
Gross
Estimated FY 2014
IPPercent
EstimatedFY 2014
IP
EstimatedFY 2015Outlays,
Gross
EstimatedFY 2015
IPPercent
EstimatedFY 2015
IP
Funds Received by NOAA under Disaster Relief Appropriations Act $ 9,405 0.00% $ – $80,769 0.00% $ – $143,305 0.00% $ –
(continued)
Activity
EstimatedFY 2016Outlays,
Gross
EstimatedFY 2016
IPPercent
EstimatedFY 2016
IP
EstimatedFY 2017Outlays,
Gross
EstimatedFY 2017
IPPercent
EstimatedFY 2017
IP
Funds Received by NOAA under Disaster Relief Appropriations Act $38,796 0.00% $ – $28,568 0.00% $ –
1 30 | FY 20 14 AGENCY F I NANC IAL REPORT
I MPROPER PAYMENTS I N FORMAT ION ACT ( I P I A ) O F 2002 , AS AMENDED , REPORT I NG DETA I LS
V. Recaptures of Improper Payments Reporting.
a. An agency shall discuss payment recapture audit efforts, if applicable. The discussion should describe: the agency’s payment recapture audit program; the actions and methods used by the agency to recoup overpayments; a justification of any overpayments that have been determined not to be collectable; and any conditions giving rise to improper payments and how those conditions are being resolved (e.g., the business process changes and internal controls instituted and/or strengthened to prevent further occurrences). If the agency has excluded any programs or activities from review under its payment recapture auditing program (including any programs or activities where the agency has determined a payment recapture audit program is not cost-effective), the agency should list those programs and activities excluded from the review, as well as the justification for doing so (i.e., a discussion of the analysis conducted to determine that a payment recapture audit program would not be cost-effective). Include in your discussion the dollar amount of cumulative payment recaptures collected beginning with FY 2004.
In conformity with IPIA, as amended, the Department has been performing, since 2005, annual payment recapture audits of closed contracts/obligations for many of the Department’s bureaus/reporting entities on a rotational basis. In recent years, these payment recapture audits have been performed by an independent contractor; however, in the past, these payment recapture audits have also been conducted by the Department’s Office of Financial Management. Effective 2012, the scope of payment recapture audits of contracts/obligations was expanded to additionally include contracts/obligations for which the period of performance ended and last payment was made, but for which the closeout process has not yet been completed. Annual payment recapture auditing is additionally performed by an independent contractor, effective 2011, for Department-wide grants and other cooperative agreements (i.e., financial assistance).
Per OMB Circular A-123, Appendix C, intragovernmental transactions are not required to be reviewed. An Octoberber 2014 update to OMB Circular A-123, Appendix C, expanded the definition of improper payments to include payments to employees. Future payment recapture audits, accordingly, will include payments to employees as appropriate. With regard to loan disbursements, NOAA is currently the only bureau with loan disbursements. As part of NOAA’s internally-conducted reviews and testing processes, NOAA loan disbursements are significantly tested every three years for both internal controls and improper payments, and the disbursement testing for improper payments is considered to be essentially equivalent to a payment recapture audit. Regarding the NOAA Corps Retirement System and the NOAA Corps Health Benefits benefit programs, these programs are cross-serviced for disbursements by the Department of Defense, and therefore are not subject to payment recapture auditing by the Department.
For payment recapture audits, the auditor analyzes the reasons why any payment errors occurred, and develops, presents, and documents any recommendations for cost-effective controls to prevent improper payments in the future and/or to enhance the applicable bureau processes.
Payment recapture audits of contracts/obligations are in process as of November 2014 by an independent contractor for Departmental Management (DM)/Salaries and Expenses (S&E), DM/Working Capital Fund, the Economic Development Administration (EDA/S&E), the Economics and Statistics Administration/Bureau of Economic Analysis (ESA/BEA), and the International Trade Administration (ITA). Contracts/obligations greater than $100 thousand which were closed out, or for which the period of performance ended and last payment was made but for which the closeout process has not yet been completed after April 1, 2013 and through March 31, 2014, are being reviewed. Intragovernmental transactions and payments to employees are excluded from review in conformity with the version of OMB Circular A-123, Appendix C in place at the commencement of these payment recapture audits. Travel payments, bankcards/purchase cards, government bills of lading, and gifts and bequests are also excluded from review. The Department determined that, for these categories of transactions, the Department’s costs for the payment recapture audit activities would likely exceed the benefits of payment recapture audits. As part of the payment
FY 20 14 AGENCY F I NANC IAL REPORT | 1 3 1
I MPROPER PAYMENTS I N FORMAT ION ACT ( I P I A ) O F 2002 , AS AMENDED , REPORT I NG DETA I LS
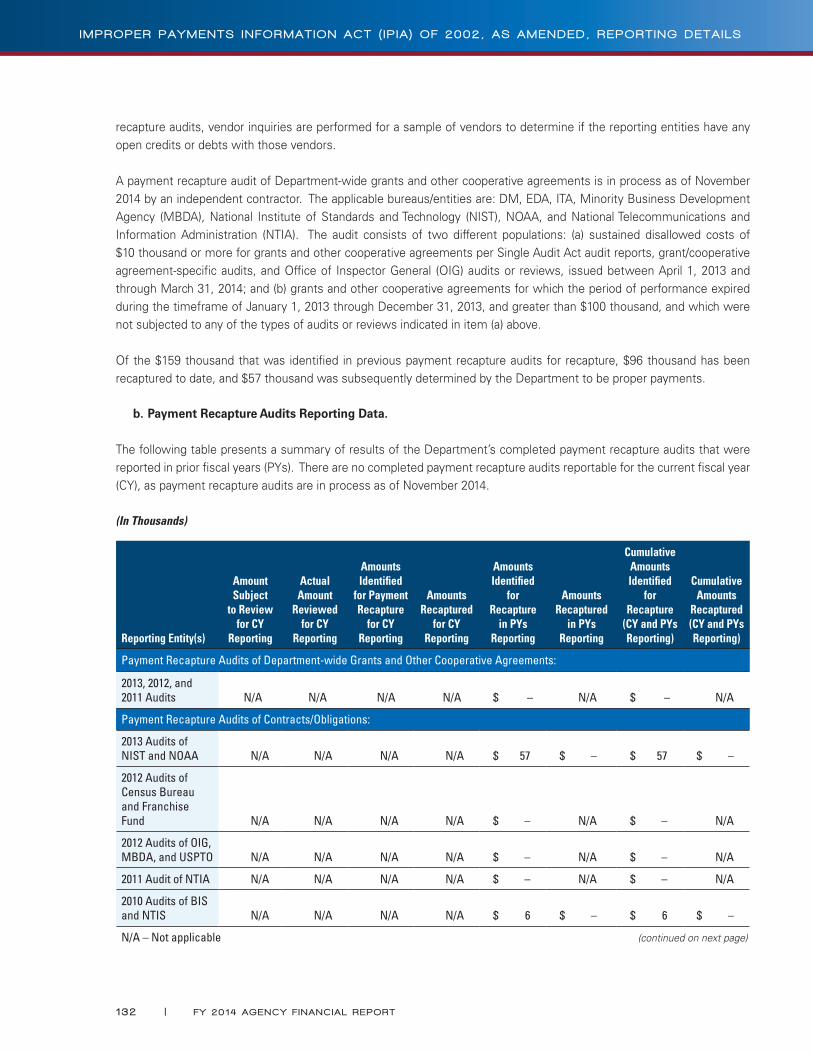
recapture audits, vendor inquiries are performed for a sample of vendors to determine if the reporting entities have any open credits or debts with those vendors.
A payment recapture audit of Department-wide grants and other cooperative agreements is in process as of November 2014 by an independent contractor. The applicable bureaus/entities are: DM, EDA, ITA, Minority Business Development Agency (MBDA), National Institute of Standards and Technology (NIST), NOAA, and National Telecommunications and Information Administration (NTIA). The audit consists of two different populations: (a) sustained disallowed costs of $10 thousand or more for grants and other cooperative agreements per Single Audit Act audit reports, grant/cooperative agreement-specific audits, and Office of Inspector General (OIG) audits or reviews, issued between April 1, 2013 and through March 31, 2014; and (b) grants and other cooperative agreements for which the period of performance expired during the timeframe of January 1, 2013 through December 31, 2013, and greater than $100 thousand, and which were not subjected to any of the types of audits or reviews indicated in item (a) above.
Of the $159 thousand that was identified in previous payment recapture audits for recapture, $96 thousand has been recaptured to date, and $57 thousand was subsequently determined by the Department to be proper payments.
b. Payment Recapture Audits Reporting Data.
The following table presents a summary of results of the Department’s completed payment recapture audits that were reported in prior fiscal years (PYs). There are no completed payment recapture audits reportable for the current fiscal year (CY), as payment recapture audits are in process as of November 2014.
(In Thousands)
Reporting Entity(s)
Amount Subject
to Review for CY
Reporting
Actual Amount
Reviewed for CY
Reporting
Amounts Identified
for Payment Recapture
for CY Reporting
Amounts Recaptured
for CY Reporting
Amounts Identified
for Recapture
in PYs Reporting
Amounts Recaptured
in PYs Reporting
Cumulative Amounts Identified
for Recapture
(CY and PYs Reporting)
Cumulative Amounts
Recaptured (CY and PYs Reporting)
Payment Recapture Audits of Department-wide Grants and Other Cooperative Agreements:
2013, 2012, and 2011 Audits N/A N/A N/A N/A $ – N/A $ – N/A
Payment Recapture Audits of Contracts/Obligations:
2013 Audits of NIST and NOAA N/A N/A N/A N/A $ 57 $ – $ 57 $ –
2012 Audits of Census Bureau and Franchise Fund N/A N/A N/A N/A $ – N/A $ – N/A
2012 Audits of OIG, MBDA, and USPTO N/A N/A N/A N/A $ – N/A $ – N/A
2011 Audit of NTIA N/A N/A N/A N/A $ – N/A $ – N/A
2010 Audits of BIS and NTIS N/A N/A N/A N/A $ 6 $ – $ 6 $ –
N/A – Not applicable (continued on next page)
1 32 | FY 20 14 AGENCY F I NANC IAL REPORT
I MPROPER PAYMENTS I N FORMAT ION ACT ( I P I A ) O F 2002 , AS AMENDED , REPORT I NG DETA I LS
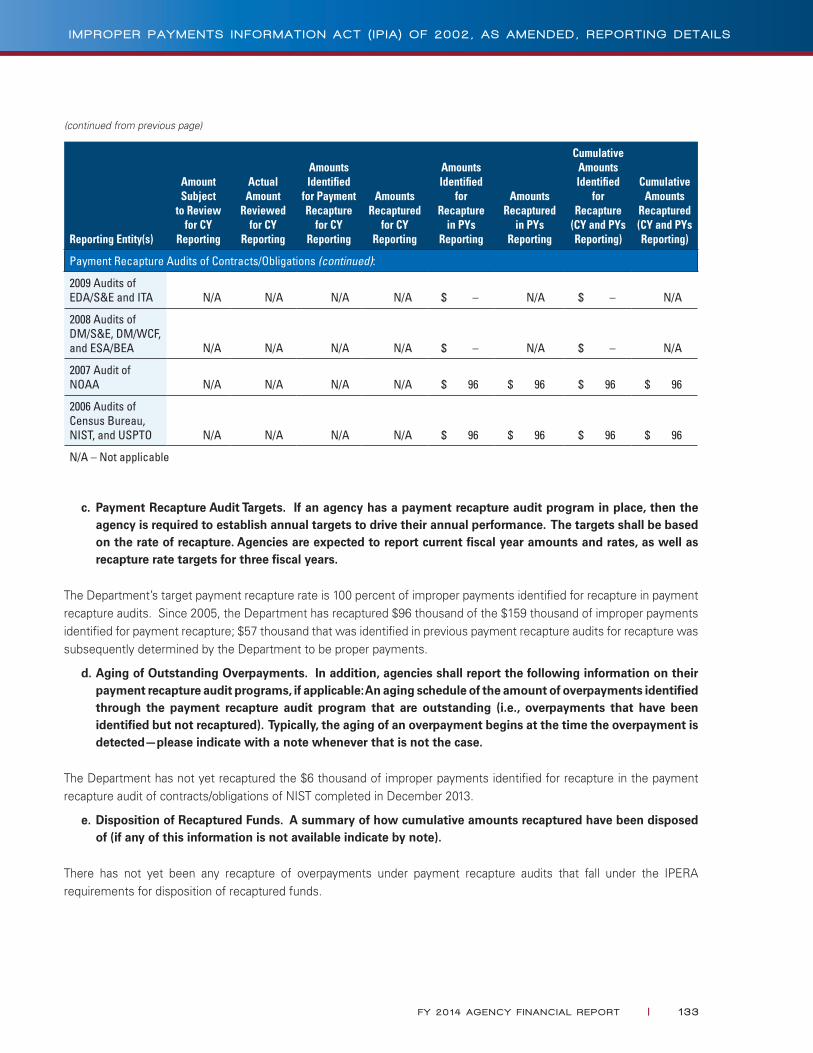
(continued from previous page)
Reporting Entity(s)
Amount Subject
to Review for CY
Reporting
Actual Amount
Reviewed for CY
Reporting
Amounts Identified
for Payment Recapture
for CY Reporting
Amounts Recaptured
for CY Reporting
Amounts Identified
for Recapture
in PYs Reporting
Amounts Recaptured
in PYs Reporting
Cumulative Amounts Identified
for Recapture
(CY and PYs Reporting)
Cumulative Amounts
Recaptured (CY and PYs Reporting)
Payment Recapture Audits of Contracts/Obligations (continued):
2009 Audits of EDA/S&E and ITA N/A N/A N/A N/A $ – N/A $ – N/A
2008 Audits of DM/S&E, DM/WCF, and ESA/BEA N/A N/A N/A N/A $ – N/A $ – N/A
2007 Audit of NOAA N/A N/A N/A N/A $ 96 $ 96 $ 96 $ 96
2006 Audits of Census Bureau, NIST, and USPTO N/A N/A N/A N/A $ 96 $ 96 $ 96 $ 96
N/A – Not applicable
c. Payment Recapture Audit Targets. If an agency has a payment recapture audit program in place, then the agency is required to establish annual targets to drive their annual performance. The targets shall be based on the rate of recapture. Agencies are expected to report current fiscal year amounts and rates, as well as recapture rate targets for three fiscal years.
The Department’s target payment recapture rate is 100 percent of improper payments identified for recapture in payment recapture audits. Since 2005, the Department has recaptured $96 thousand of the $159 thousand of improper payments identified for payment recapture; $57 thousand that was identified in previous payment recapture audits for recapture was subsequently determined by the Department to be proper payments.
d. Aging of Outstanding Overpayments. In addition, agencies shall report the following information on their payment recapture audit programs, if applicable: An aging schedule of the amount of overpayments identified through the payment recapture audit program that are outstanding (i.e., overpayments that have been identified but not recaptured). Typically, the aging of an overpayment begins at the time the overpayment is detected—please indicate with a note whenever that is not the case.
The Department has not yet recaptured the $6 thousand of improper payments identified for recapture in the payment recapture audit of contracts/obligations of NIST completed in December 2013.
e. Disposition of Recaptured Funds. A summary of how cumulative amounts recaptured have been disposed of (if any of this information is not available indicate by note).
There has not yet been any recapture of overpayments under payment recapture audits that fall under the IPERA requirements for disposition of recaptured funds.
FY 20 14 AGENCY F I NANC IAL REPORT | 1 33
I MPROPER PAYMENTS I N FORMAT ION ACT ( I P I A ) O F 2002 , AS AMENDED , REPORT I NG DETA I LS
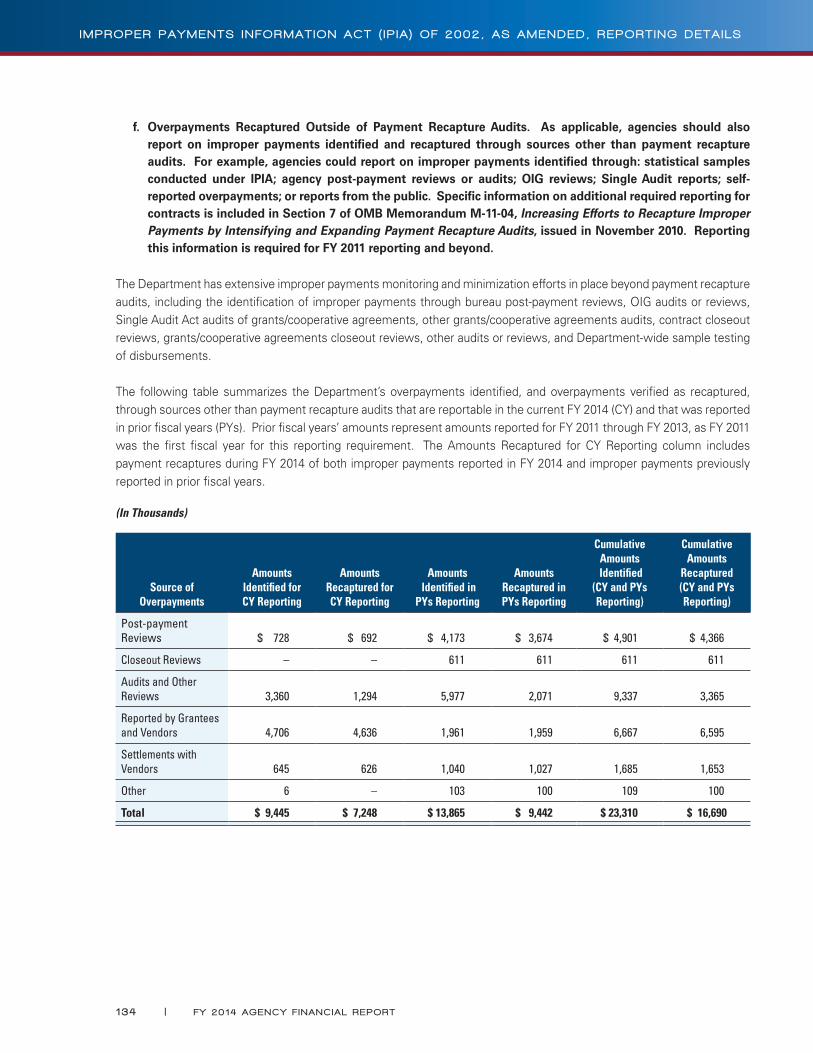
f. Overpayments Recaptured Outside of Payment Recapture Audits. As applicable, agencies should also report on improper payments identified and recaptured through sources other than payment recapture audits. For example, agencies could report on improper payments identified through: statistical samples conducted under IPIA; agency post-payment reviews or audits; OIG reviews; Single Audit reports; self-reported overpayments; or reports from the public. Specific information on additional required reporting for contracts is included in Section 7 of OMB Memorandum M-11-04, Increasing Efforts to Recapture Improper Payments by Intensifying and Expanding Payment Recapture Audits, issued in November 2010. Reporting this information is required for FY 2011 reporting and beyond.
The Department has extensive improper payments monitoring and minimization efforts in place beyond payment recapture audits, including the identification of improper payments through bureau post-payment reviews, OIG audits or reviews, Single Audit Act audits of grants/cooperative agreements, other grants/cooperative agreements audits, contract closeout reviews, grants/cooperative agreements closeout reviews, other audits or reviews, and Department-wide sample testing of disbursements.
The following table summarizes the Department’s overpayments identified, and overpayments verified as recaptured, through sources other than payment recapture audits that are reportable in the current FY 2014 (CY) and that was reported in prior fiscal years (PYs). Prior fiscal years’ amounts represent amounts reported for FY 2011 through FY 2013, as FY 2011 was the first fiscal year for this reporting requirement. The Amounts Recaptured for CY Reporting column includes payment recaptures during FY 2014 of both improper payments reported in FY 2014 and improper payments previously reported in prior fiscal years.
(In Thousands)
Source of Overpayments
Amounts Identified for CY Reporting
Amounts Recaptured for CY Reporting
Amounts Identified in
PYs Reporting
Amounts Recaptured in PYs Reporting
Cumulative Amounts
Identified(CY and PYs Reporting)
Cumulative Amounts
Recaptured(CY and PYs Reporting)
Post-payment Reviews $ 728 $ 692 $ 4,173 $ 3,674 $ 4,901 $ 4,366
Closeout Reviews – – 611 611 611 611
Audits and Other Reviews 3,360 1,294 5,977 2,071 9,337 3,365
Reported by Grantees and Vendors 4,706 4,636 1,961 1,959 6,667 6,595
Settlements with Vendors 645 626 1,040 1,027 1,685 1,653
Other 6 – 103 100 109 100
Total $ 9,445 $ 7,248 $ 13,865 $ 9,442 $ 23,310 $ 16,690
1 34 | FY 20 14 AGENCY F I NANC IAL REPORT
I MPROPER PAYMENTS I N FORMAT ION ACT ( I P I A ) O F 2002 , AS AMENDED , REPORT I NG DETA I LS
VI. Accountability. Any agency that has programs or activities that are susceptible to significant improper payments shall describe the steps the agency has taken and plans to take (including timeline) to ensure that agency managers, accountable officers (including the agency head), programs, and states and localities (where appropriate), are held accountable for reducing and recapturing improper payments. Specifically, they should be held accountable for meeting applicable improper payments reduction targets and establishing and maintaining sufficient internal controls (including an appropriate control environment) that effectively prevents improper payments from being made and promptly detects and recaptures any improper payments that are made.
The Department has not identified any significant problems with improper payments; however, the Department recognizes the importance of maintaining adequate internal controls to ensure proper payments, and its commitment to continuous improvement in disbursement management processes remains very strong. The Department’s CFO has responsibility for establishing policies and procedures for assessing Departmental and program risks of improper payments, taking actions to reduce improper payments, and reporting the results of the actions to Departmental management for oversight and other actions as deemed appropriate. The CFO has designated the Deputy CFO to oversee initiatives related to reducing improper payments within the Department, and to work closely with the bureau CFOs in this area.
In FY 2014, the Department continued its reporting procedures that required quarterly reporting to the Department by its bureaus on any improper payments, identifying the nature and magnitude of any improper payments along with any necessary control enhancements to prevent further occurrences of the types of improper payments identified. The Department’s analysis of the data collected from the bureaus shows that Department-wide improper payments were at or below one-tenth of one percent in FY 2014 and FY 2013. The bureau CFOs are accountable for internal controls over improper payments, and for monitoring and minimizing improper payments.
For FY 2015 and beyond, the Department will continue its efforts to ensure the integrity of its disbursements.
VII. Agency Information Systems and Other Infrastructure.
a. Describe whether the agency has the internal controls, human capital, and information systems and other infrastructure it needs to reduce improper payments to the levels the agency has targeted.
b. If the agency does not have such internal controls, human capital, and information systems and other infrastructure, describe the resources the agency requested in its most recent budget submission to Congress to establish and maintain the necessary internal controls, human capital, and information systems and other infrastructure.
The Department has ensured that internal controls, manual as well as financial systems, relating to payments are in place throughout the Department, and has reviewed all financial statement audit findings/comments and results of any other payment reviews for indications of breaches of disbursement controls. None of these audit findings/comments or reviews have uncovered any significant problems with improper payments or the internal controls that surround disbursements.
VIII. Barriers. Describe any statutory or regulatory barriers which may limit agency corrective actions in reducing improper payments and actions taken by the agency to mitigate the barriers’ effects.
The Department has not identified any significant barriers that limit actions to reduce improper payments.
FY 20 14 AGENCY F I NANC IAL REPORT | 1 35
I MPROPER PAYMENTS I N FORMAT ION ACT ( I P I A ) O F 2002 , AS AMENDED , REPORT I NG DETA I LS
IX. Agency Reduction of Improper Payments with the Do Not Pay Initiative. The Improper Payments Elimination and Recovery Improvement Act of 2012 (IPERIA) requires OMB to submit to Congress an annual report, “which may be included as part of another report submitted to Congress by the Director, regarding the operation of the Do Not Pay Initiative, which shall: (A) include an evaluation of whether the Do Not Pay Initiative has reduced improper payments or improper awards; and (B) provide the frequency of corrections or identification of incorrect information.” To support this requirement, agencies shall provide a brief narrative discussing the agency’s actions attributable to the Do Not Pay Initiative and respective databases, to include an evaluation of whether the Do Not Pay initiative has reduced improper payments or improper awards; identifying the frequency of corrections or identification of incorrect information; and include a table reflecting the dollar amounts and the number of payments reviewed for improper payments in the fiscal year being reported on.
Pursuant to OMB Memorandum M-12-11 dated April 12, 2012, Reducing Improper Payments through the “Do Not Pay List,” the Department in December 2012 submitted a final plan to OMB for its use of the Do Not Pay Portal for pre-payment eligibility reviews. Furthermore, the Department at that time completed evaluations of the use of the Do Not Pay solution for pre-award eligibility reviews for contracts and grants. The evaluations were to determine if the benefits from the portal checking of available databases and/or the Data Analytics Services merit the additional procedures. The Department determined existing pre-award eligibility review processes and databases checked are adequate for preventing improper contract and grant awards. The Department determined, however, that Treasury’s Debt Check database may be a beneficial tool for use in pre-award evaluations of grant applications. Currently, the Department is in the process of implementing the use of the Do Not Pay portal for pre-award checking to Treasury’s Debt Check database for grants applications.
The Department’s payment offices, between January and June 2013, implemented the Department’s OMB-approved plan to perform weekly or daily (Census Bureau) pre-payment eligibility reviews to the following Do Not Pay portal databases for the Department’s domestic, non-classified, non-employee-related, non-intragovernmental disbursements: (a) Social Security Administration’s Death Master File (DMF); (b) the U.S. General Services Administration’s System for Award Management (SAM) Exclusion Records; and (c) SAM Entity Registration Records (excluding Census Bureau).
The pre-payment checking performed by the Department excludes pre-payment eligibility reviews of grantees under Treasury’s Automated Standard Application for Payments (ASAP), as Treasury performs continuous monitoring to the Do Not Pay portal of ASAP grantees. Bureau payment and acquisition offices, as appropriate, follow up on vendors initially matched to the Do Not Pay portal databases checked to, and perform further research as necessary to follow through and resolve the issues identified by the Do Not Pay portal matches. In most cases, the initial matches are subsequently determined by the Department to be false matches. Other Departmental offices are also consulted as appropriate.
Furthermore, effective with March 2013 payments made, the Department’s payment offices receive from Treasury monthly Do Not Pay portal reports listing any match results of payments made to the following databases: (a) DMF; and (b) SAM Exclusion Records. Payment offices research and follow up on matches, as appropriate, and submit to Treasury monthly Adjudication Reports summarizing the results of their efforts.
Since inception of payment offices’ Do Not Pay portal pre-payment eligibility reviews and reviews of Treasury’s post-payment match reports, the Department has not had any significant true matches to DMF and SAM Exclusion Records. While the Department’s use of the Do Not Pay portal since inception has not yet identified or led to the prevention of any significant improper payments, the Department supports the use of the Do Not Pay portal as a sound financial management practice to prevent improper payments.
1 36 | FY 20 14 AGENCY F I NANC IAL REPORT
I MPROPER PAYMENTS I N FORMAT ION ACT ( I P I A ) O F 2002 , AS AMENDED , REPORT I NG DETA I LS
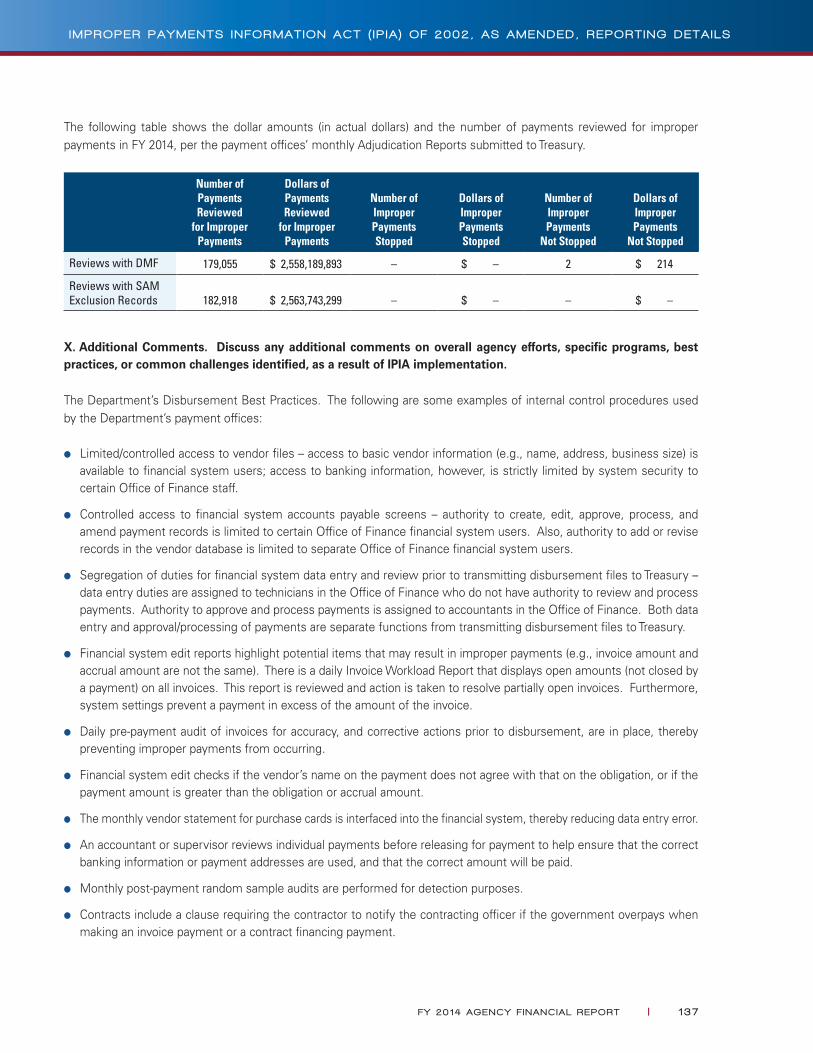
The following table shows the dollar amounts (in actual dollars) and the number of payments reviewed for improper payments in FY 2014, per the payment offices’ monthly Adjudication Reports submitted to Treasury.
Number of Payments Reviewed
for Improper Payments
Dollars of Payments Reviewed
for Improper Payments
Number of Improper Payments Stopped
Dollars of Improper Payments Stopped
Number of Improper Payments
Not Stopped
Dollars of Improper Payments
Not Stopped
Reviews with DMF 179,055 $ 2,558,189,893 – $ – 2 $ 214
Reviews with SAM Exclusion Records 182,918 $ 2,563,743,299 – $ – – $ –
X. Additional Comments. Discuss any additional comments on overall agency efforts, specific programs, best practices, or common challenges identified, as a result of IPIA implementation.
The Department’s Disbursement Best Practices. The following are some examples of internal control procedures used by the Department’s payment offices:
●● Limited/controlled access to vendor files – access to basic vendor information (e.g., name, address, business size) is available to financial system users; access to banking information, however, is strictly limited by system security to certain Office of Finance staff.
●● Controlled access to financial system accounts payable screens – authority to create, edit, approve, process, and amend payment records is limited to certain Office of Finance financial system users. Also, authority to add or revise records in the vendor database is limited to separate Office of Finance financial system users.
●● Segregation of duties for financial system data entry and review prior to transmitting disbursement files to Treasury – data entry duties are assigned to technicians in the Office of Finance who do not have authority to review and process payments. Authority to approve and process payments is assigned to accountants in the Office of Finance. Both data entry and approval/processing of payments are separate functions from transmitting disbursement files to Treasury.
●● Financial system edit reports highlight potential items that may result in improper payments (e.g., invoice amount and accrual amount are not the same). There is a daily Invoice Workload Report that displays open amounts (not closed by a payment) on all invoices. This report is reviewed and action is taken to resolve partially open invoices. Furthermore, system settings prevent a payment in excess of the amount of the invoice.
●● Daily pre-payment audit of invoices for accuracy, and corrective actions prior to disbursement, are in place, thereby preventing improper payments from occurring.
●● Financial system edit checks if the vendor’s name on the payment does not agree with that on the obligation, or if the payment amount is greater than the obligation or accrual amount.
●● The monthly vendor statement for purchase cards is interfaced into the financial system, thereby reducing data entry error.
●● An accountant or supervisor reviews individual payments before releasing for payment to help ensure that the correct banking information or payment addresses are used, and that the correct amount will be paid.
●● Monthly post-payment random sample audits are performed for detection purposes.
●● Contracts include a clause requiring the contractor to notify the contracting officer if the government overpays when making an invoice payment or a contract financing payment.
FY 20 14 AGENCY F I NANC IAL REPORT | 1 37
I MPROPER PAYMENTS I N FORMAT ION ACT ( I P I A ) O F 2002 , AS AMENDED , REPORT I NG DETA I LS

FREEZE THE FOOTPRINTChief Financial Officers (CFO) Act departments and agencies shall not increase the total square footage of their domestic office and warehouse inventory compared to the FY 2012 baseline, unless increased footage is offset through consolidation, co-location, or disposal of space from the inventory of that agency, per section 3 of the Office of Management and Budget (OMB) Memorandum 12-12, Promoting Efficient Spending to Support Agency Operations, and OMB Management Procedures Memorandum 2013-02, the Freeze the Footprint policy implementation guidance.
FREEZE THE FOOTPRINT BASELINE COMPARISONS
(In Millions)
FY 2012 Baseline FY 2013 +/- Change
Square Footage 11.837 11.488 (0.349)
OPERATING COSTS OF OWNED AND DIRECT LEASE BUILDINGS SUBJECT TO FREEZE THE FOOTPRINT
(In Millions)
FY 2012 Reported Cost FY 2013 +/- Change
Operation and Maintenance Costs $39.503 $36.5781 ($2.925)
The Department of Commerce’s FY 2012 baseline is 11.84 million square feet of office and warehouse space. The FY 2013 area was 11.48 million square feet, which is about a three percent reduction to the baseline. Through FY 2016, the Department’s consolidated space planning numbers are predicting that the Department will remain below its baseline through reciprocal growth and offsetting reductions of nearly 1.5 million square feet apiece.
Operating costs have seen a slight reduction since the FY 2012 baseline, but this seems to be mostly due to direct leases being replaced with the U.S. General Services Administration (GSA). Through FY 2016, the addition of a large owned facility is expected to increase operating cost since it is replacing several GSA assignments.
1 The amount reported in the FY 2013 Federal Real Property Profile database should have been $39.210. Two facilities costs
were reported in error. Going forward, the reporting issue has been resolved.
1 38 | FY 20 14 AGENCY F I NANC IAL REPORT
FREEZE THE FOOTPR INT

A AFR Agency Financial Report
AmTech Advanced Manufacturing Technical Consortia
Program (NIST)
APG Agency Priority Goal
ARRA American Recovery and Reinvestment Act
of 2009
ASA Assistant Secretary for Administration
ASAP Automated Standard Application for
Payments (Treasury)
B BAS Business Application Solutions
BEA Bureau of Economic Analysis
BIS Bureau of Industry and Security
BTOP Broadband Technology Opportunities
Program (NTIA)
C CAM Commerce Acquisition
Management
CAP Cross-Agency Priority Goal
CBS Commerce Business Systems
CEIP Coastal Energy Impact Program
(a NOAA direct loan program)
CFO Chief Financial Officer
GLOSSARY OF ACRONYMSAbbreviation Title Abbreviation Title
CFO/ASA Chief Financial Officer and Assistant
Secretary for Administration (DM)
CIRT Computer Incident Response Team
CSRS Civil Service Retirement System
CY Current Fiscal Year ended September 30
D DM Departmental Management
DMF Death Master File (Social Security
Administration)
DM&R Deferred Maintenance and Repairs
DOC U.S. Department of Commerce
DOL U.S. Department of Labor
E ECMO Enterprise Cybersecurity Monitoring
and Operations
EDA Economic Development Administration
ELGP Emergency Steel Loan Guarantee Program
EMT Executive Management Team
EPP Educational Partnership Program (NOAA)
ESA Economics and Statistics Administration
ESOC Enterprise Security Oversight Center
FY 20 14 AGENCY F I NANC IAL REPORT | 1 39
GLOSSARY OF ACRONYMS
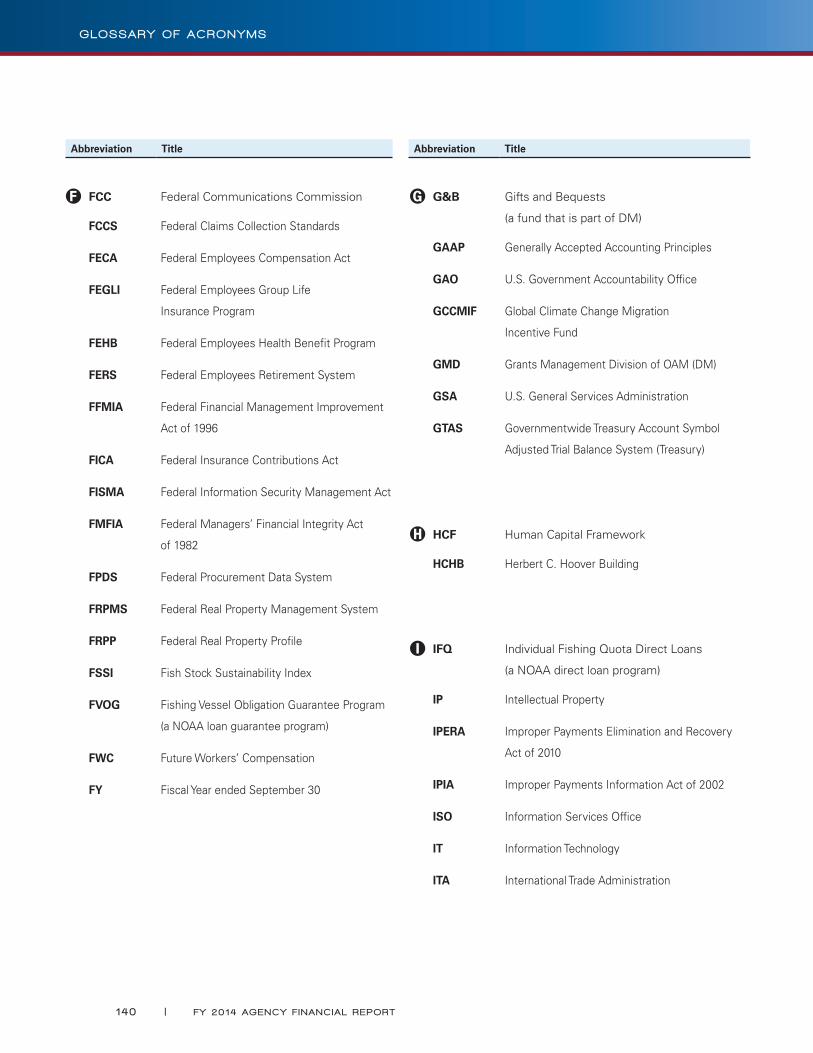
Abbreviation Title Abbreviation Title
F FCC Federal Communications Commission
FCCS Federal Claims Collection Standards
FECA Federal Employees Compensation Act
FEGLI Federal Employees Group Life
Insurance Program
FEHB Federal Employees Health Benefit Program
FERS Federal Employees Retirement System
FFMIA Federal Financial Management Improvement
Act of 1996
FICA Federal Insurance Contributions Act
FISMA Federal Information Security Management Act
FMFIA Federal Managers’ Financial Integrity Act
of 1982
FPDS Federal Procurement Data System
FRPMS Federal Real Property Management System
FRPP Federal Real Property Profile
FSSI Fish Stock Sustainability Index
FVOG Fishing Vessel Obligation Guarantee Program
(a NOAA loan guarantee program)
FWC Future Workers’ Compensation
FY Fiscal Year ended September 30
G G&B Gifts and Bequests
(a fund that is part of DM)
GAAP Generally Accepted Accounting Principles
GAO U.S. Government Accountability Office
GCCMIF Global Climate Change Migration
Incentive Fund
GMD Grants Management Division of OAM (DM)
GSA U.S. General Services Administration
GTAS Governmentwide Treasury Account Symbol
Adjusted Trial Balance System (Treasury)
H HCF Human Capital Framework
HCHB Herbert C. Hoover Building
I IFQ Individual Fishing Quota Direct Loans
(a NOAA direct loan program)
IP Intellectual Property
IPERA Improper Payments Elimination and Recovery
Act of 2010
IPIA Improper Payments Information Act of 2002
ISO Information Services Office
IT Information Technology
ITA International Trade Administration
1 40 | FY 20 14 AGENCY F I NANC IAL REPORT
GLOSSARY OF ACRONYMS
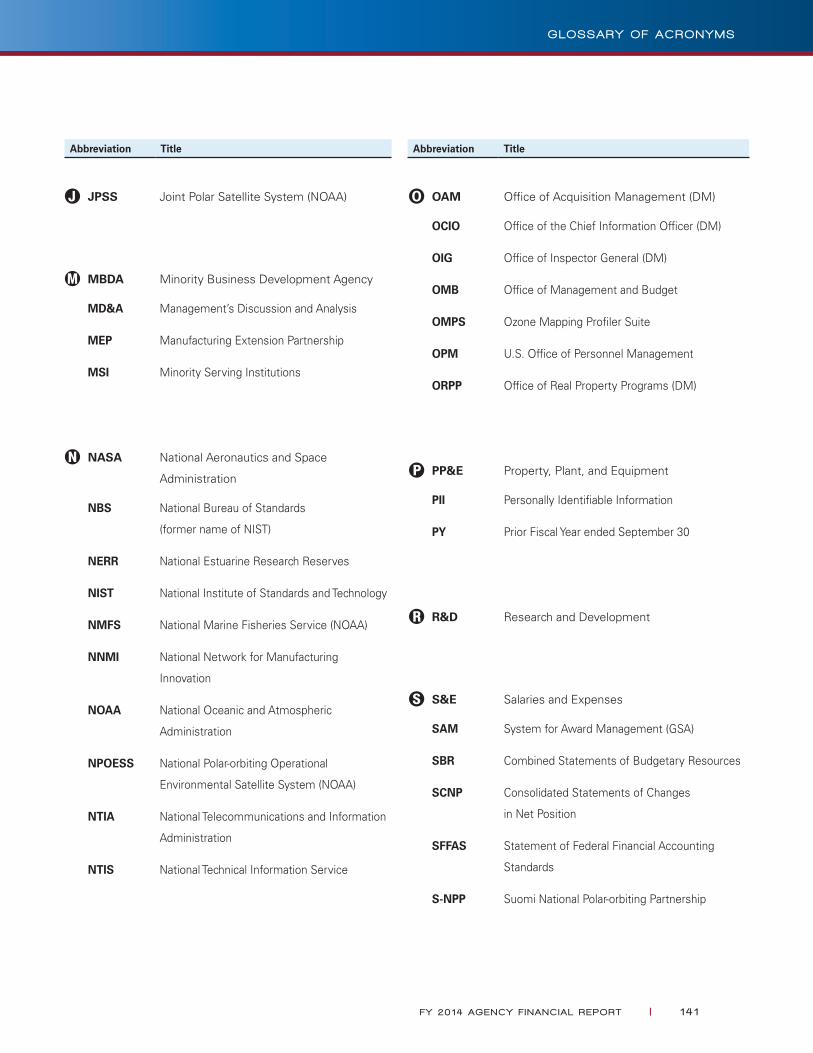
Abbreviation Title Abbreviation Title
J JPSS Joint Polar Satellite System (NOAA)
M MBDA Minority Business Development Agency
MD&A Management’s Discussion and Analysis
MEP Manufacturing Extension Partnership
MSI Minority Serving Institutions
N NASA National Aeronautics and Space
Administration
NBS National Bureau of Standards
(former name of NIST)
NERR National Estuarine Research Reserves
NIST National Institute of Standards and Technology
NMFS National Marine Fisheries Service (NOAA)
NNMI National Network for Manufacturing
Innovation
NOAA National Oceanic and Atmospheric
Administration
NPOESS National Polar-orbiting Operational
Environmental Satellite System (NOAA)
NTIA National Telecommunications and Information
Administration
NTIS National Technical Information Service
O OAM Office of Acquisition Management (DM)
OCIO Office of the Chief Information Officer (DM)
OIG Office of Inspector General (DM)
OMB Office of Management and Budget
OMPS Ozone Mapping Profiler Suite
OPM U.S. Office of Personnel Management
ORPP Office of Real Property Programs (DM)
P PP&E Property, Plant, and Equipment
PII Personally Identifiable Information
PY Prior Fiscal Year ended September 30
R R&D Research and Development
S S&E Salaries and Expenses
SAM System for Award Management (GSA)
SBR Combined Statements of Budgetary Resources
SCNP Consolidated Statements of Changes
in Net Position
SFFAS Statement of Federal Financial Accounting
Standards
S-NPP Suomi National Polar-orbiting Partnership
FY 20 14 AGENCY F I NANC IAL REPORT | 1 4 1
GLOSSARY OF ACRONYMS
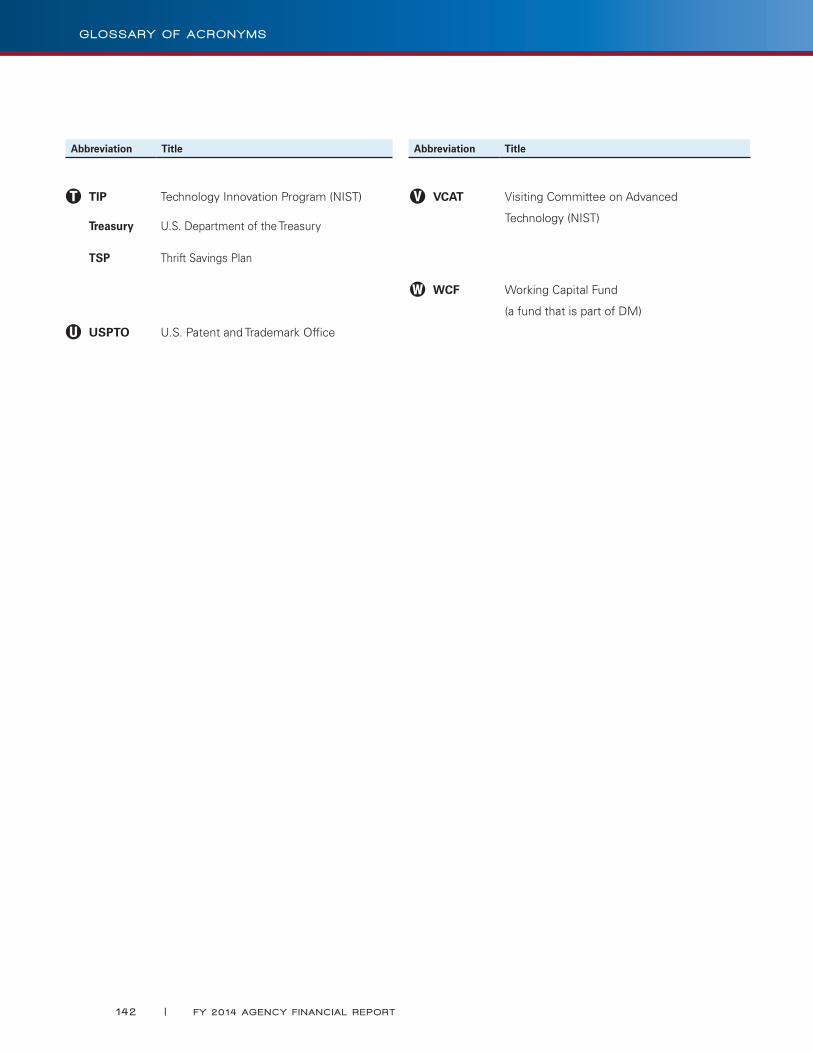
Abbreviation Title Abbreviation Title
T TIP Technology Innovation Program (NIST)
Treasury U.S. Department of the Treasury
TSP Thrift Savings Plan
U USPTO U.S. Patent and Trademark Office
V VCAT Visiting Committee on Advanced
Technology (NIST)
W WCF Working Capital Fund
(a fund that is part of DM)
1 42 | FY 20 14 AGENCY F I NANC IAL REPORT
GLOSSARY OF ACRONYMS
This Agency Financial Report was prepared with the energies and talents of many Department of Commerce employees. To these individuals, the Office of Financial Management would like to offer our sincerest appreciation and recognition.
In particular, we would like to recognize the following organizations for their contributions:
The bureau finance offices, Office of the Secretary, Office of the Chief Financial Officer and Assistant Secretary for Administration, Office of Inspector General, Office of Acquisition Management, Office of Budget, Office of Human Resources Management, Office of Performance, Evaluation, and Risk Management, and Office of Administrative Services/Office of Real Property Programs.
We also offer special gratitude and recognition to The DesignPond for their outstanding contributions in the design and production of this report.
ACKNOWLEDGEMENTS

U.S. DEPARTMENT OF COMMERCE
1401 Constitution Avenue, NW
Washington, DC 20230
(202) 482-2000
www.commerce.gov