us debt investor update - statoil.com · us debt investor update september 2017 russell alton,...
TRANSCRIPT

Photo: Gina Krog
US Debt Investor Update September 2017
Russell Alton, Senior Vice President, Head of FinancePeter Hutton, Senior Vice President, Head of Investor RelationsMorten Færevåg, Vice President, Head of Capital Markets

• Business Update Including 2Q 2017
• Funding & Debt Strategy
• Supplementary Slides
Debt Investor Update - Agenda
2

Norwegian
continental shelf
Build on unique position
• Highly cost competitive
• Attractive project pipeline
• Exploration potential
International
oil & gas
Deepen core areas
Midstream
and marketing
Access premium markets
• Flow assurance
• Asset backed trading
• Capital light
• Enhance Brazil portfolio
• Flexible US position
• New growth options
New energy
solutions
Industrial approach
• Offshore wind focus
• Low-carbon solutions
• Ventures, R&D
US onshore
Kårstø Offshore wind
High value,
low carbon,
always safe
Johan Sverdrup
3
Developing a distinct and competitive portfolio

Strong cash generation – high value reinvestment
0%
10%
20%
30%
40%
2016 2017/2018 2019/2020
USD 50/bblUSD 50/bbl
Growing cash flow with flexibility1
Free cash flow positive @ USD 50/bbl in 2017
Managing the balance sheet2
Reducing net debt at > USD 50/bbl
USD 70/bbl
USD 70/bbl
1 For illustrative purposes; assumes 40% out-take rate for the remaining scrip programme period.
2 In the price scenarios, the following real prices have been assumed (Brent Blend USD per barrel / NBP USD per million Btu): 50/5.5, 70/6.5 and 90/8.5
3 Cash flow from operations.4
2017/2018 2019/2020
0
5
10
15
20
25
CFFOCapex CFFOCapex
US
D b
illio
n
Non sanct > USD 50 BE
Non sanct USD 40-50 BE
Non sanct < USD 40 BE
Capex EXP & US onshore
Sanctioned
USD 90/bbl
USD 70/bbl
USD 50/bbl
3

1H17: Continued operating and financial progress
Cash flow $4bn positive FCF @ $52/bbl BrentFCF positive at $50/bbl Brent in 2017
(includes scrip to Q3 2017)
GearingReduced by 8 percentage points from
35.6% to 27.5% YTD
Comfortable in 30s;
15-30% long-term target range
Organic capex $4.7 billion YTD2017: USD ~11 billion
Rising slightly to 2020
OPEX / SG&A costs per boeContinued progress on $1bn
improvement in 2017
$1bn improvement in 2017
even from a better 2016 base
Production Up 4% y/y1
2016-17: ~5% organic growth1
(from ~4-5% previously);
2016-2020: ~3% organic CAGR
1H17 Guidance
5
1 Relative to 2016 production rebased for the sale of Canadian oil sands (Leismer) and PetroCedeno re-classification

OPEX / SG&A trends
0
2
4
6
8
1Q
14
2Q
14
3Q
14
4Q
14
1Q
15
2Q
15
3Q
15
4Q
15
1Q
16
2Q
16
3Q
16
4Q
16
1Q
17
2Q
17
NO
K b
illio
n
DPN: OPEX / SG&A
0
10
20
30
40
50
60
70
80
1Q
14
2Q
14
3Q
14
4Q
14
1Q
15
2Q
15
3Q
15
4Q
15
1Q
16
2Q
16
3Q
16
4Q
16
1Q
17
2Q
17
NO
K /
bo
e
DPN: OPEX / SG&A per boe
0
200
400
600
800
1 000
1 200
1 400
1 600
1Q
14
2Q
14
3Q
14
4Q
14
1Q
15
2Q
15
3Q
15
4Q
15
1Q
16
2Q
16
3Q
16
4Q
16
1Q
17
2Q
17
US
D m
illio
n
INT: OPEX / SG&A
0
2
4
6
8
10
12
14
16
1Q
14
2Q
14
3Q
14
4Q
14
1Q
15
2Q
15
3Q
15
4Q
15
1Q
16
2Q
16
3Q
16
4Q
16
1Q
17
2Q
17
US
D /
bo
e
INT: OPEX / SG&A per boe
• DPN: 11% underlying1
reduction y/y in OPEX /
SG&A per boe in NOK
• INT: Underlying2 OPEX /
SG&A per boe in USD
largely flat y/y (-4% y/y
excluding royalties)
• MMP: 5% underlying1
reduction y/y in OPEX /
SG&A
1 Adjusted for change in principle for allocation of gas transportation costs, which has no NOI effect
2 Adjusted for sale of Canadian oil sands (Leismer)
2Q17
6

0
500
1 000
1 500
2 000
2 500
2016 2017 2020
DPN excl. flex gas
International excl. US onshore
US onshore and DPN flex gas
~5%
~3% CAGR1 2017 2018 2019 2020 2021 2022
Gina KrogAasta
Hansteen
Johan
Sverdrup
Peregrino
Phase 2
Troll Future Johan Sverdrup
future
Hebron Mariner Trestakk UtgardSnøhvit
AskeladdJohan Castberg
Oseberg
VestflankenMartin Linge
Snorre
Expansion Eirin Krafla
Stampede Bauge VitoNorth-
Komsomolskoye
TVEX3
Big Foot
- Major projects (list not exhaustive)
- Statoil-operated projects are in bold
- * Indicative plateau production from planned start-ups – Statoil equity share (mboe/d), not
applicable for sum of production per year
2
Delivering high value production growth
Major start-ups planned for 2017-2022Equity productionmboe/d
~40* ~155* ~200* ~70* ~165* ~270*
1 Compound annual growth rate.
2 Rebased 2016 of 1,958 mboe/d, adjusted for the KKD transaction.
3 TVEX: Tahiti vertical expansion.7

Johan Castberg
27Average
break-even USD
Average IRR3
2023Payback2
@ USD 50/bbl
65%Oil share
0%
10%
20%
30%
USD 50/bbl
USD 70/bblUSD 90/bbl
1 Operated and non-operated projects, sanctioned since 2015 or planned for sanction, with start-up by 2022. Volume weighted.
2 Time of accumulated positive cash flow after tax.
3 Internal rate of return at time of sanctioning. Capex weighted.
4 Johan Castberg, Johan Sverdrup phase 1, Johan Sverdrup phase 2, Oseberg Vestflanken, Peregrino Phase II, Snorre Expansion, Trestakk and Utgard.
CAPEX and KPIs from 1Q2013 used with exception of newer projects.
/bbl
Investing in next generation portfolio
Development break-even major
project decisions 2015-174
World class projects 2015-221
Trestakk
Peregrino Phase 2
8
0
20
40
60
80
2017 U
SD
/bbl
Current CMU 2016 2013

0
50
100
150
200
250
At PDO Phase 1execution
Conceptchange
Facility Drilling Market Currentforecast
Phase 1
below
20USD/bbl
Full field
below
25USD/bbl
Phase 2
below
30USD/bbl
Current break-even prices
Phase 2
40-55
> 50%
Phase 1
92
Full field resources
2-3 bn boe
Phase 1
123
Phase 2
85
~25%
Improvements Phase 2
1 Numbers in NOK billion nominal, fixed currency and excluding IOR.
NO
K b
illio
n
Capex improvements1
9
Johan Sverdrup – culture for value creation

0
20
40
60
80
100
120
2013 Pre 2016 Drilling Subsea Floater Market Currentforecast
Improvements break-even price
100
Phase 2
45
> 50%
Improvements 2016 2013 above
80USD/bbl
Current below
35USD/bbl
CMU 2016 below
45USD/bbl
45-50
NO
K b
illio
n
1 Numbers in NOK billion 100% real term 2016.
Field resources
450-650 mn boe
Capex improvements1
10
Johan Castberg – continuously optimising concept

Industrial approach
• Leverage core competence
• Scale & technology reduce costs
• Access to long-term projects
Value driven
• From subsidies to markets
• 9-11% return range (real)
• Cash flow resilience
Growth opportunities
• 15-20% of capex in 20302
• Offshore wind and other options
• Low-carbon solutions
2016 2017-20 2020-25
~
500
750
-
500
1500
-
750
11
1 Indicative for offshore wind projects
2 Indicative, based on potential future corporate portfolio.
Capex potential per year
USD million
Dudgeon¹
Building a profitable new energy business

Sustainable value creation from financial discipline
• Break-even @ USD 27/bbl
• Material capex flexibility
• RoACE1 above 10% @ USD 70/bbl 2020
• A-category rating on a stand-alone basis
• Gearing comfortable in 30s; long term 15-30%
• Active portfolio management
• Visible production growth
• Improving cash margin
• FCF positive @ USD 50/bbl in 2017
• Maintain dividend at USD 0.22012
• Scrip programme to Q3 20172
• Share buyback option2
Growing cash flow
Maintaining financial flexibility
Investing in world class portfolio
Dividend policy remains firm
1 Return on average capital employed.
2 Subject to approval at the Annual General Meeting (AGM).
12

• Business Update Including 2Q 2017
• Funding & Debt Strategy
• Supplementary Slides
Debt Investor Update - Agenda
13

• Strong cash flow from
operations
• Net debt ratio reduced
from 35.6% to 27.5%
YTD
• FCF positive at 50 USD
per barrel Brent in 20171
• Continued strict capital
discipline
2017 YTD; USD mill
Cash flow from operating activities
10,808 2
Proceeds fromsale of assets
377
Net4,026
Taxes paid(1,727)
Cash flows to investments
(4,704)
Dividends paid(728)
Net debt ratio reduced by 8 percentage points
1 Including scrip, as communicated at CMU Feb 2017.
2 Income before tax (7,332) + Non cash adjustments (3,476).
14

26%
21%
12%15%
20%
27%
36%
28%
0%
5%
10%
15%
20%
25%
30%
35%
40%
Robust financial framework
▪ Strong balance sheet maintained
▪ Objective of maintaining
Statoil's long-term credit
rating at least within the
single A category on a stand-
alone basis
▪ Net debt to capital employed
target of 15-30%
▪ Long term financing
▪ Average ~8 years to maturity
▪ Firm dividend policy
▪ 2Q 2017 dividend of USD
0.2201 per share
▪ Introduction of a two year
scrip program in Q4 2015
26%
21%
12%
2010 2011 2012 2013 2014 2015 2Q,2017
15
Net debt to
capital em
plo
yed
2016
21%
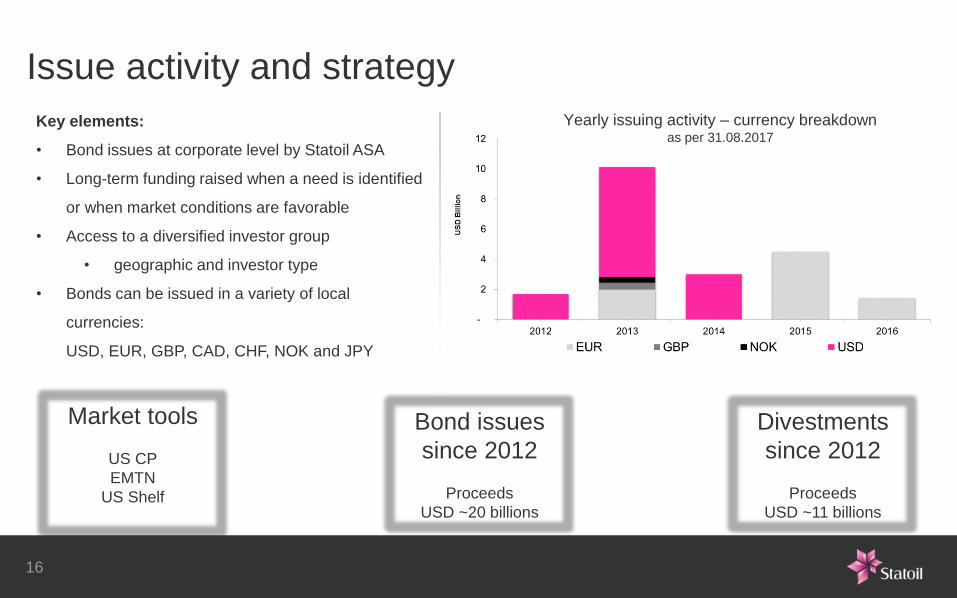
Issue activity and strategy
Key elements:
• Bond issues at corporate level by Statoil ASA
• Long-term funding raised when a need is identified
or when market conditions are favorable
• Access to a diversified investor group
• geographic and investor type
• Bonds can be issued in a variety of local
currencies:
USD, EUR, GBP, CAD, CHF, NOK and JPY
Bond issues
since 2012
Proceeds
USD ~20 billions
Divestments
since 2012
Proceeds
USD ~11 billions
Market tools
US CP
EMTN
US Shelf
16
Yearly issuing activity – currency breakdownas per 31.08.2017

Total long-term debt ~ USD 31 billion Average years to maturity ~ 8 years
Limited refinancing risk
17
Maturity profile – currency breakdownas per 31.08.2017

• Business Update Including 2Q 2017
• Funding & Debt Strategy
• Supplementary Slides
Debt Investor Update - Agenda
18

DPN: Continued strong operational performance and cash flow
Continued sustainable improvements:
• Continued safety improvements
• Improving production efficiency
• Adding new capacity – start-up of new fields
• Continue cost improvements
Milestones in 2017-18:
• Start-up Gina Krog, Byrding and Aasta
Hansteen
• DG3 planned for major projects
• Johan Castberg
• Johan Sverdrup future
• Troll future
• Snorre Expansion
Cash generation:
• Significant cash generation at current price
level – robust portfolio
Safety improvements
• SIF 0.7 YTD Q2 2017
Production efficiency at record level:
• Continued improvements planned and
unplanned losses
OPEX and SG&A reduction:
• 11% reduction NOK/ boe Q2 2017 vs Q2 2016
• 7% reduction NOK Q2 2017 vs Q2 2016
World class projects
Johan Sverdrup Troll future
Oseberg Vestflanken
Johan Castberg
2017 and 2018 Focus Progress 2017 Major NCS Projects
19
Trestakk

DPI: A competitive international portfolio
Mature and high-grade portfolio and further improve
profitability:
• Cost improvements on producing assets
• License extensions
• Enhance Brazil portfolio
• Cost and carbon efficient project development
Milestones in 2017-18:
• Start-up Hebron (Canada) and Mariner (UK)
• Efficient project execution Peregrino phase 2 (Brazil)
• Progress North Komsomolskoye (Russia)
Cash generation:
• DPI cash flow positive going forward at 4Q 2016 Brent oil
price3
Significant
improvements
in project
design,
costs and
break-even
BM-C-33 Brazil BM-S-8 Brazil
Bay du Nord
Canada
Tanzania
gas project
North Komsomolskoye
Russia
1 2016 net operating income, excluding exploration expenses, would have been zero at $45 brent oil price vs. $46 communicated at the CMU in February 2016
2 Forward break-even prices for unsanctioned portfolio
3 Excluding exploration cost, 4Q2016 Brent price was USD 49.3/boe
2017 and 2018 Focus Major International Projects
20

Peregrino Main
Peregrino Phase II
Carcará
BM-C-33
Value from Natural Gas
• 60%, operated
• >150MM bbl produced
• Long life (STOOIP ~4 bn bbl, API
14°)
• 100 kbp/d capacity
• Phase II: Construction started
• 1st oil: 2020
• 60 kbp/d capacity
• +250MMbbl recoverable
resources
• Statoil operatorship
• 76% stake – world class
• Pre-salt, light oil 32 ºAPI
• Open acreage bid round Northern
Carcará Oct17
• Intensive market potential
• Market opening initiatives
• Potential on mid and downstream
MoU with PBR
EXP portfolio
• 9 blocks, multiple wells program
• 10 commitment wells 2016-18
• Espírito Santo basin, one of the 3
most prolific in the country
• Statoil operated -3 discoveries
• Potential for early monetization
• Pre-salt, light oil
• Great gas potential• Collaboration agreement with
Petrobas, main NOC
• Mature asset evaluation
• Technological agreement
DPI: Brazil – competitive portfolio
21

1 Use of capex flexibility is not reflected in the different price scenarios in the chart
2 After tax margin at USD 50 WTI. Assumes product and gas prices correlate with WTI prices.
3 Cash flow from operations
DPUSA: On track to achieve “90 to 50”
2017/182015/16 2019/20
Growing CFFO while capex is flexible1
CFFO Capex CFFO Capex CFFO Capex
US
D b
illio
n
90/bbl
70/bbl
50/bbl70/bbl
50/bbl
Sanctioned
US onshore
Non-sanctioned
32014 2018
~USD 5/boe
New target: USD 12.50/boe
Cash margin2
@ USD 50 WTI
Old target: USD 10/boe
2014 2018
240
~360
Production potential
mboe/d
22

MMP: Delivering resilience
1 Before tax
23
-200
0
200
400
600
800
1 000
1 200
1Q
14
2Q
14
3Q
14
4Q
14
1Q
15
2Q
15
3Q
15
4Q
15
1Q
16
2Q
16
3Q
16
4Q
16
1Q
17
2Q
17
US
D m
illio
n
MMP adjusted earnings1
Natural gas Europe Natural gas US Liquids Other
MMP
guidance

Planned exploration drilling programme 2017
Suriname
US GoM
Brazil
Norway
Canada
United Kingdom
Angola
Turkey
Russia
Prolific Basins
High Impact Well
Onshore
24

Goliat
Snøhvit
Wisting
Johan Castberg

1. Digital safety, security & sustainability
2. Subsurfaceanalytics
3. Next generation well delivery
6. Process digitalisation & insight
5. Data drivenoperations
4. Field of the future
Statoil data platform
Statoil ’s digital roadmap
26

The ambition is to become a digital leader within our core areas
Safety, security and sustainability
Cost Efficiency
Productivity
Capabilities and culture
Always safe | High value | Low carbon
27

Key #1: Energy efficiency improvementGlobal GDP 2-2.6 times higher in 2050, Energy demand -5% – + 30%
Source: IEA (history), Statoil (projections)
28
World GDP and energy demandIndex, 1990=100
0
100
200
300
400
500
600
199
0
200
0
201
0
202
0
203
0
204
0
205
0
ReformRenewalRivalry
Energy intensityIndex, 1990=100
0
20
40
60
80
100
199
0
200
0
201
0
202
0
203
0
204
0
205
0
Reform Renewal Rivalry
World energy demand per fuelBillion toe
0
10
20
30
Ref Ren Riv
New Renewables Biomass
Hydro Nuclear
Gas Oil
Coal Unchanged EI decline
20501990 2014

Huge investments needed in oil in all scenarios…to replace production and satisfy demand
Source: Statoil (projections), BP statistical review of world energy (history)
29
Cumulative oil demand gap 2015-50, compared Billion barrels
0
200
400
600
800
1 000
Cumulativeoil demand
2015-50
USA Opec Norway
Potential legacy production
Renewal add-on
Reform add-on
Rivalry add-onDemand
range
Decline rangeProduction
0
20
40
60
80
100
120
140
2015 2020 2030 2040 2050
Oil demand and supply from existing fields
Million barrels per day
Cumulative production
1980-2015

…and the same is the case for gas…to replace production and satisfy demand
Source: Statoil (projections), BP statistical review of world energy (history)
30
Gas demand and supply from existing fields Billion cubic meters
Demand range
Decline range
Production
0
1000
2000
3000
4000
5000
2015 2020 2030 2040 2050
0
20
40
60
80
100
Cumulativegas demand
2015-50
USA Russia Middle East Norway
Rivalry add-on
Reform add-on
Norway
ME
Cumulative production 1980-2015
Cumulative gas demand gap 2015-50, compared Trillion cubic meters

Short-run marginal cost ranges for US 2018 LNG supply to Asia and Europe, and prices
Asia USD/MMBtu
EuropeUSD/MMBtu
North America USD/MMBtu
3.11)
Globalizing gas – flows according to price signals…to US LNG currently in the money; prices driven by other factors as well
31
JKM Shipping HH Shipping/Regas NBP
3.11)
5.0 - 5.7 4.3 - 4.7
0.8 - 1.21.5 – 2.2
5.82)
6.43)
0.5
Source: NYMEX, ICE, Platts, Pira, Statoil ASA
1 NYMEX Henry Hub Forward curve for Calendar 2018 – 1 Sep 2017
2 ICE NBP Forward curve for Calendar 2018 - 1 Sep 2017
3 Platts JKM (Asia spot LNG) - 1 Sep 2017
• Strong deliveries have led to record export levels and a wide discount to the continent
• Continental demand levels have provided support to market price
3
4
5
6
7
8
Jan-17 Mar-17 May-17 Jul-17 Sep-17 Nov-17 Jan-18 Mar-18
US
D/M
MB
tu
European Spot Gas Prices and FW to Q1-2018
NBP Day Ahead TTF Day Ahead NCG Day Ahead
NBP FW TTF FW NCG FW
Gas Prices 1st Half 2017NBP disconnects from continental hubs
32
Source: ICE

Organic capex 2017 USD ~11 billion1
Production2016-2017
2016-2020
~5% organic production growth
~3% organic CAGR
Maintenance2017
3Q 2017
30 mboe per day
50 mboe per day
Exploration 2017 USD ~1.3 billion
Efficiency
improvements2017 USD 1 billion
Outlook 2017
Period Outlook
1) Based on USD/NOK exchange rate of 8.5
1 Based on USD/NOK exchange rate of 8.5
33

Forward-looking statements
adverse changes in tax regimes; the development and use of new technology; geological or technical
difficulties; operational problems; operator error; inadequate insurance coverage; the lack of necessary
transportation infrastructure when a field is in a remote location and other transportation problems; the
actions of competitors; the actions of field partners; the actions of governments (including the Norwegian
state as majority shareholder); counterparty defaults; natural disasters and adverse weather conditions,
climate change, and other changes to business conditions; an inability to attract and retain personnel;
relevant governmental approvals; industrial actions by workers and other factors discussed elsewhere in
this report. Additional information, including information on factors that may affect Statoil's business, is
contained in Statoil's Annual Report on Form 20-F for the year ended December 31, 2015, filed with the
U.S. Securities and Exchange Commission, which can be found on Statoil's website at www.statoil.com.
Although we believe that the expectations reflected in the forward-looking statements are reasonable, we
cannot assure you that our future results, level of activity, performance or achievements will meet these
expectations. Moreover, neither we nor any other person assumes responsibility for the accuracy and
completeness of the forward-looking statements. Unless we are required by law to update these
statements, we will not necessarily update any of these statements after the date of this report, either to
make them conform to actual results or changes in our expectations.
This report contains certain forward-looking statements that involve risks and uncertainties. In some cases,
we use words such as "ambition", "continue", "could", "estimate", "expect", "focus", "likely", "may", "outlook",
"plan", "strategy", "will", "guidance" and similar expressions to identify forward-looking statements. All
statements other than statements of historical fact, including, among others, statements regarding plans and
expectations with respect to market outlook and future economic projections and assumptions; Statoil’s
focus on capital discipline; expected annual organic production through 2017; projections and future impact
related to efficiency programmes; capital expenditure and exploration guidance for 2016; production
guidance; Statoil’s value over volume strategy; Statoil’s plans with regard to its acquisition of 66% operated
interest in the BM-S-8 offshore license in the Santos basin; Statoil’s expected report on helicopter safety on
the Norwegian continental shelf; organic capital expenditure for 2016; Statoil’s intention to mature its
portfolio; exploration and development activities, plans and expectations, including estimates regarding
exploration activity levels; projected unit of production cost; equity production; planned maintenance and the
effects thereof; impact of PSA effects; risks related to Statoil’s production guidance; accounting decisions
and policy judgments and the impact thereof; expected dividend payments, the scrip dividend programme
and the timing thereof; estimated provisions and liabilities; the projected impact or timing of administrative or
governmental rules, standards, decisions, standards or laws, including with respect to the deviation notice
issued by the Norwegian tax authorities and future impact of legal proceedings are forward-looking
statements. You should not place undue reliance on these forward- looking statements. Our actual results
could differ materially from those anticipated in the forward-looking statements for many reasons.
These forward-looking statements reflect current views about future events and are, by their nature, subject
to significant risks and uncertainties because they relate to events and depend on circumstances that will
occur in the future. There are a number of factors that could cause actual results and developments to differ
materially from those expressed or implied by these forward-looking statements, including levels of industry
product supply, demand and pricing; price and availability of alternative fuels; currency exchange rate and
interest rate fluctuations; the political and economic policies of Norway and other oil-producing countries; EU
developments; general economic conditions; political and social stability and economic growth in relevant
areas of the world; global political events and actions, including war, political hostilities and terrorism;
economic sanctions, security breaches; changes or uncertainty in or non-compliance with laws and
governmental regulations; the timing of bringing new fields on stream; an inability to exploit growth or
investment opportunities; material differences from reserves estimates; unsuccessful drilling; an inability to
find and develop reserves; ineffectiveness of crisis management systems;
34

E-mail: [email protected]
Investor Relations Europe
Peter Hutton Senior Vice President [email protected] +44 7881 918792
Lars Valdresbråten IR Officer [email protected] +47 40 28 17 89
Erik Gonder IR Officer [email protected] +47 99 56 26 11
Anca Jalba IR Officer [email protected] +47 41 08 79 88
Marc Jacouris IR Officer [email protected] +44 7885 983904
Marius Javier Sandnes Senior Consultant [email protected] +47 90 15 50 93
Anne Sofie Dahle Senior Consultant [email protected] +47 97 01 50 06
Investor Relations USA & Canada
Helge Hove Haldorsen Vice President [email protected] +1 281 224 0140
Ieva Ozola IR Officer [email protected] +1 281 730 6014
Investor Relations / Debt Investor Relations
35
Debt Investor Relations
Morten Færevåg Head of Capital Markets [email protected] +47 99 22 38 57
Mads Rømer Holm Head of Corporate Financing and Analysis [email protected] +47 90 95 54 17
Philippe Cellerosi, CFA Corporate Financing and Analysis [email protected] +47 48 40 16 20
Sten Haarr Corporate Financing and Analysis [email protected] +47 48 08 03 21