urban transportation policy in korea - united nations ... · urban transportation policy ......
TRANSCRIPT
The 2th Meeting of the Regional EST Forum in Asia
Urban Transportation Policy for Sustainable Transportation
in Korea
Ministry of Construction and Transportation, Republic of Korea
December 12, 2006
The 2th Meeting of the Regional EST Forum in Asia

MINISTRY OF CONSTRUCTION & TRANSPORTATION
Contents
I.Facts and Figures of Urban Transport
III.Urban Transportation Policy – 4S Strategy
Sustainable urban transportation
II.Urban Transportation Policy System
Smart urban transportation
Safe urban transportation
Silver urban transportation
I.Facts and Figures of Urban Transport
III.Urban Transportation Policy – 4S Strategy
Sustainable urban transportation
II.Urban Transportation Policy System
Smart urban transportation
Safe urban transportation
Silver urban transportation

MINISTRY OF CONSTRUCTION & TRANSPORTATION
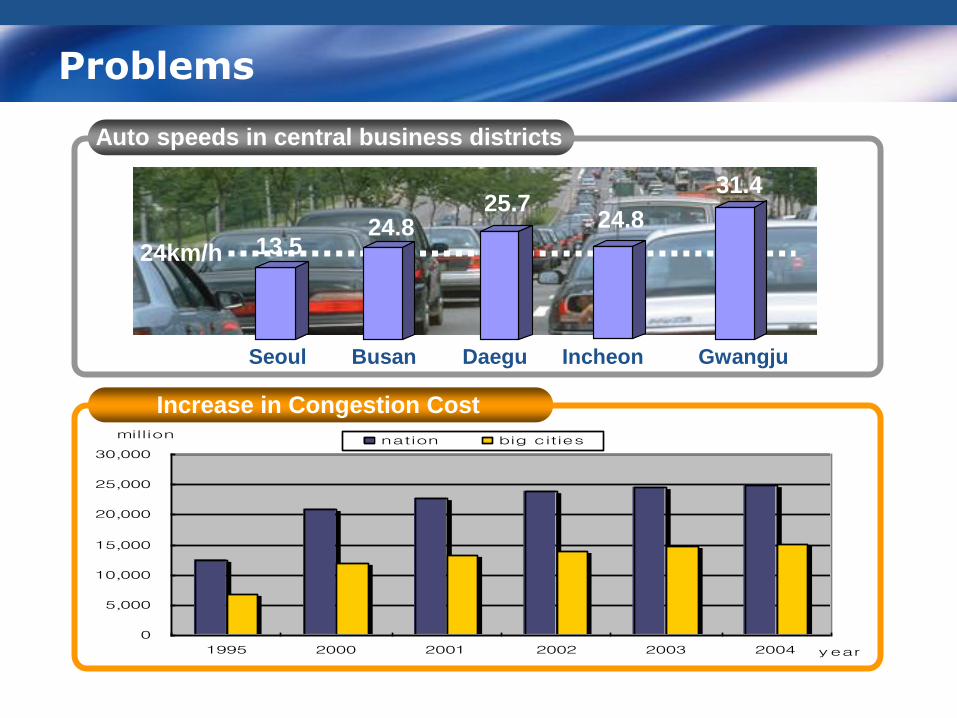
• Decrease in auto speeds
• High congestion cost
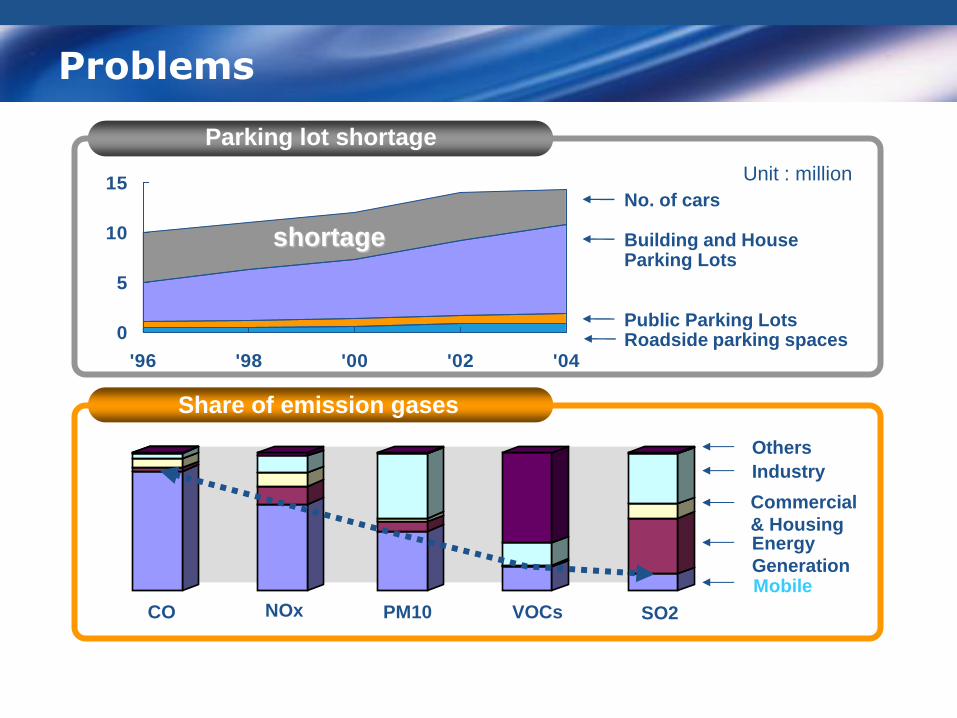
• Lack of parking lots
• Air pollution
I. Facts & Figures of Urban Transport
But • High increasing rate in cars
• Decrease in public transportation
uses
• Small area: 99,538 km2
• High urbanization rate: 89%
• High population density: 492person/km2
As a result
MINISTRY OF CONSTRUCTION & TRANSPORTATION
5,000
15,000
25,000
35,000
45,000
55,000
1995 2000 2001 2002 2003 2004 (year)
(1000)
nation big cities
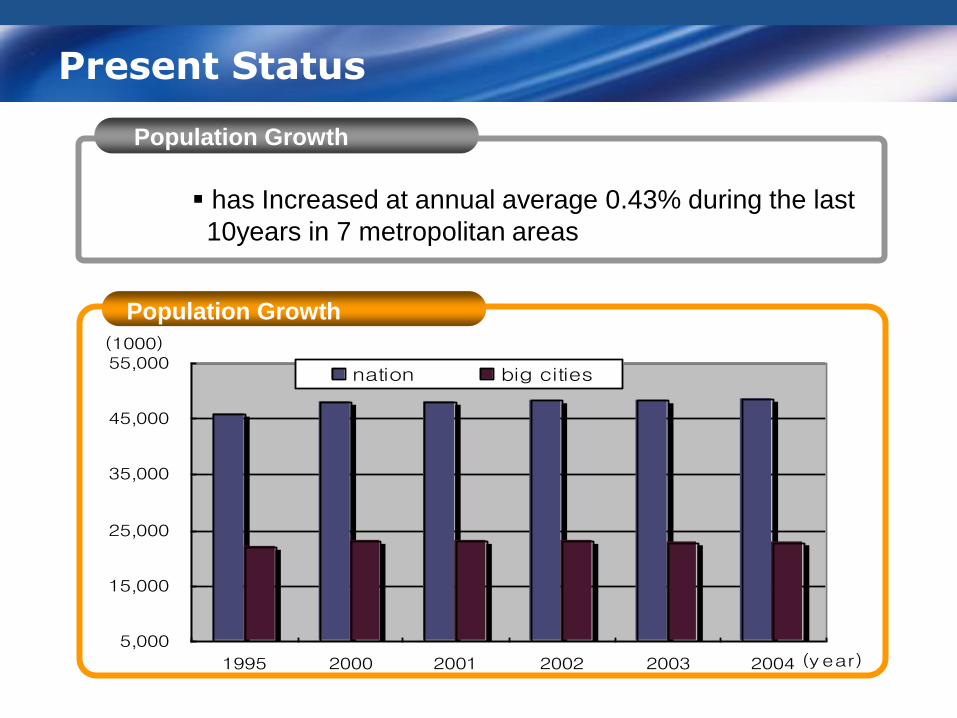
Present Status
Population Growth
Population Growth
has Increased at annual average 0.43% during the last
10years in 7 metropolitan areas

MINISTRY OF CONSTRUCTION & TRANSPORTATION
Present Status
Comparison of population densities
Seoul Busan Tokyo London Paris New York
5,405
16,993
4,827 4,433
9,421 9,182
Rapid Urbanization
1960 1970 1980 1990 2000 2004
81.9% 88.3% 89.0%
39.1%
50.1%
68.7%
MINISTRY OF CONSTRUCTION & TRANSPORTATION
1,000
3,000
5,000
7,000
9,000
11,000
13,000
15,000
17,000
1995 2000 2001 2002 2003 2004
(people, 1,000)
(year)
nation(total)l nation(cars)
big cities(total) big cities(cars)
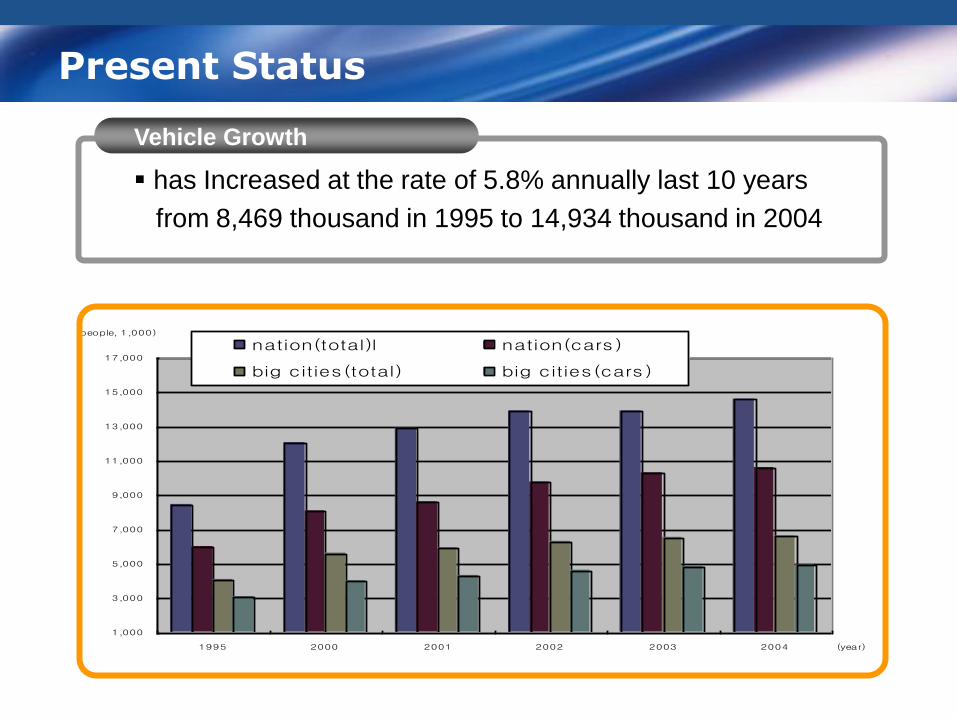
Present Status
Vehicle Growth
has Increased at the rate of 5.8% annually last 10 years
from 8,469 thousand in 1995 to 14,934 thousand in 2004
MINISTRY OF CONSTRUCTION & TRANSPORTATION
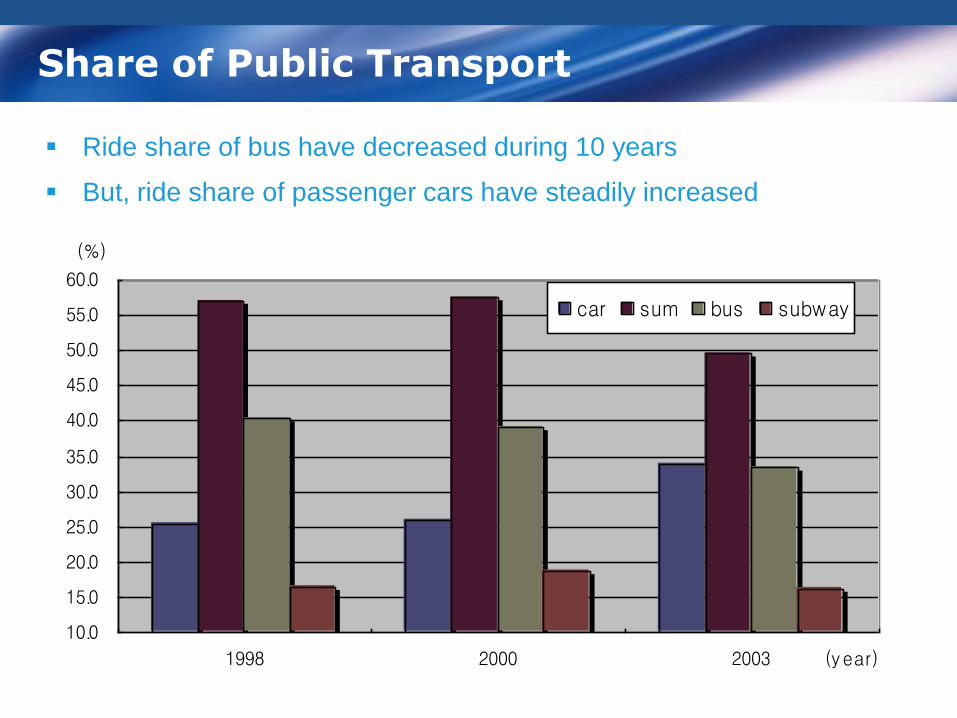
Share of Public Transport
Ride share of bus have decreased during 10 years
But, ride share of passenger cars have steadily increased
10.0
15.0
20.0
25.0
30.0
35.0
40.0
45.0
50.0
55.0
60.0
1998 2000 2003 (year)
(%)
car sum bus subway
MINISTRY OF CONSTRUCTION & TRANSPORTATION
0
5,000
10,000
15,000
20,000
25,000
30,000
1995 2000 2001 2002 2003 2004 year
millionnation big cities
Problems
Auto speeds in central business districts
Increase in Congestion Cost
Seoul Busan Daegu Incheon Gwangju
24.8
25.7 24.8
31.4
13.5 24km/h
MINISTRY OF CONSTRUCTION & TRANSPORTATION
Problems
Parking lot shortage
Share of emission gases
24.8
25.7
0
5
10
15
'96 '98 '00 '02 '04
Unit : million
No. of cars
Public Parking Lots Roadside parking spaces
Parking Lots Building and House shortage
CO NOx SO2 PM10 VOCs
Others
Industry
Commercial
& Housing Energy
Generation Mobile
MINISTRY OF CONSTRUCTION & TRANSPORTATION
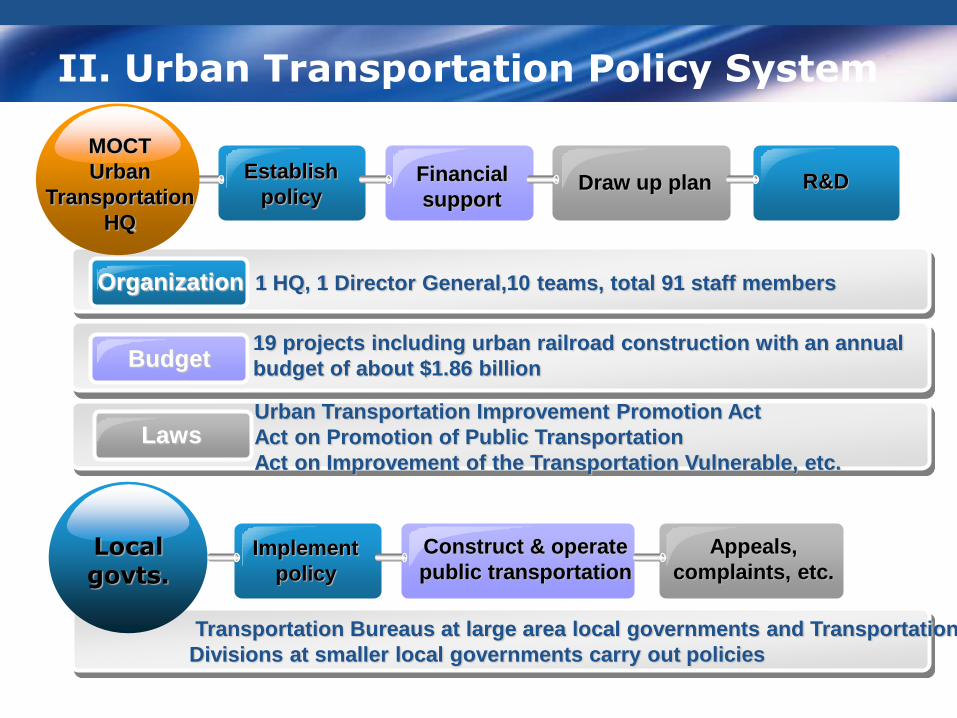
Organization
Budget
Laws
1 HQ, 1 Director General,10 teams, total 91 staff members
19 projects including urban railroad construction with an annual
budget of about $1.86 billion
Urban Transportation Improvement Promotion Act
Act on Promotion of Public Transportation
Act on Improvement of the Transportation Vulnerable, etc.
Transportation Bureaus at large area local governments and Transportation
Divisions at smaller local governments carry out policies
Establish
policy Financial
support Draw up plan R&D
MOCT
Urban
Transportation
HQ
Local govts.
Implement
policy
Appeals,
complaints, etc.
Construct & operate
public transportation
II. Urban Transportation Policy System
MINISTRY OF CONSTRUCTION & TRANSPORTATION
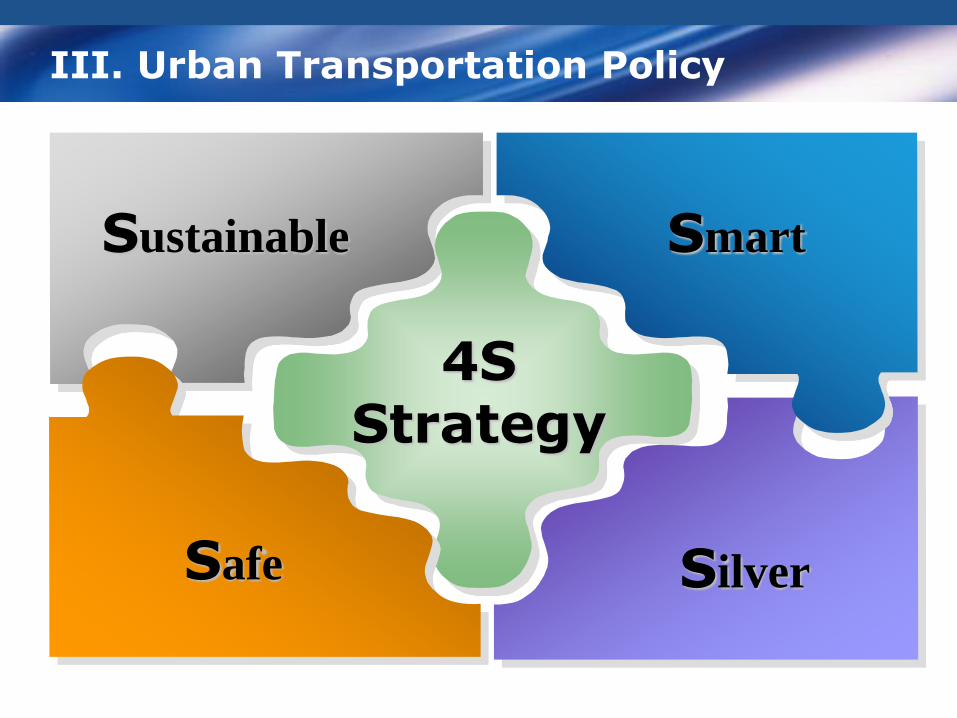
III. Urban Transportation Policy
Sustainable
Safe Silver
Smart
4S Strategy
MINISTRY OF CONSTRUCTION & TRANSPORTATION
1. Sustainable Urban Transportation
Promotion of the Public Transportation
Transportation Demand Management
Green Transportation
MINISTRY OF CONSTRUCTION & TRANSPORTATION
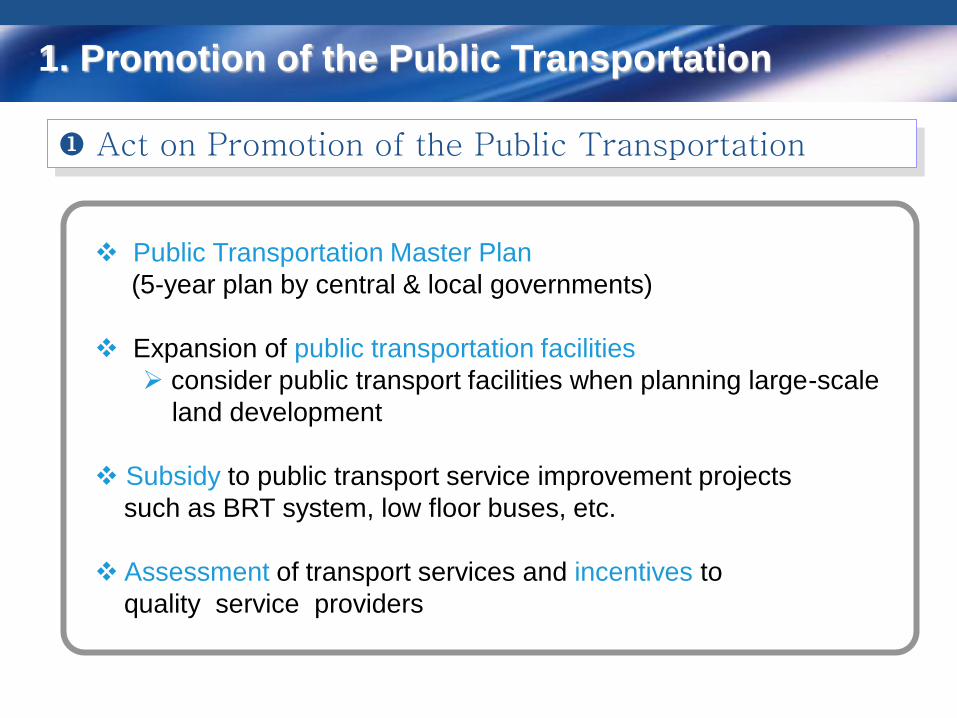
Act on Promotion of the Public Transportation
1. Promotion of the Public Transportation
Public Transportation Master Plan
(5-year plan by central & local governments)
Expansion of public transportation facilities
consider public transport facilities when planning large-scale
land development
Subsidy to public transport service improvement projects
such as BRT system, low floor buses, etc.
Assessment of transport services and incentives to
quality service providers
MINISTRY OF CONSTRUCTION & TRANSPORTATION
Nation’s long-term blueprint for public transportation
is an administration plan for public transportation-oriented
transportation system in the urban area
is guidelines and directions for local government’s public
transportation policies
Goals
is to provide mobility and access to be safely and conveniently
is to promote public transportation use to reduce traffic
congestion, air pollution, and energy consumption
Public Transportation Master Plan
MINISTRY OF CONSTRUCTION & TRANSPORTATION
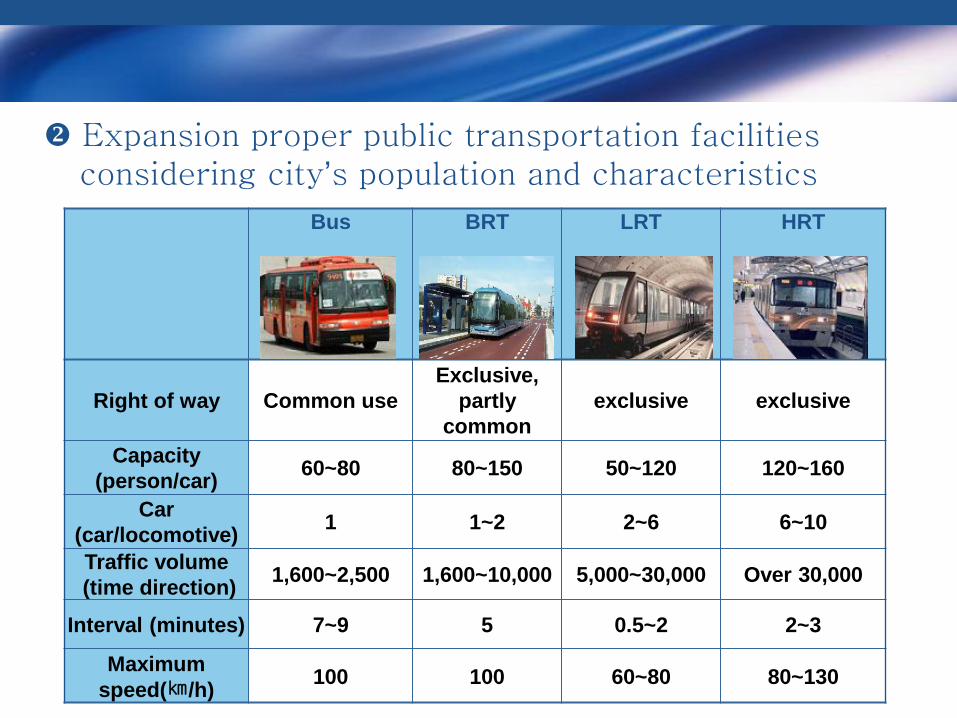
Expansion proper public transportation facilities considering city’s population and characteristics
Bus BRT LRT HRT
Right of way Common use
Exclusive,
partly
common
exclusive exclusive
Capacity
(person/car) 60~80 80~150 50~120 120~160
Car
(car/locomotive) 1 1~2 2~6 6~10
Traffic volume
(time direction) 1,600~2,500 1,600~10,000 5,000~30,000 Over 30,000
Interval (minutes) 7~9 5 0.5~2 2~3
Maximum
speed(㎞/h) 100 100 60~80 80~130
MINISTRY OF CONSTRUCTION & TRANSPORTATION
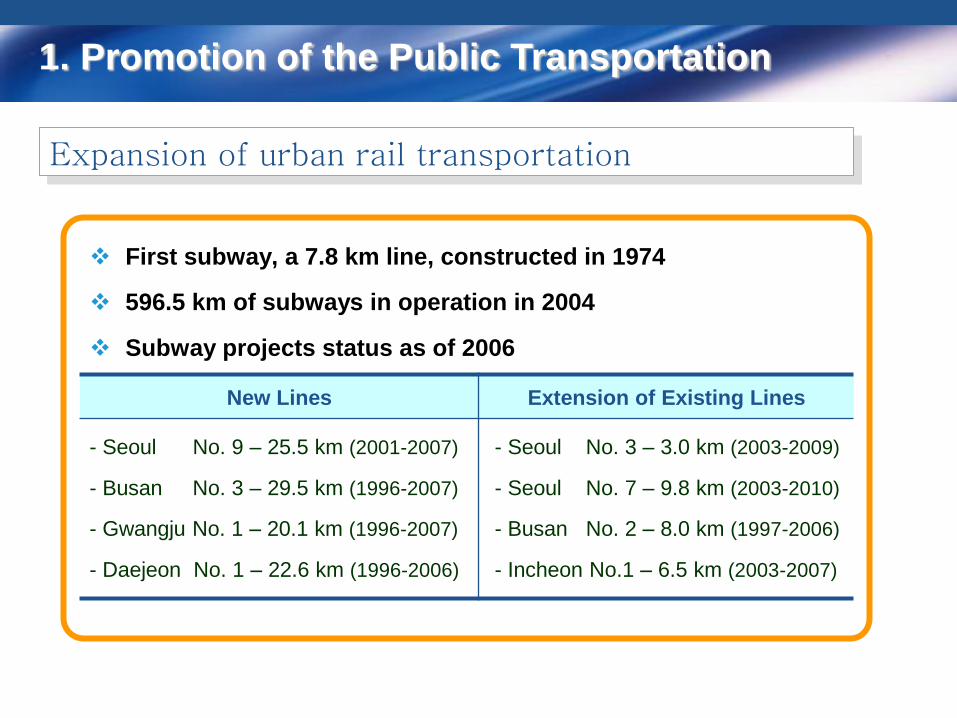
First subway, a 7.8 km line, constructed in 1974
596.5 km of subways in operation in 2004
Subway projects status as of 2006
Expansion of urban rail transportation
1. Promotion of the Public Transportation
New Lines Extension of Existing Lines
- Seoul No. 9 – 25.5 km (2001-2007)
- Busan No. 3 – 29.5 km (1996-2007)
- Gwangju No. 1 – 20.1 km (1996-2007)
- Daejeon No. 1 – 22.6 km (1996-2006)
- Seoul No. 3 – 3.0 km (2003-2009)
- Seoul No. 7 – 9.8 km (2003-2010)
- Busan No. 2 – 8.0 km (1997-2006)
- Incheon No.1 – 6.5 km (2003-2007)
MINISTRY OF CONSTRUCTION & TRANSPORTATION
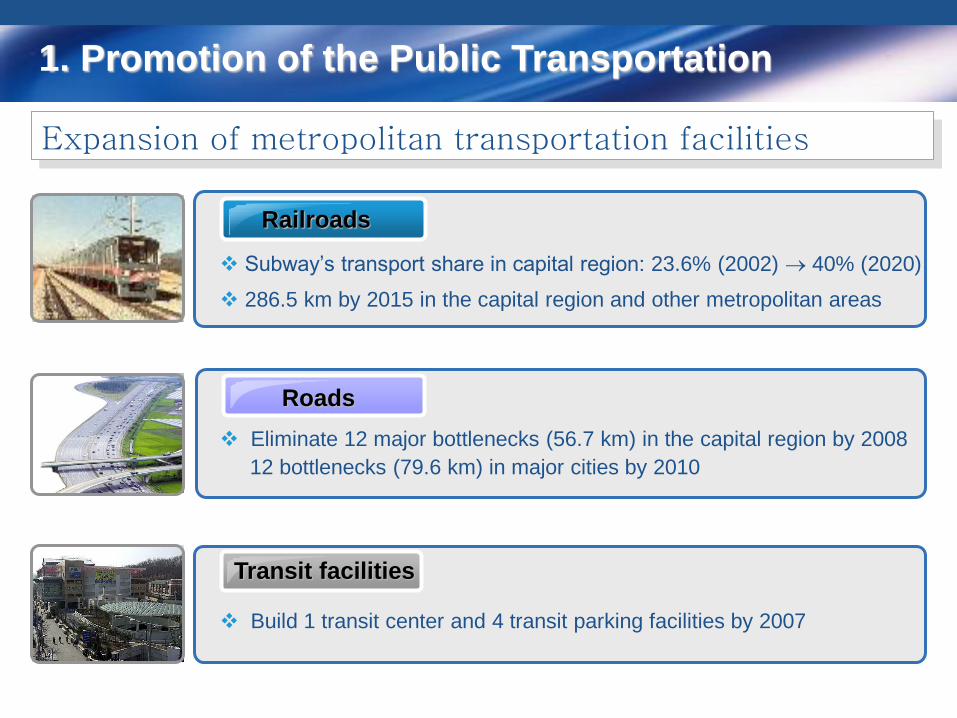
Subway’s transport share in capital region: 23.6% (2002) 40% (2020)
286.5 km by 2015 in the capital region and other metropolitan areas
Railroads
Eliminate 12 major bottlenecks (56.7 km) in the capital region by 2008
12 bottlenecks (79.6 km) in major cities by 2010
Roads
Build 1 transit center and 4 transit parking facilities by 2007
Transit facilities
Expansion of metropolitan transportation facilities
1. Promotion of the Public Transportation
MINISTRY OF CONSTRUCTION & TRANSPORTATION
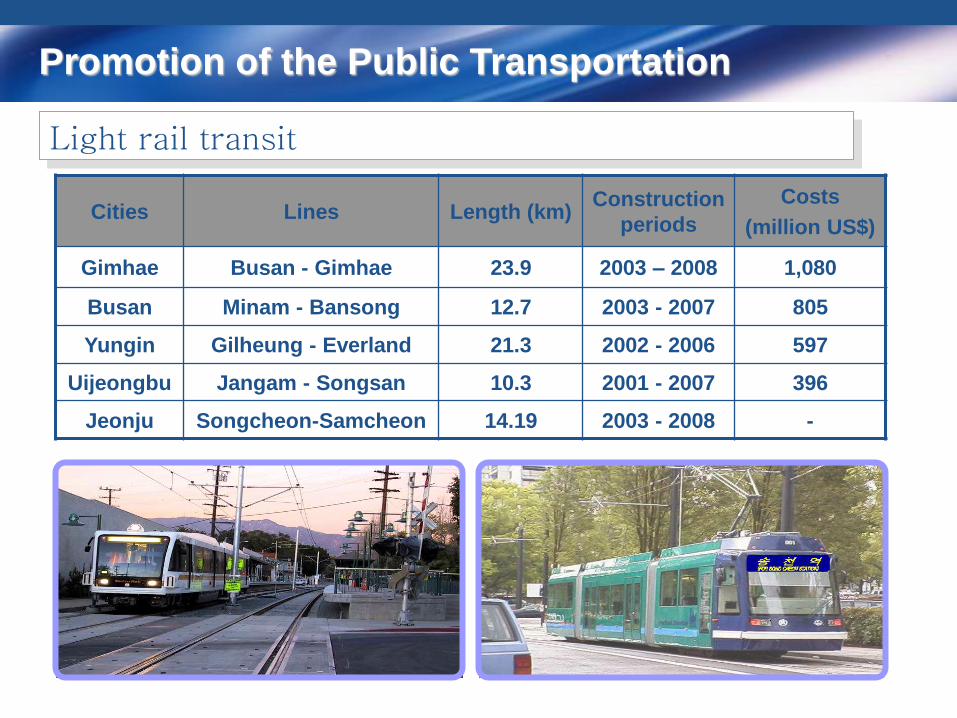
Light rail transit
Promotion of the Public Transportation
Cities Lines Length (km) Construction
periods
Costs
(million US$)
Gimhae Busan - Gimhae 23.9 2003 – 2008 1,080
Busan Minam - Bansong 12.7 2003 - 2007 805
Yungin Gilheung - Everland 21.3 2002 - 2006 597
Uijeongbu Jangam - Songsan 10.3 2001 - 2007 396
Jeonju Songcheon-Samcheon 14.19 2003 - 2008 -
MINISTRY OF CONSTRUCTION & TRANSPORTATION
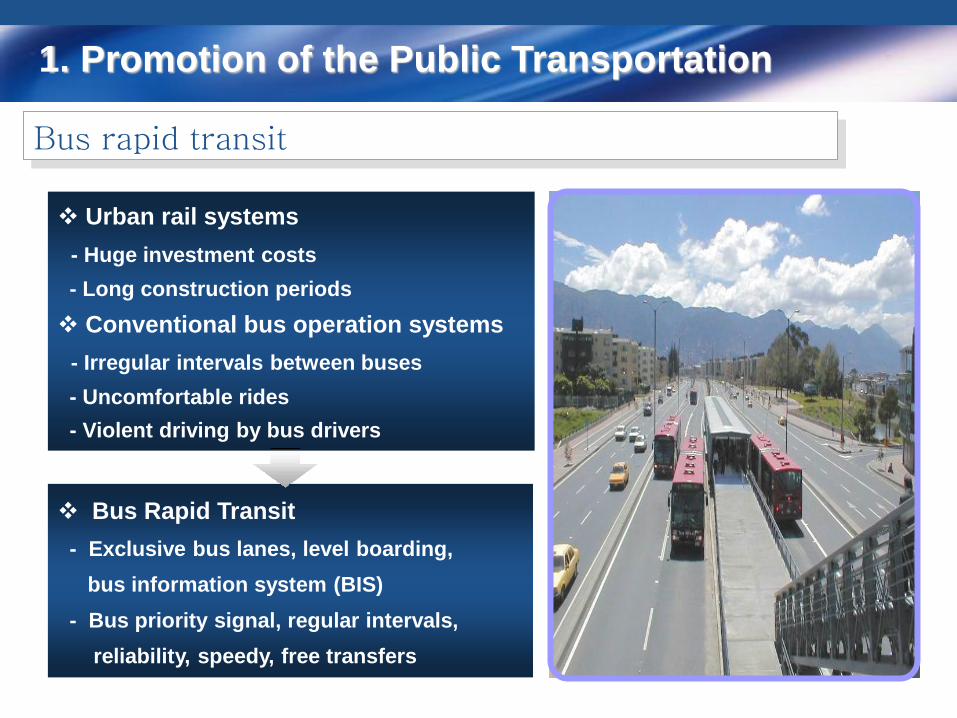
Urban rail systems
- Huge investment costs
- Long construction periods
Conventional bus operation systems
- Irregular intervals between buses
- Uncomfortable rides
- Violent driving by bus drivers
Bus Rapid Transit
- Exclusive bus lanes, level boarding,
bus information system (BIS)
- Bus priority signal, regular intervals,
reliability, speedy, free transfers
Bus rapid transit
1. Promotion of the Public Transportation
MINISTRY OF CONSTRUCTION & TRANSPORTATION
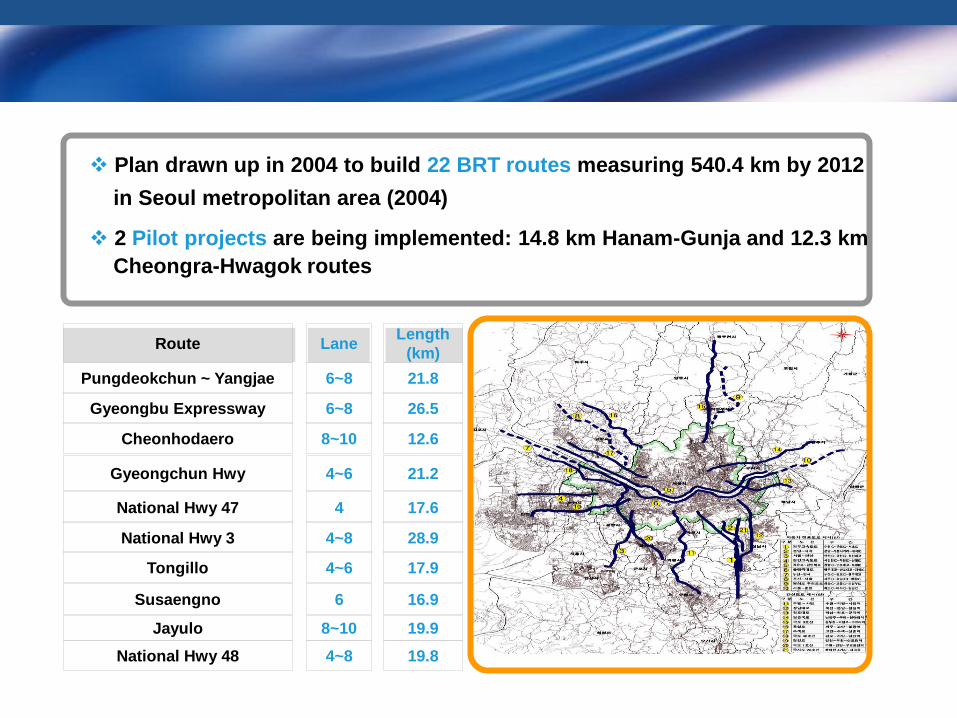
Plan drawn up in 2004 to build 22 BRT routes measuring 540.4 km by 2012
in Seoul metropolitan area (2004)
2 Pilot projects are being implemented: 14.8 km Hanam-Gunja and 12.3 km
Cheongra-Hwagok routes
Route Lane Length
(km)
Pungdeokchun ~ Yangjae 6~8 21.8
Gyeongbu Expressway 6~8 26.5
Cheonhodaero 8~10 12.6
Gyeongchun Hwy 4~6 21.2
National Hwy 47 4 17.6
National Hwy 3 4~8 28.9
Tongillo 4~6 17.9
Susaengno 6 16.9
Jayulo 8~10 19.9
National Hwy 48 4~8 19.8
MINISTRY OF CONSTRUCTION & TRANSPORTATION
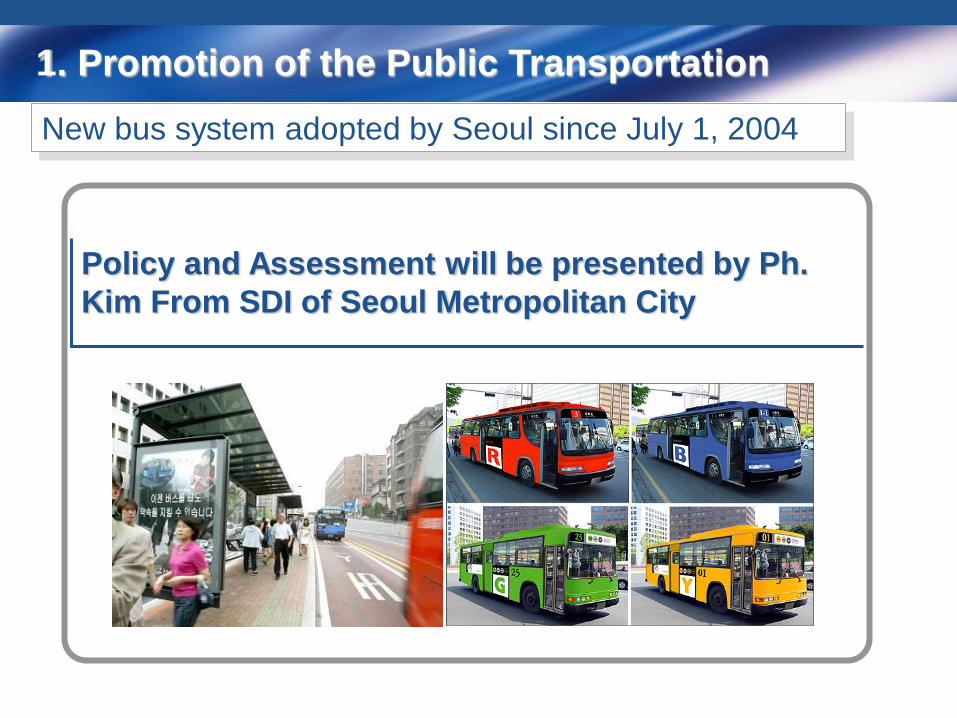
New bus system adopted by Seoul since July 1, 2004
1. Promotion of the Public Transportation
Policy and Assessment will be presented by Ph.
Kim From SDI of Seoul Metropolitan City

MINISTRY OF CONSTRUCTION & TRANSPORTATION
2. Transportation Demand Management
Congestion pricing
Present status
Congestion toll (about $2) charged at Namsan Tunnels 1 and 3
in Seoul since 1996
Buses, taxis and HOVs are exempted from the charge
0
10
20
30
40
50
'96 '98 '00 '02 '03
collected amount
(million US$)
speeds of cars
(km/h)

MINISTRY OF CONSTRUCTION & TRANSPORTATION
2. Transportation Demand Management
Traffic Impact Assessment (TIA)
TIA minimizes side effects caused by developments of large-
scale projects and construction of big facilities
TIA Committee proposes the extension of road or other
alternatives to the developer to mitigate traffic impact
Cases for TIA
500
800
1100
1400
'00 '01 '02 '03 '04
MINISTRY OF CONSTRUCTION & TRANSPORTATION
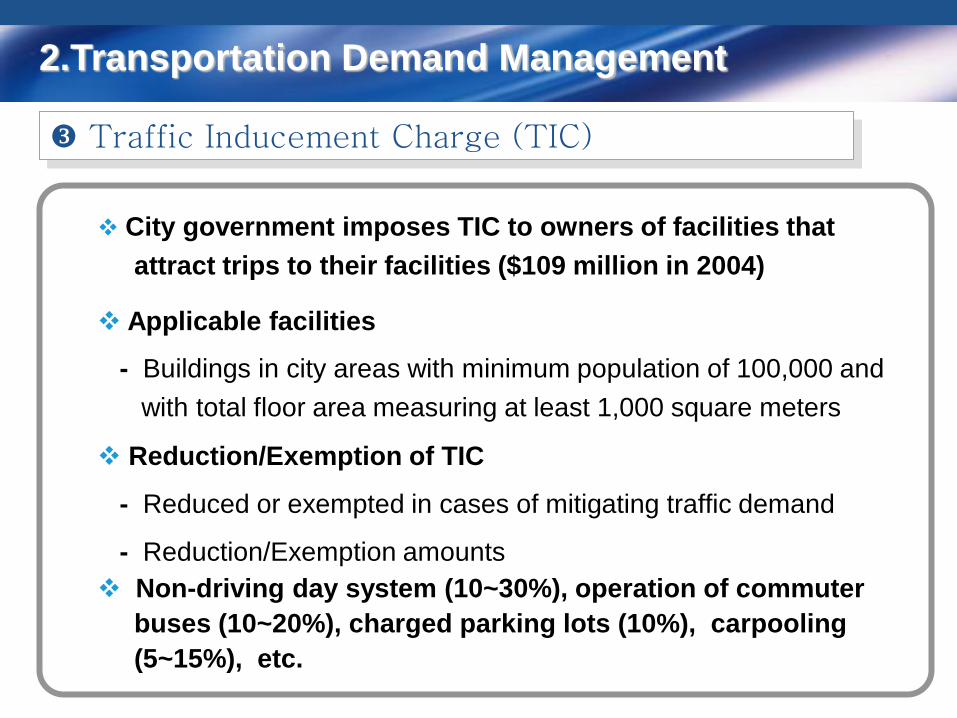
2.Transportation Demand Management
Traffic Inducement Charge (TIC)
City government imposes TIC to owners of facilities that
attract trips to their facilities ($109 million in 2004)
Applicable facilities
- Buildings in city areas with minimum population of 100,000 and
with total floor area measuring at least 1,000 square meters
Reduction/Exemption of TIC
- Reduced or exempted in cases of mitigating traffic demand
- Reduction/Exemption amounts
Non-driving day system (10~30%), operation of commuter
buses (10~20%), charged parking lots (10%), carpooling
(5~15%), etc.
MINISTRY OF CONSTRUCTION & TRANSPORTATION
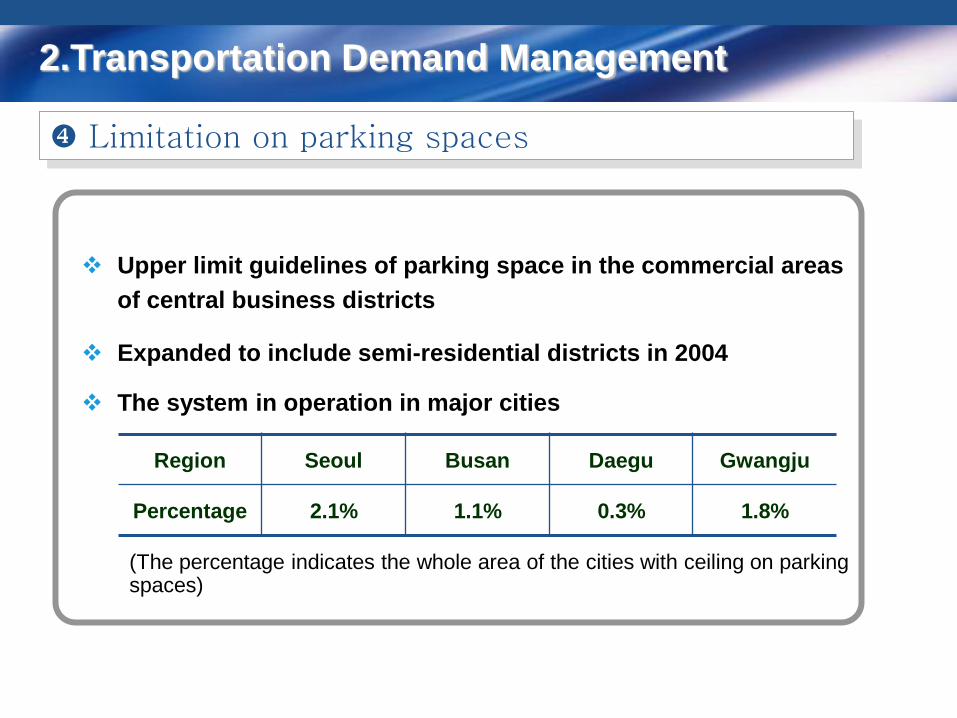
Upper limit guidelines of parking space in the commercial areas
of central business districts
Expanded to include semi-residential districts in 2004
The system in operation in major cities
2.Transportation Demand Management
Limitation on parking spaces
Present status
Region Seoul Busan Daegu Gwangju
Percentage 2.1% 1.1% 0.3% 1.8%
(The percentage indicates the whole area of the cities with ceiling on parking spaces)

MINISTRY OF CONSTRUCTION & TRANSPORTATION
27 car-free streets exist in 9 cities
Each local government is expected to have at least one car-
free street.
Extension of car-free streets
3. Green Transportation
Bicycle-Use Facilitation Act enacted in 1995
5,684 km of bicycle roads, 249,000 bicycle racks in 2005
10,000 km of bicycle roads, one million bicycle racks by 2010
Extension of bicycle facilities
MINISTRY OF CONSTRUCTION & TRANSPORTATION
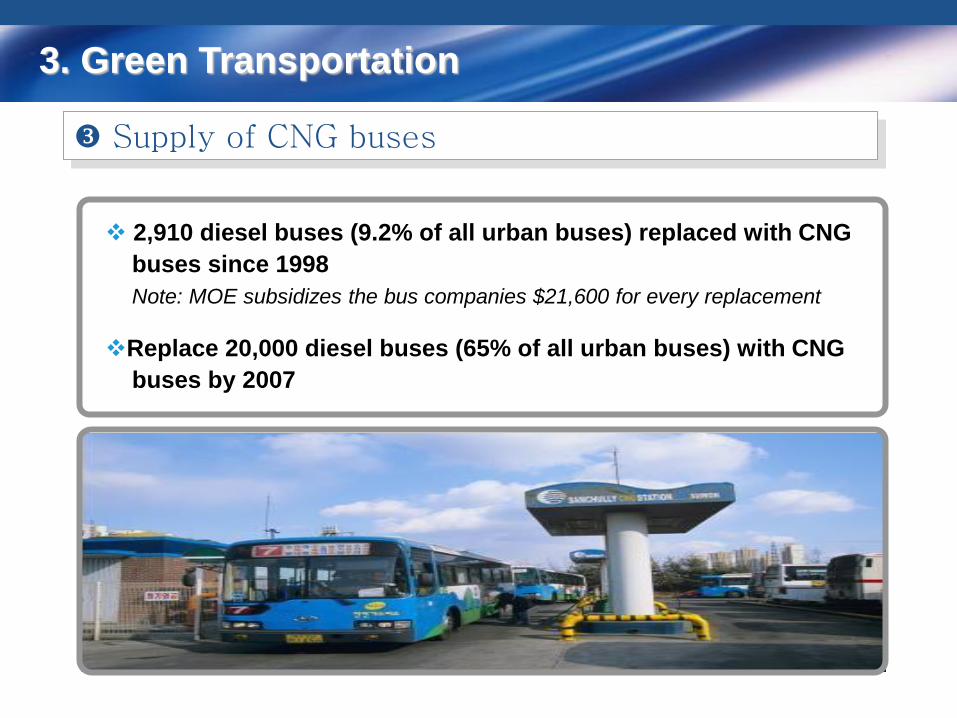
Supply of CNG buses
3. Green Transportation
2,910 diesel buses (9.2% of all urban buses) replaced with CNG
buses since 1998
Note: MOE subsidizes the bus companies $21,600 for every replacement
Replace 20,000 diesel buses (65% of all urban buses) with CNG
buses by 2007

MINISTRY OF CONSTRUCTION & TRANSPORTATION
2. Smart Urban Transportation
Transportation Smart Cards (TSC)
Intelligent Transportation System
Bus Information System
Ubiquitous Transportation Information
MINISTRY OF CONSTRUCTION & TRANSPORTATION
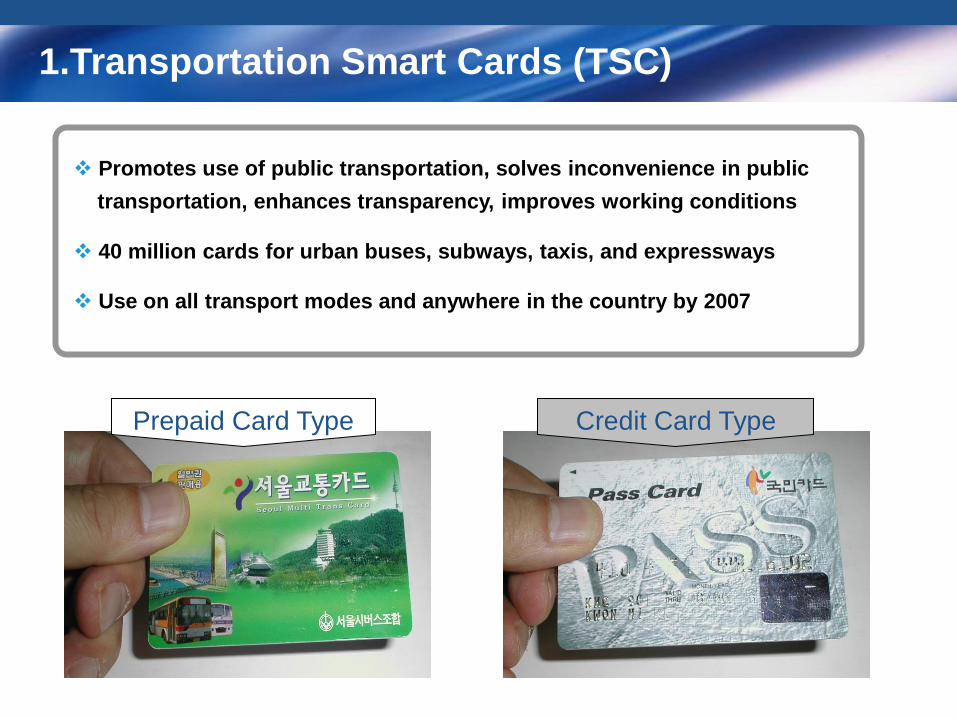
Prepaid Card Type Credit Card Type
1.Transportation Smart Cards (TSC)
Promotes use of public transportation, solves inconvenience in public
transportation, enhances transparency, improves working conditions
40 million cards for urban buses, subways, taxis, and expressways
Use on all transport modes and anywhere in the country by 2007
MINISTRY OF CONSTRUCTION & TRANSPORTATION
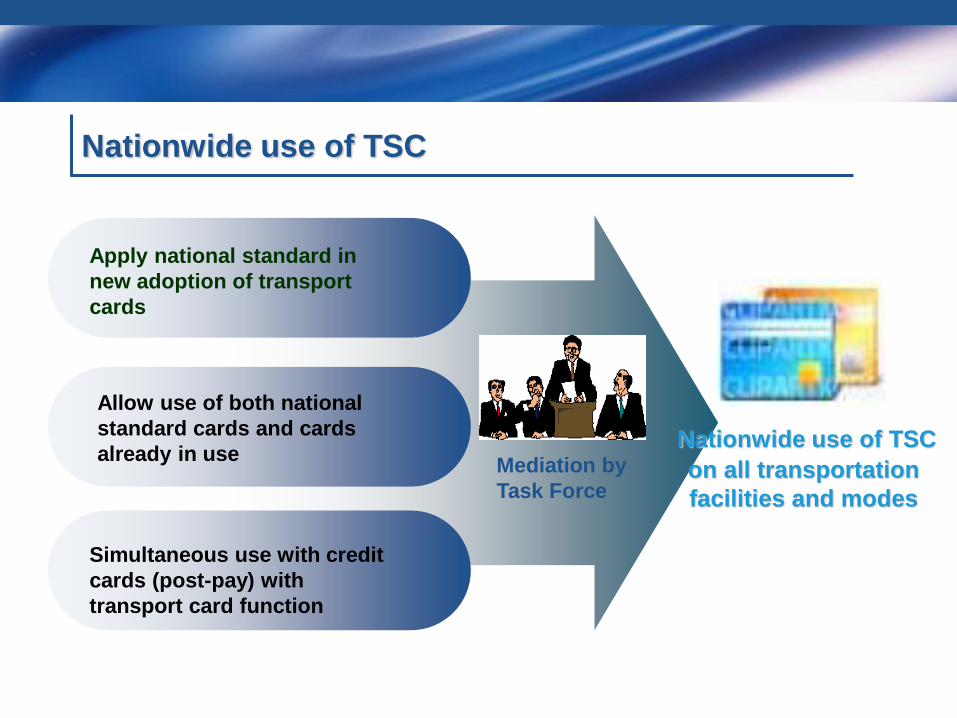
Apply national standard in
new adoption of transport
cards
Allow use of both national
standard cards and cards
already in use
Simultaneous use with credit
cards (post-pay) with
transport card function
Nationwide use of TSC
on all transportation
facilities and modes
Mediation by
Task Force
Nationwide use of TSC
MINISTRY OF CONSTRUCTION & TRANSPORTATION
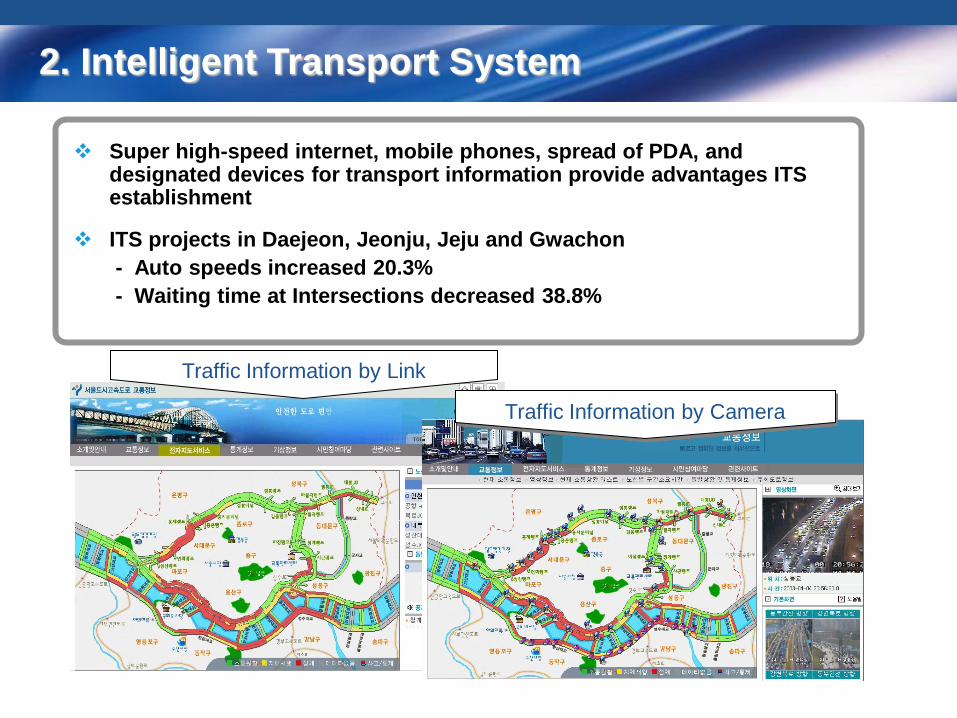
Super high-speed internet, mobile phones, spread of PDA, and designated devices for transport information provide advantages ITS establishment
ITS projects in Daejeon, Jeonju, Jeju and Gwachon
- Auto speeds increased 20.3%
- Waiting time at Intersections decreased 38.8%
2. Intelligent Transport System
Traffic Information by Link
Traffic Information by Camera
MINISTRY OF CONSTRUCTION & TRANSPORTATION
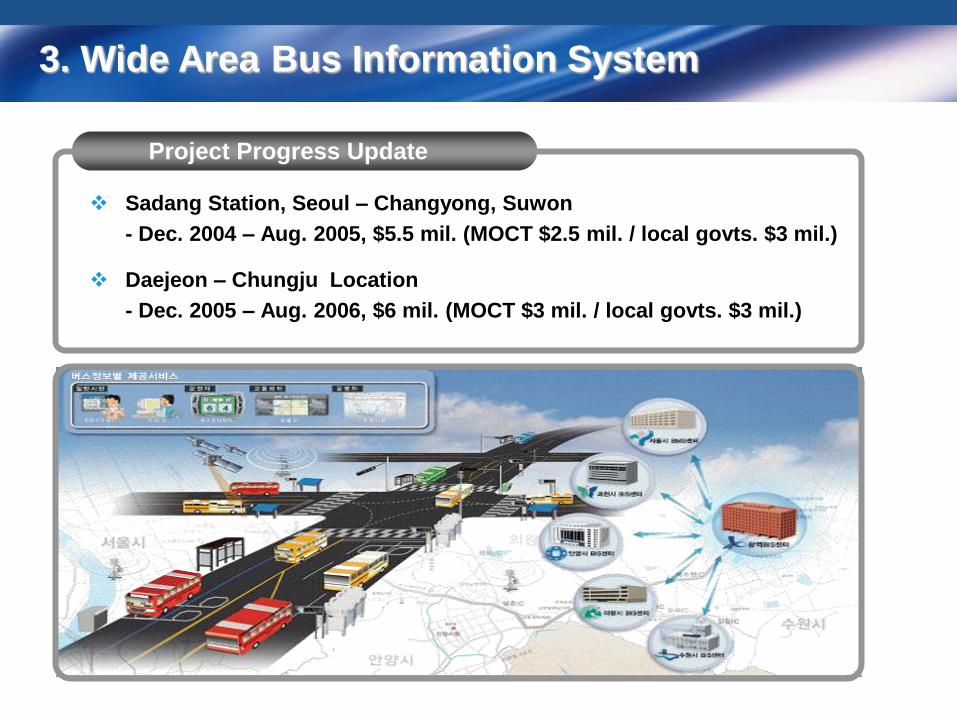
3. Wide Area Bus Information System
Sadang Station, Seoul – Changyong, Suwon
- Dec. 2004 – Aug. 2005, $5.5 mil. (MOCT $2.5 mil. / local govts. $3 mil.)
Daejeon – Chungju Location
- Dec. 2005 – Aug. 2006, $6 mil. (MOCT $3 mil. / local govts. $3 mil.)
Project Progress Update
MINISTRY OF CONSTRUCTION & TRANSPORTATION
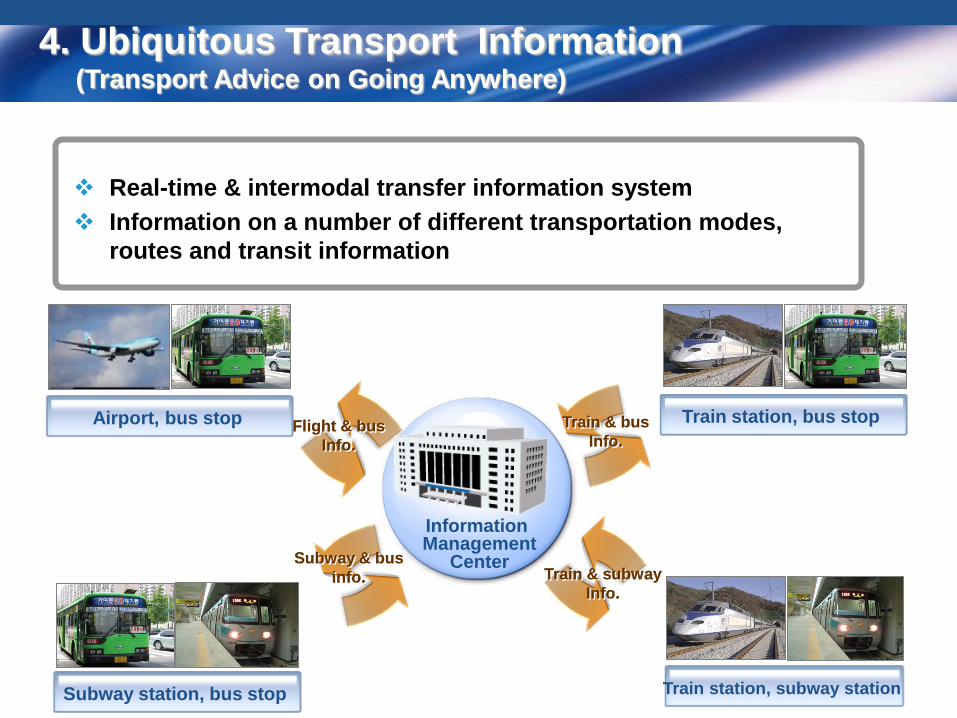
4. Ubiquitous Transport Information (Transport Advice on Going Anywhere)
Real-time & intermodal transfer information system
Information on a number of different transportation modes,
routes and transit information
Train station, bus stop
Subway station, bus stop Train station, subway station
Train & subway
Info.
Subway & bus
info.
Information Management
Center
Airport, bus stop Flight & bus
Info.
Train & bus
Info.
Train station, bus stop
Subway station, bus stop Train station, subway station
Train & subway
Info.
Subway & bus
info.
Information Management
Center
Airport, bus stop Flight & bus
Info.
Train & bus
Info.
MINISTRY OF CONSTRUCTION & TRANSPORTATION
3. Safe Urban Transport
Transportation Safety Act
Transportation Safety Measures
MINISTRY OF CONSTRUCTION & TRANSPORTATION
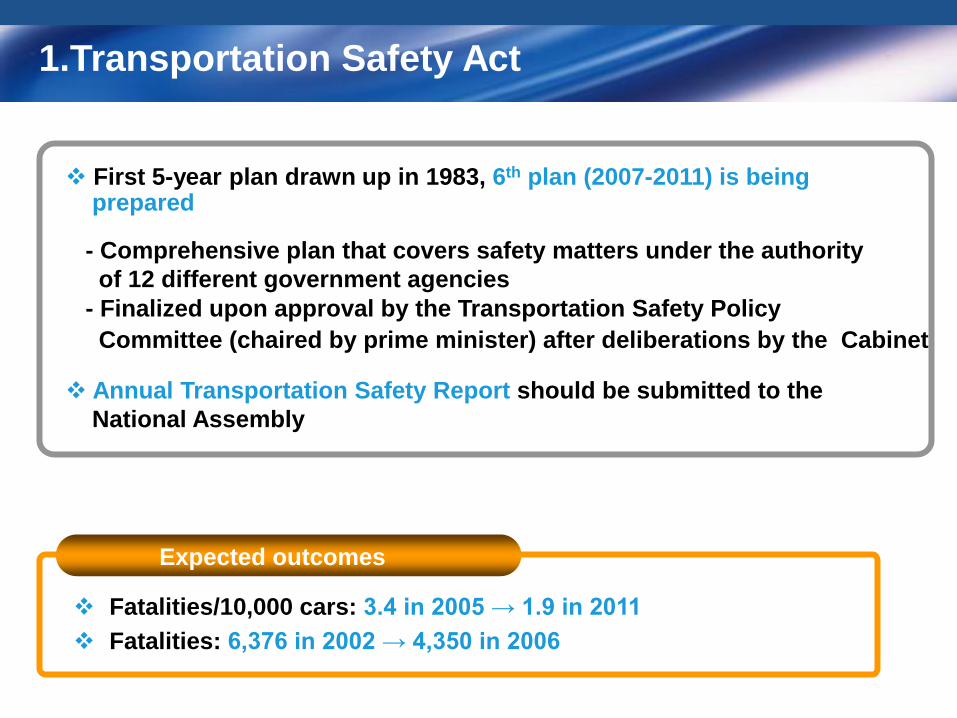
1.Transportation Safety Act
First 5-year plan drawn up in 1983, 6th plan (2007-2011) is being prepared
- Comprehensive plan that covers safety matters under the authority
of 12 different government agencies
- Finalized upon approval by the Transportation Safety Policy
Committee (chaired by prime minister) after deliberations by the Cabinet
Annual Transportation Safety Report should be submitted to the
National Assembly
Fatalities/10,000 cars: 3.4 in 2005 → 1.9 in 2011
Fatalities: 6,376 in 2002 → 4,350 in 2006
Expected outcomes
MINISTRY OF CONSTRUCTION & TRANSPORTATION
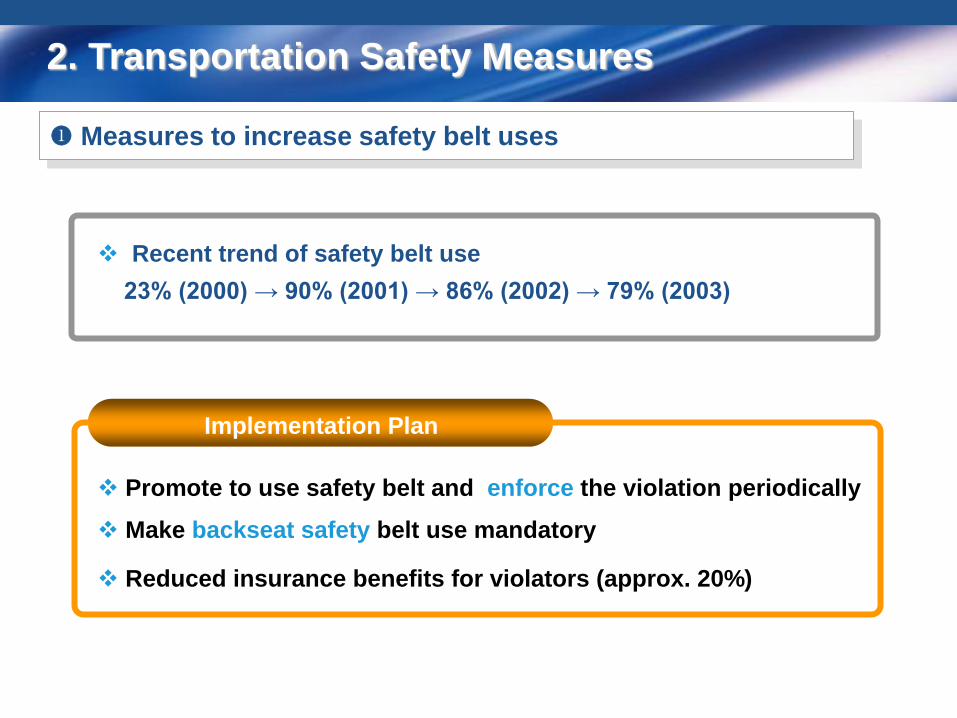
2. Transportation Safety Measures
Measures to increase safety belt uses
Recent trend of safety belt use
23% (2000) → 90% (2001) → 86% (2002) → 79% (2003)
Promote to use safety belt and enforce the violation periodically
Make backseat safety belt use mandatory
Reduced insurance benefits for violators (approx. 20%)
Implementation Plan
MINISTRY OF CONSTRUCTION & TRANSPORTATION
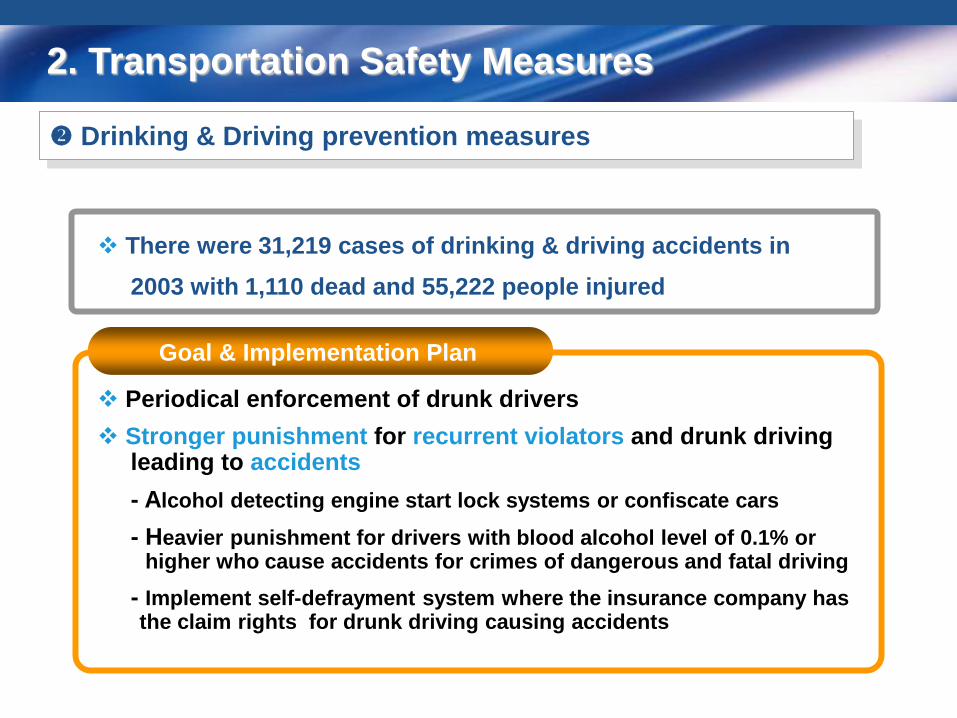
2. Transportation Safety Measures
Drinking & Driving prevention measures
There were 31,219 cases of drinking & driving accidents in
2003 with 1,110 dead and 55,222 people injured
Periodical enforcement of drunk drivers
Stronger punishment for recurrent violators and drunk driving leading to accidents
- Alcohol detecting engine start lock systems or confiscate cars
- Heavier punishment for drivers with blood alcohol level of 0.1% or higher who cause accidents for crimes of dangerous and fatal driving
- Implement self-defrayment system where the insurance company has the claim rights for drunk driving causing accidents
Goal & Implementation Plan
MINISTRY OF CONSTRUCTION & TRANSPORTATION
IV. Silver Urban Transport
Act on Promoting Mobility for
the Transportation Vulnerable
Expanding Convenience Facilities

MINISTRY OF CONSTRUCTION & TRANSPORTATION
1. Act on Promoting Mobility for the Transportation Vulnerable
Blueprint of the act
Legislated in January 2005
Mandatory requirement of mobility facilitating installations and stricter
regulations
Creating pleasant pedestrian environment including the designation
of pedestrian priority zones
MINISTRY OF CONSTRUCTION & TRANSPORTATION
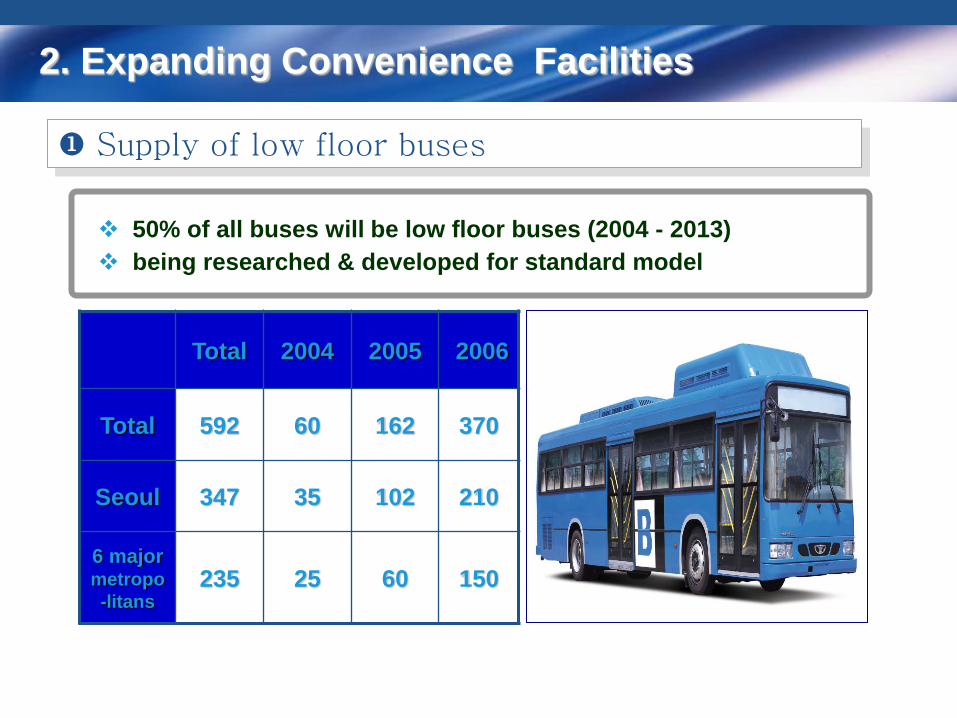
Total 2004 2005 2006
Total 592 60 162 370
Seoul 347 35 102 210
6 major metropo
-litans 235 25 60 150
2. Expanding Convenience Facilities
50% of all buses will be low floor buses (2004 - 2013)
being researched & developed for standard model
Supply of low floor buses
MINISTRY OF CONSTRUCTION & TRANSPORTATION
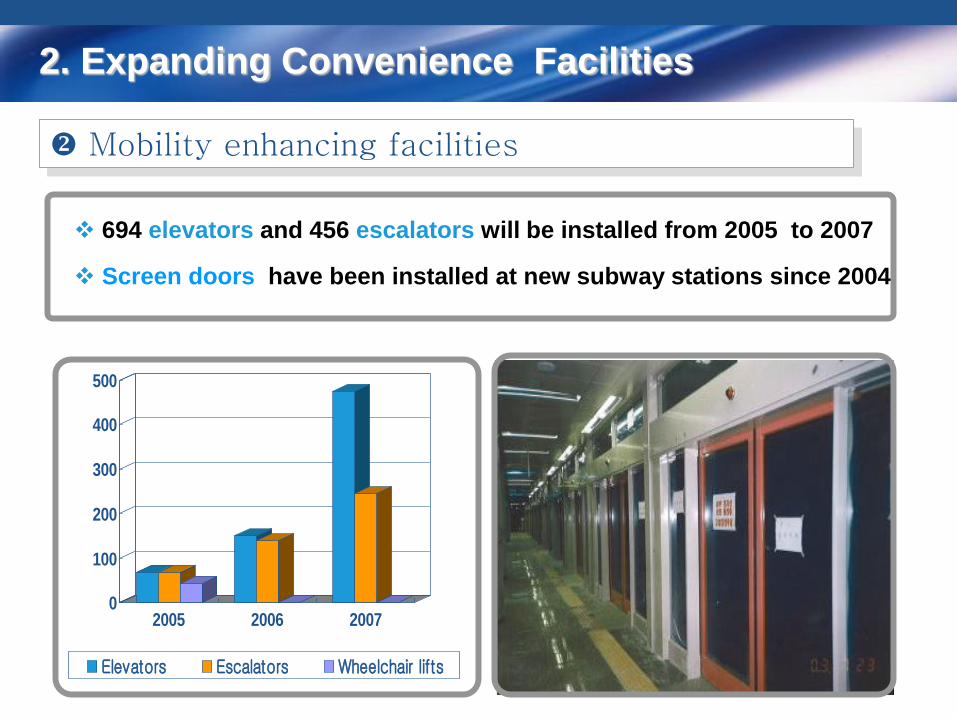
0
100
200
300
400
500
2005 2006 2007
Elevators Escalators Wheelchair lifts
694 elevators and 456 escalators will be installed from 2005 to 2007
Screen doors have been installed at new subway stations since 2004
Mobility enhancing facilities
2. Expanding Convenience Facilities
The 2th Meeting of the Regional EST Forum in Asia
Urban Transport Division Ministry of Construction and Transportation
Republic of Korea