urban heat island in southern europe: the case study of hania, crete
TRANSCRIPT
Available online at www.sciencedirect.com
www.elsevier.com/locate/solener
Solar Energy 83 (2009) 1871–1883
Urban heat island in southern Europe: The case study of Hania, Crete
D. Kolokotsa *, A. Psomas, E. Karapidakis
Technological Educational Institute of Crete, Department of Natural Resources and Environment, 3 Romanou Str., 73133 Hania, Crete, Greece
Received 31 March 2009; received in revised form 24 June 2009; accepted 25 June 2009Available online 23 July 2009
Communicated by: Associate Editor Matheos Santamouris
Abstract
The aim of the present paper is to analyze the results of the urban heat island research for a coastal densely built small Mediterraneantown namely Hania, Crete, Greece. The specific research targets to verify the existence, the intensity, the size and the form of the urbanheat island phenomenon in the specific region as well as to understand its correlation with the local weather conditions. Nine urban andthree rural meteorological stations are used for this study. Temperature and relative humidity measurements are collected from May 26,2007 until October 24, 2007. In parallel, meteorological data including wind speed and direction, barometric pressure, sunlight and pre-cipitation for the specific region are collected and elaborated for cross-correlation with the appearance of the urban heat island (UHI)phenomenon. During summer period, where the temperature is high, the UHI takes its maximum intensity, of about 8 �C. Also, the formof the UHI is strongly influenced from the wind speed and direction. The northern winds expand the UHI front, while the western windscontribute to the UHI reduction. Finally the Discomfort Index (DI) is calculated for the 2007 summer period to indicate the outdoorliving conditions.� 2009 Elsevier Ltd. All rights reserved.
Keywords: Urban heat island; Urban discomfort; Heat stress; Coastal area
1. Introduction
Urban settlements are the most important human habi-tat. Approximately 50–60% of the world population lives incities and towns. The second half of the last century was aperiod of the more intensive urbanisation that earth hasnever experienced. In fact, urban population has increasedfrom 160 millions to about 3 billions in just 100 years, andit is expected to increase to about 5 billion by 2025. Thequality of urban agglomerations is mainly defined bythe type and the strength of the anthropogenic activities,the existing infrastructures and the used resources, thegenerated wastes and emissions and the correspondingenvironmental impact (Hardy et al., 2001).
0038-092X/$ - see front matter � 2009 Elsevier Ltd. All rights reserved.
doi:10.1016/j.solener.2009.06.018
* Corresponding author. Fax: +30 2821023003.E-mail address: [email protected] (D. Kolokotsa).
Cities are often warmer than their unbuilt surroundings(Landsberg, 1981; Oke, 1982). This phenomenon which isgoverned by significant differences between the energy bud-gets of cities and the countryside is called the urban heatisland phenomenon (Crutzen, 2004). Significant researchefforts have been performed to evaluate the urban heatisland phenomenon’s impact on the urban environment(Akbari et al., 1999; Mihalakakou et al., 2000; Santamou-ris, 2001; Santamouris et al., 2007a; Alcoforado and And-rade, 2006; Kolokotroni et al., 2006; Kolokotroni andGiridharan, 2008). The heat island studies on Europeanlevel during the last 15 years are summarised by Santamou-ris, 2007. Based on this study, the quantification of urbanheat island phenomenon in Europe is analysed using thefollowing tools:
Statistics of temperature differences between pairs orgroups of urban and rural stations.Results obtained by networks of fixed stations in a city.Mobile stations across urban areas.
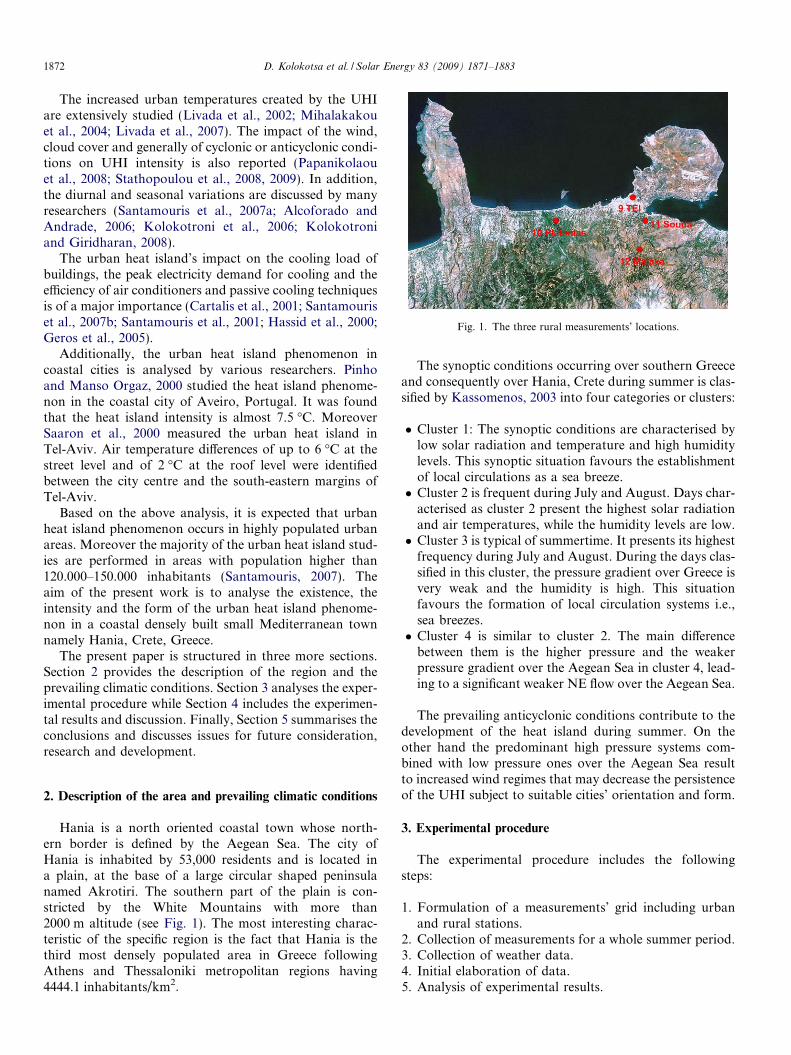
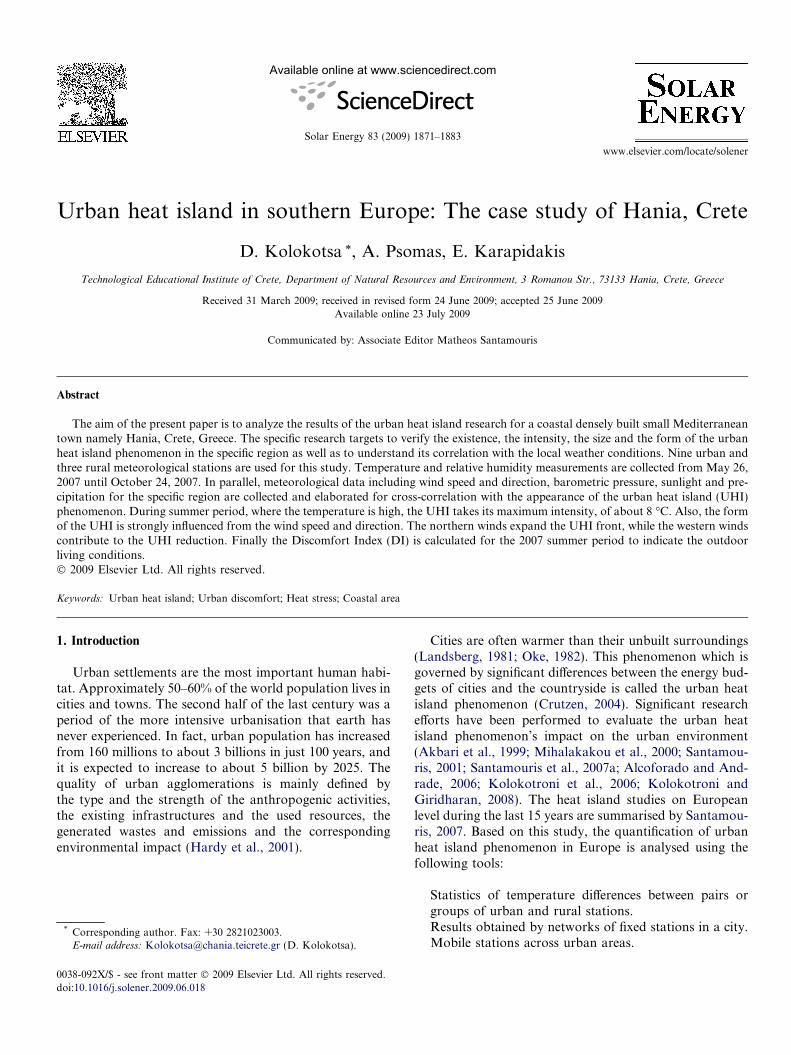
Fig. 1. The three rural measurements’ locations.
1872 D. Kolokotsa et al. / Solar Energy 83 (2009) 1871–1883
The increased urban temperatures created by the UHIare extensively studied (Livada et al., 2002; Mihalakakouet al., 2004; Livada et al., 2007). The impact of the wind,cloud cover and generally of cyclonic or anticyclonic condi-tions on UHI intensity is also reported (Papanikolaouet al., 2008; Stathopoulou et al., 2008, 2009). In addition,the diurnal and seasonal variations are discussed by manyresearchers (Santamouris et al., 2007a; Alcoforado andAndrade, 2006; Kolokotroni et al., 2006; Kolokotroniand Giridharan, 2008).
The urban heat island’s impact on the cooling load ofbuildings, the peak electricity demand for cooling and theefficiency of air conditioners and passive cooling techniquesis of a major importance (Cartalis et al., 2001; Santamouriset al., 2007b; Santamouris et al., 2001; Hassid et al., 2000;Geros et al., 2005).
Additionally, the urban heat island phenomenon incoastal cities is analysed by various researchers. Pinhoand Manso Orgaz, 2000 studied the heat island phenome-non in the coastal city of Aveiro, Portugal. It was foundthat the heat island intensity is almost 7.5 �C. MoreoverSaaron et al., 2000 measured the urban heat island inTel-Aviv. Air temperature differences of up to 6 �C at thestreet level and of 2 �C at the roof level were identifiedbetween the city centre and the south-eastern margins ofTel-Aviv.
Based on the above analysis, it is expected that urbanheat island phenomenon occurs in highly populated urbanareas. Moreover the majority of the urban heat island stud-ies are performed in areas with population higher than120.000–150.000 inhabitants (Santamouris, 2007). Theaim of the present work is to analyse the existence, theintensity and the form of the urban heat island phenome-non in a coastal densely built small Mediterranean townnamely Hania, Crete, Greece.
The present paper is structured in three more sections.Section 2 provides the description of the region and theprevailing climatic conditions. Section 3 analyses the exper-imental procedure while Section 4 includes the experimen-tal results and discussion. Finally, Section 5 summarises theconclusions and discusses issues for future consideration,research and development.
2. Description of the area and prevailing climatic conditions
Hania is a north oriented coastal town whose north-ern border is defined by the Aegean Sea. The city ofHania is inhabited by 53,000 residents and is located ina plain, at the base of a large circular shaped peninsulanamed Akrotiri. The southern part of the plain is con-stricted by the White Mountains with more than2000 m altitude (see Fig. 1). The most interesting charac-teristic of the specific region is the fact that Hania is thethird most densely populated area in Greece followingAthens and Thessaloniki metropolitan regions having4444.1 inhabitants/km2.
The synoptic conditions occurring over southern Greeceand consequently over Hania, Crete during summer is clas-sified by Kassomenos, 2003 into four categories or clusters:
� Cluster 1: The synoptic conditions are characterised bylow solar radiation and temperature and high humiditylevels. This synoptic situation favours the establishmentof local circulations as a sea breeze.� Cluster 2 is frequent during July and August. Days char-
acterised as cluster 2 present the highest solar radiationand air temperatures, while the humidity levels are low.� Cluster 3 is typical of summertime. It presents its highest
frequency during July and August. During the days clas-sified in this cluster, the pressure gradient over Greece isvery weak and the humidity is high. This situationfavours the formation of local circulation systems i.e.,sea breezes.� Cluster 4 is similar to cluster 2. The main difference
between them is the higher pressure and the weakerpressure gradient over the Aegean Sea in cluster 4, lead-ing to a significant weaker NE flow over the Aegean Sea.
The prevailing anticyclonic conditions contribute to thedevelopment of the heat island during summer. On theother hand the predominant high pressure systems com-bined with low pressure ones over the Aegean Sea resultto increased wind regimes that may decrease the persistenceof the UHI subject to suitable cities’ orientation and form.
3. Experimental procedure
The experimental procedure includes the followingsteps:
1. Formulation of a measurements’ grid including urbanand rural stations.
2. Collection of measurements for a whole summer period.3. Collection of weather data.4. Initial elaboration of data.5. Analysis of experimental results.
D. Kolokotsa et al. / Solar Energy 83 (2009) 1871–1883 1873
3.1. The measurements’ grid
In the present study, a measurements’ grid is set up con-sisting of nine urban and three rural stations. The measure-ments’ grid includes:
� Eight data loggers (Supco – model LOGiTpc) measuringdry bulb temperature and relative humidity. The mea-surements accuracy is ±0.5�C and ±1% for temperatureand relative humidity, respectively. The eight data log-gers are positioned on the second floor of specific citydwellings (around 3.5–4 m above ground). All devicesare placed in meteorological cages for weather and radi-ation protection.� Four fully equipped meteorological masts measuring
dry bulb temperature, relative humidity, wind speedand wind directions located at the city’s surroundings(see Fig. 1). One of the four meteorological masts(TEI: no 9) is also equipped with atmospheric pressureand global solar radiation sensors and is consideredthe reference station.
The measuring devices are spread to cover the urbanarea under study. The sensors’ positioning is realised basedon the following criteria:
� Coverage of the city centre as representatively as possi-ble (stations 2–5).� Coverage of the most densely built neighbourhoods (sta-
tions 1, 7 and 8) around the city centre.� Coverage of the coastal line (stations 5, 8 and 9).
The urban stations are stations 1–8 (see Fig. 2), the sub-urban station is station no 9 (reference station) while therural stations are stations 10, 11 and 12 (Figs. 1 and 2).A short description of each location is tabulated in Table 1.
Fig. 2. The nine urban measurements’ locations.
3.2. Measurements period
The measurements were performed during summer 2007and more precisely from May 2007 until October 2007. Themeasurements’ time interval is 10 min and then the mea-surements are elaborated to be presented on daily or hourlybasis.
3.3. Initial data analysis
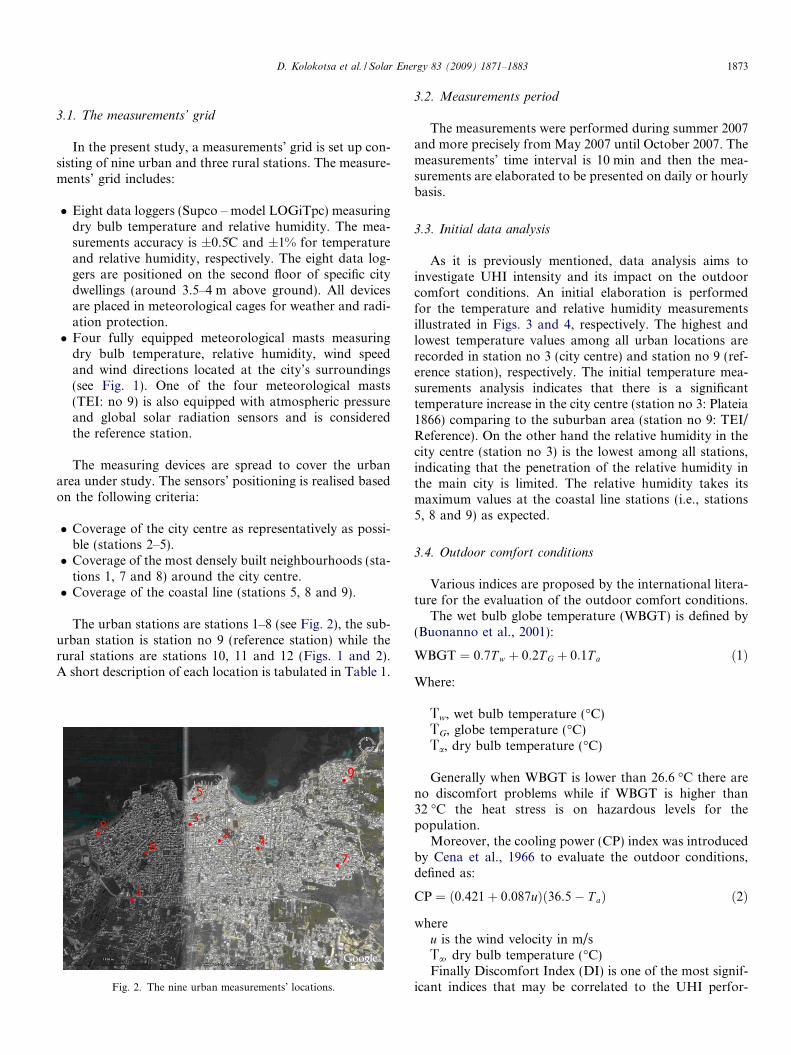
As it is previously mentioned, data analysis aims toinvestigate UHI intensity and its impact on the outdoorcomfort conditions. An initial elaboration is performedfor the temperature and relative humidity measurementsillustrated in Figs. 3 and 4, respectively. The highest andlowest temperature values among all urban locations arerecorded in station no 3 (city centre) and station no 9 (ref-erence station), respectively. The initial temperature mea-surements analysis indicates that there is a significanttemperature increase in the city centre (station no 3: Plateia1866) comparing to the suburban area (station no 9: TEI/Reference). On the other hand the relative humidity in thecity centre (station no 3) is the lowest among all stations,indicating that the penetration of the relative humidity inthe main city is limited. The relative humidity takes itsmaximum values at the coastal line stations (i.e., stations5, 8 and 9) as expected.
3.4. Outdoor comfort conditions
Various indices are proposed by the international litera-ture for the evaluation of the outdoor comfort conditions.
The wet bulb globe temperature (WBGT) is defined by(Buonanno et al., 2001):
WBGT ¼ 0:7T w þ 0:2T G þ 0:1T a ð1Þ
Where:
Nw, wet bulb temperature (�C)NG, globe temperature (�C)Na, dry bulb temperature (�C)
Generally when WBGT is lower than 26.6 �C there areno discomfort problems while if WBGT is higher than32 �C the heat stress is on hazardous levels for thepopulation.
Moreover, the cooling power (CP) index was introducedby Cena et al., 1966 to evaluate the outdoor conditions,defined as:
CP ¼ ð0:421þ 0:087uÞð36:5� T aÞ ð2Þ
whereu is the wind velocity in m/sNa, dry bulb temperature (�C)Finally Discomfort Index (DI) is one of the most signif-
icant indices that may be correlated to the UHI perfor-
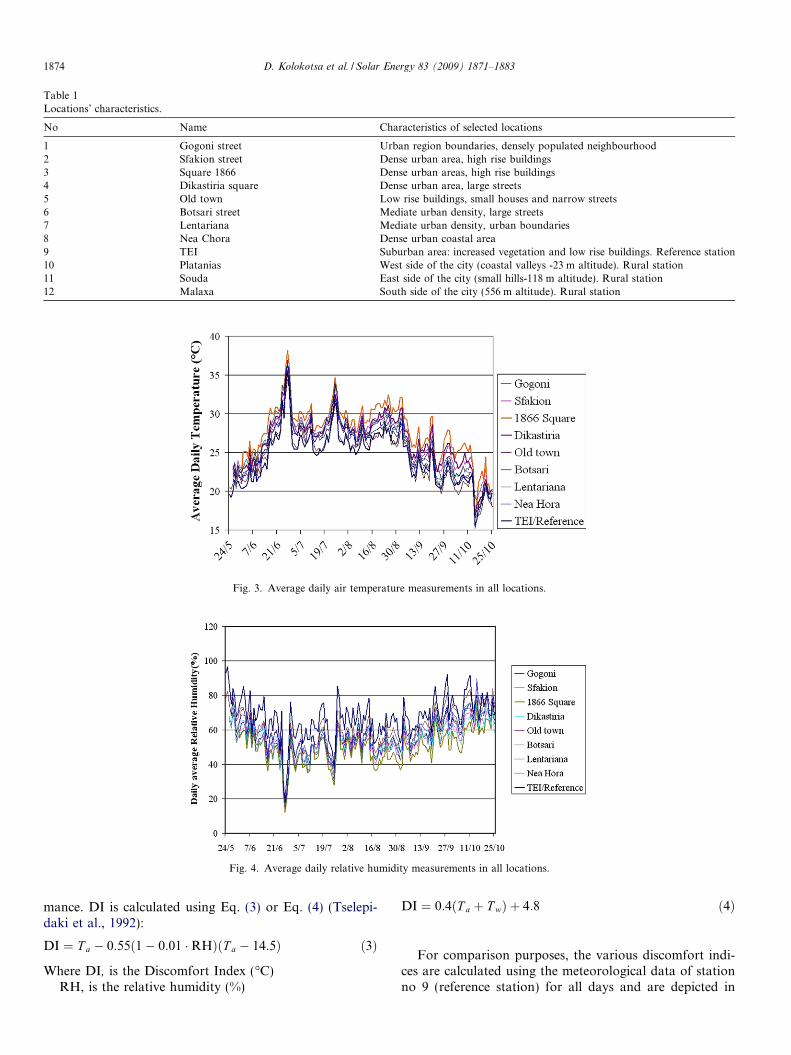
Table 1Locations’ characteristics.
No Name Characteristics of selected locations
1 Gogoni street Urban region boundaries, densely populated neighbourhood2 Sfakion street Dense urban area, high rise buildings3 Square 1866 Dense urban areas, high rise buildings4 Dikastiria square Dense urban area, large streets5 Old town Low rise buildings, small houses and narrow streets6 Botsari street Mediate urban density, large streets7 Lentariana Mediate urban density, urban boundaries8 Nea Chora Dense urban coastal area9 TEI Suburban area: increased vegetation and low rise buildings. Reference station10 Platanias West side of the city (coastal valleys -23 m altitude). Rural station11 Souda East side of the city (small hills-118 m altitude). Rural station12 Malaxa South side of the city (556 m altitude). Rural station
Fig. 3. Average daily air temperature measurements in all locations.
Fig. 4. Average daily relative humidity measurements in all locations.
1874 D. Kolokotsa et al. / Solar Energy 83 (2009) 1871–1883
mance. DI is calculated using Eq. (3) or Eq. (4) (Tselepi-daki et al., 1992):
DI ¼ T a � 0:55ð1� 0:01 �RHÞðT a � 14:5Þ ð3Þ
Where DI, is the Discomfort Index (�C)RH, is the relative humidity (%)
DI ¼ 0:4ðT a þ T wÞ þ 4:8 ð4Þ
For comparison purposes, the various discomfort indi-ces are calculated using the meteorological data of stationno 9 (reference station) for all days and are depicted in
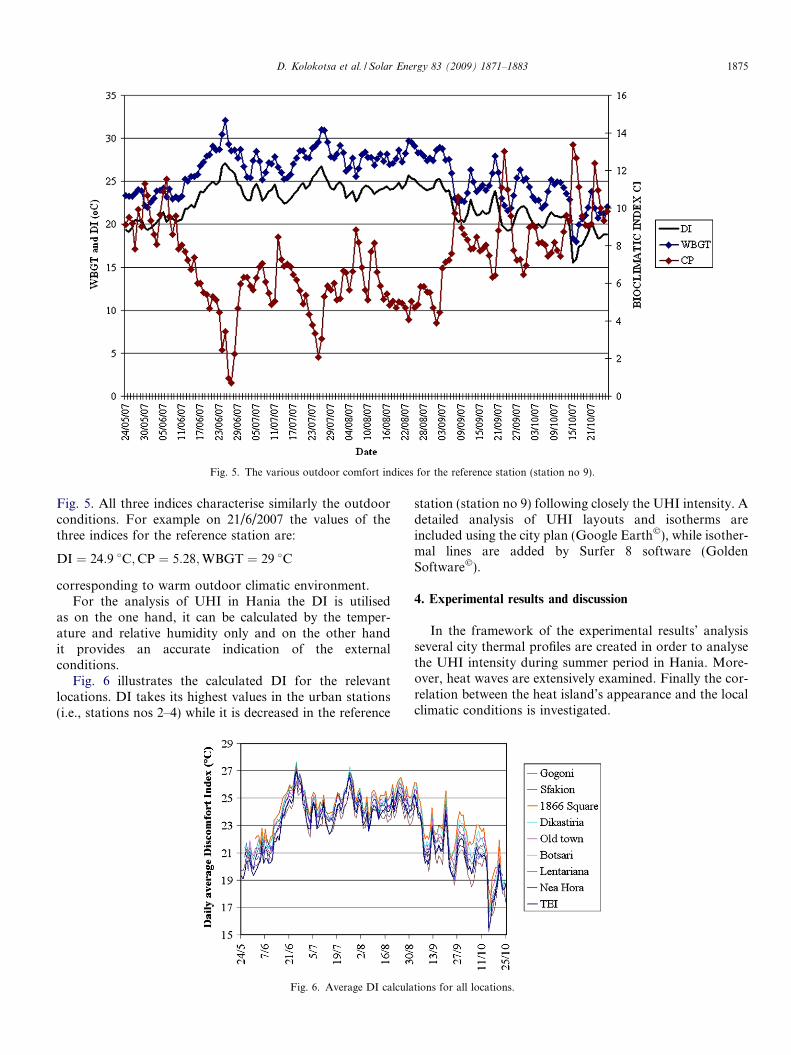
Fig. 5. The various outdoor comfort indices for the reference station (station no 9).
D. Kolokotsa et al. / Solar Energy 83 (2009) 1871–1883 1875
Fig. 5. All three indices characterise similarly the outdoorconditions. For example on 21/6/2007 the values of thethree indices for the reference station are:
DI ¼ 24:9 �C;CP ¼ 5:28;WBGT ¼ 29 �C
corresponding to warm outdoor climatic environment.For the analysis of UHI in Hania the DI is utilised
as on the one hand, it can be calculated by the temper-ature and relative humidity only and on the other handit provides an accurate indication of the externalconditions.
Fig. 6 illustrates the calculated DI for the relevantlocations. DI takes its highest values in the urban stations(i.e., stations nos 2–4) while it is decreased in the reference
Fig. 6. Average DI calcula
station (station no 9) following closely the UHI intensity. Adetailed analysis of UHI layouts and isotherms areincluded using the city plan (Google Earth�), while isother-mal lines are added by Surfer 8 software (GoldenSoftware�).
4. Experimental results and discussion
In the framework of the experimental results’ analysisseveral city thermal profiles are created in order to analysethe UHI intensity during summer period in Hania. More-over, heat waves are extensively examined. Finally the cor-relation between the heat island’s appearance and the localclimatic conditions is investigated.
tions for all locations.
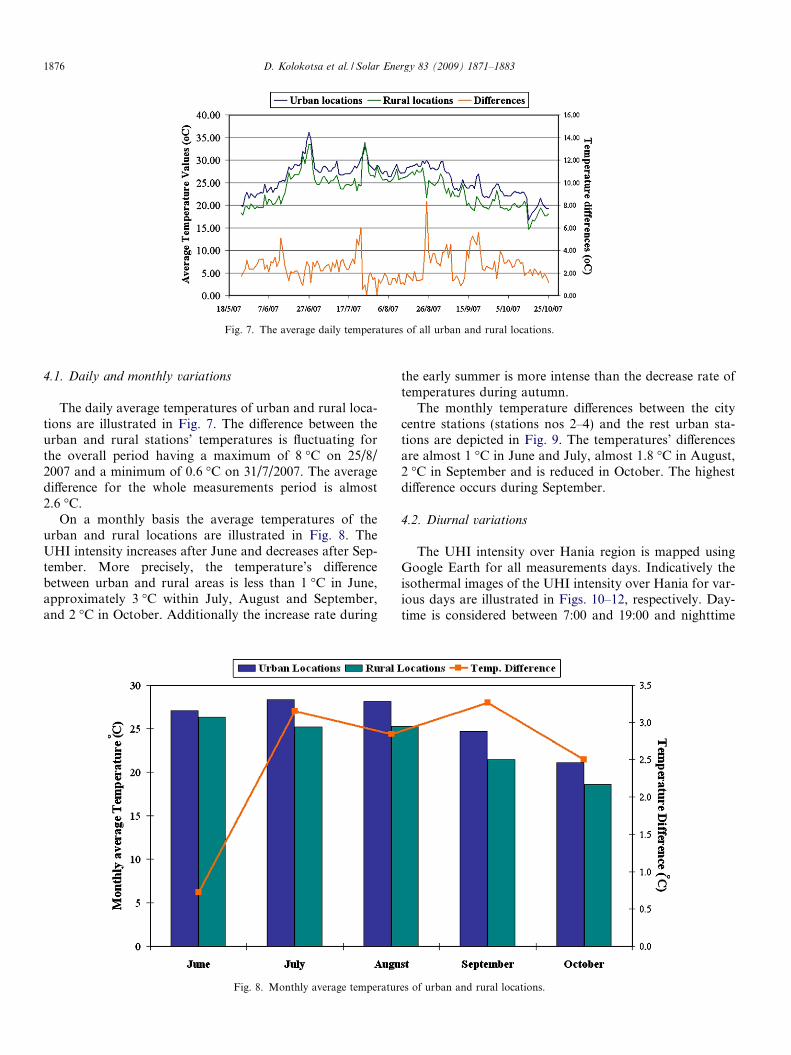
Fig. 7. The average daily temperatures of all urban and rural locations.
1876 D. Kolokotsa et al. / Solar Energy 83 (2009) 1871–1883
4.1. Daily and monthly variations
The daily average temperatures of urban and rural loca-tions are illustrated in Fig. 7. The difference between theurban and rural stations’ temperatures is fluctuating forthe overall period having a maximum of 8 �C on 25/8/2007 and a minimum of 0.6 �C on 31/7/2007. The averagedifference for the whole measurements period is almost2.6 �C.
On a monthly basis the average temperatures of theurban and rural locations are illustrated in Fig. 8. TheUHI intensity increases after June and decreases after Sep-tember. More precisely, the temperature’s differencebetween urban and rural areas is less than 1 �C in June,approximately 3 �C within July, August and September,and 2 �C in October. Additionally the increase rate during
Fig. 8. Monthly average temperatur
the early summer is more intense than the decrease rate oftemperatures during autumn.
The monthly temperature differences between the citycentre stations (stations nos 2–4) and the rest urban sta-tions are depicted in Fig. 9. The temperatures’ differencesare almost 1 �C in June and July, almost 1.8 �C in August,2 �C in September and is reduced in October. The highestdifference occurs during September.
4.2. Diurnal variations
The UHI intensity over Hania region is mapped usingGoogle Earth for all measurements days. Indicatively theisothermal images of the UHI intensity over Hania for var-ious days are illustrated in Figs. 10–12, respectively. Day-time is considered between 7:00 and 19:00 and nighttime
es of urban and rural locations.
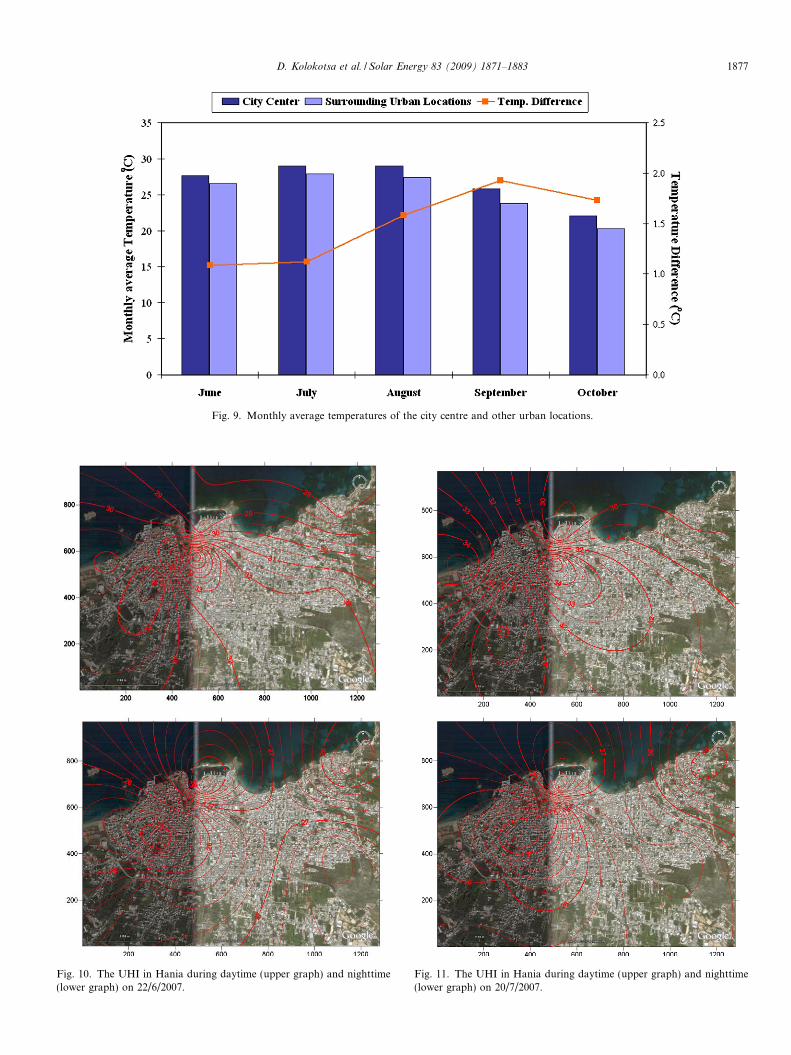
Fig. 9. Monthly average temperatures of the city centre and other urban locations.
Fig. 10. The UHI in Hania during daytime (upper graph) and nighttime(lower graph) on 22/6/2007.
Fig. 11. The UHI in Hania during daytime (upper graph) and nighttime(lower graph) on 20/7/2007.
D. Kolokotsa et al. / Solar Energy 83 (2009) 1871–1883 1877

Fig. 12. The UHI in Hania during daytime (upper graph) and nighttime(lower graph) on 31/8/2007.
Fig. 13. Temperature routes plan.
Table 2
1878 D. Kolokotsa et al. / Solar Energy 83 (2009) 1871–1883
between 19:00 and 7:00. The highest temperatures duringday are pinpointed for almost all days in station no 3 whichis in a densely populated area in the city centre with limitedvegetation. The highest temperatures of the day occurbetween 15:00–17:00. The UHI intensity is higher duringday taking its maximum values that can be up to 8 �Cfor some cases. The UHI intensity is quite stable for allnights of the examined period fluctuating between 1.5and 2 �C. Therefore the UHI is influencing the specificregion during day while during night the differences aresmoothed. This can be attributed to the local katabaticwinds that are flowing down to the urban region fromthe White Mountains and decrease the heat stress.
Routes characteristics.
No Color Route name Length (m)
1 Red Venizelou street 21502 Yellow Dimokratias street 9903 Blue Botsari–Papanastasiou street 30724 Magenta Apokoronou street 10735 Green Kissamou street 18006 Orange Gogoni street 2442
4.3. Urban temperature routes
In the previous section the UHI structure and intensityis analytically investigated using the isotherms. In thisspecific section the temperatures on the main city’s routesare recorded and presented. Despite the fact that the
temperature routes are extracted by a small number ofmeasuring locations, their illustration can indicate theplaces where possible mitigation techniques may be appliedsince the main city routes are suffering from emission ofanthropogenic heat due to traffic. The routes are mappedin Fig. 13 and their characteristics are tabulated in Table2. The temperature routes are created by Surfer softwareand for an indicative date (8th August 2007) are depictedin corresponding Figs. 14–18.
All routes indicate that there is a temperature incrementwhen moving towards the city centre. The temperature dif-ference takes its maximum value of almost 3 �C in route no1 which starts form the city centre (station no 3) and endsto the peripheral station no 9. A different profile can beseen in routes 3 and 6 which are traversing the city andare parallel to the northern coastal area. Routes 3 and 6have a maximum temperature of 28.6 �C and 27.7 �C,respectively, which is gradually decreased when movingtowards the suburbs. A significant temperature differencealso occurs between the urban locations as depicted inFig. 14. The urban temperatures in Dikastiria square(station no 4) are at least 1–1.5 �C lower than 1866 square(station no 3). This can be attributed to the fact thatDikastiria square is an open place with increased vegeta-tion comparing to 1866 square.
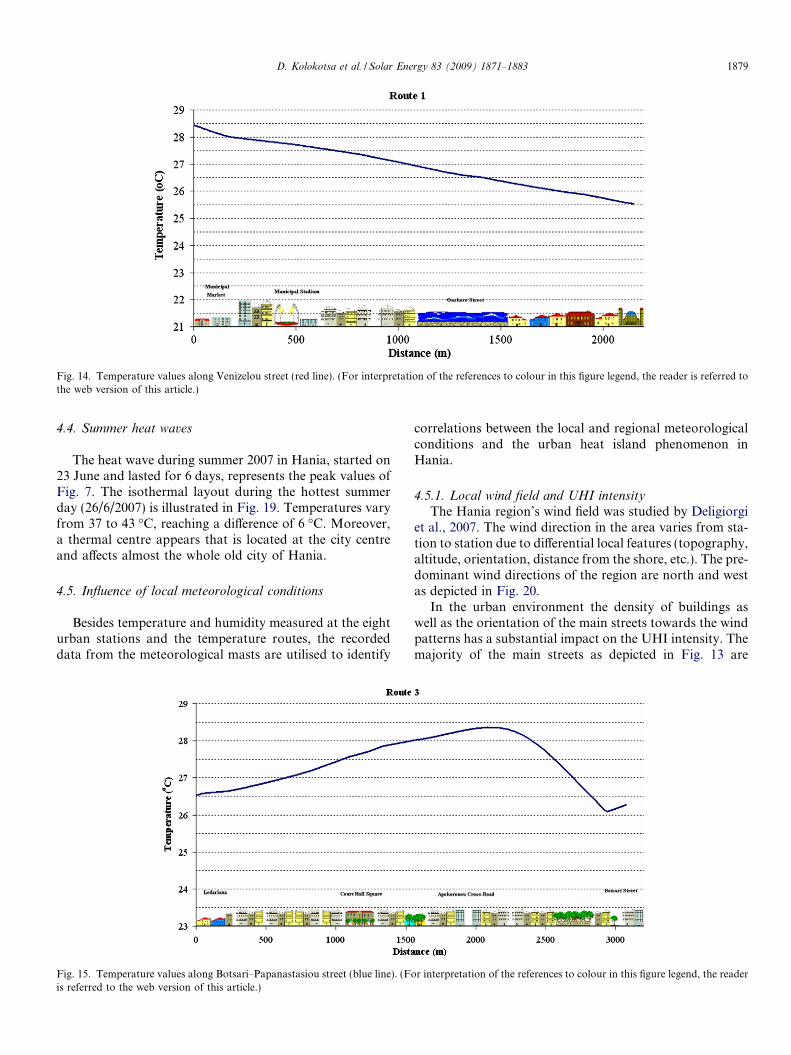
Fig. 14. Temperature values along Venizelou street (red line). (For interpretation of the references to colour in this figure legend, the reader is referred tothe web version of this article.)
D. Kolokotsa et al. / Solar Energy 83 (2009) 1871–1883 1879
4.4. Summer heat waves
The heat wave during summer 2007 in Hania, started on23 June and lasted for 6 days, represents the peak values ofFig. 7. The isothermal layout during the hottest summerday (26/6/2007) is illustrated in Fig. 19. Temperatures varyfrom 37 to 43 �C, reaching a difference of 6 �C. Moreover,a thermal centre appears that is located at the city centreand affects almost the whole old city of Hania.
4.5. Influence of local meteorological conditions
Besides temperature and humidity measured at the eighturban stations and the temperature routes, the recordeddata from the meteorological masts are utilised to identify
Fig. 15. Temperature values along Botsari–Papanastasiou street (blue line). (Fois referred to the web version of this article.)
correlations between the local and regional meteorologicalconditions and the urban heat island phenomenon inHania.
4.5.1. Local wind field and UHI intensityThe Hania region’s wind field was studied by Deligiorgi
et al., 2007. The wind direction in the area varies from sta-tion to station due to differential local features (topography,altitude, orientation, distance from the shore, etc.). The pre-dominant wind directions of the region are north and westas depicted in Fig. 20.
In the urban environment the density of buildings aswell as the orientation of the main streets towards the windpatterns has a substantial impact on the UHI intensity. Themajority of the main streets as depicted in Fig. 13 are
r interpretation of the references to colour in this figure legend, the reader
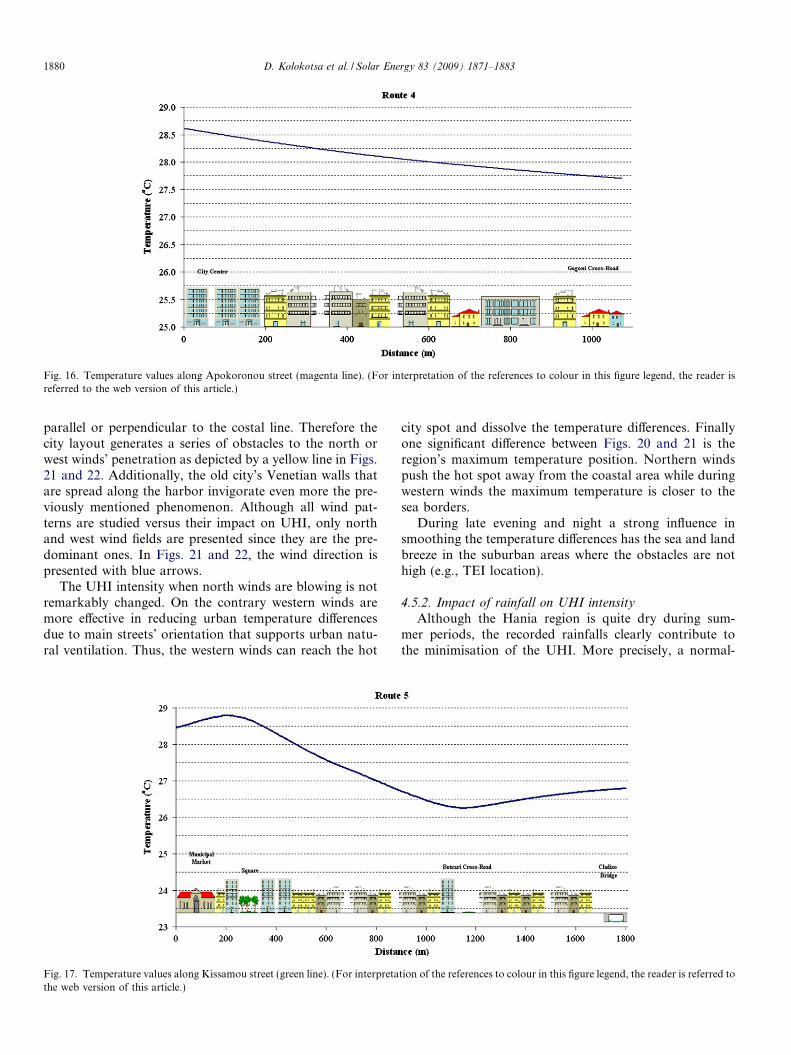
Fig. 16. Temperature values along Apokoronou street (magenta line). (For interpretation of the references to colour in this figure legend, the reader isreferred to the web version of this article.)
1880 D. Kolokotsa et al. / Solar Energy 83 (2009) 1871–1883
parallel or perpendicular to the costal line. Therefore thecity layout generates a series of obstacles to the north orwest winds’ penetration as depicted by a yellow line in Figs.21 and 22. Additionally, the old city’s Venetian walls thatare spread along the harbor invigorate even more the pre-viously mentioned phenomenon. Although all wind pat-terns are studied versus their impact on UHI, only northand west wind fields are presented since they are the pre-dominant ones. In Figs. 21 and 22, the wind direction ispresented with blue arrows.
The UHI intensity when north winds are blowing is notremarkably changed. On the contrary western winds aremore effective in reducing urban temperature differencesdue to main streets’ orientation that supports urban natu-ral ventilation. Thus, the western winds can reach the hot
Fig. 17. Temperature values along Kissamou street (green line). (For interpretathe web version of this article.)
city spot and dissolve the temperature differences. Finallyone significant difference between Figs. 20 and 21 is theregion’s maximum temperature position. Northern windspush the hot spot away from the coastal area while duringwestern winds the maximum temperature is closer to thesea borders.
During late evening and night a strong influence insmoothing the temperature differences has the sea and landbreeze in the suburban areas where the obstacles are nothigh (e.g., TEI location).
4.5.2. Impact of rainfall on UHI intensity
Although the Hania region is quite dry during sum-mer periods, the recorded rainfalls clearly contribute tothe minimisation of the UHI. More precisely, a normal-
tion of the references to colour in this figure legend, the reader is referred to
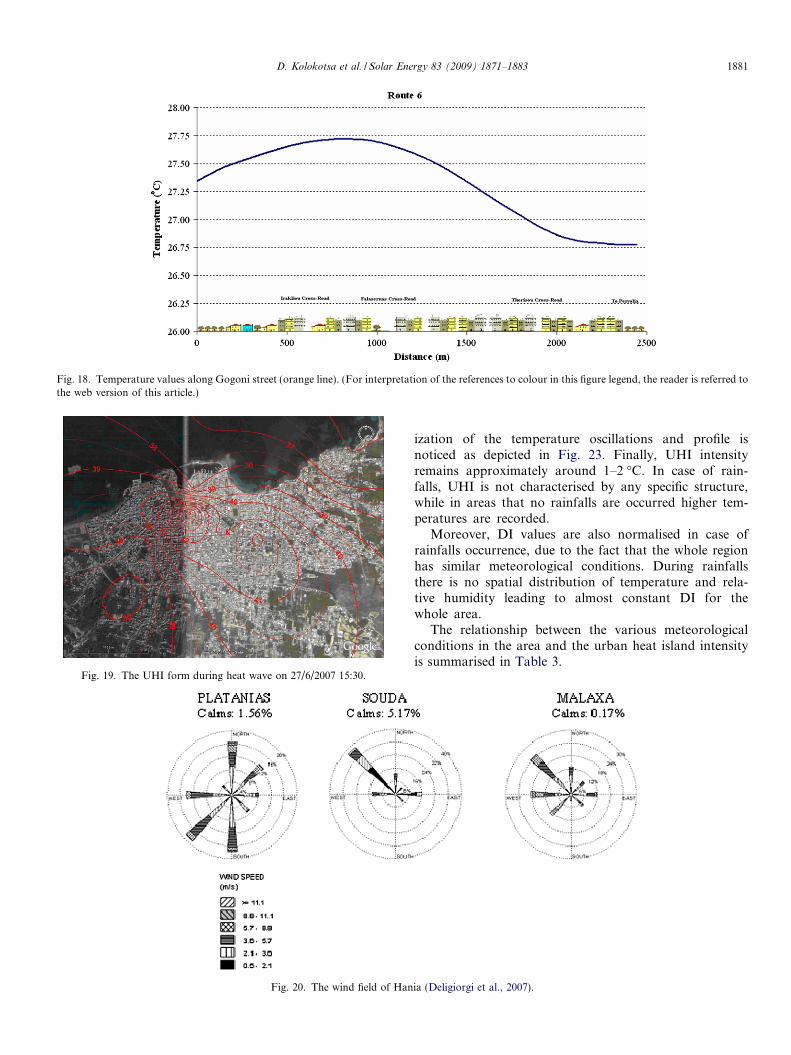
Fig. 19. The UHI form during heat wave on 27/6/2007 15:30.
Fig. 18. Temperature values along Gogoni street (orange line). (For interpretation of the references to colour in this figure legend, the reader is referred tothe web version of this article.)
Fig. 20. The wind field of Han
D. Kolokotsa et al. / Solar Energy 83 (2009) 1871–1883 1881
ization of the temperature oscillations and profile isnoticed as depicted in Fig. 23. Finally, UHI intensityremains approximately around 1–2 �C. In case of rain-falls, UHI is not characterised by any specific structure,while in areas that no rainfalls are occurred higher tem-peratures are recorded.
Moreover, DI values are also normalised in case ofrainfalls occurrence, due to the fact that the whole regionhas similar meteorological conditions. During rainfallsthere is no spatial distribution of temperature and rela-tive humidity leading to almost constant DI for thewhole area.
The relationship between the various meteorologicalconditions in the area and the urban heat island intensityis summarised in Table 3.
ia (Deligiorgi et al., 2007).
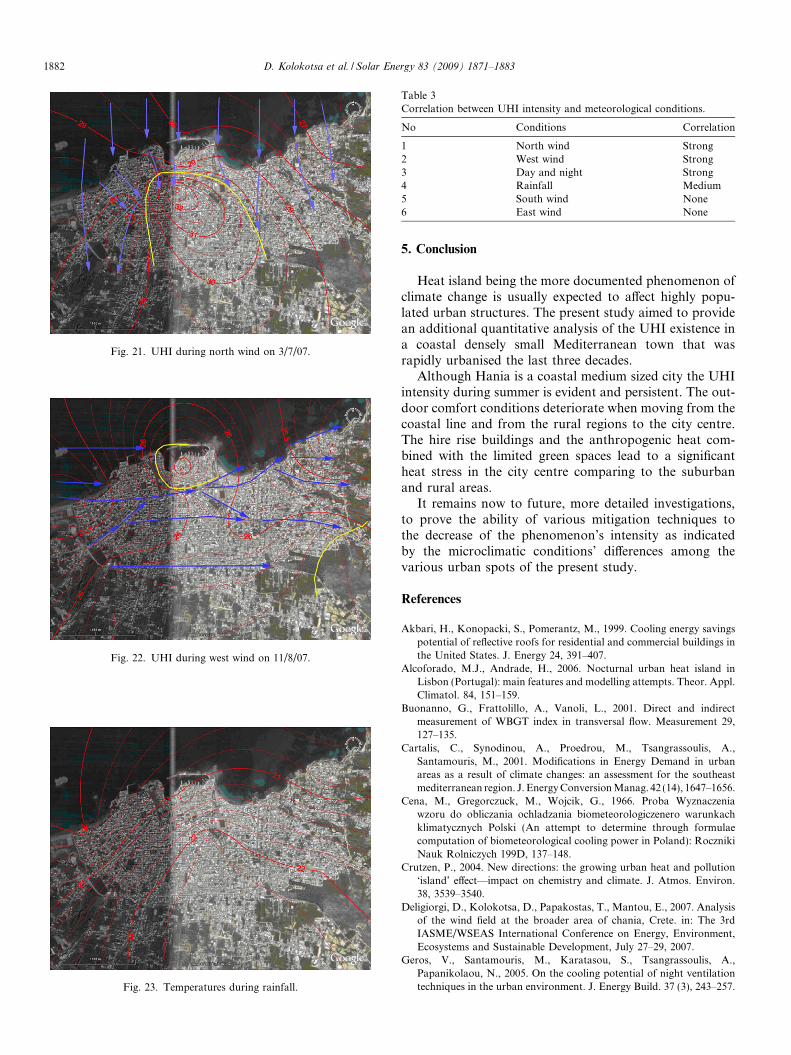
Fig. 21. UHI during north wind on 3/7/07.
Fig. 22. UHI during west wind on 11/8/07.
Fig. 23. Temperatures during rainfall.
Table 3Correlation between UHI intensity and meteorological conditions.
No Conditions Correlation
1 North wind Strong2 West wind Strong3 Day and night Strong4 Rainfall Medium5 South wind None6 East wind None
1882 D. Kolokotsa et al. / Solar Energy 83 (2009) 1871–1883
5. Conclusion
Heat island being the more documented phenomenon ofclimate change is usually expected to affect highly popu-lated urban structures. The present study aimed to providean additional quantitative analysis of the UHI existence ina coastal densely small Mediterranean town that wasrapidly urbanised the last three decades.
Although Hania is a coastal medium sized city the UHIintensity during summer is evident and persistent. The out-door comfort conditions deteriorate when moving from thecoastal line and from the rural regions to the city centre.The hire rise buildings and the anthropogenic heat com-bined with the limited green spaces lead to a significantheat stress in the city centre comparing to the suburbanand rural areas.
It remains now to future, more detailed investigations,to prove the ability of various mitigation techniques tothe decrease of the phenomenon’s intensity as indicatedby the microclimatic conditions’ differences among thevarious urban spots of the present study.
References
Akbari, H., Konopacki, S., Pomerantz, M., 1999. Cooling energy savingspotential of reflective roofs for residential and commercial buildings inthe United States. J. Energy 24, 391–407.
Alcoforado, M.J., Andrade, H., 2006. Nocturnal urban heat island inLisbon (Portugal): main features and modelling attempts. Theor. Appl.Climatol. 84, 151–159.
Buonanno, G., Frattolillo, A., Vanoli, L., 2001. Direct and indirectmeasurement of WBGT index in transversal flow. Measurement 29,127–135.
Cartalis, C., Synodinou, A., Proedrou, M., Tsangrassoulis, A.,Santamouris, M., 2001. Modifications in Energy Demand in urbanareas as a result of climate changes: an assessment for the southeastmediterranean region. J. Energy Conversion Manag. 42 (14), 1647–1656.
Cena, M., Gregorczuck, M., Wojcik, G., 1966. Proba Wyznaczeniawzoru do obliczania ochladzania biometeorologiczenero warunkachklimatycznych Polski (An attempt to determine through formulaecomputation of biometeorological cooling power in Poland): RocznikiNauk Rolniczych 199D, 137–148.
Crutzen, P., 2004. New directions: the growing urban heat and pollution‘island’ effect—impact on chemistry and climate. J. Atmos. Environ.38, 3539–3540.
Deligiorgi, D., Kolokotsa, D., Papakostas, T., Mantou, E., 2007. Analysisof the wind field at the broader area of chania, Crete. in: The 3rdIASME/WSEAS International Conference on Energy, Environment,Ecosystems and Sustainable Development, July 27–29, 2007.
Geros, V., Santamouris, M., Karatasou, S., Tsangrassoulis, A.,Papanikolaou, N., 2005. On the cooling potential of night ventilationtechniques in the urban environment. J. Energy Build. 37 (3), 243–257.

D. Kolokotsa et al. / Solar Energy 83 (2009) 1871–1883 1883
Hardy, J.E., Mitlin, D., Satterthwaite, D., 2001. Environmental problemsin an urbanizing world. Earthscan Publishers, London.
Hassid, S., Santamouris, M., Papanikolaou, N., Linardi, A., Klitsikas,N., Georgakis, C., Assimakopoulos, D., 2000. The effect of theAthens heat island on air conditioning load. J. Energy Build. 32,131–141.
Kassomenos, P., 2003. Anatomy of the synoptic conditions occurring oversouthern Greece during the second half of the 20th century. Part I.Winter and summer. Theor. Appl. Climatol. 75, 65–77.
Kolokotroni, M., Giannitsaris, I., Watkins, R., 2006. The effect of theLondon heat island and building summer cooling demand and nightventilation strategies. Solar Energy 80 (4), 383–392.
Kolokotroni, M., Giridharan, R., 2008. Urban Heat Island Intensity inLondon: an investigation of the impact of physical characteristics onchanges in outdoor air temperature during summer. Solar Energy 82,986–998.
Landsberg, H.E., 1981. The Urban Climate. Academic Press.Livada, I., Santamouris, M., Assimakopoulos, M.N., 2007. On the
variability of summer air temperature during the last 28 years inAthens. J. Geophys. Res. 112, D12103.
Livada, I., Santamouris, M., Niachou, K., Papanikolaou, N., Mihalaka-kou, G., 2002. Determination of places in the great Athens area wherethe heat island effect is observed. J. Theor. Appl. Climatol. 71, 219–230.
Mihalakakou, G., Santamouris, M., Papanikolaou, N., Cartalis, C.,Tsangrassoulis, A., 2004. Simulation of the urban heat islandphenomenon in mediterranean climates. J. Pure Appl. Geophys. 161,429–451.
Mihalakakou, P., Flokas, H., Santamouris, M., Helmis, C., 2000.Application of neural networks to the simulation of the heat islandover Athens, Greece using synoptic types as a predictor. J. Appl.Meteorol. 41, 519–527.
Oke, T.R., 1982. The energetic basis of the urban heat island. Q. J. R.Meteorol. Soc. 108, 1–24.
Papanikolaou, N., Livada, I., Santamouris, M., Niachou, K., 2008. Theinfluence of wind speed on heat island phenomenon in Athens, Greece.Int. J. Ventilation 6 (4), 337–348.
Pinho, O.S., Manso Orgaz, M.D., 2000. The urban heat island in a smallcity in coastal Portugal. Int. J. Biometeorol. 44, 198–203.
Saaron, H., Ben-Dor, E., Bitan, A., Potchter, O., 2000. Spatial distribu-tion and microscale characteristics of the urban heat island in Tel-Aviv, Israel. Landscape Urban Plan. 48, 1–18.
Santamouris, M., 2001. Energy and Climate in the Urban Built Environ-ment. James and James Science Publishers, London.
Santamouris, M., 2007. Heat island research in Europe, the state of theart. J. Adv. Build. Energy Res., ABER.
Santamouris, M., Papanikolaou, N., Livada, I., Koronakis, I., Georgakis,C., Argiriou, A., Assimakopoulos, D.N., 2001. On the impact of urbanclimate to the energy consumption of buildings. Solar Energy 70 (3),201–216.
Santamouris, M., Paraponiaris, K., Mihalakakou, G., 2007a. Estimatingthe ecological footprint of the heat island effect over Athens, Greece. J.Climate Change 80, 265–276.
Santamouris, M., Pavlou, K., Synnefa, A., Niachou, K., Kolokotsa, D.,2007b. Recent progress on passive cooling techniques. Advancedtechnological developments to improve survivability levels in low –income households. J. Energy Build. 39, 859–866.
Stathopoulou, E., Mihalakakou, G., Santamouris, M., Bagiorgas, H.S.,2008. Impact of temperature on tropospheric ozone concentrationlevels in urban environments. J. Earth Syst. Sci. 117 (3), 227–236.
Stathopoulou, M., Synnefa, A., Cartalis, C., Santamouris, M., Karlessi,T., Akbari, H., 2009. A surface heat island study of Athens using high-resolution satellite imagery and measurements of the optical andthermal properties of commonly used building and paving materials. J.Sustain. Energy 28 (1–3), 59–76.
Tselepidaki, I., Santamouris, M., Moustris, C., Poulopoulou, G., 1992.Analysis of the summer discomfort Index in Athens, Greece, forcooling purposes. Energy Build. 18, 51–56.