urban growth in china: past, prospect, and its impacts
TRANSCRIPT

ORI GIN AL PA PER
Urban growth in China: past, prospect, and its impacts
G.-Y. Cao • G. Chen • L.-H. Pang •
X.-Y. Zheng • S. Nilsson
Published online: 12 June 2011
� Springer Science+Business Media, LLC 2011
Abstract Rapid growth and globalization of the domestic economy have dra-
matically accelerated urbanization in China, resulting in significant environmental
impacts and challenges for sustainable development. Using a multistate model
accounting for distributional aspects of age, sex, education, and migration in rural
and urban regions, we estimate the magnitude of urbanization in China through
2030 and examine some major associated sustainability issues. Results indicate that:
(1) for a range of assumptions, China’s urban population will nearly double from
2000 to 2030; (2) the labor force will constitute a larger share of total population in
urban areas than rural due to internal migration of younger workers—this appears
particularly true for the mega-urban metropolises of Beijing and Shanghai; (3) rural
populations will experience more aging than urban; and (4) level of education
among China’s rural labor force will remain low, which could pressure China’s
industrial structural transition from an agricultural to a service-based economy.
Keywords Urbanization � Population dynamics � Sustainability � China �Multistate demographic models � Internal migration
Introduction
Over the last 20 years, urban areas across the globe have grown rapidly, often the
product of economic transformations related to rapid technological and political
G.-Y. Cao (&) � S. Nilsson
International Institute for Applied System Analysis (IIASA), Laxenburg, Austria
e-mail: [email protected]
G. Chen � L.-H. Pang � X.-Y. Zheng (&)
The Institute of Population Research, Peking University, WHO Collaborating Center on
Reproductive Health and Population Science, Beijing 100861, People’s Republic of China
e-mail: [email protected]; [email protected]
123
Popul Environ (2012) 33:137–160
DOI 10.1007/s11111-011-0140-6

change. Urbanization in China reflects these broader trends. Specifically, the rise of
the manufacturing sector has coincided with significant urban population growth
since the 1980s. The share of the domestic agricultural (primary) labor force,
predominantly comprised of rural workers, declined from 83.5 to 40.8% between
1952 and 2007. At the same time, the proportion of workers in secondary and
tertiary industries increased from 7.4 to 27% and from 9.1 to 32%, respectively (see
Fig. 1). Overall, the share of the Chinese population in urban areas increased
dramatically, from 12.5 to 44.9%, during this period.
China’s urbanization has resulted in a dramatic increase in income, creating jobs
for significant numbers of semi-skilled workers. Moreover, the labor intensive
export sector has absorbed a mass of unskilled workers from rural areas. However,
as a result of the global economic crisis, a large number of export-oriented private
enterprises in the coastal provinces have gone bankrupt and around 20 million
unskilled rural migrant workers have lost their jobs (Wang 2009). The slowdown in
China’s export sector, along with the decline in real estate investments, led to a
decrease in GDP growth from 13% in 2007 to 9% in 2008 (Zhang 2009).
Though urbanization is considered the driving force behind much-needed
economic restructuring, dynamic growth, and social development in China and will
continue to be given high policy priority in coming decades, urban growth also
results in conversion of natural landscapes and intensified competition among
different land uses (Deng et al. 2010). These changes directly and indirectly affect
soil and other natural resources, often with a negative impact on food security and
other aspects of human physical and social well-being (Blum 1997). The magnitude
and pace of China’s urban development since the 1980s demand a better
understanding of how this process impacts local, regional, and global sustainability.
More fundamentally, they pose the question: can this intensity of urbanization be
sustainable at any scale?
To contribute to contemporary understanding of China’s urbanization processes,
this article addresses the following questions:
Fig. 1 Employment share by industrial sector (%) 1952–2007. Source: China Population andEmployment Statistics Yearbook 2008, China Statistics Yearbook 2008, Population StatisticsYearbook 1996
138 Popul Environ (2012) 33:137–160
123

1. What are the historical characteristics of urbanization in China?
2. How will demographic dynamics drive urbanization in China over the coming
decades, particularly in large metropolitan areas?
3. What major challenges to sustainability must China face in the near future due
to its rapid urban growth?
This article is divided into four sections. First, we summarize the recent
trajectory of urbanization in China, identifying critical factors that have affected
historical trends and what these imply for future development; second, we use a
multistate methodology to produce demographic projections through 2030, both for
urban and rural China as a whole and for Beijing and Shanghai separately; third, we
discuss the implications of these projections and related challenges to urban
sustainability; finally, we summarize in the conclusions.
Characteristics of urbanization in modern China
Phases of urban growth
The term ‘‘urbanization’’ has been used both to describe a process (of becoming
more predominantly urban) and a state (typically, for a given region, the proportion
of the population residing in urban areas); in this paper, we use the latter, simpler
definition (i.e., the level of urbanization). Globally, urbanization is generally
associated with two sets of factors: rising agricultural productivity, which permits
the release of resources from agriculture, and industrial economies of scale and
agglomeration, which favor the concentration of resources in urban areas.
Technological change is also an overall driving force. China, however, is unique
in that, for significant time spans following the Revolution of 1949, urbanization
was regarded not as a by-product of development, but as a policy tool in its own
right, to be deployed as deemed necessary.
The history of urbanization and urban development in post-revolutionary China
(see Fig. 2) can generally be divided into five stages (Liu et al. 2002):
(1) The first major rapid urban growth period (1949–1957). This first period of
urban growth included the Rehabilitation (1949–1952) and the first Five-Year
Plan (1953–1957) following the establishment of the People’s Republic of
China. On average, each year saw the creation of 5.5 new cities and the
addition of 5.2 million residents to the urban population, while the proportion
of population urban rose from 10.6 to 15.4%, an average annual increment of
1.2%.
(2) The over-urbanization period (1958–1960). The second period of urbanization
resulted primarily from the Great Leap Forward, a social and economic
development strategy whose main objective was to significantly increase
China’s production, in part by tapping into underutilized human capital. Over
the course of these 3 years, the average annual growth of the urban population
was 10.4 million, and the level of urbanization rose from 16.3 to 19.8%.
Popul Environ (2012) 33:137–160 139
123

(3) The first ‘‘counter-urbanization’’ period (1961–1965). After the Great LeapForward, the country’s economy, and in particular the agricultural sector,
faced tremendous hardship. Over the period from 1961 to 1965, an estimated
18 million urban workers were laid off and the majority deported to rural areas
with their families (*26 million urban residents in all). The total urban
population actually decreased over this period, as did level of urbanization,
from 19.8 to 18.0%.
(4) The second ‘‘counter-urbanization’’ period (1966–1977). At the beginning of
the Great Proletarian Cultural Revolution, China’s government implemented a
policy of large-scale relocations to rural and mountainous areas with the aim of
re-educating intellectuals and urban youth and, in part, maintaining social
stability and alleviating urban unemployment. It was estimated that more than
16 million urban youth and 3–5 million intellectuals and cadres were deported
to rural areas (Liu et al. 2002). The proportion of population urban decreased
correspondingly, from 18.0 to 17.6%.
(5) The second rapid urbanization period (1978–present). China has been
transforming from a rural to an urban economy since 1978, when market-
oriented economic reforms were introduced. Rapid urbanization was driven
by economic growth of over 9% annually from 1978 to 2007, one of the
highest growth rates in the world, fueled by the globalization of the domestic
economy. Specifically, China’s urban population increased by over 300%,
from 172.5 to 606.7 million, between 1978 and 2008, and the corresponding
proportion urban rose from 17.0 to 43.5%. Agricultural employment
decreased from 71.0 to 44.8% of the total workforce in 2005 (NBS 2001a,
b, c, 2009).
Fig. 2 Urban share in the total population and per capita GDP from 1978 to 2007 in % and in yuan (real1978). Source: China Population and Employment Statistics Yearbook 2008, 2005, China StatisticsYearbook 2008, Population Statistics Yearbook 1996
140 Popul Environ (2012) 33:137–160
123

Effect of changing definitions of ‘‘urban’’
Government authorities have used various terminologies to describe China’s urban
population; being clear on the definition of ‘‘urban’’ is important as we explore
patterns and prospects for Chinese urbanization. Statistical data on the urban
population is generally based both on the administrative system used to define urban
locations and boundaries and on the residence registration system—the hukousystem, described below. Modifications of the definition of urban populations and
changes in the urban administrative system have complicated efforts to measure and
evaluate urbanization rates in China. Most importantly, the adoption of new urban
definitions led to substantial artifactual differences in the levels of urbanization
reported by the fourth (1990) and fifth (2000) population censes.
According to the 1990 census, the urban population comprised: (1) all population
residing in urban areas, including agricultural and non-agricultural residents and (2)
temporary residents who had lived in an urban area for over a year (rural-to-urban
migrants whose hukou status had not been modified). Accordingly, the total urban
population reported was 296.5 million, i.e., 26.3% of China’s total population. For
the 2000 census, the criteria were revised to encompass: (1) All population residing
in urban areas, cities, and towns with a population density higher than 1,500
inhabitants per km2—for urban areas with a population density lower than 1,500
inhabitants per km2, only those permanently registered residents living in town sites
and adjacent villages were considered urban residents and (2) migrants without an
urban hukou status resident in a city or town for over 6 months (rather than 1 year,
as for the 1990 census).
The revised definition led to a measured level of urbanization in 2000 of
36.2–5.2% higher than in 1999. A comparison with the average annual difference
from 1990 to 1999 of just 1.2% suggests that this large increase is predominantly the
result of the changed urban population definition itself. This definitional shift should
be borne in mind when evaluating Chinese demographic data.
Major factors influencing modern Chinese urbanization
The hukou urban–rural residence registration system
The hukou system—which classifies Chinese citizens as ‘‘agricultural’’ or ‘‘non-
agricultural’’—was introduced in urban and rural areas in 1955. The state provided
residents with non-agricultural hukou status with access to social services and
benefits (public-service jobs, housing, education, medical care, etc.). Those
registered within the agricultural population had no access to such social services.
In the pre-reform era, the state also monopolized economic activity, job recruitment,
and the distribution of essential goods, with the hukou system functioning as a defacto internal passport mechanism and essentially controlling rural-to-urban
migration. Individual transition from agricultural to non-agricultural hukou status
was subject to strict quotas, a policy designed to facilitate centrally planned
industrialization while preventing rural exodus.
Popul Environ (2012) 33:137–160 141
123

With the introduction of reforms and a national policy of economic opening,
China’s planned economy transformed into a market-driven system. As such, many
non-agricultural employment opportunities were—and continue to be—created in
the informal sector, in private companies, and in foreign or joint ventures. With this
evolution of the economy came calls to reform the hukou system. Cai et al. (2002)
have argued that, from the perspective of political economy of reform, willingness
to reform has been related to the welfare implications of the hukou system: in fact,
the sources of social protection for most urban residents come from city self-
financing rather than from national fiscal distribution. In practice, this has led to a
gradual relaxation of restrictions, beginning in small towns and progressing through
increasingly larger cities, although mega cities like Beijing and Shanghai remain, to
a certain degree, the last bastions of the old order—immigration remains to some
extent controlled. In general, Chinese have more flexibility to choose their in place
of residence location, regardless of their hukou status. Hence, population mobility,
in particular rural-to-urban migration, has increased considerably. At the same time,
China’s current government intends to establish, for the first time in history, a
minimum level of medical and pension support for farmers (NDRC 2007), which
may have the effect of encouraging retention of labor in rural areas.
The dominant role of coastal regions in urban development
The formation of metropolitan regions is a predictable consequence of economic
development, and these regions become the main drivers of additional urbaniza-
tion. Major urban areas are essentially the ‘‘hubs’’ for regional growth and
international trade. Among the most notable features of China’s urban development
over the past two decades are the unprecedented scale of urban growth in eastern
coastal regions increasingly influenced by the global economy, the formation of
large mega-urban regions around economic centers in these areas, and the
comparatively low rates of urbanization in inland regions. The transition from a
rural to an urban economy has resulted in considerable regional variations in urban
growth and particularly a gap between coastal and inland regions. This clear
geographic distinction (see Table 1) is primarily the result of economic growth and
massive rural-to-urban migration.
Levels of urbanization and population density decline from eastern coastal areas
to western inland regions (Fig. 3). Most conspicuously, the three eastern metro-
politan areas of Beijing, Shanghai, and Tianjin are under the State Council’s direct
jurisdiction and are highly urbanized, with urbanization levels greater than 75% and
urban population densities of more than 630 inhabitants per km2—compared with,
for example, Chongqi, a western metropolitan city with a density of just 347
inhabitants per km2 or China as a whole with just 130 inhabitants per km2 (China
Statistical Yearbook 2000).
National strategies for the next phase of urbanization will continue to foster
development in the four growth poles that have arisen over the last 20 years: (1) the
Yangtze River delta around Shanghai and extending westward along the Yangtze
River Valley; (2) the Pearl River delta comprising the provincial capital of
142 Popul Environ (2012) 33:137–160
123

Guangzhou and other major coastal cities in Guangdong adjacent to Hong Kong and
Macao; (3) the Round Bo-Sea Bay region, which includes the capital Beijing and
the important industrial metropolises of Tianjin and Tanshan; and (4) the Chendo-
Chonqing urban–rural integration region in southwestern China (China Population
Information and Research Center 2004, China Daily 2010). According to the 2004
City Development Report, the total GDP of the first three areas combined was 35%
of the national GDP (10% for the Pearl River Delta, 18% for the Yangtze River
Delta, and 7% for the Bo-Sea Bay area) (China Population Information and
Research Center 2005).
Table 1 Regional levels of
urbanization and per capita GDP
in 2007
Source: China Population and
Employment Statistics
Yearbook 2008, China Statistics
Yearbook 2008
Level of
urbanization
Per capita
GDP
% Yuan
National total 44.9 18,934
Shanghai 88.7 66,367
Beijing 84.5 58,204
Tianjin 76.3 46,122
Guangdong 63.1 33,151
Liaoning 59.2 25,729
Zhejiang 57.2 37,411
Heilongjiang 53.9 18,478
Jiangsu 53.2 33,928
Jilin 53.2 19,383
Inner Mongolia 50.2 25,393
Fujian 48.7 25,908
Chongqing 48.3 14,660
Hainan 47.2 14,555
Shandong 46.8 27,807
Hubei 44.3 16,206
Shanxi 44.0 16,945
Ningxia 44.0 14,649
Shaanxi 40.6 14,607
Hunan 40.5 14,492
Hebei 40.3 19,877
Qinghai 40.1 14,257
Jiangxi 39.8 12,633
Xinjiang 39.2 16,999
Anhui 38.7 12,045
Guangxi 36.2 12,555
Sichuan 35.6 12,893
Henan 34.3 16,012
Yunnan 31.6 10,540
Gansu 31.6 10,346
Tibet 28.3 12,109
Popul Environ (2012) 33:137–160 143
123

The role of internal migration in promoting urban growth
With the implementation of rural market reforms in 1978, China’s agricultural
productivity and the output of grain and other agricultural products increased
significantly. In turn, this production has not only met the needs of the rising urban
population but has also facilitated and promoted the diversification of non-
agricultural activities in rural areas on a large scale. Farm families have invested in
township enterprises, which have become a driver of rural economic development,
especially in the coastal regions.
With regard to urban population growth, China is unusual among developing
countries in that its one-child family planning policy has led to a decline or zero
natural increase in some urban regions. It is thus rural-to-urban migration and the
transformation of rural settlements into cities that have been the most important
determinants of the past two decades’ rapid urbanization. Clearly, rural-to-urban
migration has directly promoted urban land expansion and mega-urban
developments.
According to the 2000 census, 42.4 million people lived in provinces other than
their own and there were 53.1 million registered rural-to-urban migrants. These
numbers generally do not include short-term migrants that had been resident in new
areas for less than 6 months. Shanghai, Beijing, and Guangdong were the
destinations for 48.7% of all migrants, although these three urban regions accounted
for only 9.3% of China’s total population in 2000. Figure 4 illustrates the share of
inter-provincial migrants and the share of total population for Shanghai, Beijing,
and Guangdong in comparison with the rest of China.
Fig. 3 Population density at provincial level in 2000. Source: Liu et al. (2002)
144 Popul Environ (2012) 33:137–160
123

Projecting urbanization in China through 2030
Methods
There is a large body of literature on the analysis and projection of urbanization at
country or regional levels. Among statistical techniques that have been applied to
this issue in China are the following: (a) simple regression models of level of
urbanization on historical social or economic parameters, such as per capita GDP
(see, e.g., Liu et al. 2002); (b) the UN method—source for the most comprehensive
and widely used national population projections—which identifies and projects
differences in urban and rural growth rates (UN 2002), but does not include any
explanatory independent exogenous variables; (c) the decomposition method, which
disaggregates national population projections using local information on fertility,
mortality, and level of urbanization to produce regional projections of urbanization
(see, e.g., Toth et al. 2003); and (d) the multistate model (Fig. 5), based on a
multidimensional expansion of the life table and the cohort-component projection
method (see, e.g., Cao and Lutz 2004).
Of these, the UN method has several advantages in that it is relatively
straightforward and transparent, and does not require detailed data, and can easily be
applied to a large number of countries (O’Neill and Scherbov 2006). However, the
method has been criticized as being impractical for countries that are either at the
Fig. 4 Share of inter-provincial migration to Beijing, Shanghai, and Guangdong in 2000 relative to thetotal population. Source: Authors’ calculations based on national and provincial data from the 2000population census. Is from NBS (National Bureau of Statistics of the People’s Republic of China) (2002),NBS (National Bureau of Statistics of Guangdong) (2002), and (2003)
Popul Environ (2012) 33:137–160 145
123

beginning or at the end of their transition to urban dominance and as incorrect in its
implicit assumption that all countries follow a certain historical path of urbaniza-
tion. Also, the results may be inconsistent with current rates of urbanization in some
countries with extremely large populations, such as China or Indonesia (National
Research Council 2003; Cohen 2004; Bocquier 2005). Only the multistate method
accounts jointly for the changing distributions of fertility, mortality, age, sex,
educational attainment, migration, and their effects on future population prospects
(see Fig. 5). More specifically, it allows for the inclusion of explicit and
independent assumptions about fertility and mortality in urban and rural areas,
and about rural–urban migration rates. It makes use of changing age and sex
structures and allows for clear distinctions between the effects of natural increase
and migration on urban or rural populations. Furthermore, it allows for the
classification of populations by educational attainment. As noted by Lutz (2010),
‘‘educational status is considered of paramount substantive interest for a large array
of social, economic, and health-related questions in developing and industrialized
countries alike. Its inclusion may change aggregate population projections
significantly…’’ In the 1970s, this method was applied to multiregional projections
in an international study of migration and redistribution patterns in 17 countries
(Rogers 1983). In recent years, it has been used to project various dimensions of
population in China and elsewhere. For example, Cao and Lutz (2004) used this
model to project future levels of educational attainment by urban/rural residence in
China, and Lutz and Goujon (2001) produced estimates of global human capital,
combining educational components with population projections. Within these
models, internal changes over time in rural and urban regions—such as the age and
Migration
Mortality
Migration
Fertility
Migration
Males Females Males Females
Population by Age, Sex, and Education Population by Age, Sex, and Education20052000
Fig. 5 Framework of the multistate model. Source: Lutz and Goujon (2001)
146 Popul Environ (2012) 33:137–160
123

sex composition of migrants—can be captured. Accounting for these factors is
fundamental to understanding the role of demographic dynamics in urbanization
processes. Hence, we opted for the multistate model in our projections.
Framework and data
Our framework for the urban projection process is illustrated in Fig. 6.
Base-year data and definition of variables: We applied the definition of urban
used in China’s 2000 national population census, indicating the level of
urbanization, i.e., the ratio of the urban population to the total population in a
given region. Input data on fertility, mortality, age, sex, educational attainment, and
migration were also derived from the 2000 census.
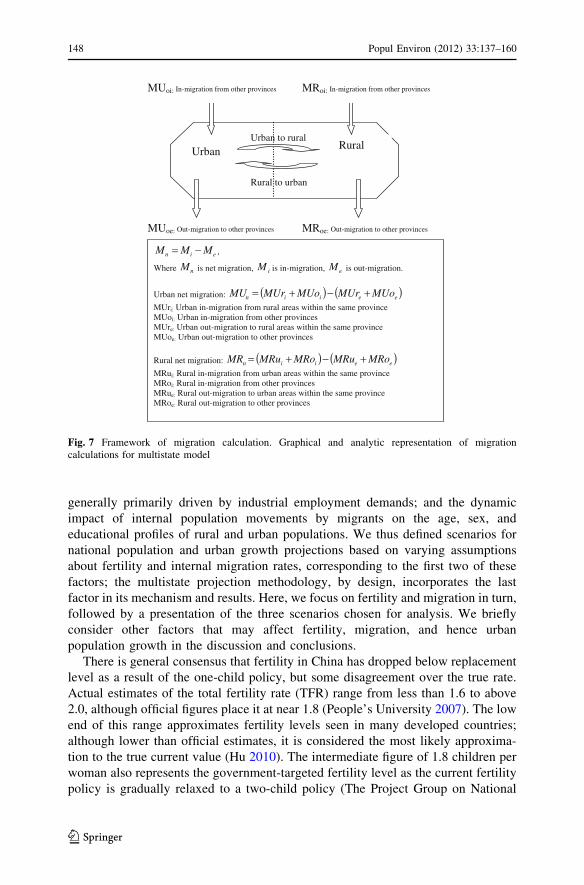
The net migration calculation: From census data, we identified urban and rural
migrants at the provincial level, characterizing them by age, sex, and level of
education. Calculating net migration was a labor-intensive process: for each
province, eight migration flows were identified, accounting for intra- and inter-
regional urban–rural migration, as illustrated in Fig. 7. We used these data directly
for demographic projections for Beijing and Shanghai, and aggregated them into
total urban–rural flows for national projections, always maintaining the age, sex, and
educational attainment classifications to inform the multistate model.
Scenario specification
National projections
Three demographic factors drive the future evolution of population growth in China:
natural increase, a function of fertility and mortality; rural–urban migration,
China (by age-sex)
Urban (by age-sex)
Rural (by age-sex)
No educ (by age-sex)
Primary (by age-sex)
Interm. (by age-sex)
College (by age-sex)
No educ (by age-sex)
Primary (by age-sex)
Interm. (by age-sex)
College (by age-sex)
Migration (by age-sex)
Fig. 6 Framework of the multistate model for projections for urban/rural China and for Beijing andShanghai. Note: Migration refers to persons who migrated and have lived in an urban area for more than6 months and does not include unregistered floating migrants. We divided the national population into anurban and a rural subregion, and simulated each subregion individually with reference to its own specificfertility, mortality, education, and migration patterns. The results were then aggregated to produceprojections for the entire region
Popul Environ (2012) 33:137–160 147
123
generally primarily driven by industrial employment demands; and the dynamic
impact of internal population movements by migrants on the age, sex, and
educational profiles of rural and urban populations. We thus defined scenarios for
national population and urban growth projections based on varying assumptions
about fertility and internal migration rates, corresponding to the first two of these
factors; the multistate projection methodology, by design, incorporates the last
factor in its mechanism and results. Here, we focus on fertility and migration in turn,
followed by a presentation of the three scenarios chosen for analysis. We briefly
consider other factors that may affect fertility, migration, and hence urban
population growth in the discussion and conclusions.
There is general consensus that fertility in China has dropped below replacement
level as a result of the one-child policy, but some disagreement over the true rate.
Actual estimates of the total fertility rate (TFR) range from less than 1.6 to above
2.0, although official figures place it at near 1.8 (People’s University 2007). The low
end of this range approximates fertility levels seen in many developed countries;
although lower than official estimates, it is considered the most likely approxima-
tion to the true current value (Hu 2010). The intermediate figure of 1.8 children per
woman also represents the government-targeted fertility level as the current fertility
policy is gradually relaxed to a two-child policy (The Project Group on National
Urban Rural
MUoi: In-migration from other provinces MRoi: In-migration from other provinces
MUoe: Out-migration to other provinces MRoe: Out-migration to other provinces
Urban to rural
Rural to urban
ein MMM −= ,
Where nM is net migration, iM is in-migration, eM is out-migration.
Urban net migration: ( ) ( )eeiin MUoMUrMUoMUrMU +−+=MUri: Urban in-migration from rural areas within the same province MUoi: Urban in-migration from other provinces MUre: Urban out-migration to rural areas within the same province MUoe: Urban out-migration to other provinces
Rural net migration: ( ) ( )eeiin MRoMRuMRoMRuMR +−+=MRui: Rural in-migration from urban areas within the same province MRoi: Rural in-migration from other provinces MRue: Rural out-migration to urban areas within the same province MRoe: Rural out-migration to other provinces
Fig. 7 Framework of migration calculation. Graphical and analytic representation of migrationcalculations for multistate model
148 Popul Environ (2012) 33:137–160
123

Population Development Strategies 2007). In fact, China’s fertility policy has been
increasingly localized and diversified at provincial level. A two-child policy has
already been applied to couples who are themselves only children. As a result, this
medium figure is often considered the most likely eventual level for China (Guo
et al. 2003). The high end of the estimate range represents the replacement level of
fertility, a figure which would produce a stationary population.
As in most developing economies, the extent and destinations of rural–urban
migration in China are generally driven by labor demand resulting from urban
economic development. Because of the major rural–urban disparities in income and
living standards, such migration is likely to remain substantial for quite sometime.
To estimate migration flows, we adopted various assumptions about the likely rate
of urban growth in China over the next 30 years. There are three schools of thought
on this issue. The ‘‘slow growth’’ view assumes that annual growth will average
considerably less than has been observed over the past decade, perhaps 0.6% per
year. This view holds that increasing labor shortages and the limited remaining pool
of agricultural workers under 30 years old point to the arrival of the Lewisian
turning point in China (Cai et al. 2009), that is, the point at which cheap surplus
labor from the countryside is exhausted. The ‘‘moderate growth’’ view contends
that, although China’s large eastern cities are now coping with the Lewisian turning
point, the big story in coming decades will be the boom of western and other once-
peripheral cities, yielding an intermediate annual growth rate of about 0.7–0.8%
(Steinbock 2010). This moderate growth rate is most consistent with the government
policy prescriptions embodied in the National 10th and 11th Five-Year Plans
(2000–2005, 2005–2010) and estimates by the National Development and Reform
Commission (NDRC) on urban growth rate up to 2025 (NDRC 2006a, b, 2007;
People’s Daily 2006). The ‘‘rapid growth’’ position argues that urban growth will
continue at 1990–2000 levels, i.e., about 1% annually. These growth scenarios were
applied to produce migration estimates; briefly, we fix age-, sex-, education-, and
region-specific fertility and mortality, and estimate the number of migrants required
to produce assumed levels of urban growth.
We then combined fertility and migration assumptions to produce three scenarios
for national projections. Note that a single set of assumptions about age- and sex-
specific mortality rates was used across all scenarios; although decomposed
mortality rates would inform population projections, such rates, stratified by
migration status and educational level, are extremely difficult to obtain. For the
current study, we focus on the important issues of fertility and migration, while
noting that further research incorporating mortality variations would be valuable.
Rural-to-urban migrants were assumed to adopt urban fertility rates; this is standard
practice in multistate demographic modeling (Rogers 1983). Scenarios were as
follows:
Low growth (L): This scenario combines low fertility (aggregate TFR = 1.6)
with high migration, equal to the rate in 2000. As such, it represents a ‘‘business-as-
usual’’ approach, maintaining estimated current levels of migration and fertility.
Medium growth (M): Combining moderate fertility (aggregate TFR = 1.8) with
a reduced level of migration, this scenario (see Table 2) represents the most likely
path if government population policy targets are met.
Popul Environ (2012) 33:137–160 149
123

High growth (H): The final scenario combines high fertility (aggregate
TFR = 2.1) with low migration. It thus represents the situation were fertility to
return to the levels of the 1970s–1980s and migration to decrease to low levels, a
plausible scenario when taking into account relaxed governmental fertility policies
and the increased rural welfare that could result from current central government
policies of urban–rural integrated socioeconomic development, particularly efforts
to provide minimum medical and pension support to farmers (NDRC 2007).
City projections
In addition to national projections, we projected urban population growth for
Beijing and Shanghai, China’s two largest cities, to illustrate the likely effects of
continuing migration on city size through 2030. Both cities have experienced
negative or zero natural population growth—that is, growth accounting only for
natural increase due to fertility and mortality—for significant periods; Shanghai’s
natural growth has been negative since 1994, while Beijing’s has been approxi-
mately zero since 2001. As such, their continued growth is entirely attributable to
migration, which will clearly play a pivotal role in future development.
Migration from rural areas to these cities, and especially to Shanghai, has increased
dramatically since the 1990s (see Fig. 8) and accounts for a disproportionate level of
all such migration in China. According to the 2000 census, migrants in Beijing totaled
2.57 million people, which accounted for 24.4% of the city’s total population; in
Shanghai, 3.35 million migrants made up 21.6% of the city’s total population. We also
note that rural–urban migration accounts for 46 and 45% of migrants in Beijing and
Shanghai, respectively, implying that urban–urban migration in China is an extremely
important phenomenon deserving of further study.
As discussed above with respect to the hukou system, high-level migration policy
has traditionally been a major factor in determining urban migration in China.
Although restrictions have been relaxed since 1978 in view of China’s economic
growth, migration to Shanghai and Beijing continues to be regulated by the
government city development plans (Beijing Statistics Bureau 2004; Chen et al.
2006). For example, Shanghai has opened its labor market to rural migrants from
Table 2 Aggregate parameters for moderate growth scenario (M) for urban and rural regions up to 2030
Urban Rural
2000 2030 2000 2030
TFR (urban and rural aggregate is 1.8) 1.58 1.58 1.98 1.98
Life expectancy (years)
Male 71.57 75.32 67.89 72.39
Female 75.58 78.93 71.00 75.44
Total net rural urban migration
from 2000–2030 (in millions)
287.831 -287.831
Aggregate TFR and migration parameters were stratified by sex, age, and education in implementing the
model
150 Popul Environ (2012) 33:137–160
123

two neighboring provinces (Jiangsu and Zheijang). Laborers who take advantage of
this opportunity can then subscribe to the medical and pension plans offered to
Shanghai residents (Urban Development Report 2005). At the same time, city
governments limit in-migration through selective issuance of work permits on the
basis of job qualifications.
To illustrate the effect of city-level migration policy, we developed three regional
population growth scenarios: the natural growth (N) scenario assumes zero net
migration, i.e., city growth is regulated only by fertility and mortality; the moderate
growth (M) scenario assumes that migration will be regulated according to
government development plans (Beijing Statistics Bureau 2004; Wang and Yin
2000); and the high growth (H) scenario assumes that migration will continue at a
high rate based on the trends of the last 10 years.
Each of these scenarios assumes a constant age- and sex-specific mortality rate
and a stable TFR of 1.2, which is the government-targeted level (Wang and Yin
2000).
Urbanization prospects: results
National projections
Over the next three decades, China will continue to grow and urbanize. According
to our projections, China’s population will increase from 1.27 billion in 2000 to 1.37
billion (L), 1.39 billion (M), or 1.42 billion (H) by 2030. The share of the urban
population is projected to nearly double by 2030, with level of urbanization rising
from 36.1% in 2000 to 62.2% in 2030 (L), 59.0% (M), or 56.0% (H). Note that in
these scenarios, level of urbanization in 2030 has an inverse relationship with total
population growth. These results thus underscore the fact that future urban
development and the growth of major cities will be strongly linked to migration: the
higher the rate of net rural-to-urban migration, the higher the urban share of the total
Fig. 8 Net migration to Beijingand Shanghai (10,000s ofmigrants). Source: Author’scalculations from PopulationStatistics Yearbooks for China,Beijing, and Shanghai,1990–2005
Popul Environ (2012) 33:137–160 151
123

population. Figures 9 and 10 illustrate projected population growth and urbanization
trends at the national level.
Urban and rural trends in aging and education
All three national-level scenarios indicate that China’s working population will
eventually experience a downward trend. In scenario M, for example (see Fig. 11),
the working population will reach its peak in 2010–2015 with 923 million, and drop
Fig. 9 Projected total population, China 2005–2030 (millions)
Fig. 10 Projected level of urbanization of the population under various growth scenarios, China2005–2030
152 Popul Environ (2012) 33:137–160
123

to approximately 835 million by 2030. The share of 0–14 year olds will decline
from 24.2 to 15.4% between 2000 and 2030, while the share of those aged 60 and
above will rise from 10.3 to 24.7%.
For all three scenarios, the working population (15–59 year olds) will comprise a
larger share of the total population in urban as compared with rural areas due to the
migration of younger workers. Aging of the rural population will be faster than that
of the urban population, as indicated in the projected rural and urban population
pyramids for 2030 (see Fig. 12). In the M scenario, the urban population will
increase to 59% of the total population by 2030, which implies a net additional
balance of over 287 million rural-to-urban migrants over the next 30 years. The
level of education of urban populations will similarly rise, thus sustaining urban
economic growth. However, we project that the rural population’s education level
will follow the trend of the last 20 years: though the number of rural residents with
no primary education will decrease, the share with an intermediate level will remain
essentially unchanged due to the tendency for people with more schooling to
migrate to urban areas.
City projections
Net migration will be an important determinant of population growth in Beijing and
Shanghai over the next three decades. Figure 13 illustrates reasonable alternative
sizes for the future population of Beijing and Shanghai under three migration policy
scenarios. The results show that (1) without new migration, Shanghai’s negative
natural growth, which began in 1994, will dominate city size, as population declines
from 14.5 to 12.9 million. Similar results apply for Beijing, where population
declines from 10.5 to 9.8 million from 2000 to 2030 without new migration
(scenario N); (2) if both cities relax their migration policies, allowing the high
recent levels of migration to continue (scenario H) Beijing’s total population will
reach 17 million by 2020 and 21.2 million by 2030; Shanghai’s population is likely
to reach 21.5 million by 2020 and 24.60 million by 2030; (3) with migration
Fig. 11 Age Distribution Trends, 2000–2030, China, M Scenario
Popul Environ (2012) 33:137–160 153
123

Fig. 12 Trends in age structure and education by urban and rural region under scenario M
154 Popul Environ (2012) 33:137–160
123

controlled according to government plans, Beijing will reach 19 million inhabitants,
and Shanghai 23 million by 2030 (scenario M), with changing age, sex, and
educational structures, as described below.
Young migrants will offset decline in workforce
Results for all migration scenarios clearly indicate that Beijing and Shanghai will
benefit from a demographic window of opportunity, in the sense that their working
populations will increase for a time. Two results are of particular import: (1) The
decline in workforce implied by low natural growth rates will be offset by an
increasing number of young migrant workers; (2) both cities will have a higher than
average share of the working population in coming decades compared with China as
a whole (Table 3). These trends will significantly affect the socioeconomic and
environmental futures of these regions.
Fig. 13 Comparison with projected sizes for Beijing and Shanghai assuming M fertility with differentassumptions for migration rates
Popul Environ (2012) 33:137–160 155
123

Urban population growth and challenges to sustainability
Under a reasonable range of assumptions for fertility and migration, China will
continue to develop and urbanize over the next two decades. Rapid urbanization will
pose major challenges with respect to demography, the environment, energy, and
the labor market, not only in mega-urban regions but in China as a whole. We raise
a few crucial questions with regard to the implications of urbanization projections
for challenges to sustainable development.
How will anticipated urban growth affect consumption and availability of landand water? These key resources foster social and economic development and are
indispensable for urban growth, but are also highly sensitive to the pace and scale of
urbanization. Urbanization was the cause of major land-cover changes in China
during the last decade of the twentieth century, as land devoted to urban uses grew
by nearly 25% (Liu et al. 2005). Urban land expansion is considered a great threat to
agricultural production and food security: a loss of agricultural labor will affect
production, and several regions are already facing problems relating to abandoned
agricultural land (Deng et al. 2010). Moreover, at present, of the 640 major cities in
China, more than 300 face water shortages to some degree and about 100 cope with
severe scarcity (World Resource Institute, 1999).
To what extent will the segregated labor market and social protection be affectedby continued urbanization? To what extent can social security be extended to coverthe rural population? We have shown how internal migration and fertility will
affect the size, distribution, and demographic characteristics of urban and rural
populations in China in decades to come. Given the continued existence of labor
market segregation, unequal pay between urban and rural migrant workers, the
exclusion of most rural migrants from urban welfare systems, and migration
Table 3 Age distribution for
China and for city of Beijing and
Shanghai under scenario M
Total
millions
0–14
%
15–59
%
60 and above
%
Nation
2000 1263.4 24.2 65.5 10.3
2010 1342.8 18.6 68.7 12.6
2020 1394.5 17.9 65.0 17.1
2030 1392.3 15.4 60.0 24.6
Beijing
2000 10.5 13.6 73.9 12.5
2010 13.5 11.0 76.0 13.0
2020 16.5 13.2 68.0 18.8
2030 19.0 10.7 63.9 25.4
Shanghai
2000 14.5 12.6 71.9 15.6
2010 16.8 10.0 74.0 16.1
2020 19.7 12.2 65.6 22.6
2030 22.7 9.7 63.1 27.2
156 Popul Environ (2012) 33:137–160
123

restrictions, policies that affect migration and fertility will play critical roles in the
welfare of Chinese citizens. Although rural–urban migrants achieve higher
educational attainment than the rural population, an educational gap continues to
exist between them and non-migrant urban residents (Fu 2005). Moreover, the
emergence and expansion of rural labor migration has led to a significant increase in
urban poor. Although China has taken major steps to reduce poverty, urban poverty
has been rising since the 1990s: the urban poverty rate was estimated at 5.0% in
1999 (Meng et al. 2005). Rapid urban growth has seriously outstripped the capacity
of some cities to provide their residents—in particular rural–urban migrants—with
adequate basic services. Furthermore, the migration of young workers will leave
rural China with a rapidly aging population which is not, for the most part, covered
by the social security system. Policies to eliminate the segregation of the labor
market and of social protection, as well as policies on social security issues for low-
income migrants and the rural population should be considered, to avoid the risk of
an increase in the number of poor. The Chinese government has argued for
education and health care reform for migrants and is undertaking considerable
efforts to provide education and health insurance to migrant families.
How should China mitigate pressure from unemployed, unskilled workers fromthe export sector? In the wake of the current global economic crisis and its impact
on China’s export sector, China is trying to resolve its over-reliance on export
growth, as declining external demand and soaring protectionist pressures weaken
any measure by which exports are stimulated. Alternatively, China could promote
employment by opening up and further developing its service sector. The service
sector is not only labor intensive but also demands a higher level of education of its
participants. It therefore has great potential to absorb both the rural population’s
abundant labor resources and unemployed, skilled export sector labor. However,
economic transformation will be challenging if China’s rural labor force remains
minimally educated. As China’s economy continues to feel the brunt of the global
crisis, the question of how China will transform its export-driven growth model into
a domestic demand-driven one to sustain its long-term economic growth is critical.
What are the likely environmental and health impacts of continued urbanization?In the last two decades, increasing environmental pollution has been linked to the
changes in urban consumption patterns in China, as well as to the urban automotive
and construction industries. Air pollution has developed into a serious problem in a
number of cities, and haze frequently hangs over cities and entire regions (Tang
2005). Acid rain, smog, and organic pollution in rivers and lakes all increasingly
threaten human health. Urban management has thus become quite complex and
requires the integration of economic growth and environmental protection into a
coherent overall framework of urban development (Tang 2005).
Conclusions
The historical trajectory and future path of urbanization in China has clear policy
importance. We applied a multistate method of urbanization projection to capture
important demographic dynamics across the rural/urban axis, including regional
Popul Environ (2012) 33:137–160 157
123

population mobility and redistribution, age and sex composition, and educational
attainment, all of which are fundamental to understanding urbanization processes.
These trends have the potential to significantly alter the outlook for socioeconomic
and environmental development in China.
China will continue to develop and urbanize over the next three decades. The
proportion urban will continue to rise and net migration will be an important
determinant of population growth. Moreover: (1) The working population will
represent a larger share of the total population in urban as compared with rural areas
due to the migration of young workers from rural to urban areas; (2) consequently,
the aging process of the rural population will be faster than that of the urban
population; and (3) in metropolitan regions, the decline of the workforce based on
natural growth will be offset by an increasing volume of young migrant workers,
and these regions will thus have a higher than average share of the working
population in future decades than China as a whole. China’s economy will continue
to enjoy strong economic growth which will further promote its key metropolises,
thus ensuring that they acquire some or all of the attributes of regional or global
hubs. The mega-urban regions of Beijing and Shanghai have achieved high levels of
growth in a short period of time; if they remain dominant in the Chinese context,
they could have the best prospects among East Asian mega-urban regions of
becoming global centers in the future.
Yet, this growth does not come without cost. China faces major challenges,
including: (1) land, water, and energy constraints; (2) pollution; (3) rural–urban
labor market segregation; (4) rural–urban distinctions in social protection (e.g.,
social security); (5) transition to a domestic demand-driven economy, and (6)
absorption of surplus rural labor. Integrating rural and urban economic and social
development and managing both urban and rural development under rapid
urbanization are the greatest challenges China will face in coming decades. Current
trends emphasize the urgent need to build and support the capacity of various levels
of urban regional development to effectively manage social, economic, and
environmental issues. The challenge of achieving sustainable urban development in
China is of global importance.
Acknowledgments This paper is the result of a joint project of the International Institute for Applied
Systems Analysis (IIASA) and Peking University: ‘‘Regional Urbanization and Human Capital
Projections for China.’’ It was carried out with the support of the National Natural Science Foundation
of China (No. 70373011). The authors are especially grateful to Hai-Tao Wang, Qiang Ren, Bo Yu, and
Bingzi Zhang for their assistance in data collection and model simulation.
References
Beijing Statistics Bureau. (2004). Collection of papers on the 2000 census of Beijing. Beijing: Chinese
Population Publishing House.
Blum, W. E. H. (1997). Soil degradation caused by industrialization and urbanization. In Proceedings ofthe international conference on problems of anthropogenic soil formation, Moscow.
Bocquier, P. (2005). World urbanization prospects: An alternative to the UN model of projection
compatible with the mobility transition theory. Demographic Research, 12, 197–236.
158 Popul Environ (2012) 33:137–160
123

Cai, F., Du, Y., & Wang, M.-Y. (2002). What determine Hukou system reform? A case of Beijing.
Working Paper Series No. 15, 2002. Institute of Population and Labor Economics, Chinese
Academy of Social Sciences.
Cai, F., Du, Y., & Wang, M-.Y. (2009). Migration and labor mobility in China. Human Development
Research Paper, 2009/9. UNDP, United Nations, New York.
Cao, G.-Y., & Lutz, W. (2004). China’s future urban and rural population by level of education. In W.
Lutz & W. Sanderson (Eds.), The end of world population growth in the 21st century: Newchallenges for human capital formation and sustainable development. London: Earthscan.
Chen, G., Cao, G.-Y., & Liu, Y.-B. (2006). Projection of urbanisation and its social and environmental
impacts for Beijing (in Chinese). Journal of Demographic and Market Analysis, 5, 21.
China Population Information and Research Center. (2005). http://www.cpirc.org.cn/yjwx/yjwx_
detail.asp?id=12057.
China Daily. (2010). China urges more efforts for rural-urban integration. http://www2.chinadaily.com.
cn/bizchina/2010-02/01/content_9408673.htm.
Cohen, B. (2004). Urban growth in developing countries: A review of current trends and a caution
regarding existing forecasts. World Development, 32(1), 23–51.
Deng, X.-Z., Huang, J.-K., Rezelle, S., & Uchida, E. (2010). Econnomic growth and the expansion of
urban land in China. Urban Studies, 47(4), 813–843.
Fu, T.-M. (2005). Unequal primary education opportunities in rural and urban China. China Perspectives,
(60), Jul–Aug 2005. Electronic ISSN 1996-4617.
Guo, Z.-G., Zhang, E.-L., Gu, B.-C., & Wang, F. (2003). Policy fertility and diversity of fertility policies
in China. Population Research (in Chinese), 5, 1–5.
Hu, A. G. (2010). Reviewing of issue of adjusting population policy in China. In Y. Zeng, B. C. Gu, & Z.
G. Guo (Eds.), Population and economic growth under the low fertility in China (pp. 190–197).
Beijing: Peking University Press.
Liu, S.-H., Li, X.-B., & Zhang, M. (2002). CHINAGRO PROJECT: Scenario analysis on urbanisationand rural-urban migration in China. Interim Report IR-03-036, Laxenburg: International Institute
for Applied Systems Analysis (IIASA).
Liu, J., Zhan, J., & Deng, X. (2005). Spatio-temporal patterns and driving forces of urban land expansion
in China during the economic reform era. Ambio, 34(6), 450–455. Royal Swedish Academy of
Sciences.
Lutz, W., & Goujon, A. (2001). The world’s changing human capital stock: Multi-state population
projections by educational attainment. Population and Development Review, 27(2), 323–339.
Meng, X., Gregory, R., & Wang,Y.-J. (2005). Poverty, inequality, and growth in urban China, 1986–
2000. IZA Discussion Paper No. 1452. Bonn: Forschungsinstitut zur Zukunft der Arbeit (Institute
for the Study of Labor) (IZA).
National Development and Reform Commission. (2006a). Population development ‘‘Eleventh Five-Year’’and 2020 planning. www.ndrc.gov.cn/shfz/t20070608_140568.htm.
National Development and Reform Commission. (2006b). The national 11th five-year national economicand social development plan 2005–2010. http://www.ndrc.gov.cn/gjscy/cxtx/t20060322_63736.htm.
NBS. (2001a). China population statistics yearbook. Beijing: China Statistics Press.
NBS. (2001–2005). Beijing and Shanghai statistics yearbook. Beijing: China Statistics Press.
NBS. (2001–2009). Statistics yearbook. Beijing: China Statistics Press.
NBS. (2003). China population statistics yearbook. Beijing: China Statistics Press.
NBS. (2009). Statistics yearbook 2009. http://www.stats.gov.cn/tjsj/ndsj/2009/indexch.htm.
NBS (National Bureau of Statistics of Guangdong). (2002). Tabulation on 2000 population census of the
People’s Republic of China. Population Census Office under the State Council & Department of
Population, Social, Science and Technology Statistics, Beijing.
NBS (National Bureau of Statistics of the People’s Republic of China). (2002). China Census, CD ROM
from the Beijing University, Population Institute and Health Center, Beijing.
O’Neill, B. C., & Scherbov, S. (2006). Interpreting UN urbanization projections using a multi-statemodel. Interim Report IR-06-012, Laxenburg: IIASA.
People’s Daily. (2006). The driving forces for accelerating ecomomic growth during the national 11thfive-year (2005–2010). http://www.ndrc.gov.cn/mtbd/t20060626_74445.htm.
Population and Development Center, People’s University. (2007). How high is the Fertility Level in
Current China? http:\\www.pds.ruc.cn/learing/showNews.asp?ID=386.
Rogers, A. (1983). Regional population projections for IIASA nations. Working Paper WP 83–41.
Laxenburg: IIASA.
Popul Environ (2012) 33:137–160 159
123

Steinbock, D. (2010). China’s urbanization: It has only just begun. New Geography. http://www.newgeo
graphy.com/content/001906-china%E2%80%99s-urbanization-it-has-only-just-begun.
Tang, X.-Y. (2005). The characteristics of urban air pollution in China–XIAOYAN TANG, in book:Thinking strategically: The appropriate use of metrics for the climate change science program.
Committee on Metrics for Global Change Research, Climate Research Committee, National
Research Council. ISBN: 0-309-55042-4, 162 pages, 6 9 9 (pp. 47–54). http://www.nap.edu/cata
log/11292.html.
Toth, F. L., Cao, G.-Y., & Hizsnyik, E. (2003). Regional population projections for China. InterimReport, IR-03–042. Laxenburg: International Institute for Applied Systems Analysis (IIASA).
UN. (2002). World urbanization prospects. The 2001 revision. New York: United Nations.
Urban Development Report. (2005). The Chinese major association. Urban Development Report 2005.
The Publishing House of City. ISBN 7-5074-1759-X. Bejing China.
Wang, D. W. (2009). The current challenge of employment affecting by the global economic crisis. The
Institute for Labor Economics, the Chinese Academy of Social Sciences, http://www.iple.cass.cn/
show_asp?id=27219.
Wang, G.-X., & Yin, Y.-Y. (2000). Research on Shanghai’s sustainable development. Shanghai: The
Economic and Finance Press of Shanghai. In Chinese.
World Resource Institute. (1999). China’s health and environment: Water scarcity, water pollution, andhealth. http://www.wri.org/publication/content/8412.
Zhang, M. (2009). The global economic crisis affecting to China’s economy. Policy Brief No. 09028, The
Institute for World Economy and Politics, the Chinese Academy of Social Sciences.
160 Popul Environ (2012) 33:137–160
123