urban air pollution evaluation and … air pollution evaluation and...urban air pollution evaluation...
TRANSCRIPT
Antai Raphael Eduk, IJSIT, 2017, 6(2), 036-048
IJSIT (www.ijsit.com), Volume 6, Issue 2, March-April 2017
36
URBAN AIR POLLUTION EVALUATION AND MITIGATION: A CASE STUDY
OF UYO CITY, NIGER DELTA, NIGERIA
Antai Raphael Eduk
Institute of Natural Resources, Environment and Sustainable Development, University of Port Harcourt, Choba,
Nigeria.
Inter-Environments Limited, Rumuodara, Port Harcourt, Nigeria.
ABSTRACT
Air pollution has been identified as one of the most critical environmental problems confronting Uyo
city. Traffic and industry are the major air pollution sources in the region. Impact on socioeconomic,
ecosystems health, properties and climate have been linked with the pollution episodes in the area but which
requires substantial scientific and empirical evidence. Multiple factors especially lack of equipment,
inadequate skilled personnel and poor policy frame work have militated against effective and qualitative air
quality studies in the area. To achieve long term goals for the region in this regard that would lead to the
overall benefit of the people in the area, there is need therefore to employ a holistic and integrated approach
to air pollution management that will involve all the stakeholders.
Keywords: Pollution, Uyo, Enviroment, Mitigation, Evaluation
Antai Raphael Eduk, IJSIT, 2017, 6(2), 036-048
IJSIT (www.ijsit.com), Volume 6, Issue 2, March-April 2017
37
INTRODUCTION
Air pollution can be defined as natural and anthropogenic substances in the atmosphere -air which
exhibit negative impacts or effects on both biotic and abiotic inhabitants at the higher or unbearable
concentration of the substances in the air. The atmosphere with its natural state has fixed a proportion of
0.03% of argon, 0.3% of carbon dioxide, 21% of oxygen and nitrogen with 78%. When these proportions of
the natural state are altered with introduction of external substances such as gases, fume, aerosols, liquid
drop or particulate matter from natural phenomenon (such as volcanic eruption) and man activities (such as
burning of hydrocarbon), the atmospheric environment is polluted in direct proportion to the increase in
concentration of the external substances being released into the atmosphere. These external substances
which find their ways into the atmosphere to destabilize the natural ambient air level are known as air
pollutants. Adverse effects of man’s exploitation of natural resources to meet his needs have thus causes him
and the ecosystem more harm than good. This is more expedient if not checked, monitored, controlled and
evaluated on time for the policy decision making to caution man on his undue activities on the environment.
Air pollution causes negative impacts which have local, regional, continental and global significance
(Narayanan, 2009).
The focus of this research work is Uyo which is the capital of Akwa Ibom State. It may be pertinent to
note that most residents of Uyo may not be aware of the level of air pollutants in the atmosphere in uyo, their
effects on human life and the environment. Therefore, they show little or no concern about the quality of air
they inhale.
Objectives of the Present Study:
Determine if there are any pollutants above regulatory limits and whether they are from point or
non- point sources.
Challenges of air quality studies in the Uyo city:
Air quality studies in the studied area are still in its infant stage and encumbered with several
challenges. Other obvious and prominent drawbacks are as follows
Lack of emissions inventory/database due to lack of consistent and systematic measurements
Unavailability of air pollution and GHG monitoring stations in the Niger Delta. This is based on
information from World Data Centre for Greenhouse Gases
Few independent and research-based measurement data are not readily available for general public use
Lack of collaboration between key regulatory authorities
Laxity in the enforcement of emission regulations
Antai Raphael Eduk, IJSIT, 2017, 6(2), 036-048
IJSIT (www.ijsit.com), Volume 6, Issue 2, March-April 2017
38
Air quality assessment and air pollution studies have focused mainly on urban centres
Significance of the Study:
Investigating air quality and noise level in the research work would entail monitoring and
assessment of the presence and concentration of noxious gases in the study area. The gases include Volatile
Organic Compounds (VOCs), Nitrogen Dioxide (NO2), Sulphur Dioxide, (SO2),Hydrogen Sulphide (H2S), Carbon
Monoxide (CO), Ammonia (NH3) and Methane (CH4), including Particulate Matter and Noise level at the
selected sampling locations. This is necessary for this study because the noxious gases, particulate matter and
noise are dangerous to human health and environment as detail below:
Carbon Monoxide (CO):
Carbon Monoxide (CO) is a colourless, odourless and tasteless gas produced by the incomplete
combustion of carbonaceous materials or fossil fuels-gas, oil coal and wood. Adverse health effect has been
observed with Carbon Monoxide concentrations of 12 – 17ppm for 8 hours Canter, (1977) while prolonged
(45 minutes to 3 hours) exposure to concentration of CO between 200ppm and 800ppm often results in
severe headache, dizziness, nausea and convulsions which might also lead to death (CCDI, 2001).
High Carbon Monoxide concentration can reduce the amount of Oxygen taken up by the brain to the
point that the person becomes unconscious and can suffer brain damage from shortness of Oxygen, Carbon
Monoxide may contribute to the green house effect and global warming (USEPA, 1990).
Carbon Monoxide (CO) is due to the incomplete combustion of Hydrocarbon. Reduction in the
gaseous emission of generator will eventually lead to reduction in exposure level, as exposure to this toxic gas
can lead to significant toxicity of the central nervous system and heart. It also has severe effect on the foetus
of a pregnant woman (Wikipedia encyclopedia, 2006). It affects the transport of Oxygen by the blood;
therefore care should be taken for it not to exceed the regulatory allowable limit.
Climate and Meteorology:
Visibility:
The weather in the area is cloudy on most days because of high relative humidity values recorded.
Fogs are formed impairing visibility to less than 1km in June through September (the most humid months),
morning mist is usually observed with visibility as low as 200m and remaining below 2km for a number of
days, thus constituting a serious hazard to land and air transport. Generally, visibility, especially in the dry
season is foggy in the early hours of the day (5 to 9am) and improves as the day progresses (Derek et al.,
Antai Raphael Eduk, IJSIT, 2017, 6(2), 036-048
IJSIT (www.ijsit.com), Volume 6, Issue 2, March-April 2017
39
1987).
Sunshine:
The mean sunshine in the area is between five (5) and six (6) hours in the dry season and three (3) to
five (5) hours in the wet season (Ayoade, 1988). Uyo and neighbourhood experience a mean annual sunshine
of 1406 which represents 31% of maximum possible amount of sunshine in the environment. The lowest
values of sunshine are recorded between July and September with about 2 hours of sunshine per day due to
greater amount of cloudiness in the sky (Ayoade, 1988).
Closely tied to the wet/dry season is the sunshine hour. The mean annual sunshine hour is over
1,500 hours. The longest monthly sunshine hours occur in December/January in the dry season while July
usually expresses the lowest value. This is due to almost constant cloudiness from rain clouds in the wettest
month. In general, the amount of net radiation can be a correlation of sunshine hours. The longer the
number of sunshine hours, the greater the net radiation and therefore air temperature is highest during the
dry season except when the relatively cold harmattan winds counteract this.
Geomorphology:
Flood plains, sandy ridge complexes separated by muddy swamp define the project area. Also, as in
all Nigerian coastal states bordering the Atlantic Ocean, coastal erosion affects the vicinity of the project site
because, the low-lying terrain consists of unconsolidated mud and sandy particles, which present no serious
resistance to the impact of breaking waves and the flood currents associated with the shoreline. The
groundwater depth ranges from about 1.5 to 6.0m while the natural near surface soil comprises very loose
sand.
Antai Raphael Eduk, IJSIT, 2017, 6(2), 036-048
IJSIT (www.ijsit.com), Volume 6, Issue 2, March-April 2017
40
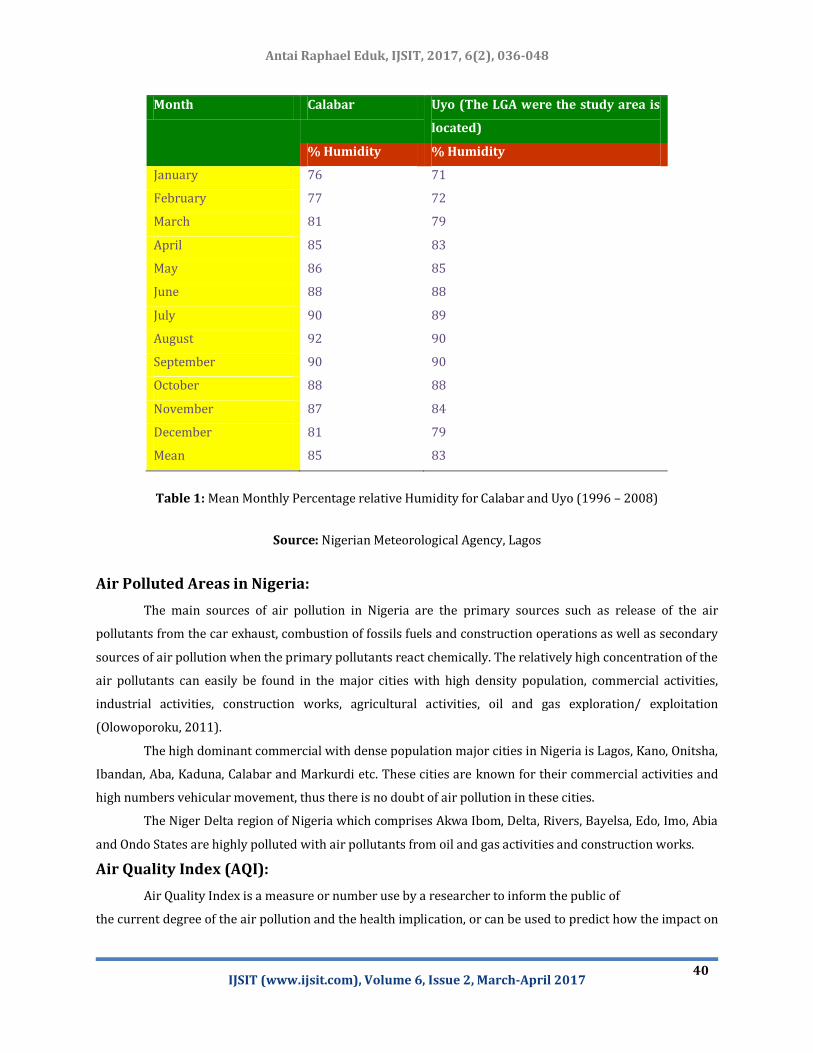
Month Calabar Uyo (The LGA were the study area is
located)
% Humidity % Humidity
January 76 71
February 77 72
March 81 79
April 85 83
May 86 85
June 88 88
July 90 89
August 92 90
September 90 90
October 88 88
November 87 84
December 81 79
Mean 85 83
Table 1: Mean Monthly Percentage relative Humidity for Calabar and Uyo (1996 – 2008)
Source: Nigerian Meteorological Agency, Lagos
Air Polluted Areas in Nigeria:
The main sources of air pollution in Nigeria are the primary sources such as release of the air
pollutants from the car exhaust, combustion of fossils fuels and construction operations as well as secondary
sources of air pollution when the primary pollutants react chemically. The relatively high concentration of the
air pollutants can easily be found in the major cities with high density population, commercial activities,
industrial activities, construction works, agricultural activities, oil and gas exploration/ exploitation
(Olowoporoku, 2011).
The high dominant commercial with dense population major cities in Nigeria is Lagos, Kano, Onitsha,
Ibandan, Aba, Kaduna, Calabar and Markurdi etc. These cities are known for their commercial activities and
high numbers vehicular movement, thus there is no doubt of air pollution in these cities.
The Niger Delta region of Nigeria which comprises Akwa Ibom, Delta, Rivers, Bayelsa, Edo, Imo, Abia
and Ondo States are highly polluted with air pollutants from oil and gas activities and construction works.
Air Quality Index (AQI):
Air Quality Index is a measure or number use by a researcher to inform the public of
the current degree of the air pollution and the health implication, or can be used to predict how the impact on
Antai Raphael Eduk, IJSIT, 2017, 6(2), 036-048
IJSIT (www.ijsit.com), Volume 6, Issue 2, March-April 2017
41
the air polluted areas will be. The high percentage of severe adverse health effects that will be experience by
public is directly proportional to the increase in concentration of the air pollutants in Air Quality Index.
Concentration of the air pollutants constituents in the study areas can be evaluated and used to calculate Air
Quality Index. Air Quality Index is the vital tool to analyze and representing air quality status in a uniform
manner. The relative change in the group of air pollutants constituents concentration in two situations can be
assessed by a measure of Air Quality Index (Chelana et al, 2002). The stipulated regulatory limits can be
compared with the relative change in concentration of the air pollutants. Different countries have their AQI.
The monitoring or modeling of air pollutants concentration in a given areas aids in calculating AQI. Different
Colour codes are used to describe or range the air pollutants concentration. Thus, AQI is a colour coded chart
which is used to classifies the air quality of the study areas with the associated health implications.
Presentation of data gathering during air quality field data monitoring to the public understanding has been
one of the challenges in air quality studies. AQI is an index help for reporting air quality of the studying areas
on the daily basis. It gives information about the purity/cleanliness or the degree of the air pollutants of the
areas with the associated health effects that might be a concern for individual.
METHODOLOGY
Air Quality Monitoring Criteria:
The following air quality criteria were chosen:
i. Federal Ministry of Environment (FMENV) guidelines for air quality monitoring, including the
National Guideline for Environmental Audit (1991)
ii. Emissions and Hazardous Waste Management in Nigeria (1991).
iii. Akwa Ibom State Ministry of Environment and Mineral Resources Guidelines
iv. (AKEPWA Law No.8 of 2000).
v. ISO 14001: 2004 Environmental Management System Standards.
World Health Organisation. Population density, topography, industrial clusters, heavy traffic guidelines.
The Series 500 monitor Aeroqual is a portable meter with the high sensitive replaceable sensors of
different gaseous air pollutants. The portable meter measured Volatile Organic Compounds (VOCs), Nitrogen
dioxide (NO2), Sulphur dioxide (SO2), Hydrogen Sulphite (H2S), Carbon Monoxide (CO), Ammonia (NH3) and
Methane (CH4) by the principle of light absorption and emission. The infrared waves length of the parameters
are not the same (different).Nitrogen dioxide (NO2) has0.001ppm detection limit, Methane (CH4) detection
limit is 1.0ppm while other air pollutants stated above have 0.01ppm detection limit.
Antai Raphael Eduk, IJSIT, 2017, 6(2), 036-048
IJSIT (www.ijsit.com), Volume 6, Issue 2, March-April 2017
42
Methods of Data Analysis:
The result of the air pollutants collected during the study was analyzed using descriptive statistics
(Mean and Standard Deviation) and regression analysis.
Regression Analysis:
Let y represent the dependent variable (pollutant) and x1, x2 and x3 represent the independent
variables (which are the meteorological variables, in this case, temperature (oc), wind speed (m/s), and
humidity (%).
Mathematically,
y = ao +a1x1 +a2x2 +a3x3
where, a1,a2, and a3 are constants. Furthermore, a0 represents the intercept on the vertical axis.
RESULTS AND DISCUSSION
The results of respirable particulate matter (RPM) PM10, PM7, PM4, PM2.5and PM1, Total Suspended
Particulate (TSP) including gaseous air pollutants and noise level that were monitored in Uyo metropolis are
presented below.
i. Effects of Temperature (oC), Wind speed (m/s) and Humidity (%) on PM4
PM4 = 206.923 + 3.842(T) – 17.120(W/S) – 3.179(H)
R=0.638, R2 = 0.406 (40.6%), Adj. R2 = 0.245 (24.5%), p-value = 0.113.
Because the calculated p-value (0.113) is greater than the critical p-value (0.05), i.e. pcal (0.113)>pcrit
(0.05), it is concluded that the meteorological variables (temperature, wind speed and humidity) do not
have significant effect on PM4.
ii. Effects of Temperature (oC), Wind speed (m/s) and Humidity (%) on PM2.5
PM2.5 = 10.328 + 2.244(T) – 7.194 (W/S) – 0.437(H)
R=0.462, R2 = 0.214 (21.4%), Adj. R2 = 0.00 (0%), p-value = 0.430.
Antai Raphael Eduk, IJSIT, 2017, 6(2), 036-048
IJSIT (www.ijsit.com), Volume 6, Issue 2, March-April 2017
43
Because the calculated p-value (0.430) is greater than the critical p-value (0.05), i.e. pcal (0.430)>pcrit
(0.05), it is concluded that the meteorological variables (temperature, wind speed and humidity) do not
have significant effect on PM2.5.Akpan Andem Market by Udoumana recorded the highest concentration
of SO2 because of the presence of relatively high volume of combustion activities from both diesel and
PMS engines due to heavy traffic congestion and road intersection where long vehicular waiting was
observed at the time of monitoring Various studies including Mmom et al.,(2014), Udontong, (2015) and
Jimmy et al.,(2013) also reported the same high values of SO2 during peak period. Hence, the findings are
in agreement that the concentration levels of SO2 is as a result of heavy traffic with high densely
clustered people with commercial activities around the study location. This was observed during the
peak periods (morning and evening) when many people were going and coming back from offices and
other businesses.
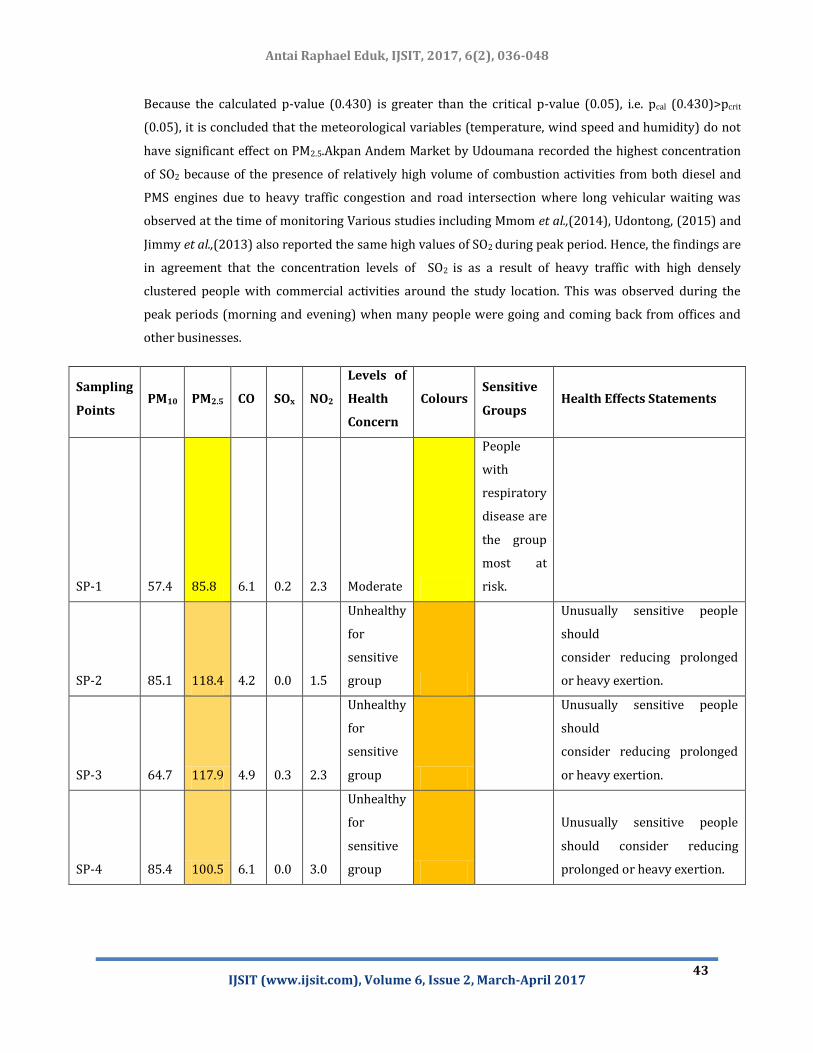
Sampling
Points PM10 PM2.5 CO SOx NO2
Levels of
Health
Concern
Colours Sensitive
Groups Health Effects Statements
SP-1 57.4 85.8 6.1 0.2 2.3 Moderate
People
with
respiratory
disease are
the group
most at
risk.
SP-2 85.1 118.4 4.2 0.0 1.5
Unhealthy
for
sensitive
group
Unusually sensitive people
should
consider reducing prolonged
or heavy exertion.
SP-3 64.7 117.9 4.9 0.3 2.3
Unhealthy
for
sensitive
group
Unusually sensitive people
should
consider reducing prolonged
or heavy exertion.
SP-4 85.4 100.5 6.1 0.0 3.0
Unhealthy
for
sensitive
group
Unusually sensitive people
should consider reducing
prolonged or heavy exertion.
Antai Raphael Eduk, IJSIT, 2017, 6(2), 036-048
IJSIT (www.ijsit.com), Volume 6, Issue 2, March-April 2017
44
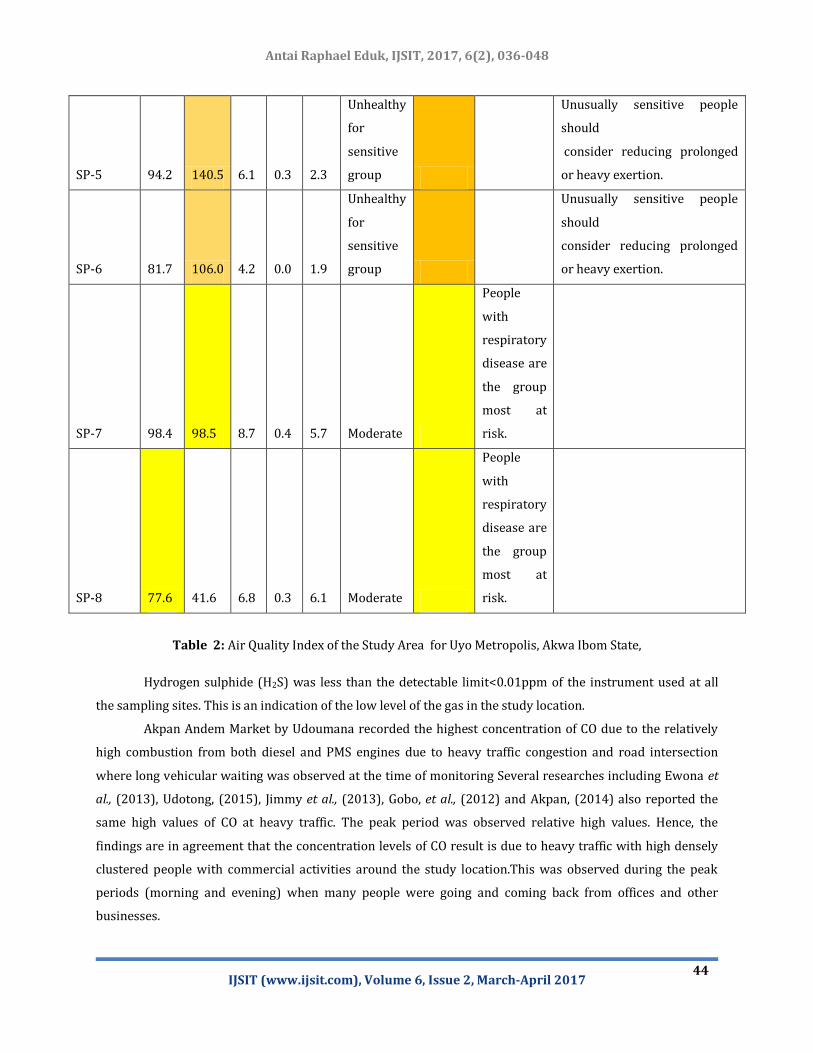
SP-5 94.2 140.5 6.1 0.3 2.3
Unhealthy
for
sensitive
group
Unusually sensitive people
should
consider reducing prolonged
or heavy exertion.
SP-6 81.7 106.0 4.2 0.0 1.9
Unhealthy
for
sensitive
group
Unusually sensitive people
should
consider reducing prolonged
or heavy exertion.
SP-7 98.4 98.5 8.7 0.4 5.7 Moderate
People
with
respiratory
disease are
the group
most at
risk.
SP-8 77.6 41.6 6.8 0.3 6.1 Moderate
People
with
respiratory
disease are
the group
most at
risk.
Table 2: Air Quality Index of the Study Area for Uyo Metropolis, Akwa Ibom State,
Hydrogen sulphide (H2S) was less than the detectable limit<0.01ppm of the instrument used at all
the sampling sites. This is an indication of the low level of the gas in the study location.
Akpan Andem Market by Udoumana recorded the highest concentration of CO due to the relatively
high combustion from both diesel and PMS engines due to heavy traffic congestion and road intersection
where long vehicular waiting was observed at the time of monitoring Several researches including Ewona et
al., (2013), Udotong, (2015), Jimmy et al., (2013), Gobo, et al., (2012) and Akpan, (2014) also reported the
same high values of CO at heavy traffic. The peak period was observed relative high values. Hence, the
findings are in agreement that the concentration levels of CO result is due to heavy traffic with high densely
clustered people with commercial activities around the study location.This was observed during the peak
periods (morning and evening) when many people were going and coming back from offices and other
businesses.
Antai Raphael Eduk, IJSIT, 2017, 6(2), 036-048
IJSIT (www.ijsit.com), Volume 6, Issue 2, March-April 2017
45
Itam Market by Gdluck Jonathan Fly Over recorded the highest mean value of NH3. The presence of
N3 could be attributed to open dump for market rotten wastes, unclean gutter, septic tanks, household
wastes, manures for agriculture, and agricultural and urban runoff (fertilizer) that were observed at the
monitoring locations. Several works studies including Udotong, (2015), Gobo, et al., (2012) and Hassan et al.,
(2012) also reported the same rationale for the detection of NH3 in our cities. Hence, this study is in
agreement that the concentration levels of NH3result is due to the above stated causes.ll The highest mean
concentration of methane in the study area was observed at Four Lane Roundabout by Nwaniba Road. The
detection of CH4 could be attributed to biogas from some Government approved dump sites. Several
publications including Udotong, (2015), Ewona, et al., (2013) and Hassan et al., (2012) also reported the same
reason for the presence of CH4 in environment. Hence, this research is in agreement that the concentration
levels of CH4 are due to above source.
The following values were obtained for gaseous pollutants; VOCs mean values ranged from 308.2 -
514.5ppm, NO2 mean data recorded was between 0.13 - 0.56ppm, while SO2 mean data was from <0.01 -
0.3ppm. H2S mean value was <0.01ppm, the COmean values was between 0.23 - 0.76ppm. The mean data
obtainedfor NH3 was between <0.01 - 2.7ppm, while CH4 mean values ranged from <1.0 – 7.0ppm and mean
noise level ranged from 68.8-84.9dB. All these values recorded at the monitoring points for the air pollutants
and noise pollution in the study area were higher than all the values recorded at the control point which are
50.73µg/m3for PM10, 30.4μg/m3 for PM7, 26.8µg/m3 for PM4, 18.7μg/m3for PM2.5, 9.2µg/m3 for PM1,
59.87µg/m3 for TSP, 192.37ppmfor VOCs, 0.03ppm for NO2, 0.03ppm for SO2, <0.01ppm for H2S, 0.66ppm for
CO, 0.66ppm for NH3, <1.0ppm for CH4 and 52.13dB for Noise level. The highest values of PM10was recorded
at Itam Market by Goodluck Jonathan Flyover,PM7 and PM4 highestvalues were at Ekomiman Junction (Ikot
Oku Ikono) while PM2.5 and PM1highest values were recoreded at Nwaniba Roundabout by Oron Road. TSP
highest data was recorded at Itam Market by Goodluck Jonathan Flyover.
Proposed Mitigation Measures:
In order to improve on the current air quality monitoring and assessment programmes in Uyo
Metropolis , there is need to embark on the following:
Develop monitoring mechanisms, regulations and enforcement measures
Institute planning policies to minimize pollution that may be caused by future development.
Government agencies such as the Niger Delta Development Commission (NDDC) should collaborate with
other multinationals and stakeholders in air pollution monitoring to come up with a comprehensive AQM
scheme for the region.
There should be a focus on the reduction of pollution levels from vehicles, industry, gas flaring and
domestic burning of timber, to permissible levels as defined in national and international standards.
Antai Raphael Eduk, IJSIT, 2017, 6(2), 036-048
IJSIT (www.ijsit.com), Volume 6, Issue 2, March-April 2017
46
The impact of air pollution from industrial and vehicular sources on the health of the communities in the
region and its biodiversity needs to be researched in-depth.
Existing air quality monitoring programmes should be re-examined and new ones introduced to
determine the most effective means of mainstreaming national programmes with regional projects to
improve air quality.
Research on air quality should focus on source apportionment of the pollutants in the region
In-depth epidemiological and toxicological studies using risk and exposure assessment tools need to be
carried out to establish causalities between the air pollution exposure factors and the associated health
problems.
Motor vehicles annual testing and other regulations must be created or re-introduced and strictly
enforced.
Focus should be on air pollution models, real-time monitoring of pollutants and speciation of pollutants
from the particulate matter.
There is a need to engage in renewable energy, clean energy and cleaner air initiatives.
Usage of emissions abatement control mechanisms by polluters should be enforced.
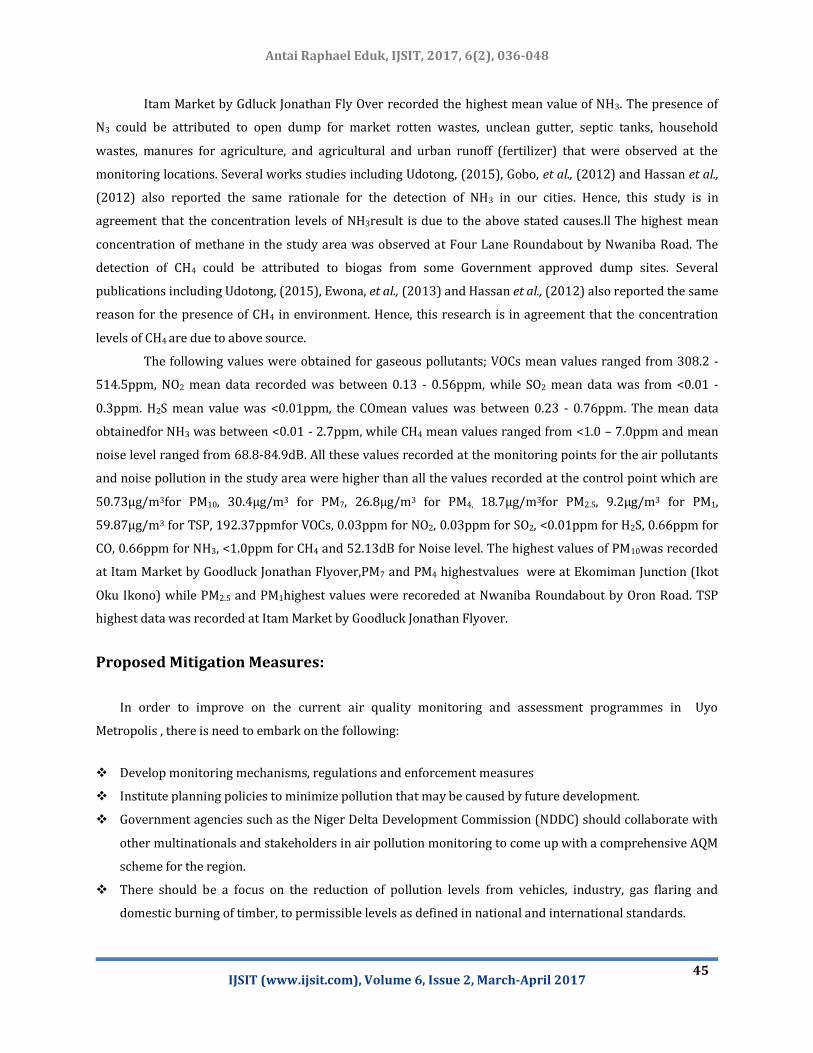
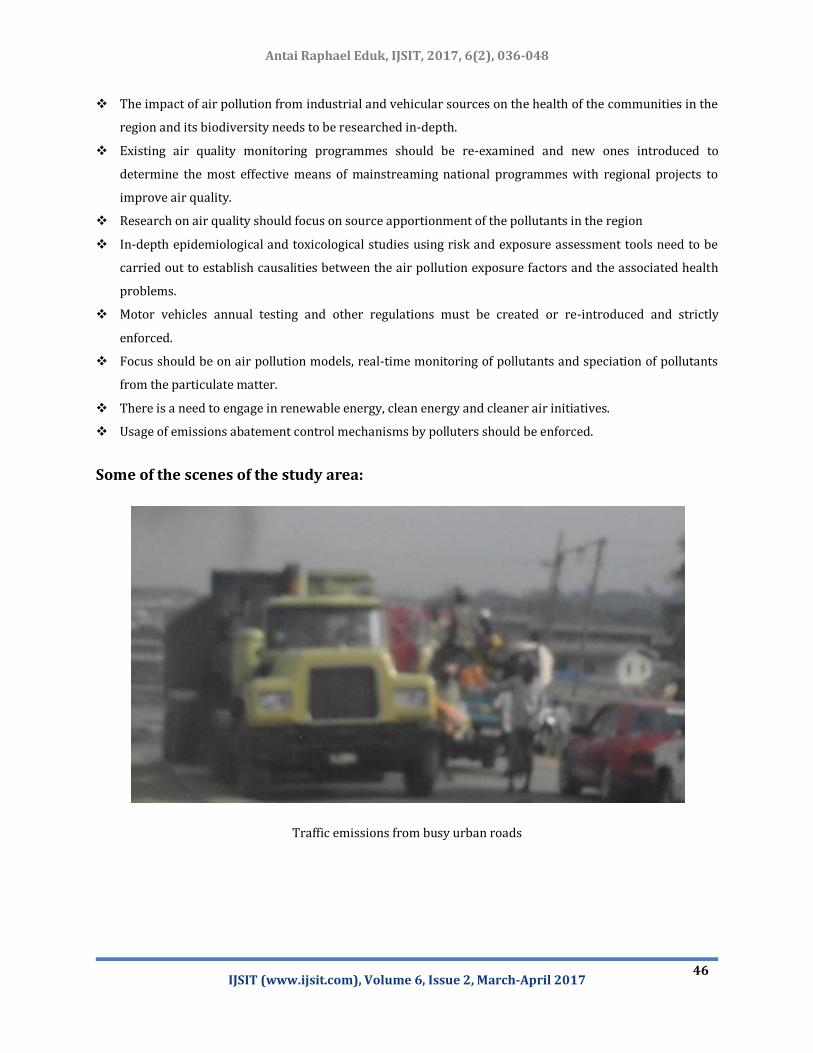
Some of the scenes of the study area:
Traffic emissions from busy urban roads
Antai Raphael Eduk, IJSIT, 2017, 6(2), 036-048
IJSIT (www.ijsit.com), Volume 6, Issue 2, March-April 2017
47
Cooking Fuel emissions from biomass combustion
REFERENCES
1. Narayanan, P. (2009). Environmental Pollution Principles, Analysis and Control Published by Satish Kumar
Jain Darya Ganj, new Delhi, Ijia
2. Canter, L. W.E. (1977).Handbook of variables for Environmental Impact Assessment. Ann Arbour Science
Publishers Inc. Ann ARBOUR. Mich. 48-106.
3. Derek, H. and Oguntoyinbo, J.S.(1987):1 Climatology of West Africa. Published Hutchinson (South Africa)
and Noble Books (Totowa, New Jersey (USA).
4. Ayoade J.O. (1988). Tropical Hydrology and Water Resources.
5. Olowoporoku, D. (2011). How clean is the air Nigeria breathe? A case for national air quality management
framework.
6. Chelana, A. B., Chalapati Rao, C. V., Phadke, K. M. and Hasan, M. Z., (2002).Formation of an Air Quality Index
for India. International Journal of Environmental Studies, 59: 331-342.
7. AKEPWA. Law No.8 of (2000). Akwa Ibom State Ministry of Environment and Mineral Resources
Guidelines.
8. Mmom, P.C. and Essiet U. (2014). Spatio - Temporal Variations in Urban Vehicular Emissions in Uyo City,
Antai Raphael Eduk, IJSIT, 2017, 6(2), 036-048
IJSIT (www.ijsit.com), Volume 6, Issue 2, March-April 2017
48
Akwa Ibom State, Nigeria. Journal of Sustainable Development vol. 7, No4 p.-272 – 280.
9. Udotong, J.I.R. (2015). Air quality Assessment at Traffic Control Points in Uyo Metropolis, Nigeria –
International Journal of Engineering and Technical Research (IJETR) vol. 3, p. 325-331.
10. Jimmy, E.O.I, Solomon, M.S, Peter, A.I. and Asuquo, C. (2013). Environmental Health Implications of
Motorcycles Emitted Gases in a Metropolitan Nigeria. American Journal of Environmental Protection(2014)
2. 7-10.
11. Ewona, I.O., Osang, I.E., Obi, E.O., Udoimuk, A.B., Ushie, P.O. (2013). Air Quality and Environmental Health in
Calabar, Cros River State, Nigeria. Journal of Environmental Science, Toxicology and Food Technology. IOSR
JESTFT: 2319-2402. 6(6). 55-65.
12. Gobo, A.E., Ideriah, T.J.K., Francis, T.E. and Stanley, H.O. (2012). Assessment of Air Quality and Noise around
Okrika Communities, Rivers State, Nigeria. Journal of Applied Science, Environmental Management (March
2012), 16: 75-83.
13. Akpan, P.E, Usip, E.E and Jeremiah, U.O (2014).Impacts of Traffics Volumes on Air Quality in Uyo Urban,
Akwa Ibom State, Nigeria. Journal of environment and earth science vol. no. 21 P. 189 – 2000.
14. Hassan, S.M. and Abdullahi, M. E. (2012). Evaluation of Pollutants in Ambient Air. A Case Study of Abuja,
Nigeria. International Journal of Scientific and Research Publications. 2(12). 1-5.