unseen children
TRANSCRIPT

Unseen children: access and achievement 20 years on
Evidence report


Unseen children: access and achievement 20 years on
Evidence report

Contents
Introduction 4
Chapter 1 Background to access and achievement in education 8
Chapter 2 Access and achievement in education –
20 years on 16
Chapter 3 Investing in high quality early years education and
care for the most disadvantaged children 36
Chapter 4 Tackling the underachievement of disadvantaged
pupils at school level 46
Chapter 5 Tackling the underachievement of disadvantaged
pupils at area level 54
Chapter 6 Getting the best leaders and teachers
to where they are needed most 66
Chapter 7 Further education and vocational skills 84
Members of the Expert Panel 103
Acknowledgements 104
Background papers 107
Schools visited for the good practice survey 108
Unseen children - access and achievement in education 20 years on: This report and associated charts and tables can be viewed online at www.ofsted.gov.uk/accessandachievement.
www.ofsted.gov.uk 3

Introduction
Since taking up the office of Her Majesty’s Chief Inspector at Ofsted in January 2012, I have been focused on what Ofsted can do through inspection to raise educational standards and the quality of teaching. The quality of education and training is, I believe, the most important issue facing Britain today. In the long term, our success as a nation – our prosperity, our security, our society – depends on how well we educate our young people.
Our education system has undoubtedly got much better over the past 20 years and now serves many children well. But a large minority of children still do not succeed at school or college, becoming increasingly less visible as they progress through the system. This unseen body of children and young people that underachieve throughout our education system represents an unacceptable waste of human potential and incurs huge subsequent costs for all of us.
A disproportionate number of these young people are from disadvantaged backgrounds. Right from the early years, there is a strong association between low family income and poor educational outcomes. The Organisation for Economic Co-operation and Development (OECD) highlights this as a particular weakness of the English educational system. It is often called our ‘long tail of underperformance’. We simply cannot have a world-class education system until we solve this problem.
The link between disadvantage and academic failure is far from being an iron law. Deprivation does not determine destiny. Many young people from low income families succeed brilliantly. There are also schools and colleges that overcome the barriers for pupils from low-income families, sending children from the toughest neighbourhoods to the top universities or into highly valued apprenticeships. They do this because they have the highest expectations for each of them and are relentless in what they do to secure excellent headway in realising these expectations.
4 Unseen children: access and achievement 20 years on
Introduction

1. Access and achievement in urban education, Ofsted, 1003; www.ofsted.gov.uk/resources/access-and-achievement-urban-education. 2. The areas looked at were: Hartcliffe, Bristol; West Chaddesden, Derby; Thamesmead, London Borough of Greenwich; Orchard Park, Kingston upon Hull; Wythenshawe, Manchester; Britwell and Northborough, Slough; and Tilbury, Thurrock. 3. Access and achievement in urban education: 10 years on – a speech to the Fabian Society by David Bell, chief inspector of schools; www.guardian.co.uk/education/2003/nov/20/schools.uk3.
I believe that poverty of expectations bears harder on educational achievement than material poverty – hard though that can be – and these expectations start in the home. Children from disadvantaged backgrounds very often have high ambitions, especially when they are young. But the odds against achieving them can worsen with age. All too often, there comes a point at which expectations shrink. They don’t see their elder sister or her friends going to university, so they think it’s not for them. Or no-one in their household is in paid work, so they don’t expect to get a job. But where the family is supportive and demanding – of the child and of their school – then in my experience they are much more likely to succeed.
It is sometimes said that ‘schools cannot do it alone’, but this is not quite true: exceptional schools can make up for grave disadvantages faced by young people. In the process, they often become surrogate parents. However, the job of schools is made so much easier, or so much harder, by the expectations that families have for their children. So as a society we have to create a culture of much higher expectations for young people both in our homes and in our schools. There are still far too many of these who suffer from poverty of expectations.
Twenty years ago, Ofsted published Access and achievement in urban education.1 This report looked at seven urban areas with high levels of deprivation in Bristol, Derby, the London Borough of Greenwich, Kingston upon Hull, Manchester, Slough and Thurrock.2 It painted a grim picture of education in these places. Inspectors reported underachievement by pupils from an early age, poor quality teaching across
the board and limited opportunities for any further learning once young people had left their secondary schools. In the words of the report, much that it revealed was ‘inadequate and disturbing’. It was a seminal publication which focused minds on a problem that is still with us today.
David Bell returned to the theme in a lecture 10 years later as HMCI.3 His conclusion was that there had been improvement but not enough, and that ‘the rising tide of educational change was still not lifting all the boats’. He highlighted the particular challenge of schools that were ‘disconnected’ in one way or another: sometimes physically isolated, sometimes cut off from the wider economy and society around them in other ways.
Sir Michael Wilshaw Her Majesty’s Chief Inspector
www.ofsted.gov.uk 5
Introduction
6 Unseen children: access and achievement 20 years on
Introduction
4. www.ofsted.gov.uk/accessandachievement. 5. www.ofsted.gov.uk/accessandachievement.
When I became HMCI, I decided to revisit the issue once again. So over the past year Ofsted has undertaken a review in order to understand the current pattern of disadvantage and educational success across England, to learn the lessons of recent policy initiatives, and to come forward with proposals that would really make a difference. I set out my conclusions and recommendations for action in a lecture that I gave on Thursday 20 June 2013.4
This review has had a wider scope than the two previous reports, which focused particularly on urban areas of economic and social disadvantage. We have considered disadvantage more broadly, looking at all children entitled to free school meals and then asking where they are and how well they achieve. Many live in areas that might be considered generally affluent but nonetheless are performing poorly. Many others live in places that are relatively isolated, such as coastal towns.
There are, of course, other groups of children and young people that perform poorly in comparison with other pupils. For example, we know that there is too much variation in the achievement of pupils with special educational needs. The achievement of children that are looked after and children from Traveller, Roma and Gypsy backgrounds is also too low. Although these groups of pupils are important, this report focuses specifically on the issue of economic disadvantage.
We have considered the early years, schools and education and training up to the age of 19.
Nevertheless, we often refer specifically to the outcomes for pupils at the end of secondary school as a measure of success or failure. This is not because I think secondary education is the most important phase for young people. Far from it: if we could get the earlier years right for everyone, that would make much more of a difference. However, the outcomes at the end of secondary school powerfully reveal the impact of what has gone before. They also account to a large extent for success in courses and qualifications thereafter.
The review has been supported by an Expert Panel, which met over the past year to consider the issues and to give me advice. I want to extend my personal thanks to all the members of the Panel for the generosity with which they have given their time and expertise. Many other people and organisations have contributed to the work of the review, including Sally Morgan and Geoff Whitty from the Ofsted Board, and I am also grateful to them.
The report that follows sets out some of the main evidence that informed the review. It draws on test and examination data, inspection outcomes, and published reports and research. It is accompanied by a series of background papers by leading academics and a short survey report that identifies examples of good practice in schools who have raised achievement for pupils from low income backgrounds. Supporting documents and a copy of my speech are available on the Access and achievement 2013 area of our website.5
www.ofsted.gov.uk 7
Introduction

1Background to access and achievement in education
6. None of these was strictly an ‘inner city’ area. The report notes that ‘the areas selected [did] not represent the most disadvantaged parts of the country which include areas in inner London and other major conurbations.’
1993: isolation and underachievement within and beyond the school gatesThe seven areas Ofsted surveyed 20 years ago all suffered from some degree of geographical ‘isolation’, positioned on the outer edge of cities.6 The areas were often perceived negatively by those living beyond the immediate community. Feelings of low self-esteem and disaffection were common among the residents. Young people living in these areas often felt disadvantaged by their ‘address’ when applying for jobs. Parents and carers, particularly those in employment, felt that their aspirations for their children would be better served if they secured places at schools in other parts of the city. The report identified a range of issues that contributed to this sense of isolation and found consistent weaknesses in the education systems across the seven areas (see Figure 2).
Much of the provision visited by Ofsted for the survey was described as ‘inadequate and disturbing’. However, there was also ‘enough work of good quality in each sector to mean that the situation is not irredeemable’.
2003: ‘disconnection’ and the barriers to sustained improvementTen years ago, David Bell argued that, in spite of general improvements to children and young people’s experience of education, progress in narrowing gaps in achievement for disadvantaged pupils had been too slow because schools in areas of high deprivation often struggled to improve sufficiently or sustain improvements.
8
Chapter 1 – Background to access and achievement in education
Unseen children: access and achievement 20 years on

Features of disadvantage in the seven urban areas, 1993
Figure 2
Issues leading to isolation Weaknesses in the education systems
Infrequent and expensive public transport Weak provision within institutions (including superficial and unchallenging teaching and curricular planning) and poor links between them
A prevalence of dental and other health problems (including speech disorders) among very small children
Inconsistency in the quality and availability of pre-school provision
Poor quality housing stock A failure to address the early underachievement in basic skills during primary school
Neighbourhood shopping centres that offer limited services or are boarded up A paucity of skilled teaching of oral and written
communication in primary and secondary schoolsLitter, graffiti and vandalism
Relatively high levels of crime (including drugs use and violent attacks) undertaken by a small number of offenders
Weaknesses in the monitoring of the learning of pupils and of the outcomes of teaching
Frequent racially motivated attacks where minority ethnic groups are a small proportion of population.
Few opportunities for pupils not performing well in GCSEs to study post-16.
Having reviewed attainment and inspection evidence for a sample of primary and secondary schools in areas of high deprivation, Bell suggested that those schools that found it difficult to improve were subject to one or more of three types of ‘disconnection’:
the geographical isolation identified in the 1993 report
schools that had insufficient professional contact with other successful schools – schools
that worked alone and didn’t benefit from the sharing of new and innovative practice
poor relationships within the school and/or with local communities.
9
Chapter 1 – Background to access and achievement in education
www.ofsted.gov.uk

© www.alamy.com
10 Unseen children: access and achievement 20 years on
Chapter 1 – Background to access and achievement in education

7. Access and achievement in urban education: 10 years on – a speech to the Fabian Society by David Bell, chief inspector of schools; www.guardian.co.uk/education/2003/nov/20/schools.uk3. 8. In addition to reviewing inspection and examination data, Ofsted contacted the seven local authorities to ask about the current position of the areas visited for the 1993 survey.
In addition, he noted that these schools often found it difficult to recruit suitably qualified staff and/or suffered from high levels of pupil mobility within the school year.
As in the 1993 report, Bell argued that schools can only do so much on their own. He called for ‘collective and concerted action across and beyond the education services in a local area’. To achieve this, Bell emphasised the importance of collaboration between schools and the value of incentives that encourage schools to take responsibility for all pupils across a defined local area.
Overall, the tone was more positive than the 1993 report. Nevertheless, he also warned against complacency, concluding with a cautionary message:
‘Ten years on, we know more about how to tackle the problem and avoid these dangers than we did before. The fact that more schools are enabling more children to gain pleasure and a sense of achievement from education, as well as, potentially, power and control over their lives, is a cause for celebration. But that celebration will deserve to remain slightly muted until the still patchy and sporadic pattern of improvement becomes far more widespread and consistent. That is the challenge that faces us for the next 10 years.’7
Success and struggle: two decades of changeOver the past two decades, the seven urban areas that Ofsted visited in 1993 have undergone considerable change.8 All have been the focus, at some stage in recent years,
of targeted local or national initiatives to raise achievement and improve outcomes for children, young people and their families. All have had their hard-won successes. However, they share a number of persistent challenges that are similar to those identified 20 years ago, outlined in Figure 2.
As at 31 December 2012, just over a third of the original 63 schools visited from the 1993 report have closed. Some of the primary schools that closed amalgamated with other schools that are still open. Several of the open schools have become converter academies. Although the seven areas are still marked by consistently high levels of deprivation, the quality of the existing schools is generally much improved. Overall, three quarters of the schools still open were judged to be good or outstanding for overall effectiveness at their last inspection and only one school is currently judged to have serious weaknesses. Levels of attainment, which were generally low at the time of the 1993 and 2003 reviews, have also improved. This is especially the case at Key Stage 2, where pupils are now more likely to achieve levels that are close to or above the national average.
The overall quality of education has improved considerably in some of the areas, while in others the rate of improvement has been slow. Some demonstrate that the significant challenge of improving the quality of education and raising achievement in areas of high disadvantage is not an insurmountable one. However, others reflect the stubborn challenges that face many schools across the nation where, in spite of some improvement, the pace of positive change has not been quick enough to close gaps in
www.ofsted.gov.uk 11
Chapter 1 – Background to access and achievement in education

9. When judging the overall effectiveness of the school and when making the four key judgements about the achievement of pupils, the quality of teaching, the behaviour and safety of pupils, and the quality of leadership in, and management of, the school, inspectors will use the following scale: grade 1: outstanding; grade 2: good; grade 3: requires improvement; and grade 4: inadequate. 10. The framework for school inspection (120100); Ofsted, April 2013; www.ofsted.gov.uk/resources/120100. 11. School inspection handbook (120101), Ofsted, April 2013; www.ofsted.gov.uk/resources/school-inspection-handbook
achievement for pupils from disadvantaged backgrounds.
How good are schools in the seven local authorities?The overall effectiveness of a school is the main Ofsted judgement that inspectors make when evaluating the quality of provision and outcomes for pupils. It encapsulates whether a school is outstanding or good, whether it requires improvement or whether it is failing to provide an adequate quality of education. In arriving at one of these four judgements, inspectors weigh up a range of factors, focusing specifically on pupils’ achievement, the quality of teaching, the behaviour and safety of pupils at the school and the quality of leadership and management.9 The features and principles of school inspection are set out in Ofsted’s framework for school inspection.10
In two of the wider local authority areas from the 1993 review, Greenwich and Manchester,
the likelihood of pupils attending a good or outstanding school now compares favourably with the national picture (see Figure 3). In Thurrock there are strengths in the secondary phase of education and weaknesses in the primary phase. In Derby, Bristol and Kingston upon Hull, pupils are less likely to go to a good or outstanding primary or secondary school than is the national average. Because of continued concerns over the quality of provision, in 2013, Ofsted carried out focused inspections of schools in Derby and Bristol.
How well did their pupils attain in 2012?When judging the achievement of pupils, Ofsted inspectors take into consideration the progress pupils make during their time at school and the levels of attainment they reach at the end of Key Stage 2 and Key Stage 4. Guidance on how inspectors make this judgement is set out in the School inspection handbook.11
At the end of Key Stage 2, the national benchmark for attainment is the proportion of pupils attaining a national curriculum Level 4 or above in both English and mathematics. At the end of Key Stage 4, the national benchmark for attainment is the proportion of pupils attaining five GCSEs at grades A* to C, including English and mathematics. Levels of attainment matter because at Key Stage 2 they are strong indicators of future performance at GCSE and at Key Stage 4 they are strong indicators of success in further education and employment.
In general, pupils’ attainment at the end of Key Stage 2 and Key Stage 4 in 2012 was below
The national benchmark at KS4 is five GCSEs A* to C including English and maths
© www.alamy.com
© www.alamy.com
12 Unseen children: access and achievement 20 years on
Chapter 1 – Background to access and achievement in education

12. Statistical neighbours for the seven local authorities have been taken from the National Foundation for Educational Research (NFER) developed for the Department for Education and currently accessed via the Local Area Interactive Tool (LAIT); www.education.gov.uk/childrenandyoungpeople/strategy/research/lait/a0070240/lait.
Percentage of pupils that are in schools judged good or outstanding for overall effectiveness in the seven local authority areas, as at 31 December 2012
Figures reflect the number of pupils on roll in maintained schools as recorded on EduBase. The number of pupils in good and outstanding schools have been combined to calculate the percentages. Includes all open schools that have had a published section 5 inspection as at 31 December 2012.
Source: Ofsted
0
20
40
60
80
Primary schools Secondary schools
Derby
56
68 68
48
Kingstonupon Hull
78
67
ManchesterEngland
74 73
62
73
Slough Bristol
6762
53
83
Thurrock Greenwich
7771
the national average in the majority of the local authorities from the 1993 report. However, there are differences in levels of attainment across the seven local authority areas, especially for pupils from low income backgrounds at the end of Key Stage 4.
Overall, in terms of pupils’ attainment, Greenwich is the strongest performing of the seven local authorities. It compares positively with the national picture and very strongly to statistically similar local authorities.12 In 2012, pupils’ attainment across both key stages was
above the national averages. At Key Stage 2, pupils from disadvantaged backgrounds attained at levels well above similar pupils nationally and close to the national average for their more advantaged peers. At Key Stage 4, pupils from low income backgrounds outperformed similar pupils nationally and the attainment gap was much lower than the national average. Since 2007, the percentage of pupils from low income backgrounds attaining five good GCSEs including English and mathematics has improved by 28 percentage points (see Figure 4). Against this measure, Greenwich rates as the third most
Figure 3
13
Chapter 1 – Background to access and achievement in education
www.ofsted.gov.uk

Performance and improvement of pupils eligible for free school meals in the seven local authorities
Source: Department for Education
Figures for 2007 are based on final data. 2012 figures are based on revised data. Figures have been rounded.Based on students in state-funded schools (including academies and city technology colleges) at the end of Key Stage 4 in each academic year.
Figure 4
improved of all English local authorities, behind Kensington and Chelsea, and Thurrock.
By contrast, pupils in Kingston upon Hull attain poorly across both key stages. In 2012, attainment at the end of Key Stage 2 and Key Stage 4 was below the national average for pupils entitled to free school meals and those not entitled to free school meals. Since 2007, the percentage of pupils from low income backgrounds attaining five good GCSEs including English and mathematics in Hull has improved at a slightly slower rate than the national average.
In Slough, overall, pupils at the end of Key Stage 2 attain at a level that is similar to the national average. At the end of Key Stage 4, attainment overall is above the national average. In 2012, a higher proportion of pupils eligible for free school meals attained the national GCSE benchmark than in any other local authority in the South East.
However, since 2007, the percentage of pupils in Slough from low income backgrounds attaining five good GCSEs including English and mathematics has improved by only six percentage points compared with a national average of 14 percentage points. In Slough, the performance of low income pupils at Key Stage 4 compares poorly with statistically similar authorities, while the performance of their better off peers compares very favourably.
From this small sample of local authorities we see a pattern of relative success in large cities compared with other areas. This reflects the major changes in the pattern of disadvantage and educational achievement nationally that is explored in the rest of this report.
Kin
gsto
n up
on H
ull
13
28
28
Thur
rock
13
41
15
Engl
and
22
36
16
Slou
gh
30
36
14
Der
by
20
32
17
Bris
tol
12
27
22
Gre
enw
ich
21
49
28
Man
ches
ter
20
40
35
22
36
13
28
13
41
30
36
20
32
12
27
21
49
20
40
Kin
gsto
n up
on H
ull
28
Thur
rock
15
Engl
and
16
Slou
gh
14
Der
by
17
Bris
tol
22
Gre
enw
ich
28
Man
ches
ter
35
2012
2007
100%
0%
0%
100%
Percentage of FSM pupils achieving 5 GCSEs A* to C including English and mathematics
2012
2007
100%
0%
0%
100%
Percentage of FSM pupils in secondary schools 2011–12
100%
0%
0%
100%
Percentage of FSM pupils achieving 5 GCSEs A* to C including English and mathematics
100%
0%
0%
100%
Percentage of FSM pupils in secondary schools 2011–12
14 Unseen children: access and achievement 20 years on
Chapter 1 – Background to access and achievement in education

www.ofsted.gov.uk 15
Chapter 1 – Background to access and achievement in education

52Access and achievement in education – 20 years on
The educational landscape is a more positive place than it was 10 or 20 years ago. Material poverty is not in itself an insurmountable barrier to educational success. The significant improvements to London’s schools and the outcomes for its pupils are evidence that disadvantaged pupils can achieve consistently well. However, there is still too much variation in the quality of education experienced by pupils across the country.
The very best early years providers, schools and colleges make an enormous difference to the life chances of children and young people. The achievement of children in the early stages of their learning and development has improved over time. However, gaps exist between the poorest children and their better off counterparts. Schools are improving but too slowly in areas of higher deprivation. Outcomes for all pupils at Key Stage 2 and Key Stage 4 have improved, but the attainment gap between disadvantaged pupils and their better off peers is closing too slowly, particularly at secondary level.
Levels of attainment and the attainment gap vary too widely across the country. At GCSE, attainment has improved for pupils from different ethnic backgrounds and for pupils who speak English as an additional language. However, the attainment of many White British pupils from low income backgrounds is too low – and this is by far the largest group of disadvantaged pupils.
16 Unseen children: access and achievement 20 years on
Chapter 2 – Access and achievement in education – 20 years on

Material poverty is not an insurmountable barrier to achievement In England, the educational landscape today is a much more positive place than it was 10 and 20 years ago. Much has changed and for the better in the intervening period. The ‘boats’ have risen for most groups of children and young people, who now have access to better quality educational provision and achieve higher outcomes.
However, the detailed picture is a more complex one. There is too much variability in the quality of education and outcomes across different local authorities and between schools serving the most and least deprived communities. In some areas of the country and in some communities, there is a worryingly engrained poverty of expectation, with large groups of disadvantaged pupils performing poorly. Of particular concern in this respect is the low attainment and poor progress made by too many White British pupils from low income backgrounds.
International comparisons show that more needs to be done to remove inequalities for disadvantaged pupils so that England’s education system can compete with the very best and be ‘world class’.13-15 This issue is important because a more equitable access to high quality statutory education is a fundamental precursor to an individual’s future education and training, employment, social mobility and economic prosperity. In the UK, for example, pupils from the highest social class groups are three times more likely to enter university than those from the lowest social
13. PISA 2009 Results: Volume II, Overcoming social background: equity in learning opportunities and outcomes, OECD: Paris. Available at: http://dx.doi.org/10.1787/888932560911. 14. Equity and quality in education: supporting disadvantaged students and schools, OECD Publishing, 2012. Available at: http://dx.doi.org/10.1787/9789264130852-en. 15. J Waldfogel and E Washbrook, Achievement gaps in childhood: A cross-national perspective. S Paper prepared for the Sutton Trust/Carnegie Corporation Summit on Social Mobility, London, May 2012.
www.ofsted.gov.uk 17
Chapter 2 – Access and achievement in education – 20 years on
www.ofsted.co.uk 17www.ofsted.gov.uk 17

groups, while fewer than one in five degree entrants in leading research universities come from four class groups that make up half the UK population.16 Persistent gaps in achievement have been quantified as likely to have a major economic cost.17
For the purposes of this review, the term ‘disadvantaged pupils’ refers to those pupils from low income backgrounds who are eligible for free school meals.18 The merits of using such a proxy measure of socio-economic status and the problems relating to the take-up of free school meals have been discussed
16. M Corak, J Waldfogel, L Washbrook, J Ermisch, J Jerrim and A Vignoles, Social mobility and education gaps in the four major Anglophone countries: research findings for the social mobility summit, Proceedings held at Royal Society, London 21–22 May 2012 of research sponsored by Sutton Trust & Carnegie Corporation of New York published online by Sutton Trust, London available on 6 December 2012 at www.suttontrust.com/research/social-mobility-summit-research-findings. 17. The economic impact of the achievement gap in America’s schools, Washington: Social Sector Office, McKinsey and Company, 2009. 18. This should not be confused with the Department for Education’s ‘disadvantaged pupils’ measure, which includes children looked after and is based on pupils that have been eligible for free school meals at any point in the preceding six years. The definition of disadvantaged in this report refers to those pupils eligible for free school meals as identified from the Annual School Census data for a particular year.’. 19. G Hobbs and A Vignoles, Is free school meal status a valid proxy for socio-economic status (in schools research)?, London: London School of Economics, 2007. 20. S Iniesta-Martinez and L Evans, Pupils not claiming free school meals, Department for Education, 2012. 21. G Whitty and J Anders, ‘Narrowing the achievement gap: policy and practice in England 1997–2010’, Addressing the achievement gap from an international perspective (J V Clark, ed.), Springer, 2013. 22. EFA global monitoring report: reaching the marginalized, UNESCO/Oxford University Press, 2010, Ch. 2.
in the research literature.19-21 However, it provides a clear and comprehensible means of differentiating between two broad groups of pupils. Although there are overlaps between pupils eligible for free school meals, children who are looked after and pupils with special educational needs and/or disabilities, this review focuses specifically on those pupils eligible for free school meals.
Differences in educational attainment between individuals will always exist and attainment will always be ‘heavily influenced by the type of school pupils attend and their family backgrounds… School-based disparities do not operate in isolation. In many cases they interact with and reinforce wider disadvantage’.22 However, factors such as material poverty or ethnic background are not by themselves insurmountable barriers to success. Ofsted’s inspection evidence demonstrates that the very best early years providers, schools and colleges make an enormous difference to the life chances of children and young people, often providing crucial support where family care is lacking.
For too many disadvantaged children failure starts earlySince 2008, when the Early Years Foundation Stage (EYFS) and a new inspection framework were introduced, there has been a year-on-year improvement to provision in the sector. The proportion of all children aged five who achieve a good level of development on the EYFS Profile
The very best early years providers, schools and colleges make an enormous difference to the life chances of children and young people
18 Unseen children: access and achievement 20 years on
Chapter 2 – Access and achievement in education – 20 years on

Percentage of children achieving a good level of development on the EYFS profile by FSM eligibility 2007–12
0
10
30
50
20
40
60
70
Children eligible for free school meals Children not eligible for free school meals
2008 2009 20102007 2011 2012
62
44
59
40
55
34
52
31
49
28
67
48
has also risen incrementally since 2007.23 The rate of improvement for disadvantaged children is keeping pace with the rest. However, the gap between the two has closed only marginally over the last five years (see Figure 5). The importance of continued investment in high quality early years education as a means of reducing these early gaps in achievement is considered in Chapter 3.
Schools are improving too slowly in areas of higher deprivationThe quality of schools in England has improved over time. At their most recent inspection as at 31 December 2012, 74% of maintained schools were judged to be good or outstanding for overall effectiveness compared with 66% in August 2009. During this period, the percentage of outstanding schools has also risen from 16%
Figures for all years are based on final data. All providers of state-funded early years education (including academies and free schools) and private, voluntary and independent (PVI) sectors in England are within the scope of the EYFSP data collection. A pupil achieving six or more points across the seven scales of ‘Personal, social and emotional development’ (PSE) and ‘Communication, language and literacy’ (CLL) and who also achieves 78 or more points across all 13 scales is classed as having ‘a good level of development’.
Figure 5
Source: Department for Education
23. At the end of the EYFS teachers complete an assessment which is known as the EYFS Profile. This assessment is carried out by the Reception teacher and is based on what they have observed over a period of time. From 2013, children will be defined as having reached a good level of development at the end of the EYFS if they achieve at least the expected level in: the early learning goals in the prime areas of learning (personal, social and emotional development; physical development; and communication and language); and the early learning goals in the specific areas of mathematics and literacy. www.education.gov.uk/schools/teachingandlearning/curriculum/a0068102/early-years-foundation-stage-eyfs.
www.ofsted.gov.uk 19
Chapter 2 – Access and achievement in education – 20 years on

20 Unseen children: access and achievement 20 years on
Chapter 2 – Access and achievement in education – 20 years on

Overall effectiveness of maintained schools by level of deprivation as at 31 December 2012
%, outstanding %, good
30
56
23
56
17
54
16
52
16
50
Least deprived(4,032)
Less deprived(4,133)
Average(4,161)
Deprived(4,181)
Most deprived(4,052)
to 21%. Inspection evidence demonstrates that there are clear differences in the overall quality of provision between those schools serving the least and most deprived communities (see Figure 6). The proportion of good or outstanding schools in the most deprived areas is 20 percentage points lower than in the least deprived areas. Moreover, the proportion of outstanding schools in the least deprived areas is nearly double that found in the ‘deprived’ and ‘most deprived’ communities.
Outcomes at the end of Key Stage 2 and Key Stage 4 have improved for all pupils, but the attainment gap is not closing fast enough
Overall, levels of attainment at the end of Key Stage 2 have risen for all pupils in recent years (see Figure 7). The attainment gap between those pupils eligible for free school meals and their better off peers has narrowed, falling from 24 percentage points in 2007 to 16 percentage
Includes all open primary, secondary and special schools that have had a published section 5 inspection as at 31 December 2012. Deprivation is based on the Income Deprivation Affecting Children Index (IDACI) 2010. The deprivation of a provider is based on the mean of the deprivation indices associated with the home post codes of the pupils attending the school rather than the location of the school itself. The schools are divided into five equal groups (quintiles) that are labelled from ‘most deprived’ to ‘least deprived’.
Figure 6
Source: Ofsted
www.ofsted.gov.uk 21
Chapter 2 – Access and achievement in education – 20 years on

Percentage of pupils at the end of Key Stage 2 attaining Level 4+ in both English and mathematics 2007–12
FSM Non FSM
2012
0
40
80
20
60
2011
78
58
82
66
2010
77
56
2009
76
54
2008
76
54
2007
75
51
points in 2012. Last year’s national curriculum test results show strong gains for pupils eligible for free school meals, with the attainment gap falling by four percentage points. In part, this may be a result of changes to assessment procedures. In part, it may be as a result of the increased awareness of this target group of pupils following the introduction of the Pupil Premium funding in 2011, although it is too early to state this with any confidence.
Pupils’ attainment in English and mathematics at the end of Key Stage 2 is a strong indicator of future performance in those subjects at GCSE. However, the Level 4 benchmark at Key
Stage 2 is arguably too broad a category to be sufficiently challenging for primary schools. For example, only 50% of pupils attaining a lower Level 4c in English go on to attain a grade C or higher at GCSE compared with 70% who attained a secure Level 4b. In mathematics, only 56% of pupils attaining a low Level 4c in Year 6 go on to attain a grade C or above at GCSE compared with 76% of those pupils attaining a secure Level 4b.
There are also clear differences in the higher levels of attainment achieved by pupils from low income backgrounds compared with their better off counterparts. In 2012, only two out of every
Figures for 2007 to 2011 are based on final data. 2012 figures are based on revised data. Based on students in state-funded schools at the end of Key Stage 2 for each year. In 2012, English was calculated from reading test results and writing teacher assessment rather than from reading and writing tests as in previous years. English in 2012 is, therefore, not comparable to previous years.
Figure 7
Source: Department for Education
22 Unseen children: access and achievement 20 years on
Chapter 2 – Access and achievement in education – 20 years on

Percentage of pupils at the end of Key Stage 4 attaining five GCSEs at grades A*to C including English and mathematics by free school meals eligibility 2005–12
0
20
10
50
40
30
60
FSM Non FSM
2007 2008 20092005 2006 20122010 2011
63
36
62
35
59
31
54
27
52
24
49
21
48
20
46
18
10 pupils eligible for free school meals attained a Level 5 or above in English or mathematics compared with four out of every 10 pupils from more advantaged backgrounds. Over time, the gaps in performance at the higher levels between these two groups of pupils have closed only very slightly.
At Key Stage 4, there have been clear gains for all pupils in terms of the percentage attaining five GCSEs at grades A* to C including English and mathematics (see Figure 8). However, the attainment gap between disadvantaged pupils and their better off peers continues to widen
between the end of Key Stage 2 and Key Stage 4 and has hardly narrowed at GCSE, remaining stubbornly at around 27 percentage points in 2012.
Attainment and the attainment gap varies too widely across the countryLevels of attainment at GCSE have improved across all areas of the country, but there remain noticeable variations in the proportion of pupils reaching national benchmarks across the different government regions, particularly at the end of Key Stage 4 (see Figure 9).
Figures for 2007 to 2011 are based on final data. 2012 figures are based on revised data. Based on students in state-funded schools (including academies and city technology colleges) at the end of Key Stage 4 in each academic year.
Figure 8
Source: Department for Education
www.ofsted.gov.uk 23
Chapter 2 – Access and achievement in education – 20 years on
www.ofsted.co.uk 23www.ofsted.gov.uk 23

Percentage of pupils at the end of Key Stage 4 attaining five GCSEs at grades A* to C including English and mathematics by region 2007–12
50
40
60
2011 20122008 20092007 2010
England
57.3
58.8
58.9
58.5
57.6
58.2
57.5
60.2
63.1
60.8
59
Yorkshire andHumber 42.5
WestMidlands 43.3
North West 44.7
North East 41.9
EastMidlands 44.4
East ofEngland 48.4
South West 47.2
South East 49.4
OuterLondon 50.4
InnerLondon 42.4
England 45.9
The most striking improvements in attainment at GCSE have taken place in Inner London. Examination results for schools in Inner London have risen year on year, taking it from a position of the second lowest performing region in 2007 to the second highest performing in 2012 (behind Outer London). Last year, disadvantaged pupils in Inner London schools outperformed similar pupils in England by 17 percentage points. In the same year, the West Midlands was the only region outside London where pupils eligible for free school meals attained above the national average for
disadvantaged pupils. The London success story has been well-documented in research literature and in the media. The reasons behind this improvement are discussed in Chapter 5.
There are large differences in terms of outcomes across the regions, particularly for pupils from low income backgrounds. For example, benchmark attainment at GCSE varies across the different regions by 23 percentage points for pupils eligible for free school meals compared with only six percentage points for pupils who are not eligible for free school meals. The gap
Figures for 2007 to 2011 are based on final data. 2012 figures are based on revised data. Based on students in state-funded schools (including academies and CTCs) at the end of Key Stage 4 in each academic year.
Figure 9
Source: Department for Education
24 Unseen children: access and achievement 20 years on
Chapter 2 – Access and achievement in education – 20 years on

Since 2007, there have been big improvements in the performance of pupils from different ethnic backgrounds
between the attainment of pupils eligible for free school meals and their better off peers also varies substantially within regions. Strikingly, in the South East, this gap is around 33 percentage points compared with a national average of 27 and 13 percentage points in Inner London.
Attainment at GCSE has improved for pupils from different ethnic backgrounds and for pupils who speak English as an additional language
Since 2007, there have been big improvements in the performance of pupils from different ethnic backgrounds. At GCSE, all of the main ethnic groups have increased their levels of attainment, with Bangladeshi pupils making the greatest gains over time (see Figure 10). Overall, Chinese and Indian pupils continue to perform more strongly than other ethnic groups. Their attainment is consistently well above the national average for all pupils.
Unsurprisingly, as White British pupils make up by far the largest ethnic group in England, their attainment is very close to the national average for all pupils. It is striking that some ethnic groups have caught up with or overtaken this benchmark. Five years ago Bangladeshi and Black African pupils were trailing their White British counterparts. Now Bangladeshi pupils outperform their White British peers and Black African pupils attain at a similar level.
In spite of these overall improvements, the attainment of Pakistani and Black Caribbean pupils remains below average. However, while pupils from any Black background remain the lowest attaining major ethnic group, the percentage making expected progress in English and mathematics is above the national average.
www.ofsted.gov.uk 25
Chapter 2 – Access and achievement in education – 20 years on

In 2012, pupils of any White background made progress that was below the national average in both English and mathematics.
Levels of attainment have also increased year on year for pupils who speak English as an additional language. The attainment gap in 2012, when compared with pupils whose first language is English, was small: four percentage points at the end of Key Stage 2 and only three percentage points at the end of Key Stage 4.
The progress made by pupils who speak English as an additional language, an essential
component of their achievement, also compares well with their peers. At the end of both Key Stage 2 and Key Stage 4, a higher percentage of pupils whose first language is other than English achieved the expected level of progress than those whose first language is English.
High quality support for pupils who speak English as an additional language is crucial to their achievement, particularly in the early stages of language development. However, this factor does not appear to present a substantial or insurmountable barrier to their achievement. Indeed, their small attainment gap and
The major ethnic groups: percentage of pupils at the end of Key Stage 4 attaining five GCSEs at grades A* to C including English and mathematics 2007–12
50
30
80
40
70
60
2007 2008 2009 2010 2011 2012
Bangladeshi 41.4 58.9
WhiteBritish 46.1 62.2
Indian 62 74.4
Chinese 70.7 76.4
Pakistani 37.3 54.4
BlackCaribbean 33.2 49.8
BlackAfrican 40.8 58
Figures for 2007 to 2011 are based on final data. 2012 figures are based on revised data. Based on students in state-funded schools (including academies and CTCs) at the end of Key Stage 4 in each academic year.
Figure 10
Source: Department for Education
26 Unseen children: access and achievement 20 years on
Chapter 2 – Access and achievement in education – 20 years on

www.ofsted.gov.uk 27
Chapter 2 – Access and achievement in education – 20 years on

improving rates of progress between key stages can be seen as one of the success stories of our education system.
White British pupils from low income backgrounds perform poorlyWhite British pupils from low income backgrounds are by far the largest of the main disadvantaged ethnic groups (see Figure 11). In 2012, there were 51,521 White British pupils eligible for free school meals at the end of Key Stage 4. This constitutes just under two thirds (64%) of the total number of pupils eligible for
free school meals in the 2011/12 cohort. The difference between the attainment of White British pupils from low income backgrounds and their more advantaged peers is much larger than for any of the other main ethnic groups.
In 2012, just over a third of pupils from low income backgrounds (36%) left school with five good GCSEs including English and maths compared with over three-fifths of their better off peers (63%). However, the performance of pupils from low income backgrounds varies
2012 figures are based on revised data. Based on students in state-funded schools (including academies and CTCs) at the end of Key Stage 4 in each academic year.
Figure 11
Source: Department for Education
Attainment gap at the end of Key Stage 4 between the percentage of eligible free school meal pupils and non-eligible pupils attaining the GCSE benchmark, by ethnicity in 2012
The relative size and attainment of the major ethnic groups
WhiteBritish
BlackCaribbean
BlackAfrican
IndianPakistani Bangladeshi Chinese
WhiteBritish
BlackCaribbean
BlackAfrican
IndianPakistani Bangladeshi Chinese
31
40
48
58
47
59
68
31
40
48
58
47
59
68
63
53
63
76
58
65
77
63
53
63
76
58
65
77
32 13
1115
18
6
9
100%
0%
100%
0%
Non-FSM %
Attainment gap
FSM %
32 13
1115
18
6
9
100%
0%
100%
0%
Non-FSM %1
Attainment gap2
FSM %1
28 Unseen children: access and achievement 20 years on
Chapter 2 – Access and achievement in education – 20 years on

Major ethnic groups: percentage of pupils eligible for free school meals attaining five GCSEs at grades A* to C including English and mathematics, 2007–12
50
10
80
30
20
40
70
60
Chinese
Bangladeshi
Indian
BlackAfrican
BlackCaribbean
Pakistani
WhiteBritish
2007 2008 2009 2011 20122010
60.7
36.4
41.9
29.2
29.5
24.2
17.4
68.2
58.6
57.9
48.4
46.5
40.2
30.5
greatly between different ethnic groups (see Figure 12).
Overall, White British pupils from disadvantaged backgrounds are consistently the lowest performing of all of the main ethnic groups and gaps in attainment to other groups have widened over time. Since 2007, the attainment of White British pupils eligible for free school meal has improved by only 13 percentage points compared with 22 percentage points for Bangladeshi pupils from low income backgrounds.
In 2012, only 26% of disadvantaged White British boys and 35% of disadvantaged White British girls achieved five good GCSEs including English and mathematics. While girls outperformed boys across all of the main ethnic groups, the achievement of White British girls eligible for free school meals was below that of low income boys from other ethnic groups, with the exception of Black Caribbean boys.24 The poor performance of low income White British pupils is not, therefore, a gender issue (see Figure 13).
Figures for 2007 to 2011 are based on final data. 2012 figures are based on revised data. Based on students in state-funded schools (including academies and city technology colleges) at the end of Key Stage 4 in each academic year.
Figure 12
Source: Department for Education
24. In 2011, low income White British girls were the second lowest performing group, after low income White British boys.
www.ofsted.gov.uk 29
Chapter 2 – Access and achievement in education – 20 years on

Percentage of pupils eligible for free school meals attaining five GCSEs at grades A* to C including English and mathematics by gender and ethnicity in 2012
Boys
White British 26 74
Black Caribbean 32 68
Pakistani 43 57
Black African 44 56
Indian 55 45
Bangladeshi 56 44
Chinese 62 38
Girls
White British 35 65
Black Caribbean 48 52
Pakistani 50 50
Black African 53 47
Indian 61 39
Bangladeshi 61 39
Chinese 74 26
Attaining GCSE threshold Not attaining GCSE threshold
Based on students in state-funded schools (including academies and city technology colleges) at the end of Key Stage 4 in each academic year.Figure 13
Source: Department for Education
30 Unseen children: access and achievement 20 years on
Chapter 2 – Access and achievement in education – 20 years on

25. R Cassen and G Kingdon, Tackling low educational achievement, York: Joseph Rowntree Foundation, 2007. 26. L King and T Welch, Successful white boys, of British origin, eligible for free school meals, 2012; www.ssatuk.co.uk/wp-content/uploads/2013/01/FSM-report.pdf. 27. D Mongon, ‘White British students from low income backgrounds’, background paper prepared for Access and achievement in education 2013 review, Ofsted, 2013; www.ofsted.gov.uk/accessandachievement. 28. J Sharples, R Slavin, B Chambers and C Sharp, ‘Effective classroom strategies for closing the gap in educational achievement for children and young people living in poverty, including White working-class boys’, C4EO Schools and Communities Research Review 4, London: C4EO [online], 2011. Available at: www.c4eo.org.uk/themes/schools/classroomstrategies/files/classroom_strategies_research_review.pdf. 29. White boys from low-income backgrounds: good practice in schools (070220), Ofsted 2008; www.ofsted.gov.uk/resources/white-boys-low-income-backgrounds-good-practice-schools.
The poor performance of White British pupils from low income backgrounds, especially boys, and approaches to tackling this problem have been discussed at length in the research literature.25-28 Studies identify a number of common strategies for successfully raising achievement for this group at classroom, whole school and wider community level. The most important include:
rigorous monitoring of data and its
effective use in feedback, planning, support and intervention
ensuring access to the highest
quality teaching
providing strong and visionary leadership
working with pupils and parents to increase
engagement and raise expectations.
Importantly, the research literature indicates that the strategies that are most successful for one ethnic group tend to be effective for others.
In 2008, Ofsted published a good practice survey report that highlighted common features in schools that had been successful in improving the educational experiences and achievements of white boys from low income backgrounds.29 These features included:
support to develop boys’ organisation
skills and instil the importance of perseverance; any anti-school subculture ‘left at the gates’
rigorous monitoring systems that track
individual pupils’ performance against expectations; realistic but challenging targets; tailored, flexible intervention programmes and frequent reviews of performance against targets
a curriculum that is tightly structured
around individual needs and linked to support programmes that seek to raise aspirations
creative and flexible strategies to engage
parents and carers, make them feel valued, enable them to give greater support to their sons’ education and help them make informed decisions about the future
strong partnership with a wide
range of agencies to provide social, emotional, educational and practical support for boys and their families in order to raise their aspirations.
Strategies that are most effective for one ethnic group tend to be effective for another
www.ofsted.gov.uk 31
Chapter 2 – Access and achievement in education – 20 years on

A well-qualified school leader was appointed to reshape the school’s intervention programme as part of its drive to raise achievement and close gaps. Searching self-evaluation had shown that previous interventions had not always been successful because they had been delivered by non-specialists and their timing, at the end of the school day, had failed to reach those pupils who needed the support most. A decision was taken to radically change the way support was delivered, focusing primarily on English and mathematics. Pupils making slow progress are now selected through a rigorous assessment and target-setting process for one-to-one tuition and mentoring. This programme is delivered by subject specialists during the school day.
The Director of Learning (head of department) designs an individual learning plan for each pupil. This identifies clearly the skills or knowledge the pupil needs to improve. The tutor then plans a series of intensive lessons that address these weaknesses. After each session, the tutor completes a detailed review of the pupil’s progress. The school ensures that sessions are scheduled at different times to minimise disruption to other subjects. Parents and carers are kept informed about the purpose of these sessions and their child’s progress. Mentors provide additional support for families where the pupil’s attitudes or behaviours have presented concerns. The effectiveness of the programme is rigorously checked by leaders, who monitor its impact on pupils’ measured academic performance.
Case study 1: Meeting the needs of pupils
In 2013, as part of the Access and achievement review, Her Majesty’s Inspectors visited 16 schools where the attainment and/or progress made by disadvantaged pupils, especially those from White British backgrounds, was higher than the national average for these groups or improving strongly. This work builds on Ofsted’s 2008 survey and its recent good practice report on the use of the Pupil Premium.30
The 2013 survey recognises that the most successful schools are prepared to implement
a flexible range of well-chosen strategies that meet the specific needs of pupils. They adapt these interventions on the basis of regular monitoring and careful evaluation. If something is not working well enough they change it or stop doing it. Strong leadership ensures that processes are rigorous. As one Assistant Principal stated, the school makes sure that ‘the right kids have the right intervention at the right time with the right people’ (see Case study 1).
30. The Pupil Premium: how schools are spending the funding successfully to maximise achievement (130016), Ofsted, 2013; www.ofsted.gov.uk/resources/130016.
32 Unseen children: access and achievement 20 years on
Chapter 2 – Access and achievement in education – 20 years on

www.ofsted.gov.uk 33
Chapter 2 – Access and achievement in education – 20 years on

34 Unseen children: access and achievement 20 years on
Chapter 2 – Access and achievement in education – 20 years on

Prior to children entering the EYFS, parents receive a home visit in order to understand the child’s home circumstances. Having identified weaknesses in communication and language as a general issue, the school helps parents to support their children to develop these crucial skills with the school’s own approaches. This has had a positive impact on the children’s progress in this area of learning. To foster productive relationships in the home, the school offers the ‘Family Works’ programme to parents and carers of pupils in reception. Family Works is based on the principles of the social and emotional aspects of learning (SEAL) project. The families of children who present with challenging behaviours are targeted to participate, but the activity is open to all families. There is a similar programme for pupils and their families in Year 6. Both the school and parents and carers report that the programme has improved children’s behaviour and that improved attitudes to learning have enabled them to make better progress.
At Key Stages 1 and 2, the school ensures that parents and carers are regularly informed about their child’s progress. Every half-term, the children’s personal challenge books and records of achievement are sent home so that parents and carers can assess the progress their children are making against their targets in reading, writing and mathematics. The child’s personal challenge book forms the focus of discussion at parents’ evenings. Every term, parents and carers receive a written report. The school makes sure that parents and carers are kept up to date with what is taught in school and they are given a calendar that tells them what topics will be covered and when. The school actively encourages parents and carers to become involved in their children’s education. For example, they have held evening events such as ‘bed time reading’ to encourage parents and carers to read with their children at home. As result, parents are now much better placed to help their children and achievement has risen throughout the school.
Case study 2: Working closely with parents
The most successful schools also recognise that raising academic achievement cannot be tackled in isolation. Teachers’ high expectations, consistently high quality teaching and learning and a relevant curriculum must be underpinned by other interventions that increase pupils’ resilience and readiness to learn, as well as developing strong partnerships with parents and carers.
Several schools identified home circumstances and the expectations of parents as an important
barrier to pupils’ achievement. Engaging closely with parents and raising their awareness of what can be achieved was seen as an essential aspect of ensuring pupils’ success. For example, in one school, a strong ethos of working closely with families throughout their time in school has had a positive impact on raising achievement in the Early Years Foundation Stage and Key Stages 1 and 2 (see Case study 2).
www.ofsted.gov.uk 35
Chapter 2 – Access and achievement in education – 20 years on

3Investing in high quality early years education and care for the most disadvantaged children
Gaps in achievement between the poorest children and their better off counterparts are well established by the age of five. High quality early years education and care has a big impact on outcomes for disadvantaged children. However, children from low income families are less likely to attend high quality early education and care programmes than their more advantaged peers.
Parents and carers can play a fundamental role in their children’s early development and learning. ‘Parenting style’ and the home learning environment strongly influence children’s development and school readiness. However, children from poor backgrounds are much less likely to experience a rich home learning environment than children from better off backgrounds. Pre-school programmes can help parents and carers to improve their parenting skills and the quality of the home learning environment so that children are better prepared for school.
Children get the best start in their learning and development when they are cared for by highly qualified and experienced professionals. However, too many practitioners in the current early years workforce are underqualified. There is an important overlap between the early years and Key Stage 1. It is crucial that teachers are better equipped to assess and track the progress of children from the very start of their school career.
36 Unseen children: access and achievement 20 years on
Chapter 3 – Investing in high quality early years education and care

Children’s life chances are rooted firmly in their first five years A child’s early experience of learning and development, especially during their first five years of life, is a critical springboard to their future success in education, work and life. The quality of this early experience is shaped by many often interrelated factors, notably the effects of socio-economic status, the impact of high quality early education and care, and the influence of ‘good parenting’. The central importance of high quality early education in particular as a strategy in countering socio-economic disadvantage has been widely discussed in the research literature and highlighted in major reviews of the sector.31-36
Growing up in poverty has a negative impact on educational attainmentIt is widely accepted that there is a negative developmental influence associated with growing up in poverty.37 The current economic climate has put additional financial pressure on families and, by implication, their children. These pressures are likely to become even greater in the future as the child poverty rate in the UK is predicted to rise from 20% in 2013 to 24% by 2020/21.38 This would constitute a return to the relative child poverty levels of Ofsted’s 1993 report.
For too many children, especially those living in the most deprived areas, educational failure starts early. Gaps in achievement between the poorest children and their better off
31. M Coghlan, C Bergeron, K White, C Sharp, M Morris and R Wilson, Narrowing the gap in outcomes for young children through effective practices in the early years, London: Centre for Excellence and Outcomes in Children and Young People’s Services [online], 2010. Available: www.c4eo.org.uk/themes/earlyyears/ntg/files/c4eo_narrowing_the_gap_full_knowledge_review.pdf. 32. C Pascal and A Bertram, ‘The impact of early education as a strategy for counteracting socio economic disadvantage’, background paper prepared for Ofsted’s Access and Achievement 2013 review, available at: www.ofsted.gov.uk/accessandachievement. 33. I Springate, M Atkinson, S Straw, E Lamont and H Grayson, Narrowing the gap in outcomes: early years (0–5 years), 2008, Available at: www.nfer.ac.uk/publications/LNG02/. 34. C Nutbrown, Foundations for quality: the independent review of early education and childcare qualifications (final report), Department for Education, 2012. 35. F Field, The foundation years: preventing poor children becoming poor adults. The report of the independent review on poverty and life chances, London: Cabinet Office, 2010. 36. C Tickel, The early years: foundations for life, health and learning. An independent report on the Early Years Foundation Stage to Her Majesty’s Government, London: DfE, 2011. 37. Unleashing aspiration: The final report of the Panel on Fair Access to the Professions, London: The Cabinet Office, 2009; available at: http://dera.ioe.ac.uk/9496/. 38. UNICEF, Measuring Child Poverty 2012. Data refer to the relative child poverty rate. A child is deemed to be living in relative poverty if she or he is growing up in a household where disposable income (when adjusted for family size and composition) is less than 50% of the median disposable household income for the country. There is committment to reduce this to 10% by 2020 under the Child Poverty Act 2010. 39. A Goodman and P Gregg, The importance of attitudes and behaviour for poorer children’s educational attainment, Joseph Rowntree Foundation, 2010. 40. S Roulstone, J Law, R Rush, J Clegg and T Peters, Investigating the role of language in children’s early education outcomes, research report DFE-RR 134, 2011; www.gov.uk/government/publications/investigating-the-role-of-language-in-childrens-early-educational-outcomes. 41. J Waldfogel and E Washbrook, ‘Early Years Policy’, paper prepared for the Sutton Trust–Carnegie Summit: Social Mobility and Education Policy, London, 2008. 42. Waldfogel and E Washbrook, ‘Achievement gaps in childhood: A cross-national perspective’. S Paper prepared for the Sutton Trust/Carnegie Corporation Summit on Social Mobility, London, May 2012. 43. Based on case studies of eight schools in areas of high deprivation with an excellent record of working successfully with parents and carers.
counterparts are clearly established by the age of five.39 There are strong associations between a child’s social background and their readiness for school as measured by their scores on school entry.40 Too many children, especially those that are poor, lack a firm grounding in the key skills of communication, language, literacy and mathematics. In the UK, for example, large gaps exist in the results from vocabulary tests between children from middle and low income families. Children from low income backgrounds in the UK are 19 months behind their better off peers compared with only 10.6 months in Canada.41, 42
It is essential, if gaps in achievement are to close more quickly, that early years education and support for parents continue to focus resolutely on strategies that improve children’s skills in communication, language and literacy.
School leaders working in the most disadvantaged communities describe a complex set of challenges that their schools face when working with children and families from low income backgrounds.43 They include:
low levels of social skills and prior
learning, especially in reading and communication, mean that children are not ‘ready’ for school
parents and carers often have weak
parenting skills, low levels of education and/or negative experiences of schooling
www.ofsted.co.uk 37
Chapter 3 – Investing in high quality early years education and care

44. K Sylva, E Melhuish, P Sammons, I Siraj-Blatchford and B Taggart (Eds), The Effective Provision of Pre-School Education [EPPE] Project: Final report. Institute of Education, University of London, 2004. 45. Unleashing aspiration: The final report of the Panel on Fair Access to the Professions, The Cabinet Office, 2009; available at: http://dera.ioe.ac.uk/9496/. 46. C Pascal and A Bertram, ‘The impact of early education as a strategy for counteracting socio economic disadvantage’, background paper prepared for Ofsted’s Access and Achievement 2013 review, available at: www.ofsted.gov.uk/accessandachievement. 47. The Annual Report of Her Majesty’s Chief Inspector of Education, Children’s Services and Skills, Ofsted, 2012; www.ofsted.gov.uk/resources/report-of-her-majestys-chief-inspector-of-education-childrens-services-and-skills-early-years. By December 2012 76% of providers on the Early Years Register were judged to be good or better compared to 65% at the end of August 2009 (the end of the first year of inspections under the EYFS framework).
high unemployment in families can
lead to mental health issues for parents and low aspirations for children
poor quality or multiple-occupancy
housing or in areas of high crime can lead to social and health issues for children
low income and/or unemployment
often lead to poor diet and limited range of life experiences.
Worryingly, these barriers to school readiness and achievement are not dissimilar from the features of isolation described in the 1993 report.
High quality early years education and care has a big impact on outcomes for disadvantaged children All children benefit from exposure to regular and high quality early education.44 The benefits of high quality pre-school education and care are greatest for boys, children with special educational needs and disadvantaged children. The difference in impact between attending a high quality pre-school and attending a low quality pre-school is greater for children who come from more disadvantaged backgrounds.45 However, in many countries, including the UK, children from low income families are less likely to attend high quality early education and care programmes than their peers.46
Overall, 76% of early years provision is now good or better compared with 65% three years ago. However, the overall quality of provision is
weakest in areas of high deprivation (see Figure 14). This is particularly the case for childminders, where the gap between the quality of provision in areas of high and low deprivation is wider than for other childcare providers. This issue was discussed in detail in Ofsted’s Annual Report 2011/12.47
Studies indicate that the most successful childhood interventions begin early in a child’s life, are centre-based and involve well-trained professionals. Those that encourage high levels of active parent engagement in their children’s learning are more successful in closing the attainment gap for socially disadvantaged children. The most effective settings share their educational aims with parents and enable parents to support children at home with activities or materials that complement what the setting is doing in its delivery of the EYFS curriculum. Programmes that incorporate these features commonly represent good value for money and are more likely to have a disproportionately positive long-term impact on children’s learning and development.48,49 However, many early education programmes do not meet these criteria adequately and/or are not of a sufficiently high quality. All too often, projects are short-term, temporary and subject to constantly changing funding streams.
Gaps in achievement are clearly established by the age of five
38 Unseen children: access and achievement 20 years on
Chapter 3 – Investing in high quality early years education and care

Quality of early years provision as at 31 December 2012, in percentages by deprivation level
Good Satisfactory/requires improvement InadequateOutstanding
Average (14,507) 1
11 64 24
1
10 62 27
Deprived (11,936)
Less deprived (15,641) 1
13 65 22
2
8 59 31
Most deprived (9,183)
Least deprived (15,765) 0
14 66 20
Source: Ofsted
Includes all open providers that have had a published early years registered inspection as at 31 December 2012. Deprivation is based on the Income Deprivation Affecting Children Index (IDACI) 2010. The deprivation of a provider is the deprivation index associated with the location (lower super output area, LSOA) of the provider. The LSOAs are divided into five equal groups (quintiles) based on their IDACI score. These five groups are labelled ‘most deprived’ to ‘least deprived’.
Figure 14
www.ofsted.gov.uk 39
Chapter 3 – Investing in high quality early years education and care

Scarce resources should be targeted at increasing access to high quality early years education for the most disadvantaged children
Reducing the levels of poverty experienced by children has been a concern for successive governments, as has the drive to enable more children to attend early education programmes. Free entitlement to part-time early education programmes for all children aged three to five has been in place in the UK since 2006. The recent UNICEF report Child well-being in rich countries50 indicates that this policy has met with some success. The percentage of children in the UK aged between four years and the start of compulsory education enrolled in pre-school now compares very favourably with other countries.51
Recent policy has focused on targeting resources at increasing access for children from low income backgrounds. A programme for the expansion of high quality, part-time early education to disadvantaged two-year-olds is currently being rolled out in the UK to allow access for 40% of the most disadvantaged children.52 This programme is designed to improve access to early education for children from low income families and, importantly, is offered in conjunction with parenting support.
Parenting style and the home learning environment strongly influence children’s development and school readiness
The great majority of parents, whatever their socio-economic circumstances, want their children to access good quality childcare
48. G Allen, Early intervention: the next steps. An independent report to HM Government, London: Cabinet Office, 2011. 49. A Diamond, ‘The evidence base for improving school outcomes by addressing the whole child and by addressing skills and attitudes, not just content’, Early Education and Development 21(5): 780–793, 2010. 50. UNICEF, Child well-being in rich countries: a comparative overview, 2013. Available at: www.unicef-irc.org/publication. 51. The UK ranks eight out of 29 on this measure. 52. Early education for two-year-olds, Department for Education, 2012: www.education.gov.uk/childrenandyoungpeople/earlylearningandchildcare/delivery/free%20entitlement%20to%20early%20education/b0070114/eefortwoyearolds.
40 Unseen children: access and achievement 20 years on
Chapter 3 – Investing in high quality early years education and care Chapter 3 – Investing in high quality early years education and care

Chapter 3 - A Springboard to SuccessChapter 3 – Investing in high quality early years education and care
www.ofsted.gov.uk 41

and early education that sets them up well for statutory schooling. They want their children to go to great childcarers, nurseries, children’s centres and schools that provide them with opportunities to learn and develop and to succeed. Recent research for the Joseph Rowntree Foundation emphasises the importance of parental involvement in children’s education as a causal influence on children’s school readiness and subsequent attainment.53 It is critical, therefore, that parents and carers are encouraged, supported and expected to play their full part in their children’s education. In particular, it is vital they work closely with early years practitioners to improve their children’s learning and development.
’Parenting style’ has been identified as a major factor explaining the weaker cognitive performance of low income children compared with their better off peers. Among the most important features of parenting style are maternal sensitivity and responsiveness (sometimes called nurturance), knowledge of infant development, discipline and rules. Studies have indicated that parenting style can account for 19% of the gap in mathematics, 21% of the gap in literacy and 33% of the gap in language.54
The home learning environment also has a considerable impact on cognitive school readiness, accounting for between 16% and 21% of the gap between low income children and their better off peers.55 The Effective provision of pre-school education (EPPE) longitudinal study found that, for all children, the quality of the home learning environment is more important
53. C Carter-Wall and G Whitfield, The role of aspirations, attitudes and behaviour in closing the educational attainment gap, Joseph Rowntree Foundation, 2012. 54. J Waldfogel and E Washbrook, Early years policy. Paper prepared for the Sutton Trust/Carnegie Corporation Summit on Social Mobility, June 2008. 55. C Pascal and A Bertram, ‘The impact of early education as a strategy for counteracting socio economic disadvantage’, background paper prepared for Ofsted’s Access and Achievement 2013 review, available at: www.ofsted.gov.uk/accessandachievement.
42 Unseen children: access and achievement 20 years on
Chapter 3 – Investing in high quality early years education and care

for intellectual and social development than parental occupation, education or income.56,57 A recent study of the role of language in children’s early educational outcomes found that the communication environment is a more dominant predictor of early language than social background.58 The number of books available to the child, the frequency of visits to the library, parents teaching a range of activities and the number of toys available are all important predictors of the child’s expressive vocabulary at the age of two. However, children from poor backgrounds are much less likely to experience a rich home learning environment than children from better off backgrounds. Differences in the home learning environment, particularly at the age of three, have an important role to play in explaining why children from poorer backgrounds have lower test scores than children from better off families.59
Pre-school programmes can help parents and carers to improve their parenting skills and the quality of the home learning environment so that children are better prepared for school. Several programmes have been shown to play an important role in supporting parents during pregnancy and early childhood. For example, the Play and Learning Strategies programme offers at-home training to parents of infants and toddlers focused on improving parents’ responsiveness and sensitivity. This programme has been shown to impact positively on children’s attention, their use of language and vocabulary scores. Other initiatives have focused on learning. The Peers Early Education Partnership programme aims to foster reading
readiness by providing parents with age-appropriate materials and supporting them in using the materials either through group sessions or home visits. Evaluations show positive gains in several measures of cognitive development between ages two and four to five years.60
Breaking the cycle of disadvantage
Children get the best start in their learning and development when they are cared for by highly qualified and experienced professionals. Ofsted’s inspection evidence suggests that providers with a good level of qualification, to at least level 3, tend to receive better grades at inspection.61 Well-qualified teams of early years practitioners are more effective in developing children’s communication, language and literacy, reasoning, thinking and mathematical skills.62\ A well-trained and highly qualified early years workforce, with access to ongoing professional development, is vital in closing the achievement gap between children from poorer homes and their peers.
In her recent review of the early years, Professor Cathy Nutbrown stated that the current qualifications system is confusing and many existing qualifications are not equipping the workforce with the necessary knowledge and skills to provide high quality early education and care. She recommended that all early years staff should be qualified at a minimum ‘full and relevant’ level 3 by September 2022 and that students should have level 2 qualifications in English and mathematics before they begin a level 3 early education or childcare course.
56. The home learning environment includes parents’ teaching behaviours as well as their provision of learning materials and activities, including books and CDs, computer access, TV watching, library visits and classes. 57. K Sylva, E Melhuish, P Sammons, I Siraj-Blatchford and B Taggart (Eds), The Effective Provision of Pre-School Education [EPPE] Project: Final report. UK: Institute of Education, University of London, 2004. 58. S Roulstone, J Law, R Rush, J Clegg and T Peters Investigating the role of language in children’s early education outcomes, research report DFE-RR 134, 2011; www.gov.uk/government/publications/investigating-the-role-of-language-in-childrens-early-educational-outcomes. 59. A Goodman and P Gregg, The importance of attitudes and behaviour for poorer children’s educational attainment, Joseph Rowntree Foundation, 2010. 60. C Pascal and A Bertram, ‘The impact of early education as a strategy for counteracting socio economic disadvantage’, background paper prepared for Ofsted’s Access and Achievement 2013 review, available at: www.ofsted.gov.uk/accessandachievement. 61. The Annual Report of Her Majesty’s Chief Inspector of Education, Children’s Services and Skills, Ofsted, 2012; www.ofsted.gov.uk/resources/report-of-her-majestys-chief-inspector-of-education-childrens-services-and-skills-early-years. 62. C Nutbrown, Foundations for quality: the independent review of early education and childcare qualifications (final report), Department for Education, 2012.
www.ofsted.gov.uk 43
Chapter 3 – Investing in high quality early years education and care

Early years education and care play major roles in laying the foundations for children’s future life prospects. All too often, the positive gains reported in the Early Years Foundation Stage are not maintained and built on sufficiently during the earliest stages of statutory schooling.
It is crucial that teachers in primary schools are better equipped to assess and track the progress of children from the start of their school career. Inspection evidence demonstrates that the best primary schools do just that.
The best primary schools quickly assess each child in terms of key skills such as reading,
writing and grasp of numbers. They use this baseline to inform teaching and support for each child. They link frequent assessments of each child’s progress to their learning and to the professional development and performance management of their staff. The schools that do this well achieve outstanding results for all their children.
One headteacher, whose school was visited as part of the Access and achievement good practice survey,61 explained why early and ongoing assessment and tracking was critical to the school’s success in narrowing gaps for disadvantaged pupils (see case study 3).
61. www.ofsted.gov.uk/accessandachievement.
Case study 3: Ongoing assessment was critical‘We have worked consistently to move to a more precise description of entry levels into Nursery. The most important reason is to identify gaps in attainment as compared to reasonable age related expectations and any patterns within cohorts and intakes. This allows us to insist that all staff understand these needs and meet them so that over time we close the gap. There is a real sense of urgency about this, as there is in the use of analysis throughout the school, because we do not have the luxury of time to waste. We have to ensure children make exceptional progress in every single year group including Nursery if they are to leave us with above age related expectations and well equipped for Key Stage 3 and beyond.
‘Our own assessment system has been developed by the EYFS leader over a period of time and uses a combination of every day criteria such as name recognition, number and colours known, etc., alongside accurate and detailed assessment of language acquisition and application. The data are analysed swiftly at the start of the year and the outcomes inform planning, targeted support and additional strategies such as purchasing in-house speech therapist time to train staff and to work with children. The results are used to accurately understand and address learning needs. The wealth of information follows the child, is reviewed at the end of Nursery and in Reception and moves with them into Year 1, where again we assess early and move on with closing the gap.’
44 Unseen children: access and achievement 20 years on
Chapter 3 – Investing in high quality early years education and care

www.ofsted.gov.uk 45
Chapter 3 – Investing in high quality early years education and care

54Tackling the underachievement of disadvantaged pupils at school level
The attainment of disadvantaged pupils varies greatly between similar schools and too many schools achieve very little for this group of pupils. There are too few secondary schools outside London serving higher proportions of low income pupils where levels of attainment for this group match or are better than all pupils nationally. This is a particular issue in schools that have higher proportions of White British pupils.
In addition, it is too easy to lose sight of pupils from low income backgrounds in schools where they make up a smaller proportion of the total number of pupils on roll. In these schools, the stronger performance of the majority of pupils can mask weaker performance of those pupils eligible for free school meals. While all types of pupils benefit from going to a good or outstanding school, gaps in attainment remain too wide across the education system.
The attainment of disadvantaged pupils varies greatly between similar schools The attainment of pupils eligible for free school meals varies greatly between similar schools and too many schools achieve very little for this group of pupils, particularly during their secondary education (see Figure 15). Stark variations in levels of attainment can be identified across the full range of free school meals bands in schools. In too many instances, what is working very well in some schools is not being replicated elsewhere in schools serving similar proportions of disadvantaged pupils.
Figure 15 contains data for 2,603 mainstream state secondary schools with six or more free school meal eligible students on roll in 2012. On the upper right hand side are the relatively few successful schools serving deprived communities where pupils eligible for free school meals attain well. In the top left corner are the schools serving less deprived communities where the small proportion of
46 Unseen children: access and achievement 20 years on
Chapter 4 – Tackling the underachievement of disadvantaged pupils at school level

Percentage of pupils eligible for free school meals
% a
chie
ving
5+
GC
SEs
at g
rade
s A
* to
C in
clud
ing
Engl
ish
and
mat
hem
atic
s
0
10
20
30
40
50
60
70
80
90
100
0 10 20 30 40 50 60 70 80 90 100
GCSE average attainment for FSM pupils
FSM eligibility national average for Key Stage 4 pupils in 2012
14%
GCSE average attainment for all pupils
59%
36%
Attainment of pupils eligible for free school meals and proportion of pupils eligible for free school meals, mainstream state secondary schools
Data based on 2012 Key Stage 4 validated data. Data points represent all open secondary schools that have had a published section 5 inspection as at 31 December 2012. 320 secondary schools without any eligible FSM pupils or where <=5 students were on role in 2012 are not included in this analysis.
Source: Ofsted
Figure 15
www.ofsted.gov.uk 47
Chapter 4 – Tackling the underachievement of disadvantaged pupils at school level
www.ofsted.co.uk 4747www.ofsted.gov.uk

62. Based on outcomes for the Key Stage 4 cohort in 2012. 63. R Lupton, P Noden, A Brady and A West, ‘School organisation and the educational achievement of children in poverty in England’, Access and achievement in education 2013 review, Ofsted 2013; www.ofsted.gov.uk/accessandachievement.
children from low-income families also attain well. However, there are too many secondary schools densely clustered in the bottom left corner of the chart. These are schools where the proportion of pupils eligible for free meals is relatively small but where these pupils attain poorly.
Also striking are the schools at the bottom of the chart. At the very bottom left is a group of 30 schools with a small proportion of pupils from low income backgrounds where none of these pupils attained five GCSEs at grades A* to C including English and mathematics in 2012. Just above these is a cluster of schools where fewer than one in 10 attained the national benchmark for GCSE.
There are too few successful secondary schools serving high proportions of disadvantaged pupils Outside of London, there are too few secondary schools where large number of pupils from low income backgrounds attain standards that are in line with their better off peers.62
In 2012, there were a total of 442 secondary schools in England where the percentage of pupils eligible for free school meals attaining five good GCSEs including English and mathematics was above the national average for all pupils. This represents over one in six of all secondary schools with eligible pupils on roll. However, the number of successful secondary schools serving higher proportions of pupils from lower income backgrounds was much smaller, with few featuring high proportions of White British pupils.
Over two thirds of the 442 most successful schools had fewer than 10% of pupils eligible for free school meals. Many of these schools were grammar schools. Despite pupils from low income families making better progress in grammar schools than disadvantaged pupils elsewhere, there is a much lower likelihood of disadvantaged pupils attending grammar schools in the first place.63
By comparison, in 2012, there were only 97 secondary schools with over 14% of pupils on roll eligible for free school meals where these pupils attained above the national average for all pupils at GCSE (see Figure 17 on pages 50–51). Sixty-four of these schools were in London. There were no such successful schools in the South West or South East of England.
It is clear from the maps that the strongest performing schools serving areas of disadvantage are concentrated in London and a few other large urban areas. By contrast, the weakest performing schools are spread widely across the country, often in towns rather than large urban areas, and with a large number located near to the coast. Interestingly, there are areas of the country, such as the North East, where the strongest and weakest performing schools (in terms of the attainment of their disadvantaged pupils) are in very close proximity. This reinforces the point that economic disadvantage in itself is not an insurmountable barrier to educational success. Some schools with high proportions of pupils eligible for free school meals do very well for this group, while others in the same geographical location do not.
48 Unseen children: access and achievement 20 years on
Chapter 4 – Tackling the underachievement of disadvantaged pupils at school level

It is too easy to lose sight of disadvantaged pupils
In too many secondary schools, the poor performance of pupils from low income backgrounds is masked by the generally strong performance of other pupils. In 2012, for example, there were 424 secondary schools where, overall, pupils attained at or above the national average for all pupils, whereas the pupils eligible for free school meals attained below the national average for similar pupils. Of these
schools, 225 had been judged good for overall effectiveness at their most recent inspection and 131 had been judged outstanding.
This issue is most problematic in those schools where a smaller proportion of pupils are eligible for free school meals. For example, in 2012, there were just over 181,000 pupils eligible for free school meals in around 1,850 secondary schools, where they accounted for 5% to 20% of the total number of pupils on roll (see Figure 16). However, we know that, on average, pupils
Number of pupils in secondary schools eligible for free school meals by the average proportion of free school meal eligibility within the schools attended, in thousands
FSM band
0
30
60
90
120
<5 5–10 10–20 20–30 30–40 40–50 50–60 60–70 70–80 80–90 90–95 95>
Source: Department for Education
Figures based on the proportion of free school meal eligibility across the whole school populations.Figure 16
www.ofsted.gov.uk 49
Chapter 4 – Tackling the underachievement of disadvantaged pupils at school level

Sheffield
Birmingham
Swindon
Plymouth
Norwich
Leicester
Southampton
Portsmouth
Sunderland
LeedsLiverpool
Location of the 97 secondary schools in England serving above average proportions of pupils eligible for free school meals, with the highest performance at GCSE for these pupils
Schools with a high percentage of FSM pupils attaining the GCSE benchmark
50 Unseen children: access and achievement 20 years on
Chapter 4 – Tackling the underachievement of disadvantaged pupils at school level
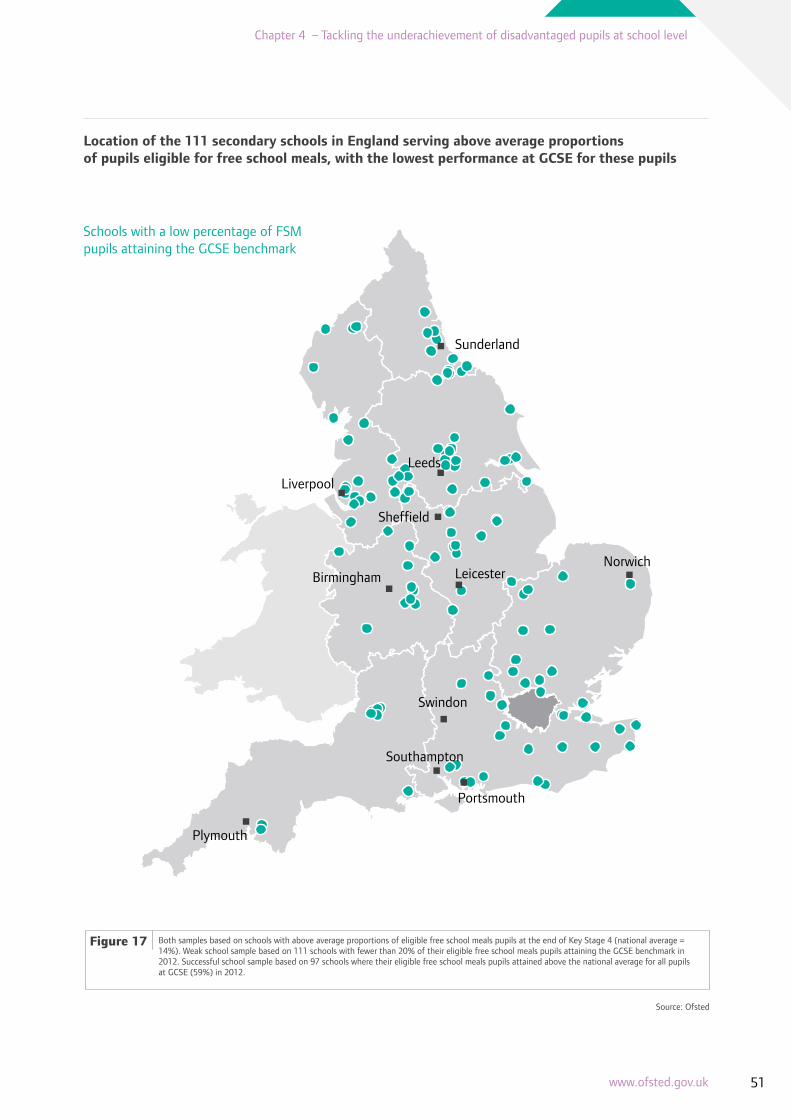
Sheffield
Birmingham
Swindon
Plymouth
NorwichLeicester
Southampton
Portsmouth
Sunderland
Leeds
Liverpool
Location of the 111 secondary schools in England serving above average proportions of pupils eligible for free school meals, with the lowest performance at GCSE for these pupils
Source: Ofsted
Both samples based on schools with above average proportions of eligible free school meals pupils at the end of Key Stage 4 (national average = 14%). Weak school sample based on 111 schools with fewer than 20% of their eligible free school meals pupils attaining the GCSE benchmark in 2012. Successful school sample based on 97 schools where their eligible free school meals pupils attained above the national average for all pupils at GCSE (59%) in 2012.
Figure 17
Schools with a low percentage of FSM pupils attaining the GCSE benchmark
www.ofsted.gov.uk 51
Chapter 4 – Tackling the underachievement of disadvantaged pupils at school level

eligible for free school meals do best in secondary schools where they make up either a very small or large proportion of the total number on roll. They do worst in those schools where they are in the middle range (see Figure 18).
Percentage of Key Stage 4 pupils eligible for free school meals attaining the GCSE benchmark by secondary schools, in deciles from low to high proportions of pupils eligible for free school meals
0
20
40
10
30
50
60
7063
47
37 3735 35 35 35
38
42
Percentage of Key Stage 4 cohort eligible for FSM
0–3
3.1
–4.9
5–6
.6
6.7
–8.4
8.5
–10
.4
10
.5–1
3.2
13
.3–1
7.2
17
.3–2
2.5
22
.6–3
0.7
30
.8–8
3.6
Children who are eligible for free school meals do worst in those schools where they are in the middle range
52 Unseen children: access and achievement 20 years on
Chapter 4 - Tackling underachievement at school level
Source: Ofsted
Data based on 2012 Key Stage 4 validated data. Figures represent all open secondary schools that have had a published section 5 inspection as at 31 December 2012. Schools with percentage figures exactly on the decile boundary have been included in the lower decile.
Figure 18

0
20
40
60
100
80
Good Satisfactory/requires improvement InadequateOutstanding
Non-FSM FSM Non-FSM FSM Non-FSM FSM Non-FSM FSM
50
75
39
64
34
56
25
47
Percentage of pupils eligible for free school meals attaining five GCSEs at grades A* to C including English and mathematics, by school overall effectiveness judgement
Source: Ofsted
Includes all open secondary schools that have had a published section 5 inspection as at 31 December 2012. Figures are based on Key Stage 4 validated data.
Figure 19
Attainment rises for all pupils in good and outstanding schools but gaps in attainment persist
Overall, test and examination data indicate that all types of pupils, irrespective of economic circumstance, attain more highly when they go to a good or outstanding school. wAt both Key Stage 2 and Key Stage 4, pupils’ average attainment rises incrementally across the four Ofsted judgements for overall effectiveness. Whether they are eligible for free school meals or not, a pupil in an outstanding school will, typically, attain more highly than
a corresponding pupil in a school that requires improvement or is inadequate.
Although good and outstanding schools achieve better outcomes for their pupils overall, they do not demonstrate a greater ability to close attainment gaps within the school. This is most apparent at Key Stage 4 (see Figure 19). It is also worth noting that the average attainment of pupils eligible for free school meals in outstanding secondary schools is still below the national average for all pupils, and only slightly higher than their better off peers in schools that have been judged inadequate.
www.ofsted.gov.uk 53
Chapter 4 – Tackling the underachievement of disadvantaged pupils at school level

5Tackling the underachievement of disadvantaged pupils at area level
Across the country, there are still too few good and outstanding schools serving areas of average or high deprivation. However, the pattern of access and achievement has changed dramatically since Ofsted’s previous review in 2003. There are some regions where pupils from disadvantaged backgrounds routinely underachieve across many local authorities. The performance of disadvantaged pupils also varies greatly across individual local authorities. The strongest performing English local authorities are now mostly in London. In some local authorities, disadvantaged pupils attain well below the average for similar pupils and the attainment gap is too wide.
Over the years, there have been a number of government-sponsored area-based initiatives to provide additional support to areas with high levels of socio-economic disadvantage. The most successful of these have been the City Challenge programmes. Important features of this initiative included a high level of political accountability, teams of dedicated challenge advisers and systems leaders, a forensic use of performance data, effective school-to-school support and the power to employ radical structural solutions where schools were underperforming. Crucially, the challenge programmes created much greater accountability at an area level for the performance of disadvantaged pupils.
All kinds of pupils benefit from going to a good or outstanding school. In A good education for all, Ofsted highlighted that too many children go through their entire school careers in satisfactory schools or worse.64 This problem is greatest for pupils who come from areas of average to high deprivation. Across the country, two thirds of schools are good or better for overall effectiveness serving areas characterised as ‘most deprived’ compared with well over four fifths of schools in the ‘least deprived’ areas. At their most recent inspection, a third of
5
64. A good education for all: key changes for schools (120112), Ofsted, 2012; ofsted.gov.uk/resources/good-education-for-all-key-changes-for-schools.
54 Unseen children: access and achievement 20 years on
Chapter 5 – Tackling the underachievement of disadvantaged pupils at area level

Percentage of schools judged good or outstanding serving the most deprived communities, as at 31 December 2012 by region
Not yet goodGood or outstanding
England
67 33
London
75 25
North West
72 28
North East
68 32
Yorkshire and Humber
60 40
West Midlands
59 41
South West
59 41
East Midlands
56 44
South East
53 47
East of England
51 49
Includes all open primary, secondary and special schools that have had a published section 5 inspection as at 31 December 2012. The number of good and outstanding schools have been combined to calculate the percentages. Deprivation is based on the Income Deprivation Affecting Children Index (IDACI) 2010. The deprivation of a provider is based on the mean of the deprivation indices associated with the home post codes of the pupils attending the school rather than the location of the school itself. The schools are divided into five equal groups (quintiles) that are labelled from ‘most deprived’ to ‘least deprived’.
Figure 20
Source: Ofsted
www.ofsted.gov.uk 55
Chapter 5 – Tackling the underachievement of disadvantaged pupils at area level

schools (1,353) serving the ‘most deprived’ areas were judged to be no better than satisfactory compared with 14% of schools (574) serving the ‘least deprived’ areas. The problem is more pronounced in secondary schools. The gap between the least and most deprived is more pronounced in secondary schools.
There are notable regional variations in the quality of schools serving areas of high deprivation (see Figure 20). The proportion of good and outstanding schools serving the ‘most deprived’ areas is better than the national average in London, the North West and the North East. However, in other regions, such
0
20
40
60
10
30
50
West B
erks
hire
Isle o
f Wigh
t
Hampsh
ire
Woking
ham
Bright
on an
d Hov
e
West S
usse
x
Brackn
ell Fo
rest
Portsm
outh
Oxford
shire
Buckin
gham
shire
Sout
h Eas
t
East S
usse
x
Milt
on K
eyne
sKen
t
Sout
hampto
n
Surre
y
Med
way
Wind
sor a
nd M
aiden
head
Reading
Sloug
h
70
63%
36%
National average for non-FSM pupils (63%)
National average for FSM pupils (36%)
Pupils not eligible for free school meals or unclassified in 2012
Pupils known to be eligible for free school meals in 2012
Source: Department for Education
Figures for 2007 to 2011 are based on final data. 2012 figures are based on revised data. Based on pupils in state-funded schools (including academies and CTCs) at the end of Key Stage 4 in each academic year.
Figure 21
The South East region: performance of FSM eligible and non-eligible pupils attaining five GCSEs at grade A* to C including English and mathematics, by local authority
56 Unseen children: access and achievement 20 years on
Chapter 5 – Tackling the underachievement of disadvantaged pupils at area level

as the East of England and South East, pupils from the most deprived areas have more limited opportunities to go to a good or outstanding school.
In some regions disadvantaged pupils underachieve across many local authoritiesIn some whole regions, opportunities for pupils from low income backgrounds look bleak. For example, in the relatively affluent South East, pupils eligible for free school meals attain at levels below the national figure for similar pupils in every local authority (see Figure 21). Gaps in attainment between disadvantaged pupils and their better off peers are also often greater than the national figure. There are comparable levels of poor performance in the least and most deprived local authorities in the region.
The performance of disadvantaged pupils varies greatly across different local authoritiesThere are even larger variations in the attainment of pupils eligible for free school meals across different local authorities. In the most successful local authorities, pupils from low income backgrounds perform much better than similar pupils elsewhere and the gap between their performance and their better off peers is much smaller than the average. In 2012, 66% of pupils eligible for free school meals at the end of Key Stage 2 attained a national curriculum Level 4 or above in both English and mathematics compared with 82% of all other pupils.65 In that year, there were 23 local authorities where 72% or more of the pupils eligible for free school meals attained the benchmark Level 4 in English
65. Seventy-nine per cent of all pupils achieved a Level 4 or above in both English and mathematics.
Performance at GCSE is a strong indicator of future success
www.ofsted.gov.uk 57
Chapter 5 – Tackling the underachievement of disadvantaged pupils at area level

Weakest-performinglocal authorities
Strongest-performinglocal authorities
Gre
enw
ich
21
49
28
43
England average 2012, all pupils (59%)
England average 2012, FSM pupils (36%)
Cam
brid
gesh
ire
18
25
8
War
ringt
on
18
25
11
Har
tlepo
ol
17
26
23
Sout
hend
-on-
Sea
20
25
14
Ches
hire
Wes
t an
d Ch
este
r
15
25
12
Her
efor
dshi
re
19
23
9
Stoc
kton
-on-
Tees
14
24
18
Swin
don
16
24
15
Cum
bria
16
24
11
Dor
set
2325
10
Wes
t B
erks
hire
2022
7
Pete
rbor
ough
14
19
17
Bar
nsle
y
10
23
20
Shro
pshi
re
2724
9
Isle
of
Wig
ht
2623
14
Lam
beth
34
56
35
Birm
ingh
am
24
47
33
Ham
mer
smith
and
Ful
ham
38
47
32
Har
inge
y
25
46
37
Bar
king
and
Dag
enha
m
29
50
30
Bar
net
34
50
18
Hou
nslo
w
32
51
21
Sout
hwar
k
31
52
36
Wes
tmin
ster
40
65
41
Tow
er H
amle
ts
32
59
54
Red
brid
ge
37
56
20
New
ham
37
55
40
Hac
kney
32
52
40
Kens
ingt
on a
nd C
hels
ea
48
77
25
Percentage of FSM eligible pupils in secondary schools 2011–12
100%
0%
0%
100%
Percentage of FSM pupils achieving 5 GCSEs A* to C including English and mathematics
2012
2007
Weakest and strongest performing local authorities by FSM pupil attainment and change in FSM pupil attainment from 2007 to 2012
Source: Department for Education
Figures for 2007 are based on final data. 2012 figures are based on revised data. Based on pupils in state-funded schools (including academies and city technology colleges) at the end of Key Stage 4 in each academic year.
Figure 22
58 Unseen children: access and achievement 20 years on
Chapter 5 – Tackling the underachievement of disadvantaged pupils at area level

and mathematics at the end of Key Stage 2. Attainment gaps were smaller than average in all these authorities. Eighteen of these higher performing local authorities were in London, four were in the North West and one was in the North East. Against this measure of attainment, the four strongest performing authorities were Camden, Tower Hamlets, Lewisham and Lambeth.66
During the same period, there were 34 local authorities where 60% or fewer pupils eligible for free school meals at the end of Key Stage 2 achieved the national benchmark. In these authorities, the attainment gap between disadvantaged pupils and their better off peers was typically well above the national average. Twelve local authorities were in the South East, six were located in the Yorkshire and Humber and five each were in the East of England and West Midlands regions, respectively. Against this measure of attainment, the lowest performing local authorities were West Berkshire, Wokingham, North Lincolnshire and Suffolk.
Although pupils’ attainment is important at all stages, performance at GCSE represents the culmination of a pupil’s statutory schooling and is a strong indicator of future success in education and employment. In 2012, 36% of pupils eligible for free school meals nationally gained five GCSEs at grades A*to C including English and mathematics compared with 63% for all other pupils. In that year, there were 21 local authorities where 45% or more of the disadvantaged cohort achieved the GCSE benchmark. With the exception of Birmingham, all of these local authorities were in London.
The attainment gap between disadvantaged pupils and their better off peers was also lower than the national average in all except one of these local authorities (Hammersmith and Fulham). The attainment of pupils from low income backgrounds was above the national figure for all pupils in Kensington and Chelsea, Westminster and Tower Hamlets.
By contrast, there were 15 local authorities where the benchmark GCSE attainment of disadvantaged pupils was 26% or less. The weakest performing local authorities against this measure were Peterborough, West Berkshire, Barnsley and Herefordshire (see Figure 22). In all bar one of these 15 local authorities (Isle of Wight), the attainment gap between disadvantaged pupils and their better off peers was higher than the national figure.
Looking more broadly at the 20 poorest performing local authorities in terms of GCSE attainment for low income pupils, it is apparent that they vary in size, density of population and geographical location. What they suggest is that the problem is not simply an ‘urban’ challenge as was investigated at the time of the 1993 report. There are striking differences in the performance of pupils eligible for free school meals across different regions and between ostensibly similar local authorities. As such, a range of tailored solutions are required that meet particular needs of pupils in different areas of the country. In turn, this calls for a much greater accountability for the performance of disadvantaged pupils at an area-based level and specific targeted interventions that improve achievement in areas where underperformance is most prominent.
66. Full tables available at: www.ofsted.gov.uk/accessandachievement.
www.ofsted.gov.uk 59
Chapter 5 – Tackling the underachievement of disadvantaged pupils at area level

67. Pupil Premium – what you need to know, Department for Education, www.education.gov.uk/schools/pupilsupport/premium/b0076063/pp. 68. R Lupton, P Noden, A Brady and A West, School organisation and the educational achievement of children in poverty in England’, Access and achievement in education review, Ofsted 2013; www.ofsted.gov.uk/accessandachievement. 69. R Cunningham and K Lewis, NFER Teacher Voice Omnibus February 2012 Survey, London: The Sutton Trust, 2012. 70. The Pupil Premium (120197), Ofsted, 2012; www.ofsted.gov.uk/resources/pupil-premium. 71. The Pupil Premium: how schools are spending the funding successfully to maximise achievement (130016), Ofsted, 2012; www.ofsted.gov.uk/resources/pupil-premium-how-schools-are-spending-funding-successfully-maximise-achievement. 72. The Sutton Trust EEF Teaching and Learning Toolkit; www.suttontrust.com/education-endowment-foundation/toolkit/. 73. www.afa3as.org.uk/. 74. N Humphreys and G Squires, Achievement for all national evaluation: final report, research report DFE-RR 176, 2011.
Area-based initiatives to tackle the impact of socio-economic disadvantageOver the years, there have been many attempts by central government to fund additional inputs into targeted areas to compensate for high levels of socio-economic disadvantage. There are several prominent examples of these area-based initiatives. These range from the Educational Priority Areas of the 1960s through to New Labour’s Education Action Zones, New Deal for Communities (NDC), Sure Start, Excellence in Cities (EiC) and the London and City Challenge programmes.
Since 2011, government policy has focused on giving targeted Pupil Premium funding to individual schools to support the work they do with disadvantaged pupils.67 Studies have shown that whole school improvement activities tend to have greater benefit for better off pupils. To close gaps, initiatives need to be targeted closely at those schools facing the most challenging circumstances and the most disadvantaged pupils within those schools.68
Schools have autonomy on how they spend the money to raise achievement for their pupils from low income backgrounds. Early studies into schools’ use of the Pupil Premium indicated that, while broadly welcomed, the funding was not always targeted closely on those pupils who need it or on those interventions that have a track record of successfully raising achievement.69,70
However, more recent evaluations indicate that this is improving as schools develop better focused approaches to using the money. Examples of successful strategies for making the best use of the Pupil Premium have been identified by Ofsted in its good practice survey report The Pupil Premium: how schools are spending the funding successfully to maximise achievement71 and by the Sutton Trust through its Pupil Premium Toolkit.72
Although not area-based, collaborative initiatives such as ‘Achievement for All’ have been successful in raising the ambitions and achievement of pupils identified with special educational needs and/or disabilities, a group of pupils who are also often from economically disadvantaged backgrounds.73 The programme contains some of the important elements of successful area-based initiatives. It sets up tailored partnerships between trained coaches, school leaders, teachers and parents and has a strong ‘holistic’ focus on improving wider school outcomes.
A Department for Education (DfE) evaluation of the programme concluded that it had been ‘very successful in narrowing the well-established achievement gap between pupils with and without SEND’.74 It offers helpful lessons when designing strategies that aim to reduce gaps between different groups of pupils.
Although recent policy has focused on providing funding directly to schools, there remains considerable interest in promoting area-based
60 Unseen children: access and achievement 20 years on
Chapter 5 – Tackling the underachievement of disadvantaged pupils at area level

www.ofsted.gov.uk 61
Chapter 5 – Tackling the underachievement of disadvantaged pupils at area level

initiatives in localities where socio-economic disadvantage has a detrimental impact across the whole community.75 However, the rapidly evolving nature of many area-based initiatives in the past has made it difficult to fully evaluate their impact. The relative merits and shortcomings of these programmes have been highlighted in the research literature.76,77
Studies show, for example, that area-based initiatives are often successful in stimulating local activity and are viewed positively by teachers and parents. However, it is less clear whether they offer good value for money or are accessed fully by the most disadvantaged pupils. In general, area-based initiatives have failed to close the overall attainment gap between disadvantaged pupils and their more affluent peers. There has, however, been one notable exception – the area-based London and City Challenge programmes, which ran from 2003 to 2011.
London Challenge and the City Challenges, 2003–11
As discussed elsewhere in this report, the quality of education in London and the outcomes for its pupils have been transformed in recent years. The ‘London premium’ appears to be of greatest value for pupils from low income and minority ethnic backgrounds and pupils in schools in Inner London. Nevertheless, pupils do better on average in London than elsewhere in the country regardless of minority ethnic status or eligibility for free school meals.
One of the key drivers behind the sustained improvement in London schools was the success of the London Challenge programme. The aims and impact of the London and City Challenge programmes and the merits of their various strategies have been considered in detail in the literature.78-84 On balance, evaluations point to measurable improvements in reducing the number of underperforming schools, increasing the number of good or outstanding schools and raising educational attainment for disadvantaged pupils.
London Challenge was established in 2003 to improve outcomes in low-performing secondary schools in the capital. Primary schools were included in the scheme from 2008. In its 2010 evaluation of London Challenge, Ofsted noted that: ‘London Challenge has continued to improve outcomes for pupils in London’s primary and secondary schools at a faster rate than
75. A Dyson, K Kerr, C Raffo and M Wigelsworth, Developing Children’s Zones for England, University of Manchester/Save the Children, 2012. 76. D Mongon, ‘White British students from low income backgrounds’, Access and achievement in education 2013 review, Ofsted, 2013, www.ofsted.gov.uk/accessandachievement. 77. G Whitty and J Anders, Narrowing the achievement gap: policy and practice in England 1997-2010, Addressing the achievement gap from an international perspective (J V Clark, ed.), Springer, 2013. 78. M Ainscow, ‘Moving knowledge around: strategies for fostering equity within educational systems’, Journal of Educational Change, vol. 13, No. 3: 289 310, 2012. 79. Vision for London 2008 11: London education on the way to world class, Department for Children, Schools and Families, 2008. 80. M Hutchings, C Greenwood, S Hollingworth, A Sansaray and A Rose, Evaluation of the city challenge programme, Institute for Policy Studies in Education, London Metropolitan Universtiy/Department for Education, 2012. 81. M Hutchings and A Mansaray, A review of the impact of the London Challenge (2003 08) and the City Challenge (2008 11), Access and achievement in education review, Ofsted, 2013. 82. London Challenge (100192), Ofsted, 2010; www.ofsted.gov.uk/resources/london-challenge. 83. P Rudd, P Poet, G Featherstone, E Lamont, B Durbin, C Bergeron, G Bramley, K Kettlewell and R Hart, Evaluation of city challenge leadership strategies; overview report – final report for the national College for Leadership of Schools and Children’s Services, NFER, 2011. 84. G Wyness, London schooling: lessons from the capital, Centre Forum, 2011.
There was very high level political support and accountability for the London Challenge programme from the outset
62 Unseen children: access and achievement 20 years on
Chapter 5 – Tackling the underachievement of disadvantaged pupils at area level

nationally. London’s secondary schools continue to perform better than those in the rest of England. Programmes of support for schools are planned with experienced and credible London Challenge advisers using a shared and accurate audit of need. Excellent system leadership and pan-London networks of schools allow effective partnerships to be established between schools, enabling needs to be tackled quickly and progress to be accelerated.’
City Challenge was an expansion of London Challenge over three years from 2008 that aimed to improve outcomes for young people in the Black Country and Greater Manchester and to continue support for London Challenge. In a detailed evaluation of the City Challenge programmes, Hutchings, et al. (2012) found that:
‘Clearly a great many factors contributed to these improvements, including national policies and strategies and the considerable efforts of headteachers and staff. However, these factors apply everywhere in the country. The most plausible explanation for the greater improvement in Challenge areas is that the City Challenge programme was responsible. The vast majority of stakeholders at all levels who contributed to this evaluation attributed the additional improvements that have been made in these areas to the work of City Challenge.’85
In an up-to-date review of the long-term impact of the challenge programme, Hutchings and Mansaray (2013) conclude that improvements have been sustained in London and Manchester but less so in the Black Country.86 However, all of the areas have benefited from important
legacy activities. The review identifies a number of reasons behind the relative success of each of the challenges. Important factors include the timescale of the programmes, the continuity of the personnel involved and the extent to which those in the area felt ‘ownership’ of the challenge. The authors note that ‘the challenges were comprehensive area-based initiatives that tackled all elements of schooling. It cannot be assumed that taking certain elements in isolation will be as effective as the combination of elements.’
The London Challenge programme was a partnership between central government, local government, schools and other key players in the city. Crucially, there was very high level political support and accountability for the London Challenge programme from the outset. It was one of the Prime Minister’s top 10 delivery priorities, with both an identified Minister and Commissioner for London Schools.
In his evidence to the Access and achievement review, Lord Andrew Adonis argued that the success of London Challenge was founded on:
‘…a collective spirit combined with a massive sense of urgency. Settling for the status quo was not an option – a tough line was taken, with radical solutions available and, for the most part, with the support of the various local authority directors of education. Unfortunately, the same level of urgency about the then state of London schools wasn’t (and isn’t) apparent in other areas of the country.’
The Challenge programme differed from many other previous initiatives in that it had greater
85. M Hutchings, C Greenwood, S Hollingworth, A Sansaray and A Rose, Evaluation of the city challenge programme, Institute for Policy Studies in Education, London Metropolitan Universtiy/Department for Education, 2012. 86. M Hutchings and A Mansaray, A review of the impact of the London Challenge (2003 08) and the City Challenge (2008 11), Access and achievement in education review, Ofsted, 2013.
www.ofsted.gov.uk 63
Chapter 5 – Tackling the underachievement of disadvantaged pupils at area level

flexibility to respond to local needs, to be experimental and, wherever necessary, to find radical structural solutions. One of the ultimate solutions the London Challenge had at its disposal was the power to close schools, create sponsored academies, encourage federations and develop trusts. Throughout the London Challenge, there was a concerted effort to put greater support and challenge into the system. Centrally contracted ‘challenge advisers’ were employed to offer or broker high quality support and focused challenge to schools. In the main, these advisers worked with those schools that were weakest. Experienced and successful headteachers – including National Leaders in Education (NLEs) and Local Leaders in Education (LLEs) – were also directed to work closely with underperforming schools, particularly in relation to leadership, and teaching and learning.
School leaders were helped and expected to make full use of the available performance data. This worked on several levels. Firstly, leaders had to confront what Professor David Woods, Principal Adviser to the London City Challenge, termed ‘the brutal facts’ in relation to their own school’s performance and also benchmarked against similar schools.87 Secondly, there had to be much more ‘forensic’ use of the data to track and evaluate performance so that the school’s efforts, and any intervention strategies, were closely focused on those areas that needed the most urgent improvement. Finally, there were clear, unambiguous and hard-edged targets that could not be ignored. Headteachers, schools and challenge advisers were accountable for these.
London headteachers were strongly encouraged to ‘buy into’ the aims and the approaches
87. London Challenge used benchmarking through ‘families of schools’. This allowed schools to compare their performance against similar (neighbouring) schools. ‘Families of schools’ data were also used in the Manchester and Black Country Challenges, but with varying degrees of success (Hutchings et al., 2012).
64 Unseen children: access and achievement 20 years on
Chapter 5 – Tackling the underachievement of disadvantaged pupils at area level

a clear focus on raising achievement
for the most disadvantaged pupils
a shared purpose that involves the best
local leaders and schools in directly supporting other schools in strengthening the leadership and teaching workforce
support and challenge through
external, expert advisers who could broker bespoke solutions
sufficient flexibility to respond to the specific
needs and context of the target area
sufficient executive powers to take decisive
action where improvement is too slow.
88. M Hutchings and A Mansaray, ‘A review of the impact of the London Challenge (2003 08) and the City Challenge (2008 11)’, Access and achievement in education review, Ofsted, 2013.
of the Challenge from the start. Over time, headteachers came to see themselves as ‘London headteachers’, responsible for the performance of pupils across London and not just within their own schools. They became actively involved in leading the strategy, supported by challenge advisers who were there to broker the best support. Successful leaders and schools were encouraged to organise training for others and there were opportunities for schools to work in partnership in order to share effective practice and exchange innovations.
The London Challenge was proactive in tackling issues of teacher recruitment and retention that had dogged the capital for years. There were a number of elements to this strategy, including Chartered London Teacher status, the advent of Teach First, a range of targeted professional development programmes focused on improving the quality of teaching and a system-wide use of existing expertise to ‘move knowledge and expertise around the system’.
Importantly, the City Challenges ran over a sustained period of time. Indeed, the longer timescale for the London Challenge was, arguably, a key factor in the greater success and the sustained improvement found in London.88 It takes time to bring about sustainable improvement across an area, and three years would seem to be too short a time period for such an area-based programme to fully embed. In summary, the key lessons learned from London and City Challenge programmes point to the importance of:
a high level of political will
and accountability
The London Challenge was proactive in tackling the issue of teacher recruitment that had dogged the capital for years
www.ofsted.gov.uk 65
Chapter 5 – Tackling the underachievement of disadvantaged pupils at area level

6Getting the best leaders and teachers to where they are needed most
Exceptional leaders and teachers transform schools and the lives of the pupils who attend them. The quality of leadership and management in schools has improved over time but there is too much variation across the country and between schools serving the least and most deprived communities. High profile initiatives have focused on improving leadership and getting the best leaders to areas that typically find it hard to recruit.
External support networks for school leaders have improved, but are not yet evenly distributed across the country. Leadership of more than one school and school-to-school collaboration show promise, but the impact on system wide improvement is patchy. More needs to be done to match the very best leaders and schools with other less successful schools to help them improve more rapidly.
High quality teaching is crucial, especially for disadvantaged pupils. There are big regional variations in the quality of teaching in schools serving the most and least deprived communities. Recruiting the best teachers to schools serving disadvantaged pupils is a priority. Teachers’ salaries must be competitive. Strong incentives are needed to encourage the best teachers to work in the most challenging schools, especially beyond London.
6
66 Unseen children: access and achievement 20 years on
Chapter 6 – Getting the best leaders and teachers to where they are needed most

Exceptional leaders transform schools and the lives of the pupils who attend them Recent reviews have shown that talented leadership is an essential factor in driving school improvement and a prerequisite for improving student achievement, particularly in a time of considerable educational change.89,90 It is good leadership – and particularly good leadership of teaching and learning – that makes the biggest difference to school standards.91 Studies demonstrate that leaders who foster the right conditions for developing teacher quality exert a powerful influence on learning outcomes, even in schools in the most challenging of contexts.92
All schools deserve the very best leaders, but talented leadership is most important in those schools that serve the most disadvantaged communities. The common features of successful leadership of schools in challenging circumstances were set out in two Ofsted survey reports that looked at 12 outstanding secondary schools and 20 outstanding primary schools that were ‘excelling against the odds’.93,94
The reports concluded that many of the characteristics of successful practice are common to schools in all phases. These include appointing staff of the highest quality and investing in and developing them. The staff in these schools have an unremitting focus on learning, development and progress. High quality leadership is essential to promoting, supporting and sustaining the drive to perfect
teaching and maximising learning in schools that face tough challenges.
However, in many areas of the country there is a shortage of high quality leaders, with schools in the most challenging circumstances often the most acutely affected.95 This is not a new problem, but one which needs to be addressed urgently. If achievement gaps between the highest and lowest performing areas of the country are to be closed, ‘more of the best school leaders will need to be encouraged to work in challenging contexts’.96
89. P Earley, R Higham, R Allen, T Allen, J Howson, R Nelson, S Rawar, S Lynch, L Morton, P Mehta and D Sims, Review of the school leadership landscape, National College for School Leadership, 2012. 90. K Leithwood and K Seashore-Louis, Linking leadership to student learning, Jossey-Bass, 2011. 91. The Annual Report of Her Majesty’s Chief Inspector of Education, Children’s Services and Skills, Ofsted, published November 2012; www.ofsted.gov.uk/resources/report-of-her-majestys-chief-inspector-of-education-childrens-services-and-skills-early-years. 92. T Allen, ‘Drivers and barriers to raising achievement: a focus on school and classroom level influences’, Access and achievement in education review, Ofsted, 2013; www.ofsted.gov.uk/accessandachievement. 93. Twelve outstanding secondary schools – excelling against the odds (080240), Ofsted, 2009; www.ofsted.gov.uk/resources/twelve-outstanding-secondary-schools-excelling-against-odds. 94. Twenty outstanding primary schools – excelling against the odds (090170), Ofsted, 2009; www.ofsted.gov.uk/resources/twenty-outstanding-primary-schools-excelling-against-odds. 95. Future Leaders: demonstrating impact, Future Leaders, 2011. Available at: www.future-leaders.org.uk/news/6-publications/69-future-leaders-demonstrating-impact?page=. 96. Successful leadership for promoting the achievement of white working class pupils, Denis Mongon and Christopher Chapman, School of Education, University of Manchester, for The National Union of Teachers and National College for School Leadership November 2008
It is good leadership – and particularly good leadership of teaching and learning – that makes the biggest difference to school standards
www.ofsted.gov.uk 67
Chapter 6 – Getting the best leaders and teachers to where they are needed most

Percentage of primary schools judged good or outstanding for leadership and management, by region and deprivation as at 31 December 2012
0
10
30
50
20
40
60
70
80
90
100
Most deprived Least deprived
ENG NE LON NW SW YH WM E EM SE
74
88
81
97
80
95
78
92
75
91
71
88
68
84
66
83
64
88
61
85
In England, the quality of leadership and management in maintained schools has improved markedly over the past four years. The proportion of schools judged to be outstanding for leadership and management has increased by eight percentage points since 2008.
However, there is a noticeable difference in the quality of leadership and management across different regions of the country and between the ‘least deprived’ and ‘the most deprived’
schools. This issue is particularly acute in the secondary phase of education.
The quality of leadership is not good enough in primary schools serving deprived communitiesAt their most recent inspection, leadership and management was good or outstanding in 88% of primary schools in the least deprived areas compared with only 74% in the most deprived (see Figure 23).
Includes all open primary schools that have had a published section 5 inspection as at 31 December 2012. The number of good and outstanding schools have been combined to calculate the percentages. Deprivation is based on the Income Deprivation Affecting Children Index (IDACI) 2010. The deprivation of a provider is based on the mean of the deprivation indices associated with the home post codes of the pupils attending the school rather than the location of the school itself. The schools are divided into five equal groups (quintiles) that are labelled from ‘most deprived’ to ‘least deprived’.
Figure 23
Source: Ofsted
68 Unseen children: access and achievement 20 years on
Chapter 6 – Getting the best leaders and teachers to where they are needed most

Percentage of secondary schools judged good or outstanding for leadership and management, by region and deprivation as at 31 December 2012
0
10
30
50
20
40
60
70
80
90
100
Most deprived Least deprived
ENG NELON NWSW YHWM EEMSE
75
8992 93
8691
80
93
76
88
75
94
70
87
60
85
51
84
36
85
In some areas of the country, the disparity in the quality of leadership between primary schools in deprived and affluent areas is stark. In the East Midlands, for example, the proportion of primary schools judged good or outstanding for leadership and management in the ‘least deprived’ areas is in line with the national average at 88%. But in the ‘most deprived’ areas the proportion is only 64% – a difference of 24 percentage points. Moreover, leadership is not
yet good enough in around a third or more of the most deprived primary schools in the East of England, the East Midlands and the South East.
For secondary schools there are substantial variations for deprived areas across the countryThe gap in terms of the quality of leadership and management between the ‘least deprived’ and ‘most deprived’ schools is a much bigger issue
Includes all open secondary schools that have had a published section 5 inspection as at 31 December 2012. The number of good and outstanding schools have been combined to calculate the percentages. Deprivation is based on the Income Deprivation Affecting Children Index (IDACI) 2010. The deprivation of a provider is based on the mean of the deprivation indices associated with the home post codes of the pupils attending the school rather than the location of the school itself. The schools are divided into five equal groups (quintiles) that are labelled from ‘most deprived’ to ‘least deprived’.
Figure 24
Source: Ofsted
www.ofsted.gov.uk 69
Chapter 6 – Getting the best leaders and teachers to where they are needed most

97. www.education.gov.uk/nationalcollege/national-college-teaching-agency-merger. 98. P Rudd, P Poet, G Featherstone, E Lamont, B Durbin, C Bergeron, G Bramley, K Kettlewell and R Hart, Evaluation of city challenge leadership strategies; overview report – final report for the national College for Leadership of Schools and Children’s Services, NFER, 2011. 99. Hill R. and Matthews P. (2010) Schools leading schools II: the growing impact of National Leaders of Education, National College 100. S Rea, R Hill, L Sandals, System leadership: does school-to-school support close the gap?, National College for School Leadership, 2010.
for some regions in the secondary school sector (see Figure 24). Differences are particularly large in the North East and Yorkshire and Humber, where the quality of leadership is much stronger in schools serving the least deprived communities. In contrast, there is only a small difference in the South West and London. In these regions, there is a high proportion of good and outstanding leadership in schools serving both affluent and deprived communities.
Comparing the quality of leadership and management between London and the North East illustrates the seriousness of these regional variations. In the North East, leadership and management is good or outstanding in just over a third of the most deprived secondary schools compared with over four fifths in London. Moreover, leadership and management are outstanding in nearly two fifths (38%) of London’s 245 most deprived secondary schools compared with only one of the North East’s 28 most deprived secondary schools.
High profile initiatives have focused on improving the quality of leadership in schools Over the past 10 years, there have been a number of initiatives established to improve the quality of school leadership. The National College and Future Leaders are two organisations that have played a prominent role in the field of leadership development.
In April 2013, The National College merged with the Teaching Agency to become the National College for Teaching and Leadership.97 This new agency has two key aims: improving the quality
of the workforce; and helping schools to help each other improve. One of its most high profile programmes – National Leaders of Education (NLEs) – uses outstanding headteachers to support schools in challenging circumstances.
Evaluations of the NLE programme have been generally positive and suggest that it has represented good value for money.98 A 2010 evaluation concluded that it ‘is still very much growing and extending its influence and impact. It has become embedded in the school system and developed into being a core element of the school improvement armoury’.99 A 2011 evaluation showed that NLEs were particularly successful in raising the performance of pupils eligible for free school meals in supported primary schools.100 NLEs also played an important role in the City Challenge programme that was discussed in Chapter 5.
As might be expected, where there are fewer outstanding schools, there are typically fewer NLEs and more schools in need of support. London, the North East and the North West have a better ratio of NLEs to schools than the East, East Midlands and Yorkshire and Humber. Some local authorities have very few NLEs to support large numbers of schools which require improvement. For example there were just three NLEs in Norfolk and two in Derbyshire at the end of 2012.
Overall, NLE schools do reflect the national profile for free school meals, and they are generally more disadvantaged than other outstanding schools. However, in some areas of the country there is a mismatch between the type of schools providing NLEs and the schools
70 Unseen children: access and achievement 20 years on
Chapter 6 – Getting the best leaders and teachers to where they are needed most

www.ofsted.co.uk 71
Chapter 6 – Getting the best leaders and teachers to where they are needed most
www.ofsted.co.uk 71www.ofsted.gov.uk 71
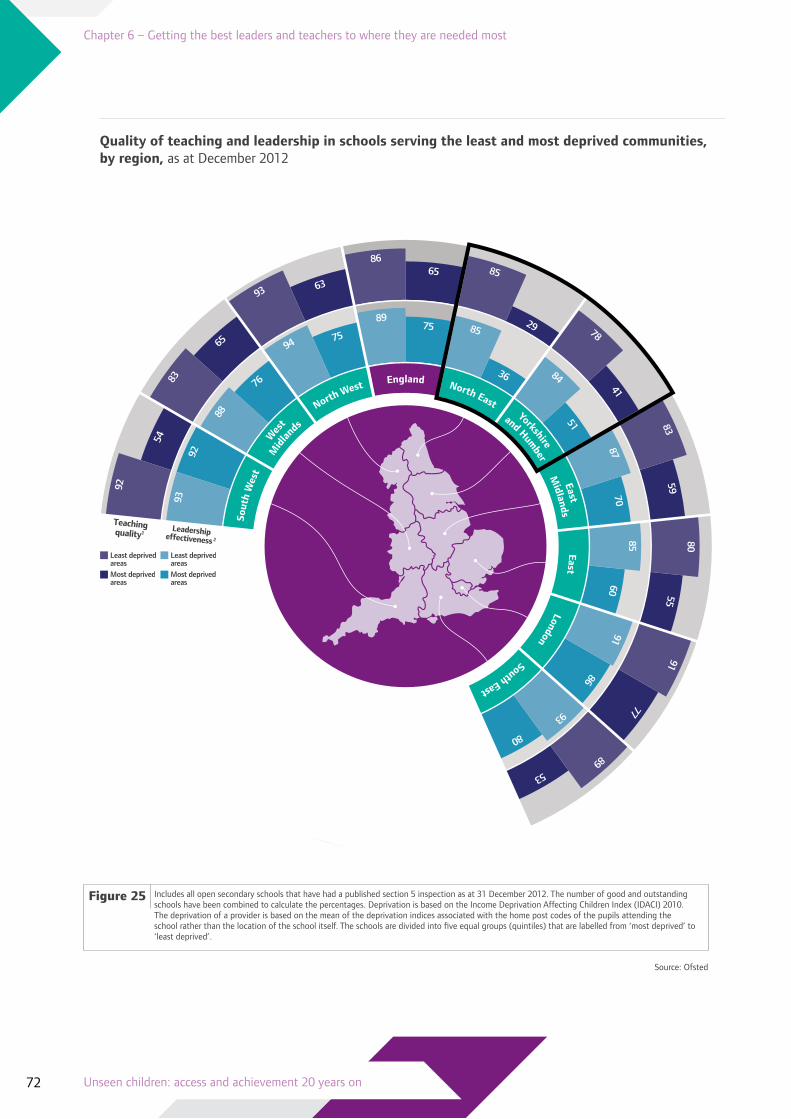
England North East
EastLondon
South East
North West
Sout
h W
est
and Humber
YorkshireM
idlandsEast
Mid
land
s
Wes
t65
75
86
89
63
75
93
9465
7683
88
54
92
92
93
85
8529
36
78
84
41
51 83
87
59
70
80
85
55
60
91
91
77
86
89
93
53
80
Least deprivedareasMost deprivedareas
Least deprivedareasMost deprivedareas
Leadershipeffectiveness2
Teachingquality1
Quality of teaching and leadership in schools serving the least and most deprived communities, by region, as at December 2012
Includes all open secondary schools that have had a published section 5 inspection as at 31 December 2012. The number of good and outstanding schools have been combined to calculate the percentages. Deprivation is based on the Income Deprivation Affecting Children Index (IDACI) 2010. The deprivation of a provider is based on the mean of the deprivation indices associated with the home post codes of the pupils attending the school rather than the location of the school itself. The schools are divided into five equal groups (quintiles) that are labelled from ‘most deprived’ to ‘least deprived’.
Figure 25
Source: Ofsted
72 Unseen children: access and achievement 20 years on
Chapter 6 – Getting the best leaders and teachers to where they are needed most

in need of support. For example, in the Yorkshire and Humber region, more than half of the NLE schools have highly advantaged populations, with the proportion of pupils eligible for free school meals under 10%.
A key question going forward is therefore how to ensure good strategic matching between NLEs and the schools which are in need of support.
Future Leaders is equipping prospective headteachers with the skills they need to work in disadvantaged schools
The Future Leaders Trust is a charitable organisation whose mission is to address educational disadvantage by transforming outstanding current or former teachers into effective school leaders for challenging schools.101 Successful applicants undertake a three-year leadership development programme that combines on-the-job and residential training. It is designed to equip participants with the skills to increase their impact, become a successful senior leader and, ultimately, a headteacher.102 Participants are expected to start seeking headships after four years of starting on the programme and to contribute back to the programme over five years by completing projects and consultancy work.
The Future Leaders flagship programme began in London in 2006 with 20 participants. Within six years, the programme had over 350 Future Leaders working in more than 200 schools. Ninety-five per cent of participants have successfully gained senior leadership roles, with over 50 reaching headship. While there has been
101. www.future-leaders.org.uk. 102. Applicants should be qualified current or former teachers who have worked in a school in the last five years, with at least two years’ proven management experience.
www.ofsted.gov.uk 73
Chapter 6 – Getting the best leaders and teachers to where they are needed most

relatively little formal evaluation of the impact of the programme on pupil outcomes, schools with Future Leader headteachers, or with a Future Leader in post for at least two years since the programme began, have improved their results at a faster rate than the national average.103
In common with a number of other successful programmes, Future Leaders has grown from a small start, and was initially focused on London and a few other deprived urban areas. The programme is now expanding to other areas, including the South Coast and the North East of England. The challenge for the scheme will be to continue shifting its geographical focus to the locations of disadvantage and low achievement while growing successfully.
Leadership of more than one school and school-to-school collaboration show promise but the impact is too patchy
Recently, there has been an increase in headteachers taking on leadership of more than one school, with federations and chains being encouraged to take over underperforming schools. Overall, Ofsted’s inspection data indicate that schools in chains generally perform better than standalone academies. The strongest chains are geographically concentrated, particularly in London. However, there is a wide range of performance between different chains.
There have also been attempts to set up structured collaborations between ‘stronger’ and ‘weaker’ schools, an approach that has the
greatest potential to work well where schools are located reasonably close together. From 2010, the government has encouraged good and outstanding schools to convert to academy status. Many of the good and outstanding schools that converted since 2010 have become standalone academies. As part of their new status, these convertor academies have a responsibility to work in partnership with other schools to help them improve. However, there is evidence that too few are taking this duty seriously enough. The recent Academies Commission report Unleashing greatness – getting the best from an academised system104 concluded that:
‘Not all these ‘converter academies’ are fulfilling their commitment to supporting other schools to improve. This is significant given that they already represent over three quarters of all academies.’
High quality teaching is especially important for disadvantaged pupilsThe quality of teaching makes a crucial difference to pupils’ learning and achievement, particularly in disadvantaged schools.105,106
Ofsted’s Annual Report 2011/12 highlights in some detail the features of the most and least successful teaching seen during inspections. The characteristics of outstanding teaching include:
excellent leadership of behaviour
and attitudes to learning
lessons that challenge pupils according
to their needs and abilities
103. Future Leaders Trust, Great leaders make great schools, great schools change lives – impact report, 2013: www.future-leaders.org.uk/news/6-publications/69-future-leaders-demonstrating-impact?page= 104. Academies Commission, Unleashing Greatness: getting the best from an academised system, Pearson/RSA, 2013. Available at: www.academiescommission.org/academies-commission-report-unleashing-greatness-getting-the-best-from-an-academised-system/. 105. T Allen, ‘Drivers and barriers to raising achievement: a focus on school and classroom level influences’, Access and achievement in education review, Ofsted, 2013; www.ofsted.gov.uk/accessandachievement. 106. L Tikly, ‘Recruiting and retaining good quality teachers in disadvantaged schools: a review of the UK and international evidence’, Access and achievement in education review, Ofsted, 2013; www.ofsted.gov.uk/accessandachievement.
74 Unseen children: access and achievement 20 years on
Chapter 6 – Getting the best leaders and teachers to where they are needed most

frequent and purposeful opportunities
to learn independently
teachers’ excellent subject knowledge
and use of questioning
highly effective feedback to pupils.
Research undertaken as part of the Effective pre-school, primary and secondary education project identified a range of practices and pedagogical techniques associated with improved outcomes for disadvantaged learners in primary and secondary schools.107 These approaches include:
improving the quality of
feedback to learners
the effective use of one-to-one
and small group teaching
encouraging pupils to be actively
involved in decision making
specific strategies for high achievers.
A recent study of the GCSE examination results for 7,305 pupils in England found that being taught over a two-year course by a high quality teacher adds 0.565 of a GCSE point per subject.108 This study shows the strong potential for improving educational standards by improving average teacher quality. The potential for leverage is greater still given that teachers work in the main with whole classes and not individuals. Importantly, this study also found that family background in itself is not a barrier to achievement. The same student can score significantly very different marks in different subjects as a result of different teacher quality.
A review of international and UK research concluded that the effects of high quality teaching are especially significant for pupils from disadvantaged backgrounds:
‘Over a school year, these pupils can gain 1.5 years’ worth of learning with very effective teachers, compared with 0.5 years with poorly performing teachers. In other words, for poor pupils the difference between a good teacher and a bad teacher is a whole year’s learning.’109
There are big regional variations in the quality of teaching between the most and least deprived schools International comparisons of OECD countries indicate that most education systems that demonstrate both high performance and very low between-school variation in PISA
The same student can score significantly very different marks in different subjects as a result of different teacher quality
107. P Sammons, K Sylva, E Melhuish, I Siraj-Blatchford, B Taggart, S Barreau and Y Grabbe, Effective pre-school and primary education 3 11 project (EPPE 3 11): The influence of school and teaching quality on children’s progress in primary school, Institute of Education, University of London. 2008. 108. H Slater, N Davies and S Burgess, ‘Do Teachers Matter? Measuring the Variation in Teacher Effectiveness in England’, Oxford Bulletin of Economics and Statistics, 74, 5, 2012. Throughout this paper the authors use teacher ‘quality’ as shorthand for the impact on test scores, and not a teacher’s wider contributions to the school. 109. Improving the impact of teachers on pupil achievement in the UK – interim findings, Sutton Trust, 2011.
www.ofsted.gov.uk 75
Chapter 6 – Getting the best leaders and teachers to where they are needed most
www.ofsted.co.uk 75www.ofsted.gov.uk 75

assessments attract teachers equitably across the school system, including, too, the hard-to-staff schools.110 In England, however, there is too much variation across the country and too much variation between schools serving the most and least deprived communities.
Nationally, the quality of teaching is good or outstanding in well over eight out of 10 primary schools serving the ‘least deprived’ areas. In the North East, the figure is 96%. However, just over two thirds of teaching is good or outstanding in schools serving the most deprived communities with very wide gaps in overall quality between the most and least disadvantaged primary schools in several regions (in particular the East Midlands, the South East and the East of England) (see Figure 26).
In secondary schools, variation in the quality of teaching both across regions and between the ‘most deprived’ and ‘least deprived’ schools is stark (see Figure 27). For example, in London, pupils benefited from good or better teaching in over three quarters of schools located in the ‘most deprived’ areas. However, in the North East, under a third of schools in the most deprived areas were considered good or better for teaching.
In five of the nine regions, the gap between the quality of teaching in the least and most deprived schools is more than 30 percentage points. This means that pupils in the most deprived schools have a much greater likelihood of receiving teaching that is not yet good enough than pupils in more affluent areas.
110. Preparing teachers and developing school leaders for the 21st century: lessons from around the world, OECD Publishing, available at: www.oecd-ilibrary.org/education/preparing-teachers-and-developing-school-leaders-for-the-21st-century_9789264174559-en.
76 Unseen children: access and achievement 20 years on
Chapter 6 – Getting the best leaders and teachers to where they are needed most

Percentage of primary schools judged good or outstanding for teaching, by region and deprivation as at 31 December 2012
0
10
30
50
20
40
60
70
80
90
100
Most deprived Least deprived
ENG NELONNW SW YH WM EEM SE
69
86
75
90
74
93
73
97
67
90
66
86
61
84
58
86
57
84
55
82
Figure 26 Includes all open secondary schools that have had a published section 5 inspection as at 31 December 2012. The number of good and outstanding schools have been combined to calculate the percentages. Deprivation is based on the Income Deprivation Affecting Children Index (IDACI) 2010. The deprivation of a provider is based on the mean of the deprivation indices associated with the home post codes of the pupils attending the school rather than the location of the school itself. The schools are divided into five equal groups (quintiles) that are labelled from ‘most deprived’ to ‘least deprived’.
Source: Ofsted
www.ofsted.gov.uk 77
Chapter 6 – Getting the best leaders and teachers to where they are needed most

Recruiting the best teachers to schools serving disadvantaged pupils is still a priority
Recruiting and retaining good quality teachers to schools in disadvantaged areas was identified by the previous two Access and achievement reviews as a major priority. It has also been a priority for successive governments, and several
initiatives, including the Graduate (GTP) and Registered Teacher (RTP) programmes, Teach First and, more recently, School Direct, have been introduced to achieve this goal. Recent research on the state of the teacher labour market identifies a range of issues affecting teacher supply and retention for all schools but with the potential to impact hardest on socio-economically disadvantaged schools.111,112
Percentage of secondary schools judged good or outstanding for teaching, by region and deprivation as at 31 December 2012
0
10
30
50
20
40
60
70
80
90
100
Most deprived Least deprived
ENG NELON NW SW YHWM EEM SE
65
86
77
91
65
83
63
93
59
83
55
80
54
92
53
89
41
78
29
85
Includes all open secondary schools that have had a published section 5 inspection as at 31 December 2012. The number of good and outstanding schools have been combined to calculate the percentages. Deprivation is based on the Income Deprivation Affecting Children Index (IDACI) 2010. The deprivation of a provider is based on the mean of the deprivation indices associated with the home post codes of the pupils attending the school rather than the location of the school itself. The schools are divided into five equal groups (quintiles) that are labelled from ‘most deprived’ to ‘least deprived’.
Figure 27
Source: Ofsted
78 Unseen children: access and achievement 20 years on
Chapter 6 – Getting the best leaders and teachers to where they are needed most

111. J Howson, The future teacher workforce: Quality and quantity: A report for the Pearson think tank, Pearson Think Tank, 2012. 112. Capital funding for new school places, report by the Comptroller and Auditor General, National Audit Office, HC 1042, Session 2012 13, 2013. 113 R Allen, S Burgess and J Mayo, The teacher labour market, teacher turnover and disadvantaged schools: New evidence from England, Bristol: Centre for Market and Public Organisation, University of Bristol, 2012. 114. Preparing teachers and developing school leaders for the 21st century: lessons from around the world, OECD Publishing, available at: www.oecd-ilibrary.org/education/preparing-teachers-and-developing-school-leaders-for-the-21st-century_9789264174559-en. 115. Education at a glance, OECD Indicators, OECD Publishing, 2011, available at: www.oecd-ilibrary.org/education/education-at-a-glance-2011_eag_highlights-2011-en. 116. L Tikly, ‘Recruiting and retaining good quality teachers in disadvantaged schools: a review of the UK and international evidence’, Access and achievement in education review, Ofsted, 2013; www.ofsted.gov.uk/accessandachievement. 117. Of those completing ITT in 2009/10, 75% completed their training in their home region and within a year 80% of those who were employed found work in their home region. Source: DfE, Evidence to the STRB: the case for change, 16 May 2012. 118. J Howson, The future teacher workforce: Quality and quantity: A report for the Pearson think tank, Pearson Think Tank, 2012. 119. L Tikly, ‘Recruiting and retaining good quality teachers in disadvantaged schools: a review of the UK and international evidence’, Access and achievement in education review, Ofsted, 2013; www.ofsted.gov.uk/accessandachievement. 120. School Direct, Quick Start Guide for Schools, 2014/15 – As of 17 March 2013, there were 800 partnerships and around 6,000 schools signed up to the programme.
A recent study of 343,547 teachers in English primary and secondary schools identified a small but positive association between the level of school disadvantage and the turnover rate of its teachers. It found that schools with many pupils from low income backgrounds have higher teacher turnover and fewer experienced teachers.113 Regular turnover of teachers and assigning fewer experienced or weaker teachers to particular groups can exacerbate inequalities, particularly for pupils from low income backgrounds.114 Matching teacher demand is therefore particularly important for pupils in schools serving disadvantaged communities who often find themselves in classes with the least experienced and least qualified teachers.
Teachers’ salaries must be competitiveIn recent times, the austere economic climate has made a career in teaching more appealing. Teachers’ salaries increased in real terms between 2000 and 2009 in virtually all OECD countries, but tend to remain below those of other graduate employment. Relative salaries in England are around the average for OECD countries.115 However, when the wider graduate labour market starts to recover, teaching is likely to look less attractive unless salaries remain competitive.
England has one of the most open labour markets for teachers in the world.116 In England, teachers are free to decide when they apply for jobs and where they apply. However, most teachers train and seek employment in their
‘home’ regions.117 Consequently, ‘if the best-quality trainees are location-specific in where they will accept teaching posts, then schools outside those areas will have to accept less well-qualified teachers.’118 There is a need, therefore, for strong and multiple incentives to attract the best teachers to the schools and areas of the country that need them most.
Schools have been given freedom at school level to set teachers’ pay in relation to the needs of the school, the local labour market and to link pay to teacher performance. This would potentially allow, for example, the Pupil Premium to be used to attract and retain good quality teachers to disadvantaged schools.119
School Direct recognises the need to offer incentives for trainees in challenging schoolsSchool Direct is a major new route for training teachers that aims to give schools a more central role in recruiting and training new teachers.120
The programme recognises the need to incentivise trainees to work in schools in more challenging circumstances. A tax-free bursary of up to £20,000 is available to individuals on the School Direct training programme, dependent on factors such as subject choice and degree classification. However, in addition, there is a 25% premium paid on the bursaries of School Direct trainees whose training is based in a school where more than 35% of pupils are eligible for free school meals.
www.ofsted.gov.uk 79
Chapter 6 – Getting the best leaders and teachers to where they are needed most

The School Direct route offers potential for schools who wish to proactively recruit, train and develop the teachers they need, but it is too early to comment on its impact. Serious consideration also needs to be given to the possibility that the most successful schools will be in a position to cherry pick the brightest and best for themselves. It is right that trainees should have the opportunity to train in the best schools. However, if these schools then employ their best trainees as newly qualified teachers (which would be understandable), there is a danger that staffing quality between successful and struggling schools will become polarised.
Currently, we know too little about where the best teachers are employedUntil recently, the Teaching Agency collected information about where newly qualified teachers worked through information provided by the now defunct General Teaching Council. Currently, it does not collect this information, nor does it collect data on where the ‘best’ teachers go. This is a weakness in the system. It makes it difficult to identify and provide ongoing support for these teachers so that they develop quickly and are retained over a longer period. It also means that it is difficult to target incentives or high quality mentoring at these teachers in order to encourage them to work in more challenging contexts. It is worth noting that one of the common features of successful education systems such as Finland, Singapore and South Korea is robust mentoring arrangements that last for several years after initial training.
Teach First has attracted new high quality teachers to disadvantaged schools, but is still strongly focused on London
Teach First is a charity focused on improving the educational outcomes of pupils from disadvantaged backgrounds. It recruits, places and trains high quality graduates, and, more recently, career changers, in schools with a high proportion of pupils from low socio-economic backgrounds. It receives a portion of its income via government grant.
Recruits follow a two-year leadership development programme. They achieve a Post-Graduate Certificate of Education at the end of year one but receive ongoing support to develop their leadership abilities and increase their impact.
Evaluations of the programme – including Ofsted’s own inspection judgements – have been generally positive.121-124 Teach First has expanded into eight regions of England, but is still relatively concentrated in a small number of areas. Currently, there are 1,562 Teach First teachers on the two-year Leadership Development Programme. Most are concentrated in London, the West Midlands and Yorkshire.
Just under half of all trainees are in London schools compared with around a fifth in the North East, the North West and the East Midlands combined. The programme now plans to expand into the South Coast from 2013, and the East from 2014 (including Norfolk, Suffolk
121. M Hutchings, U Maylor, H Mendick, I Menter and S Smart, An evaluation of innovative approaches to teacher training on the teach first programme: Final report to the training and development agency for schools, London: Institute for Policy Studies in Education. 122. D Muijs, C Chapman, A Collins and P Armstrong, Maximum impact evaluation: The impact of Teach First teachers in Schools, University of Manchester, 2010. 123. Rising to the challenge: a review of the Teach First initial teacher training programme (070170), Ofsted, 2008; www.ofsted.gov.uk/resources/rising-challenge-review-of-teach-first-initial-teacher-training-programme. 124. Teach First inspection report, Ofsted, 2011; www.ofsted.gov.uk/inspection-reports/find-inspection-report/provider/ELS/70270.
80 Unseen children: access and achievement 20 years on
Chapter 6 – Getting the best leaders and teachers to where they are needed most

and Cambridgeshire). A key question is where the future focus of this successful scheme should be, including which schools and which areas of England.
Financial incentives are important but it is not all about the moneyFinancial incentives can play their part in recruiting and retaining high quality teachers, particularly to schools that traditionally find it hard to recruit. Many countries provide substantial salary allowances for teaching in difficult areas, transportation assistance for teachers in remote areas, or additional payments for teachers with skills in short supply to help ensure that all schools are staffed with teachers of similar quality. However, incentives need to be big enough and flexible enough to make a difference.125
In France, for example, the creation of Zones d’Éducation Prioritaire (ZEP) demonstrated that additional financial resources can have a limited or negative impact on performance when too small or insufficiently targeted. In the ZEP areas, the quality of teachers actually decreased as salary bonuses were insufficient to attract more experienced teachers, and the accelerated career incentives on offer resulted in higher turnover.126
One important lesson learnt from this project was a need to concentrate more resources on fewer schools.
Financial rewards, therefore, need to be part of a well-targeted package of multiple incentives that attract high quality teachers to disadvantaged schools and enable them to contribute to that sector over a longer period.
125 Preparing teachers and developing school leaders for the 21st century: lessons from around the world, OECD Publishing, available at: www.oecd-ilibrary.org/education/preparing-teachers-and-developing-school-leaders-for-the-21st-century_9789264174559-en. 126. L Tikly, ‘Recruiting and retaining good quality teachers in disadvantaged schools: a review of the UK and international evidence’, Access and achievement in education review, Ofsted, 2013; www.ofsted.gov.uk/accessandachievement.
www.ofsted.gov.uk 81
Chapter 6 – Getting the best leaders and teachers to where they are needed most

82 Unseen children: access and achievement 20 years on
Chapter 6 – Getting the best leaders and teachers to where they are needed most

For example, North Carolina successfully introduced teaching quality improvement plans with five key features:
increased initial certification
requirements for teachers
increased salaries tied to meeting
performance standards
new teacher mentoring
ongoing professional development
for all teachers
scholarships and loan ’forgiveness‘
programmes targeted to recruit high quality candidates to teach in disadvantaged schools.
In Korea, multiple incentives are offered to candidates who work in high need schools. These include additional salary, smaller class size, less instructional time, additional credit towards future promotion, and the ability to choose the next school where one works.127
Financial incentives for the best need to be accompanied by ongoing support and career development opportunities
Studies show that financial incentives on their own are only effective when teachers have the capacity to be professionally successful in disadvantaged schools.128 This necessitates providing a range of incentives alongside appropriate support and high quality professional development. The balance between incentives
and support needs to evolve over the career cycle of the teacher so that they respond to the individual’s changing needs and circumstances.
In Singapore, for example, there are comprehensive systems for selecting, training, compensating and developing teachers and principals. Outstanding teachers receive a bonus from the school’s bonus pool. After three years of teaching, teachers are assessed annually to see which of three career paths would best suit them – master teacher, specialist in curriculum or research or school leader. Young teachers are continuously assessed for their leadership potential and given opportunities to demonstrate and learn. Potential principals are selected for interviews and go through leadership situational exercises. If they pass these, then they go for six months of executive leadership training, with their salaries paid. Principals are transferred between schools periodically as part of Singapore’s continuous improvement strategy.129
While the policies that are successful in one country cannot be transplanted wholesale into another, there is much to be learned from these international experiences. More can be done to incentivise the best teachers to work in areas of the country and schools that find it difficult to recruit.
127. OECD (2012), Preparing teachers and developing school leaders for the 21st century: Lessons from around the world, OECD Publishing, available at: www.oecd-ilibrary.org/education/preparing-teachers-and-developing-school-leaders-for-the-21st-century_9789264174559-en 128. L Tikly, ‘Recruiting and retaining good quality teachers in disadvantaged schools: a review of the UK and international evidence’, Access and achievement in education review, Ofsted, 2013; www.ofsted.gov.uk/accessandachievement. 129. OECD (2012), Preparing teachers and developing school leaders for the 21st century: Lessons from around the world, OECD Publishing, available at: www.oecd-ilibrary.org/education/preparing-teachers-and-developing-school-leaders-for-the-21st-century_9789264174559-en
The balance between incentives and support needs to evolve over the career cycle of the teacher
www.ofsted.gov.uk 83
Chapter 6 – Getting the best leaders and teachers to where they are needed most

57Further education and vocational skills
For many of the young people who get good exam grades at the age of 16, there is a well understood path through A levels and other academic qualifications to university. However, for those who do not achieve five good GCSEs including English and mathematics, the subsequent system is much more complex, and their prospects are on average much worse. Relatively few go on to secure the qualifications – particularly in English and mathematics – that they need for employment or further study by the age of 19. This affects young people from disadvantaged backgrounds disproportionately.
Ofsted has recently been critical of the quality of provision in the further education and skills sector. However, the government has announced a number of far-reaching reforms that should have a positive impact, if it follows them through rigorously and if a robust measure of progress is developed for all learners.
Apprenticeships in particular are a valued qualification route, but remain underdeveloped in England. Too many apprenticeships have been of short duration, low level, and without a real job attached to them, and the recent growth in numbers has been primarily for those over 25 years old. The Richard review recommendations propose the basis on which to reform and grow this system.130 Part of the implementation of current policies should be to strengthen greatly the level of employer leadership in the further education and skills sector, especially in relation to apprenticeships.
130. D Richard, The Richard review of Apprenticeships, Department for Business, Innovation and Skills, 2012; www.gov.uk/government/publications/the-richard-review-of-apprenticeships.
84 Unseen children: access and achievement 20 years on
Chapter 7 – Further education and vocational skills
84 Access & Achievement In Education 2012/201384 Access & Achievement In Education 2012/201384 Access & Achievement In Education 2012/2013

So far in this review, we have examined the pattern of achievement and disadvantage up to the age of 16. Most young people stay in full-time education or training longer than this, and from 2015 all young people will be required to participate in learning to the age of 18. This chapter examines what happens after secondary school and up to what will become the required age of participation in education or training in England.
Most young people either enter the labour market or continue to higher education around the age of 19. The level of educational attainment they have reached at this point is particularly important. A ‘full level 2 qualification’, meaning the equivalent of at least five GCSE passes at grades A* to C including English and mathematics, is a critical ‘employability benchmark’.131 If young people entering the labour market lack a full level 2 qualification – and the key employability skills such as reliability and the ability to work independently and in teams – then they will struggle.
Good attainment in both English and mathematics in particular is vital for work and further and higher education.132 In its recent report, First Steps: a new approach for our schools, the Confederation of British Industry (CBI) emphasised the importance of these subjects for all students.133 Level 3 qualifications meanwhile – such as A levels – are the passport to higher education, high value employment and the professions. It is necessary to examine outcomes at both levels, with a particular focus on English and mathematics.
Outcomes at 16 and 19
Overall, outcomes at 16 and 19 have improved since the last Access and achievement review. The proportion of all young people attaining level 2 including English and mathematics has been rising year on year. For 19-year-olds it increased from 45% in 2005 to 62% in 2012. However, this left a large group of young people – almost four in every 10 – finishing education in that year without the qualifications they needed to secure employment.
From a very low base, the proportions of young people from low-income families reaching the level 2 and level 3 benchmarks at age 19 have risen markedly. For example, in 2005, just one in five (20%) of those pupils who were eligible for free school meals at school secured level 2 including English and mathematics by the age of 19. By 2012, this had almost doubled to 38%.
131. D Richard, The Richard review of Apprenticeships, Department for Business, Innovation and Skills, 2012; www.gov.uk/government/publications/the-richard-review-of-apprenticeships. 132. A Wolf, Review of vocational education, Department for Education (DfE), 2011. 133. First steps: a new approach for our schools, Confederation of British Industry (CBI), 2012; www.cbi.org.uk/campaigns/education-campaign-ambition-for-all/first-steps-read-the-report-online/
From 2015 all young people will be required to participate in learning to the age of 18
www.ofsted.gov.uk 85
Chapter 7 – Further education and vocational skills
www.ofsted.co.uk 85www.ofsted.co.uk 85www.ofsted.gov.uk 85

While this represents a significant gain, more than six out of 10 young people remained below the benchmark.
Achievement by this age is particularly important because adults who do not secure good literacy and numeracy skills by 19 struggle to gain them subsequently. Despite billions of pounds of investment in adult literacy and numeracy provision over the last decade, there is limited evidence of corresponding improvements to population literacy and numeracy skills, particularly at the lower levels of attainment.
At level 3, achievement for disadvantaged young people at the age of 19 has risen from just one in five (20%) in 2005 to one in three (34%) in 2012. So two out of every three young people from low income families reached the end of their education without achieving the equivalent of two A levels. This highlights an interesting aspect of the pattern of achievement by disadvantaged young people: those who secure level 2 at age 16 appear to have a good chance of going on to secure level 3 by age 19. This further highlights the importance of achievement at school.
Just as there are wide variations in outcomes at 16 between different local authority areas, there are also wide disparities in terms of how well disadvantaged young people across the country achieve by the age of 19. In 2012, the three worst performing areas at the level 2 benchmark were the relatively affluent Rutland, Cheshire West and Chester, and West Berkshire. In each of these places just one in four or fewer pupils eligible for free school meals achieved the equivalent of five good GCSEs including English and mathematics by the age of 19 in
Adults who do not secure good literacy and numeracy skills by 19 struggle to gain them subsequently
86 Unseen children: access and achievement 20 years on
Chapter 7 – Further education and vocational skillsChapter 7 – Further education and vocational skills

Unemployment of 15–24-year-olds in the UK compared with other EU countries
Data based on figures at the end of quarter 4 2012. For comparisons across Europe the youth population is everyone aged 15 to 24. The unemployment rate is the number unemployed divided by the number employed and unemployed. The unemployment proportion is the number unemployed divided by the number employed, unemployed or economically active.
Figure 28
Source: Eurostat
Portugal
Sweden
Denmark
Spain
Greece
Netherlands
Ireland
Italy
France
UK
Austria
Germany
4
4
7
10
2111
17
15
8
1211
11
7
27
5540
39
58
13
10
2820
22
8
Unemployment rate amongst 15–24-year-olds (%)
Proportion of all unemployment accounted for by 15–24-year-olds (%)
Key
www.ofsted.gov.uk 87
Chapter 7 – Further education and vocational skills
www.ofsted.gov.uk 87
Chapter 7 – Further education and vocational skills

2012. These areas saw three quarters of their disadvantaged young people entering the labour market ill-equipped for employment. As with schools, the highest performing areas are almost all London boroughs.
This pattern of poor achievement by many young people at the age of 19 helps explain why young people make up a relatively high proportion of the unemployed in the United Kingdom. Figure 28 shows the proportion of total unemployment accounted for by young people (as well as the youth unemployment rate). One striking fact is that in Ireland, Italy and France – all of which have higher youth unemployment than the UK – young
people make up a lower share of the total unemployment. Relatively speaking, their young people are more employable compared with older adults. In Germany and Austria, young people make up a very small proportion of the total number of people who are out of work, reflecting the great strengths of their vocational training arrangements. Their recently educated and trained young people are markedly more employable than older adults.
Progression from age 16 to 19
How much value does the further education system add to young people in the years immediately after school finishes? One answer
Percentage of young people who had attained level 2 including English and mathematics at ages 16 and 19
Level 2 English and mathematics at age 16 Level 2 English and mathematics at age 19
0
20
40
60
10
30
50
19 in 2005
39
45
19 in 2006
39
46
19 in 2007
40
48
19 in 2008
42
51
19 in 2009
44
54
19 in 2010
46
57
19 in 2011
49
60
19 in 2012
51
62
Estimates at age 16 differ from other published figures on the attainment of pupils aged 15 in schools and colleges because there are differences in the methodologies used in calculating the numerators and denominators.
Figure 29
Source: Department for Education
88 Unseen children: access and achievement 20 years on
Chapter 7 – Further education and vocational skills

www.ofsted.gov.uk 89
Chapter 7 – Further education and vocational skills
www.ofsted.co.uk 89
Chapter 6 - Getting the best leaders and teachers to where they are needed most
www.ofsted.co.uk 89
Chapter 7 – Further education and vocational skills
www.ofsted.co.uk 89www.ofsted.gov.uk 89
to this question is given by looking at how many pupils leave school at age 16 without level 2 including English and mathematics, but then gain it by the time they are 19. This provides a measure of the effectiveness of the system as a whole in helping those people who did not achieve well at school.
It is important to recognise that this is not what the system has recently been funded or incentivised to do. Rather, the further education (FE) sector has been incentivised through funding and accountability measures to attract learners, to retain them on courses and to prioritise the completion of qualifications. As the sector has moved from widening participation in education to widening participation in employment, the FE sector has been responsive: young people’s participation in further education, and qualification success rates, have risen steadily and are now high across many courses and qualification types.
The number of people who progress from a lower level to level 2 including English and mathematics between the ages of 16 and 19 has also risen, but to a much lesser extent, and it remains low. Of those young people who were 19 in 2012, 62% had level 2 qualifications or better. However, 51% had already reached this level three years earlier at school. So the 16-18 system as a whole helped just over one in five of all those who had not reach level 2 at 16 to get there by the age of 19. One of the purposes of the 16–18 phase of education is to provide a second chance for those who were previously let down by the schools system. The numbers, however, tell a challenging story about how successfully the system as a whole enables this group of learners to progress.

134. A Wolf, Review of vocational education, Department for Education (DfE), 2011.
Progression to level 2 for young people from low income families is worse. The evidence shows that 38% of the pupils who were eligible for free school meals secured level 2 including English and mathematics by the age of 19 in 2012. However, three years earlier, 27% of the same cohort had already achieved that level at school by the time they were 16. In other words, seven out of 10 pupils who were entitled to free school meals left school in 2009 without the basics, and three years later just one out of those seven had reached the benchmark.
These young people may not have been in any educational provision during these years. Around one in 10 16–18-year-olds were not in any form of education, employment or training (NEET). Some of those who studied but did not reach level 2 will nonetheless have received valuable education, for example in a vocational area that was new to them. However, the central message remains that only a minority of young people from poor families secure good qualifications at school, and few subsequently secure them through further education.
The pattern and quality of further education provision Once young people complete their GCSEs, the majority attend one of three main types of educational institution. The largest number – 34% of 17-year-olds – attend general further education colleges. The next largest group – 28% of 17-year-olds – attend state-funded school sixth forms. Another 10% go to sixth form colleges, and a small proportion attend independent learning providers.
More than school sixth forms, general further education colleges support large numbers of young people to gain level 3 qualifications. Further education colleges provide a major route to further study and high quality employment. However, they are also by far the largest providers for young people who did not gain five GCSE passes at grades A* to C including English and mathematics at school. These institutions are particularly important for young people from disadvantaged backgrounds.
The large majority of 16–18-year-olds tend to stay on and successfully complete their courses. For example, the national average success rate in general further education colleges in 2012 was 83% for 16–18-year-olds. So why is the rate of progression from 16 to 19 not better? This is not what the system has been funded or incentivised to do. Many young people simply have not taken qualifications between the ages of 16 and 18 that enabled them to make enough progress. In her landmark review of vocational education, Professor Alison Wolf indicated at least 350,000 out of approximately 1.6 million students in any given 16-19 cohort were not on programmes that enabled them to progress a higher level of English and mathematics adequately.134
Overall, pupils who did not secure at least a GCSE grade C in English and in mathematics make poor progress in these subjects subsequently. Of all those (not just pupils eligible for free school meals) who secured a grade C in English but not in mathematics at 16, just over one in five (21%) had succeeded in mathematics by the time they were 19-years old in 2012. The corresponding figure for those
90 Unseen children: access and achievement 20 years on
Chapter 7 – Further education and vocational skills

www.ofsted.gov.uk 91
Chapter 7 – Further education and vocational skills

who secured a grade C in mathematics but not English at 16 was one in four (26%) by the time they were 19 in 2012.
We also see large numbers of qualifications below level 2 taken by this age group – 385,000 learners in 2011/12 – despite the fact that fully 93% of 16-year-olds in 2012 achieved a level one qualification including English and mathematics. Many of these qualifications will be in specific vocational areas that the individual has not studied previously. Nevertheless, the end result is that relatively few of the young people who do not reach level 2 by the end of secondary school subsequently manage to achieve level 2 by the age of 19.
Professor Alison Wolf’s 2011 review of vocational education was highly critical of the state of vocational education as she found it.135 She identified a number of key issues, including:
a system of ‘perverse incentives’, which
encourage the teaching of qualifications that attract the most performance points, or the most funding
not enough apprenticeships for 16–
18-year-olds and a lack of incentives for employers to be involved in the programme
too many courses and qualifications
that offer no route to further education nor entry to employment for those still in education
too many students without a solid
grounding in the basics being allowed to drop the study of English and mathematics
indifferent teaching of highly
specialised subjects.
The Wolf review also found that many of the most common vocational qualifications offered in the United Kingdom have had low and even negative returns in the labour market. This has particularly been the case for vocational qualifications at levels 1 and 2.136 However, there is also evidence that the right kind of vocational qualifications brings rewards in the labour market, with some qualifications offering immediate and sustained benefits.137 For example, studies have identified a number of examples of highly successful vocational qualifications in the STEM (science, technology, engineering and mathematics) subjects.138 It is certainly not vocational qualifications per se that are the issue, but, rather, which qualifications, and whether they are taken in a way (in the right combinations and at the right level) that leads on to higher qualifications or better employment opportunities.
Many of these issues have been identified in Ofsted inspections, and were commented on in Annual Report 2011/12, which identified major concerns with the quality of some provision in the post-16 learning and skills sector. At the end of August 2012, there were 1.5 million learners at providers that were less than good and some colleges that had not been judged to be better than satisfactory in the previous 10 years. The overall picture of inspection results for general further education colleges in particular was worse than the previous year, and the quality of teaching was a particular concern. Inspectors found:
‘…often, the quality of teaching is still not good enough; not enough young people secure good skills in English and mathematics; and providers
135. A Wolf, Review of vocational education, Department for Education (DfE), 2011. 136. A Dickerson, The returns to academic and vocational qualifications in the UK, Warwick Institute for Employment Research: University of Warwick, 2006. 137. P Patrignani and G Conlon, The long term effect of vocational qualification on labour market outcomes, 2011, Department for Business, Innovation and Skills. 138. C Greenwood, M Harrison and A Vignoles, The labour market returns of STEM qualifications and occupations, Institute of Education, 2011.
92 Unseen children: access and achievement 20 years on
Chapter 7 – Further education and vocational skills

generally do not adequately measure how well adults and young people are being equipped with skills that are closely matched to local and national labour markets.’
Figure 30 shows the pattern of college inspection judgements since 2010. The impact of risk-focused inspections and higher expectations is visible in the worsening profile of inspection judgements between 2010 and 2012. The most recent results, from December 2012, are slightly more positive than the end of the previous academic year.
Despite providing for the largest share of learners aged 16–18, the number of general further colleges is relatively small, at just over 220. This reflects their large average size. Some are very large indeed: there are around 70 colleges serving more than 10,000 learners each. These institutions have a particularly important role in their local communities, sometimes serving a very high proportion of young people who were previously entitled to free school meals as the dominant provider for those who do not attend a school sixth form. Where these large institutions are of poor quality, the life
Most recent overall effectiveness judgement for all funded colleges in England, in percentages
Good Satisfactory/requires improvement InadequateOutstanding
3December 2012 (381)
22 46 29
4August 2012 (386)
21 44 31
1August 2011 (391)
23 46 30
1August 2010 (350)
23 47 29
Percentages are rounded and may not add to exactly 100. Includes general further education/tertiary colleges (including specialist further education), sixth form colleges and independent specialist colleges that are either wholly or partly funded by the Skills Funding Agency or Education Funding Agency (formerly the Young People’s Learning Agency). As of 1 September 2012, the ‘satisfactory’ judgement has been replaced by ‘requires improvement’. Data include all open providers that have had a published college inspection at the end of each period.
Figure 30
Source: Ofsted
www.ofsted.gov.uk 93
Chapter 7 – Further education and vocational skills

chances of disadvantaged young people locally are severely compromised.
Ofsted has recently found the provision it inspects in a number of large colleges to be inadequate, including:
City of Bristol College, with
over 22,000 learners
The City of Liverpool College,
with over 11,000 learners
City College Coventry, with
over 5,000 learners.
Government policy has developed to address these concernsThe government is acting to address many of these concerns. In particular it is implementing Study Programmes, a new 16–19 funding formula from September 2013139 and a range of other changes. These collectively represent a major potential reform of the post-16 further education landscape.
As both the Wolf Review and Ofsted’s Annual Report pointed out, funding providers of further education on the basis of the number of qualifications passed creates an incentive towards high volumes at the expense of quality and coherence. In addition, funding only qualifications makes it difficult for institutions to justify other valuable activity such as work experience.
The Study Programme reforms will move the system towards ‘per student’ funding, weighted for retention and course costs, and with a
separate allocation to reflect disadvantage at the provider level. They also include a funding element related to the proportion of learners without English and mathematics at level 2. The reforms will mean that courses for 16–18-year-olds must include the study of English and mathematics for those who lack these qualifications at the equivalent of GCSE C grade. These reforms should remove important ‘perverse incentives’ for providers to focus on qualification volumes and success rates at the expense of appropriateness for the individual learner.
At the same time as removing perverse incentives in the funding system, it will be important to align the accountability system, including Ofsted inspections, away from success rates and towards better measures of performance. Ofsted inspections are already moving in this direction, with more focus on the quality of observed teaching and learning in the Common Inspection Framework from September 2012.140 However, there are key data issues that also need to be resolved before accountability can line up most effectively with the intentions of the Study Programme reforms.
One important and much needed new source of evidence for the success of providers will be ‘destination data’, which identify where learners went after completing their courses, particularly to employment or further education. These data are at an experimental stage and will be available for most post-16 institutions from later in 2013. Ofsted will give this information increasing weight in its inspection frameworks as the data become more complete and reliable.
139. Study Programmes for 16 to 19 year olds: government response to consultation and plans for implementation, Department for Education, 2012. 140. Common Inspection Framework for further education and skills (120062), Ofsted, 2012; www.ofsted.gov.uk/resources/common-inspection-framework-for-further-education-and-skills-2012.
94 Unseen children: access and achievement 20 years on
Chapter 7 – Further education and vocational skills

School accountability is greatly strengthened by the existence of nationally comparable measures on the progress made by pupils in primary and secondary schools. While attainment and qualifications are what pupils need as a foundation for success in their later lives, learner progress is now widely recognised as a better measure of the effectiveness of learning institutions. Focusing too much on raw attainment in the accountability system unfairly disadvantages institutions that are doing well for pupils with low prior attainment. It also creates a perverse incentive not to serve those young people at all. Similarly, while it is important that young people stay on and complete their courses, it is important not to recreate incentives to put young people on ‘easy’ courses, or to dissuade providers from offering courses to young people who are at more risk of dropping out.
The same arguments apply to colleges, where there are currently only progress measures for pupils moving from level 2 to level 3 qualifications. Until robust and nationally comparable progress measures are available for all pupils, it will be difficult to adequately reward those institutions adding the most value for their learners, and hard to hold those that are less effective to account. Progress measures should ideally cover the whole range of attainment, and be sufficiently finely graduated that they do not encourage discrimination against those who only just achieved a particular level. They should therefore incentivise providers to make the maximum progress for all learners. In the further education sector, it will be particularly important not to penalise colleges that enrol learners with
low prior attainment, because otherwise they may withdraw from such provision. This argues against putting too much weight on the raw attainment of particular benchmarks.
A further recent and important policy statement by the government is Rigour and responsiveness in skills.141 One important development is the proposal to create a Further Education Commissioner, with strong powers of intervention where institutions are seriously failing. The proposals to use ministerial powers where necessary to strengthen or replace college governing bodies, and to restructure or break up providers, are particularly radical. If used, they will not only add a new element to the accountability system but could also change the pattern of provision, for example replacing some very large providers with smaller more specialist institutions.
Accountability is greatly strengthened by the existence of nationally comparable measures of the progress made by pupils
141. Rigour and responsiveness in skills, 2013, Department for Business, Innovation and Skills and Department for Education; www.gov.uk/government.publications/rigour-and-responsiveness-in-skills.
www.ofsted.gov.uk 95
Chapter 7 – Further education and vocational skills
www.ofsted.co.uk 95www.ofsted.gov.uk 95

HMCI visited Germany to examine its ‘dual training’ apprenticeship system as part of the Access and achievement in education 2013 review.
In England, young people face a wide range of qualification choices at age 14–19. In the German education system, the large majority of pathways result in one of two qualifications: a degree or an apprenticeship. It is tempting to think of the German system as complex and bureaucratic. Actually it is flexible, focused on outcomes and employer needs, and highly effective.
In Germany, apprenticeships are the vocational qualification. They are started by more than half of young people and the majority, unlike in England, lead to level 3 qualifications. There are high expectations attached to apprenticeships, which take at least two years to complete and often three. Around two thirds of the apprentice’s time is spent with the employer and the rest at a vocational training school.
The vocational education element of the apprenticeships (the ‘off the job’ training) is characterised by a clear mission and specialist institutions. There are specialist institutions in cities and more general providers in dispersed areas, but all of these institutions are far smaller than our large colleges. The specialist institutions have a clear mission: to support young people to complete their apprenticeship and gain the skills of their profession. Young people train for both a specific job and a wider profession, and German apprenticeships lead to marketable skills and a very high likelihood of employment. The German system is also pragmatic and flexible: young people only start when they can secure a place with an employer (at 16, 17, 18 or 19 or after completing a degree) and they do not start if they are not ready.
There is a strong national system of professional standards – backed by legislation around professional standards and employer organisations – and an extremely high level of both national and local employer engagement in Germany. In fact the term ‘employer engagement’ is too weak a description of what happens in Germany. It is better described as employer leadership or ownership. Employers receive little or no subsidy for providing places and they pay apprentices a proper wage from day one. They also play a leading role in determining the professional standards and curriculum, and examining apprentices.
Apprenticeships in Germany are part of a cultural heritage with deep roots that goes back to the 19th century. There is no way this system can be imported wholesale to the United Kingdom, but we should recognise its strengths and try to reflect them in our own arrangements where this is appropriate.
Case study 4: The German system of vocational training
96 Unseen children: access and achievement 20 years on
Chapter 7 – Further education and vocational skills

Stronger employer leadership, and more high quality apprenticeships will be key to successApprenticeships play an important role in helping young people make a successful transition into work in many northern European countries and in some other English-speaking countries, notably Australia.142,143 In these countries, apprenticeships are designed to be a main route into employment: they have high public standing and well-resourced apprenticeship training and associated learning environments, and employers continue their apprentices’ training and development after they qualify for their profession. Employers are well represented on the governing bodies of training institutions. Rates of youth unemployment in these countries are much lower than in the UK. However, replicating these successful systems in England is not a straightforward proposition. In this country a recent study by the Institute for Public Policy Research argued that:
‘Employer demand for apprentices has been persistently low and repeated attempts to revive the system have been frustrated by the weak institutional framework for apprenticeships, which is characterised by low involvement or commitment from key stakeholders. There is also evidence that the quality of apprenticeships in England varies widely across sectors, and that it is much lower in those sectors where apprenticeships are not traditional. Attempts to increase the number of employers willing to offer apprenticeships, or to improve the quality of those that are available, have generally foundered.’
142. H Steedman, The state of apprenticeships in 2010, 2010, Apprenticeship Ambassadors Network/the London School of Economics and Political Science. 143. T Dolphin and T Lanning (eds.), Rethinking Apprenticeships, 2011, Institute for Public Policy Research/Association of Colleges, 2011.
Apprenticeships play an important role in helping young people make a successful transition into work
www.ofsted.gov.uk 97
Chapter 7 – Further education and vocational skills
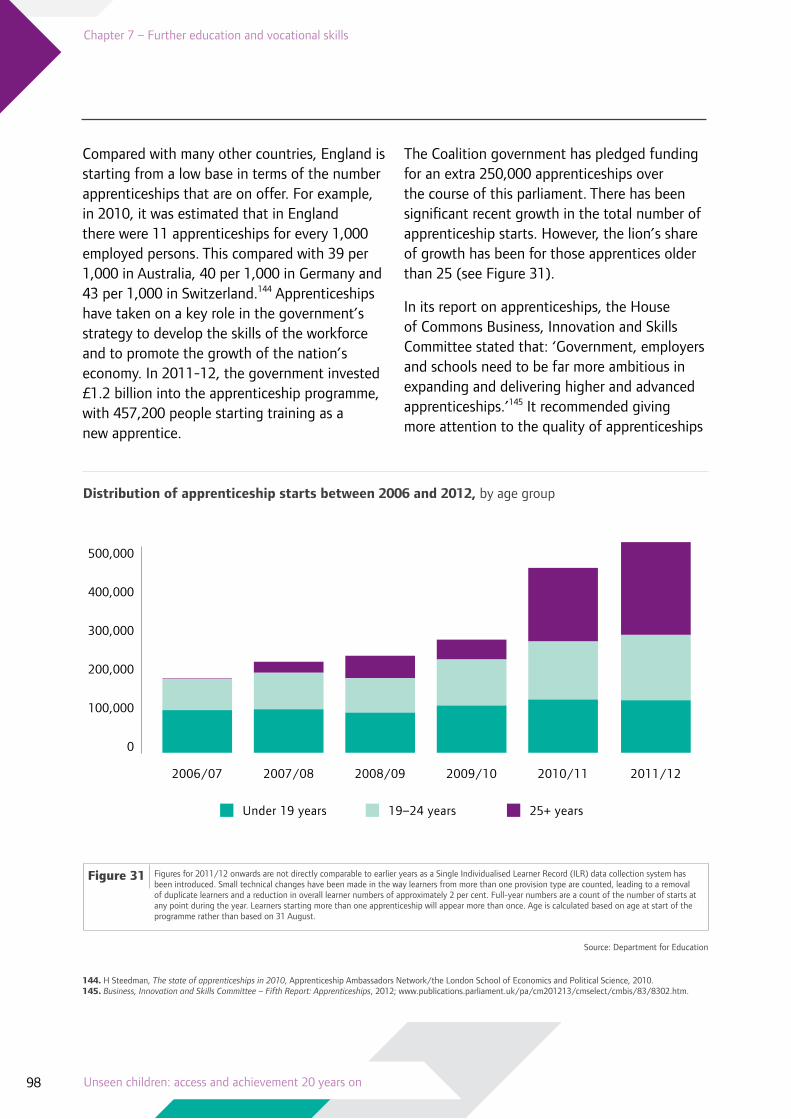
144. H Steedman, The state of apprenticeships in 2010, Apprenticeship Ambassadors Network/the London School of Economics and Political Science, 2010. 145. Business, Innovation and Skills Committee – Fifth Report: Apprenticeships, 2012; www.publications.parliament.uk/pa/cm201213/cmselect/cmbis/83/8302.htm.
Distribution of apprenticeship starts between 2006 and 2012, by age group
Under 19 years 19–24 years 25+ years
2006/07 2007/08 2008/09 2009/10 2010/11 2011/12
0
200,000
400,000
100,000
300,000
500,000
Compared with many other countries, England is starting from a low base in terms of the number apprenticeships that are on offer. For example, in 2010, it was estimated that in England there were 11 apprenticeships for every 1,000 employed persons. This compared with 39 per 1,000 in Australia, 40 per 1,000 in Germany and 43 per 1,000 in Switzerland.144 Apprenticeships have taken on a key role in the government’s strategy to develop the skills of the workforce and to promote the growth of the nation’s economy. In 2011-12, the government invested £1.2 billion into the apprenticeship programme, with 457,200 people starting training as a new apprentice.
The Coalition government has pledged funding for an extra 250,000 apprenticeships over the course of this parliament. There has been significant recent growth in the total number of apprenticeship starts. However, the lion’s share of growth has been for those apprentices older than 25 (see Figure 31).
In its report on apprenticeships, the House of Commons Business, Innovation and Skills Committee stated that: ‘Government, employers and schools need to be far more ambitious in expanding and delivering higher and advanced apprenticeships.’145 It recommended giving more attention to the quality of apprenticeships
Figures for 2011/12 onwards are not directly comparable to earlier years as a Single Individualised Learner Record (ILR) data collection system has been introduced. Small technical changes have been made in the way learners from more than one provision type are counted, leading to a removal of duplicate learners and a reduction in overall learner numbers of approximately 2 per cent. Full-year numbers are a count of the number of starts at any point during the year. Learners starting more than one apprenticeship will appear more than once. Age is calculated based on age at start of the programme rather than based on 31 August.
Figure 31
Source: Department for Education
98 Unseen children: access and achievement 20 years on
Chapter 7 – Further education and vocational skills

and not setting objectives weighed too heavily on numbers.
In 2012, Ofsted published two reports focused on apprenticeships. The first, a good practice study, Apprenticeships for young people,146 identified a number of common factors that have led to high performance in the work of 15 providers who are extensively involved in delivering apprenticeships to young people. The second, a survey report, Ensuring quality in apprenticeships,147 investigated the quality of apprenticeship programmes, with a particular focus on subcontracting arrangements.148
Among its key findings, it noted that:
‘Too many apprentices interviewed in the survey did not have real and sustained employment. This applied to a quarter of the apprentices that were interviewed. Just over a third of the 500 apprentices responding to an online survey did not consider themselves to be holding a permanent job during their apprenticeships. Some of the apprenticeship training encountered was too short to embed the skills being developed by apprentices. This was encountered most frequently in provision in IT, retail, leisure, customer service and business administration.’
Total government funded apprenticeship starts and achievements, by apprentice level as at 31 December 2012
Intermediate level apprenticeships (level 2) Advanced level apprenticeships (level 3)
0
200,000
400,000
100,000
300,000
500,000
2006/07 2007/08 2008/09 2009/10 2010/11 2011/12
146. Apprenticeships for young people (110177), Ofsted, 2012; www.ofsted.gov.uk/resources/apprenticeships-for-young-people. 147. Ensuring quality in apprenticeships (120153), Ofsted, 2012; www.ofsted.gov.uk/resources/ensuring-quality-apprenticeships. 148. Ofsted conducted survey visits in May 2012 to 17 subcontractor providers. During these visits, 110 apprentices and 40 employers were interviewed and at least one lead contractor was interviewed on each occasion. In addition, an online survey of just over 500 apprentices was carried out to give an overview of learners’ views on their experience of apprenticeships.
Figures for 2011/12 onwards are not directly comparable to earlier years as a Single Individualised Learner Record (ILR) data collection system has been introduced. Small technical changes have been made in the way learners from more than one provision type are counted, leading to a removal of duplicate learners and a reduction in overall learner numbers of approximately 2 per cent. Full-year numbers are a count of the number of starts at any point during the year. Learners starting more than one apprenticeship will appear more than once.
Figure 32
Source: Department for Education
www.ofsted.gov.uk 99
Chapter 7 – Further education and vocational skills

The data support these inspection findings. Most English apprenticeships are still at level 2 and many are short programmes of a year or less. These courses are too short and do not reliably lead to real employment (see Figure 32).
In his review, Doug Richard set out 10 recommendations for the future of apprenticeships in England.149 These include ensuring that apprenticeships: are targeted at those that are new to the job or require substantial training; are rooted in recognised industry standards; are designed, tested and validated by industry; and require apprentices to achieve level 2 in English and mathematics.Richard stresses that his 10 recommendations must be taken collectively: ‘they are interlinked and the system will only make sense and be deliverable if all the elements are adopted as a whole.’
In Rigour and responsiveness, the government has accepted many of the key elements of the Richard proposals:
‘Apprenticeships should be designed for those at the start of a new job role or occupation, and to support people to train for jobs at a higher skilled level. If an employee is already competently performing a role, then it will not be the appropriate route. An Apprenticeship will not be the right choice for every individual or job role. An Apprenticeship job will by its nature require substantial training over an extended period to master the skills involved.’
The government has also recently announced a new programme of ‘Traineeships’ for young people. These will initially be for young people
ages 16–19 (and up to 25 for those with learning disabilities), and are designed as a bridge to a full apprenticeship or employment. The duration of the programmes will be six weeks to five months, and the content will be focused on English and mathematics plus employability skills.
All kinds of providers will be able to deliver traineeships if they can meet the content requirements. Crucially, they will include a work placement and a guaranteed interview with an employer at the end of the programme. Traineeships therefore represent a form of transitional provision, which is a key feature of the German system of vocational training. If they are delivered to a good standard, they should increase the number of young people whom employers are willing to take on as apprentices.
One of the Richard review recommendations was to route apprenticeship funding directly through the employers. Under this model, the employer would receive the money and buy any necessary ‘off site’ provision. Some large employers with extensive existing provision already operate on very similar lines to this. The intention behind this recommendation is to incentivise providers to create more good quality places where they have more control over the content of the training and its suitability to their business. This is an important issue given the relatively low level of overall apprenticeship provision in England.
Greater employer leadership and demand for apprentices will be a major driver of growth, because without a job there is no true apprenticeship.
149. D Richard, The Richard review of Apprenticeships, Department for Business, Innovation and Skills, 2012; www.gov.uk/government/publications/the-richard-review-of-apprenticeships.
100 Unseen children: access and achievement 20 years on
Chapter 7 – Further education and vocational skills

www.ofsted.gov.uk 101
Chapter 7 – Further education and vocational skills
www.ofsted.gov.uk 101
Chapter 7 - Further education and vocational skills

102 Unseen children: access and achievement 20 years on
Members of the Expert Panel
102 Unseen children: access and achievement 20 years on

Members of the Expert Panel
Dame Yasmin Bevan, Executive Principal and Headteacher, Challney
High School for Boys and Denbigh High School, Luton
Dr Kevan Collins, Chief Executive, Education Endowment Foundation
Dr Hilary Emery, Chief Executive, National Children’s Bureau
Professor Chris Husbands, Director, Institute of Education, University of London
Debbie Jones, Immediate Past President, Association of Directors of Children’s
Services; and Executive Director, Children and Young People’s Services, Lambeth
Sir Daniel Moynihan, Chief Executive Officer, Harris Federation
Carol Norman, Headteacher, Welbeck Primary School, Nottingham and
National Leader of Education
Mike Raleigh, Education Adviser
Dame Ruth Silver, Chair, Learning and Skills Improvement Service; former chair,
Working Men’s College Governing Board; and Principal, Lewisham College
Professor Robert Slavin, Professor, Institute for Effective Education, University of York;
and Director, Center for Research and Reform in Education, Johns Hopkins University
Professor David Woods CBE, Former Chief Adviser, London Schools and The London
Challenge; and Principal National Challenge Adviser for England
www.ofsted.gov.uk 103
Members of the Expert Panel

Acknowledgements
The Rt Hon. the Lord Adonis, Chair, Institute for Public Policy Research; and
Non-executive Director, Edge Foundation
Mel Ainscow CBE, Co-Director Centre for Equity in Education, University of Manchester
The Rt Hon. the Lord Baker of Dorking CH, Chairman and Trustee, Baker-Dearing
Educational Trust; and Chairman and Trustee, The Edge Foundation
Nick Batchelar, Service Director, Education, Bristol City Council
Rhian Beynon, Head of Policy and Campaigns, Family Action
Professor Sonia Blandford, National Director, Achievement for All; and
Professor, Educational Leadership and Innovation, University of Warwick
Andrew Bunyan, Strategic Director, Children’s and Young People’s Services, Derby City Council
Neil Carberry, Director for employment and skills, Confederation of British Industry
Robin Crofts, Assistant Director, School Improvement, Standards and Inclusion,
Slough Borough Council
Lorraine Dearden, Research Fellow, Education, Employment and Evaluation Sector,
Institute for Fiscal Studies (IFS); and Professor of Economics and Social Statistics, Institute of Education, University London (IOE)
Emma Drew, Headteacher, Fair Furlong Primary School, Bristol
Matt Dunkley, Director of Children’s Services, East Sussex County Council
Alan Dyson, Professor of Education and Co-director of the Centre for Equity in
Education, University of Manchester
Helen Ellis, Head of Corporate Responsibility and Community Relations, Prudential
Alison Fletcher, Head of Department of Education, University of the West of England
Claire Foreman, Deputy Principal, Runshaw College
Harvey Goldstein, Professor of Social Statistics, Centre for Multilevel Modelling,
University of Bristol
Stephen Gorard, Professor of Education and Well-being, Durham University
Toby Greany, Acting Executive Director, Policy, National College for School Leadership
Ofsted would like to thank the following people for their contribution to the Access and achievement review
104 Unseen children: access and achievement 20 years on
Acknowledgements
Julian Grenier, Headteacher, Sheringham Nursery School, Newham
Peter Gronn, Professor and Head of Faculty of Education, University of Cambridge
Professor John Howson, Managing Director, Data for Education
Andrew Jordan, Headteacher, Dyke House Sports and Technology College, Hartlepool
Dame Reena Keeble DBE, EdD, Headteacher, Cannon Lane First School, Harrow
Frank McLoughlin CBE, Principal, City and Islington College
Heath Monk, Chief Executive, The Future Leaders Trust
Dr Patricia Mucavele, Research and Nutrition Senior Manager, Children’s Food Trust
Dr Michael Nelson, Director of Research and Nutrition, Children’s Food Trust
Christine Owen OBE M.Ed, Headteacher, Bartley Green School, Birmingham
Gillian Palmer, Director of Children’s Services, Royal Borough of Greenwich
Sally Power, Professor of Education, School of Social Sciences, Cardiff University
Julia Pye, Associate Director, Social Research Institute, Ipsos MORI
Fiona Rawes MBE, Director of Education Campaigns, Business in the Community
Sue Rossiter, Chief Executive, National Foundation for Educational Research
Pamela Sammons, Professor of Education, Department of Education, University of Oxford
Graham Schuhmacher, Head of Development Services, Rolls-Royce plc
Caroline Sharp, Research Director, National Foundation for Educational Research
Richard Skog, Operations Officer, Adult Children and Family Services Directorate,
Hull City Council
Paul Smith, Principal, Parbold Douglas CoE Academy, Wigan
Dr Hilary Steedman, Centre for Economic Performance, London School of Economics
Kathy Sylva, Professor of Educational Psychology, University of Oxford
Charlie Taylor, Chief Executive, National College for Teaching and Leadership
James Toop, Chief Executive, Teaching Leaders
Kay Truscott-Howell, Programme Director, Billericay Educational Consortium
Chris Wellings, UK Head of Policy, Save the Children
Anne West, Professor of Education Policy, Department of Social Policy,
London School of Economics
James Westhead, Director, External Relations, Teach First
www.ofsted.gov.uk 105
Acknowledgements
www.ofsted.gov.uk 105

106 Unseen children: access and achievement 20 years on
Background papers
106 Unseen children: access and achievement 20 years on

Background papers150
T Allen, Drivers and barriers to raising achievement: A focus on school and classroom level influences.
S Gibbons and S McNally, The effects of resources across school phases: a summary of recent evidence.
M Hutchings and A Mansaray, A review of the impact of the London Challenge (2003–8) and the City Challenge (2008–11).
R Lupton, P Noden, A Brady and A West, School organisation and the educational achievement of children in poverty in England.
D Mongon, Educational attainment: White British students from low income backgrounds.
National Foundation for Educational Research (2013) Wilshaw submission: NFER evidence on access and achievement and educational success in deprived communities.
C Pascal and A Bertram, The impact of early education as a strategy for counteracting socio economic disadvantage.
L Tikly, Recruiting and retaining good quality teachers in disadvantaged schools: a review of the UK and international evidence.
150. Background papers prepared for Ofsted’s Access and achievement 2013 review; www.ofsted.gov.uk/accessandachievement.
www.ofsted.gov.uk 107
Background papers

Schools visited for the good practice survey
School Phase Local Authority
Cardinal Hume Catholic School Secondary Gateshead
Chorley All Saints Church of England Primary School and Nursery Unit
Primary Lancashire
Cockington Community Primary School Primary Torbay
Fair Furlong Primary School Primary City of Bristol
Hartsholme Academy Primary Lincolnshire
Hempstalls Primary School Primary Staffordshire
Lingham Primary School Primary Wirral
Millfield Science and Performing Arts College Secondary Lancashire
Morice Town Primary School Primary Plymouth
Prenton High School for Girls Secondary Wirral
Shire Oak Academy Secondary Walsall
Sirius Academy Secondary Hull
Southfields Primary School Primary Peterborough
St Leo’s and Southmead Catholic Primary School Serving the Community
Primary Knowsley
St Mary’s and St Thomas’ CofE Primary School Primary St Helens
Weatherhead High School Secondary Wirral
Bartley Green School151 Secondary Birmingham
151. Telephone interview only.
108 Unseen children: access and achievement 20 years on
Schools visited for the good practice survey

Produced by Guardian Digital Agency
Photos: front cover, pages 10 and 12 copyright www.alamy.com; all others copyright Ofsted
Printed by Dayfold Ltd Black Moor Road Verwood Dorset BH31 6BE
www.dayfold.com
Printed on recycled paper

The Office for Standards in Education, Children’s Services and Skills (Ofsted) regulates and inspects to achieve excellence in the care of children and young people, and in education and skills for learners of all ages. It regulates and inspects childcare and children’s social care, and inspects the Children and Family Court Advisory and Support Service (Cafcass), schools, colleges, initial teacher training, work-based learning and skills training, adult and community learning, and education and training in prisons and other secure establishments. It assesses council children’s services, and inspects services for looked after children, safeguarding and child protection.
If you would like a copy of this document in a different format, such as large print or Braille, please telephone 0300 123 1231, or email [email protected]
You may reuse this information (not including logos) free of charge in any format or medium, under the terms of the Open Government Licence. To view this licence, visit www.nationalarchives.gov.uk/doc/open-government-licence/Write to the Information Policy Team, The National Archives, Kew, London TW9 4DU, or email: [email protected]
This publication is available at www.ofsted.gov.uk/resources/130155
Interested in our work? You can subscribe to our website for news, information and updates at www.ofsted.gov.uk/user
Piccadilly Gate, Store Street, Manchester, M1 2WD
T: 0300 123 1231 Textphone: 0161 618 8524 E: [email protected] W: www.ofsted.gov.uk
No. 130155
© Crown copyright 2013