unmet needs report 2018 - kopernik€¦ · unmet needs report 2018 smallholder farmers in papua,...
TRANSCRIPT
UNMET NEEDSREPORT 2018SMALLHOLDER FARMERS
IN PAPUA, WEST PAPUA
& WEST KALIMANTAN
UNMET NEEDS REPORT 2018SMALLHOLDER FARMERS IN PAPUA, WEST PAPUA & WEST KALIMANTAN
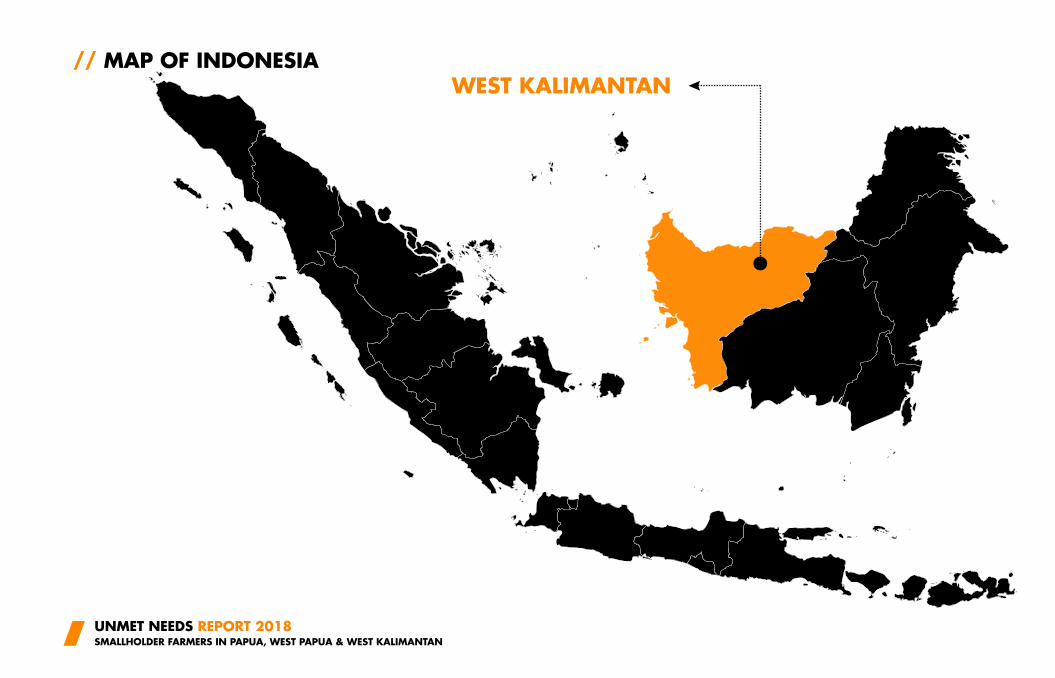
// MAP OF INDONESIA
WEST KALIMANTAN
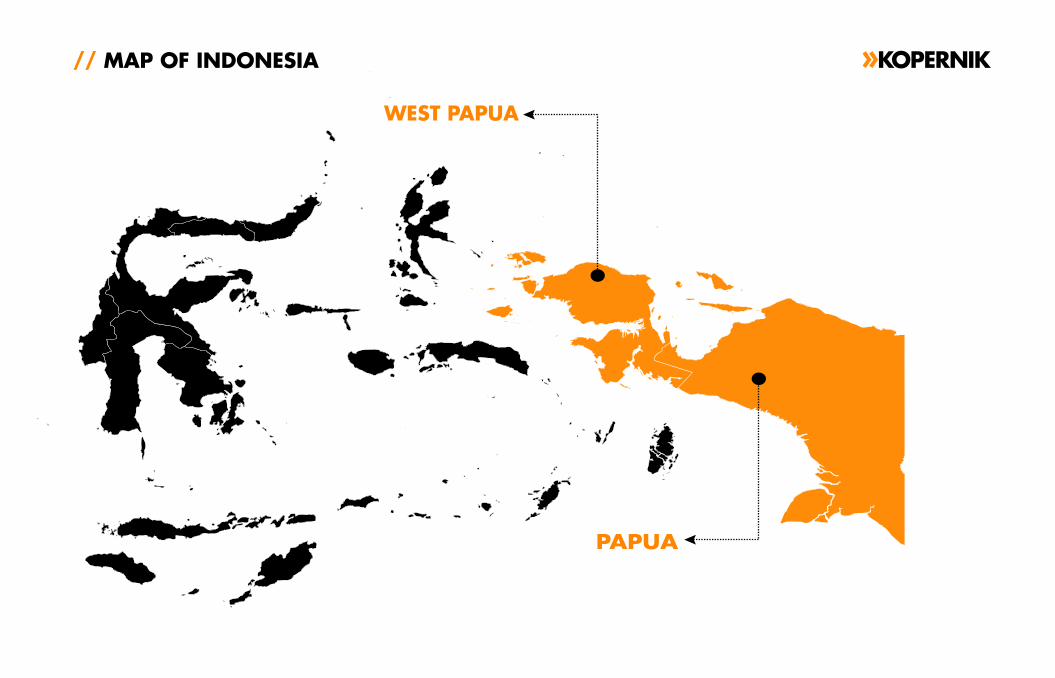
// MAP OF INDONESIA
PAPUA
WEST PAPUA
// TABLE OF CONTENTSABOUT THE REPORT
EXECUTIVE SUMMARY
PAPUA
WEST PAPUA
WEST KALIMANTAN
METHODOLOGY
BIBLIOGRAPHY
ABOUT KOPERNIK
04
05
23
51
79
115
121
126
UNMET NEEDS REPORT 2018SMALLHOLDER FARMERS IN PAPUA, WEST PAPUA & WEST KALIMANTAN
// ABOUT THE REPORT
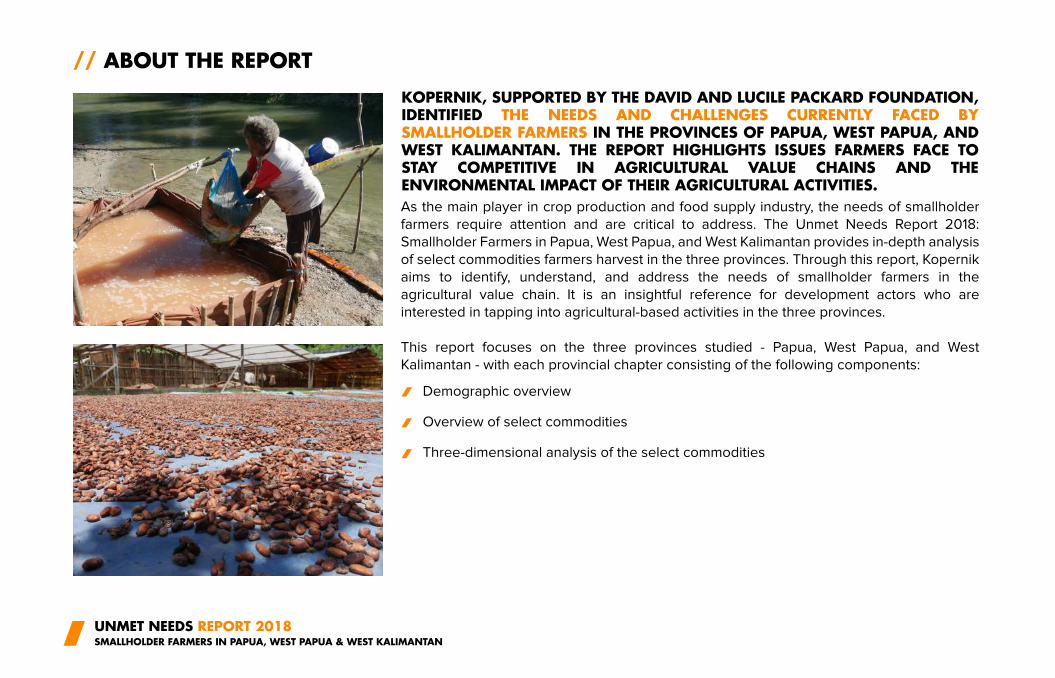
KOPERNIK, SUPPORTED BY THE DAVID AND LUCILE PACKARD FOUNDATION, IDENTIFIED THE NEEDS AND CHALLENGES CURRENTLY FACED BY SMALLHOLDER FARMERS IN THE PROVINCES OF PAPUA, WEST PAPUA, AND WEST KALIMANTAN. THE REPORT HIGHLIGHTS ISSUES FARMERS FACE TO STAY COMPETITIVE IN AGRICULTURAL VALUE CHAINS AND THE ENVIRONMENTAL IMPACT OF THEIR AGRICULTURAL ACTIVITIES.
As the main player in crop production and food supply industry, the needs of smallholder
farmers require attention and are critical to address. The Unmet Needs Report 2018:
Smallholder Farmers in Papua, West Papua, and West Kalimantan provides in-depth analysis
of select commodities farmers harvest in the three provinces. Through this report, Kopernik
aims to identify, understand, and address the needs of smallholder farmers in the
agricultural value chain. It is an insightful reference for development actors who are
interested in tapping into agricultural-based activities in the three provinces.
This report focuses on the three provinces studied - Papua, West Papua, and West
Kalimantan - with each provincial chapter consisting of the following components:
Demographic overview
Overview of select commodities
Three-dimensional analysis of the select commodities
05
// EXECUTIVE SUMMARY
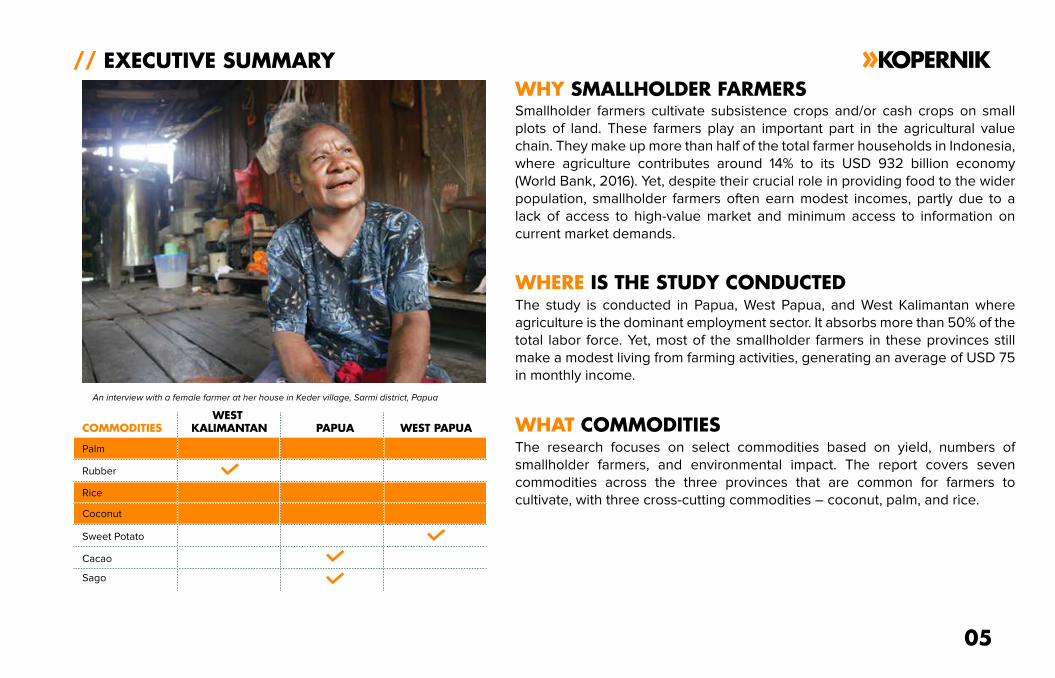
The study is conducted in Papua, West Papua, and West Kalimantan where
agriculture is the dominant employment sector. It absorbs more than 50% of the
total labor force. Yet, most of the smallholder farmers in these provinces still
make a modest living from farming activities, generating an average of USD 75
in monthly income.
WHERE IS THE STUDY CONDUCTED
COMMODITIES
WEST
KALIMANTAN PAPUA WEST PAPUA
WHY SMALLHOLDER FARMERS
WHAT COMMODITIESThe research focuses on select commodities based on yield, numbers of
smallholder farmers, and environmental impact. The report covers seven
commodities across the three provinces that are common for farmers to
cultivate, with three cross-cutting commodities – coconut, palm, and rice.
Smallholder farmers cultivate subsistence crops and/or cash crops on small
plots of land. These farmers play an important part in the agricultural value
chain. They make up more than half of the total farmer households in Indonesia,
where agriculture contributes around 14% to its USD 932 billion economy
(World Bank, 2016). Yet, despite their crucial role in providing food to the wider
population, smallholder farmers often earn modest incomes, partly due to a
lack of access to high-value market and minimum access to information on
current market demands.
An interview with a female farmer at her house in Keder village, Sarmi district, Papua
Palm
Rubber
Rice
Coconut
Sweet Potato
Cacao
Sago
UNMET NEEDS REPORT 2018SMALLHOLDER FARMERS IN PAPUA, WEST PAPUA & WEST KALIMANTAN
// EXECUTIVE SUMMARY
TYPE
A
B
C
D
E
F
DESCRIPTION
HOW FARMERS VALUE THEIR OWN COMMODITIES
FARMING
GATHERING
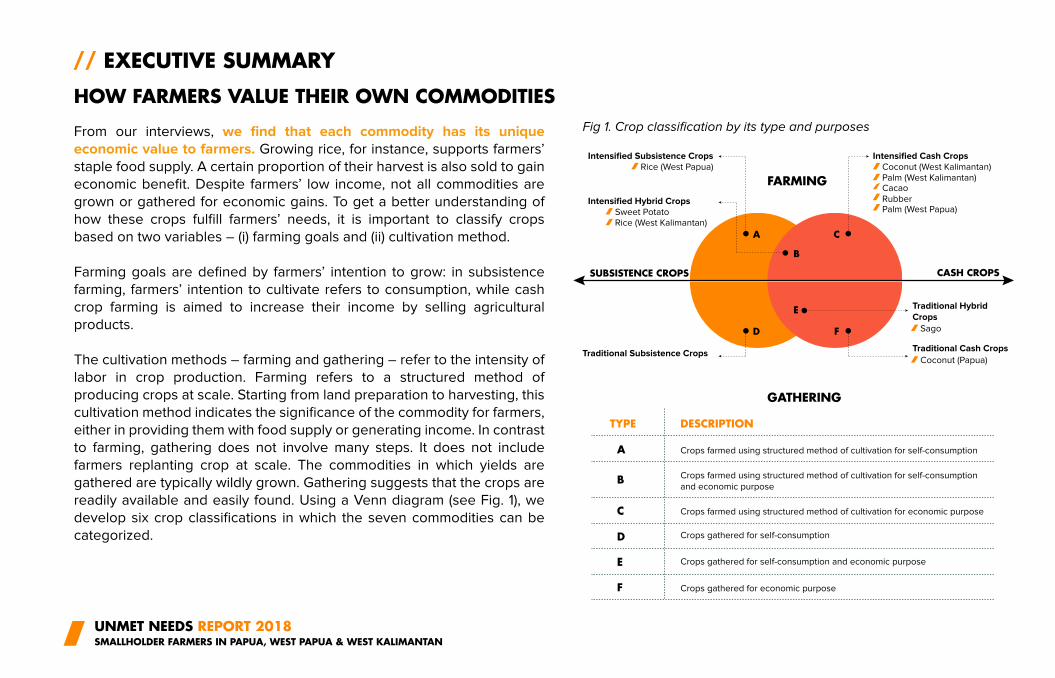
From our interviews, we find that each commodity has its unique
economic value to farmers. Growing rice, for instance, supports farmers’
staple food supply. A certain proportion of their harvest is also sold to gain
economic benefit. Despite farmers’ low income, not all commodities are
grown or gathered for economic gains. To get a better understanding of
how these crops fulfill farmers’ needs, it is important to classify crops
based on two variables – (i) farming goals and (ii) cultivation method.
Farming goals are defined by farmers’ intention to grow: in subsistence
farming, farmers’ intention to cultivate refers to consumption, while cash
crop farming is aimed to increase their income by selling agricultural
products.
The cultivation methods – farming and gathering – refer to the intensity of
labor in crop production. Farming refers to a structured method of
producing crops at scale. Starting from land preparation to harvesting, this
cultivation method indicates the significance of the commodity for farmers,
either in providing them with food supply or generating income. In contrast
to farming, gathering does not involve many steps. It does not include
farmers replanting crop at scale. The commodities in which yields are
gathered are typically wildly grown. Gathering suggests that the crops are
readily available and easily found. Using a Venn diagram (see Fig. 1), we
develop six crop classifications in which the seven commodities can be
categorized.
Fig 1. Crop classification by its type and purposes
Intensified Subsistence Crops Intensified Cash Crops
Traditional Hybrid
Crops
Traditional Cash Crops
SUBSISTENCE CROPS CASH CROPS
Traditional Subsistence Crops
Rice (West Papua)
A
D
B
E
C
F
Coconut (West Kalimantan)
Coconut (Papua)
Sago
Palm (West Kalimantan)CacaoRubberPalm (West Papua)
Intensified Hybrid CropsSweet PotatoRice (West Kalimantan)
Crops farmed using structured method of cultivation for self-consumption
Crops farmed using structured method of cultivation for economic purpose
Crops gathered for self-consumption
Crops gathered for self-consumption and economic purpose
Crops gathered for economic purpose
Crops farmed using structured method of cultivation for self-consumption
and economic purpose
07
// EXECUTIVE SUMMARY
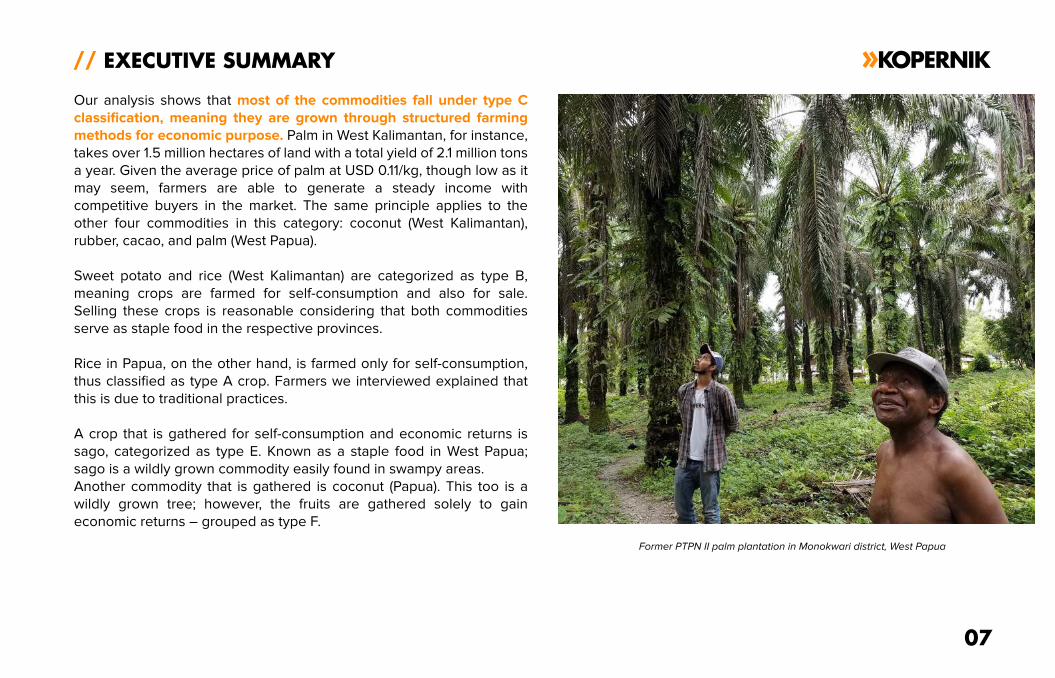
Former PTPN II palm plantation in Monokwari district, West Papua
Our analysis shows that most of the commodities fall under type C
classification, meaning they are grown through structured farming
methods for economic purpose. Palm in West Kalimantan, for instance,
takes over 1.5 million hectares of land with a total yield of 2.1 million tons
a year. Given the average price of palm at USD 0.11/kg, though low as it
may seem, farmers are able to generate a steady income with
competitive buyers in the market. The same principle applies to the
other four commodities in this category: coconut (West Kalimantan),
rubber, cacao, and palm (West Papua).
Sweet potato and rice (West Kalimantan) are categorized as type B,
meaning crops are farmed for self-consumption and also for sale.
Selling these crops is reasonable considering that both commodities
serve as staple food in the respective provinces.
Rice in Papua, on the other hand, is farmed only for self-consumption,
thus classified as type A crop. Farmers we interviewed explained that
this is due to traditional practices.
A crop that is gathered for self-consumption and economic returns is
sago, categorized as type E. Known as a staple food in West Papua;
sago is a wildly grown commodity easily found in swampy areas.
Another commodity that is gathered is coconut (Papua). This too is a
wildly grown tree; however, the fruits are gathered solely to gain
economic returns – grouped as type F.
UNMET NEEDS REPORT 2018SMALLHOLDER FARMERS IN PAPUA, WEST PAPUA & WEST KALIMANTAN
// EXECUTIVE SUMMARY
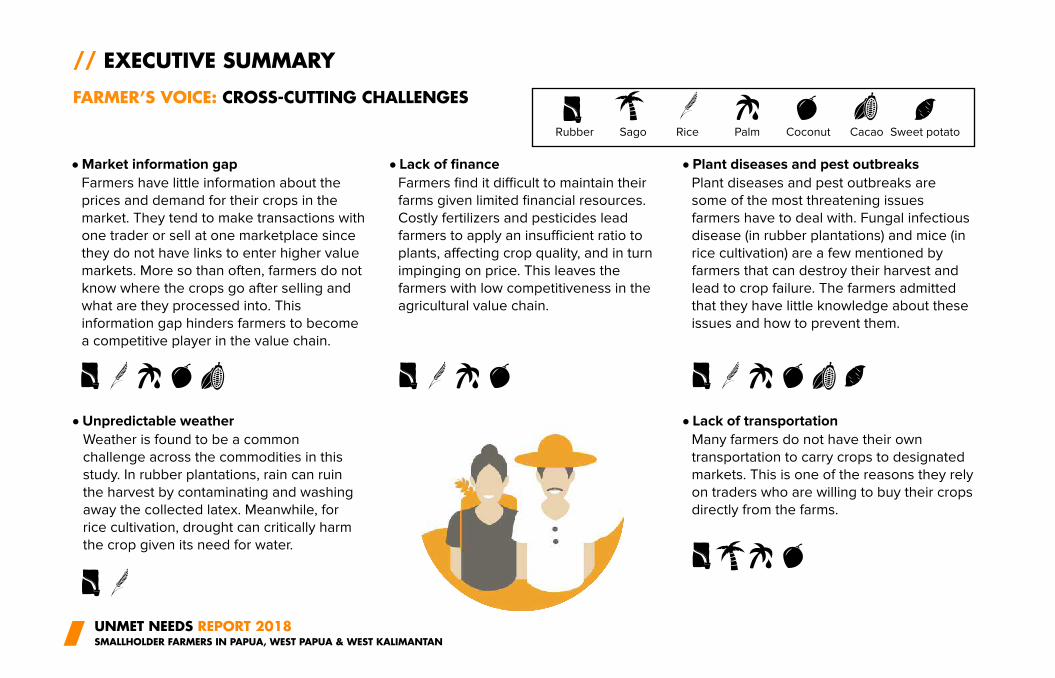
FARMER’S VOICE: CROSS-CUTTING CHALLENGES
Market information gap
Unpredictable weather
Farmers have little information about the
prices and demand for their crops in the
market. They tend to make transactions with
one trader or sell at one marketplace since
they do not have links to enter higher value
markets. More so than often, farmers do not
know where the crops go after selling and
what are they processed into. This
information gap hinders farmers to become
a competitive player in the value chain.
Lack of finance
Farmers find it difficult to maintain their
farms given limited financial resources.
Costly fertilizers and pesticides lead
farmers to apply an insufficient ratio to
plants, affecting crop quality, and in turn
impinging on price. This leaves the
farmers with low competitiveness in the
agricultural value chain.
Plant diseases and pest outbreaks
Lack of transportation
Weather is found to be a common
challenge across the commodities in this
study. In rubber plantations, rain can ruin
the harvest by contaminating and washing
away the collected latex. Meanwhile, for
rice cultivation, drought can critically harm
the crop given its need for water.
Plant diseases and pest outbreaks are
some of the most threatening issues
farmers have to deal with. Fungal infectious
disease (in rubber plantations) and mice (in
rice cultivation) are a few mentioned by
farmers that can destroy their harvest and
lead to crop failure. The farmers admitted
that they have little knowledge about these
issues and how to prevent them.
Many farmers do not have their own
transportation to carry crops to designated
markets. This is one of the reasons they rely
on traders who are willing to buy their crops
directly from the farms.
Rubber Sago Rice Palm Coconut Cacao Sweet potato
09
// EXECUTIVE SUMMARY
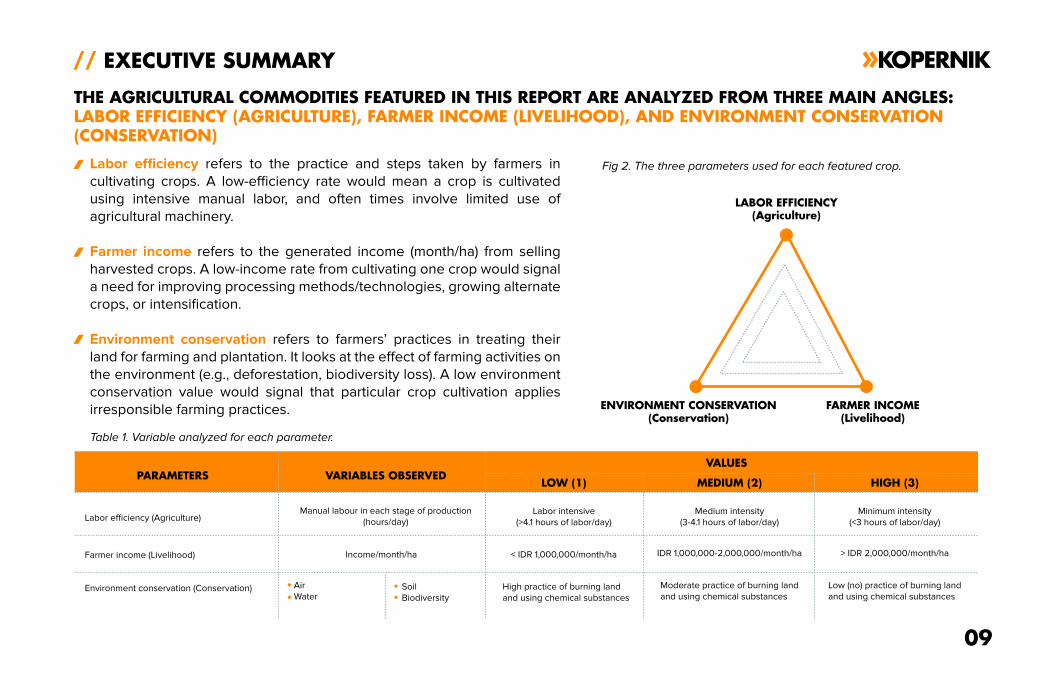
THE AGRICULTURAL COMMODITIES FEATURED IN THIS REPORT ARE ANALYZED FROM THREE MAIN ANGLES: LABOR EFFICIENCY (AGRICULTURE), FARMER INCOME (LIVELIHOOD), AND ENVIRONMENT CONSERVATION(CONSERVATION)
Labor efficiency refers to the practice and steps taken by farmers in
cultivating crops. A low-efficiency rate would mean a crop is cultivated
using intensive manual labor, and often times involve limited use of
agricultural machinery.
Farmer income refers to the generated income (month/ha) from selling
harvested crops. A low-income rate from cultivating one crop would signal
a need for improving processing methods/technologies, growing alternate
crops, or intensification.
Environment conservation refers to farmers’ practices in treating their
land for farming and plantation. It looks at the effect of farming activities on
the environment (e.g., deforestation, biodiversity loss). A low environment
conservation value would signal that particular crop cultivation applies
irresponsible farming practices.
Table 1. Variable analyzed for each parameter.
Fig 2. The three parameters used for each featured crop.
Labor efficiency (Agriculture)
High practice of burning land
and using chemical substances
Moderate practice of burning land
and using chemical substances
Low (no) practice of burning land
and using chemical substances
Farmer income (Livelihood)
Air
WaterSoil
BiodiversityEnvironment conservation (Conservation)
LABOR EFFICIENCY(Agriculture)
ENVIRONMENT CONSERVATION(Conservation)
FARMER INCOME(Livelihood)
PARAMETERS VARIABLES OBSERVEDVALUES
LOW (1) MEDIUM (2) HIGH (3)
Manual labour in each stage of production
(hours/day)
Income/month/ha
Labor intensive
(>4.1 hours of labor/day)
< IDR 1,000,000/month/ha
Medium intensity
(3-4.1 hours of labor/day)
Minimum intensity
(<3 hours of labor/day)
IDR 1,000,000-2,000,000/month/ha > IDR 2,000,000/month/ha
UNMET NEEDS REPORT 2018SMALLHOLDER FARMERS IN PAPUA, WEST PAPUA & WEST KALIMANTAN
// EXECUTIVE SUMMARY
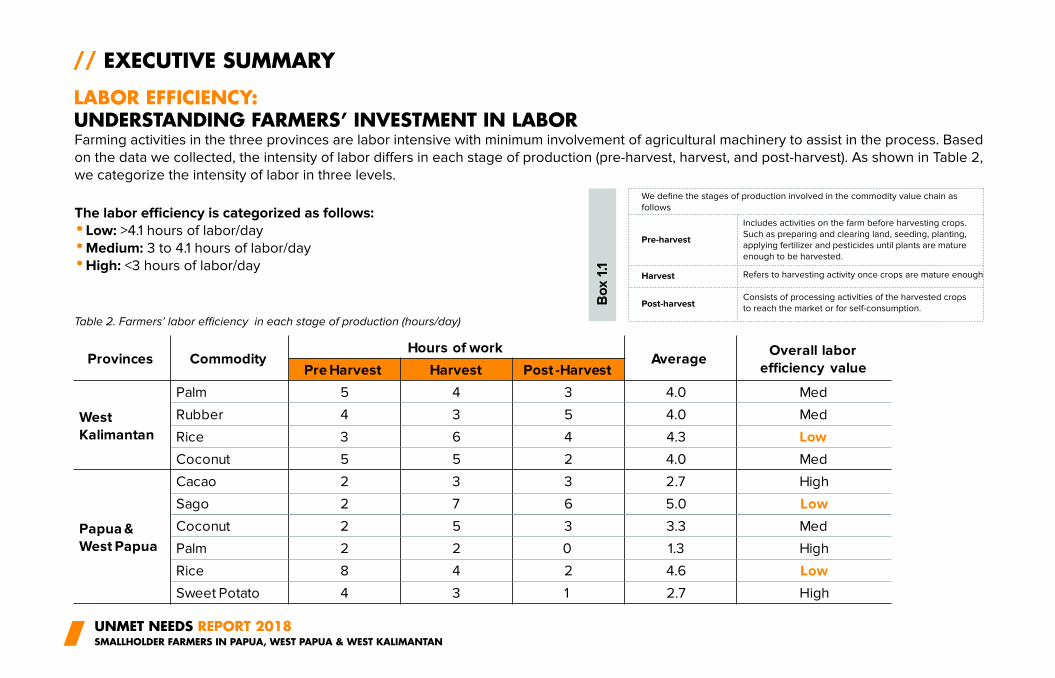
LABOR EFFICIENCY: UNDERSTANDING FARMERS’ INVESTMENT IN LABOR
Table 2. Farmers’ labor efficiency in each stage of production (hours/day)
Farming activities in the three provinces are labor intensive with minimum involvement of agricultural machinery to assist in the process. Based
on the data we collected, the intensity of labor differs in each stage of production (pre-harvest, harvest, and post-harvest). As shown in Table 2,
we categorize the intensity of labor in three levels.
The labor efficiency is categorized as follows:
Low: >4.1 hours of labor/day
Medium: 3 to 4.1 hours of labor/day
High: <3 hours of labor/day
Provinces CommodityHours of work
AverageOverall labor
efficiency valuePre Harvest Harvest Post -Harvest
West
Kalimantan
Palm 5 4 3 4.0 Med
Rubber 4 3 5 4.0 Med
Rice 3 6 4 4.3 Low
Coconut 5 5 2 4.0 Med
Papua &
West Papua
Cacao 2 3 3 2.7 High
Sago 2 7 6 5.0 Low
Coconut 2 5 3 3.3 Med
Palm 2 2 0 1.3 High
Rice 8 4 2 4.6 Low
Sweet Potato 4 3 1 2.7 HighB
ox 1
.1
Pre-harvest
We define the stages of production involved in the commodity value chain as
follows
Harvest
Post-harvest
Includes activities on the farm before harvesting crops.
Such as preparing and clearing land, seeding, planting,
applying fertilizer and pesticides until plants are mature
enough to be harvested.
Refers to harvesting activity once crops are mature enough
Consists of processing activities of the harvested crops
to reach the market or for self-consumption.
11
// EXECUTIVE SUMMARY
LABOR EFFICIENCY:
UNDERSTANDING FARMERS’ INVESTMENT IN LABOR
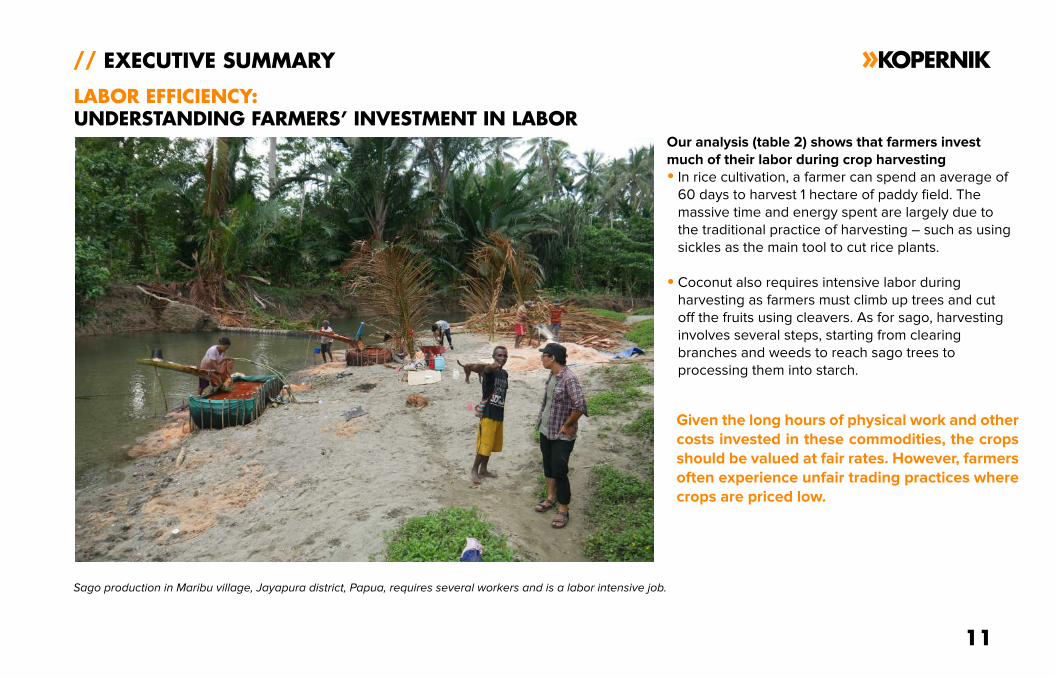
Sago production in Maribu village, Jayapura district, Papua, requires several workers and is a labor intensive job.
Our analysis (table 2) shows that farmers invest
much of their labor during crop harvesting
In rice cultivation, a farmer can spend an average of
60 days to harvest 1 hectare of paddy field. The
massive time and energy spent are largely due to
the traditional practice of harvesting – such as using
sickles as the main tool to cut rice plants.
Coconut also requires intensive labor during
harvesting as farmers must climb up trees and cut
off the fruits using cleavers. As for sago, harvesting
involves several steps, starting from clearing
branches and weeds to reach sago trees to
processing them into starch.
Given the long hours of physical work and other
costs invested in these commodities, the crops
should be valued at fair rates. However, farmers
often experience unfair trading practices where
crops are priced low.
UNMET NEEDS REPORT 2018SMALLHOLDER FARMERS IN PAPUA, WEST PAPUA & WEST KALIMANTAN
// EXECUTIVE SUMMARY
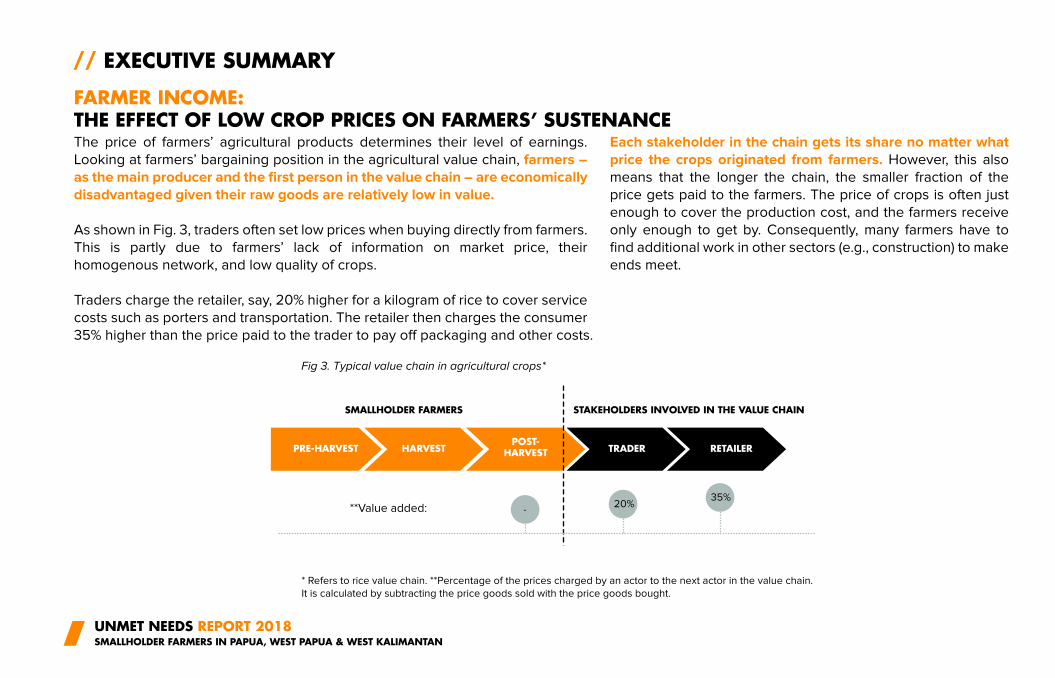
Fig 3. Typical value chain in agricultural crops*
**Value added: 20%-
35%
SMALLHOLDER FARMERS STAKEHOLDERS INVOLVED IN THE VALUE CHAIN
The price of farmers’ agricultural products determines their level of earnings.
Looking at farmers’ bargaining position in the agricultural value chain, farmers –
as the main producer and the first person in the value chain – are economically
disadvantaged given their raw goods are relatively low in value.
As shown in Fig. 3, traders often set low prices when buying directly from farmers.
This is partly due to farmers’ lack of information on market price, their
homogenous network, and low quality of crops.
Traders charge the retailer, say, 20% higher for a kilogram of rice to cover service
costs such as porters and transportation. The retailer then charges the consumer
35% higher than the price paid to the trader to pay off packaging and other costs.
* Refers to rice value chain. **Percentage of the prices charged by an actor to the next actor in the value chain.
It is calculated by subtracting the price goods sold with the price goods bought.
Each stakeholder in the chain gets its share no matter what
price the crops originated from farmers. However, this also
means that the longer the chain, the smaller fraction of the
price gets paid to the farmers. The price of crops is often just
enough to cover the production cost, and the farmers receive
only enough to get by. Consequently, many farmers have to
find additional work in other sectors (e.g., construction) to make
ends meet.
FARMER INCOME:THE EFFECT OF LOW CROP PRICES ON FARMERS’ SUSTENANCE
PRE-HARVEST HARVEST TRADER CONSUMERPOST-
HARVEST RETAILER
13
// EXECUTIVE SUMMARY
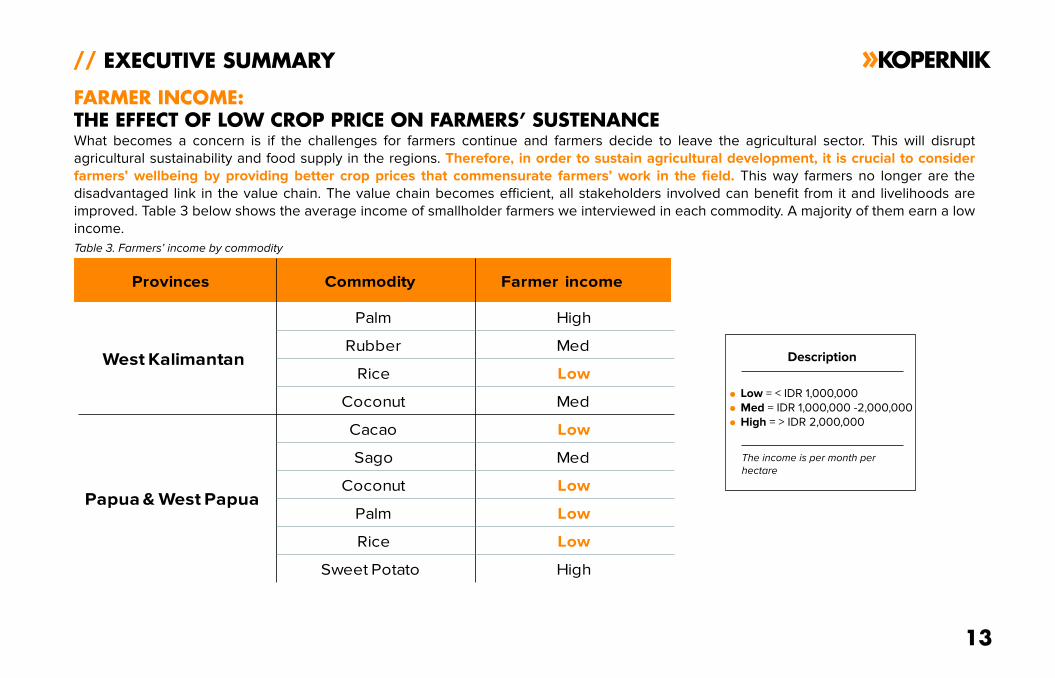
Table 3. Farmers’ income by commodity
FARMER INCOME:
THE EFFECT OF LOW CROP PRICE ON FARMERS’ SUSTENANCEWhat becomes a concern is if the challenges for farmers continue and farmers decide to leave the agricultural sector. This will disrupt
agricultural sustainability and food supply in the regions. Therefore, in order to sustain agricultural development, it is crucial to consider
farmers’ wellbeing by providing better crop prices that commensurate farmers’ work in the field. This way farmers no longer are the
disadvantaged link in the value chain. The value chain becomes efficient, all stakeholders involved can benefit from it and livelihoods are
improved. Table 3 below shows the average income of smallholder farmers we interviewed in each commodity. A majority of them earn a low
income.
Provinces Commodity Farmer income
West Kalimantan
Palm High
Rubber Med
Rice Low
Coconut Med
Papua & West Papua
Cacao Low
Sago Med
Coconut Low
Palm Low
Rice Low
Sweet Potato High
The income is per month per
hectare
Low = < IDR 1,000,000
Med = IDR 1,000,000 -2,000,000
High = > IDR 2,000,000
Description
UNMET NEEDS REPORT 2018SMALLHOLDER FARMERS IN PAPUA, WEST PAPUA & WEST KALIMANTAN
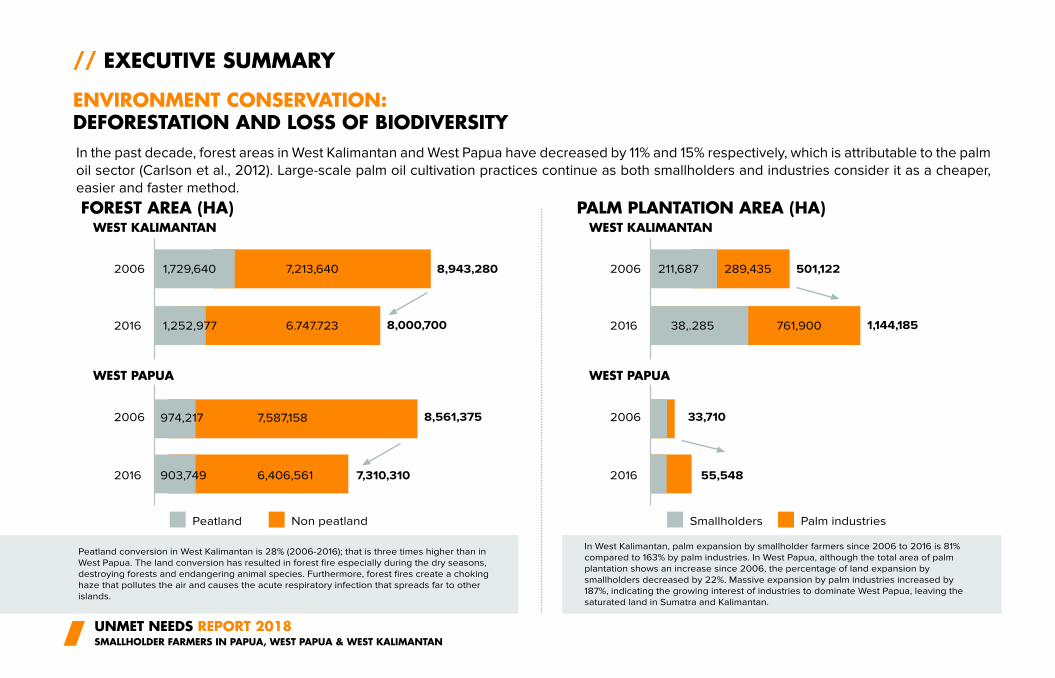
2006 8,943,280
8,561,375
7,310,310
8,000,7002016
2006
2016
Peatland
FOREST AREA (HA) PALM PLANTATION AREA (HA)WEST KALIMANTAN
WEST PAPUA
In the past decade, forest areas in West Kalimantan and West Papua have decreased by 11% and 15% respectively, which is attributable to the palm
oil sector (Carlson et al., 2012). Large-scale palm oil cultivation practices continue as both smallholders and industries consider it as a cheaper,
easier and faster method.
1,729,640 7,213,640
1,252,977
974,217
903,749 6,406,561
7,587,158
6.747.723
Non peatland
2006 501,122
33,710
55,548
1,144,1852016
2006
2016
Smallholders
WEST KALIMANTAN
WEST PAPUA
211,687 289,435
38,.285 761,900
Palm industries
Peatland conversion in West Kalimantan is 28% (2006-2016); that is three times higher than in
West Papua. The land conversion has resulted in forest fire especially during the dry seasons,
destroying forests and endangering animal species. Furthermore, forest fires create a choking
haze that pollutes the air and causes the acute respiratory infection that spreads far to other
islands.
In West Kalimantan, palm expansion by smallholder farmers since 2006 to 2016 is 81%
compared to 163% by palm industries. In West Papua, although the total area of palm
plantation shows an increase since 2006, the percentage of land expansion by
smallholders decreased by 22%. Massive expansion by palm industries increased by
187%, indicating the growing interest of industries to dominate West Papua, leaving the
saturated land in Sumatra and Kalimantan.
// EXECUTIVE SUMMARY
ENVIRONMENT CONSERVATION:DEFORESTATION AND LOSS OF BIODIVERSITY
15
// EXECUTIVE SUMMARY
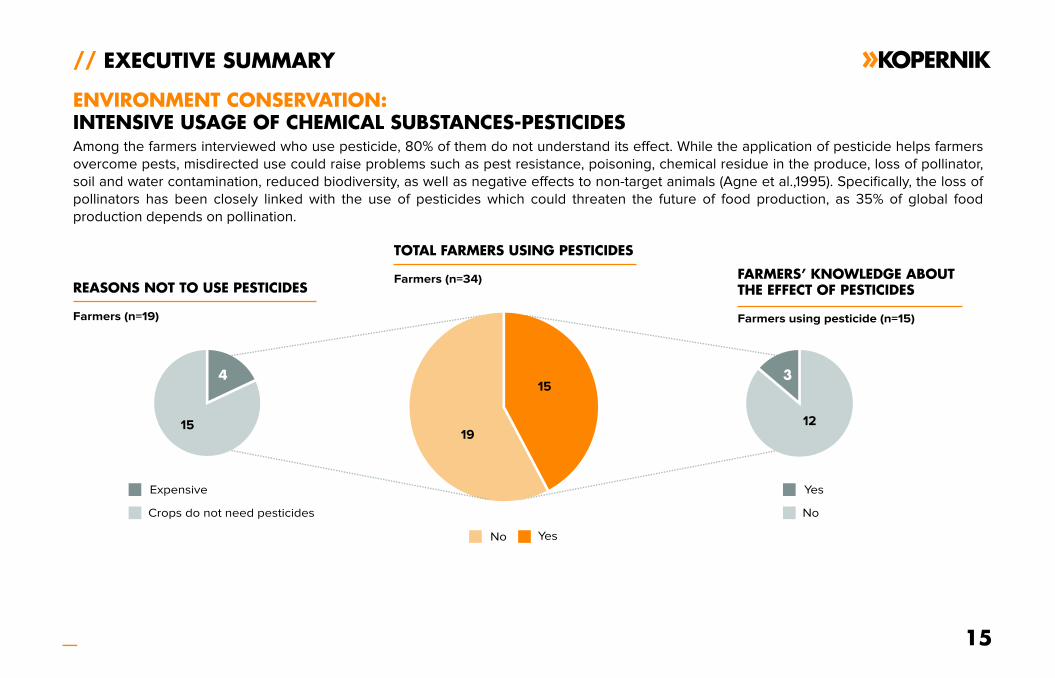
Among the farmers interviewed who use pesticide, 80% of them do not understand its effect. While the application of pesticide helps farmers
overcome pests, misdirected use could raise problems such as pest resistance, poisoning, chemical residue in the produce, loss of pollinator,
soil and water contamination, reduced biodiversity, as well as negative effects to non-target animals (Agne et al.,1995). Specifically, the loss of
pollinators has been closely linked with the use of pesticides which could threaten the future of food production, as 35% of global food
production depends on pollination.
ENVIRONMENT CONSERVATION:
INTENSIVE USAGE OF CHEMICAL SUBSTANCES-PESTICIDES
Farmers (n=19)
REASONS NOT TO USE PESTICIDES
Expensive
Crops do not need pesticides
Farmers (n=34)
TOTAL FARMERS USING PESTICIDES
Farmers using pesticide (n=15)
FARMERS’ KNOWLEDGE ABOUT
THE EFFECT OF PESTICIDES
15
1915
4 3
12
Yes
No
No Yes
UNMET NEEDS REPORT 2018SMALLHOLDER FARMERS IN PAPUA, WEST PAPUA & WEST KALIMANTAN
// EXECUTIVE SUMMARY
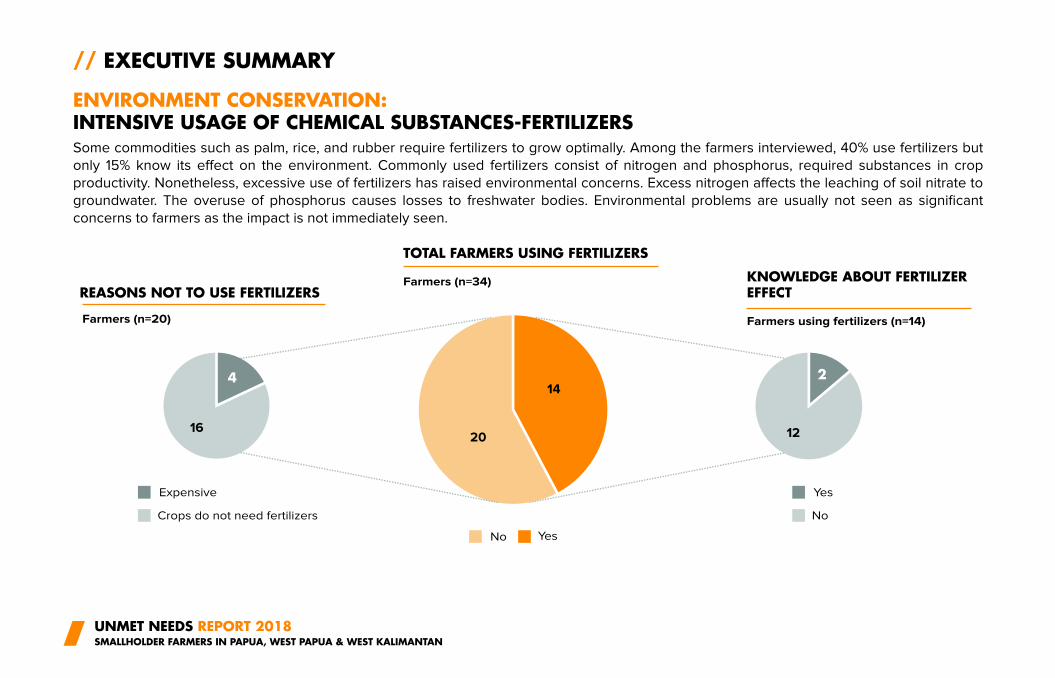
Some commodities such as palm, rice, and rubber require fertilizers to grow optimally. Among the farmers interviewed, 40% use fertilizers but
only 15% know its effect on the environment. Commonly used fertilizers consist of nitrogen and phosphorus, required substances in crop
productivity. Nonetheless, excessive use of fertilizers has raised environmental concerns. Excess nitrogen affects the leaching of soil nitrate to
groundwater. The overuse of phosphorus causes losses to freshwater bodies. Environmental problems are usually not seen as significant
concerns to farmers as the impact is not immediately seen.
ENVIRONMENT CONSERVATION:INTENSIVE USAGE OF CHEMICAL SUBSTANCES-FERTILIZERS
Farmers (n=20)
Expensive
Crops do not need fertilizers
Farmers (n=34)
TOTAL FARMERS USING FERTILIZERS
Farmers using fertilizers (n=14)
KNOWLEDGE ABOUT FERTILIZEREFFECT
14
2016
4 2
12
Yes
No
REASONS NOT TO USE FERTILIZERS
No Yes
17
// EXECUTIVE SUMMARY
ENVIRONMENT CONSERVATION:
IMPACT OF FARMING ACTIVITIES
CommodityEnvironmental aspect
Environment impact
Environment
conservation
valueAir Water Soil Biodiversity
We
stK
alim
an
tan Palm ✓ ✓ ✓ ✓ Loss of biodiversity due to monoculture plantation
Deforestation due to plantation expansionLow
Rubber ✓ ✓
✓ ✓ ✓
✓
✓
RiceRice
Coconut
Cacao
Sago
Coconut
Palm
Rice
Sweet Potato
✓ ✓ ✓
✓
✓ ✓ ✓ ✓
✓
✓ ✓
Pa
pu
a a
nd
We
st P
ap
ua
Loss of biodiversity due to monoculture plantation
Pesticide retention causes pest outbreak
Burning of coconut husk might cause air pollution
Loss of biodiversity due to monoculture plantation
No significant long term environmental impact
Burning of coconut husk for household cooking fuel
might cause air pollution
Loss of biodiversity due to monoculture plantationDeforestation due to plantation expansion
The practice of slash and burn results in air pollution
Usage of pesticide and fertilizer in moderation
Med
Low
High
Med
High
High
Med
Med
Med
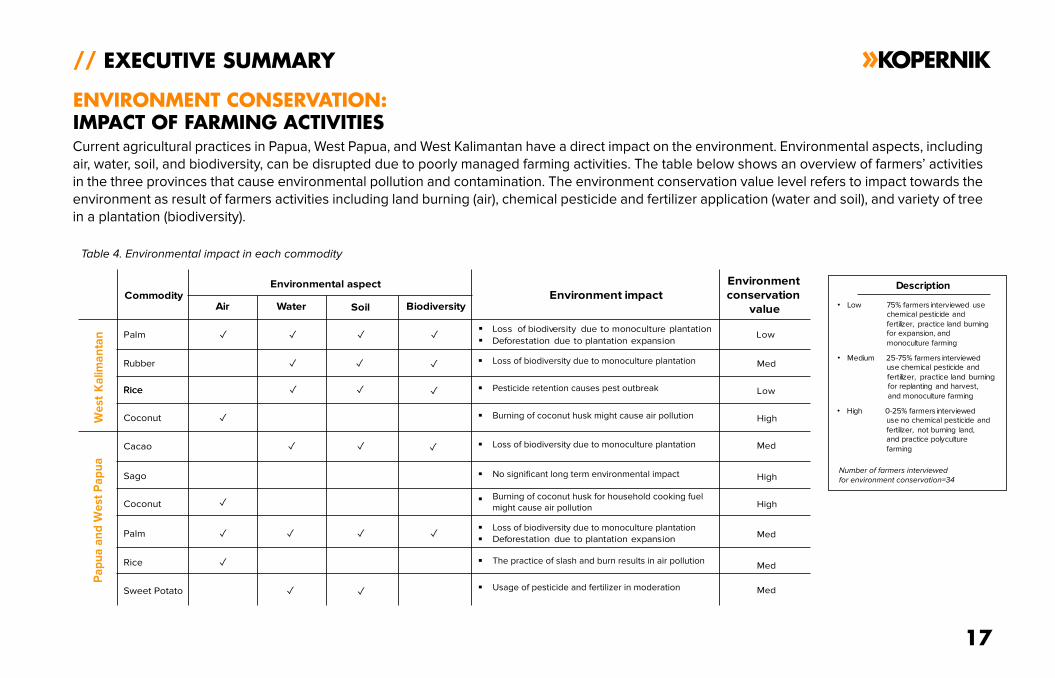
Description
• Low 75% farmers interviewed use chemical pesticide and
fertilizer, practice land burning for expansion, and
monoculture farming
• Medium 25-75% farmers interviewed use chemical pesticide and
fertilizer, practice land burning for replanting and harvest,
and monoculture farming
• High 0-25% farmers interviewed use no chemical pesticide and
fertilizer, not burning land, and practice polyculture
farming
Number of farmers interviewed
for environment conservation=34
Current agricultural practices in Papua, West Papua, and West Kalimantan have a direct impact on the environment. Environmental aspects, including
air, water, soil, and biodiversity, can be disrupted due to poorly managed farming activities. The table below shows an overview of farmers’ activities
in the three provinces that cause environmental pollution and contamination. The environment conservation value level refers to impact towards the
environment as result of farmers activities including land burning (air), chemical pesticide and fertilizer application (water and soil), and variety of tree
in a plantation (biodiversity).
Table 4. Environmental impact in each commodity
// EXECUTIVE SUMMARY / NEXT STEPS
LABOR EFFICIENCY, FARMER INCOME, AND ENVIRONMENT CONSERVATION
Table 5. Assessment matrix
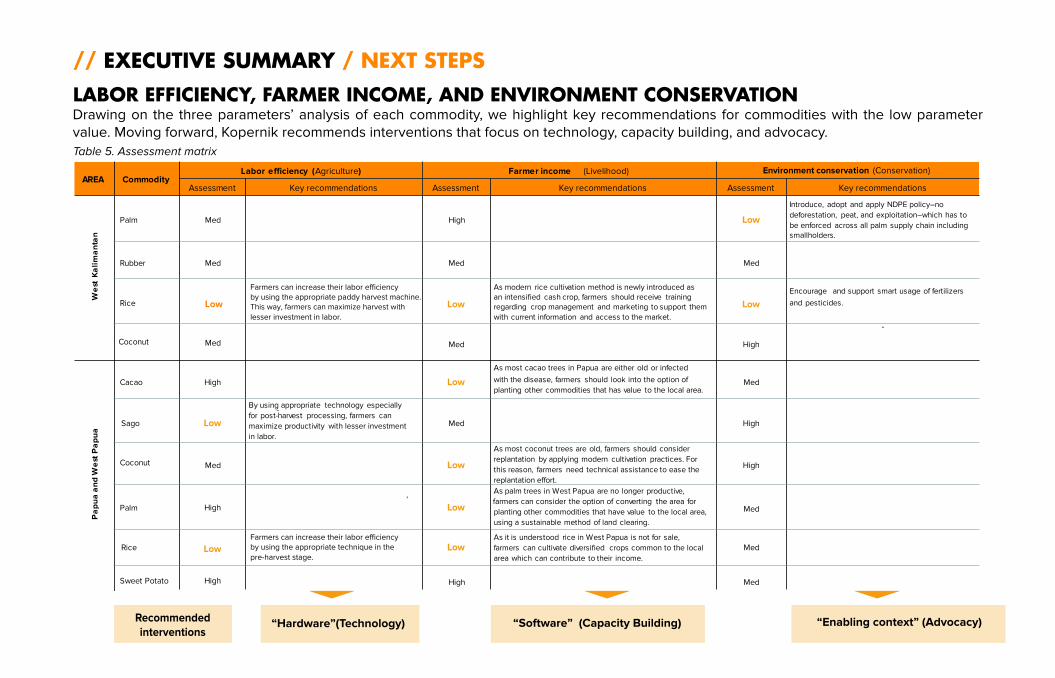
Drawing on the three parameters’ analysis of each commodity, we highlight key recommendations for commodities with the low parameter
value. Moving forward, Kopernik recommends interventions that focus on technology, capacity building, and advocacy.
AREA CommodityLabor efficiency (Agriculture) Farmer income (Livelihood) Environment conservation (Conservation)
Assessment Key recommendations Assessment Key recommendations Assessment Key recommendations
We
stK
ali
ma
nta
n
Palm Med High Low
Introduce, adopt and apply NDPE policy–no
deforestation, peat, and exploitation–which has to
be enforced across all palm supply chain including
smallholders.
Rubber Med Med Med
Rice Low Low
As modern rice cultivation method is newly introduced as
an intensified cash crop, farmers should receive training
regarding crop management and marketing to support them
with current information and access to the market.
Low
Encourage and support smart usage of fertilizers
and pesticides.
Coconut Med High
-
Pa
pu
a a
nd
We
st P
ap
ua
Cacao High Low
As most cacao trees in Papua are either old or infected
with the disease, farmers should look into the option of
planting other commodities that has value to the local area. Med
Sago Low
By using appropriate technology especially
for post--harvest processing, farmers can
maximize productivity with lesser investment
in labor.
Med High
Coconut Med Low
As most coconut trees are old, farmers should consider
replantation by applying modern cultivation practices. For
this reason, farmers need technical assistance to ease the
replantation effort.
High
Palm
,
Low
As palm trees in West Papua are no longer productive,
farmers can consider the option of converting the area for
planting other commodities that have value to the local area,
using a sustainable method of land clearing.
Rice LowAs it is understood rice in West Papua is not for sale,
farmers can cultivate diversified crops common to the local
area which can contribute to their income.
Med
Sweet Potato High Med
Recommended
interventions “Hardware”(Technology) “Software” (Capacity Building) “Enabling context” (Advocacy)
Farmers can increase their labor efficiency
by using the appropriate paddy harvest machine.
This way, farmers can maximize harvest with
lesser investment in labor.
High
Farmers can increase their labor efficiency
by using the appropriate technique in the
pre-harvest stage. Low
High
Med
Med
19
// EXECUTIVE SUMMARY / NEXT STEPS
“HARDWARE”
TECHNOLOGY
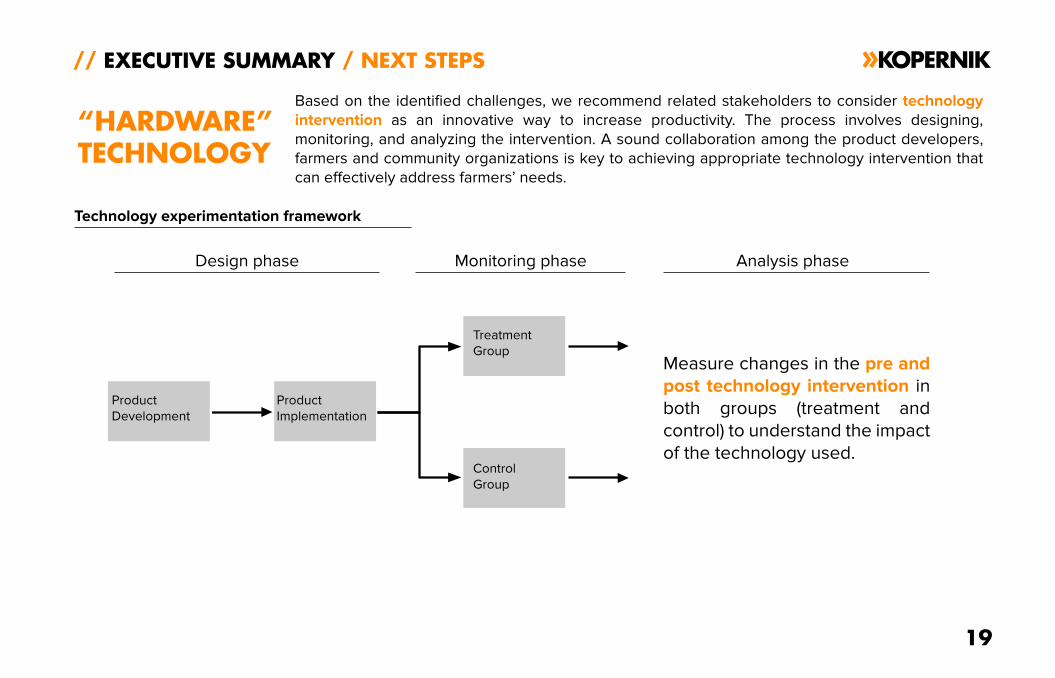
Based on the identified challenges, we recommend related stakeholders to consider technology
intervention as an innovative way to increase productivity. The process involves designing,
monitoring, and analyzing the intervention. A sound collaboration among the product developers,
farmers and community organizations is key to achieving appropriate technology intervention that
can effectively address farmers’ needs.
Technology experimentation framework
Design phase Monitoring phase Analysis phase
Product
Development
Product
Implementation
Treatment
Group
Control
Group
Measure changes in the pre and
post technology intervention in
both groups (treatment and
control) to understand the impact
of the technology used.
UNMET NEEDS REPORT 2018SMALLHOLDER FARMERS IN PAPUA, WEST PAPUA & WEST KALIMANTAN
// EXECUTIVE SUMMARY / NEXT STEPS
“SOFTWARE”CAPACITY BUILDING
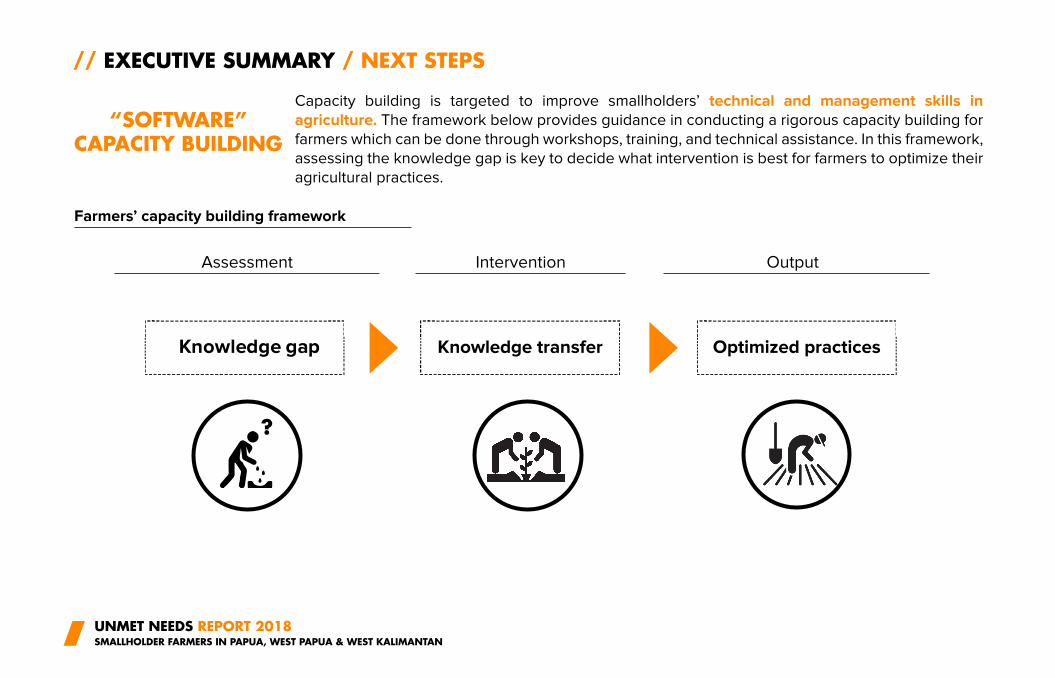
Capacity building is targeted to improve smallholders’ technical and management skills in
agriculture. The framework below provides guidance in conducting a rigorous capacity building for
farmers which can be done through workshops, training, and technical assistance. In this framework,
assessing the knowledge gap is key to decide what intervention is best for farmers to optimize their
agricultural practices.
Farmers’ capacity building framework
Assessment Intervention Output
Knowledge gap Knowledge transfer Optimized practices
?
21
// EXECUTIVE SUMMARY / NEXT STEPS
“SOFTWARE”
CAPACITY BUILDING
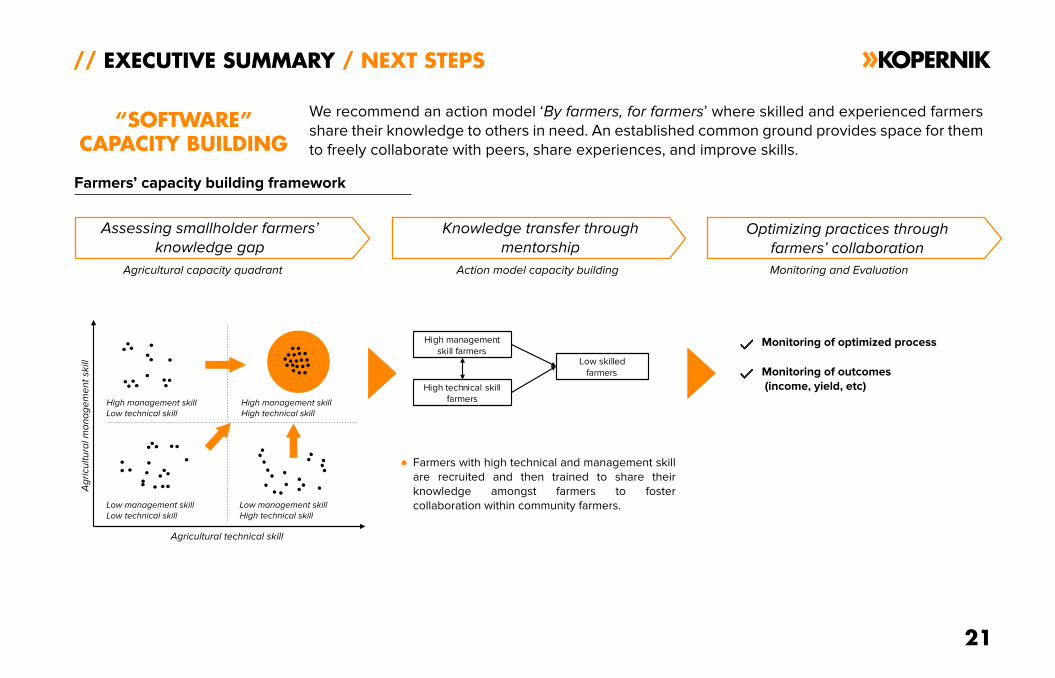
We recommend an action model ‘By farmers, for farmers’ where skilled and experienced farmers
share their knowledge to others in need. An established common ground provides space for them
to freely collaborate with peers, share experiences, and improve skills.
Farmers’ capacity building framework
Assessing smallholder farmers’
knowledge gap
Ag
ricu
ltu
ral m
an
ag
em
en
t sk
ill
Agricultural technical skill
High management skill
Low technical skill
Low management skill
Low technical skill
Low management skill
High technical skill
High management skill
High technical skill
Agricultural capacity quadrant
High management
skill farmers
High technical skill
farmers
Low skilled
farmers
Action model capacity building Monitoring and Evaluation
Farmers with high technical and management skill
are recruited and then trained to share their
knowledge amongst farmers to foster
collaboration within community farmers.
Monitoring of optimized process
Knowledge transfer through
mentorship Optimizing practices through
farmers’ collaboration
Monitoring of outcomes
(income, yield, etc)
UNMET NEEDS REPORT 2018SMALLHOLDER FARMERS IN PAPUA, WEST PAPUA & WEST KALIMANTAN
// EXECUTIVE SUMMARY / NEXT STEPS
“ENABLING CONTEXT”ADVOCACY
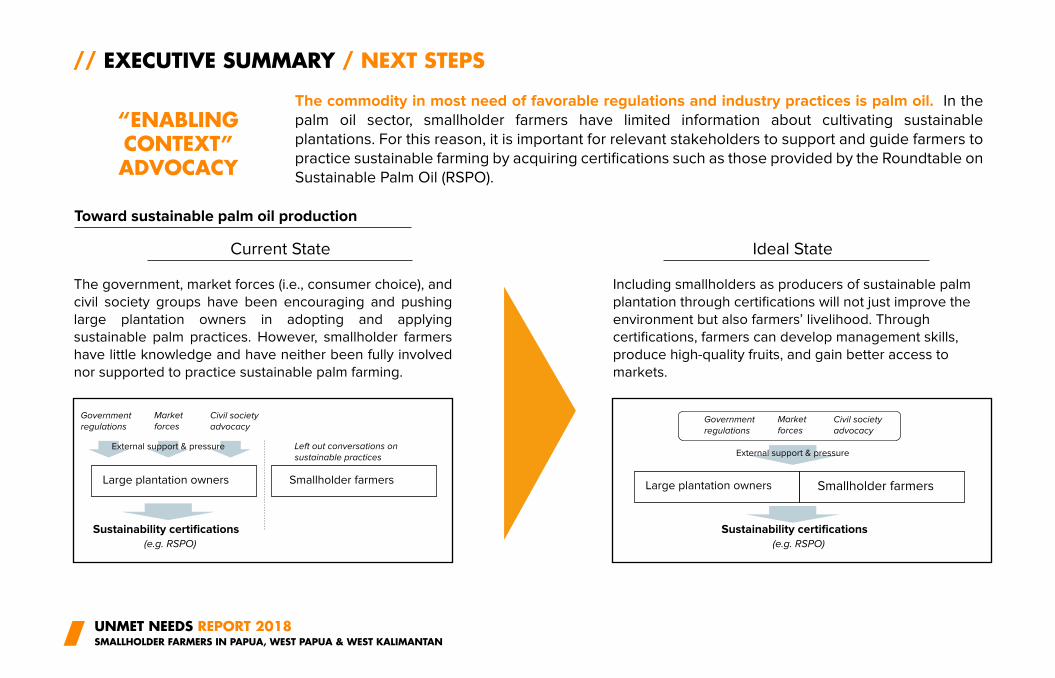
The commodity in most need of favorable regulations and industry practices is palm oil. In the
palm oil sector, smallholder farmers have limited information about cultivating sustainable
plantations. For this reason, it is important for relevant stakeholders to support and guide farmers to
practice sustainable farming by acquiring certifications such as those provided by the Roundtable on
Sustainable Palm Oil (RSPO).
Toward sustainable palm oil production
Current State Ideal State
The government, market forces (i.e., consumer choice), and
civil society groups have been encouraging and pushing
large plantation owners in adopting and applying
sustainable palm practices. However, smallholder farmers
have little knowledge and have neither been fully involved
nor supported to practice sustainable palm farming.
Including smallholders as producers of sustainable palm
plantation through certifications will not just improve the
environment but also farmers’ livelihood. Through
certifications, farmers can develop management skills,
produce high-quality fruits, and gain better access to
markets.
Government
regulations
Market
forcesCivil society
advocacy
External support & pressure
Smallholder farmers
Sustainability certifications(e.g. RSPO)
Large plantation owners
Left out conversations on
sustainable practices
Government
regulations
Market
forcesCivil society
advocacy
External support & pressure
Smallholder farmersLarge plantation owners
Sustainability certifications(e.g. RSPO)
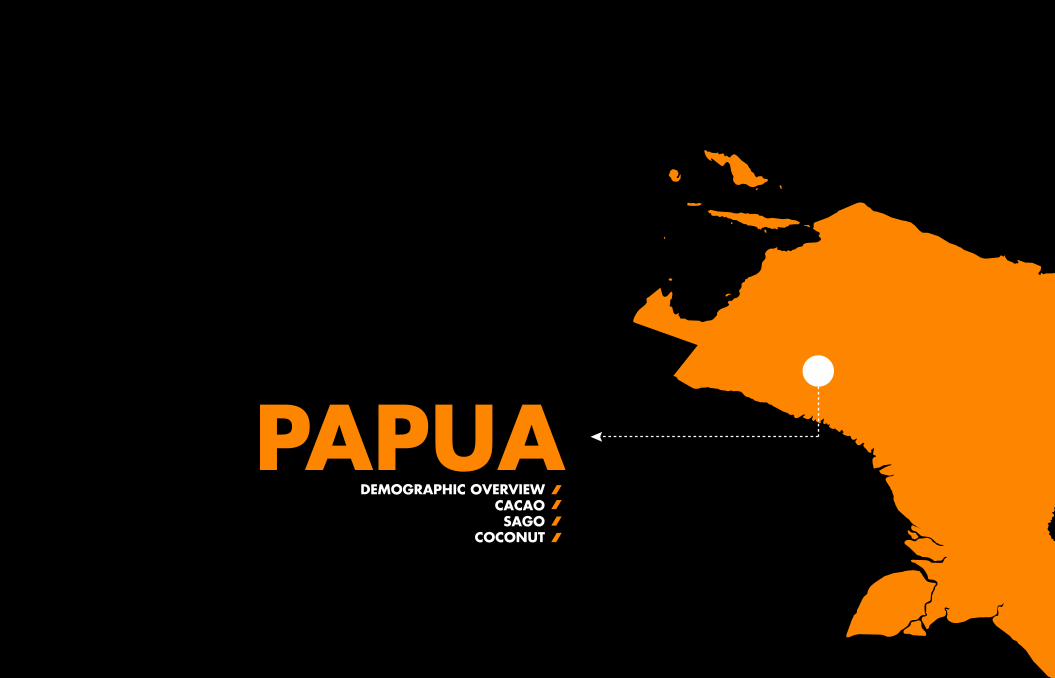
PAPUADEMOGRAPHIC OVERVIEW
CACAO
SAGO
COCONUT
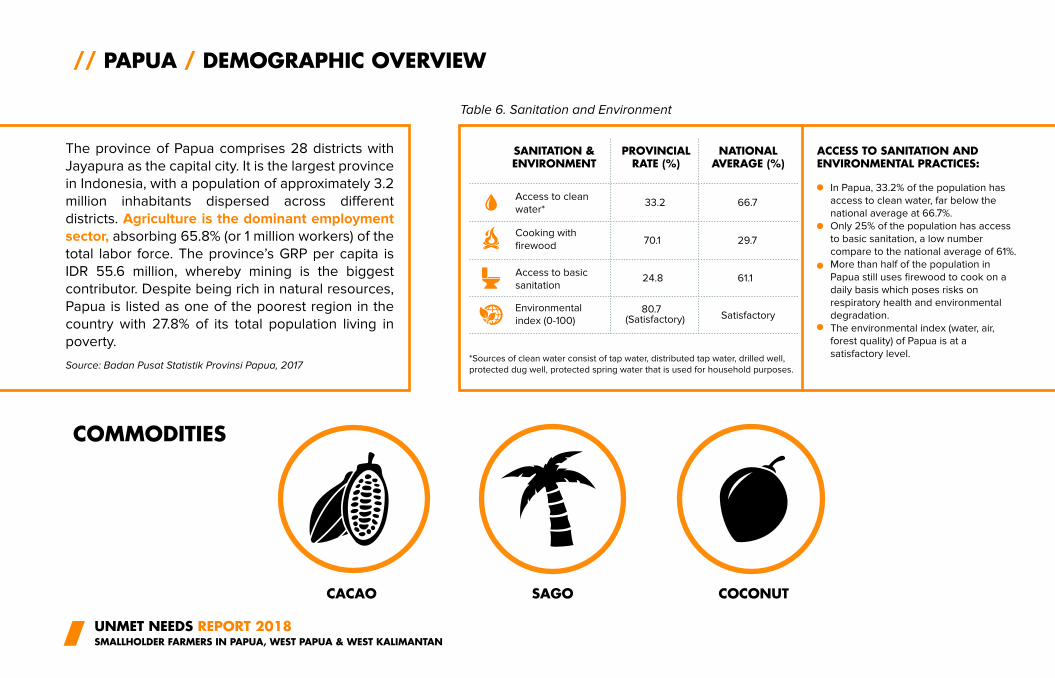
Table 6. Sanitation and Environment
*Sources of clean water consist of tap water, distributed tap water, drilled well,
protected dug well, protected spring water that is used for household purposes.
SANITATION &ENVIRONMENT
ACCESS TO SANITATION AND ENVIRONMENTAL PRACTICES:
PROVINCIALRATE (%)
NATIONALAVERAGE (%)
The province of Papua comprises 28 districts with
Jayapura as the capital city. It is the largest province
in Indonesia, with a population of approximately 3.2
million inhabitants dispersed across different
districts. Agriculture is the dominant employment
sector, absorbing 65.8% (or 1 million workers) of the
total labor force. The province’s GRP per capita is
IDR 55.6 million, whereby mining is the biggest
contributor. Despite being rich in natural resources,
Papua is listed as one of the poorest region in the
country with 27.8% of its total population living in
poverty.
In Papua, 33.2% of the population has
access to clean water, far below the
national average at 66.7%.
Only 25% of the population has access
to basic sanitation, a low number
compare to the national average of 61%.
More than half of the population in
Papua still uses firewood to cook on a
daily basis which poses risks on
respiratory health and environmental
degradation.
The environmental index (water, air,
forest quality) of Papua is at a
satisfactory level.
COMMODITIES
CACAO SAGO COCONUT
Access to clean
water*33.2
70.1
24.8
66.7
29.7
61.1
Satisfactory
Cooking with
firewood
Access to basic
sanitation
Environmental
index (0-100)
UNMET NEEDS REPORT 2018SMALLHOLDER FARMERS IN PAPUA, WEST PAPUA & WEST KALIMANTAN
// PAPUA / DEMOGRAPHIC OVERVIEW
Source: Badan Pusat Statistik Provinsi Papua, 2017
80.7(Satisfactory)
25
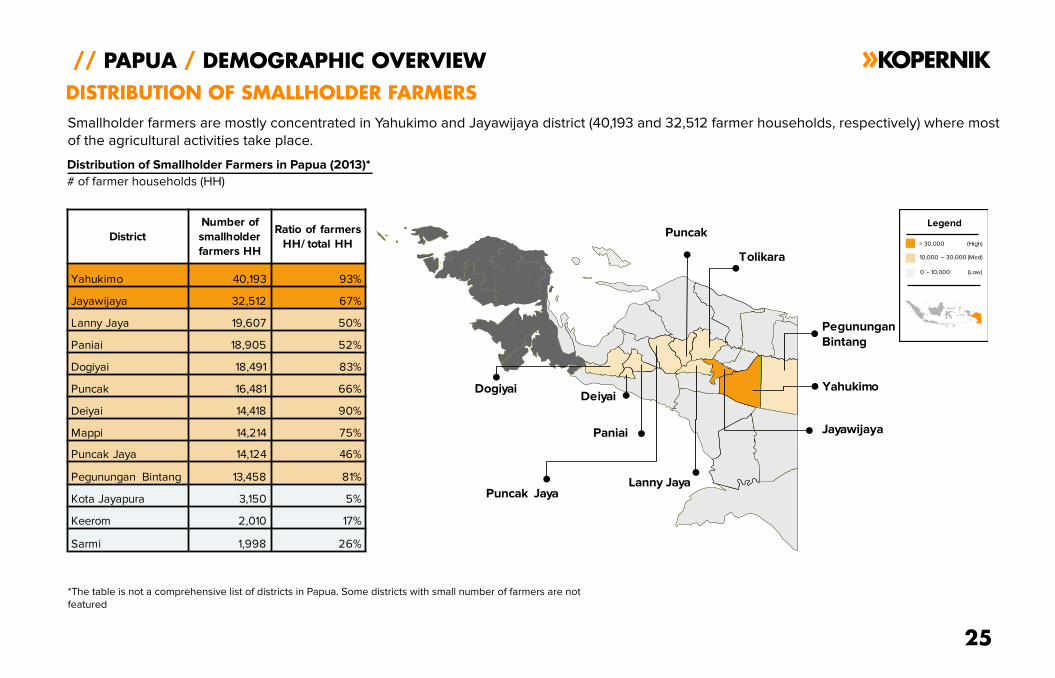
// PAPUA / DEMOGRAPHIC OVERVIEW
DISTRIBUTION OF SMALLHOLDER FARMERS
Pegunungan
Bintang
Jayawijaya Paniai
Yahukimo
Lanny Jaya
Puncak
DogiyaiDeiyai
Puncak Jaya
Tolikara
Distribution of Smallholder Farmers in Papua (2013)*
# of farmer households (HH)
Smallholder farmers are mostly concentrated in Yahukimo and Jayawijaya district (40,193 and 32,512 farmer households, respectively) where most
of the agricultural activities take place.
*The table is not a comprehensive list of districts in Papua. Some districts with small number of farmers are not
featured
District
Number of
smallholder
farmers HH
Ratio of farmers
HH/ total HH
Yahukimo 40,193 93%
Jayawijaya 32,512 67%
Lanny Jaya 19,607 50%
Paniai 18,905 52%
Dogiyai 18,491 83%
Puncak 16,481 66%
Deiyai 14,418 90%
Mappi 14,214 75%
Puncak Jaya 14,124 46%
Pegunungan Bintang 13,458 81%
Kota Jayapura 3,150 5%
Keerom 2,010 17%
Sarmi 1,998 26%
0 – 10,000 (Low)
10,000 – 30,000 (Med)
> 30,000 (High)
Legend
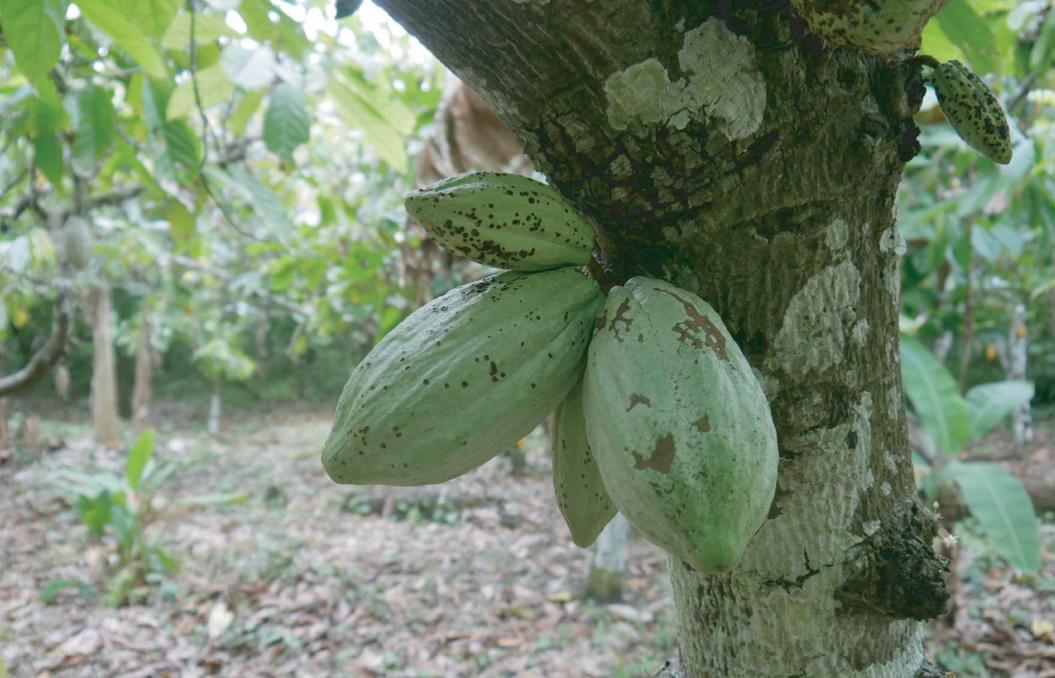
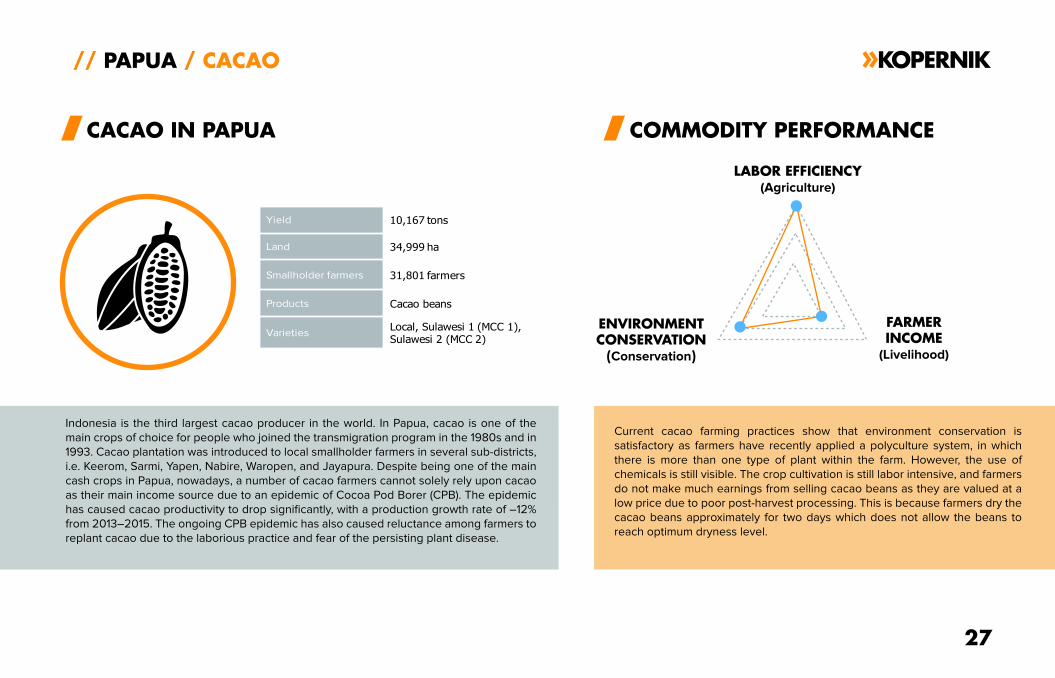
Indonesia is the third largest cacao producer in the world. In Papua, cacao is one of the
main crops of choice for people who joined the transmigration program in the 1980s and in
1993. Cacao plantation was introduced to local smallholder farmers in several sub-districts,
i.e. Keerom, Sarmi, Yapen, Nabire, Waropen, and Jayapura. Despite being one of the main
cash crops in Papua, nowadays, a number of cacao farmers cannot solely rely upon cacao
as their main income source due to an epidemic of Cocoa Pod Borer (CPB). The epidemic
has caused cacao productivity to drop significantly, with a production growth rate of –12%
from 2013–2015. The ongoing CPB epidemic has also caused reluctance among farmers to
replant cacao due to the laborious practice and fear of the persisting plant disease.
Current cacao farming practices show that environment conservation is
satisfactory as farmers have recently applied a polyculture system, in which
there is more than one type of plant within the farm. However, the use of
chemicals is still visible. The crop cultivation is still labor intensive, and farmers
do not make much earnings from selling cacao beans as they are valued at a
low price due to poor post-harvest processing. This is because farmers dry the
cacao beans approximately for two days which does not allow the beans to
reach optimum dryness level.
27
// PAPUA / CACAO
CACAO IN PAPUA COMMODITY PERFORMANCE
LABOR EFFICIENCY(Agriculture)
ENVIRONMENTCONSERVATION
(Conservation)
FARMERINCOME
(Livelihood)
Yield 10,167 tons
Land 34,999 ha
Smallholder farmers 31,801 farmers
Products Cacao beans
VarietiesLocal, Sulawesi 1 (MCC 1), Sulawesi 2 (MCC 2)
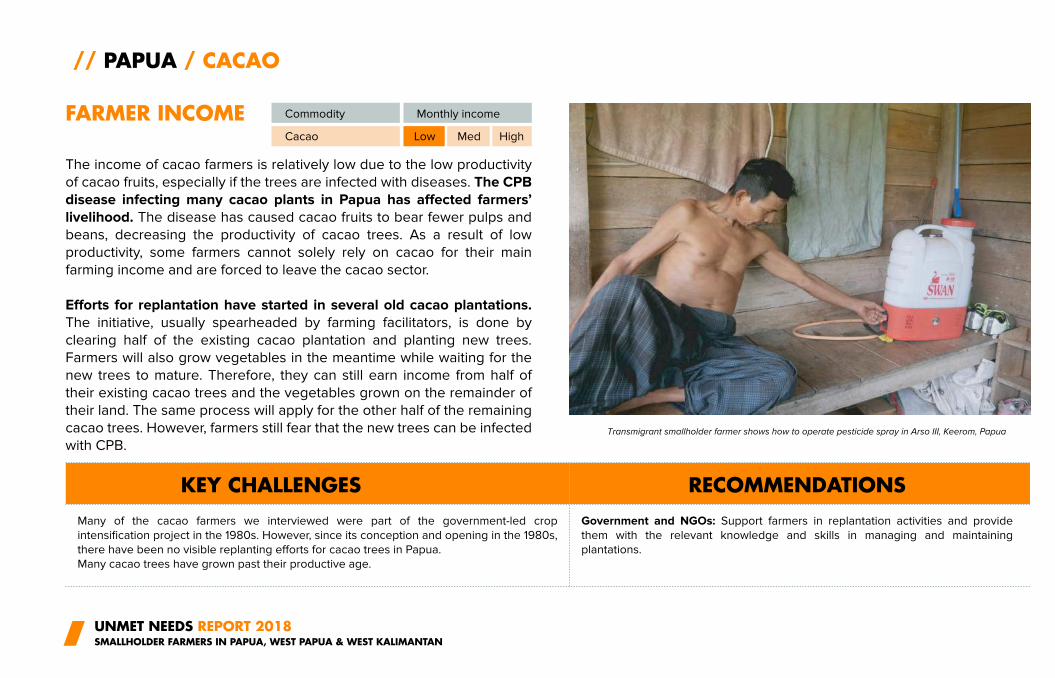
The income of cacao farmers is relatively low due to the low productivity
of cacao fruits, especially if the trees are infected with diseases. The CPB
disease infecting many cacao plants in Papua has affected farmers’
livelihood. The disease has caused cacao fruits to bear fewer pulps and
beans, decreasing the productivity of cacao trees. As a result of low
productivity, some farmers cannot solely rely on cacao for their main
farming income and are forced to leave the cacao sector.
Efforts for replantation have started in several old cacao plantations.
The initiative, usually spearheaded by farming facilitators, is done by
clearing half of the existing cacao plantation and planting new trees.
Farmers will also grow vegetables in the meantime while waiting for the
new trees to mature. Therefore, they can still earn income from half of
their existing cacao trees and the vegetables grown on the remainder of
their land. The same process will apply for the other half of the remaining
cacao trees. However, farmers still fear that the new trees can be infected
with CPB.
UNMET NEEDS REPORT 2018SMALLHOLDER FARMERS IN PAPUA, WEST PAPUA & WEST KALIMANTAN
// PAPUA / CACAO
FARMER INCOME
KEY CHALLENGES RECOMMENDATIONS
Commodity
Transmigrant smallholder farmer shows how to operate pesticide spray in Arso III, Keerom, Papua
Monthly income
Cacao Low Med High
Many of the cacao farmers we interviewed were part of the government-led crop
intensification project in the 1980s. However, since its conception and opening in the 1980s,
there have been no visible replanting efforts for cacao trees in Papua.
Many cacao trees have grown past their productive age.
Government and NGOs: Support farmers in replantation activities and provide
them with the relevant knowledge and skills in managing and maintaining
plantations.
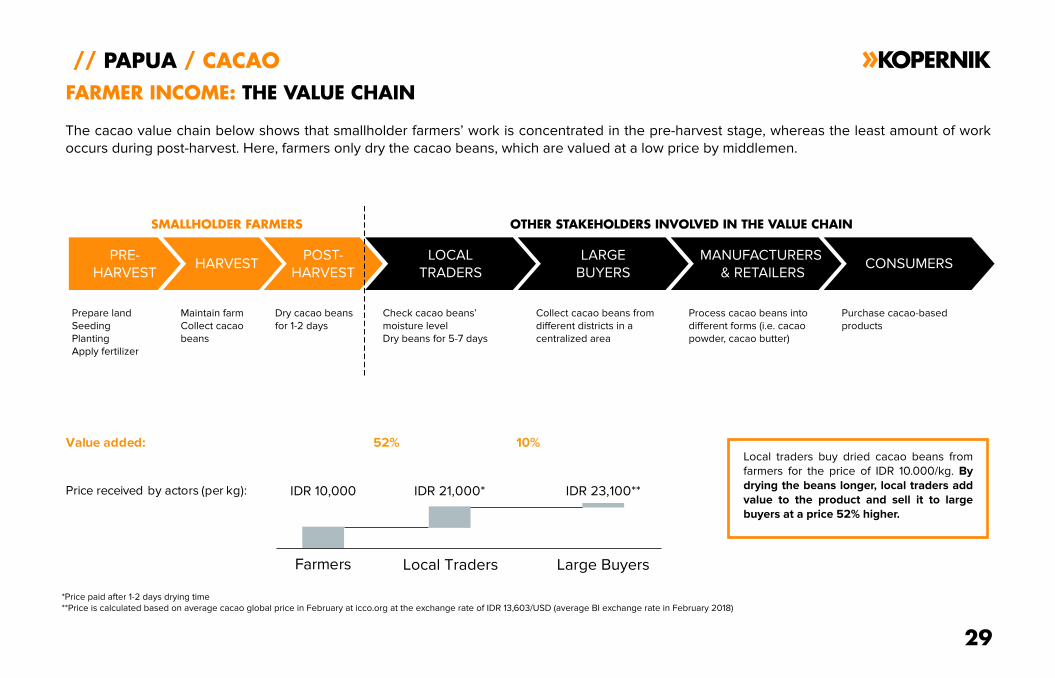
The cacao value chain below shows that smallholder farmers’ work is concentrated in the pre-harvest stage, whereas the least amount of work
occurs during post-harvest. Here, farmers only dry the cacao beans, which are valued at a low price by middlemen.
29
// PAPUA / CACAO
PRE-
HARVESTHARVEST
POST-
HARVEST
LOCAL
TRADERS
FARMER INCOME: THE VALUE CHAIN
Price received by actors (per kg):
Value added:
Farmers
IDR 10,000
52%
IDR 21,000*
Local Traders Large Buyers
IDR 23,100**
10%
Prepare land
Seeding
Planting
Apply fertilizer
Maintain farm
Collect cacao
beans
Dry cacao beans
for 1-2 days
SMALLHOLDER FARMERS OTHER STAKEHOLDERS INVOLVED IN THE VALUE CHAIN
LARGE
BUYERS
MANUFACTURERS
& RETAILERSCONSUMERS
Check cacao beans’
moisture level
Dry beans for 5-7 days
Collect cacao beans from
different districts in a
centralized area
Process cacao beans into
different forms (i.e. cacao
powder, cacao butter)
Purchase cacao-based
products
Local traders buy dried cacao beans from
farmers for the price of IDR 10.000/kg. By
drying the beans longer, local traders add
value to the product and sell it to large
buyers at a price 52% higher.
*Price paid after 1-2 days drying time
**Price is calculated based on average cacao global price in February at icco.org at the exchange rate of IDR 13,603/USD (average BI exchange rate in February 2018)
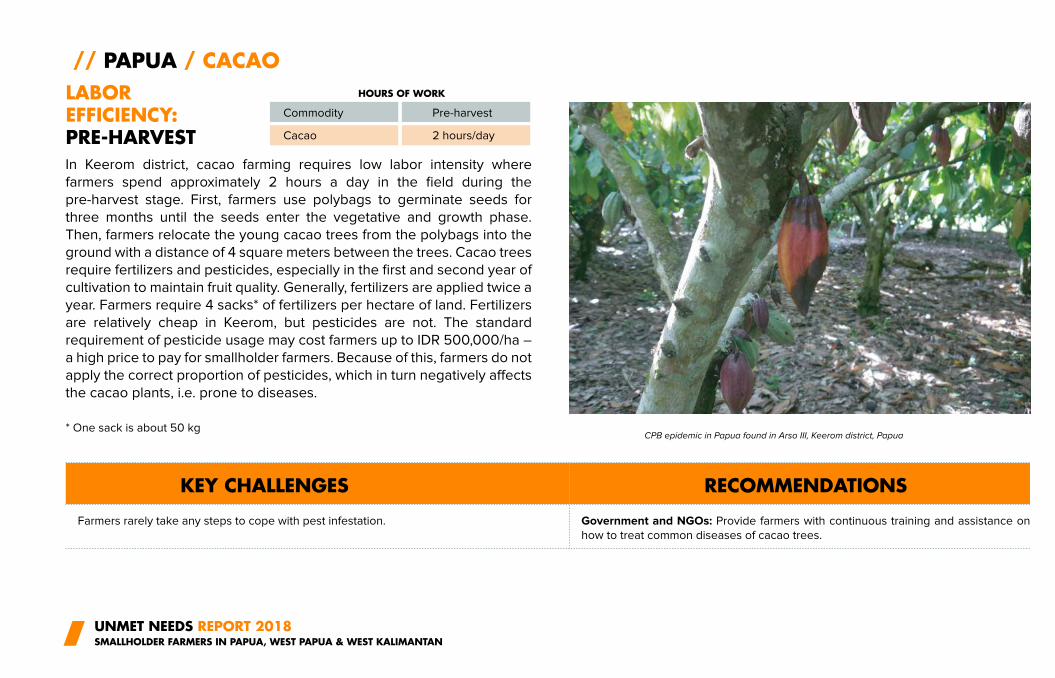
In Keerom district, cacao farming requires low labor intensity where
farmers spend approximately 2 hours a day in the field during the
pre-harvest stage. First, farmers use polybags to germinate seeds for
three months until the seeds enter the vegetative and growth phase.
Then, farmers relocate the young cacao trees from the polybags into the
ground with a distance of 4 square meters between the trees. Cacao trees
require fertilizers and pesticides, especially in the first and second year of
cultivation to maintain fruit quality. Generally, fertilizers are applied twice a
year. Farmers require 4 sacks* of fertilizers per hectare of land. Fertilizers
are relatively cheap in Keerom, but pesticides are not. The standard
requirement of pesticide usage may cost farmers up to IDR 500,000/ha –
a high price to pay for smallholder farmers. Because of this, farmers do not
apply the correct proportion of pesticides, which in turn negatively affects
the cacao plants, i.e. prone to diseases.
UNMET NEEDS REPORT 2018SMALLHOLDER FARMERS IN PAPUA, WEST PAPUA & WEST KALIMANTAN
// PAPUA / CACAO
LABOREFFICIENCY:PRE-HARVEST
Commodity
CPB epidemic in Papua found in Arso III, Keerom district, Papua
Pre-harvest
Cacao
KEY CHALLENGES RECOMMENDATIONS
Farmers rarely take any steps to cope with pest infestation. Government and NGOs: Provide farmers with continuous training and assistance on
how to treat common diseases of cacao trees.
* One sack is about 50 kg
2 hours/day
HOURS OF WORK
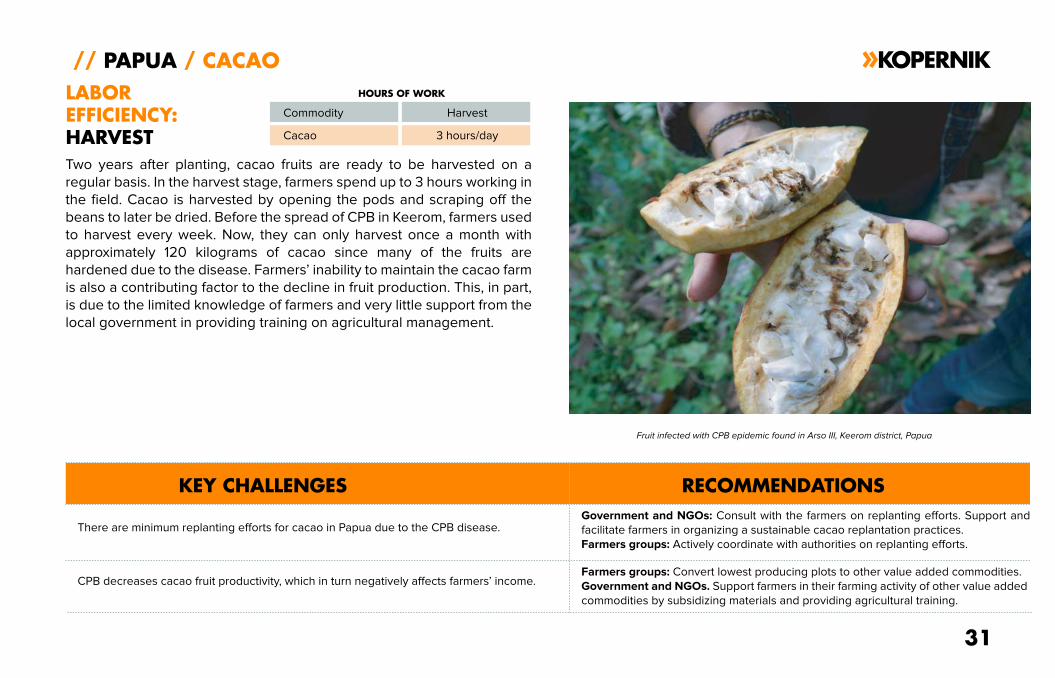
Two years after planting, cacao fruits are ready to be harvested on a
regular basis. In the harvest stage, farmers spend up to 3 hours working in
the field. Cacao is harvested by opening the pods and scraping off the
beans to later be dried. Before the spread of CPB in Keerom, farmers used
to harvest every week. Now, they can only harvest once a month with
approximately 120 kilograms of cacao since many of the fruits are
hardened due to the disease. Farmers’ inability to maintain the cacao farm
is also a contributing factor to the decline in fruit production. This, in part,
is due to the limited knowledge of farmers and very little support from the
local government in providing training on agricultural management.
31
// PAPUA / CACAO
LABOR
EFFICIENCY:
HARVEST
KEY CHALLENGES RECOMMENDATIONS
Commodity
Fruit infected with CPB epidemic found in Arso III, Keerom district, Papua
Harvest
Cacao
There are minimum replanting efforts for cacao in Papua due to the CPB disease.Government and NGOs: Consult with the farmers on replanting efforts. Support and
facilitate farmers in organizing a sustainable cacao replantation practices.
Farmers groups: Actively coordinate with authorities on replanting efforts.
CPB decreases cacao fruit productivity, which in turn negatively affects farmers’ income.Farmers groups: Convert lowest producing plots to other value added commodities.
Government and NGOs. Support farmers in their farming activity of other value added
commodities by subsidizing materials and providing agricultural training.
3 hours/day
HOURS OF WORK
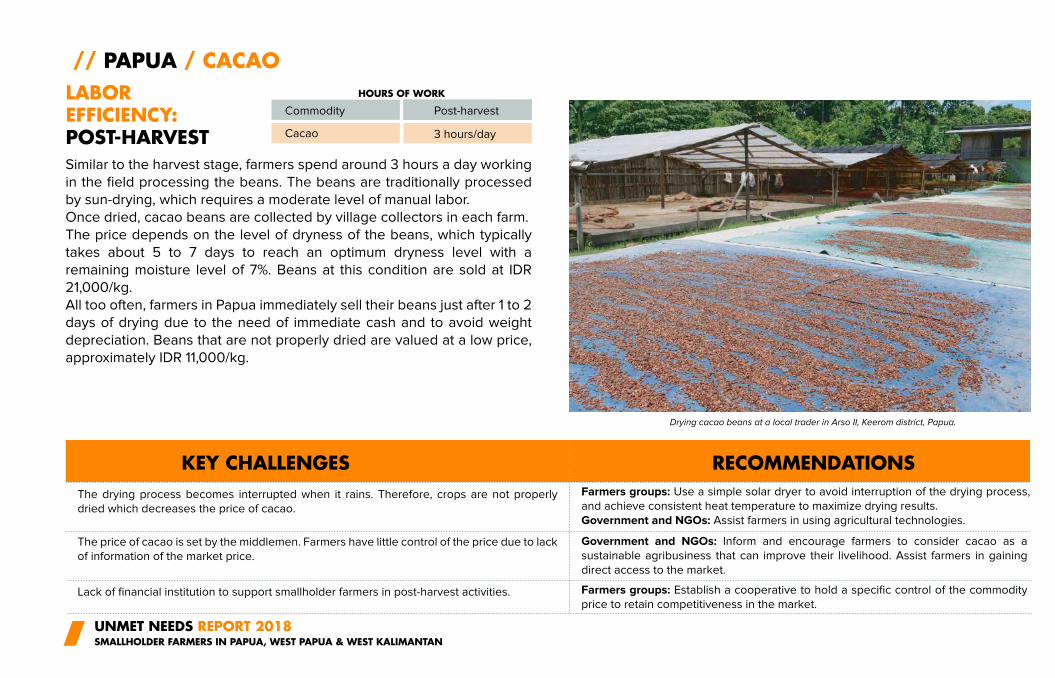
Similar to the harvest stage, farmers spend around 3 hours a day working
in the field processing the beans. The beans are traditionally processed
by sun-drying, which requires a moderate level of manual labor.
Once dried, cacao beans are collected by village collectors in each farm.
The price depends on the level of dryness of the beans, which typically
takes about 5 to 7 days to reach an optimum dryness level with a
remaining moisture level of 7%. Beans at this condition are sold at IDR
21,000/kg.
All too often, farmers in Papua immediately sell their beans just after 1 to 2
days of drying due to the need of immediate cash and to avoid weight
depreciation. Beans that are not properly dried are valued at a low price,
approximately IDR 11,000/kg.
UNMET NEEDS REPORT 2018SMALLHOLDER FARMERS IN PAPUA, WEST PAPUA & WEST KALIMANTAN
// PAPUA / CACAO
LABOR EFFICIENCY:POST-HARVEST
Commodity
Drying cacao beans at a local trader in Arso II, Keerom district, Papua.
Post-harvest
Cacao
The drying process becomes interrupted when it rains. Therefore, crops are not properly
dried which decreases the price of cacao.
Farmers groups: Use a simple solar dryer to avoid interruption of the drying process,
and achieve consistent heat temperature to maximize drying results.
Government and NGOs: Assist farmers in using agricultural technologies.
The price of cacao is set by the middlemen. Farmers have little control of the price due to lack
of information of the market price.
Government and NGOs: Inform and encourage farmers to consider cacao as a
sustainable agribusiness that can improve their livelihood. Assist farmers in gaining
direct access to the market.
KEY CHALLENGES RECOMMENDATIONS
Lack of financial institution to support smallholder farmers in post-harvest activities. Farmers groups: Establish a cooperative to hold a specific control of the commodity
price to retain competitiveness in the market.
Post-harvest
3 hours/day
HOURS OF WORK
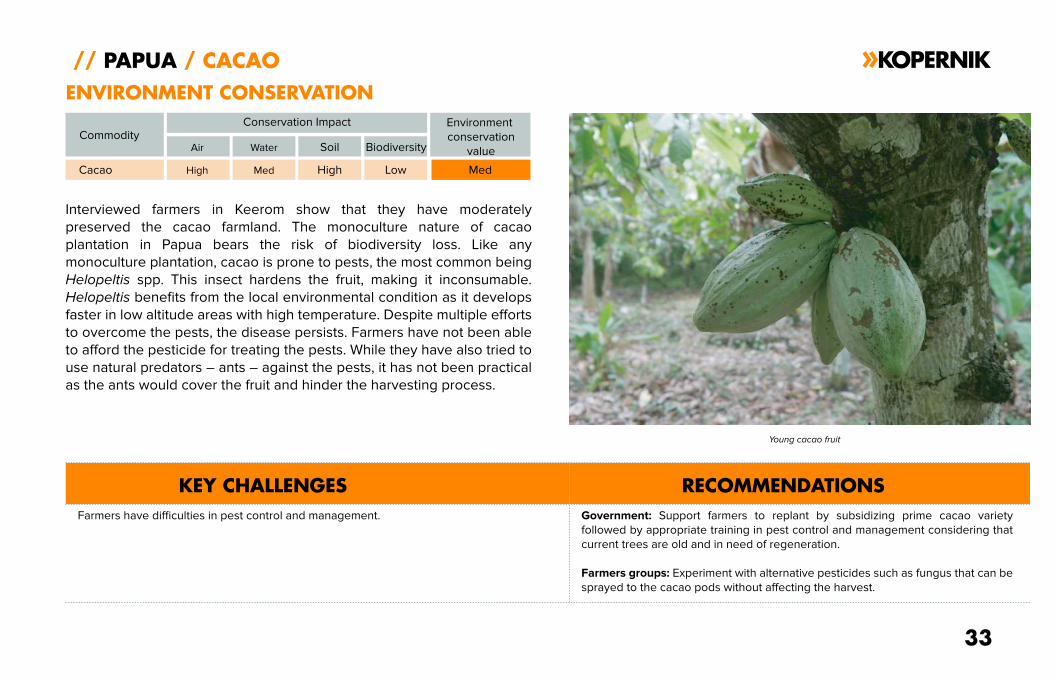
Interviewed farmers in Keerom show that they have moderately
preserved the cacao farmland. The monoculture nature of cacao
plantation in Papua bears the risk of biodiversity loss. Like any
monoculture plantation, cacao is prone to pests, the most common being
Helopeltis spp. This insect hardens the fruit, making it inconsumable.
Helopeltis benefits from the local environmental condition as it develops
faster in low altitude areas with high temperature. Despite multiple efforts
to overcome the pests, the disease persists. Farmers have not been able
to afford the pesticide for treating the pests. While they have also tried to
use natural predators – ants – against the pests, it has not been practical
as the ants would cover the fruit and hinder the harvesting process.
33
// PAPUA / CACAO
ENVIRONMENT CONSERVATION
KEY CHALLENGES RECOMMENDATIONS
Commodity
Young cacao fruit
Cacao High
Farmers have difficulties in pest control and management. Government: Support farmers to replant by subsidizing prime cacao variety
followed by appropriate training in pest control and management considering that
current trees are old and in need of regeneration.
Farmers groups: Experiment with alternative pesticides such as fungus that can be
sprayed to the cacao pods without affecting the harvest.
Conservation Impact Environment
conservation
value
Med High Low Med
Air Water Soil Biodiversity
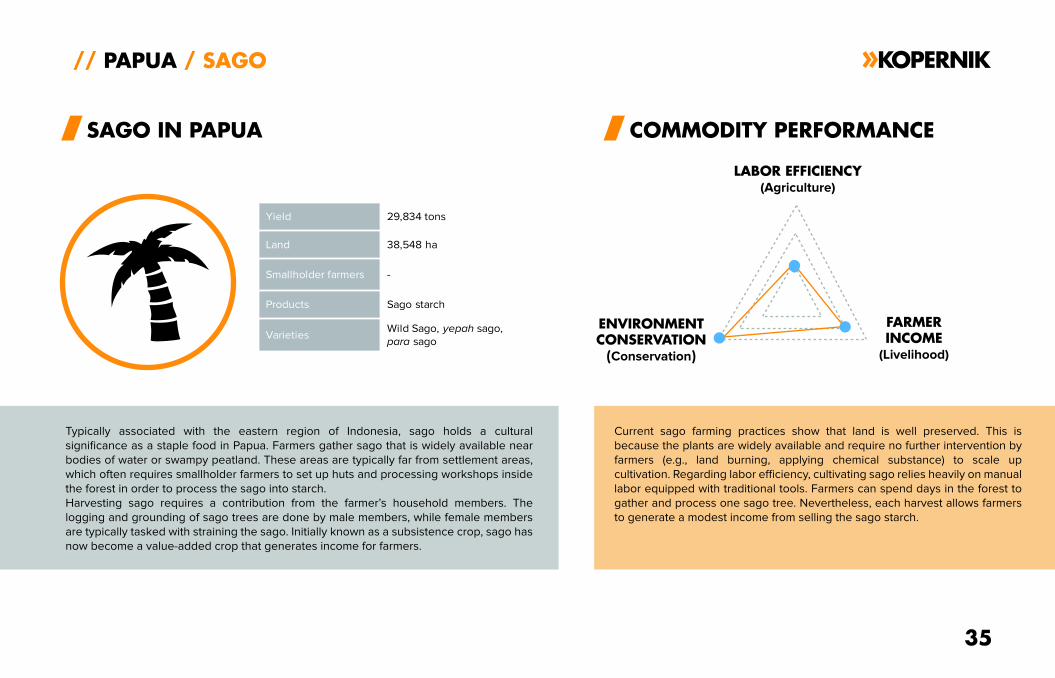
Typically associated with the eastern region of Indonesia, sago holds a cultural
significance as a staple food in Papua. Farmers gather sago that is widely available near
bodies of water or swampy peatland. These areas are typically far from settlement areas,
which often requires smallholder farmers to set up huts and processing workshops inside
the forest in order to process the sago into starch.
Harvesting sago requires a contribution from the farmer’s household members. The
logging and grounding of sago trees are done by male members, while female members
are typically tasked with straining the sago. Initially known as a subsistence crop, sago has
now become a value-added crop that generates income for farmers.
Current sago farming practices show that land is well preserved. This is
because the plants are widely available and require no further intervention by
farmers (e.g., land burning, applying chemical substance) to scale up
cultivation. Regarding labor efficiency, cultivating sago relies heavily on manual
labor equipped with traditional tools. Farmers can spend days in the forest to
gather and process one sago tree. Nevertheless, each harvest allows farmers
to generate a modest income from selling the sago starch.
35
// PAPUA / SAGO
SAGO IN PAPUA COMMODITY PERFORMANCE
LABOR EFFICIENCY(Agriculture)
ENVIRONMENTCONSERVATION
(Conservation)
FARMERINCOME
(Livelihood)
Yield 29,834 tons
Land 38,548 ha
Smallholder farmers -
Products Sago starch
VarietiesWild Sago, yepah sago, para sago
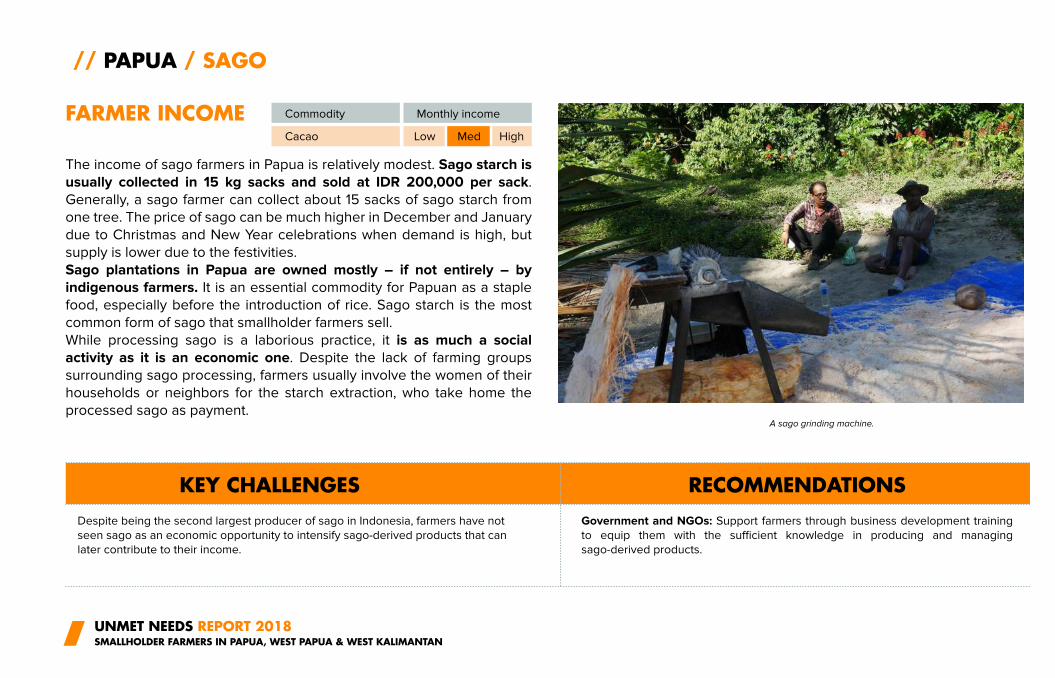
The income of sago farmers in Papua is relatively modest. Sago starch is
usually collected in 15 kg sacks and sold at IDR 200,000 per sack.
Generally, a sago farmer can collect about 15 sacks of sago starch from
one tree. The price of sago can be much higher in December and January
due to Christmas and New Year celebrations when demand is high, but
supply is lower due to the festivities.
Sago plantations in Papua are owned mostly – if not entirely – by
indigenous farmers. It is an essential commodity for Papuan as a staple
food, especially before the introduction of rice. Sago starch is the most
common form of sago that smallholder farmers sell.
While processing sago is a laborious practice, it is as much a social
activity as it is an economic one. Despite the lack of farming groups
surrounding sago processing, farmers usually involve the women of their
households or neighbors for the starch extraction, who take home the
processed sago as payment.
UNMET NEEDS REPORT 2018SMALLHOLDER FARMERS IN PAPUA, WEST PAPUA & WEST KALIMANTAN
// PAPUA / SAGO
FARMER INCOME
KEY CHALLENGES RECOMMENDATIONS
Commodity
A sago grinding machine.
Monthly income
Cacao Low Med High
Despite being the second largest producer of sago in Indonesia, farmers have not
seen sago as an economic opportunity to intensify sago-derived products that can
later contribute to their income.
Government and NGOs: Support farmers through business development training
to equip them with the sufficient knowledge in producing and managing
sago-derived products.
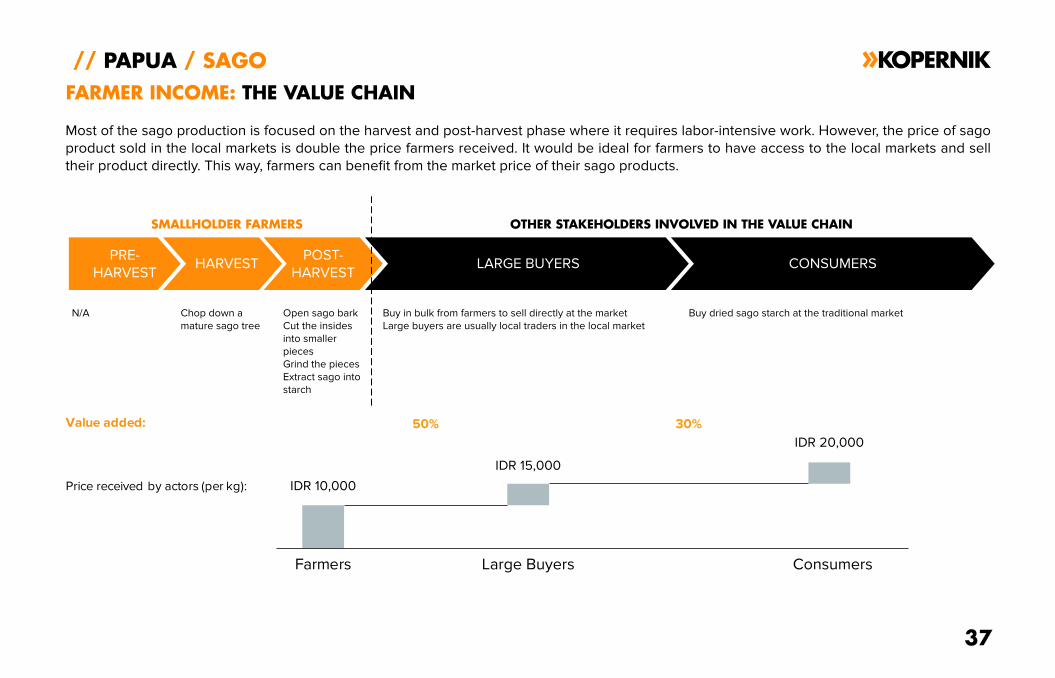
Most of the sago production is focused on the harvest and post-harvest phase where it requires labor-intensive work. However, the price of sago
product sold in the local markets is double the price farmers received. It would be ideal for farmers to have access to the local markets and sell
their product directly. This way, farmers can benefit from the market price of their sago products.
// PAPUA / SAGO
PRE-
HARVESTHARVEST
POST-
HARVESTLARGE BUYERS
FARMER INCOME: THE VALUE CHAIN
Price received by actors (per kg):
Value added:
Farmers
IDR 10,000
50%
IDR 15,000
Large Buyers Consumers
IDR 20,000
30%
N/A Chop down a
mature sago tree
Open sago bark
Cut the insides
into smaller
pieces
Grind the pieces
Extract sago into
starch
SMALLHOLDER FARMERS
Buy in bulk from farmers to sell directly at the market
Large buyers are usually local traders in the local market
CONSUMERS
Buy dried sago starch at the traditional market
37
OTHER STAKEHOLDERS INVOLVED IN THE VALUE CHAIN
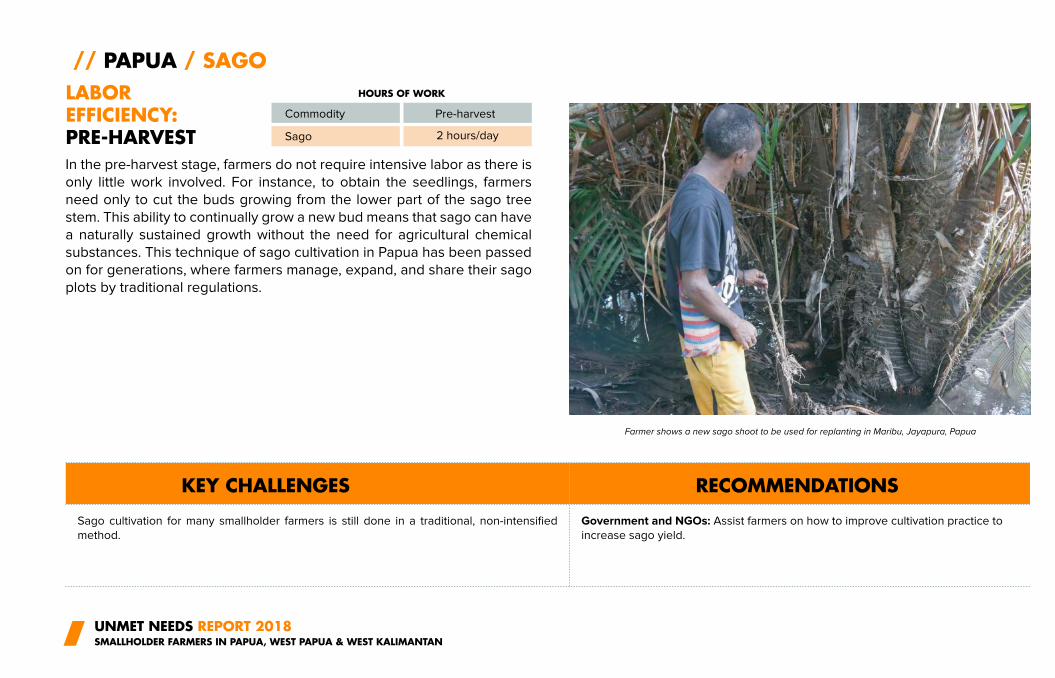
In the pre-harvest stage, farmers do not require intensive labor as there is
only little work involved. For instance, to obtain the seedlings, farmers
need only to cut the buds growing from the lower part of the sago tree
stem. This ability to continually grow a new bud means that sago can have
a naturally sustained growth without the need for agricultural chemical
substances. This technique of sago cultivation in Papua has been passed
on for generations, where farmers manage, expand, and share their sago
plots by traditional regulations.
UNMET NEEDS REPORT 2018SMALLHOLDER FARMERS IN PAPUA, WEST PAPUA & WEST KALIMANTAN
// PAPUA / SAGO
LABOR EFFICIENCY:PRE-HARVEST
KEY CHALLENGES RECOMMENDATIONS
Commodity
Farmer shows a new sago shoot to be used for replanting in Maribu, Jayapura, Papua
Pre-harvest
Sago
Sago cultivation for many smallholder farmers is still done in a traditional, non-intensified
method.
Government and NGOs: Assist farmers on how to improve cultivation practice to
increase sago yield.
HOURS OF WORK
2 hours/day
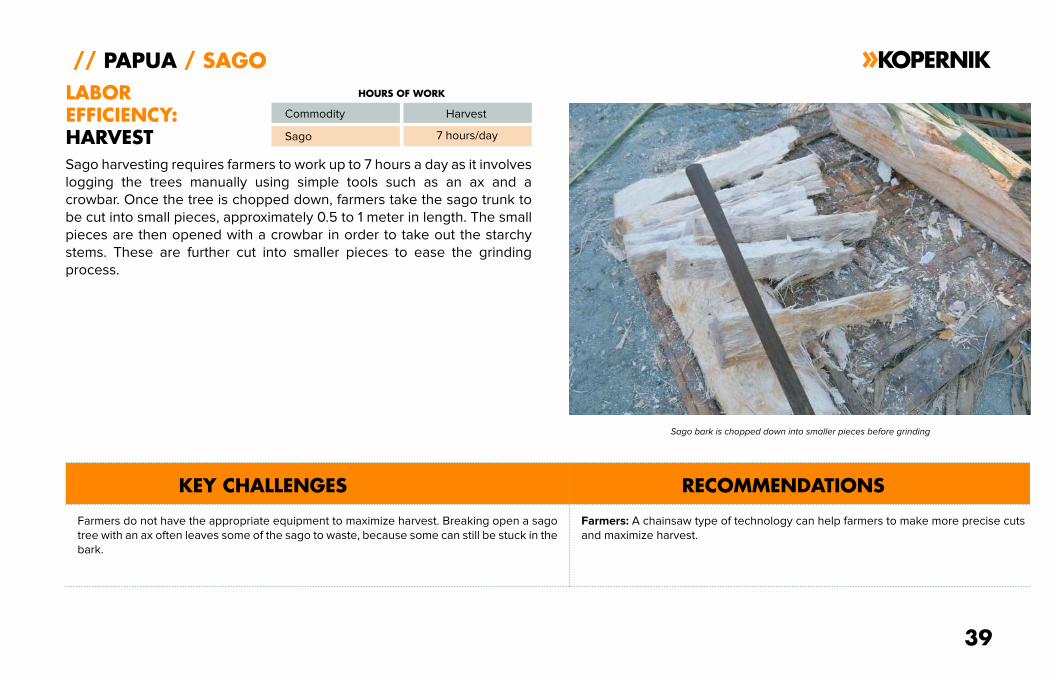
Sago harvesting requires farmers to work up to 7 hours a day as it involves
logging the trees manually using simple tools such as an ax and a
crowbar. Once the tree is chopped down, farmers take the sago trunk to
be cut into small pieces, approximately 0.5 to 1 meter in length. The small
pieces are then opened with a crowbar in order to take out the starchy
stems. These are further cut into smaller pieces to ease the grinding
process.
39
// PAPUA / SAGO
LABOR
EFFICIENCY:
HARVEST
KEY CHALLENGES RECOMMENDATIONS
Commodity
Sago bark is chopped down into smaller pieces before grinding
Harvest
Sago
Farmers do not have the appropriate equipment to maximize harvest. Breaking open a sago
tree with an ax often leaves some of the sago to waste, because some can still be stuck in the
bark.
Farmers: A chainsaw type of technology can help farmers to make more precise cuts
and maximize harvest.
HOURS OF WORK
7 hours/day
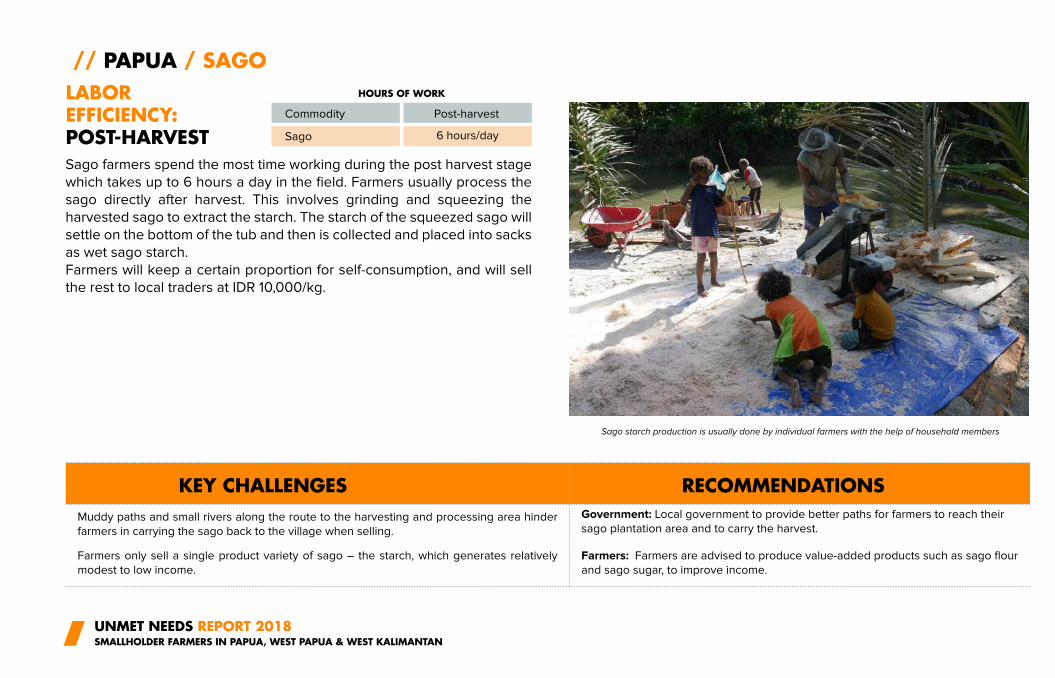
Sago farmers spend the most time working during the post harvest stage
which takes up to 6 hours a day in the field. Farmers usually process the
sago directly after harvest. This involves grinding and squeezing the
harvested sago to extract the starch. The starch of the squeezed sago will
settle on the bottom of the tub and then is collected and placed into sacks
as wet sago starch.
Farmers will keep a certain proportion for self-consumption, and will sell
the rest to local traders at IDR 10,000/kg.
UNMET NEEDS REPORT 2018SMALLHOLDER FARMERS IN PAPUA, WEST PAPUA & WEST KALIMANTAN
// PAPUA / SAGO
LABOREFFICIENCY:POST-HARVEST
KEY CHALLENGES RECOMMENDATIONS
Commodity
Sago starch production is usually done by individual farmers with the help of household members
Post-harvest
Sago
Muddy paths and small rivers along the route to the harvesting and processing area hinder
farmers in carrying the sago back to the village when selling.
Government: Local government to provide better paths for farmers to reach their
sago plantation area and to carry the harvest.
HOURS OF WORK
6 hours/day
Farmers only sell a single product variety of sago – the starch, which generates relatively
modest to low income.
Farmers: Farmers are advised to produce value-added products such as sago flour
and sago sugar, to improve income.
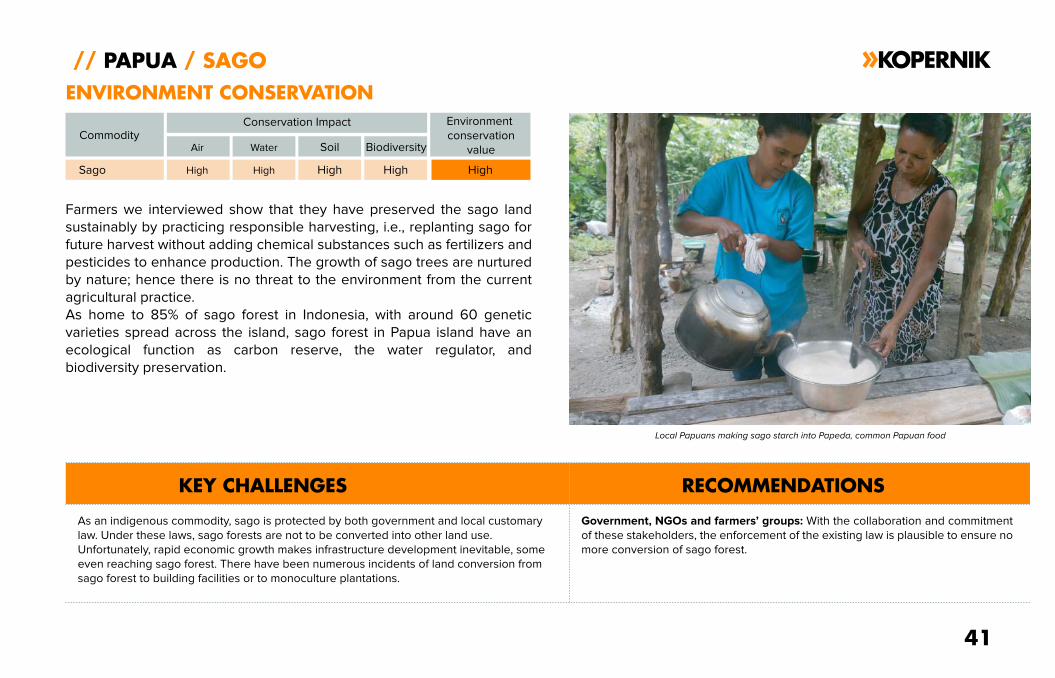
Farmers we interviewed show that they have preserved the sago land
sustainably by practicing responsible harvesting, i.e., replanting sago for
future harvest without adding chemical substances such as fertilizers and
pesticides to enhance production. The growth of sago trees are nurtured
by nature; hence there is no threat to the environment from the current
agricultural practice.
As home to 85% of sago forest in Indonesia, with around 60 genetic
varieties spread across the island, sago forest in Papua island have an
ecological function as carbon reserve, the water regulator, and
biodiversity preservation.
41
// PAPUA / SAGO
ENVIRONMENT CONSERVATION
KEY CHALLENGES RECOMMENDATIONS
Commodity
Local Papuans making sago starch into Papeda, common Papuan food
Sago High
As an indigenous commodity, sago is protected by both government and local customary
law. Under these laws, sago forests are not to be converted into other land use.
Unfortunately, rapid economic growth makes infrastructure development inevitable, some
even reaching sago forest. There have been numerous incidents of land conversion from
sago forest to building facilities or to monoculture plantations.
Government, NGOs and farmers’ groups: With the collaboration and commitment
of these stakeholders, the enforcement of the existing law is plausible to ensure no
more conversion of sago forest.
Conservation Impact
High High High High
Air Water Soil Biodiversity
Environment
conservation
value
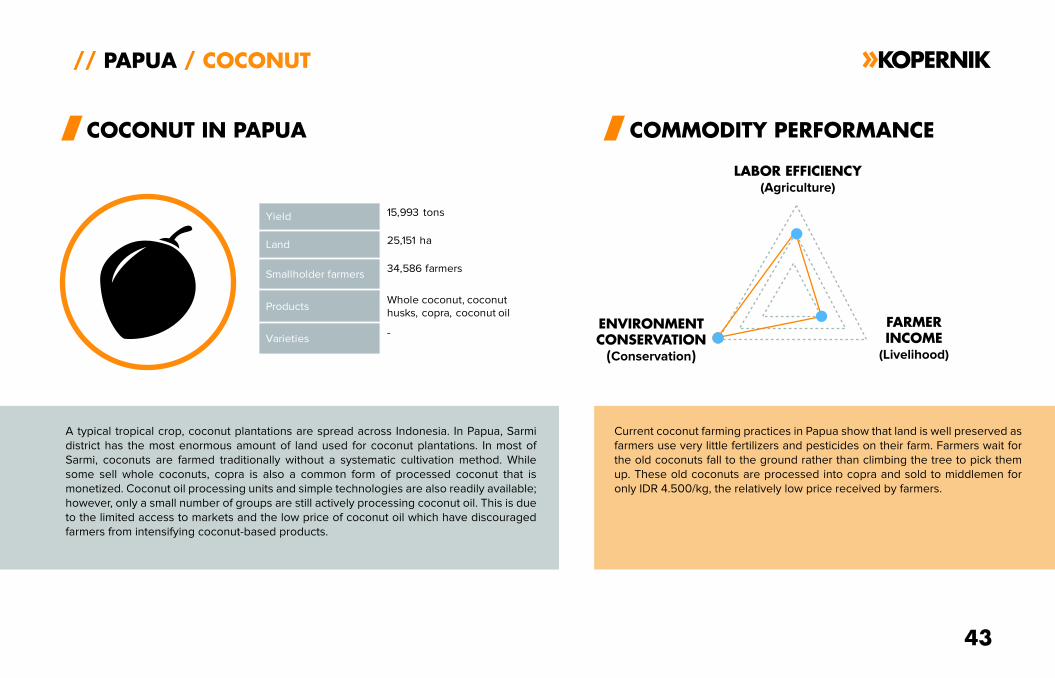
A typical tropical crop, coconut plantations are spread across Indonesia. In Papua, Sarmi
district has the most enormous amount of land used for coconut plantations. In most of
Sarmi, coconuts are farmed traditionally without a systematic cultivation method. While
some sell whole coconuts, copra is also a common form of processed coconut that is
monetized. Coconut oil processing units and simple technologies are also readily available;
however, only a small number of groups are still actively processing coconut oil. This is due
to the limited access to markets and the low price of coconut oil which have discouraged
farmers from intensifying coconut-based products.
Current coconut farming practices in Papua show that land is well preserved as
farmers use very little fertilizers and pesticides on their farm. Farmers wait for
the old coconuts fall to the ground rather than climbing the tree to pick them
up. These old coconuts are processed into copra and sold to middlemen for
only IDR 4.500/kg, the relatively low price received by farmers.
43
// PAPUA / COCONUT
COCONUT IN PAPUA COMMODITY PERFORMANCE
LABOR EFFICIENCY(Agriculture)
ENVIRONMENTCONSERVATION
(Conservation)
FARMERINCOME
(Livelihood)
Yield 15,993 tons
Land 25,151 ha
Smallholder farmers34,586 farmers
ProductsWhole coconut, coconut
husks, copra, coconut oil
Varieties-
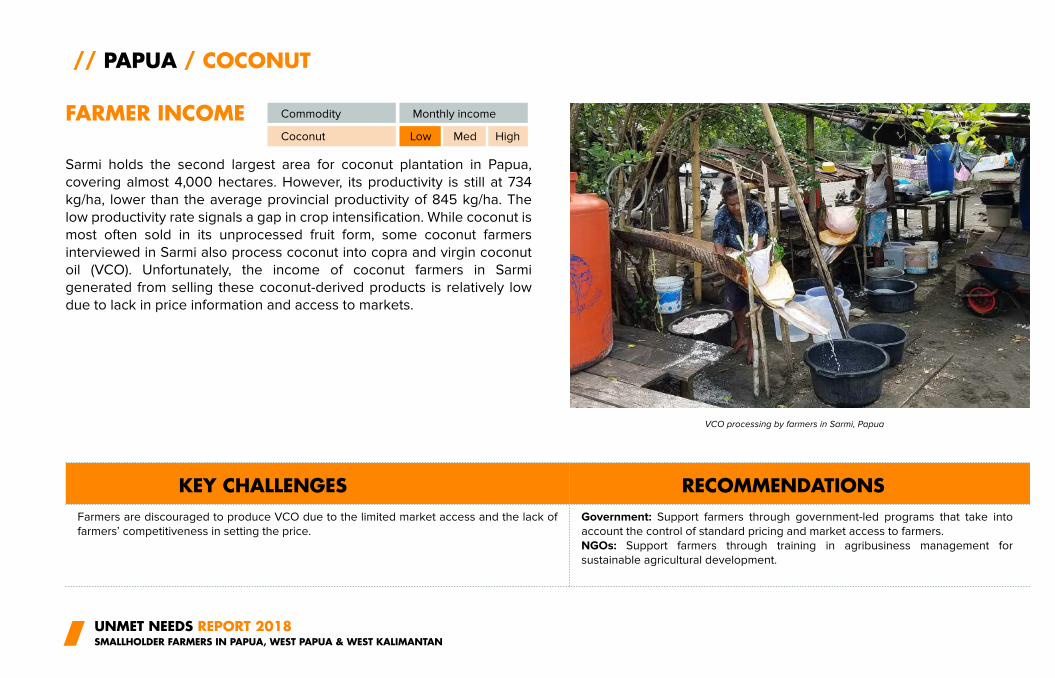
Sarmi holds the second largest area for coconut plantation in Papua,
covering almost 4,000 hectares. However, its productivity is still at 734
kg/ha, lower than the average provincial productivity of 845 kg/ha. The
low productivity rate signals a gap in crop intensification. While coconut is
most often sold in its unprocessed fruit form, some coconut farmers
interviewed in Sarmi also process coconut into copra and virgin coconut
oil (VCO). Unfortunately, the income of coconut farmers in Sarmi
generated from selling these coconut-derived products is relatively low
due to lack in price information and access to markets.
UNMET NEEDS REPORT 2018SMALLHOLDER FARMERS IN PAPUA, WEST PAPUA & WEST KALIMANTAN
// PAPUA / COCONUT
FARMER INCOME
KEY CHALLENGES RECOMMENDATIONS
Commodity
VCO processing by farmers in Sarmi, Papua
Monthly income
Coconut Low Med High
Farmers are discouraged to produce VCO due to the limited market access and the lack of
farmers’ competitiveness in setting the price.
Government: Support farmers through government-led programs that take into
account the control of standard pricing and market access to farmers.
NGOs: Support farmers through training in agribusiness management for
sustainable agricultural development.
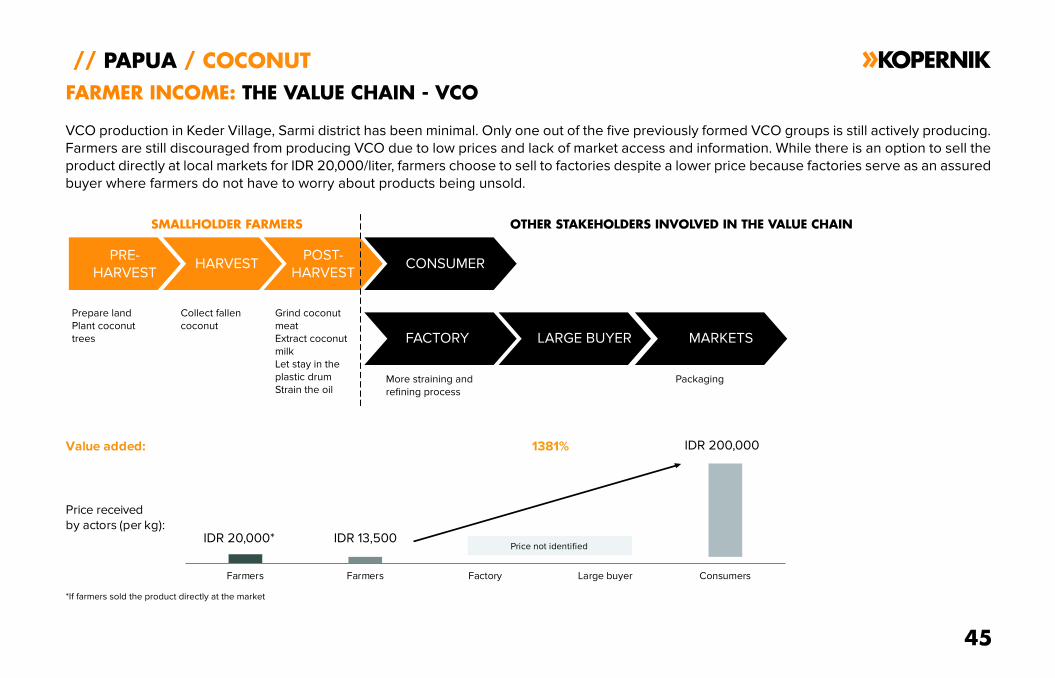
VCO production in Keder Village, Sarmi district has been minimal. Only one out of the five previously formed VCO groups is still actively producing.
Farmers are still discouraged from producing VCO due to low prices and lack of market access and information. While there is an option to sell the
product directly at local markets for IDR 20,000/liter, farmers choose to sell to factories despite a lower price because factories serve as an assured
buyer where farmers do not have to worry about products being unsold.
45
// PAPUA / COCONUT
PRE-
HARVESTHARVEST
POST-
HARVESTCONSUMER
FARMER INCOME: THE VALUE CHAIN - VCO
Prepare land
Plant coconut
trees
Collect fallen
coconut
Grind coconut
meat
Extract coconut
milk
Let stay in the
plastic drum
Strain the oil
SMALLHOLDER FARMERS
FACTORY LARGE BUYER MARKETS
More straining and
refining process
Packaging
Farmers Farmers Factory Large buyer Consumers
IDR 20,000* IDR 13,500
IDR 200,000
Price not identified
Price received
by actors (per kg):
Value added: 1381%
*If farmers sold the product directly at the market
OTHER STAKEHOLDERS INVOLVED IN THE VALUE CHAIN
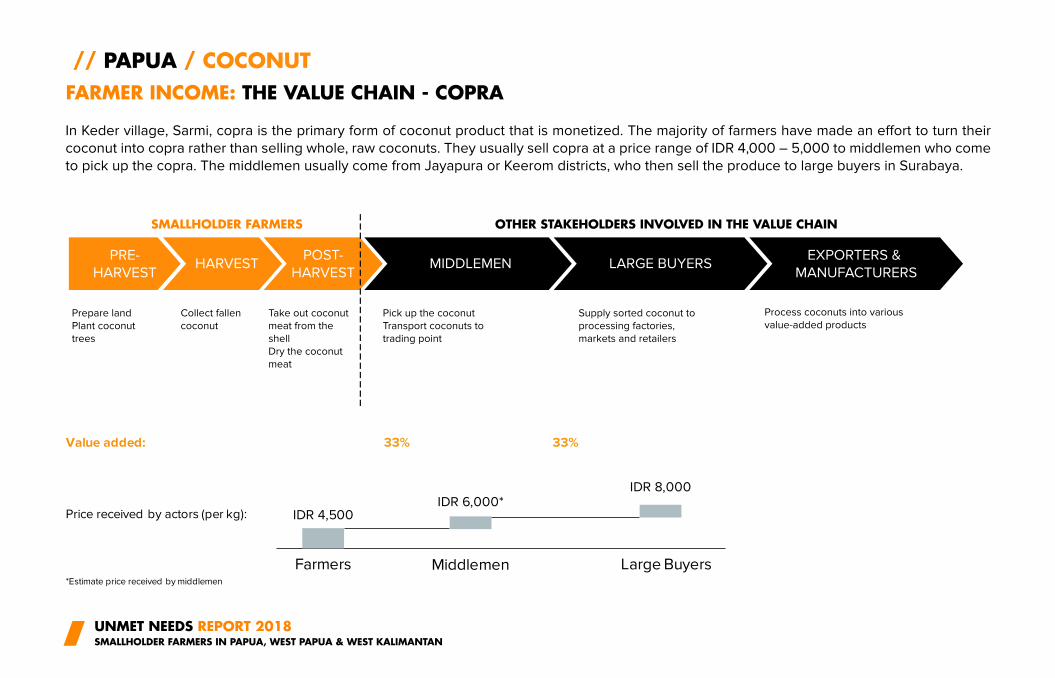
In Keder village, Sarmi, copra is the primary form of coconut product that is monetized. The majority of farmers have made an effort to turn their
coconut into copra rather than selling whole, raw coconuts. They usually sell copra at a price range of IDR 4,000 – 5,000 to middlemen who come
to pick up the copra. The middlemen usually come from Jayapura or Keerom districts, who then sell the produce to large buyers in Surabaya.
UNMET NEEDS REPORT 2018SMALLHOLDER FARMERS IN PAPUA, WEST PAPUA & WEST KALIMANTAN
// PAPUA / COCONUT
PRE-
HARVESTHARVEST
POST-
HARVESTMIDDLEMEN
FARMER INCOME: THE VALUE CHAIN - COPRA
*Estimate price received by middlemen
Price received by actors (per kg):
Value added:
Farmers Large Buyers
IDR 4,500
33%
IDR 6,000*IDR 8,000
Middlemen
33%
LARGE BUYERSEXPORTERS &
MANUFACTURERS
Prepare land
Plant coconut
trees
Collect fallen
coconut
Take out coconut
meat from the
shell
Dry the coconut
meat
SMALLHOLDER FARMERS OTHER STAKEHOLDERS INVOLVED IN THE VALUE CHAIN
Pick up the coconut
Transport coconuts to
trading point
Supply sorted coconut to
processing factories,
markets and retailers
Process coconuts into various
value-added products
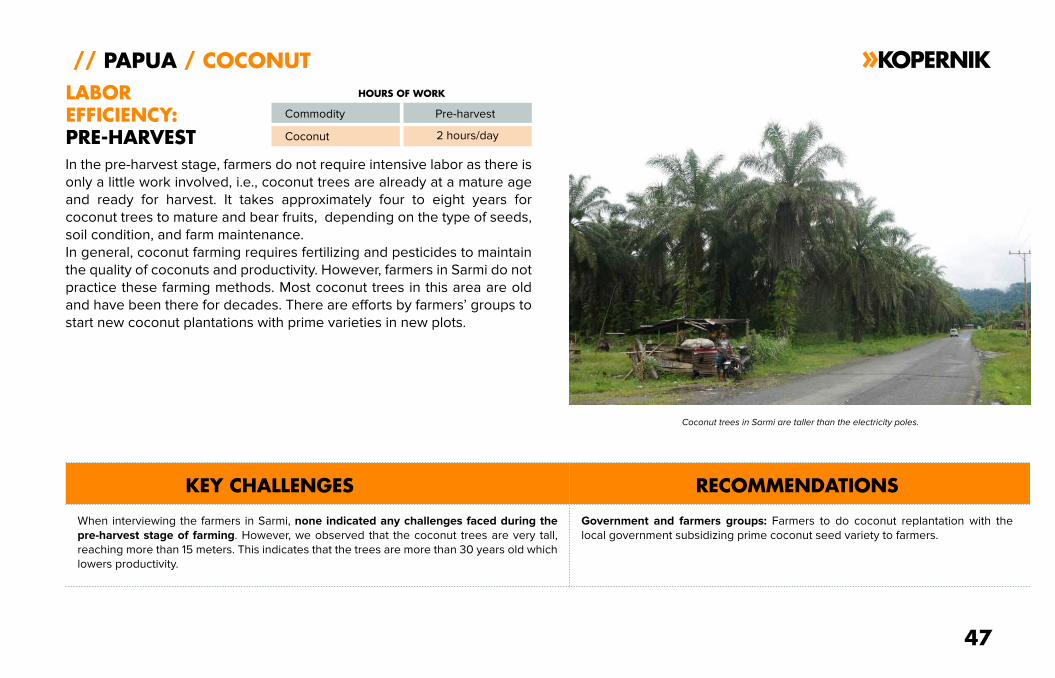
In the pre-harvest stage, farmers do not require intensive labor as there is
only a little work involved, i.e., coconut trees are already at a mature age
and ready for harvest. It takes approximately four to eight years for
coconut trees to mature and bear fruits, depending on the type of seeds,
soil condition, and farm maintenance.
In general, coconut farming requires fertilizing and pesticides to maintain
the quality of coconuts and productivity. However, farmers in Sarmi do not
practice these farming methods. Most coconut trees in this area are old
and have been there for decades. There are efforts by farmers’ groups to
start new coconut plantations with prime varieties in new plots.
47
// PAPUA / COCONUT
LABOR
EFFICIENCY:
PRE-HARVEST
KEY CHALLENGES RECOMMENDATIONS
Commodity
Coconut trees in Sarmi are taller than the electricity poles.
Coconut
When interviewing the farmers in Sarmi, none indicated any challenges faced during the
pre-harvest stage of farming. However, we observed that the coconut trees are very tall,
reaching more than 15 meters. This indicates that the trees are more than 30 years old which
lowers productivity.
Government and farmers groups: Farmers to do coconut replantation with the
local government subsidizing prime coconut seed variety to farmers.
Pre-harvest
2 hours/day
HOURS OF WORK
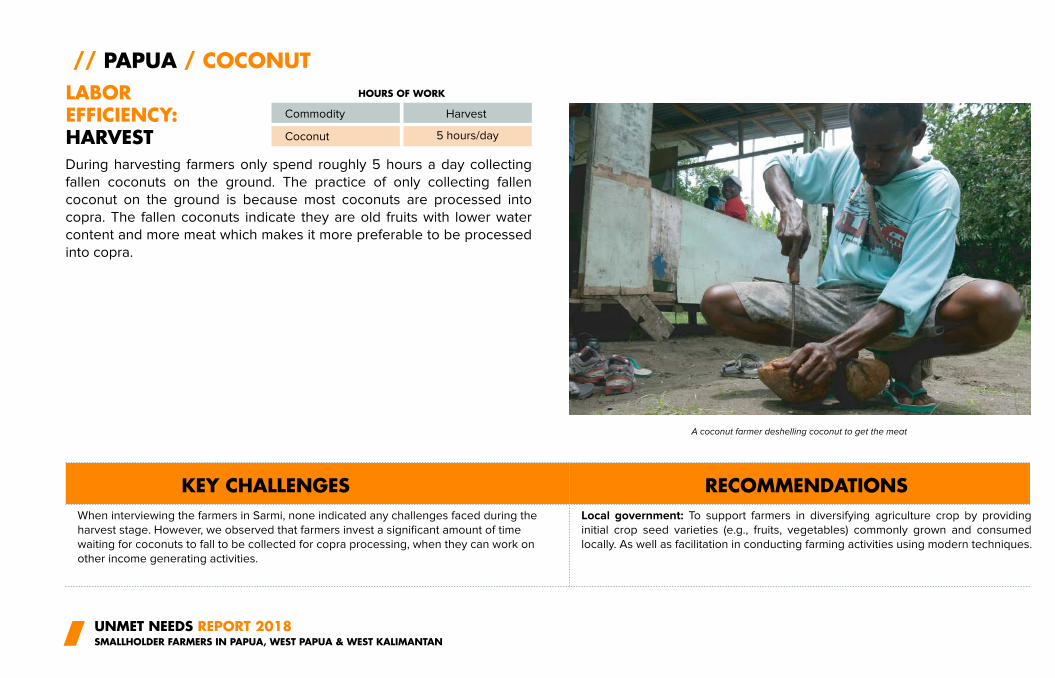
During harvesting farmers only spend roughly 5 hours a day collecting
fallen coconuts on the ground. The practice of only collecting fallen
coconut on the ground is because most coconuts are processed into
copra. The fallen coconuts indicate they are old fruits with lower water
content and more meat which makes it more preferable to be processed
into copra.
UNMET NEEDS REPORT 2018SMALLHOLDER FARMERS IN PAPUA, WEST PAPUA & WEST KALIMANTAN
// PAPUA / COCONUT
LABOREFFICIENCY:HARVEST
KEY CHALLENGES RECOMMENDATIONS
Commodity
A coconut farmer deshelling coconut to get the meat
Coconut
When interviewing the farmers in Sarmi, none indicated any challenges faced during the
harvest stage. However, we observed that farmers invest a significant amount of time
waiting for coconuts to fall to be collected for copra processing, when they can work on
other income generating activities.
Local government: To support farmers in diversifying agriculture crop by providing
initial crop seed varieties (e.g., fruits, vegetables) commonly grown and consumed
locally. As well as facilitation in conducting farming activities using modern techniques.
HOURS OF WORK
Harvest
5 hours/day
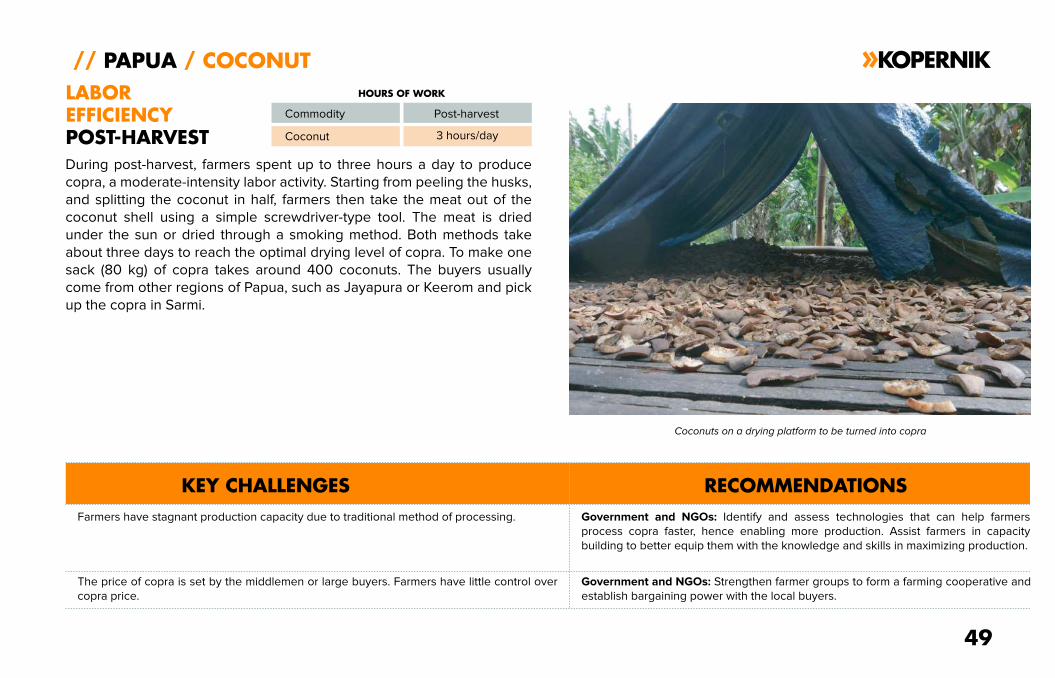
During post-harvest, farmers spent up to three hours a day to produce
copra, a moderate-intensity labor activity. Starting from peeling the husks,
and splitting the coconut in half, farmers then take the meat out of the
coconut shell using a simple screwdriver-type tool. The meat is dried
under the sun or dried through a smoking method. Both methods take
about three days to reach the optimal drying level of copra. To make one
sack (80 kg) of copra takes around 400 coconuts. The buyers usually
come from other regions of Papua, such as Jayapura or Keerom and pick
up the copra in Sarmi.
49
// PAPUA / COCONUT
LABOR
EFFICIENCY
POST-HARVEST
KEY CHALLENGES RECOMMENDATIONS
Commodity
Coconuts on a drying platform to be turned into copra
Coconut
Farmers have stagnant production capacity due to traditional method of processing. Government and NGOs: Identify and assess technologies that can help farmers
process copra faster, hence enabling more production. Assist farmers in capacity
building to better equip them with the knowledge and skills in maximizing production.
The price of copra is set by the middlemen or large buyers. Farmers have little control over
copra price.
Government and NGOs: Strengthen farmer groups to form a farming cooperative and
establish bargaining power with the local buyers.
Post-harvest
HOURS OF WORK
3 hours/day
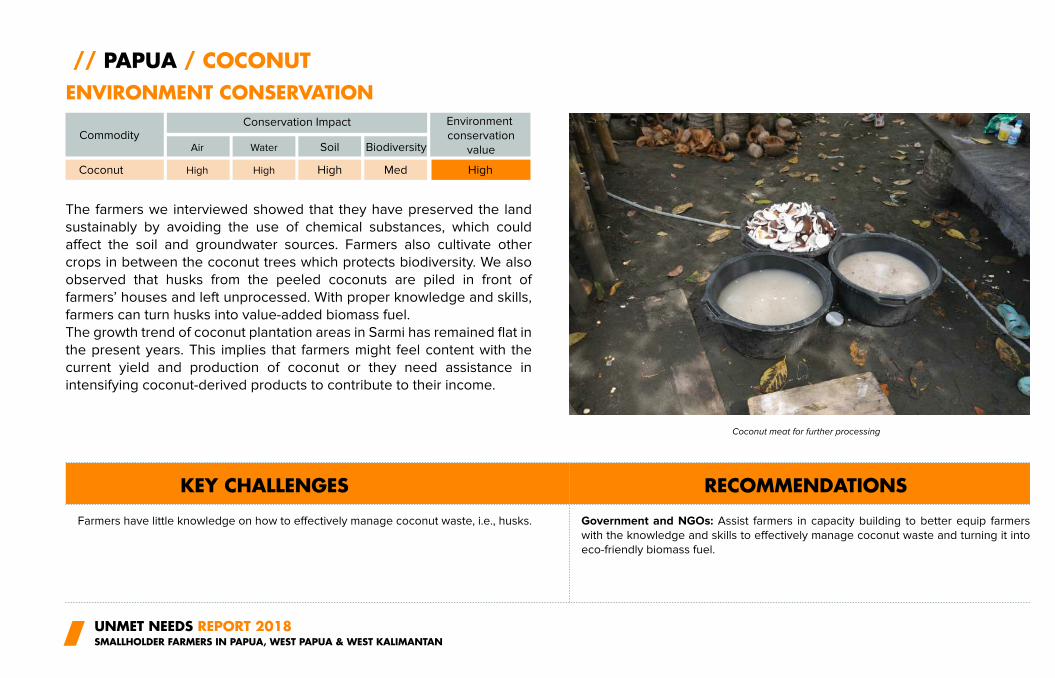
The farmers we interviewed showed that they have preserved the land
sustainably by avoiding the use of chemical substances, which could
affect the soil and groundwater sources. Farmers also cultivate other
crops in between the coconut trees which protects biodiversity. We also
observed that husks from the peeled coconuts are piled in front of
farmers’ houses and left unprocessed. With proper knowledge and skills,
farmers can turn husks into value-added biomass fuel.
The growth trend of coconut plantation areas in Sarmi has remained flat in
the present years. This implies that farmers might feel content with the
current yield and production of coconut or they need assistance in
intensifying coconut-derived products to contribute to their income.
UNMET NEEDS REPORT 2018SMALLHOLDER FARMERS IN PAPUA, WEST PAPUA & WEST KALIMANTAN
// PAPUA / COCONUT
ENVIRONMENT CONSERVATION
KEY CHALLENGES RECOMMENDATIONS
Commodity
Coconut High
Farmers have little knowledge on how to effectively manage coconut waste, i.e., husks. Government and NGOs: Assist farmers in capacity building to better equip farmers
with the knowledge and skills to effectively manage coconut waste and turning it into
eco-friendly biomass fuel.
Conservation Impact
High High Med High
Air Water Soil Biodiversity
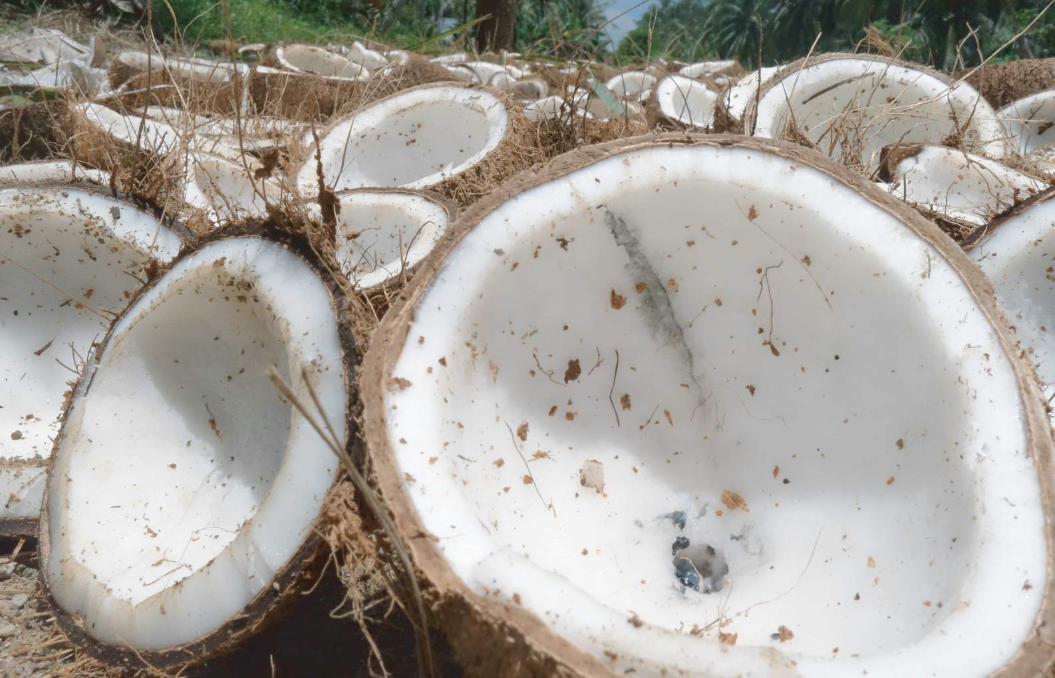
Coconut meat for further processing
Environment
conservation
value
WEST PAPUADEMOGRAPHIC OVERVIEW
PALM
SWIDDEN RICE
SWEET POTATO
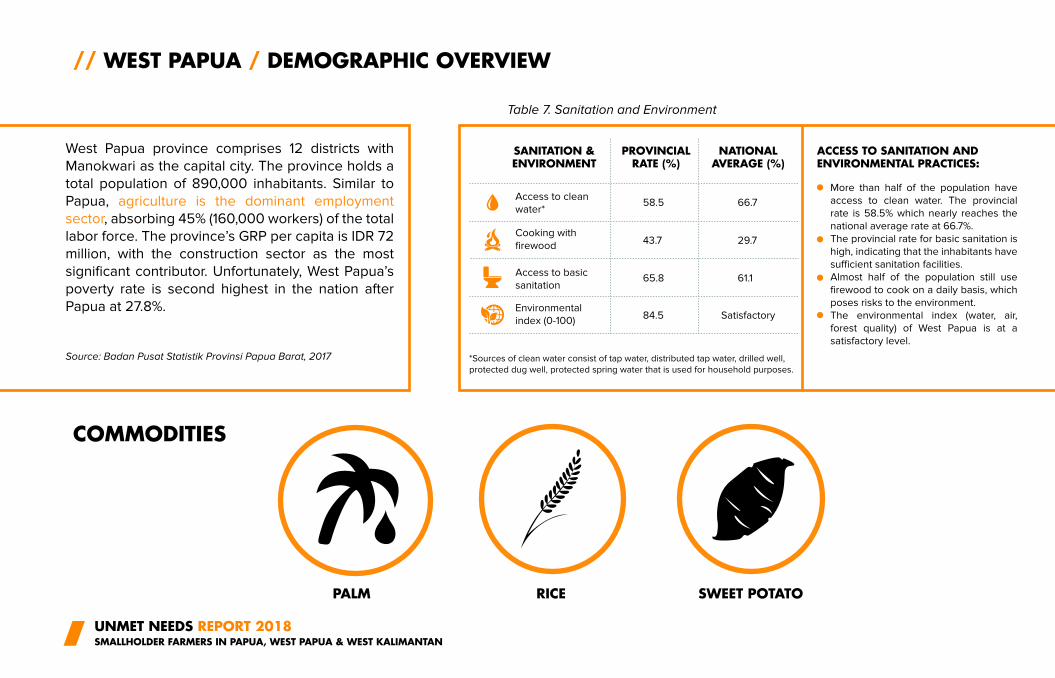
Table 7. Sanitation and Environment
*Sources of clean water consist of tap water, distributed tap water, drilled well,
protected dug well, protected spring water that is used for household purposes.
SANITATION &ENVIRONMENT
ACCESS TO SANITATION AND ENVIRONMENTAL PRACTICES:
PROVINCIALRATE (%)
NATIONALAVERAGE (%)
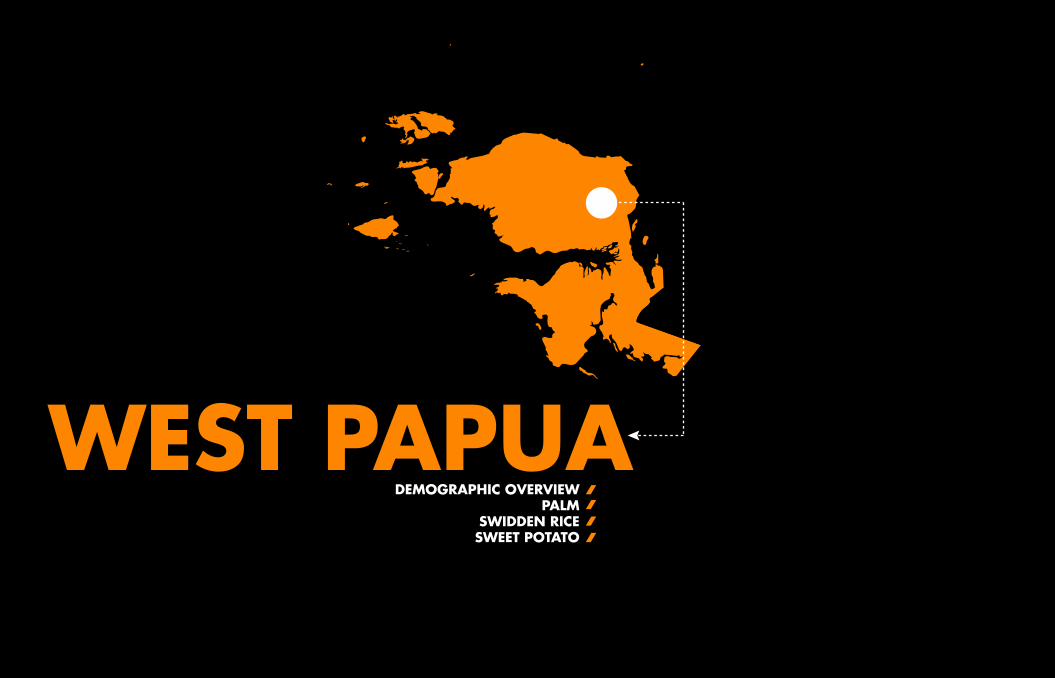
West Papua province comprises 12 districts with
Manokwari as the capital city. The province holds a
total population of 890,000 inhabitants. Similar to
Papua, agriculture is the dominant employment
sector, absorbing 45% (160,000 workers) of the total
labor force. The province’s GRP per capita is IDR 72
million, with the construction sector as the most
significant contributor. Unfortunately, West Papua’s
poverty rate is second highest in the nation after
Papua at 27.8%.
More than half of the population have
access to clean water. The provincial
rate is 58.5% which nearly reaches the
national average rate at 66.7%.
The provincial rate for basic sanitation is
high, indicating that the inhabitants have
sufficient sanitation facilities.
Almost half of the population still use
firewood to cook on a daily basis, which
poses risks to the environment.
The environmental index (water, air,
forest quality) of West Papua is at a
satisfactory level.
COMMODITIES
PALM RICE SWEET POTATO
Access to clean
water*58.5
43.7
65.8
84.5
66.7
29.7
61.1
Satisfactory
Cooking with
firewood
Access to basic
sanitation
Environmental
index (0-100)
UNMET NEEDS REPORT 2018SMALLHOLDER FARMERS IN PAPUA, WEST PAPUA & WEST KALIMANTAN
// WEST PAPUA / DEMOGRAPHIC OVERVIEW
Source: Badan Pusat Statistik Provinsi Papua Barat, 2017
53
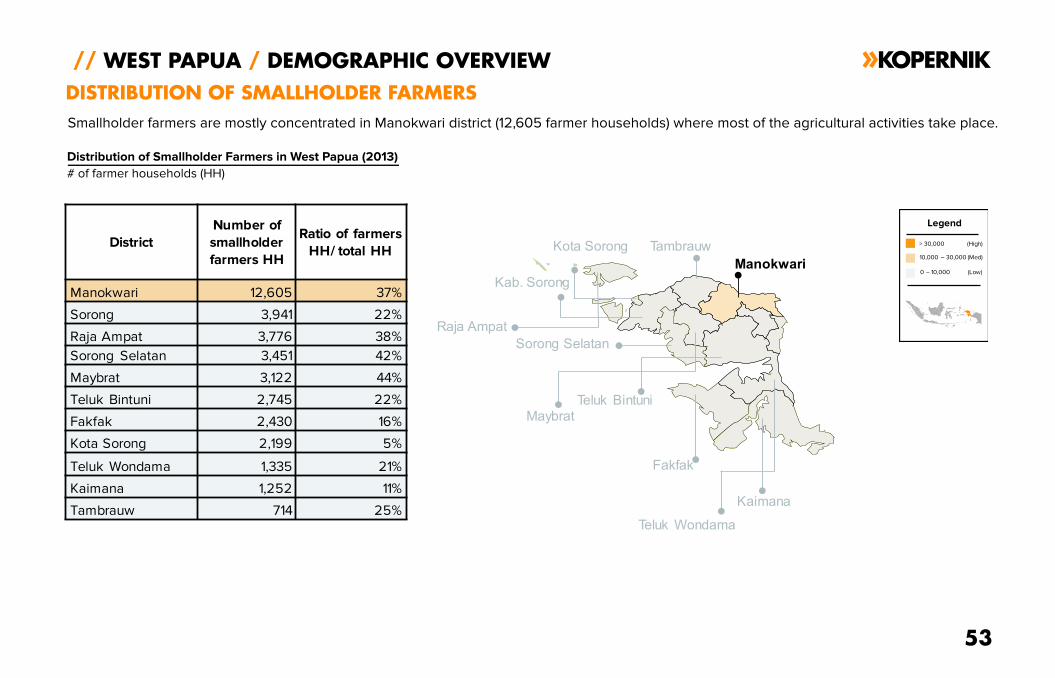
// WEST PAPUA / DEMOGRAPHIC OVERVIEW
DISTRIBUTION OF SMALLHOLDER FARMERS
Distribution of Smallholder Farmers in West Papua (2013)
# of farmer households (HH)
Smallholder farmers are mostly concentrated in Manokwari district (12,605 farmer households) where most of the agricultural activities take place.
Manokwari
Kaimana
Kab. Sorong
Sorong Selatan
Fakfak
Maybrat
Teluk Wondama
Teluk Bintuni
Raja Ampat
TambrauwKota SorongDistrict
Number of
smallholder
farmers HH
Ratio of farmers
HH/ total HH
Manokwari 12,605 37%
Sorong 3,941 22%
Raja Ampat 3,776 38%
Sorong Selatan 3,451 42%
Maybrat 3,122 44%
Teluk Bintuni 2,745 22%
Fakfak 2,430 16%
Kota Sorong 2,199 5%
Teluk Wondama 1,335 21%
Kaimana 1,252 11%
Tambrauw 714 25%
0 – 10,000 (Low)
10,000 – 30,000 (Med)
> 30,000 (High)
Legend
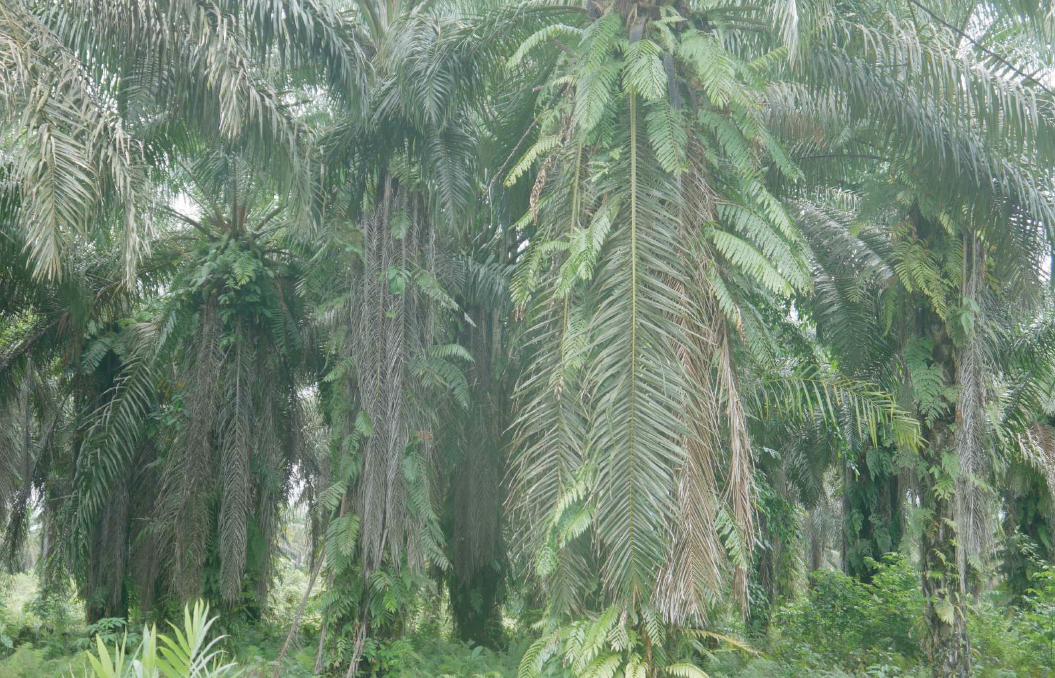
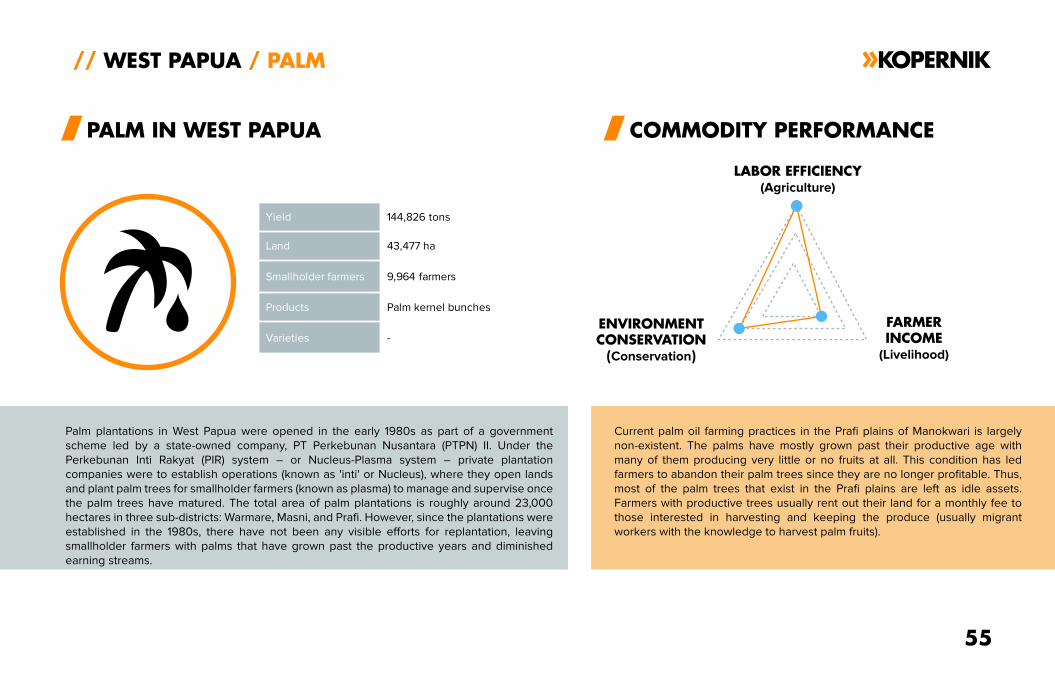
Palm plantations in West Papua were opened in the early 1980s as part of a government
scheme led by a state-owned company, PT Perkebunan Nusantara (PTPN) II. Under the
Perkebunan Inti Rakyat (PIR) system – or Nucleus-Plasma system – private plantation
companies were to establish operations (known as 'inti' or Nucleus), where they open lands
and plant palm trees for smallholder farmers (known as plasma) to manage and supervise once
the palm trees have matured. The total area of palm plantations is roughly around 23,000
hectares in three sub-districts: Warmare, Masni, and Prafi. However, since the plantations were
established in the 1980s, there have not been any visible efforts for replantation, leaving
smallholder farmers with palms that have grown past the productive years and diminished
earning streams.
Current palm oil farming practices in the Prafi plains of Manokwari is largely
non-existent. The palms have mostly grown past their productive age with
many of them producing very little or no fruits at all. This condition has led
farmers to abandon their palm trees since they are no longer profitable. Thus,
most of the palm trees that exist in the Prafi plains are left as idle assets.
Farmers with productive trees usually rent out their land for a monthly fee to
those interested in harvesting and keeping the produce (usually migrant
workers with the knowledge to harvest palm fruits).
55
// WEST PAPUA / PALM
PALM IN WEST PAPUA COMMODITY PERFORMANCE
LABOR EFFICIENCY(Agriculture)
ENVIRONMENTCONSERVATION
(Conservation)
FARMERINCOME
(Livelihood)
Yield 144,826 tons
Land 43,477 ha
Smallholder farmers 9,964 farmers
Products Palm kernel bunches
Varieties -
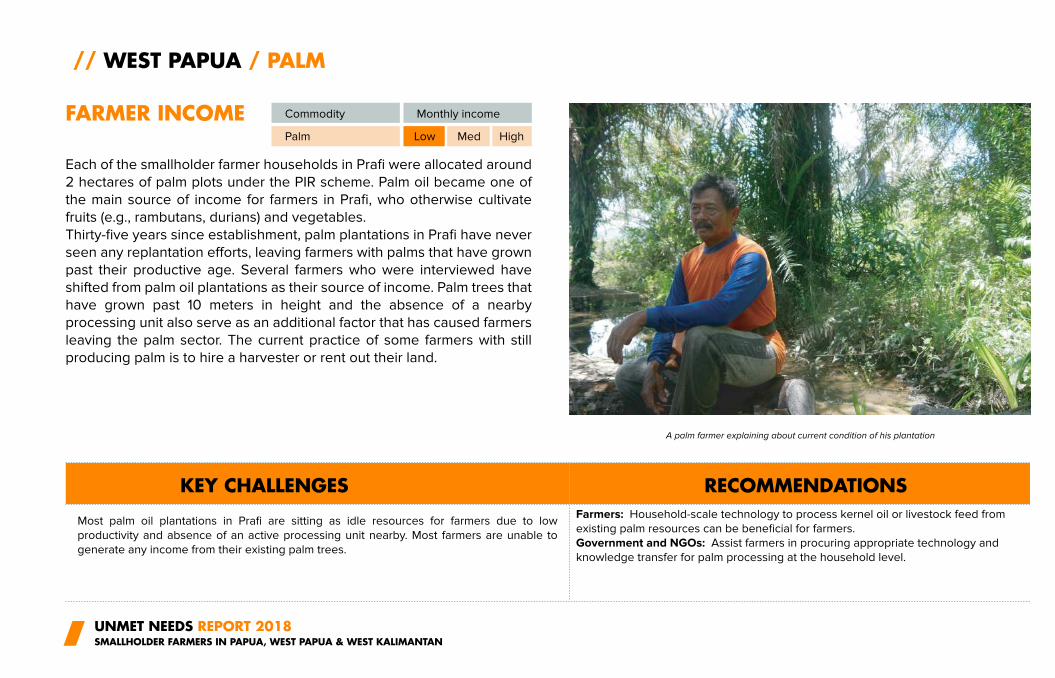
Each of the smallholder farmer households in Prafi were allocated around
2 hectares of palm plots under the PIR scheme. Palm oil became one of
the main source of income for farmers in Prafi, who otherwise cultivate
fruits (e.g., rambutans, durians) and vegetables.
Thirty-five years since establishment, palm plantations in Prafi have never
seen any replantation efforts, leaving farmers with palms that have grown
past their productive age. Several farmers who were interviewed have
shifted from palm oil plantations as their source of income. Palm trees that
have grown past 10 meters in height and the absence of a nearby
processing unit also serve as an additional factor that has caused farmers
leaving the palm sector. The current practice of some farmers with still
producing palm is to hire a harvester or rent out their land.
UNMET NEEDS REPORT 2018SMALLHOLDER FARMERS IN PAPUA, WEST PAPUA & WEST KALIMANTAN
// WEST PAPUA / PALM
FARMER INCOME
KEY CHALLENGES RECOMMENDATIONS
Commodity Monthly income
Palm Low Med High
Most palm oil plantations in Prafi are sitting as idle resources for farmers due to low
productivity and absence of an active processing unit nearby. Most farmers are unable to
generate any income from their existing palm trees.
Farmers: Household-scale technology to process kernel oil or livestock feed from
existing palm resources can be beneficial for farmers.
Government and NGOs: Assist farmers in procuring appropriate technology and
knowledge transfer for palm processing at the household level.
A palm farmer explaining about current condition of his plantation
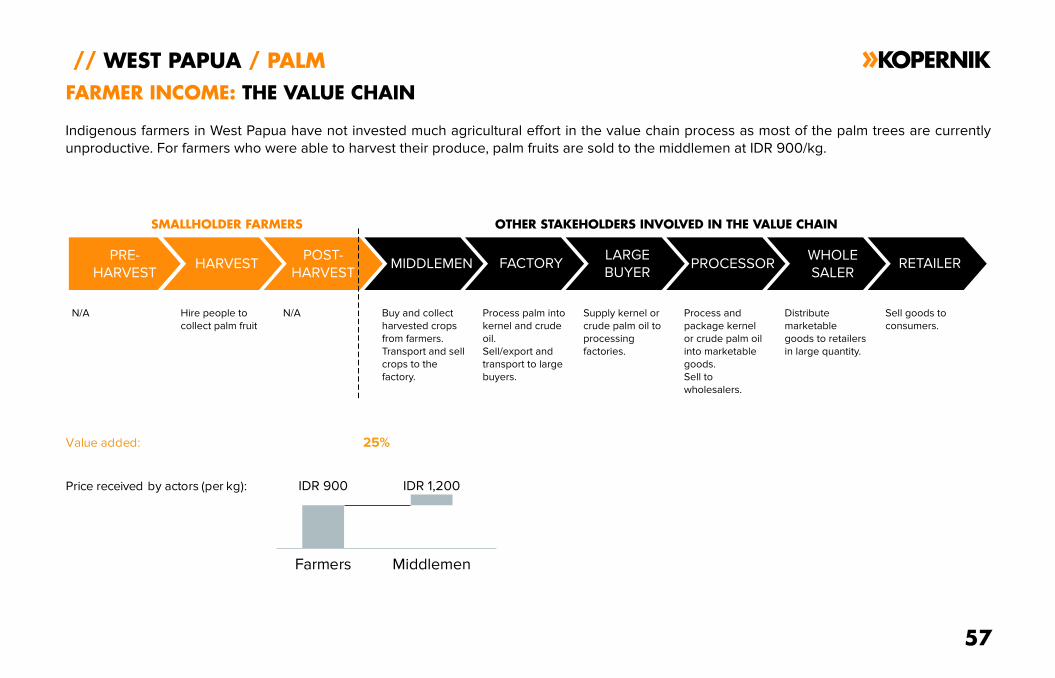
Indigenous farmers in West Papua have not invested much agricultural effort in the value chain process as most of the palm trees are currently
unproductive. For farmers who were able to harvest their produce, palm fruits are sold to the middlemen at IDR 900/kg.
PRE-
HARVESTHARVEST
POST-
HARVESTLARGE BUYERS
FARMER INCOME: THE VALUE CHAIN
Price received by actors (per kg):
Value added:
Farmers
IDR 900
25%
IDR 1,200
Middlemen
N/A Hire people to
collect palm fruit
N/A
SMALLHOLDER FARMERS OTHER STAKEHOLDERS INVOLVED IN THE VALUE CHAIN
CONSUMERS
Buy and collect
harvested crops
from farmers.
Transport and sell
crops to the
factory.
Process palm into
kernel and crude
oil.
Sell/export and
transport to large
buyers.
Supply kernel or
crude palm oil to
processing
factories.
Process and
package kernel
or crude palm oil
into marketable
goods.
Sell to
wholesalers.
Distribute
marketable
goods to retailers
in large quantity.
Sell goods to
consumers.
PRE-
HARVESTHARVEST
POST-
HARVESTMIDDLEMEN FACTORY
LARGE
BUYERPROCESSOR
WHOLE
SALERRETAILER
57
// WEST PAPUA / PALM
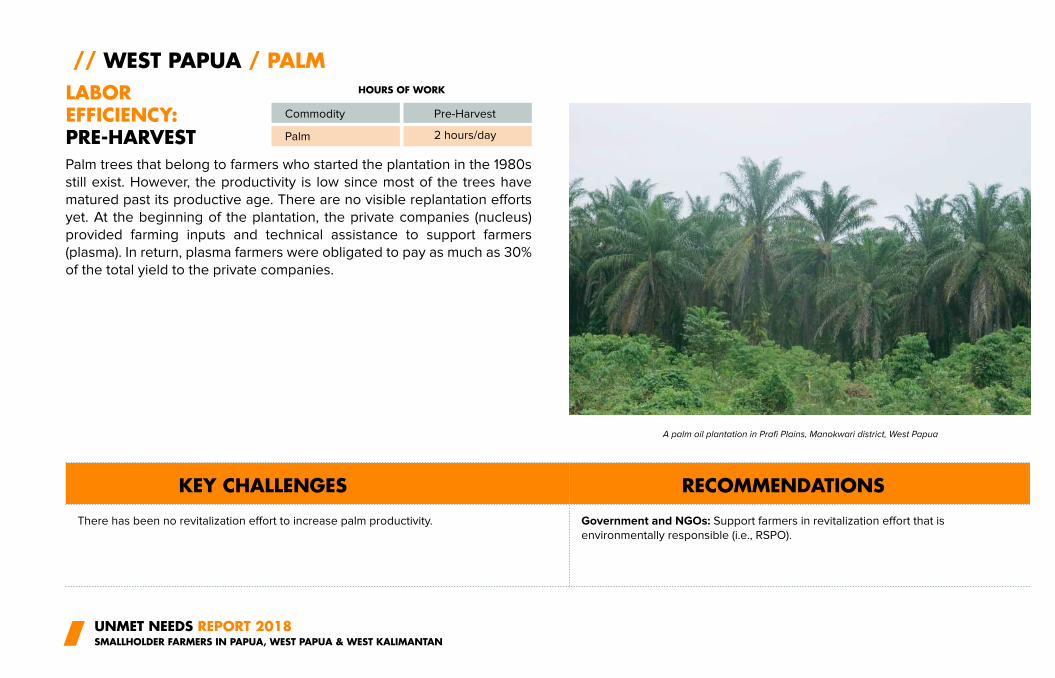
Palm trees that belong to farmers who started the plantation in the 1980s
still exist. However, the productivity is low since most of the trees have
matured past its productive age. There are no visible replantation efforts
yet. At the beginning of the plantation, the private companies (nucleus)
provided farming inputs and technical assistance to support farmers
(plasma). In return, plasma farmers were obligated to pay as much as 30%
of the total yield to the private companies.
UNMET NEEDS REPORT 2018SMALLHOLDER FARMERS IN PAPUA, WEST PAPUA & WEST KALIMANTAN
// WEST PAPUA / PALM
LABOR EFFICIENCY:PRE-HARVEST
KEY CHALLENGES RECOMMENDATIONS
Commodity
A palm oil plantation in Prafi Plains, Manokwari district, West Papua
Pre-Harvest
Palm
There has been no revitalization effort to increase palm productivity. Government and NGOs: Support farmers in revitalization effort that is
environmentally responsible (i.e., RSPO).
HOURS OF WORK
2 hours/day
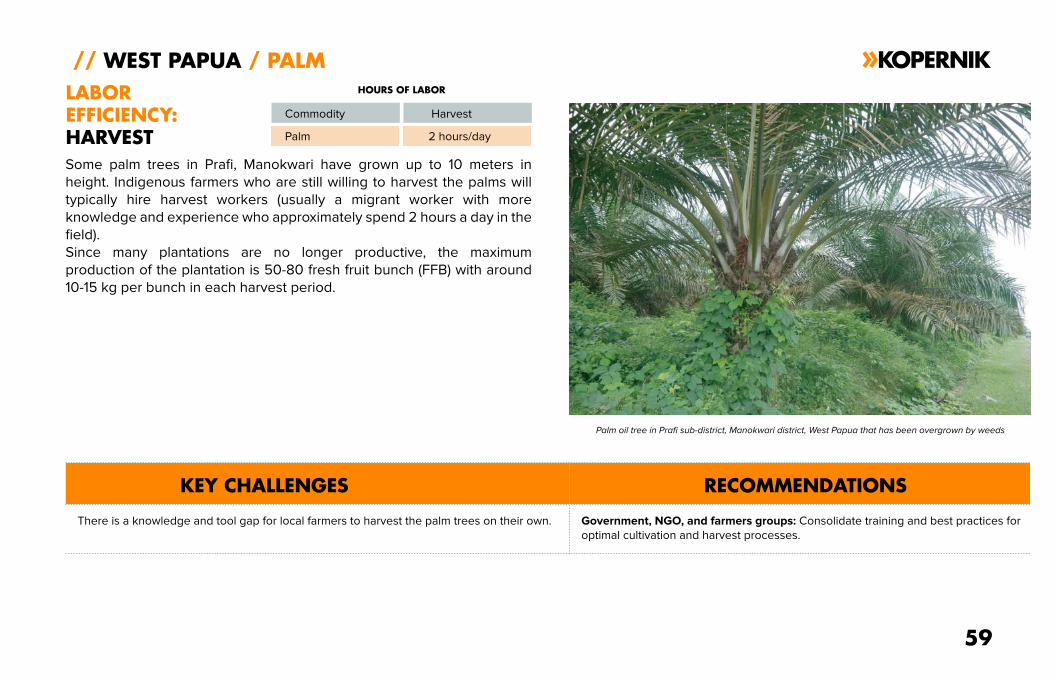
Some palm trees in Prafi, Manokwari have grown up to 10 meters in
height. Indigenous farmers who are still willing to harvest the palms will
typically hire harvest workers (usually a migrant worker with more
knowledge and experience who approximately spend 2 hours a day in the
field).
Since many plantations are no longer productive, the maximum
production of the plantation is 50-80 fresh fruit bunch (FFB) with around
10-15 kg per bunch in each harvest period.
// WEST PAPUA / PALM
LABOR
EFFICIENCY:
HARVEST
KEY CHALLENGES RECOMMENDATIONS
Commodity
Palm oil tree in Prafi sub-district, Manokwari district, West Papua that has been overgrown by weeds
Harvest
Palm
There is a knowledge and tool gap for local farmers to harvest the palm trees on their own. Government, NGO, and farmers groups: Consolidate training and best practices for
optimal cultivation and harvest processes.
HOURS OF LABOR
2 hours/day
59
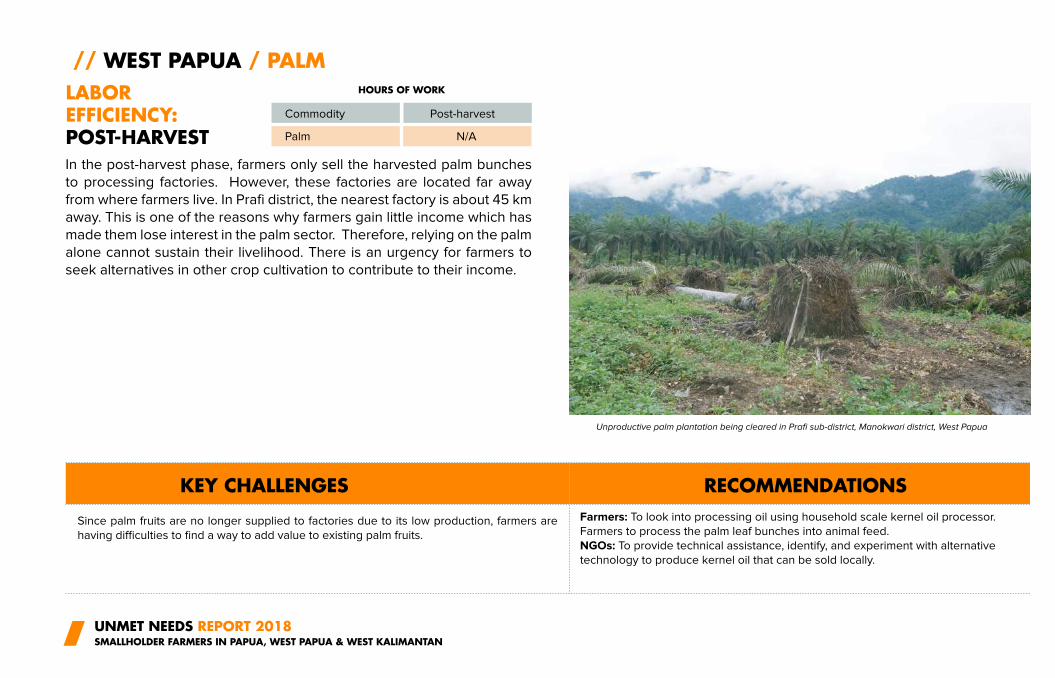
In the post-harvest phase, farmers only sell the harvested palm bunches
to processing factories. However, these factories are located far away
from where farmers live. In Prafi district, the nearest factory is about 45 km
away. This is one of the reasons why farmers gain little income which has
made them lose interest in the palm sector. Therefore, relying on the palm
alone cannot sustain their livelihood. There is an urgency for farmers to
seek alternatives in other crop cultivation to contribute to their income.
UNMET NEEDS REPORT 2018SMALLHOLDER FARMERS IN PAPUA, WEST PAPUA & WEST KALIMANTAN
// WEST PAPUA / PALM
LABOR EFFICIENCY:POST-HARVEST
KEY CHALLENGES RECOMMENDATIONS
Commodity
Unproductive palm plantation being cleared in Prafi sub-district, Manokwari district, West Papua
Post-harvest
Palm
Since palm fruits are no longer supplied to factories due to its low production, farmers are
having difficulties to find a way to add value to existing palm fruits.
Farmers: To look into processing oil using household scale kernel oil processor.
Farmers to process the palm leaf bunches into animal feed.
NGOs: To provide technical assistance, identify, and experiment with alternative
technology to produce kernel oil that can be sold locally.
HOURS OF WORK
N/A
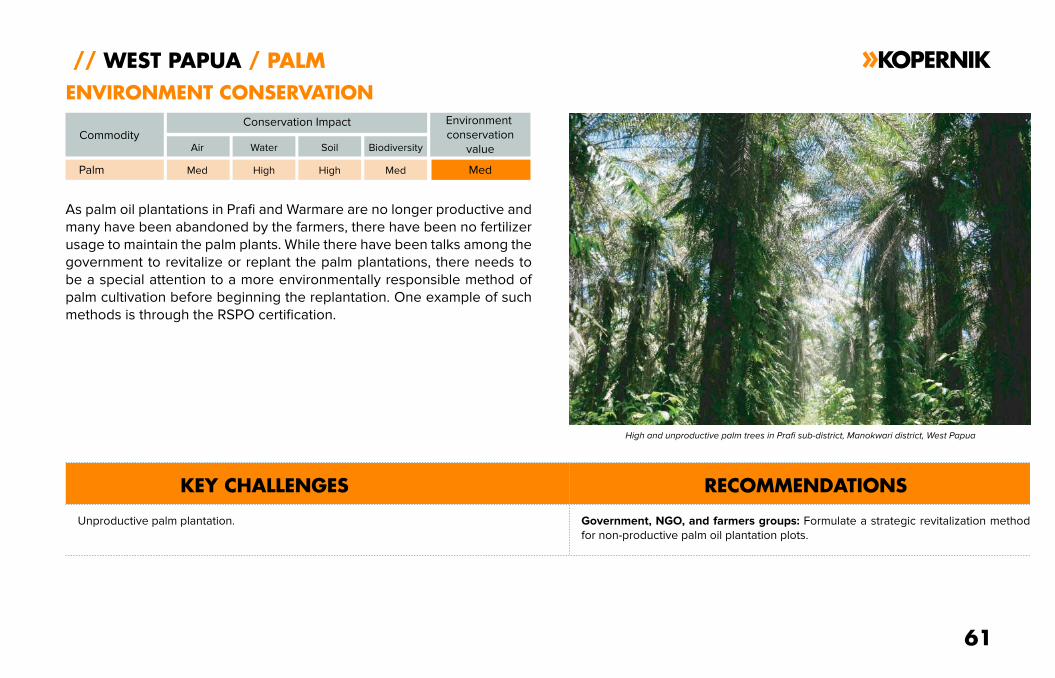
As palm oil plantations in Prafi and Warmare are no longer productive and
many have been abandoned by the farmers, there have been no fertilizer
usage to maintain the palm plants. While there have been talks among the
government to revitalize or replant the palm plantations, there needs to
be a special attention to a more environmentally responsible method of
palm cultivation before beginning the replantation. One example of such
methods is through the RSPO certification.
// WEST PAPUA / PALM
ENVIRONMENT CONSERVATION
KEY CHALLENGES RECOMMENDATIONS
Commodity
High and unproductive palm trees in Prafi sub-district, Manokwari district, West Papua
Palm Med
Unproductive palm plantation. Government, NGO, and farmers groups: Formulate a strategic revitalization method
for non-productive palm oil plantation plots.
Conservation Impact
High High Med Med
Air Water Soil Biodiversity
Environment
conservation
value
61
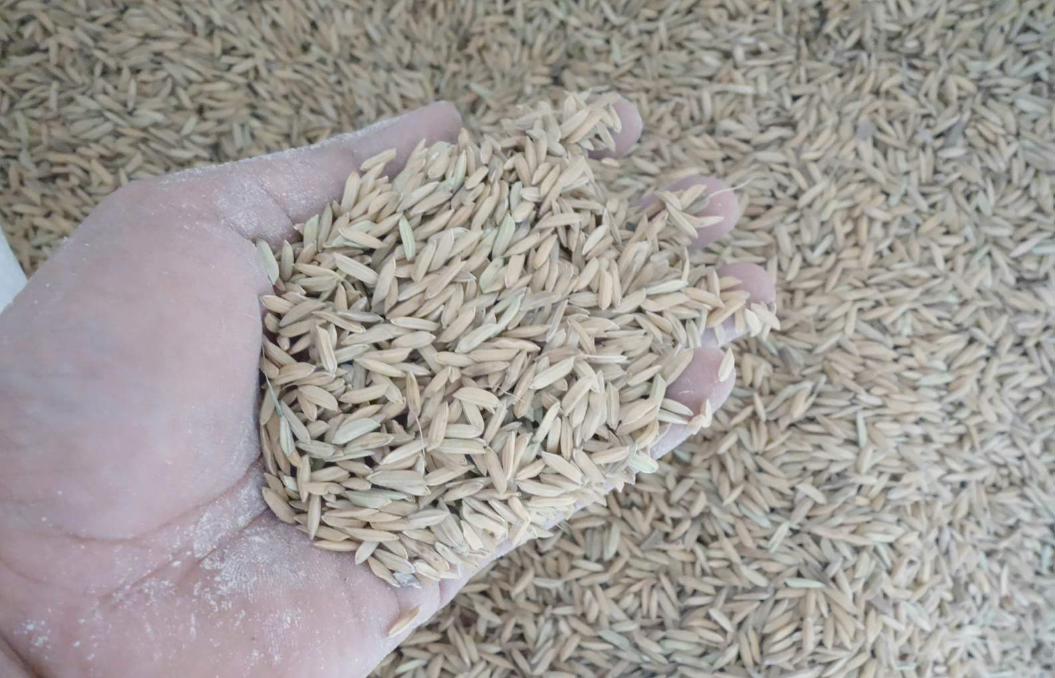
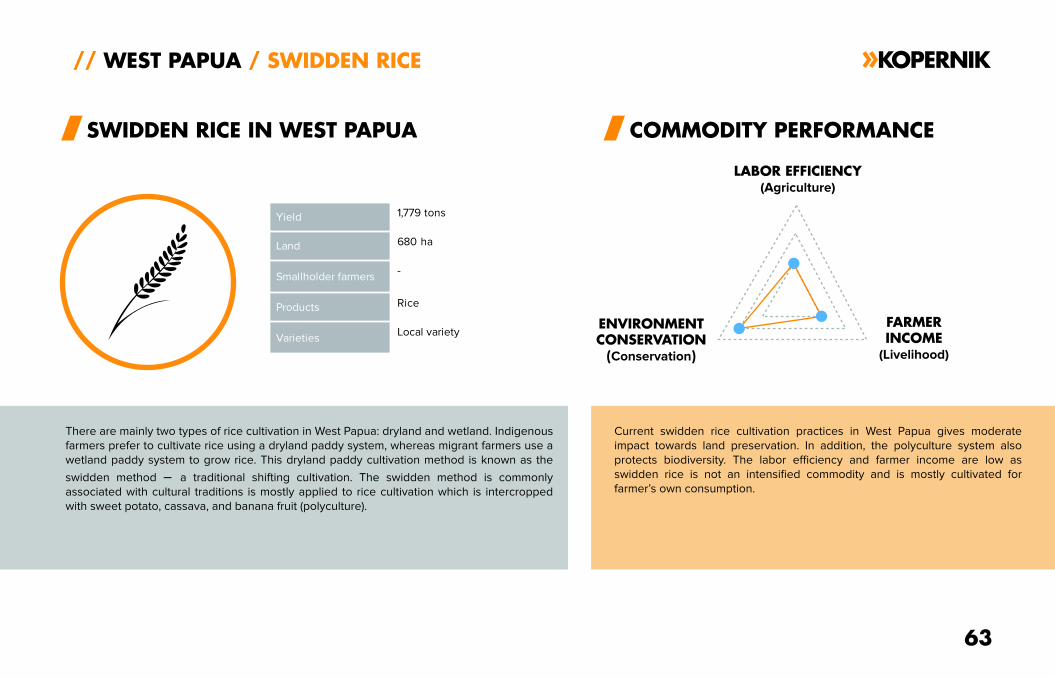
There are mainly two types of rice cultivation in West Papua: dryland and wetland. Indigenous
farmers prefer to cultivate rice using a dryland paddy system, whereas migrant farmers use a
wetland paddy system to grow rice. This dryland paddy cultivation method is known as the
swidden method – a traditional shifting cultivation. The swidden method is commonly
associated with cultural traditions is mostly applied to rice cultivation which is intercropped
with sweet potato, cassava, and banana fruit (polyculture).
Current swidden rice cultivation practices in West Papua gives moderate
impact towards land preservation. In addition, the polyculture system also
protects biodiversity. The labor efficiency and farmer income are low as
swidden rice is not an intensified commodity and is mostly cultivated for
farmer’s own consumption.
63
// WEST PAPUA / SWIDDEN RICE
SWIDDEN RICE IN WEST PAPUA COMMODITY PERFORMANCE
LABOR EFFICIENCY(Agriculture)
ENVIRONMENTCONSERVATION
(Conservation)
FARMERINCOME
(Livelihood)
Yield 1,779 tons
Land 680 ha
Smallholder farmers-
Products Rice
VarietiesLocal variety
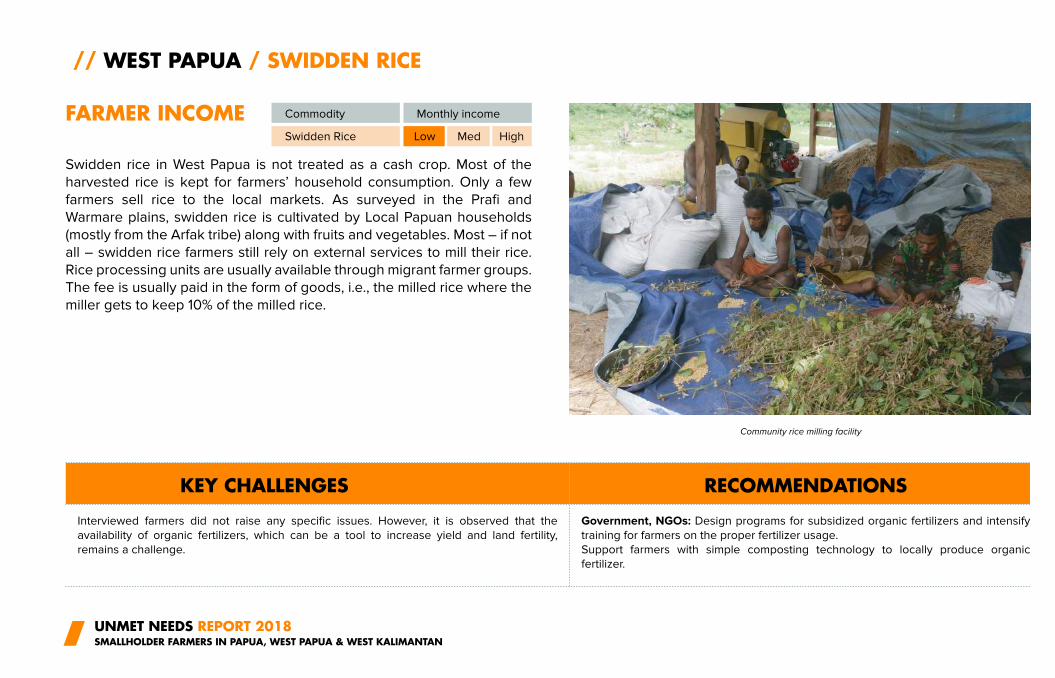
Swidden rice in West Papua is not treated as a cash crop. Most of the
harvested rice is kept for farmers’ household consumption. Only a few
farmers sell rice to the local markets. As surveyed in the Prafi and
Warmare plains, swidden rice is cultivated by Local Papuan households
(mostly from the Arfak tribe) along with fruits and vegetables. Most – if not
all – swidden rice farmers still rely on external services to mill their rice.
Rice processing units are usually available through migrant farmer groups.
The fee is usually paid in the form of goods, i.e., the milled rice where the
miller gets to keep 10% of the milled rice.
UNMET NEEDS REPORT 2018SMALLHOLDER FARMERS IN PAPUA, WEST PAPUA & WEST KALIMANTAN
// WEST PAPUA / SWIDDEN RICE
FARMER INCOME
KEY CHALLENGES RECOMMENDATIONS
Commodity
Community rice milling facility
Monthly income
Swidden Rice Low Med High
Interviewed farmers did not raise any specific issues. However, it is observed that the
availability of organic fertilizers, which can be a tool to increase yield and land fertility,
remains a challenge.
Government, NGOs: Design programs for subsidized organic fertilizers and intensify
training for farmers on the proper fertilizer usage.
Support farmers with simple composting technology to locally produce organic
fertilizer.
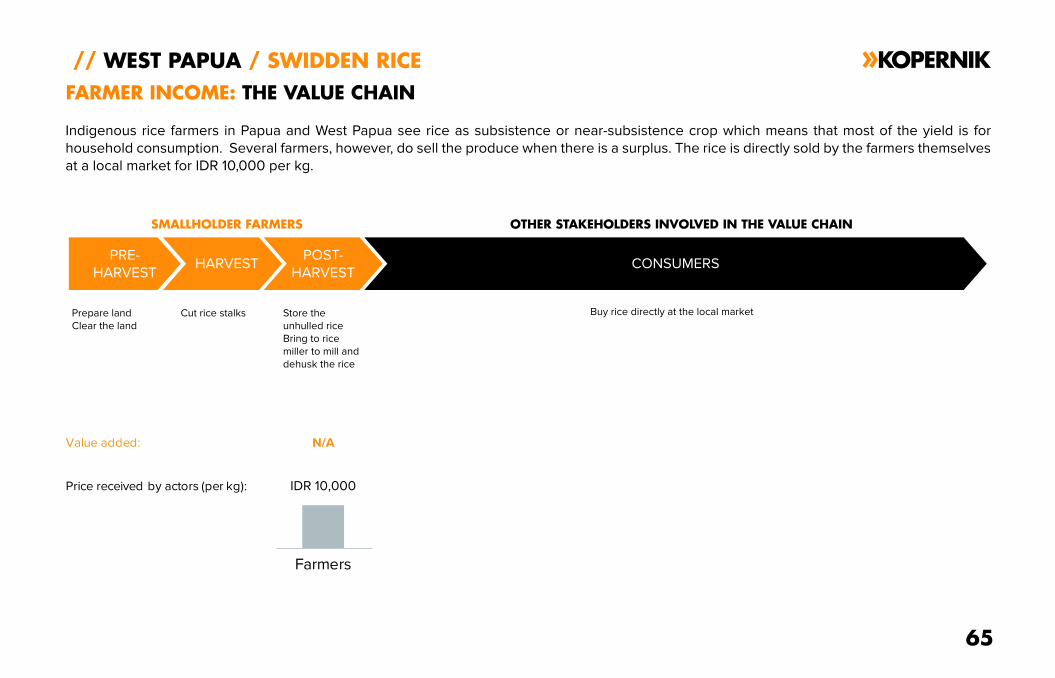
Indigenous rice farmers in Papua and West Papua see rice as subsistence or near-subsistence crop which means that most of the yield is for
household consumption. Several farmers, however, do sell the produce when there is a surplus. The rice is directly sold by the farmers themselves
at a local market for IDR 10,000 per kg.
// WEST PAPUA / SWIDDEN RICE
PRE-
HARVESTHARVEST
POST-
HARVEST
FARMER INCOME: THE VALUE CHAIN
Price received by actors (per kg):
Value added:
Farmers
IDR 10,000
N/A
Prepare land
Clear the land
Cut rice stalks Store the
unhulled rice
Bring to rice
miller to mill and
dehusk the rice
SMALLHOLDER FARMERS
PRE-
HARVESTHARVEST
POST-
HARVESTCONSUMERS
65
OTHER STAKEHOLDERS INVOLVED IN THE VALUE CHAIN
Buy rice directly at the local market
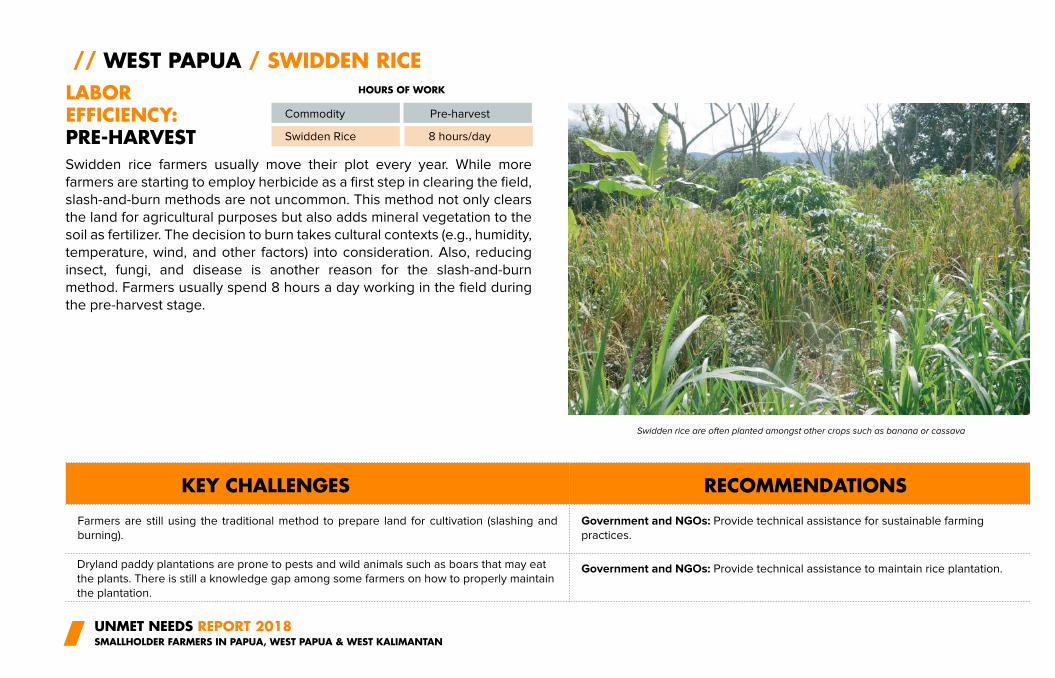
Swidden rice farmers usually move their plot every year. While more
farmers are starting to employ herbicide as a first step in clearing the field,
slash-and-burn methods are not uncommon. This method not only clears
the land for agricultural purposes but also adds mineral vegetation to the
soil as fertilizer. The decision to burn takes cultural contexts (e.g., humidity,
temperature, wind, and other factors) into consideration. Also, reducing
insect, fungi, and disease is another reason for the slash-and-burn
method. Farmers usually spend 8 hours a day working in the field during
the pre-harvest stage.
UNMET NEEDS REPORT 2018SMALLHOLDER FARMERS IN PAPUA, WEST PAPUA & WEST KALIMANTAN
// WEST PAPUA / SWIDDEN RICE
LABOR EFFICIENCY:PRE-HARVEST
KEY CHALLENGES RECOMMENDATIONS
Commodity
Swidden rice are often planted amongst other crops such as banana or cassava
Pre-harvest
Swidden Rice
Farmers are still using the traditional method to prepare land for cultivation (slashing and
burning).
Government and NGOs: Provide technical assistance for sustainable farming
practices.
HOURS OF WORK
Dryland paddy plantations are prone to pests and wild animals such as boars that may eat
the plants. There is still a knowledge gap among some farmers on how to properly maintain
the plantation.
8 hours/day
Government and NGOs: Provide technical assistance to maintain rice plantation.
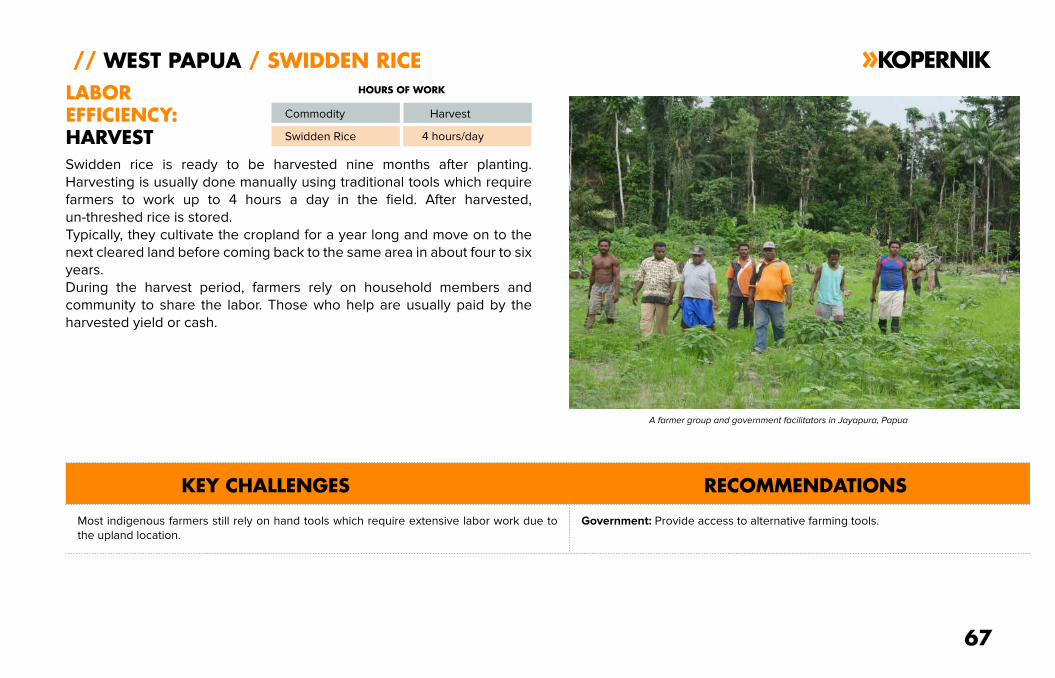
Swidden rice is ready to be harvested nine months after planting.
Harvesting is usually done manually using traditional tools which require
farmers to work up to 4 hours a day in the field. After harvested,
un-threshed rice is stored.
Typically, they cultivate the cropland for a year long and move on to the
next cleared land before coming back to the same area in about four to six
years.
During the harvest period, farmers rely on household members and
community to share the labor. Those who help are usually paid by the
harvested yield or cash.
67
// WEST PAPUA / SWIDDEN RICE
LABOR
EFFICIENCY:
HARVEST
KEY CHALLENGES RECOMMENDATIONS
Commodity Harvest
Swidden Rice
Most indigenous farmers still rely on hand tools which require extensive labor work due to
the upland location.
Government: Provide access to alternative farming tools.
HOURS OF WORK
4 hours/day
A farmer group and government facilitators in Jayapura, Papua
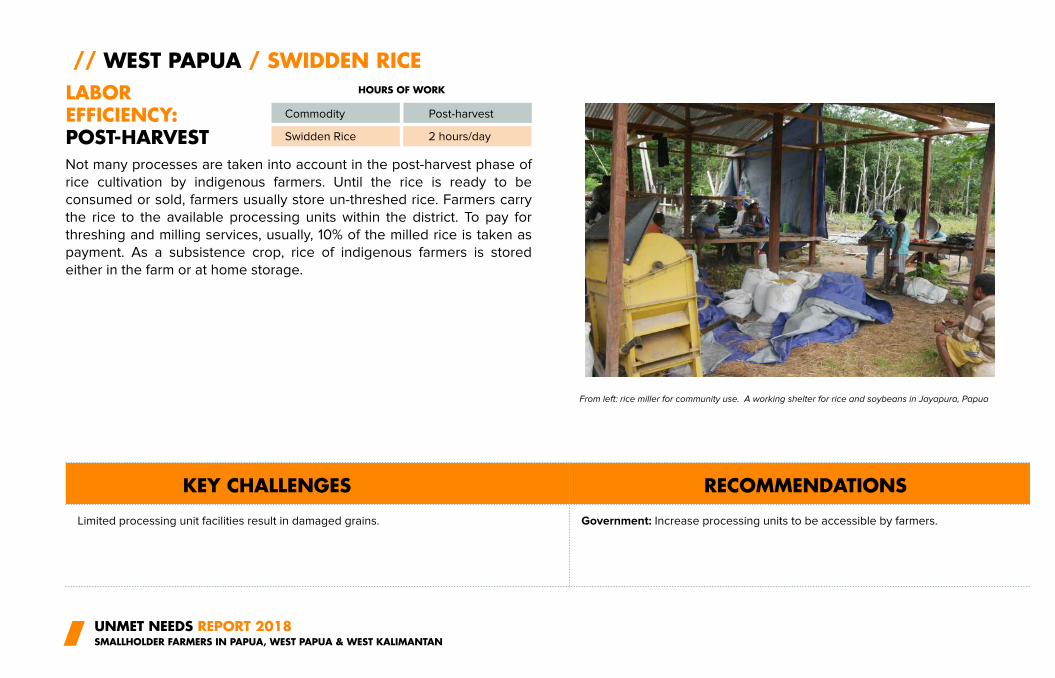
Not many processes are taken into account in the post-harvest phase of
rice cultivation by indigenous farmers. Until the rice is ready to be
consumed or sold, farmers usually store un-threshed rice. Farmers carry
the rice to the available processing units within the district. To pay for
threshing and milling services, usually, 10% of the milled rice is taken as
payment. As a subsistence crop, rice of indigenous farmers is stored
either in the farm or at home storage.
UNMET NEEDS REPORT 2018SMALLHOLDER FARMERS IN PAPUA, WEST PAPUA & WEST KALIMANTAN
// WEST PAPUA / SWIDDEN RICE
LABOR EFFICIENCY:POST-HARVEST
Commodity Post-harvest
Swidden Rice
HOURS OF WORK
KEY CHALLENGES RECOMMENDATIONS
Limited processing unit facilities result in damaged grains. Government: Increase processing units to be accessible by farmers.
2 hours/day
From left: rice miller for community use. A working shelter for rice and soybeans in Jayapura, Papua
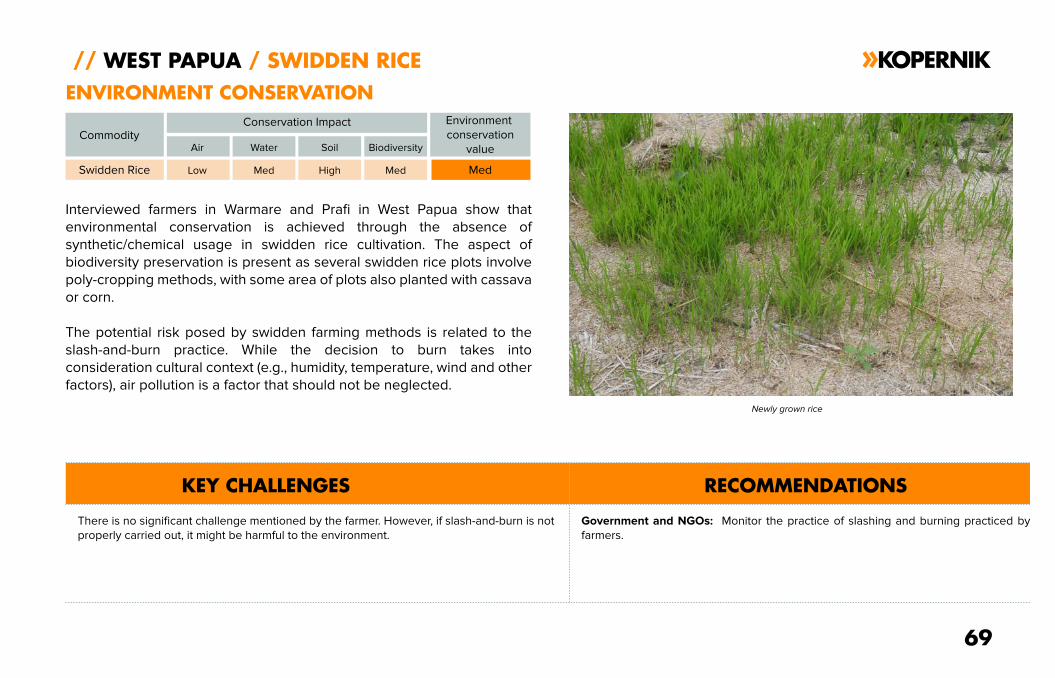
Interviewed farmers in Warmare and Prafi in West Papua show that
environmental conservation is achieved through the absence of
synthetic/chemical usage in swidden rice cultivation. The aspect of
biodiversity preservation is present as several swidden rice plots involve
poly-cropping methods, with some area of plots also planted with cassava
or corn.
The potential risk posed by swidden farming methods is related to the
slash-and-burn practice. While the decision to burn takes into
consideration cultural context (e.g., humidity, temperature, wind and other
factors), air pollution is a factor that should not be neglected.
69
// WEST PAPUA / SWIDDEN RICE
ENVIRONMENT CONSERVATION
KEY CHALLENGES RECOMMENDATIONS
Commodity
Newly grown rice
Swidden Rice Low
There is no significant challenge mentioned by the farmer. However, if slash-and-burn is not
properly carried out, it might be harmful to the environment.
Government and NGOs: Monitor the practice of slashing and burning practiced by
farmers.
Conservation Impact
Med High Med Med
Air Water Soil Biodiversity
Environment
conservation
value
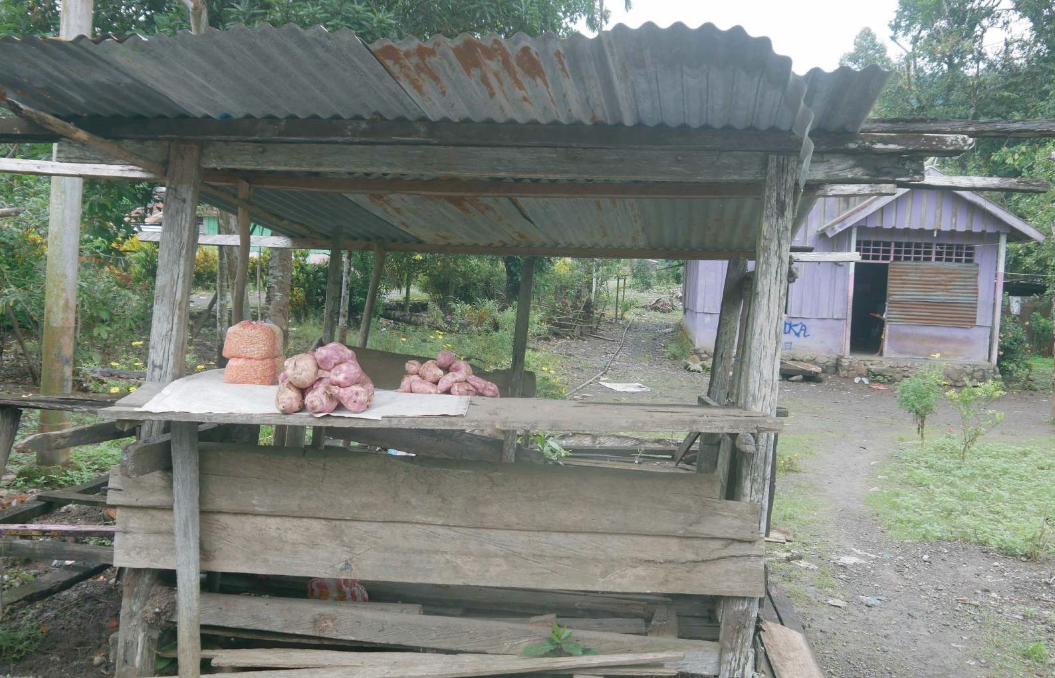
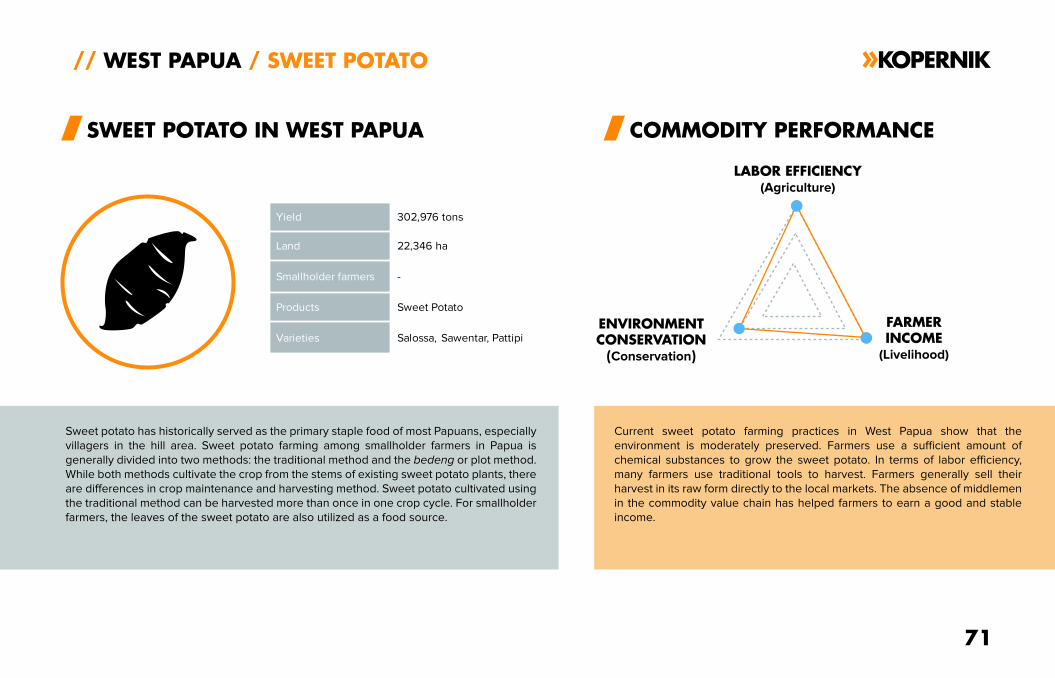
Sweet potato has historically served as the primary staple food of most Papuans, especially
villagers in the hill area. Sweet potato farming among smallholder farmers in Papua is
generally divided into two methods: the traditional method and the bedeng or plot method.
While both methods cultivate the crop from the stems of existing sweet potato plants, there
are differences in crop maintenance and harvesting method. Sweet potato cultivated using
the traditional method can be harvested more than once in one crop cycle. For smallholder
farmers, the leaves of the sweet potato are also utilized as a food source.
Current sweet potato farming practices in West Papua show that the
environment is moderately preserved. Farmers use a sufficient amount of
chemical substances to grow the sweet potato. In terms of labor efficiency,
many farmers use traditional tools to harvest. Farmers generally sell their
harvest in its raw form directly to the local markets. The absence of middlemen
in the commodity value chain has helped farmers to earn a good and stable
income.
71
// WEST PAPUA / SWEET POTATO
SWEET POTATO IN WEST PAPUA COMMODITY PERFORMANCE
LABOR EFFICIENCY(Agriculture)
ENVIRONMENTCONSERVATION
(Conservation)
FARMERINCOME
(Livelihood)
Yield 302,976 tons
Land 22,346 ha
Smallholder farmers -
Products Sweet Potato
Varieties Salossa, Sawentar, Pattipi
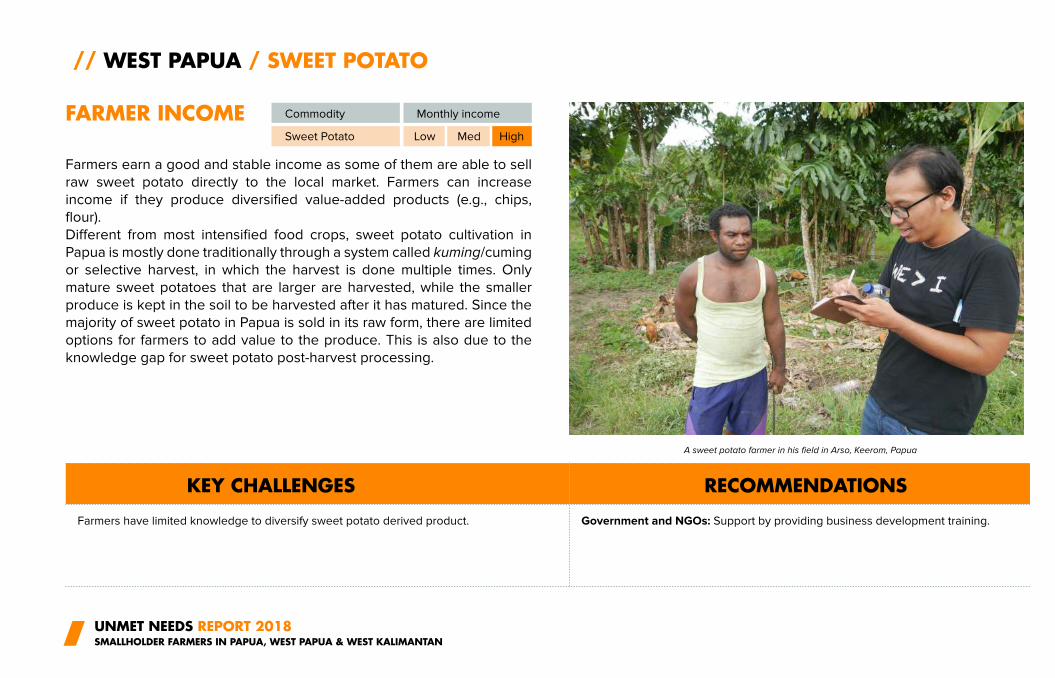
Farmers earn a good and stable income as some of them are able to sell
raw sweet potato directly to the local market. Farmers can increase
income if they produce diversified value-added products (e.g., chips,
flour).
Different from most intensified food crops, sweet potato cultivation in
Papua is mostly done traditionally through a system called kuming/cuming
or selective harvest, in which the harvest is done multiple times. Only
mature sweet potatoes that are larger are harvested, while the smaller
produce is kept in the soil to be harvested after it has matured. Since the
majority of sweet potato in Papua is sold in its raw form, there are limited
options for farmers to add value to the produce. This is also due to the
knowledge gap for sweet potato post-harvest processing.
UNMET NEEDS REPORT 2018SMALLHOLDER FARMERS IN PAPUA, WEST PAPUA & WEST KALIMANTAN
// WEST PAPUA / SWEET POTATO
FARMER INCOME
KEY CHALLENGES RECOMMENDATIONS
Commodity
A sweet potato farmer in his field in Arso, Keerom, Papua
Monthly income
Sweet Potato Low Med High
Farmers have limited knowledge to diversify sweet potato derived product. Government and NGOs: Support by providing business development training.
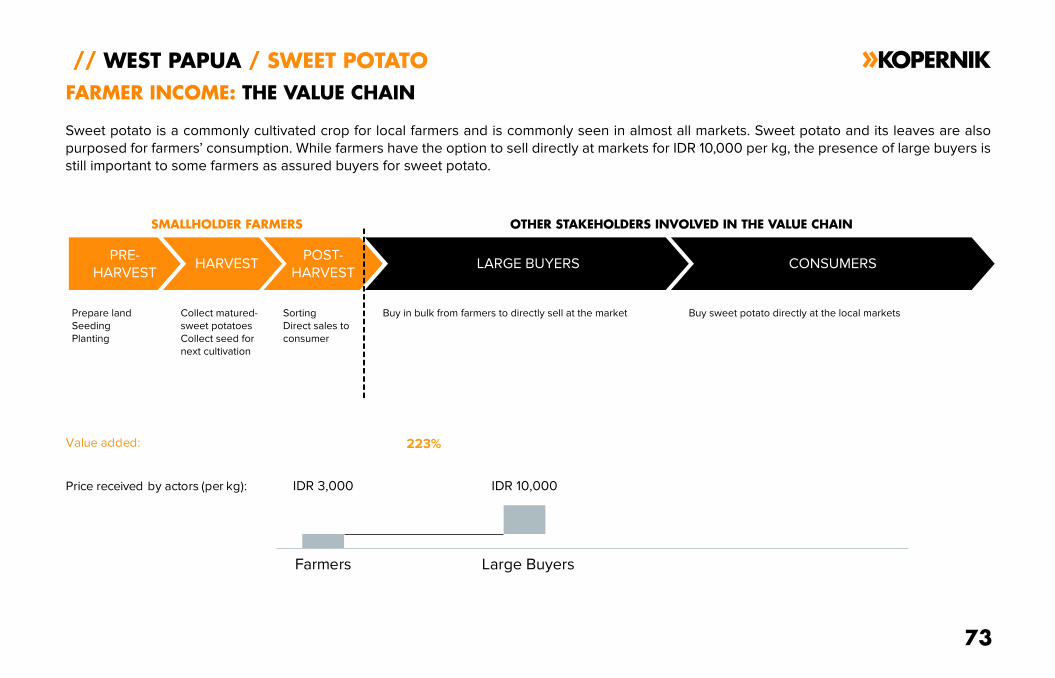
Sweet potato is a commonly cultivated crop for local farmers and is commonly seen in almost all markets. Sweet potato and its leaves are also
purposed for farmers’ consumption. While farmers have the option to sell directly at markets for IDR 10,000 per kg, the presence of large buyers is
still important to some farmers as assured buyers for sweet potato.
// WEST PAPUA / SWEET POTATO
PRE-
HARVESTHARVEST
POST-
HARVESTLARGE BUYERS
FARMER INCOME: THE VALUE CHAIN
Price received by actors (per kg):
Value added:
Farmers
IDR 3,000
223%
IDR 10,000
Large Buyers
Prepare land
Seeding
Planting
Collect matured-
sweet potatoes
Collect seed for
next cultivation
Sorting
Direct sales to
consumer
SMALLHOLDER FARMERS
Buy in bulk from farmers to directly sell at the market
CONSUMERS
Buy sweet potato directly at the local markets
73
OTHER STAKEHOLDERS INVOLVED IN THE VALUE CHAIN
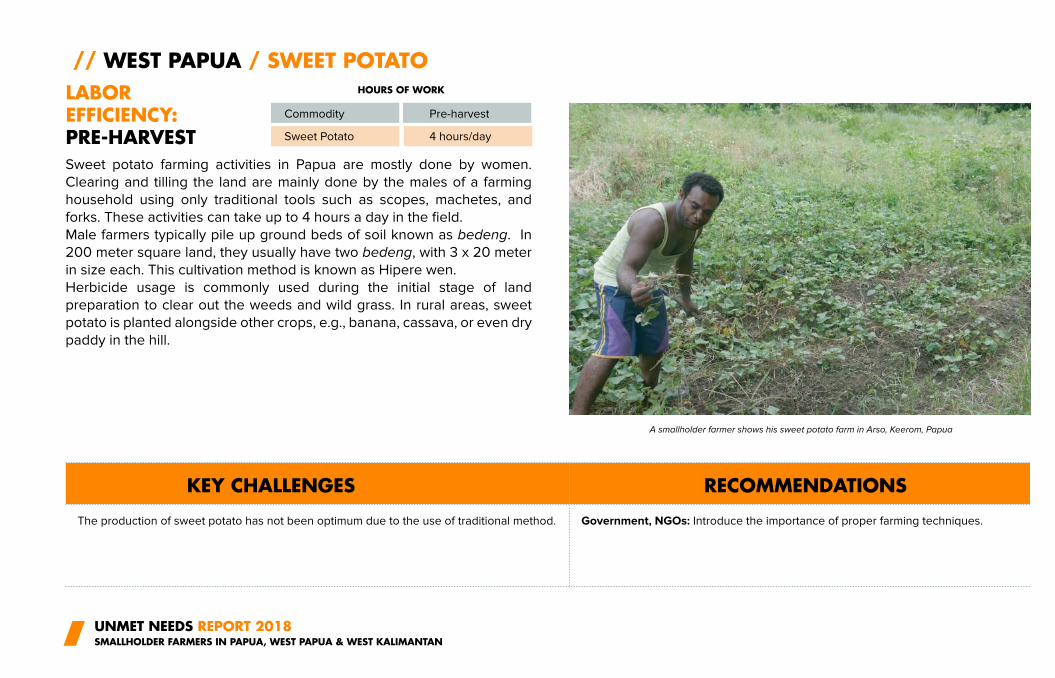
Sweet potato farming activities in Papua are mostly done by women.
Clearing and tilling the land are mainly done by the males of a farming
household using only traditional tools such as scopes, machetes, and
forks. These activities can take up to 4 hours a day in the field.
Male farmers typically pile up ground beds of soil known as bedeng. In
200 meter square land, they usually have two bedeng, with 3 x 20 meter
in size each. This cultivation method is known as Hipere wen.
Herbicide usage is commonly used during the initial stage of land
preparation to clear out the weeds and wild grass. In rural areas, sweet
potato is planted alongside other crops, e.g., banana, cassava, or even dry
paddy in the hill.
UNMET NEEDS REPORT 2018SMALLHOLDER FARMERS IN PAPUA, WEST PAPUA & WEST KALIMANTAN
// WEST PAPUA / SWEET POTATO
LABOREFFICIENCY:PRE-HARVEST
Commodity
A smallholder farmer shows his sweet potato farm in Arso, Keerom, Papua
Pre-harvest
Sweet Potato
HOURS OF WORK
KEY CHALLENGES RECOMMENDATIONS
The production of sweet potato has not been optimum due to the use of traditional method. Government, NGOs: Introduce the importance of proper farming techniques.
4 hours/day
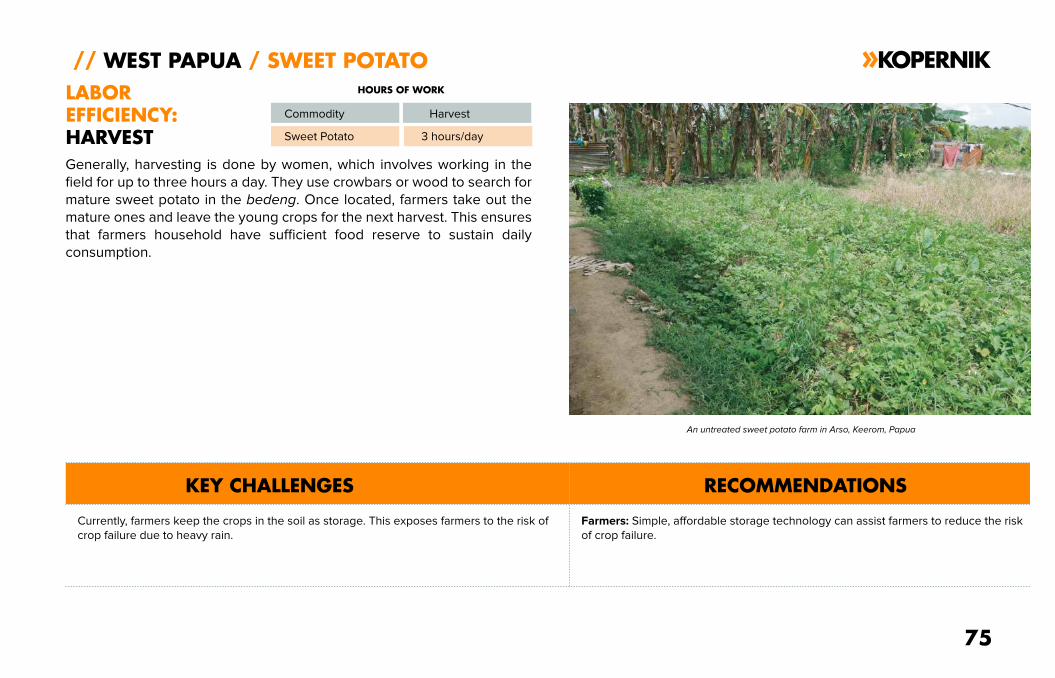
Generally, harvesting is done by women, which involves working in the
field for up to three hours a day. They use crowbars or wood to search for
mature sweet potato in the bedeng. Once located, farmers take out the
mature ones and leave the young crops for the next harvest. This ensures
that farmers household have sufficient food reserve to sustain daily
consumption.
75
// WEST PAPUA / SWEET POTATO
LABOR
EFFICIENCY:
HARVEST
Commodity
An untreated sweet potato farm in Arso, Keerom, Papua
Harvest
Sweet Potato
HOURS OF WORK
KEY CHALLENGES RECOMMENDATIONS
Currently, farmers keep the crops in the soil as storage. This exposes farmers to the risk of
crop failure due to heavy rain.
Farmers: Simple, affordable storage technology can assist farmers to reduce the risk
of crop failure.
3 hours/day
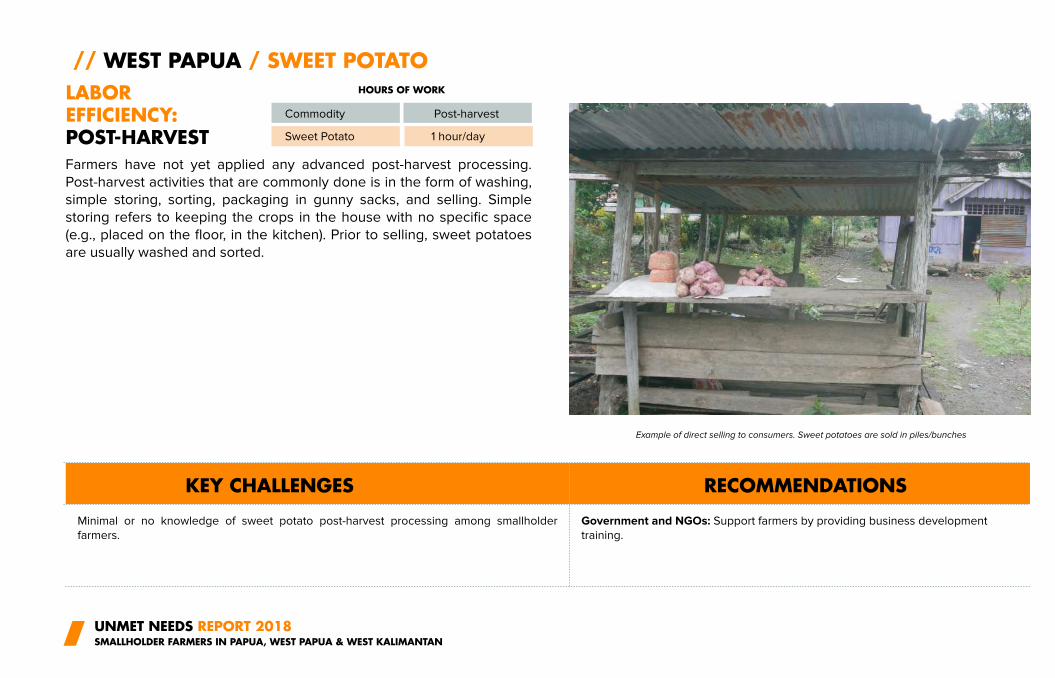
Farmers have not yet applied any advanced post-harvest processing.
Post-harvest activities that are commonly done is in the form of washing,
simple storing, sorting, packaging in gunny sacks, and selling. Simple
storing refers to keeping the crops in the house with no specific space
(e.g., placed on the floor, in the kitchen). Prior to selling, sweet potatoes
are usually washed and sorted.
UNMET NEEDS REPORT 2018SMALLHOLDER FARMERS IN PAPUA, WEST PAPUA & WEST KALIMANTAN
// WEST PAPUA / SWEET POTATO
LABOR EFFICIENCY:POST-HARVEST
Commodity
Example of direct selling to consumers. Sweet potatoes are sold in piles/bunches
Post-harvest
Sweet Potato
HOURS OF WORK
KEY CHALLENGES RECOMMENDATIONS
Minimal or no knowledge of sweet potato post-harvest processing among smallholder
farmers.
Government and NGOs: Support farmers by providing business development
training.
1 hour/day
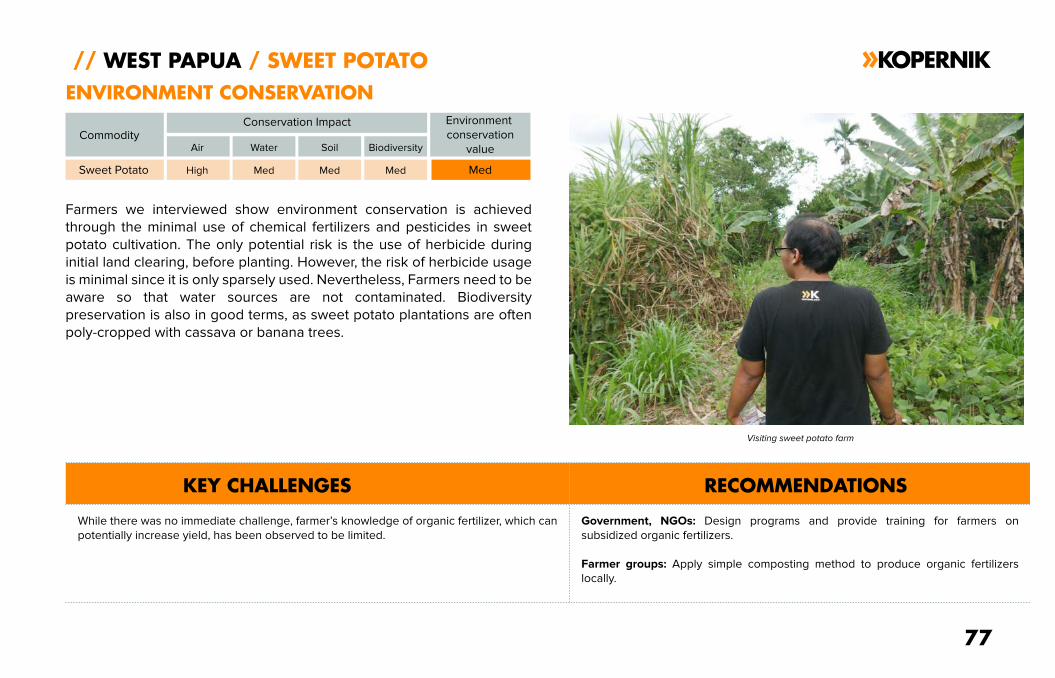
Farmers we interviewed show environment conservation is achieved
through the minimal use of chemical fertilizers and pesticides in sweet
potato cultivation. The only potential risk is the use of herbicide during
initial land clearing, before planting. However, the risk of herbicide usage
is minimal since it is only sparsely used. Nevertheless, Farmers need to be
aware so that water sources are not contaminated. Biodiversity
preservation is also in good terms, as sweet potato plantations are often
poly-cropped with cassava or banana trees.
77
// WEST PAPUA / SWEET POTATO
ENVIRONMENT CONSERVATION
KEY CHALLENGES RECOMMENDATIONS
Commodity
Visiting sweet potato farm
Sweet Potato High
While there was no immediate challenge, farmer’s knowledge of organic fertilizer, which can
potentially increase yield, has been observed to be limited.
Government, NGOs: Design programs and provide training for farmers on
subsidized organic fertilizers.
Farmer groups: Apply simple composting method to produce organic fertilizers
locally.
Conservation Impact
Med Med Med Med
Air Water Soil Biodiversity
Environment
conservation
value
UNMET NEEDS REPORT 2018SMALLHOLDER FARMERS IN PAPUA, WEST PAPUA & WEST KALIMANTAN
The Indonesian government has been working closely with farmers towards sustainable crop
production and improving farmers’ livelihood to reduce rural poverty. Many farmers are now supported
with agricultural machinery, subsidized agricultural inputs, and on-field trainers. However, there are
inconsistencies between the support provided by the government with the actual needs of farmers.
Therefore, it is critical to improve communication between farmers and related government agency to
plan and map out the needs of farmers to maximize crop productivity.
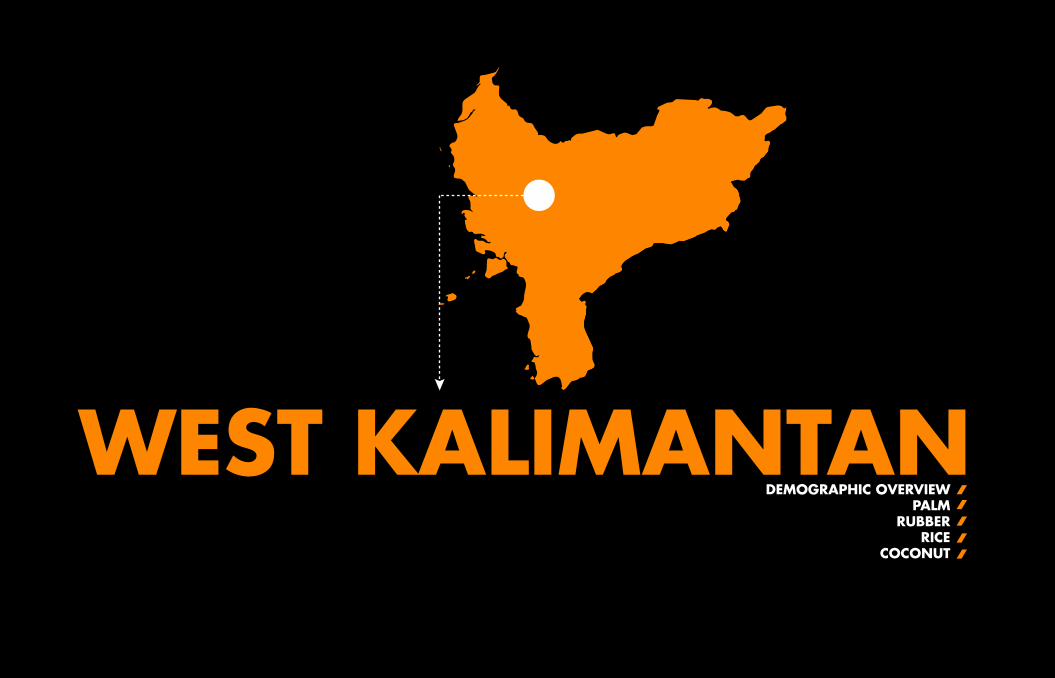
WEST KALIMANTANDEMOGRAPHIC OVERVIEW
PALM
RUBBER
RICE
COCONUT
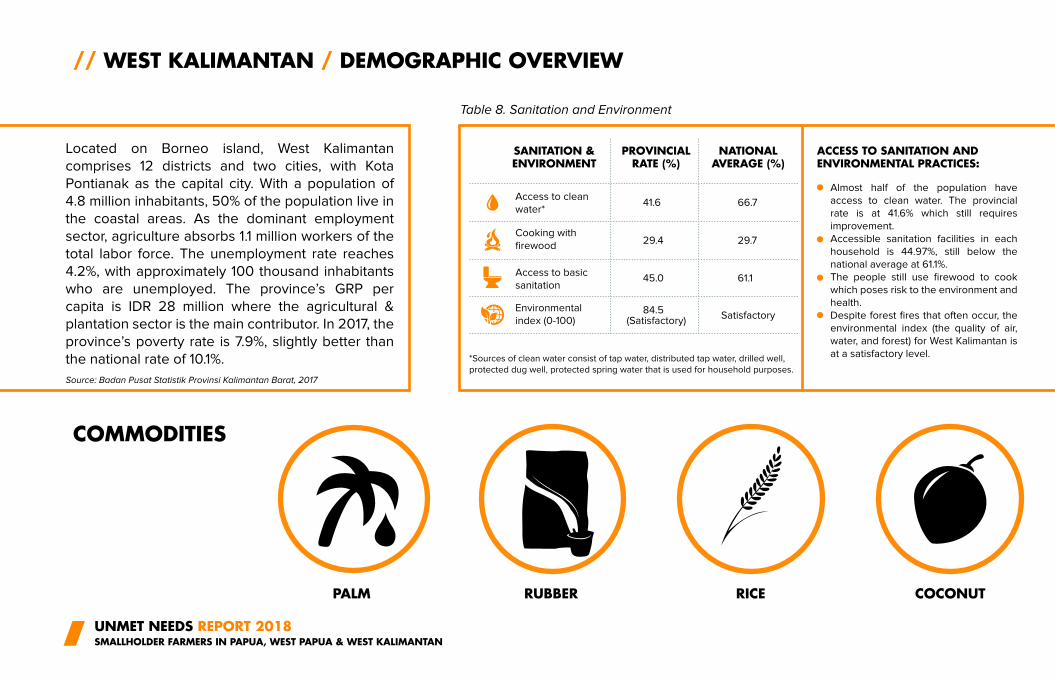
Table 8. Sanitation and Environment
*Sources of clean water consist of tap water, distributed tap water, drilled well,
protected dug well, protected spring water that is used for household purposes.
SANITATION &ENVIRONMENT
ACCESS TO SANITATION AND ENVIRONMENTAL PRACTICES:
PROVINCIALRATE (%)
NATIONALAVERAGE (%)
Located on Borneo island, West Kalimantan
comprises 12 districts and two cities, with Kota
Pontianak as the capital city. With a population of
4.8 million inhabitants, 50% of the population live in
the coastal areas. As the dominant employment
sector, agriculture absorbs 1.1 million workers of the
total labor force. The unemployment rate reaches
4.2%, with approximately 100 thousand inhabitants
who are unemployed. The province’s GRP per
capita is IDR 28 million where the agricultural &
plantation sector is the main contributor. In 2017, the
province’s poverty rate is 7.9%, slightly better than
the national rate of 10.1%.
Almost half of the population have
access to clean water. The provincial
rate is at 41.6% which still requires
improvement.
Accessible sanitation facilities in each
household is 44.97%, still below the
national average at 61.1%.
The people still use firewood to cook
which poses risk to the environment and
health.
Despite forest fires that often occur, the
environmental index (the quality of air,
water, and forest) for West Kalimantan is
at a satisfactory level.
COMMODITIES
PALM RUBBER RICE
Access to clean
water*41.6
29.4
45.0
84.5
66.7
29.7
61.1
Satisfactory
Cooking with
firewood
Access to basic
sanitation
Environmental
index (0-100)
UNMET NEEDS REPORT 2018SMALLHOLDER FARMERS IN PAPUA, WEST PAPUA & WEST KALIMANTAN
// WEST KALIMANTAN / DEMOGRAPHIC OVERVIEW
COCONUT
Source: Badan Pusat Statistik Provinsi Kalimantan Barat, 2017
(Satisfactory)
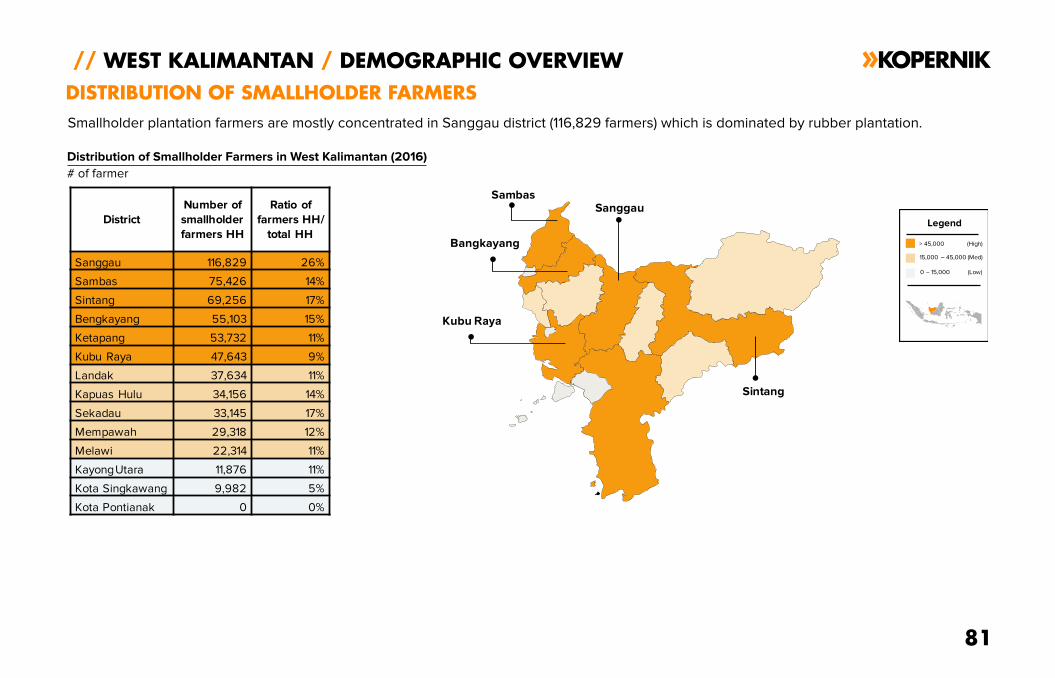
81
// WEST KALIMANTAN / DEMOGRAPHIC OVERVIEW
DISTRIBUTION OF SMALLHOLDER FARMERS
Distribution of Smallholder Farmers in West Kalimantan (2016)
# of farmer
Smallholder plantation farmers are mostly concentrated in Sanggau district (116,829 farmers) which is dominated by rubber plantation.
Sanggau
Sintang
Kubu Raya
Sambas
Bangkayang
District
Number of
smallholder
farmers HH
Ratio of
farmers HH/
total HH
Sanggau 116,829 26%
Sambas 75,426 14%
Sintang 69,256 17%
Bengkayang 55,103 15%
Ketapang 53,732 11%
Kubu Raya 47,643 9%
Landak 37,634 11%
Kapuas Hulu 34,156 14%
Sekadau 33,145 17%
Mempawah 29,318 12%
Melawi 22,314 11%
KayongUtara 11,876 11%
Kota Singkawang 9,982 5%
Kota Pontianak 0 0%
0 – 15,000 (Low)
15,000 – 45,000 (Med)
> 45,000 (High)
Legend
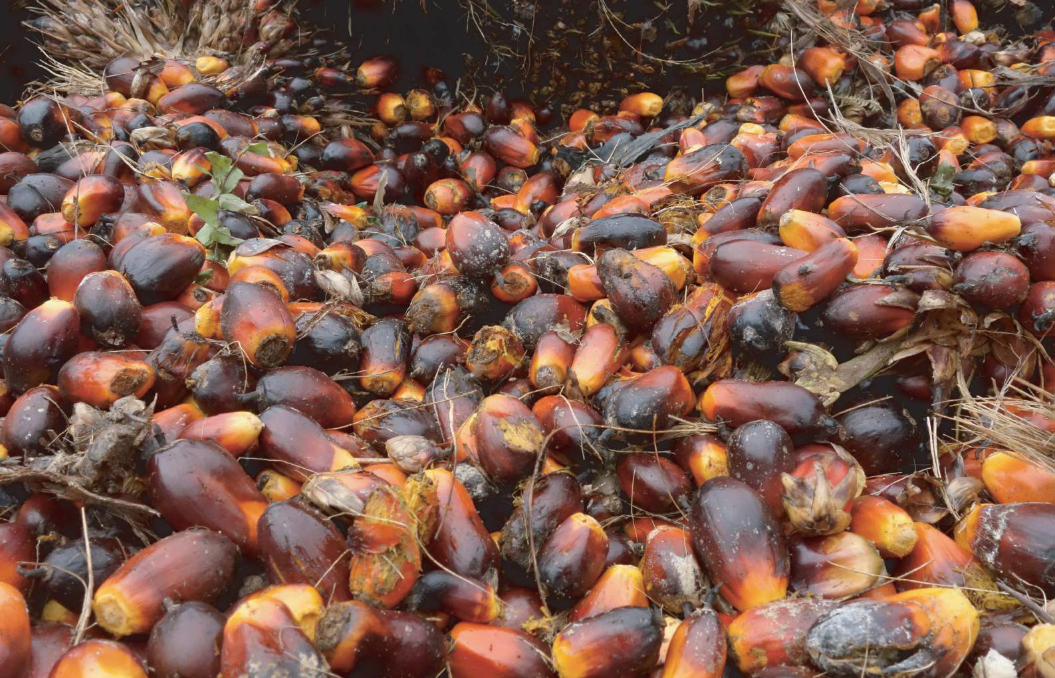
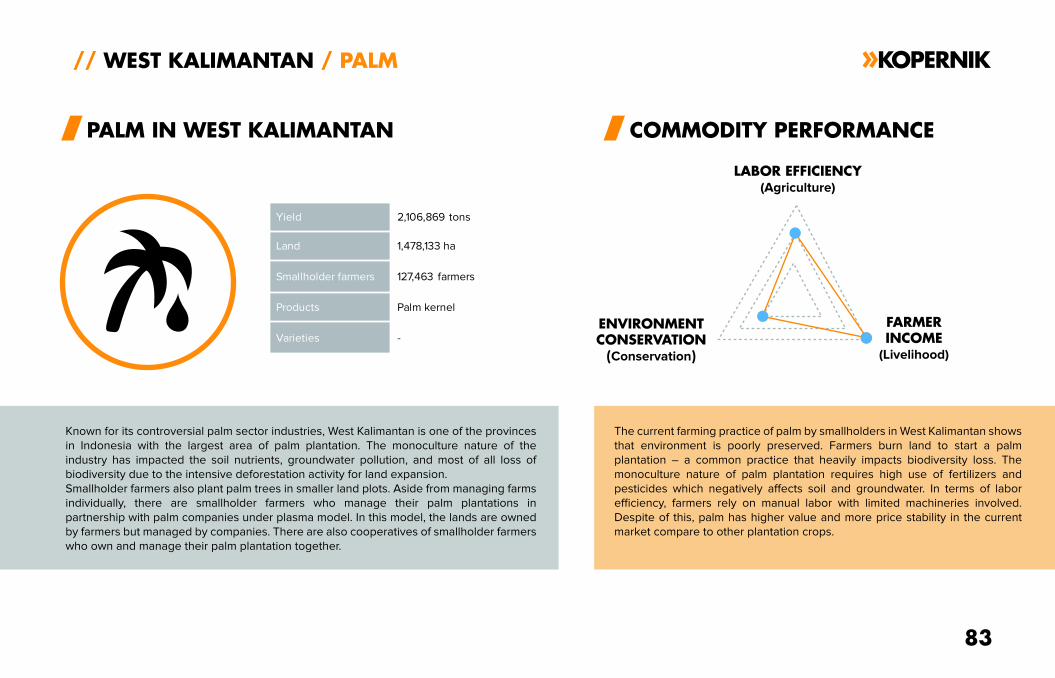
Known for its controversial palm sector industries, West Kalimantan is one of the provinces
in Indonesia with the largest area of palm plantation. The monoculture nature of the
industry has impacted the soil nutrients, groundwater pollution, and most of all loss of
biodiversity due to the intensive deforestation activity for land expansion.
Smallholder farmers also plant palm trees in smaller land plots. Aside from managing farms
individually, there are smallholder farmers who manage their palm plantations in
partnership with palm companies under plasma model. In this model, the lands are owned
by farmers but managed by companies. There are also cooperatives of smallholder farmers
who own and manage their palm plantation together.
The current farming practice of palm by smallholders in West Kalimantan shows
that environment is poorly preserved. Farmers burn land to start a palm
plantation – a common practice that heavily impacts biodiversity loss. The
monoculture nature of palm plantation requires high use of fertilizers and
pesticides which negatively affects soil and groundwater. In terms of labor
efficiency, farmers rely on manual labor with limited machineries involved.
Despite of this, palm has higher value and more price stability in the current
market compare to other plantation crops.
83
// WEST KALIMANTAN / PALM
PALM IN WEST KALIMANTAN COMMODITY PERFORMANCE
LABOR EFFICIENCY(Agriculture)
ENVIRONMENTCONSERVATION
(Conservation)
FARMERINCOME
(Livelihood)
Yield 2,106,869 tons
Land 1,478,133 ha
Smallholder farmers 127,463 farmers
Products Palm kernel
Varieties -
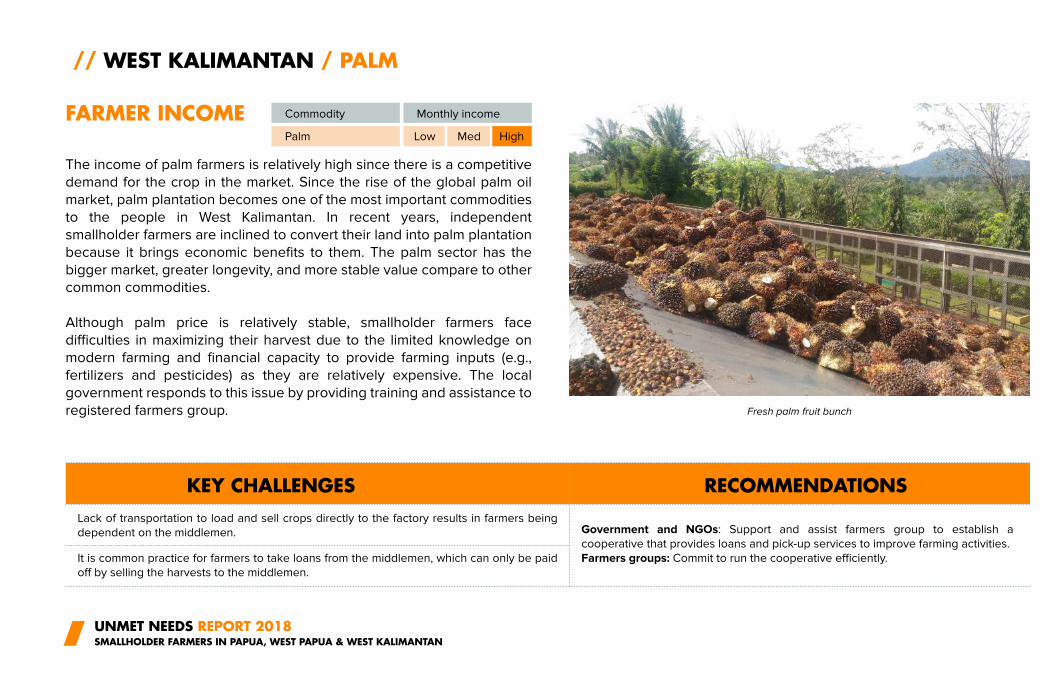
The income of palm farmers is relatively high since there is a competitive
demand for the crop in the market. Since the rise of the global palm oil
market, palm plantation becomes one of the most important commodities
to the people in West Kalimantan. In recent years, independent
smallholder farmers are inclined to convert their land into palm plantation
because it brings economic benefits to them. The palm sector has the
bigger market, greater longevity, and more stable value compare to other
common commodities.
Although palm price is relatively stable, smallholder farmers face
difficulties in maximizing their harvest due to the limited knowledge on
modern farming and financial capacity to provide farming inputs (e.g.,
fertilizers and pesticides) as they are relatively expensive. The local
government responds to this issue by providing training and assistance to
registered farmers group.
UNMET NEEDS REPORT 2018SMALLHOLDER FARMERS IN PAPUA, WEST PAPUA & WEST KALIMANTAN
// WEST KALIMANTAN / PALM
FARMER INCOME
KEY CHALLENGES RECOMMENDATIONS
Commodity Monthly income
Palm Low Med High
Lack of transportation to load and sell crops directly to the factory results in farmers being
dependent on the middlemen. Government and NGOs: Support and assist farmers group to establish a
cooperative that provides loans and pick-up services to improve farming activities.
Farmers groups: Commit to run the cooperative efficiently.It is common practice for farmers to take loans from the middlemen, which can only be paid
off by selling the harvests to the middlemen.
Fresh palm fruit bunch
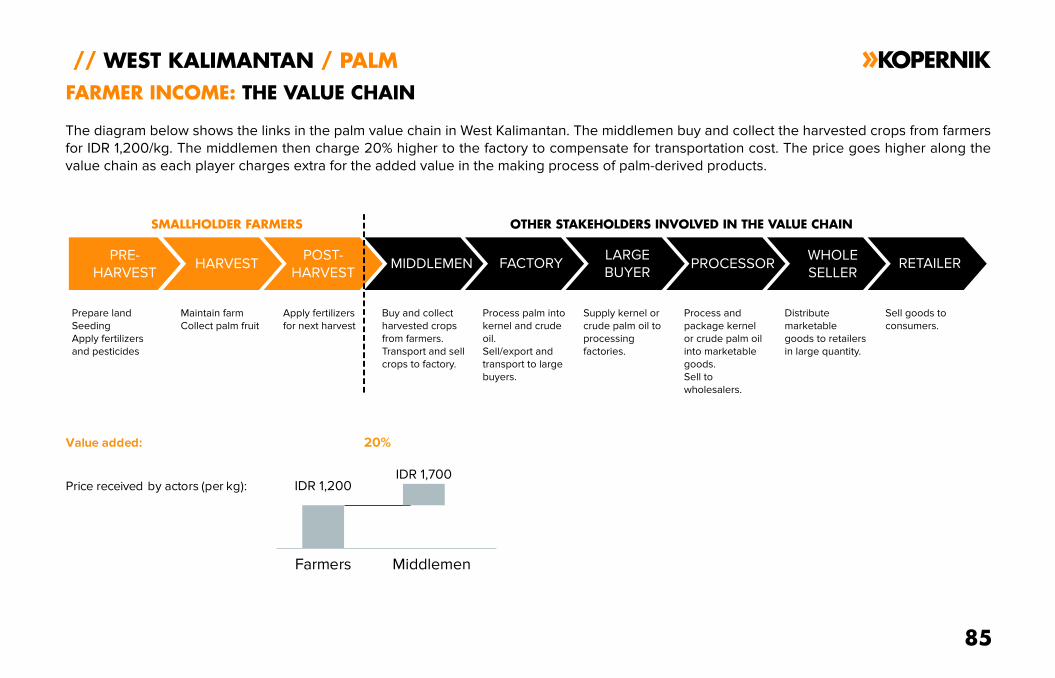
The diagram below shows the links in the palm value chain in West Kalimantan. The middlemen buy and collect the harvested crops from farmers
for IDR 1,200/kg. The middlemen then charge 20% higher to the factory to compensate for transportation cost. The price goes higher along the
value chain as each player charges extra for the added value in the making process of palm-derived products.
// WEST KALIMANTAN / PALM
PRE-
HARVESTHARVEST
POST-
HARVESTLARGE BUYERS
FARMER INCOME: THE VALUE CHAIN
Price received by actors (per kg):
Value added:
Farmers
IDR 1,200
20%
IDR 1,700
Middlemen
Prepare land
Seeding
Apply fertilizers
and pesticides
Maintain farm
Collect palm fruit
Apply fertilizers
for next harvest
SMALLHOLDER FARMERS
CONSUMERS
85
Buy and collect
harvested crops
from farmers.
Transport and sell
crops to factory.
Process palm into
kernel and crude
oil.
Sell/export and
transport to large
buyers.
Supply kernel or
crude palm oil to
processing
factories.
Process and
package kernel
or crude palm oil
into marketable
goods.
Sell to
wholesalers.
Distribute
marketable
goods to retailers
in large quantity.
Sell goods to
consumers.
PRE-
HARVESTHARVEST
POST-
HARVESTMIDDLEMEN FACTORY
LARGE
BUYERPROCESSOR
WHOLE
SELLERRETAILER
OTHER STAKEHOLDERS INVOLVED IN THE VALUE CHAIN
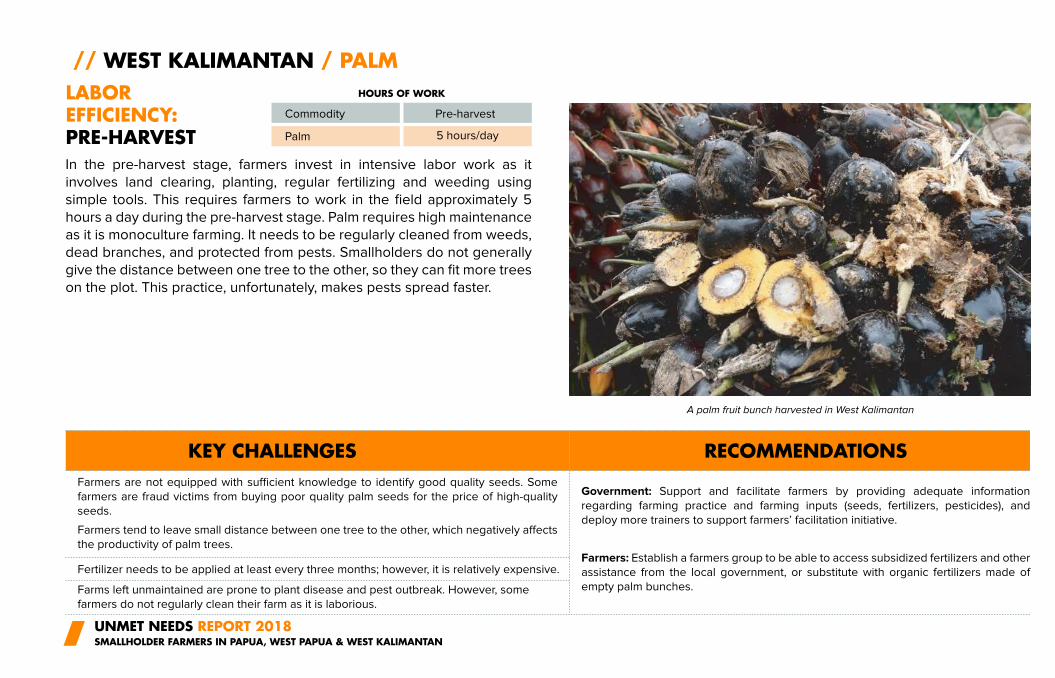
Farmers: Establish a farmers group to be able to access subsidized fertilizers and other
assistance from the local government, or substitute with organic fertilizers made of
empty palm bunches.
In the pre-harvest stage, farmers invest in intensive labor work as it
involves land clearing, planting, regular fertilizing and weeding using
simple tools. This requires farmers to work in the field approximately 5
hours a day during the pre-harvest stage. Palm requires high maintenance
as it is monoculture farming. It needs to be regularly cleaned from weeds,
dead branches, and protected from pests. Smallholders do not generally
give the distance between one tree to the other, so they can fit more trees
on the plot. This practice, unfortunately, makes pests spread faster.
UNMET NEEDS REPORT 2018SMALLHOLDER FARMERS IN PAPUA, WEST PAPUA & WEST KALIMANTAN
// WEST KALIMANTAN / PALM
LABOR EFFICIENCY:PRE-HARVEST
KEY CHALLENGES RECOMMENDATIONS
Commodity
A palm fruit bunch harvested in West Kalimantan
Palm
Farmers tend to leave small distance between one tree to the other, which negatively affects
the productivity of palm trees.
Farmers are not equipped with sufficient knowledge to identify good quality seeds. Some
farmers are fraud victims from buying poor quality palm seeds for the price of high-quality
seeds.
Fertilizer needs to be applied at least every three months; however, it is relatively expensive.
Farms left unmaintained are prone to plant disease and pest outbreak. However, some
farmers do not regularly clean their farm as it is laborious.
Government: Support and facilitate farmers by providing adequate information
regarding farming practice and farming inputs (seeds, fertilizers, pesticides), and
deploy more trainers to support farmers’ facilitation initiative.
Pre-harvest
5 hours/day
HOURS OF WORK
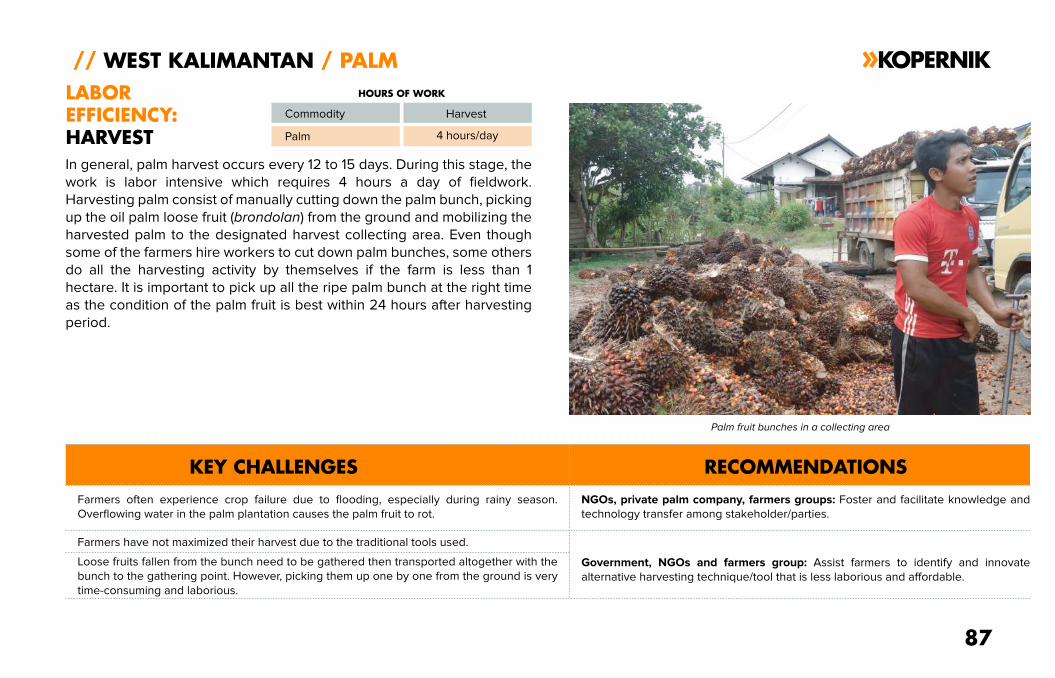
In general, palm harvest occurs every 12 to 15 days. During this stage, the
work is labor intensive which requires 4 hours a day of fieldwork.
Harvesting palm consist of manually cutting down the palm bunch, picking
up the oil palm loose fruit (brondolan) from the ground and mobilizing the
harvested palm to the designated harvest collecting area. Even though
some of the farmers hire workers to cut down palm bunches, some others
do all the harvesting activity by themselves if the farm is less than 1
hectare. It is important to pick up all the ripe palm bunch at the right time
as the condition of the palm fruit is best within 24 hours after harvesting
period.
87
// WEST KALIMANTAN / PALM
LABOR
EFFICIENCY:
HARVEST
KEY CHALLENGES RECOMMENDATIONS
Commodity
Palm fruit bunches in a collecting area
Palm
Farmers often experience crop failure due to flooding, especially during rainy season.
Overflowing water in the palm plantation causes the palm fruit to rot.
NGOs, private palm company, farmers groups: Foster and facilitate knowledge and
technology transfer among stakeholder/parties.
Farmers have not maximized their harvest due to the traditional tools used.
Loose fruits fallen from the bunch need to be gathered then transported altogether with the
bunch to the gathering point. However, picking them up one by one from the ground is very
time-consuming and laborious.
Government, NGOs and farmers group: Assist farmers to identify and innovate
alternative harvesting technique/tool that is less laborious and affordable.
HOURS OF WORK
Harvest
4 hours/day
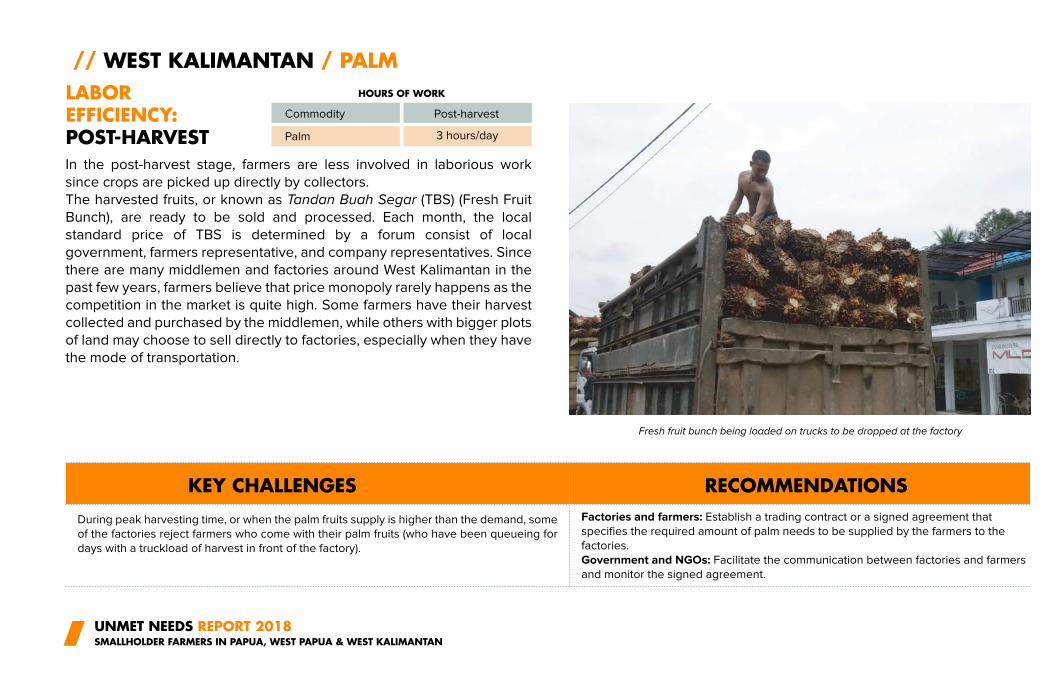
In the post-harvest stage, farmers are less involved in laborious work
since crops are picked up directly by collectors.
The harvested fruits, or known as Tandan Buah Segar (TBS) (Fresh Fruit
Bunch), are ready to be sold and processed. Each month, the local
standard price of TBS is determined by a forum consist of local
government, farmers representative, and company representatives. Since
there are many middlemen and factories around West Kalimantan in the
past few years, farmers believe that price monopoly rarely happens as the
competition in the market is quite high. Some farmers have their harvest
collected and purchased by the middlemen, while others with bigger plots
of land may choose to sell directly to factories, especially when they have
the mode of transportation.
UNMET NEEDS REPORT 2018SMALLHOLDER FARMERS IN PAPUA, WEST PAPUA & WEST KALIMANTAN
// WEST KALIMANTAN / PALM
LABOR EFFICIENCY:POST-HARVEST
KEY CHALLENGES RECOMMENDATIONS
Commodity
Fresh fruit bunch being loaded on trucks to be dropped at the factory
Palm
During peak harvesting time, or when the palm fruits supply is higher than the demand, some
of the factories reject farmers who come with their palm fruits (who have been queueing for
days with a truckload of harvest in front of the factory).
Factories and farmers: Establish a trading contract or a signed agreement that
specifies the required amount of palm needs to be supplied by the farmers to the
factories.
Government and NGOs: Facilitate the communication between factories and farmers
and monitor the signed agreement.
Post-harvest
HOURS OF WORK
3 hours/day
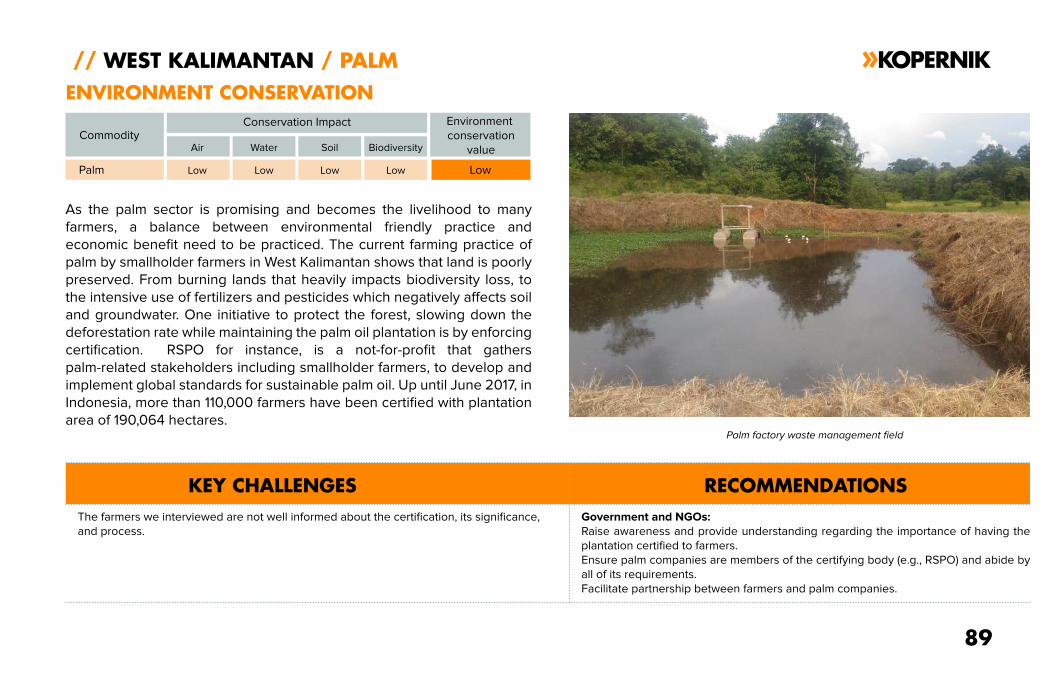
As the palm sector is promising and becomes the livelihood to many
farmers, a balance between environmental friendly practice and
economic benefit need to be practiced. The current farming practice of
palm by smallholder farmers in West Kalimantan shows that land is poorly
preserved. From burning lands that heavily impacts biodiversity loss, to
the intensive use of fertilizers and pesticides which negatively affects soil
and groundwater. One initiative to protect the forest, slowing down the
deforestation rate while maintaining the palm oil plantation is by enforcing
certification. RSPO for instance, is a not-for-profit that gathers
palm-related stakeholders including smallholder farmers, to develop and
implement global standards for sustainable palm oil. Up until June 2017, in
Indonesia, more than 110,000 farmers have been certified with plantation
area of 190,064 hectares.
89
// WEST KALIMANTAN / PALM
ENVIRONMENT CONSERVATION
KEY CHALLENGES RECOMMENDATIONS
Commodity
Palm factory waste management field
Palm Low
The farmers we interviewed are not well informed about the certification, its significance,
and process.
Government and NGOs:
Raise awareness and provide understanding regarding the importance of having the
plantation certified to farmers.
Ensure palm companies are members of the certifying body (e.g., RSPO) and abide by
all of its requirements.
Facilitate partnership between farmers and palm companies.
Conservation Impact
Low Low Low Low
Air Water Soil Biodiversity
Environment
conservation
value
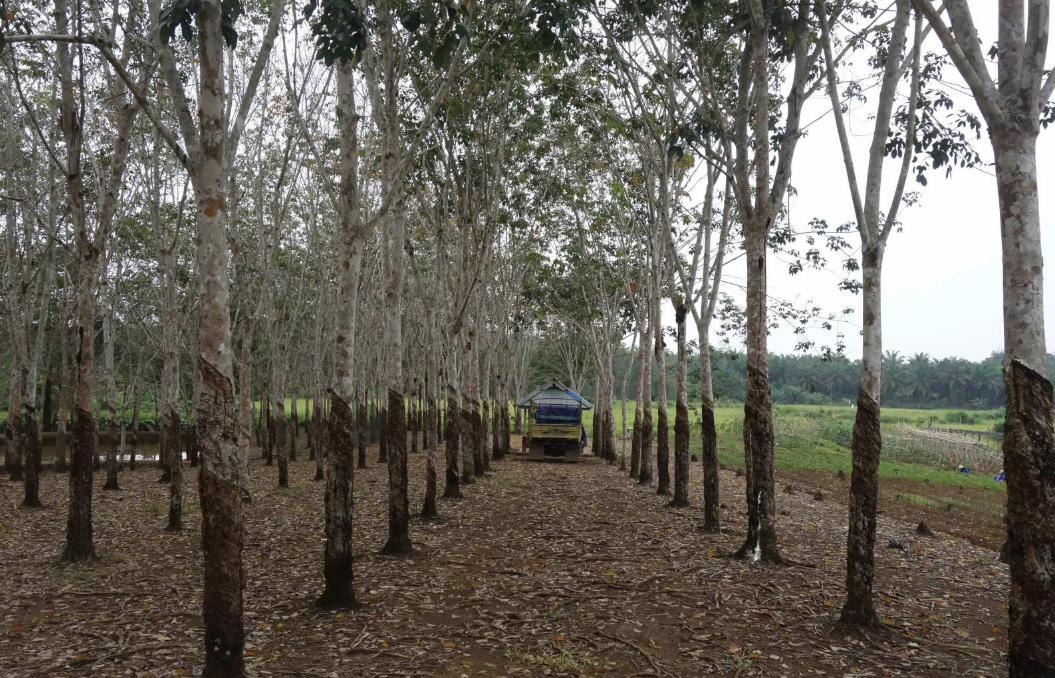
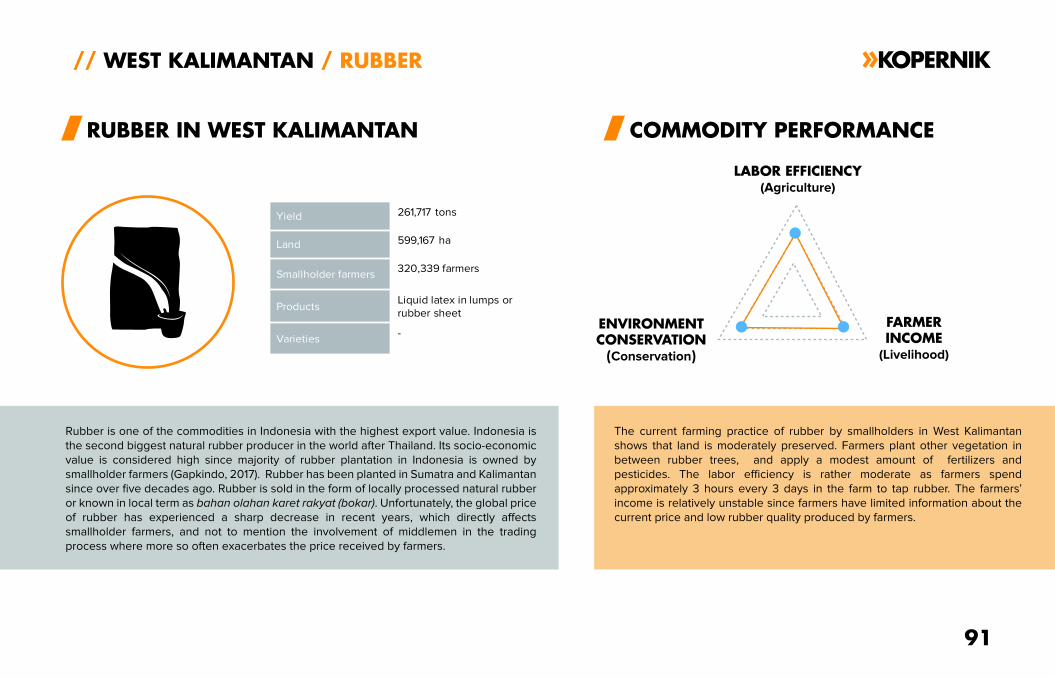
Rubber is one of the commodities in Indonesia with the highest export value. Indonesia is
the second biggest natural rubber producer in the world after Thailand. Its socio-economic
value is considered high since majority of rubber plantation in Indonesia is owned by
smallholder farmers (Gapkindo, 2017). Rubber has been planted in Sumatra and Kalimantan
since over five decades ago. Rubber is sold in the form of locally processed natural rubber
or known in local term as bahan olahan karet rakyat (bokar). Unfortunately, the global price
of rubber has experienced a sharp decrease in recent years, which directly affects
smallholder farmers, and not to mention the involvement of middlemen in the trading
process where more so often exacerbates the price received by farmers.
The current farming practice of rubber by smallholders in West Kalimantan
shows that land is moderately preserved. Farmers plant other vegetation in
between rubber trees, and apply a modest amount of fertilizers and
pesticides. The labor efficiency is rather moderate as farmers spend
approximately 3 hours every 3 days in the farm to tap rubber. The farmers’
income is relatively unstable since farmers have limited information about the
current price and low rubber quality produced by farmers.
91
// WEST KALIMANTAN / RUBBER
RUBBER IN WEST KALIMANTAN COMMODITY PERFORMANCE
LABOR EFFICIENCY(Agriculture)
ENVIRONMENTCONSERVATION
(Conservation)
FARMERINCOME
(Livelihood)
Yield 261,717 tons
Land 599,167 ha
Smallholder farmers320,339 farmers
ProductsLiquid latex in lumps or rubber sheet
Varieties-
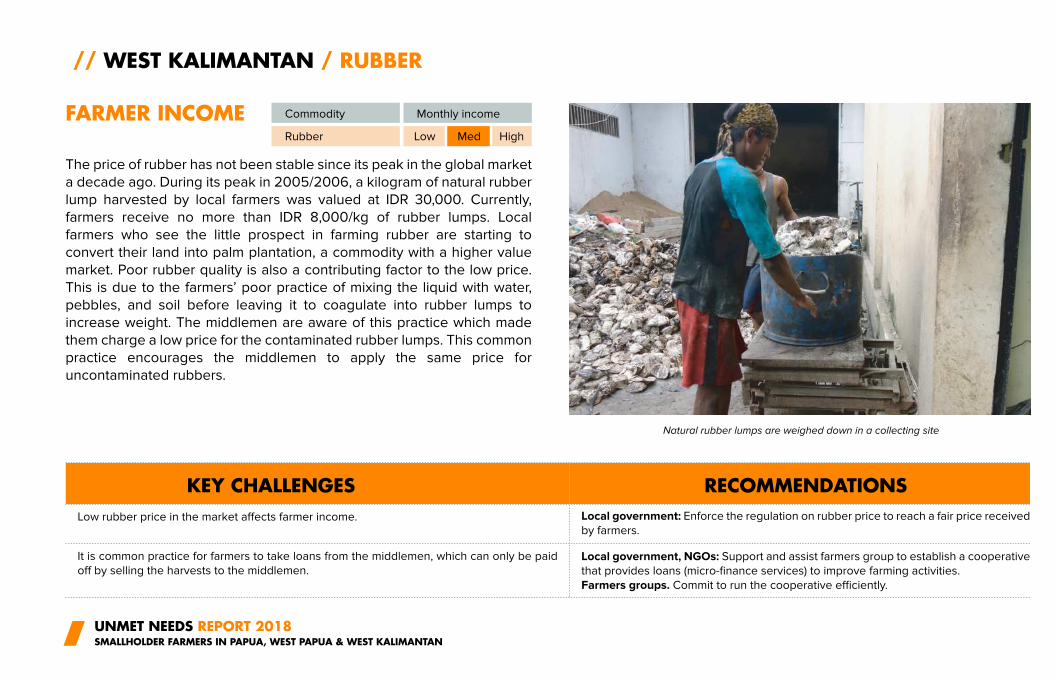
The price of rubber has not been stable since its peak in the global market
a decade ago. During its peak in 2005/2006, a kilogram of natural rubber
lump harvested by local farmers was valued at IDR 30,000. Currently,
farmers receive no more than IDR 8,000/kg of rubber lumps. Local
farmers who see the little prospect in farming rubber are starting to
convert their land into palm plantation, a commodity with a higher value
market. Poor rubber quality is also a contributing factor to the low price.
This is due to the farmers’ poor practice of mixing the liquid with water,
pebbles, and soil before leaving it to coagulate into rubber lumps to
increase weight. The middlemen are aware of this practice which made
them charge a low price for the contaminated rubber lumps. This common
practice encourages the middlemen to apply the same price for
uncontaminated rubbers.
UNMET NEEDS REPORT 2018SMALLHOLDER FARMERS IN PAPUA, WEST PAPUA & WEST KALIMANTAN
// WEST KALIMANTAN / RUBBER
FARMER INCOME
KEY CHALLENGES RECOMMENDATIONS
Commodity Monthly income
Rubber Low Med High
Low rubber price in the market affects farmer income. Local government: Enforce the regulation on rubber price to reach a fair price received
by farmers.
It is common practice for farmers to take loans from the middlemen, which can only be paid
off by selling the harvests to the middlemen.Local government, NGOs: Support and assist farmers group to establish a cooperative
that provides loans (micro-finance services) to improve farming activities.
Farmers groups. Commit to run the cooperative efficiently.
Natural rubber lumps are weighed down in a collecting site
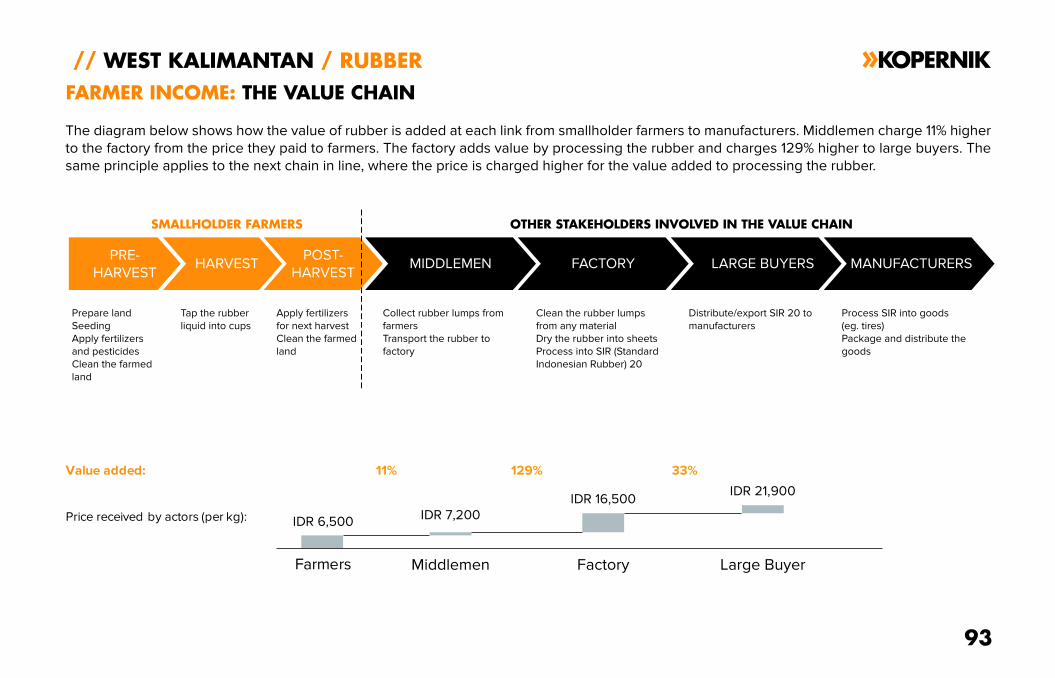
The diagram below shows how the value of rubber is added at each link from smallholder farmers to manufacturers. Middlemen charge 11% higher
to the factory from the price they paid to farmers. The factory adds value by processing the rubber and charges 129% higher to large buyers. The
same principle applies to the next chain in line, where the price is charged higher for the value added to processing the rubber.
93
// WEST KALIMANTAN / RUBBER
PRE-
HARVESTHARVEST
POST-
HARVESTMIDDLEMEN
FARMER INCOME: THE VALUE CHAIN
Price received by actors (per kg):
Value added:
Farmers
IDR 6,500
11%
IDR 21,900
Middlemen Factory Large Buyer
IDR 7,200IDR 16,500
Prepare land
Seeding
Apply fertilizers
and pesticides
Clean the farmed
land
Tap the rubber
liquid into cups
Apply fertilizers
for next harvest
Clean the farmed
land
SMALLHOLDER FARMERS
FACTORY LARGE BUYERS MANUFACTURERS
Collect rubber lumps from
farmers
Transport the rubber to
factory
Clean the rubber lumps
from any material
Dry the rubber into sheets
Process into SIR (Standard
Indonesian Rubber) 20
Distribute/export SIR 20 to
manufacturers
Process SIR into goods
(eg. tires)
Package and distribute the
goods
129% 33%
OTHER STAKEHOLDERS INVOLVED IN THE VALUE CHAIN
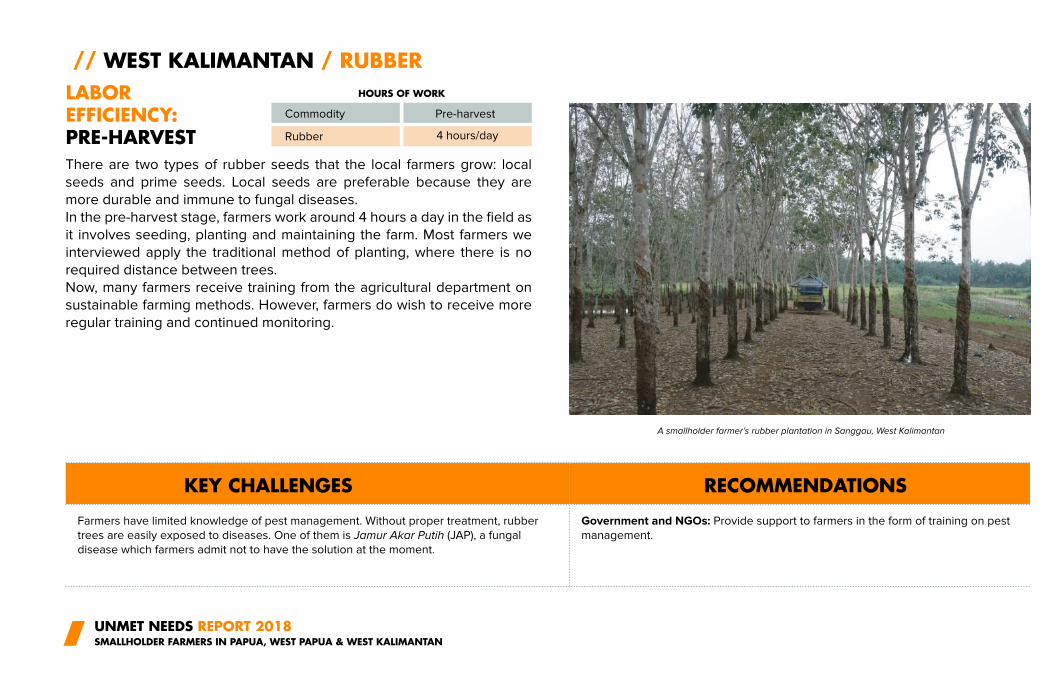
There are two types of rubber seeds that the local farmers grow: local
seeds and prime seeds. Local seeds are preferable because they are
more durable and immune to fungal diseases.
In the pre-harvest stage, farmers work around 4 hours a day in the field as
it involves seeding, planting and maintaining the farm. Most farmers we
interviewed apply the traditional method of planting, where there is no
required distance between trees.
Now, many farmers receive training from the agricultural department on
sustainable farming methods. However, farmers do wish to receive more
regular training and continued monitoring.
UNMET NEEDS REPORT 2018SMALLHOLDER FARMERS IN PAPUA, WEST PAPUA & WEST KALIMANTAN
// WEST KALIMANTAN / RUBBER
LABOR EFFICIENCY:PRE-HARVEST
Commodity
A smallholder farmer’s rubber plantation in Sanggau, West Kalimantan
Rubber
KEY CHALLENGES RECOMMENDATIONS
Farmers have limited knowledge of pest management. Without proper treatment, rubber
trees are easily exposed to diseases. One of them is Jamur Akar Putih (JAP), a fungal
disease which farmers admit not to have the solution at the moment.
Government and NGOs: Provide support to farmers in the form of training on pest
management.
Pre-harvest
4 hours/day
HOURS OF WORK
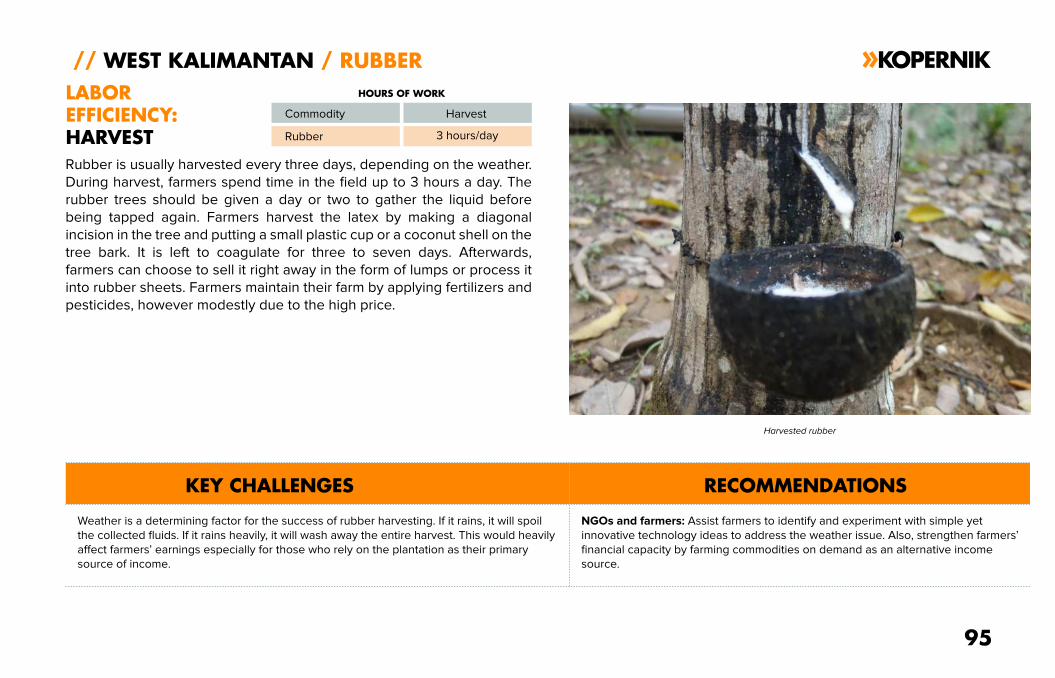
Rubber is usually harvested every three days, depending on the weather.
During harvest, farmers spend time in the field up to 3 hours a day. The
rubber trees should be given a day or two to gather the liquid before
being tapped again. Farmers harvest the latex by making a diagonal
incision in the tree and putting a small plastic cup or a coconut shell on the
tree bark. It is left to coagulate for three to seven days. Afterwards,
farmers can choose to sell it right away in the form of lumps or process it
into rubber sheets. Farmers maintain their farm by applying fertilizers and
pesticides, however modestly due to the high price.
95
// WEST KALIMANTAN / RUBBER
LABOR
EFFICIENCY:
HARVEST
Commodity
Harvested rubber
Rubber
KEY CHALLENGES RECOMMENDATIONS
Weather is a determining factor for the success of rubber harvesting. If it rains, it will spoil
the collected fluids. If it rains heavily, it will wash away the entire harvest. This would heavily
affect farmers’ earnings especially for those who rely on the plantation as their primary
source of income.
NGOs and farmers: Assist farmers to identify and experiment with simple yet
innovative technology ideas to address the weather issue. Also, strengthen farmers’
financial capacity by farming commodities on demand as an alternative income
source.
HOURS OF WORK
Harvest
3 hours/day
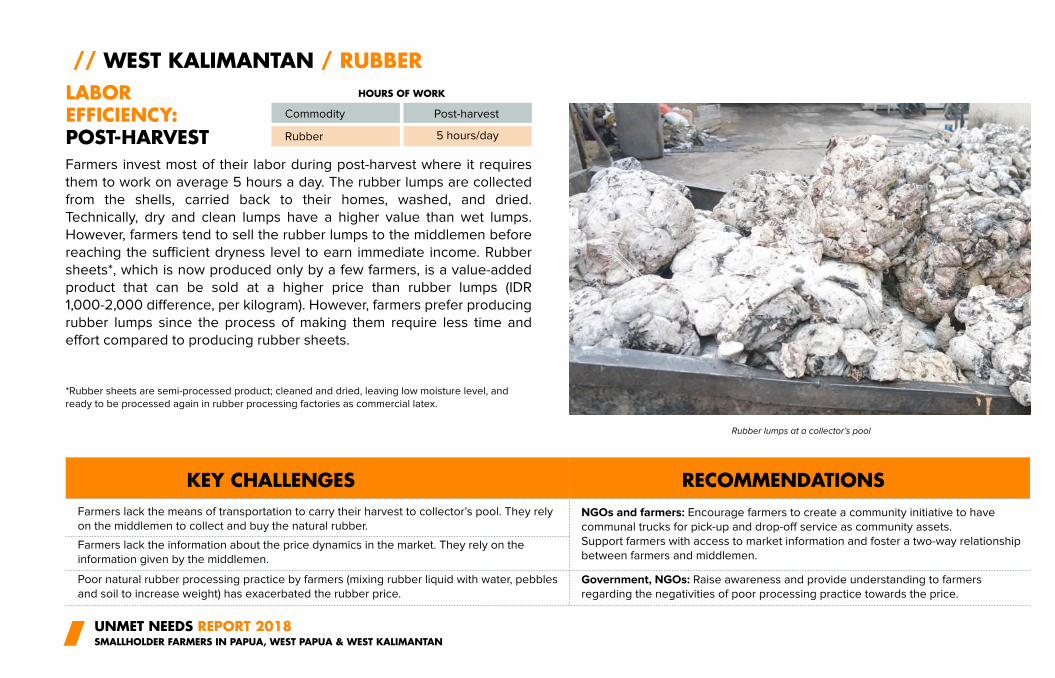
Farmers invest most of their labor during post-harvest where it requires
them to work on average 5 hours a day. The rubber lumps are collected
from the shells, carried back to their homes, washed, and dried.
Technically, dry and clean lumps have a higher value than wet lumps.
However, farmers tend to sell the rubber lumps to the middlemen before
reaching the sufficient dryness level to earn immediate income. Rubber
sheets*, which is now produced only by a few farmers, is a value-added
product that can be sold at a higher price than rubber lumps (IDR
1,000-2,000 difference, per kilogram). However, farmers prefer producing
rubber lumps since the process of making them require less time and
effort compared to producing rubber sheets.
UNMET NEEDS REPORT 2018SMALLHOLDER FARMERS IN PAPUA, WEST PAPUA & WEST KALIMANTAN
// WEST KALIMANTAN / RUBBER
LABOREFFICIENCY:POST-HARVEST
Commodity
Rubber lumps at a collector’s pool
Rubber
KEY CHALLENGES RECOMMENDATIONS
*Rubber sheets are semi-processed product; cleaned and dried, leaving low moisture level, and
ready to be processed again in rubber processing factories as commercial latex.
Farmers lack the means of transportation to carry their harvest to collector’s pool. They rely
on the middlemen to collect and buy the natural rubber.
Farmers lack the information about the price dynamics in the market. They rely on the
information given by the middlemen.
Poor natural rubber processing practice by farmers (mixing rubber liquid with water, pebbles
and soil to increase weight) has exacerbated the rubber price.
NGOs and farmers: Encourage farmers to create a community initiative to have
communal trucks for pick-up and drop-off service as community assets.
Support farmers with access to market information and foster a two-way relationship
between farmers and middlemen.
Government, NGOs: Raise awareness and provide understanding to farmers
regarding the negativities of poor processing practice towards the price.
Post-harvest
HOURS OF WORK
5 hours/day
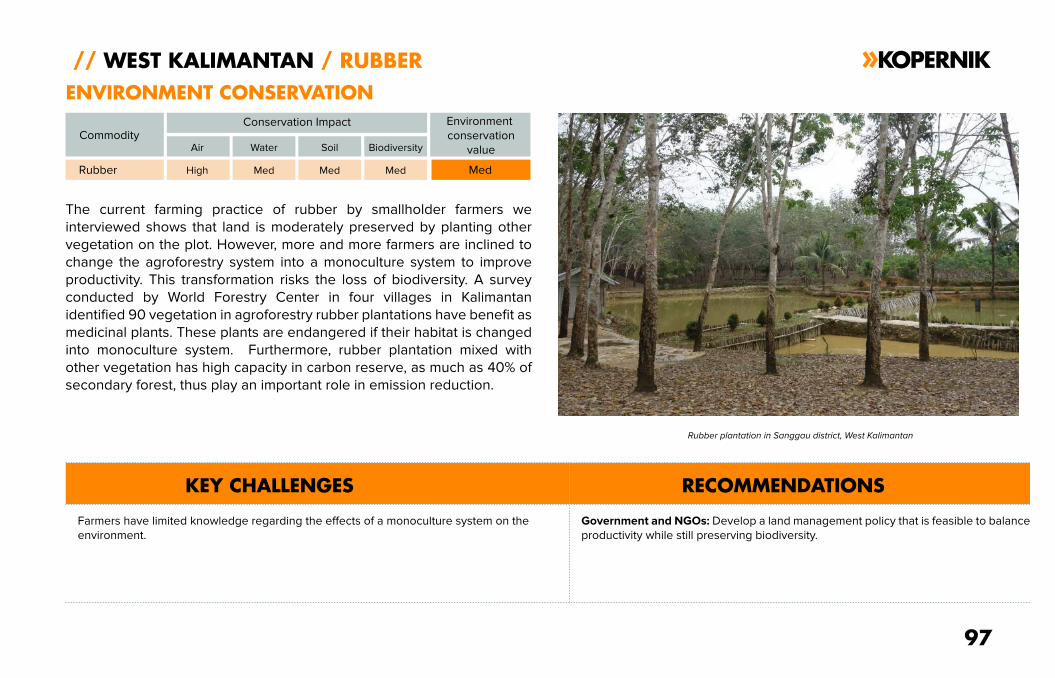
The current farming practice of rubber by smallholder farmers we
interviewed shows that land is moderately preserved by planting other
vegetation on the plot. However, more and more farmers are inclined to
change the agroforestry system into a monoculture system to improve
productivity. This transformation risks the loss of biodiversity. A survey
conducted by World Forestry Center in four villages in Kalimantan
identified 90 vegetation in agroforestry rubber plantations have benefit as
medicinal plants. These plants are endangered if their habitat is changed
into monoculture system. Furthermore, rubber plantation mixed with
other vegetation has high capacity in carbon reserve, as much as 40% of
secondary forest, thus play an important role in emission reduction.
97
// WEST KALIMANTAN / RUBBER
ENVIRONMENT CONSERVATION
KEY CHALLENGES RECOMMENDATIONS
Commodity
Rubber plantation in Sanggau district, West Kalimantan
Rubber High
Farmers have limited knowledge regarding the effects of a monoculture system on the
environment.
Government and NGOs: Develop a land management policy that is feasible to balance
productivity while still preserving biodiversity.
Conservation Impact
Med Med Med Med
Air Water Soil Biodiversity
Environment
conservation
value
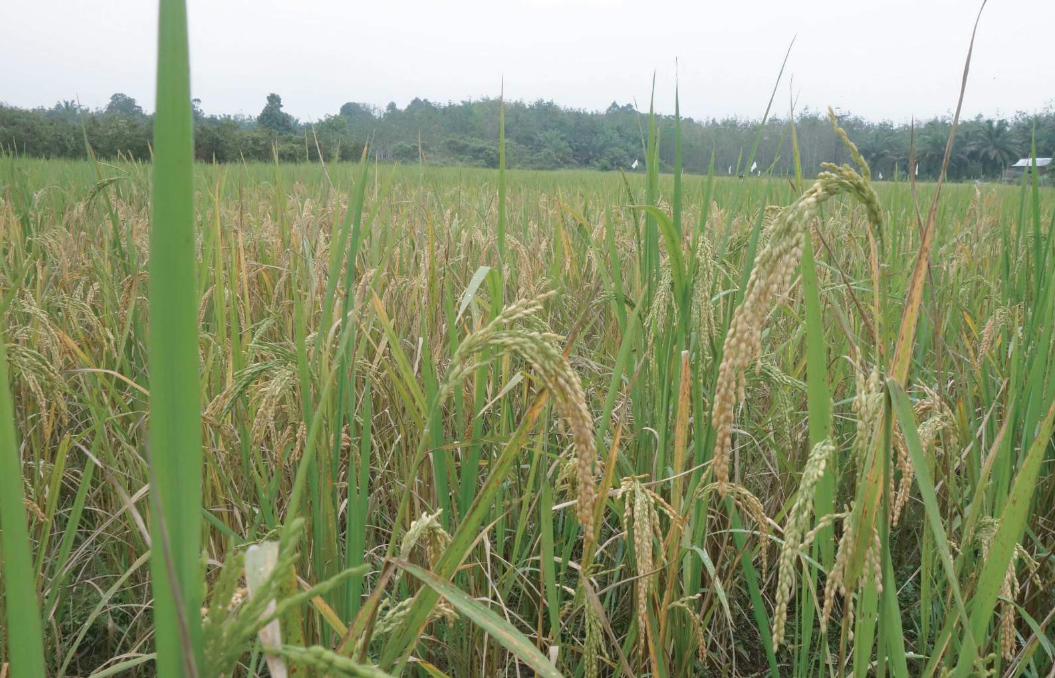
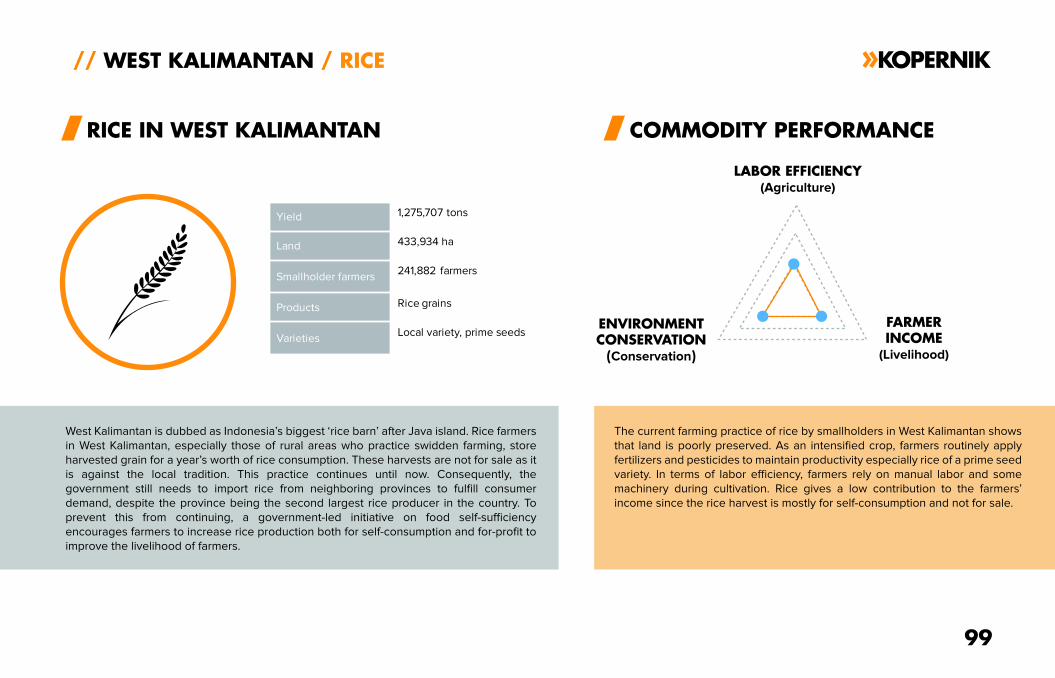
West Kalimantan is dubbed as Indonesia’s biggest ‘rice barn’ after Java island. Rice farmers
in West Kalimantan, especially those of rural areas who practice swidden farming, store
harvested grain for a year’s worth of rice consumption. These harvests are not for sale as it
is against the local tradition. This practice continues until now. Consequently, the
government still needs to import rice from neighboring provinces to fulfill consumer
demand, despite the province being the second largest rice producer in the country. To
prevent this from continuing, a government-led initiative on food self-sufficiency
encourages farmers to increase rice production both for self-consumption and for-profit to
improve the livelihood of farmers.
The current farming practice of rice by smallholders in West Kalimantan shows
that land is poorly preserved. As an intensified crop, farmers routinely apply
fertilizers and pesticides to maintain productivity especially rice of a prime seed
variety. In terms of labor efficiency, farmers rely on manual labor and some
machinery during cultivation. Rice gives a low contribution to the farmers’
income since the rice harvest is mostly for self-consumption and not for sale.
99
// WEST KALIMANTAN / RICE
RICE IN WEST KALIMANTAN COMMODITY PERFORMANCE
LABOR EFFICIENCY(Agriculture)
ENVIRONMENTCONSERVATION
(Conservation)
FARMERINCOME
(Livelihood)
Yield 1,275,707 tons
Land 433,934 ha
Smallholder farmers241,882 farmers
Products Rice grains
VarietiesLocal variety, prime seeds
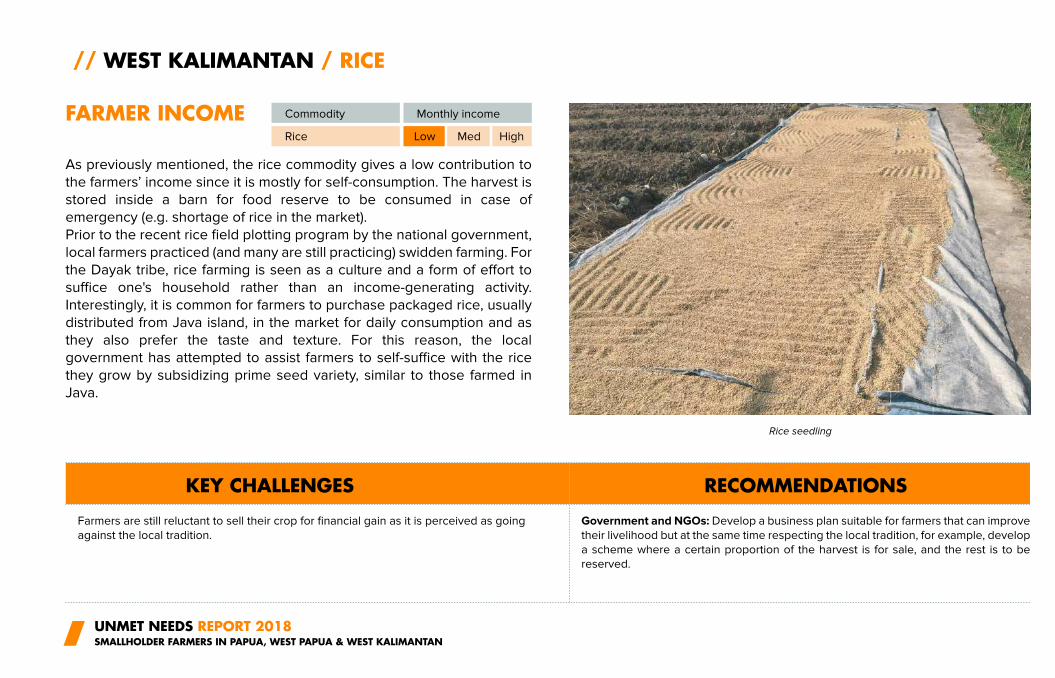
As previously mentioned, the rice commodity gives a low contribution to
the farmers’ income since it is mostly for self-consumption. The harvest is
stored inside a barn for food reserve to be consumed in case of
emergency (e.g. shortage of rice in the market).
Prior to the recent rice field plotting program by the national government,
local farmers practiced (and many are still practicing) swidden farming. For
the Dayak tribe, rice farming is seen as a culture and a form of effort to
suffice one's household rather than an income-generating activity.
Interestingly, it is common for farmers to purchase packaged rice, usually
distributed from Java island, in the market for daily consumption and as
they also prefer the taste and texture. For this reason, the local
government has attempted to assist farmers to self-suffice with the rice
they grow by subsidizing prime seed variety, similar to those farmed in
Java.
UNMET NEEDS REPORT 2018SMALLHOLDER FARMERS IN PAPUA, WEST PAPUA & WEST KALIMANTAN
// WEST KALIMANTAN / RICE
FARMER INCOME Commodity Monthly income
Rice Low Med High
KEY CHALLENGES RECOMMENDATIONS
Rice seedling
Farmers are still reluctant to sell their crop for financial gain as it is perceived as going
against the local tradition.
Government and NGOs: Develop a business plan suitable for farmers that can improve
their livelihood but at the same time respecting the local tradition, for example, develop
a scheme where a certain proportion of the harvest is for sale, and the rest is to be
reserved.
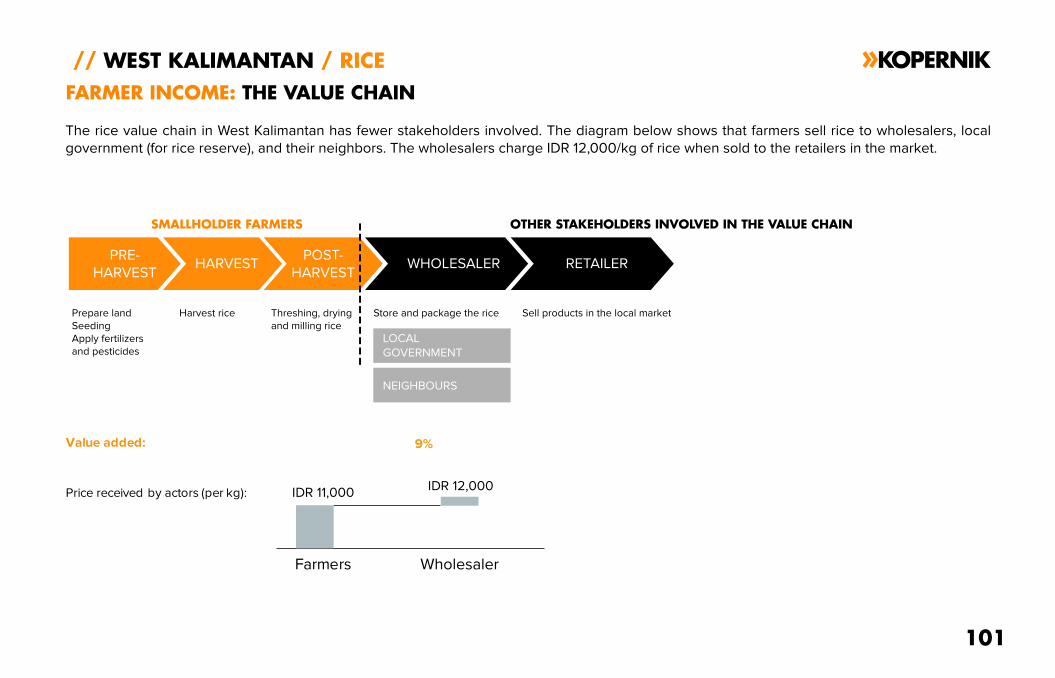
The rice value chain in West Kalimantan has fewer stakeholders involved. The diagram below shows that farmers sell rice to wholesalers, local
government (for rice reserve), and their neighbors. The wholesalers charge IDR 12,000/kg of rice when sold to the retailers in the market.
// WEST KALIMANTAN / RICE
PRE-
HARVESTHARVEST
POST-
HARVESTWHOLESALER
FARMER INCOME: THE VALUE CHAIN
Price received by actors (per kg):
Value added:
Farmers
IDR 11,000
9%
IDR 12,000
Wholesaler
Prepare land
Seeding
Apply fertilizers
and pesticides
Harvest rice Threshing, drying
and milling rice
SMALLHOLDER FARMERS
Store and package the rice
RETAILER
Sell products in the local market
101
LOCAL
GOVERNMENT
NEIGHBOURS
OTHER STAKEHOLDERS INVOLVED IN THE VALUE CHAIN
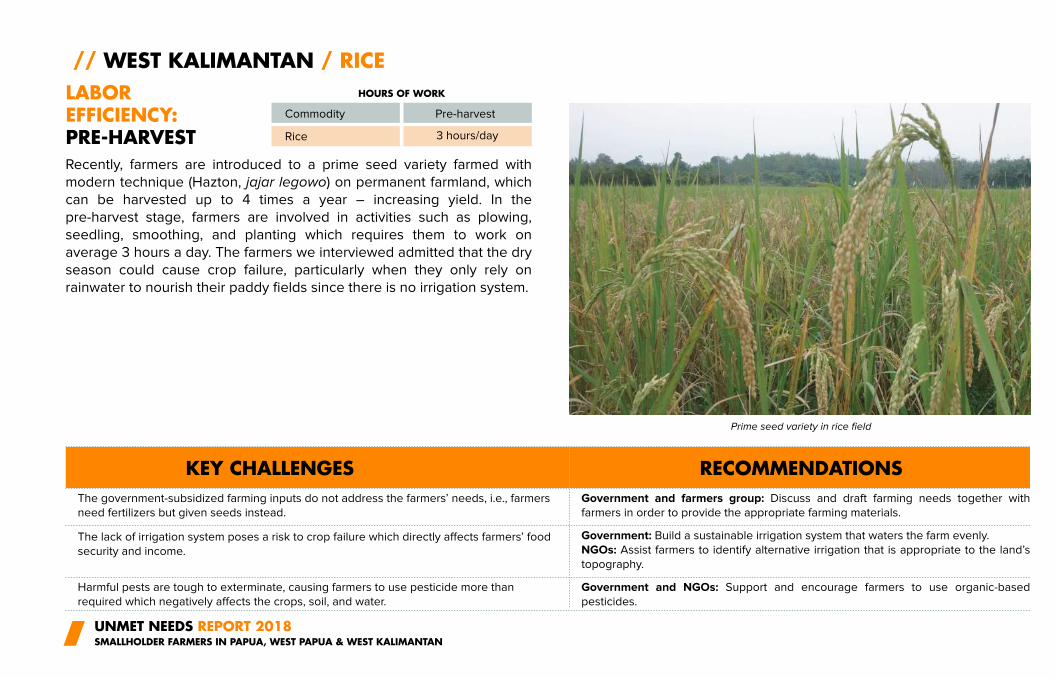
Recently, farmers are introduced to a prime seed variety farmed with
modern technique (Hazton, jajar legowo) on permanent farmland, which
can be harvested up to 4 times a year – increasing yield. In the
pre-harvest stage, farmers are involved in activities such as plowing,
seedling, smoothing, and planting which requires them to work on
average 3 hours a day. The farmers we interviewed admitted that the dry
season could cause crop failure, particularly when they only rely on
rainwater to nourish their paddy fields since there is no irrigation system.
UNMET NEEDS REPORT 2018SMALLHOLDER FARMERS IN PAPUA, WEST PAPUA & WEST KALIMANTAN
// WEST KALIMANTAN / RICE
LABOREFFICIENCY:PRE-HARVEST
Commodity
Prime seed variety in rice field
Rice
KEY CHALLENGES RECOMMENDATIONS
The government-subsidized farming inputs do not address the farmers’ needs, i.e., farmers
need fertilizers but given seeds instead.
The lack of irrigation system poses a risk to crop failure which directly affects farmers’ food
security and income.
Harmful pests are tough to exterminate, causing farmers to use pesticide more than
required which negatively affects the crops, soil, and water.
Government and farmers group: Discuss and draft farming needs together with
farmers in order to provide the appropriate farming materials.
Government: Build a sustainable irrigation system that waters the farm evenly.
NGOs: Assist farmers to identify alternative irrigation that is appropriate to the land’s
topography.
Government and NGOs: Support and encourage farmers to use organic-based
pesticides.
Pre-harvest
3 hours/day
HOURS OF WORK
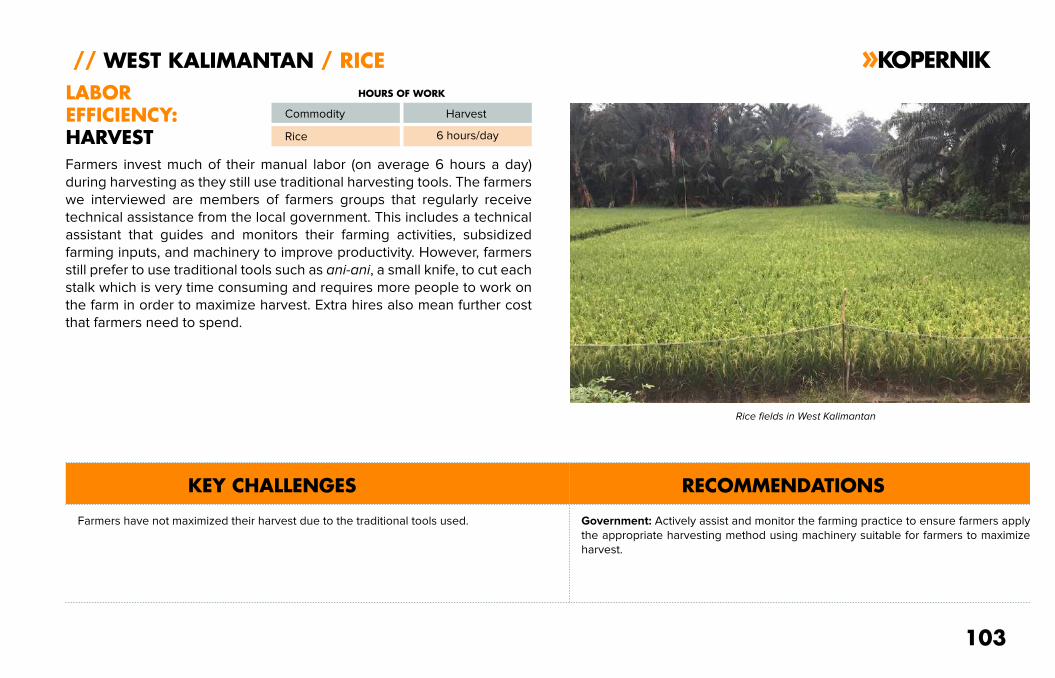
Farmers invest much of their manual labor (on average 6 hours a day)
during harvesting as they still use traditional harvesting tools. The farmers
we interviewed are members of farmers groups that regularly receive
technical assistance from the local government. This includes a technical
assistant that guides and monitors their farming activities, subsidized
farming inputs, and machinery to improve productivity. However, farmers
still prefer to use traditional tools such as ani-ani, a small knife, to cut each
stalk which is very time consuming and requires more people to work on
the farm in order to maximize harvest. Extra hires also mean further cost
that farmers need to spend.
103
// WEST KALIMANTAN / RICE
LABOR
EFFICIENCY:
HARVEST
Commodity
Rice fields in West Kalimantan
Rice
KEY CHALLENGES RECOMMENDATIONS
Farmers have not maximized their harvest due to the traditional tools used. Government: Actively assist and monitor the farming practice to ensure farmers apply
the appropriate harvesting method using machinery suitable for farmers to maximize
harvest.
HOURS OF WORK
Harvest
6 hours/day
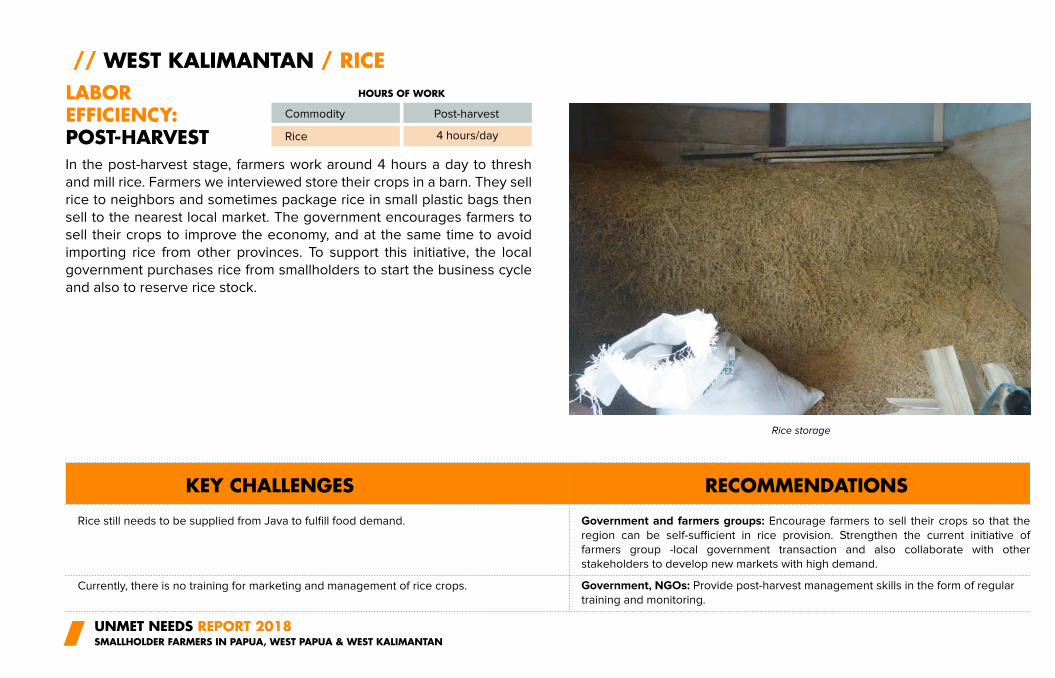
In the post-harvest stage, farmers work around 4 hours a day to thresh
and mill rice. Farmers we interviewed store their crops in a barn. They sell
rice to neighbors and sometimes package rice in small plastic bags then
sell to the nearest local market. The government encourages farmers to
sell their crops to improve the economy, and at the same time to avoid
importing rice from other provinces. To support this initiative, the local
government purchases rice from smallholders to start the business cycle
and also to reserve rice stock.
UNMET NEEDS REPORT 2018SMALLHOLDER FARMERS IN PAPUA, WEST PAPUA & WEST KALIMANTAN
// WEST KALIMANTAN / RICE
LABOREFFICIENCY:POST-HARVEST
Commodity
Rice storage
Rice
KEY CHALLENGES RECOMMENDATIONS
Rice still needs to be supplied from Java to fulfill food demand. Government and farmers groups: Encourage farmers to sell their crops so that the
region can be self-sufficient in rice provision. Strengthen the current initiative of
farmers group -local government transaction and also collaborate with other
stakeholders to develop new markets with high demand.
Currently, there is no training for marketing and management of rice crops. Government, NGOs: Provide post-harvest management skills in the form of regular
training and monitoring.
Post-harvest
HOURS OF WORK
4 hours/day
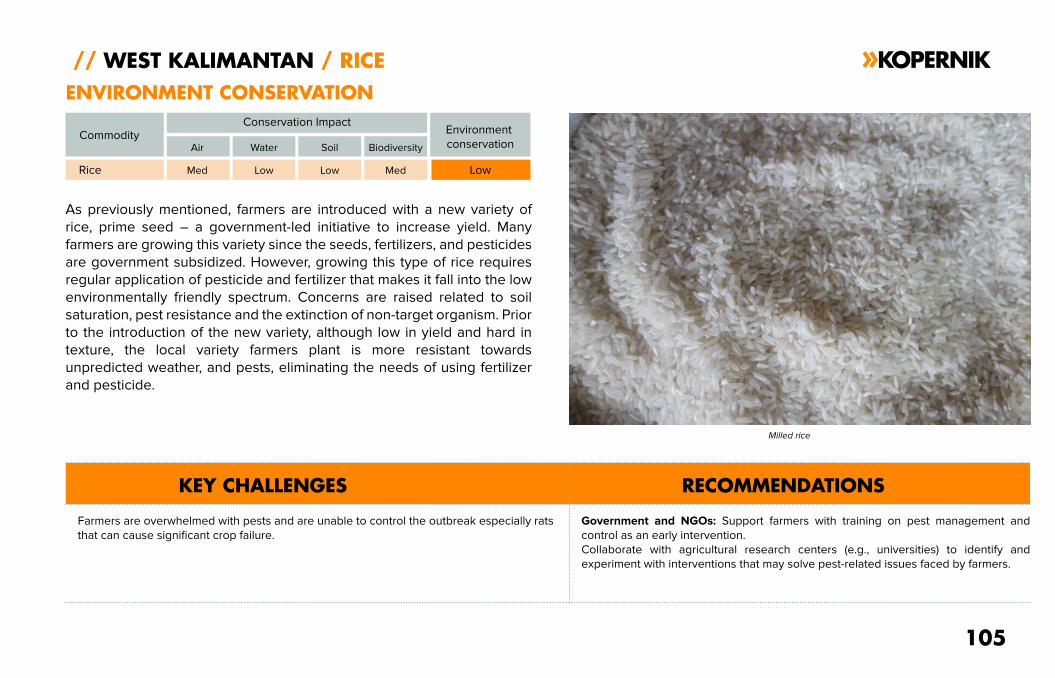
As previously mentioned, farmers are introduced with a new variety of
rice, prime seed – a government-led initiative to increase yield. Many
farmers are growing this variety since the seeds, fertilizers, and pesticides
are government subsidized. However, growing this type of rice requires
regular application of pesticide and fertilizer that makes it fall into the low
environmentally friendly spectrum. Concerns are raised related to soil
saturation, pest resistance and the extinction of non-target organism. Prior
to the introduction of the new variety, although low in yield and hard in
texture, the local variety farmers plant is more resistant towards
unpredicted weather, and pests, eliminating the needs of using fertilizer
and pesticide.
105
// WEST KALIMANTAN / RICE
ENVIRONMENT CONSERVATION
KEY CHALLENGES RECOMMENDATIONS
Commodity
Milled rice
Rice Med
Farmers are overwhelmed with pests and are unable to control the outbreak especially rats
that can cause significant crop failure.
Government and NGOs: Support farmers with training on pest management and
control as an early intervention.
Collaborate with agricultural research centers (e.g., universities) to identify and
experiment with interventions that may solve pest-related issues faced by farmers.
Conservation Impact
Low Low Med Low
Air Water Soil Biodiversity
Environment
conservation
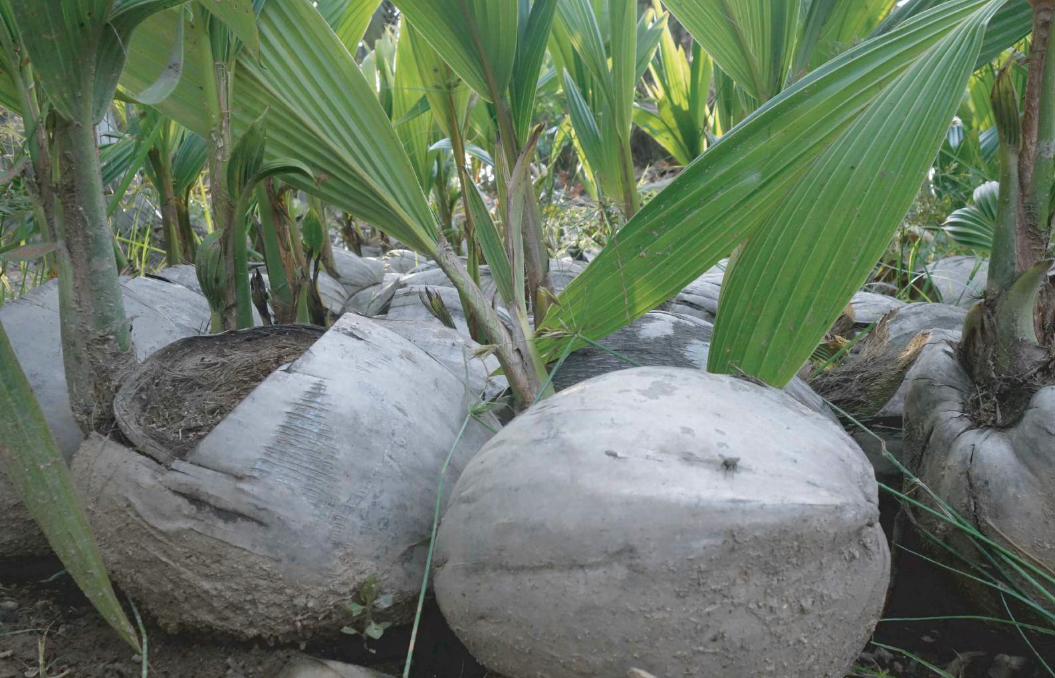
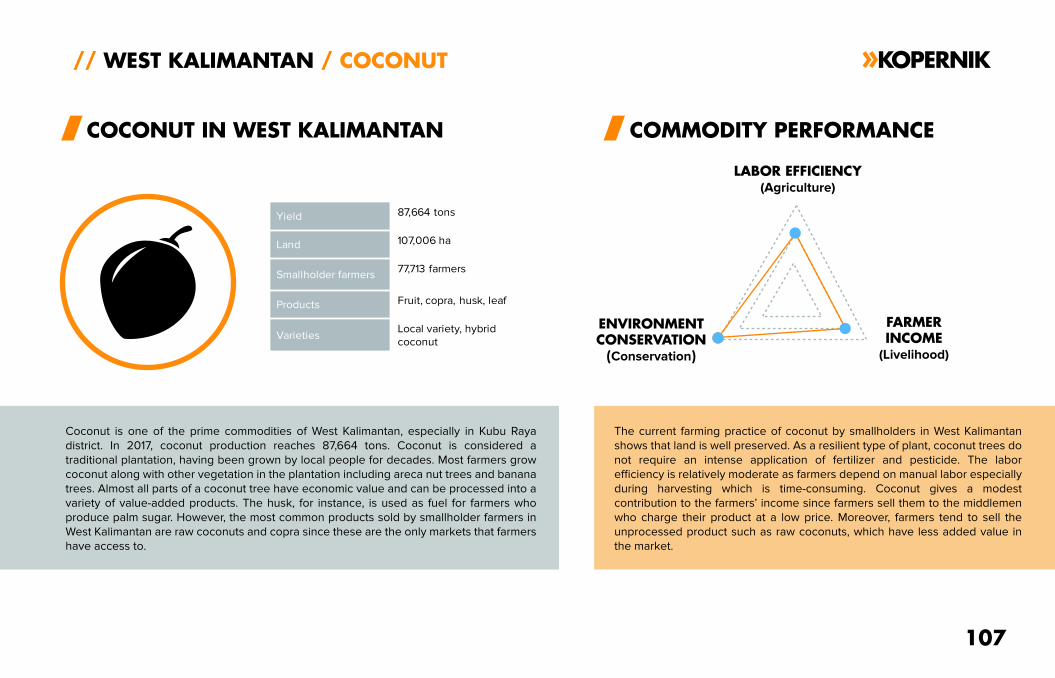
Coconut is one of the prime commodities of West Kalimantan, especially in Kubu Raya
district. In 2017, coconut production reaches 87,664 tons. Coconut is considered a
traditional plantation, having been grown by local people for decades. Most farmers grow
coconut along with other vegetation in the plantation including areca nut trees and banana
trees. Almost all parts of a coconut tree have economic value and can be processed into a
variety of value-added products. The husk, for instance, is used as fuel for farmers who
produce palm sugar. However, the most common products sold by smallholder farmers in
West Kalimantan are raw coconuts and copra since these are the only markets that farmers
have access to.
The current farming practice of coconut by smallholders in West Kalimantan
shows that land is well preserved. As a resilient type of plant, coconut trees do
not require an intense application of fertilizer and pesticide. The labor
efficiency is relatively moderate as farmers depend on manual labor especially
during harvesting which is time-consuming. Coconut gives a modest
contribution to the farmers’ income since farmers sell them to the middlemen
who charge their product at a low price. Moreover, farmers tend to sell the
unprocessed product such as raw coconuts, which have less added value in
the market.
107
// WEST KALIMANTAN / COCONUT
COCONUT IN WEST KALIMANTAN COMMODITY PERFORMANCE
LABOR EFFICIENCY(Agriculture)
ENVIRONMENTCONSERVATION
(Conservation)
FARMERINCOME
(Livelihood)
Yield 87,664 tons
Land 107,006 ha
Smallholder farmers77,713 farmers
Products Fruit, copra, husk, leaf
VarietiesLocal variety, hybrid
coconut
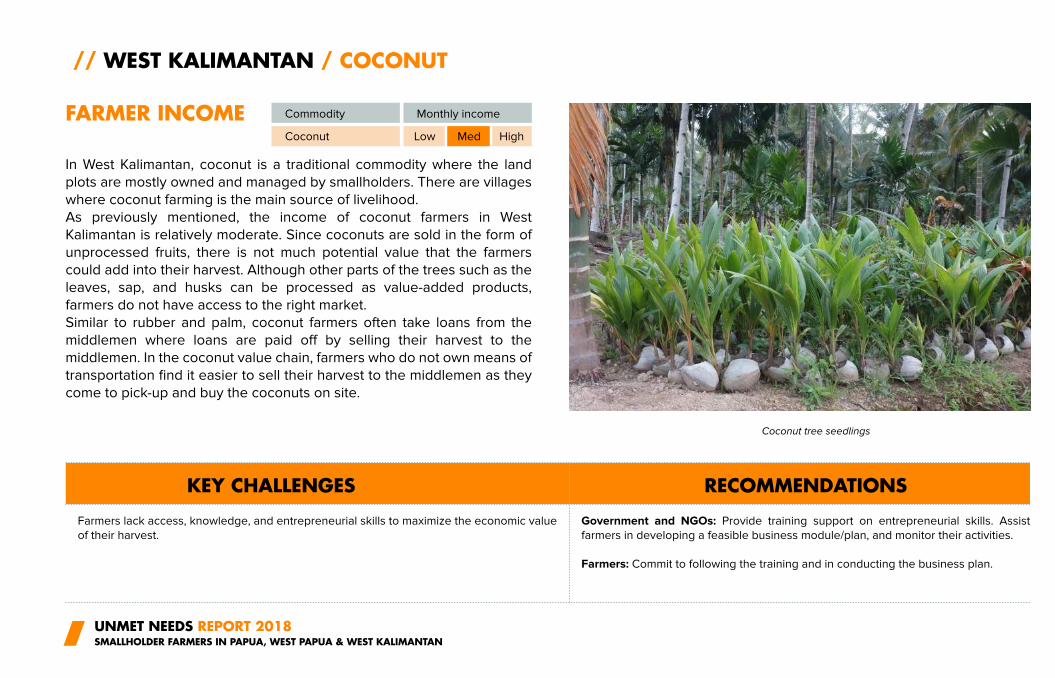
In West Kalimantan, coconut is a traditional commodity where the land
plots are mostly owned and managed by smallholders. There are villages
where coconut farming is the main source of livelihood.
As previously mentioned, the income of coconut farmers in West
Kalimantan is relatively moderate. Since coconuts are sold in the form of
unprocessed fruits, there is not much potential value that the farmers
could add into their harvest. Although other parts of the trees such as the
leaves, sap, and husks can be processed as value-added products,
farmers do not have access to the right market.
Similar to rubber and palm, coconut farmers often take loans from the
middlemen where loans are paid off by selling their harvest to the
middlemen. In the coconut value chain, farmers who do not own means of
transportation find it easier to sell their harvest to the middlemen as they
come to pick-up and buy the coconuts on site.
UNMET NEEDS REPORT 2018SMALLHOLDER FARMERS IN PAPUA, WEST PAPUA & WEST KALIMANTAN
// WEST KALIMANTAN / COCONUT
FARMER INCOME Commodity Monthly income
Coconut Low Med High
KEY CHALLENGES RECOMMENDATIONS
Coconut tree seedlings
Farmers lack access, knowledge, and entrepreneurial skills to maximize the economic value
of their harvest.
Government and NGOs: Provide training support on entrepreneurial skills. Assist
farmers in developing a feasible business module/plan, and monitor their activities.
Farmers: Commit to following the training and in conducting the business plan.
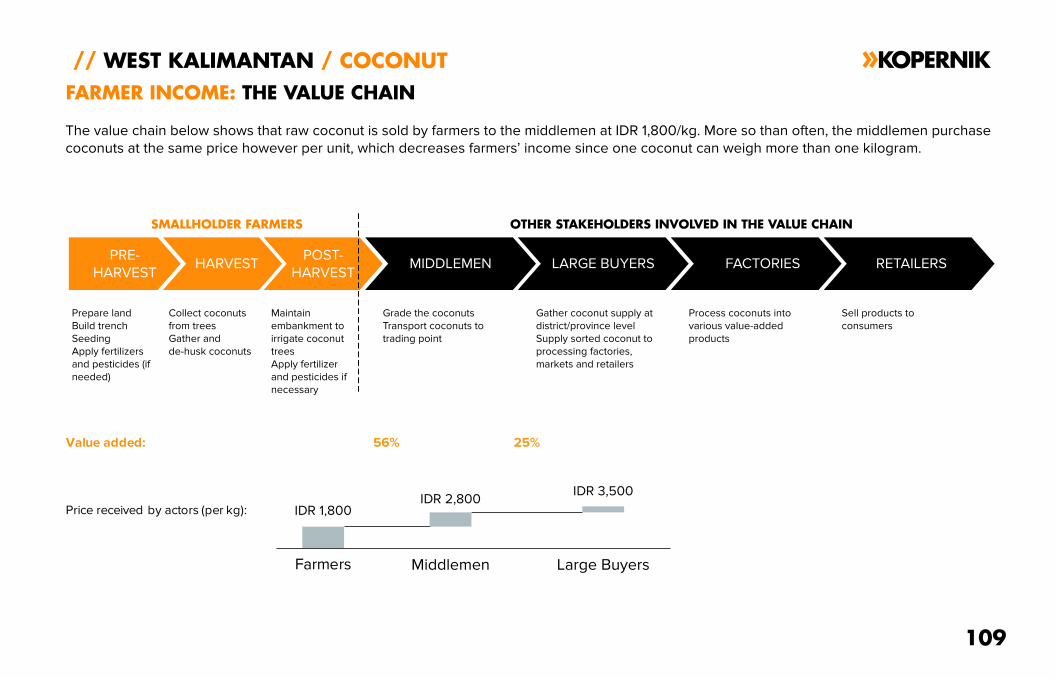
The value chain below shows that raw coconut is sold by farmers to the middlemen at IDR 1,800/kg. More so than often, the middlemen purchase
coconuts at the same price however per unit, which decreases farmers’ income since one coconut can weigh more than one kilogram.
109
// WEST KALIMANTAN / COCONUT
PRE-
HARVESTHARVEST
POST-
HARVESTMIDDLEMEN
FARMER INCOME: THE VALUE CHAIN
Price received by actors (per kg):
Value added:
Farmers
IDR 1,800
56%
Middlemen Large Buyers
IDR 2,800IDR 3,500
Prepare land
Build trench
Seeding
Apply fertilizers
and pesticides (if
needed)
Collect coconuts
from trees
Gather and
de-husk coconuts
Maintain
embankment to
irrigate coconut
trees
Apply fertilizer
and pesticides if
necessary
SMALLHOLDER FARMERS
LARGE BUYERS FACTORIES RETAILERS
Grade the coconuts
Transport coconuts to
trading point
Gather coconut supply at
district/province level
Supply sorted coconut to
processing factories,
markets and retailers
Process coconuts into
various value-added
products
Sell products to
consumers
25%
OTHER STAKEHOLDERS INVOLVED IN THE VALUE CHAIN
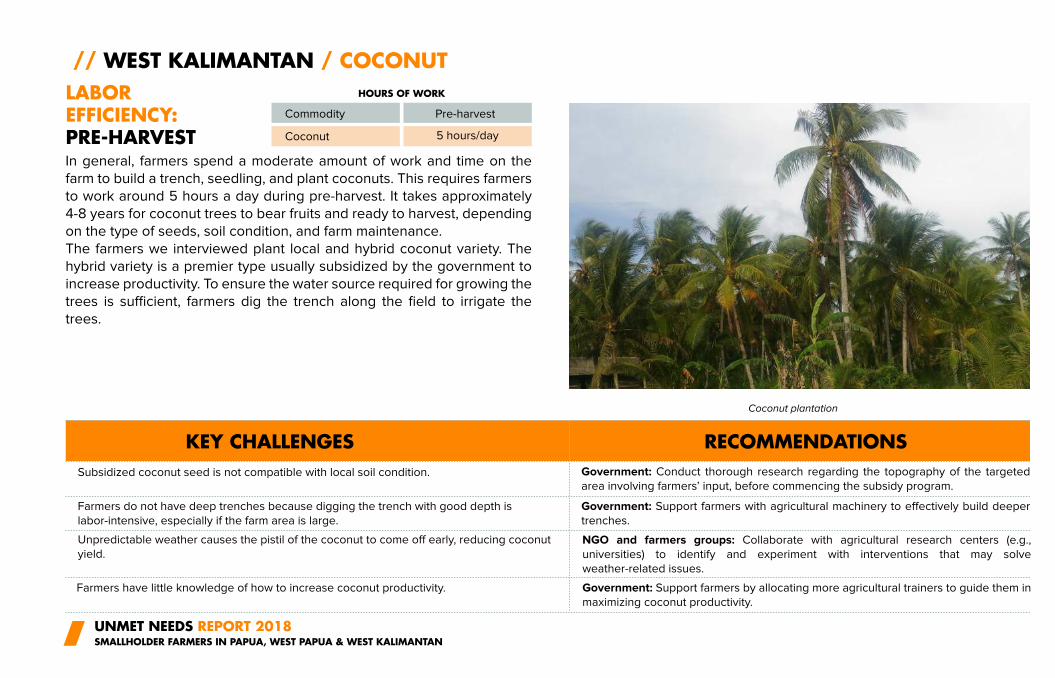
In general, farmers spend a moderate amount of work and time on the
farm to build a trench, seedling, and plant coconuts. This requires farmers
to work around 5 hours a day during pre-harvest. It takes approximately
4-8 years for coconut trees to bear fruits and ready to harvest, depending
on the type of seeds, soil condition, and farm maintenance.
The farmers we interviewed plant local and hybrid coconut variety. The
hybrid variety is a premier type usually subsidized by the government to
increase productivity. To ensure the water source required for growing the
trees is sufficient, farmers dig the trench along the field to irrigate the
trees.
UNMET NEEDS REPORT 2018SMALLHOLDER FARMERS IN PAPUA, WEST PAPUA & WEST KALIMANTAN
// WEST KALIMANTAN / COCONUT
LABOR EFFICIENCY:PRE-HARVEST
Commodity
Coconut
KEY CHALLENGES RECOMMENDATIONS
Subsidized coconut seed is not compatible with local soil condition.
Farmers do not have deep trenches because digging the trench with good depth is
labor-intensive, especially if the farm area is large.
Unpredictable weather causes the pistil of the coconut to come off early, reducing coconut
yield.
Farmers have little knowledge of how to increase coconut productivity.
Government: Conduct thorough research regarding the topography of the targeted
area involving farmers’ input, before commencing the subsidy program.
Government: Support farmers with agricultural machinery to effectively build deeper
trenches.
NGO and farmers groups: Collaborate with agricultural research centers (e.g.,
universities) to identify and experiment with interventions that may solve
weather-related issues.
Government: Support farmers by allocating more agricultural trainers to guide them in
maximizing coconut productivity.
Coconut plantation
Pre-harvest
5 hours/day
HOURS OF WORK
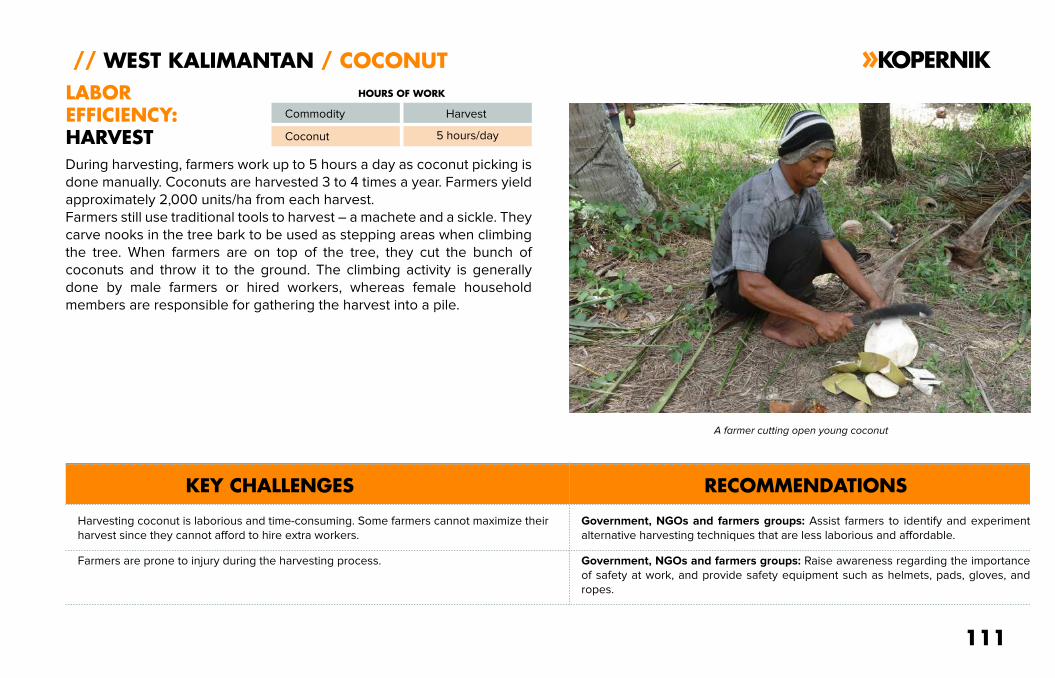
During harvesting, farmers work up to 5 hours a day as coconut picking is
done manually. Coconuts are harvested 3 to 4 times a year. Farmers yield
approximately 2,000 units/ha from each harvest.
Farmers still use traditional tools to harvest – a machete and a sickle. They
carve nooks in the tree bark to be used as stepping areas when climbing
the tree. When farmers are on top of the tree, they cut the bunch of
coconuts and throw it to the ground. The climbing activity is generally
done by male farmers or hired workers, whereas female household
members are responsible for gathering the harvest into a pile.
111
// WEST KALIMANTAN / COCONUT
LABOR
EFFICIENCY:
HARVEST
Commodity
A farmer cutting open young coconut
Coconut
KEY CHALLENGES RECOMMENDATIONS
Government, NGOs and farmers groups: Assist farmers to identify and experiment
alternative harvesting techniques that are less laborious and affordable.
Harvesting coconut is laborious and time-consuming. Some farmers cannot maximize their
harvest since they cannot afford to hire extra workers.
Farmers are prone to injury during the harvesting process. Government, NGOs and farmers groups: Raise awareness regarding the importance
of safety at work, and provide safety equipment such as helmets, pads, gloves, and
ropes.
HOURS OF WORK
Harvest
5 hours/day
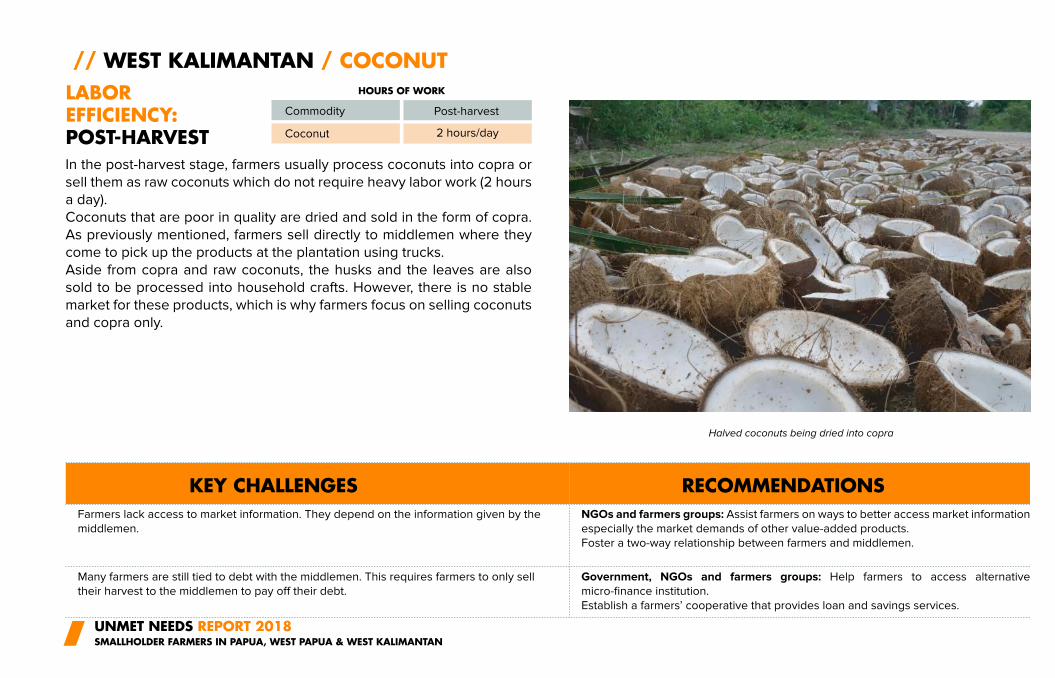
In the post-harvest stage, farmers usually process coconuts into copra or
sell them as raw coconuts which do not require heavy labor work (2 hours
a day).
Coconuts that are poor in quality are dried and sold in the form of copra.
As previously mentioned, farmers sell directly to middlemen where they
come to pick up the products at the plantation using trucks.
Aside from copra and raw coconuts, the husks and the leaves are also
sold to be processed into household crafts. However, there is no stable
market for these products, which is why farmers focus on selling coconuts
and copra only.
UNMET NEEDS REPORT 2018SMALLHOLDER FARMERS IN PAPUA, WEST PAPUA & WEST KALIMANTAN
// WEST KALIMANTAN / COCONUT
LABOREFFICIENCY:POST-HARVEST
Commodity
Halved coconuts being dried into copra
Coconut
KEY CHALLENGES RECOMMENDATIONS
NGOs and farmers groups: Assist farmers on ways to better access market information
especially the market demands of other value-added products.
Foster a two-way relationship between farmers and middlemen.
Farmers lack access to market information. They depend on the information given by the
middlemen.
Many farmers are still tied to debt with the middlemen. This requires farmers to only sell
their harvest to the middlemen to pay off their debt.
Government, NGOs and farmers groups: Help farmers to access alternative
micro-finance institution.
Establish a farmers’ cooperative that provides loan and savings services.
Post-harvest
HOURS OF WORK
2 hours/day
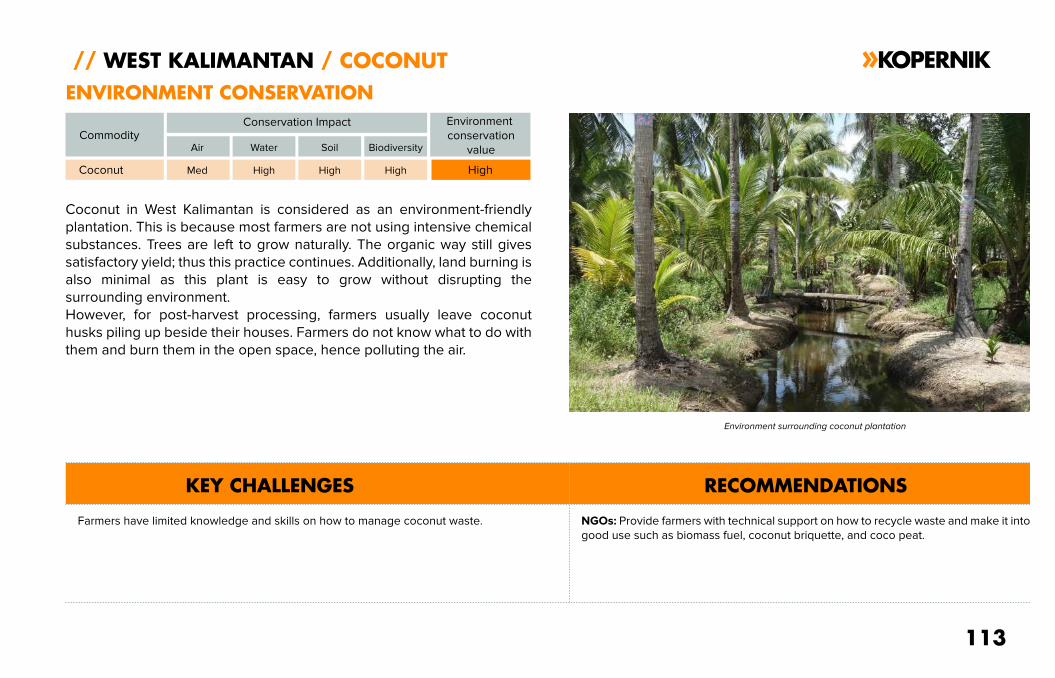
Coconut in West Kalimantan is considered as an environment-friendly
plantation. This is because most farmers are not using intensive chemical
substances. Trees are left to grow naturally. The organic way still gives
satisfactory yield; thus this practice continues. Additionally, land burning is
also minimal as this plant is easy to grow without disrupting the
surrounding environment.
However, for post-harvest processing, farmers usually leave coconut
husks piling up beside their houses. Farmers do not know what to do with
them and burn them in the open space, hence polluting the air.
// WEST KALIMANTAN / COCONUT
ENVIRONMENT CONSERVATION
KEY CHALLENGES RECOMMENDATIONS
Commodity
Environment surrounding coconut plantation
Coconut Med
Farmers have limited knowledge and skills on how to manage coconut waste. NGOs: Provide farmers with technical support on how to recycle waste and make it into
good use such as biomass fuel, coconut briquette, and coco peat.
Conservation Impact
High High High High
Air Water Soil Biodiversity
113
Environment
conservation
value
UNMET NEEDS REPORT 2018SMALLHOLDER FARMERS IN PAPUA, WEST PAPUA & WEST KALIMANTAN
The key findings provide us with a better understanding of current agricultural practices in the
three provinces and their impact on farmers’ livelihood and the environment. This allows us to
suggest, design and experiment potential solutions in the next step towards sustainable
agriculture that is in favor of all stakeholders involved, in particular, the smallholder farmers.
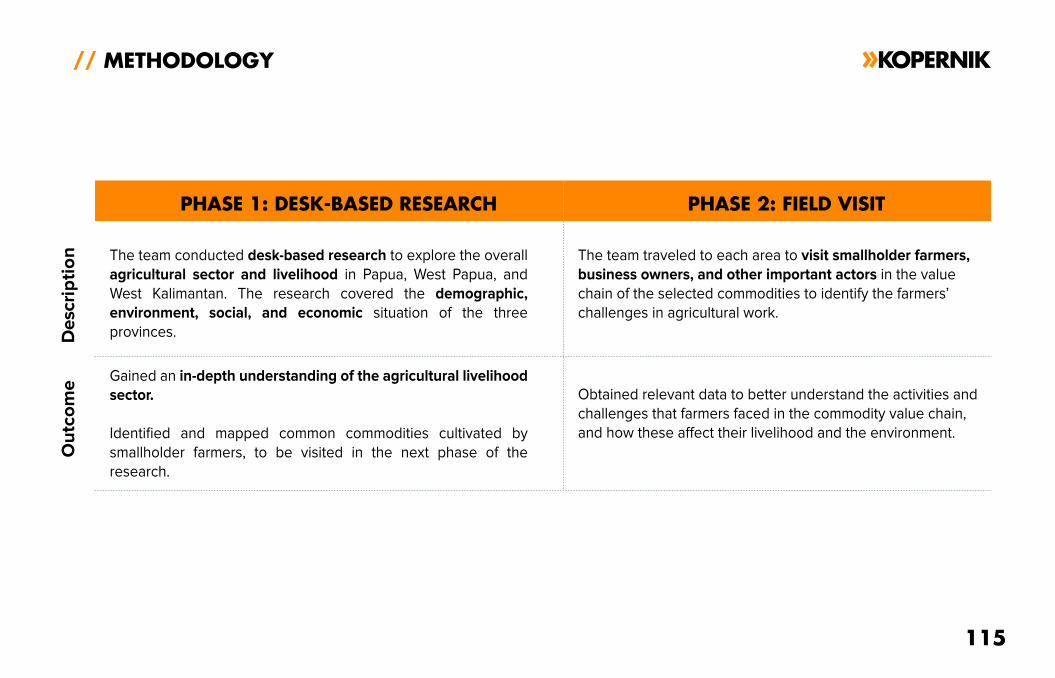
115
// METHODOLOGY
PHASE 1: DESK-BASED RESEARCH PHASE 2: FIELD VISIT
The team conducted desk-based research to explore the overall
agricultural sector and livelihood in Papua, West Papua, and
West Kalimantan. The research covered the demographic,
environment, social, and economic situation of the three
provinces.
The team traveled to each area to visit smallholder farmers,
business owners, and other important actors in the value
chain of the selected commodities to identify the farmers’
challenges in agricultural work.
De
scri
pti
on
Ou
tco
me
Gained an in-depth understanding of the agricultural livelihood
sector.
Identified and mapped common commodities cultivated by
smallholder farmers, to be visited in the next phase of the
research.
Obtained relevant data to better understand the activities and
challenges that farmers faced in the commodity value chain,
and how these affect their livelihood and the environment.
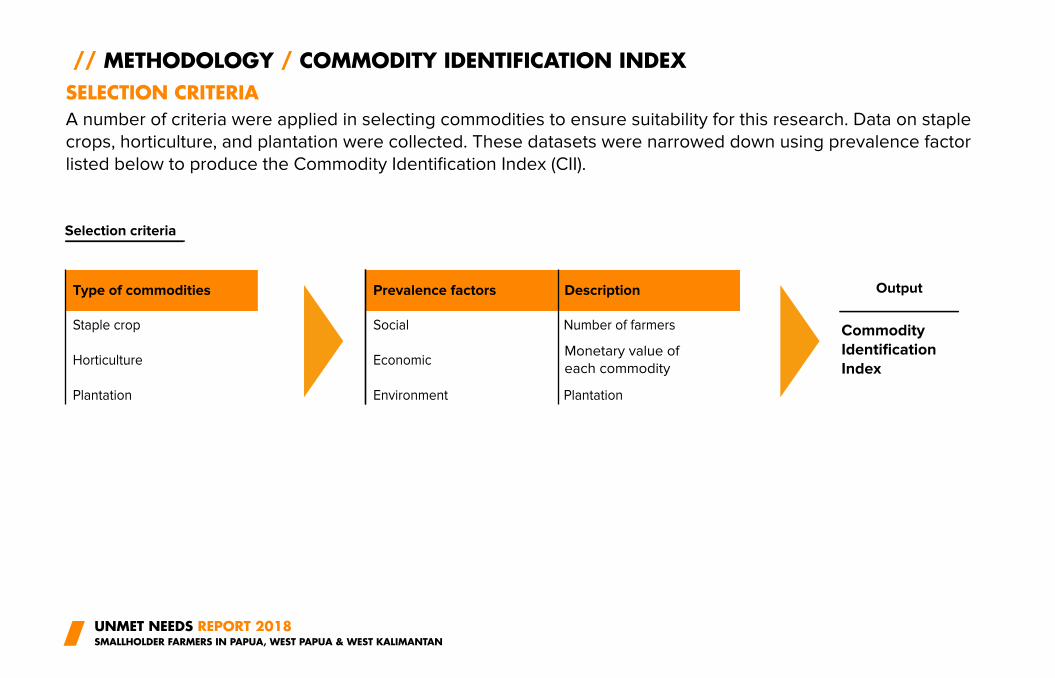
UNMET NEEDS REPORT 2018SMALLHOLDER FARMERS IN PAPUA, WEST PAPUA & WEST KALIMANTAN
Type of commodities
// METHODOLOGY / COMMODITY IDENTIFICATION INDEX
SELECTION CRITERIA
A number of criteria were applied in selecting commodities to ensure suitability for this research. Data on staple
crops, horticulture, and plantation were collected. These datasets were narrowed down using prevalence factor
listed below to produce the Commodity Identification Index (CII).
Staple crop
Horticulture
Plantation
Prevalence factors
Social
Economic
Environment
Description
Number of farmers
Plantation
Monetary value of
each commodity
Output
Commodity
Identification
Index
Selection criteria
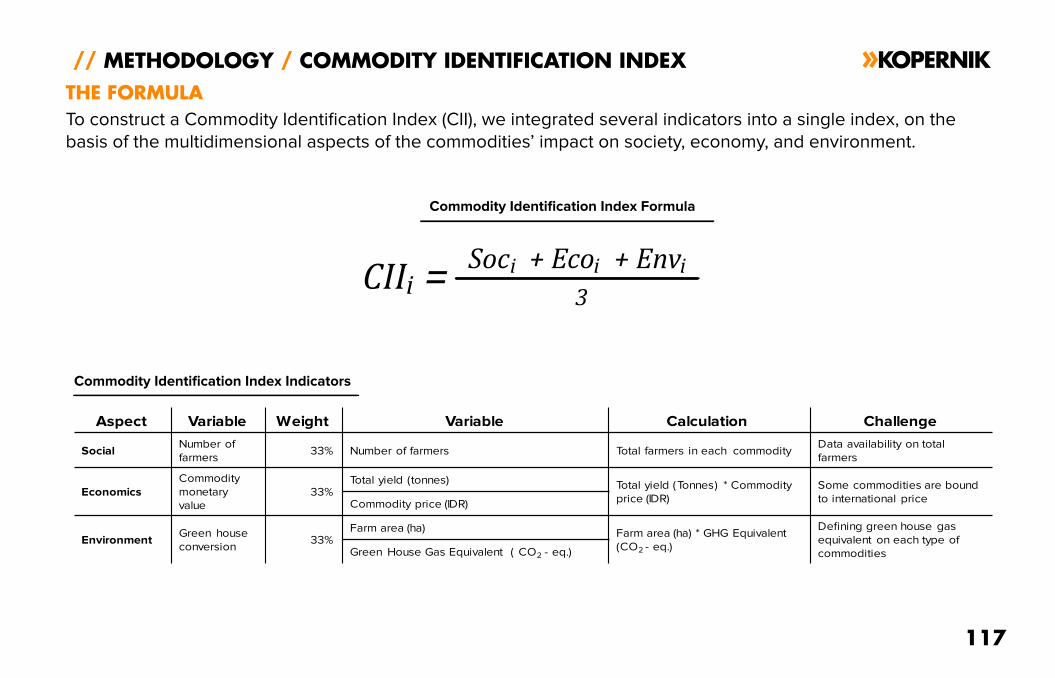
117
// METHODOLOGY / COMMODITY IDENTIFICATION INDEX
THE FORMULA
To construct a Commodity Identification Index (CII), we integrated several indicators into a single index, on the
basis of the multidimensional aspects of the commodities’ impact on society, economy, and environment.
Commodity Identification Index Indicators
Aspect Variable Weight Variable Calculation Challenge
SocialNumber of farmers
33% Number of farmers Total farmers in each commodityData availability on total farmers
Economics
Commoditymonetaryvalue
33%Total yield (tonnes) Total yield (Tonnes) * Commodity
price (IDR)Some commodities are bound to international priceCommodity price (IDR)
EnvironmentGreen house conversion
33%Farm area (ha) Farm area (ha) * GHG Equivalent
(CO2 - eq.)
Defining green house gas equivalent on each type of commoditiesGreen House Gas Equivalent ( CO2 - eq.)
CII iSoc + Eco + Env
3
i i i=
Commodity Identification Index Formula
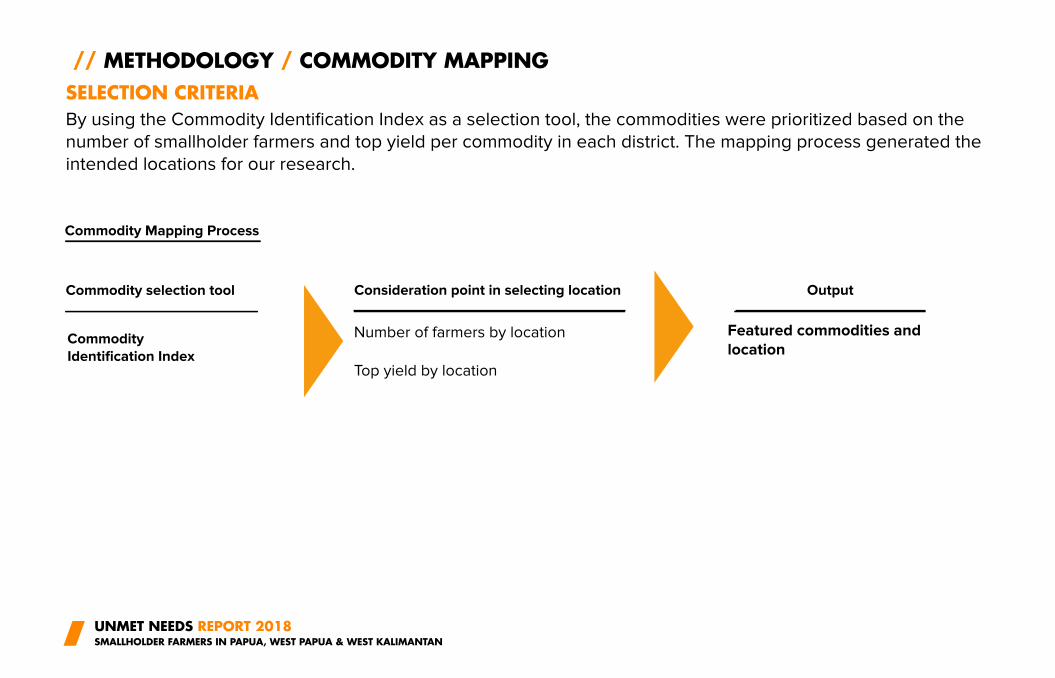
UNMET NEEDS REPORT 2018SMALLHOLDER FARMERS IN PAPUA, WEST PAPUA & WEST KALIMANTAN
Commodity selection tool
// METHODOLOGY / COMMODITY MAPPING
SELECTION CRITERIA
By using the Commodity Identification Index as a selection tool, the commodities were prioritized based on the
number of smallholder farmers and top yield per commodity in each district. The mapping process generated the
intended locations for our research.
Output
Featured commodities and
location
Commodity Mapping Process
Commodity
Identification Index
Consideration point in selecting location
Number of farmers by location
Top yield by location
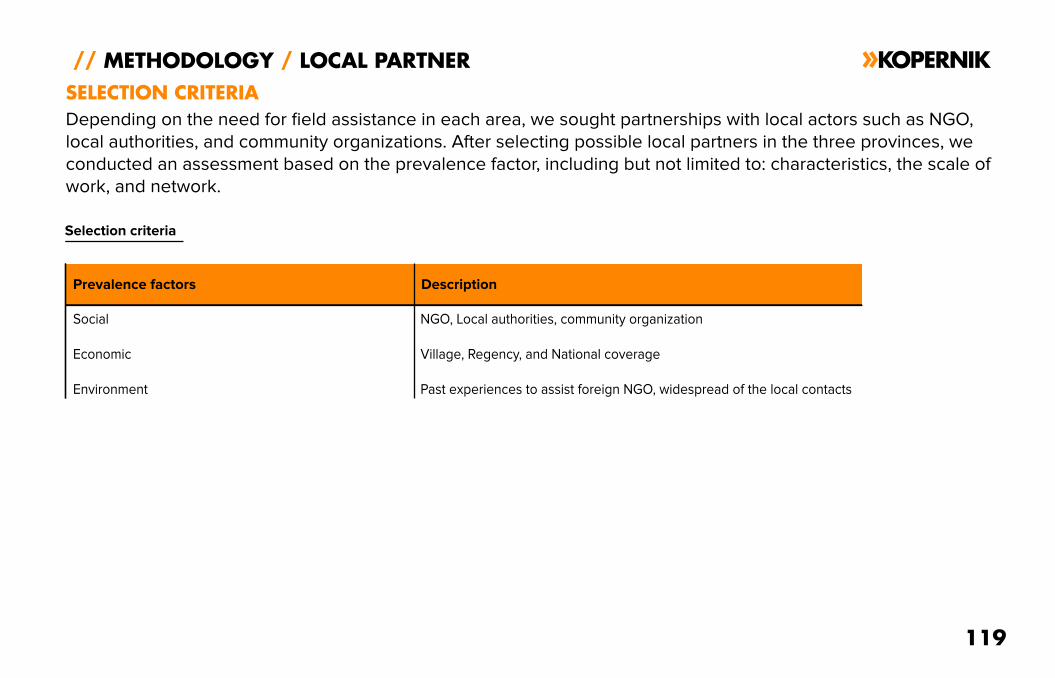
119
// METHODOLOGY / LOCAL PARTNER
SELECTION CRITERIA
Depending on the need for field assistance in each area, we sought partnerships with local actors such as NGO,
local authorities, and community organizations. After selecting possible local partners in the three provinces, we
conducted an assessment based on the prevalence factor, including but not limited to: characteristics, the scale of
work, and network.
Prevalence factors
Social
Economic
Environment
Description
NGO, Local authorities, community organization
Village, Regency, and National coverage
Past experiences to assist foreign NGO, widespread of the local contacts
Selection criteria
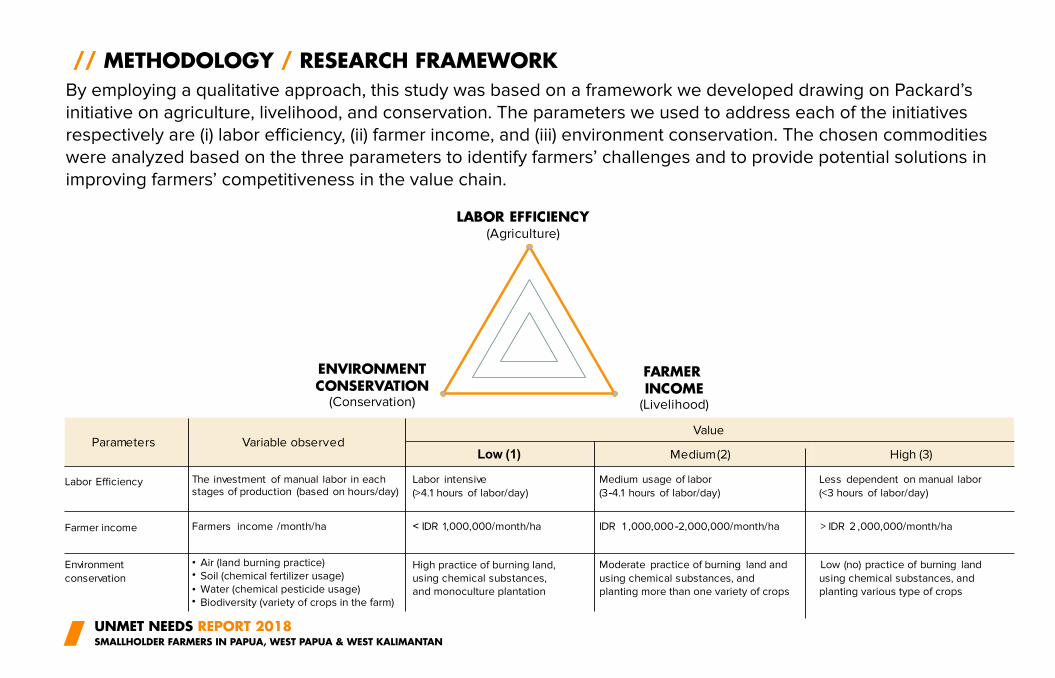
// METHODOLOGY / RESEARCH FRAMEWORK
By employing a qualitative approach, this study was based on a framework we developed drawing on Packard’s
initiative on agriculture, livelihood, and conservation. The parameters we used to address each of the initiatives
respectively are (i) labor efficiency, (ii) farmer income, and (iii) environment conservation. The chosen commodities
were analyzed based on the three parameters to identify farmers’ challenges and to provide potential solutions in
improving farmers’ competitiveness in the value chain.
LABOR EFFICIENCY(Agriculture)
ENVIRONMENT
CONSERVATION(Conservation)
FARMER
INCOME(Livelihood)
Parameters Variable observedValue
Low (1) Medium (2) High (3)
Labor Efficiency The investment of manual labor in each stages of production (based on hours/day)
Labor intensive
(>4.1 hours of labor/day)
Medium usage of labor
(3-4.1 hours of labor/day)
Less dependent on manual labor
(<3 hours of labor/day)
Farmer income Farmers income /month/ha < IDR 1,000,000/month/ha IDR 1 ,000,000 -2,000,000/month/ha > IDR 2 ,000,000/month/ha
Environment
conservation
• Air (land burning practice)
Soil (chemical fertilizer usage)
Water (chemical pesticide usage)
Biodiversity (variety of crops in the farm)
High practice of burning land,
using chemical substances,
and monoculture plantation
Moderate practice of burning land and
using chemical substances, and
planting more than one variety of crops
Low (no) practice of burning land
using chemical substances, and
planting various type of crops
•
•
•
UNMET NEEDS REPORT 2018SMALLHOLDER FARMERS IN PAPUA, WEST PAPUA & WEST KALIMANTAN
121
// BIBLIOGRAPHY
Agne, S., Fleisher, G., Jungbluth, F. & H. Weibel (1995) Guidelines for Pesticide Policy Studies: A framework for analysing economic and political
factors of pesticide use in developing countries. Pesticide Policy Project, Publication Series No. 1. Hannover: Hannover University
Andrianto, A., Sedik, B. F., Waridjo, H., Komarudin, H., & Obidzinski, K. (2014). The impacts of oil palm plantations on forests and people in Papua:
A case study from Boven Digoel District (Vol. 163). CIFOR.
Arumingtyas, L. (2017) Ketika RSPO dorong perluasan sertifikasi kebun sawit petani kecil. Retrieved from
https://www.mongabay.co.id/2017/12/05/ketika-rspo-dorong-perluasan-sertifikasi-kebun-sawit-petani-kecil/
Badan Pusat Statistik. (2013). Indonesia - Census of agriculture 2013. Retrieved from
https://microdata.bps.go.id/mikrodata/index.php/ddibrowser/398/export/?format=pdf&generate=yes
Badan Pusat Statistik (2017). Statistik lingkungan hidup Indonesia 2017. Retrieved from
https://unstats.un.org/unsd/environment/Compendia/Statistik%20Lingkungan%20Hidup%20Indonesia%202017.pdf
Badan Pusat Statistik Provinsi Kalimantan Barat (2017). Kalimantan Barat dalam angka 2017. Retrieved from
https://kalbar.bps.go.id/publication/2017/08/11/de84c4884c60a3685dd1772f/provinsi-kalimantan-barat-dalam-angka-2017.html
Badan Pusat Statistik Provinsi Papua. (2017). Papua dalam angka 2017. Retrieved from
https://papua.bps.go.id/publication/2017/08/12/8c2f0255727bf86ad3136948/provinsi-papua-dalam-angka-2017.html
Badan Pusat Statistik Provinsi Papua Barat. (2017). Papua Barat dalam angka 2017. Retrieved from
https://papuabarat.bps.go.id/publication/2017/08/11/39c51c3cbf26301e2e9f81f6/provinsi-papua-barat-dalam-angka-2017.html
Balai Besar Pengkajian dan Pengembangan Teknologi Pertanian, Badan Penelitian dan Pengembangan Pertanian. (2008). Teknologi budidaya
kelapa sawit. Retrieved from http://lampung.litbang.pertanian.go.id/ind/images/stories/publikasi/sawit.pdf
Balai Besar Penelitian Tanaman Padi (2016) Waspada Serangan Hama Tanaman Padi Di Musim Hujan. (2016, October 24). Retrieved from
http://bbpadi.litbang.pertanian.go.id/index.php/berita/info-teknologi/content/404-waspada-serangan-hama-tanaman-padi-di-musim-hujan
UNMET NEEDS REPORT 2018SMALLHOLDER FARMERS IN PAPUA, WEST PAPUA & WEST KALIMANTAN
// BIBLIOGRAPHY
Balai Pengkajian Teknologi Pertanian Papua. (2009). Budaya dan budidaya ubi jalar di Wamena, Papua. Retrieved from
http://papua.litbang.pertanian.go.id/index.php/publikasi/liptan/26-budaya-dan-budidaya-ubi-jalar-di-wamena-papua
Bina Desa. (2012). Merauke integrated food and energy estate (MIFEE): Blessing or curse for papua people? Retrieved from
http://binadesa.org/wp-content/uploads/2013/08/MIFEE-Berkah-atau-Bencana-bagi-Rakyat-Papua.pdf
Burhansyah, Rusli (2017). Inventarisasi dan indentifikasi kebutuhan teknologi spesifik lokasi komoditas pertanian unggulan Kalimantan barat.
Jurnal Pertanian Agro 19(1), pp. 61-76
Carlson, et.al. (2012). Carbon emission from forest conversion by Kalimantan oil palm plantation. Nature Climate Change pp. 1-5
Dinas Perkebunan Provinsi Kalimantan Barat (2018). Luas dan produksi komoditi perkebunan tahun 2007 dan 2016. Retrieved from
http://disbun.kalbarprov.go.id/index.php/statistik/per-komoditi
Direktorat Jenderal Perkebunan. (2016). Statistik perkebunan Indonesia: Kakao 2015-2017. Retrieved from
http://ditjenbun.pertanian.go.id/tinymcpuk/gambar/file/statistik/2017/Buku-Kakao-2015-2017.pdf
Direktorat Jenderal Perkebunan. (2016). Statistik perkebunan Indonesia: Sagu 2015-2017. Retrieved from
http://ditjenbun.pertanian.go.id/tinymcpuk/gambar/file/statistik/2017/Sagu-2015-2017.pdf
Direktorat Jenderal Perkebunan. (2017). Statistik perkebunan Indonesia: Kelapa sawit 2015-2017. Retrieved from
http://ditjenbun.pertanian.go.id/tinymcpuk/gambar/file/statistik/2017/Kelapa-Sawit-2015-2017.pdf
Farm Radio International (2013). An introduction to agricultural value chains. Retrieved from
https://idl-bnc-idrc.dspacedirect.org/bitstream/handle/10625/52685/IDL-52685.pdf?sequence=1&isAllowed=y
Gapkindo. (Ed.). (2017). Tentang Kami. Retrieved from
https://www.gapkindo.org/tentang-kami/gapkindo
123
// BIBLIOGRAPHY
GPPI Kalbar (n.d.). (21017) Optimalisasi pemanfaatan lahan perkebunan sawit berkelanjutan. Retrieved from
http://www.perhepi.org/wp-content/uploads/2017/01/5.-Ilham-Sanusi_Ketua-GPPI-Kalbar.pdf
Ibarrola-Rivas, M. J., Kastner, T., & Nonhebel, S. (2016). How much time does a farmer spend to produce my food? An International Comparison of
the Impact of Diets and Mechanization. Resources, 5(4), 47.
Indriati, G., Soesanthy, F., & Hapsari, A. D. (2014). The pest management of Helopeltis spp. (hemiptera: miridae) in cocoa to support integrated
agriculture environment friendly. Bunga Rampai: Inovasi Teknologi Bioindustri Kakao.
International Labour Organization. (2012). Kajian rantai nilai ubi jalar dan iklim investasi di Kabupaten Jayawijaya. Retrieved from
http://www.ilo.org/wcmsp5/groups/public/@asia/@ro-bangkok/@ilo-jakarta/documents/publication/wcms_342931.pdf
International Labour Organization. (2013). Kajian kelapa dengan pendekatan pantai nilai dan iklim usaha di Kabupaten Sarmi. Retrieved from
http://www.ilo.org/wcmsp5/groups/public/@asia/@ro-bangkok/@ilo-jakarta/documents/publication/wcms_342734.pdf
Kakao Indonesia (2014). Cara menghitung harga biji kakao. Retrieved from
https://www.kakao-indonesia.com/index.php/news-feeds/89-cara-menghitung-harga-biji-kakao
Kementrian Kehutanan. (2007). Statistik Kehutanan Indonesia. Retrieved from
http://www.storage.jak-stik.ac.id/ProdukHukum/kehutanan/Stat_2007.pdf
Kementerian Pertanian. (2017). Statistik pertanian 2017. Retrieved from
http://epublikasi.setjen.pertanian.go.id/arsip-perstatistikan/160-statistik/statistik-pertanian/533-statistik-pertanian-2019
Kementerian Pertanian. (2016). Outlook komoditas pertanian tanaman pangan: Ubi jalar. Retrieved from:
http://epublikasi.setjen.pertanian.go.id/epublikasi/outlook/2016/Tanpang/OUTLOOK%20UBIJALAR%202016/files/assets/common/downloa
ds/OUTLOOK%20UBIJALAR%202016.pdf
UNMET NEEDS REPORT 2018SMALLHOLDER FARMERS IN PAPUA, WEST PAPUA & WEST KALIMANTAN
// BIBLIOGRAPHY
Kementrian Pertanian Direktorat Jendral Perkebunan. (2014) Pedoman budidaya karet (Hevea brasiliensis) yang baik. Retrieved from
http://tanhun.ditjenbun.pertanian.go.id/uploads/download/1505357153.pdf
Kementrian Pertanian Direktorat Jendral Perkebunan. (2014). Pedoman budidaya kelapa sawit (Elais guineensis) yang baik. Retrieved from
http://tanhun.ditjenbun.pertanian.go.id/uploads/download/1505205716.pdf
Kesaulija, F. F., Sadsoeitoebeon, B. M., Peday, H. F., Tokede, M. J., Komarudin, H., Andriani, R., & Obidzinski, K. (2014). Oil palm estate
development and its impact on forests and local communities in West Papua: A case study on the Prafi Plain(Vol. 156). CIFOR.
Langston, J. D., Riggs, R. A., Sururi, Y., Sunderland, T., & Munawir, M. (2017). Estate crops more attractive than community forests in West
Kalimantan, Indonesia. Land, 6 (1), 12.
Mosnier, A., Boere, E., Reumann, A., Yowargana, P., Pirker, J., Havlik, P., & Pacheco, P. (2017). Palm oil and likely futures: Assessing the potential
impacts of zero deforestation commitments and a moratorium on large-scale oil palm plantations in Indonesia: Center for International
Forestry Research (CIFOR), Bogor, Indonesia.
Mulyadi, M., Sugihen, B. G., Asngari, P. S., & Susanto, D. (2015). Kearifan Lokal dan Hambatan Inovasi Pertanian Suku Pedalaman Arfak di
Kabupaten Manokwari Papua Barat. Jurnal Penyuluhan, 5(1).
Nationwide, S. (n.d.). Management of nitrogen and phosphorus. Retrieved from
https://www.sare.org/Learning-Center/Books/Building-Soils-for-Better-Crops-3rd-Edition/Text-Version/Management-of-Nitrogen-and-Phosp
horus
Obidzinski, K., Andriani, R., Komarudin, H., & Andrianto, A. (2012). Environmental and social impacts of oil palm plantations and their implications
Obidzinski, K., Andriani, R., Komarudin, H., & Andrianto, A. (2012). Environmental and social impacts of oil palm plantations and their
implications for biofuel production in Indonesia. Ecology and Society, 17(1).
Oxfam. (2012). Ubi jalar and Papuan economic development: A source of life and livelihood for the Papuan People. Retrieved from
https://www.oxfam.org.nz/sites/default/files/reports/Counting%20the%20harvest_The%20Ubi%20Jalar%20project_FINAL.pdf
125
// BIBLIOGRAPHY
PRISMA (2016) Promoting rural Income through support for markets in agriculture. Progress report and implementation plan. Retrieved from
https://aip-rural.or.id/data/uploaded_file/18.04.17_04042017-PRISMA%20PRIP%202016%20Semester%201-Public%20Version.pdf
Rahayu, S., Tazkiana, D., Johana, F., Harja, D., & Kendoom, M. (2014). Sago forest: from local wisdom to national regulation. Prosiding Seminar
Nasional Agroforestri ke-5 (63-67).
Ray, Denise. Neuhauser M. (2014). Wilcoxon-Signed-Rank Test. International Encyclopedia of Statistical Science.
Sari, H. R. (2017, July 23). Lahan diserang hama, bulir padi di Kalbar banyak yang kosong. Retrieved from
https://www.merdeka.com/peristiwa/lahan-diserang-hama-bulir-padi-di-kalbar-banyak-yang-kosong.html
Sawit Indonesia (2014) Kisah Petani Dapatkan Sertifikat RSPO. Retrieved from
https://sawitindonesia.com/rubrikasi-majalah/tata-kelola/kisah-petani-dapatkan-sertifikat-rspo/
Weatherspoon, D. D., & Reardon, T. (2003). The rise of supermarkets in Africa: implications for agrifood systems and the rural poor. Development
policy review, 21(3), 333-355.
Weinberger, K., & Lumpkin, T. A. (2007). Diversification into horticulture and poverty reduction: a research agenda. World Development, 35(8),
1464-1480.
Widodo Y,Rahayuningsih. (2009). Teknologi budidaya praktis ubi jalar mendukung ketahanan pangan dan usaha agroindustri. Retrieved from
http://ejurnal.litbang.pertanian.go.id/index.php/bulpa/article/view/1738/7617
World Agroforestry Center. (2013). Agroforestri karet: Benarkah kaya akan imbal jasa lingkungan? Retrieved from
http://www.worldagroforestry.org/downloads/Publications/PDFS/B17660.pdf
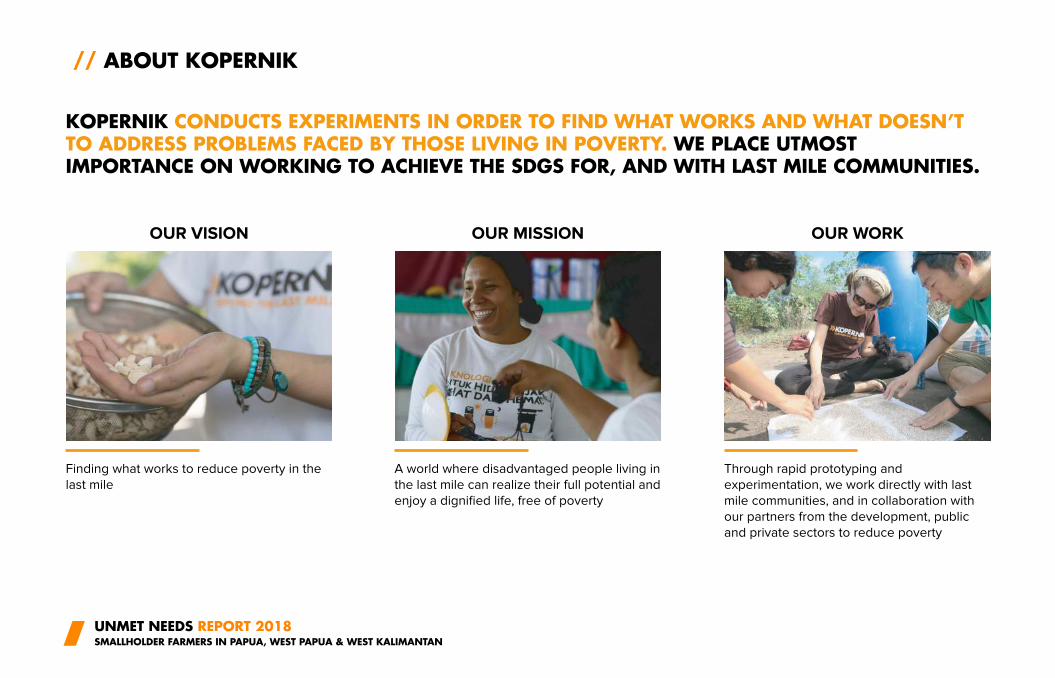
UNMET NEEDS REPORT 2018SMALLHOLDER FARMERS IN PAPUA, WEST PAPUA & WEST KALIMANTAN
// ABOUT KOPERNIK
KOPERNIK CONDUCTS EXPERIMENTS IN ORDER TO FIND WHAT WORKS AND WHAT DOESN’T TO ADDRESS PROBLEMS FACED BY THOSE LIVING IN POVERTY. WE PLACE UTMOST IMPORTANCE ON WORKING TO ACHIEVE THE SDGS FOR, AND WITH LAST MILE COMMUNITIES.
OUR VISION OUR MISSION OUR WORK
Finding what works to reduce poverty in the
last mile
A world where disadvantaged people living in
the last mile can realize their full potential and
enjoy a dignified life, free of poverty
Through rapid prototyping and
experimentation, we work directly with last
mile communities, and in collaboration with
our partners from the development, public
and private sectors to reduce poverty
Authors of this report:
This report was researched and written by Kopernik's Last Mile
Consulting team, namely Annisa Nurulhuda, Dianty Ningrum,
Nanda Riska, Radityo Hutomo, Stevan Chondro and Tomo
Hamakawa. Other Kopernik members contributed to the research,
including Fera Ketti, Gumilang Andika, Laetitia Lemaistre, and
Vanesha Manuturi.