unmet need for early care and education in boston
DESCRIPTION
Published 2003TRANSCRIPT
1
Unmet Need For Early Care and
Education in Boston
Submitted to the Child Care Capital Investment Fund August 28, 2003
By
Martha McCahill Cowden, Independent Consultant Kristen Stinchcombe, Vice President of Research and Policy, Associated
Early Care and Education, Inc.
2
Table of Contents Introduction p. 3 Executive Summary p. 4 City of Boston p. 7 Comparison of Boston Neighborhoods p. 13 Allston Brighton p. 21 Charlestown/North End p. 23 Chinatown/South End/Fenway p. 25 Dorchester p. 27 East Boston p. 29 Hyde Park/Roslindale/West Roxbury p. 31 Mattapan p. 33 Roxbury/Jamaica Plain/Mission Hill p. 35 South Boston p. 37
3
Introduction
The purpose of this report is to identify the unmet need for early care and education for zero to five year olds in Boston. This need will be described generally, in specific neighborhoods, and for specific populations. In the following pages we will:
• Describe the current supply of early childhood care and education in Boston; • Present several estimates of current demand for early care and education in Boston; • Compare the supply to demand in order to identify the unmet need and need for subsidized
care.
We recommend that this report be used to: • Inform planning for the universal preschool initiative; • Inform the Child Care Capital Investment Fund’s planning for expansion of services for
children ages 0-5 in Boston and for allocation of resources; and • Assist in fundraising efforts to expand services in specific areas of high need.
This document was built on a report from June, 2002, entitled The Supply and Demand
For Early Care and Education in Boston, by Christine Johnson-Staub, Kelly Graceffa, and Martha Cowden. The 2002 report was prepared for the Zero to Eight Coalition’s Facilities Committee. This report expands upon the capacity and subsidy data from the earlier report by providing updated and corrected subsidy figures and adding several new demand formulas. We reviewed local, state, and national research on assessing the need for early childhood services. The 2001 report, Planning For Chicago’s Children In The New Century, by The Illinois Facilities Fund, provided a format, methodology, and specific demand formula that are particularly relevant to Boston.
We would like to thank and acknowledge the following people for contributing to this report:
Erika Argersinger, Associated Early Care and Education, Inc. Victoria Bok, Child Care Capital Investment Fund/Community Economic Development Assistance Corporation Joan Clark, Rod Southwick and Jennifer Louis, MA Office of Child Care Services Rolf Goetz, Boston Redevelopment Authority Kelly Graceffa, Child Care Choices of Boston Barbara Jacobs, ABCD Head Start John Lippitt, Heller School, Brandeis University Erin Majewski, Associated Early Care and Education Jennifer Lutzy McDonald, Heller School, Brandeis University and Consultant Jason Sachs, MA Department of Education Sasha Stavsky, Associated Early Care and Education, Inc. Patricia Xavier, Boston Child Care Alliance and Zero to Eight Coalition
4
Executive Summary
The 2000 U.S. Census shows that Boston is becoming an increasingly diverse city. For the first time a majority of the city (50.5%) is non-White. The total number of children under the age of five has declined by 12.5% since 1990, and almost one in five of its residents lives below the poverty line.1
Our review of the 15,328 current full-time licensed slots for 0-5 year olds in the city shows that 66% of the full-time supply (capacity) is for preschool aged children, 22% is for toddlers, and 12% is for infants. The shortage of licensed slots for infants and toddlers is acute across the city. Almost 60% of all licensed slots are in center based programs, with centers providing 66% of care for preschoolers, and family child care providers providing 60% of care to infants and 45% of care for toddlers. Full-time capacity can be increased by 2,117 slots or by 14%, by converting the Boston Public Schools and Head Start part-time slots to full-time. The space these programs use is available, but substantial funds would be needed for the increased operating costs.
There are 7,177 full-time subsidies in Boston, with 72% for preschool aged children, 20%
for toddlers, and only 8% for infants. Fifty-eight percent of these subsidies to go centers and 23% to family child care. Vouchers account for the greatest percentage (36%) of all subsidies. Family child care providers rely on vouchers for 63% of the total subsidies they receive.
Roxbury/Jamaica Plain/Mission Hill and Dorchester have the greatest full-time capacity;
together they have 51% of the total number of licensed slots in the city and 61% of the full-time subsidies. They also have 42% of the total number of 0-5 year olds in Boston. In Dorchester, East Boston, and Roxbury/Jamaica Plain/Mission Hill, over 50% of the licensed capacity for 0-5 year olds is subsidized.
According to the demand formula for Boston (see Appendix A.1. for a detailed
explanation of the methodology), the total demand for full-day/full year early care and education services for children under the age of five in Boston is 20,766. This total demand number represents 53% of all children ages 0-5 according to Public Health Commission birth records2, and 65% of all 0-5 year olds according to the 2000 U.S. Census. Infants account for 4,112 or 20% of the total demand, toddlers for 7,206 or 35% of the total, and preschool aged children for 9,448 or 45% of the total demand.
In comparing supply to demand in order to assess unmet need across the city, the
following figures stand out: • In comparing the supply of licensed slots to total births of 0-5 year olds, 24,070
children, or 61% of 0-5 year olds still do not have access to early care and education. • Full-time subsidies are only available for 39% of the licensed slots in the city and for
only 18.2% of the children under five, according to birth records. 1 Kahn, C. and Pradhan, G. Creativity and Innovation: A Bridge to the Future: A Summary of the Boston Indicators Report, 2002 (Boston: Boston Foundation and Boston’s Civic Community, 2003, p. 27). 2 Public Health Commission birth records, as reported to the authors by the Boston Public Schools.
5
• After subtracting the total supply from the general demand, there is an unmet need for 5,432 slots for children ages 0-5 in Boston, with an unmet need for 2,289 slots for infants, 3,876 slots for toddlers, and an excess of 733 slots over demand for preschool aged children.
• In comparing the total demand for Head Start services for children 0-5 to the current supply of part-time and full-time Head Start slots available, there is still an unmet need for 5,483 part-time and full-time Head Start slots.
The greatest unmet needs for early care and education for all 0-5 year olds are in
Dorchester (2,737 children), Hyde Park/Roslindale/W. Roxbury (2,213 children) and East Boston (907 children). By percentage of capacity (supply) to overall demand, the greatest unmet needs are in South Boston (only 27.1% of need met), Hyde Park/ Roslindale/West Roxbury (44.2% of need met) and East Boston (52.2% of need met). There is an excess of capacity in comparison to demand in three neighborhoods: Chinatown/South End/Fenway (1,103 slots), Roxbury/JP/Mission Hill (569 slots), and Downtown/Back Bay/Beacon Hill (367 slots). Almost all the excess is found in slots for preschool aged children.
It is interesting to note that in both the comparisons of capacity/births and capacity/demand formulas, the neighborhoods with the greatest percentages of unmet need are South Boston, Hyde Park/Roslindale/W. Roxbury, and East Boston. The lowest percentages of subsidies/births are in South Boston, Allston/Brighton/Kenmore, and Charlestown/North End, but the real unmet need for subsidized care (except for Head Start, see below) could not be calculated due to our inability to collect income information for families with children 0-5 and by cluster neighborhood The greatest unmet need for full-time Head Start slots based on the HS demand formula compared to full-time Head Start capacity is in Dorchester (2,356 full-time slots needed), Roxbury/Jamaica Plain/Mission Hill (1,143 full-time slots needed) and Hyde Park/Roslindale/West Roxbury (756 full-time slots needed). The greatest need for either full or part-time Head Start slots is also Dorchester (2,039 slots needed), Roxbury/Jamaica Plain/Mission Hill (891 slots needed) and Hyde Park/Roslindale/West Roxbury (733 slots needed). Again, it should be noted that most families who are eligible for Head Start are also eligible for other subsidies, so the actual unmet need numbers for Head Start are less than reported here. A review of these conclusions leads us to make the following recommendations to expand early care and education services for children aged zero to five in Boston: 1. Increase the supply of full-time licensed infant and toddler slots across the city to address the
unmet need for 2,289 infant slots and 3,876 toddler slots in all neighborhoods of the city. New slots should include a mix of family child care, center based, and Head Start services in order to provide families with a range of program choices.
2. Increase the supply of full-time licensed preschool slots in the four neighborhoods with the greatest unmet needs: Hyde Park/Roslindale/W.Roxbury (699 slots), Dorchester (590 slots), East Boston (244 slots), and South Boston (194 slots). Again, new slots should include a mix of family child care, center based, Head Start, and BPS services.
6
3. Increase the supply of full-time Head Start services to address the unmet need for 5,483 full- and part-time Head Start slots. Obtain resources needed to convert to full-time as many of the 1,318 part-time Head Start slots as possible in order to meet the needs of low income working families.
4. Provide technical assistance and capacity building support to the neighborhoods with the greatest unmet needs to plan for the expansion of slots. A review of the various methods of assessing unmet need shows that the neighborhoods with the greatest unmet needs in absolute numbers are Dorchester, Hyde Park/Roslindale/W. Roxbury, and East Boston. The greatest unmet needs in percentage of capacity to demand are in South Boston.
5. Conduct further research to review the census, birth record, capacity, and subsidy numbers for the South End/Chinatown/Fenway neighborhood and the Roxbury/Jamaica Plain/Mission Hill neighborhood and make any corrections needed in the tables, demand formula, and unmet needs assessments.
6. Conduct further research to compile data on the numbers of families with children under the age of five by neighborhood, broken out by income level and work status. Once this data has been gathered, then compare it to the subsidy data to determine the unmet need for subsidized early care and education in Boston.
In conclusion, we believe that all children should be able to access high quality early care
and education. We advocate for government agencies, the legislature, parents, business people, and the Early Education for All Campaign to provide more resources to implement the recommendations listed above.
7
City of Boston
Overview
According to 2000 U.S. Census data, 574,282 people live in the city of Boston, representing 2.6% growth since 1990. The total number of children under five years of age is 32,046, representing a 12.5% reduction from the 1990 Census. The City is also more diverse--for the first time a majority (50.5%) of the city is non-White. The largest racial and ethnic groups are Whites (49.5%) Blacks or African Americans (23.8%) and Hispanics (14.4%). The largest increase since 1990 was found among Asians or Pacific Islanders, with an increase of 49.4% although Asians and Pacific Islanders only represent 7.5% of the total population. The median household income is now $39,629, an increase of only 1.4% over the 1990 level. The percentage of residents living in poverty is 19.5%, representing an increase of 6.9% over the 1990 level.3 For a family of four, the federal poverty level is $18,400. In comparison, the Massachusetts statewide median income (SMI) level for a family of four is $68,964, and the threshold for MA Office of Child Care Services child care subsidies is 50% of the SMI or 34,488.
In this overview section and the following overview sections for each neighborhood, the
census data is presented using the Boston Redevelopment Authority’s neighborhood boundaries. Using these boundaries allowed the authors to compare basic census data from the 2000 U.S. Census and the 1990 U.S. Census, in order to show population trends.
It should be noted that the 2000 U.S. Census data for children under five years differs
substantially from the Boston Public Health Commission’s Boston birth records, as reported to the authors by the Boston Public Schools. As described above there are 32,046 children under five years of age in Boston, according to the 2000 U.S. Census. However, according to the Boston Public Health Commission’s records (as reported to us by the Boston Public Schools), there are 39,398 children, representing an increase of 23% over the census number. At this time, we can not explain the difference in the two numbers. The Boston Public Schools and the Zero to Eight Coalition have chosen to use birth records for their planning, because they believe these numbers represent a more accurate count of the actual number of children in the city, particularly the children of refugee and immigrant families who tend to be undercounted in the census data. Supply Table 1 below provides information on citywide licensed full-time (FT) and part-time (PT) capacity. (See Appendix A.2. for definitions of full and part-time care.)
3 Kahn, C. and Pradhan, G. Boston Indicators, p. 27.
8
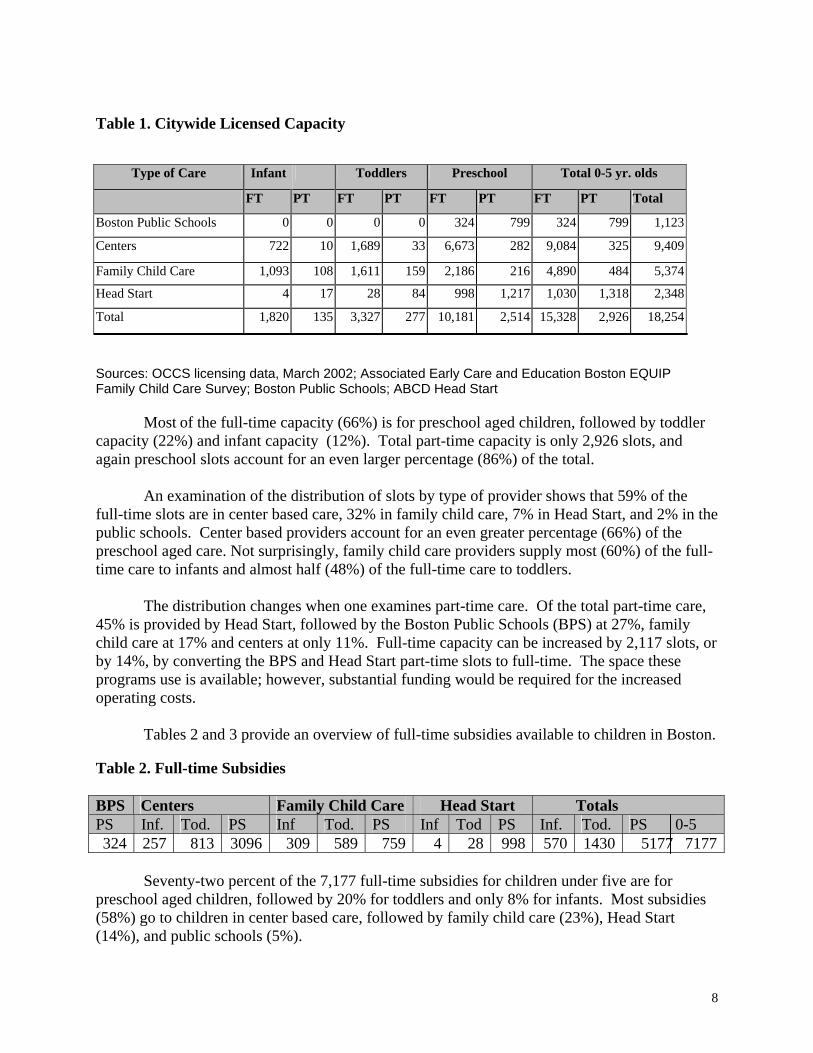
Table 1. Citywide Licensed Capacity
Type of Care Infant Toddlers Preschool Total 0-5 yr. olds
FT PT FT PT FT PT FT PT Total
Boston Public Schools 0 0 0 0 324 799 324 799 1,123
Centers 722 10 1,689 33 6,673 282 9,084 325 9,409
Family Child Care 1,093 108 1,611 159 2,186 216 4,890 484 5,374
Head Start 4 17 28 84 998 1,217 1,030 1,318 2,348
Total 1,820 135 3,327 277 10,181 2,514 15,328 2,926 18,254
Sources: OCCS licensing data, March 2002; Associated Early Care and Education Boston EQUIP Family Child Care Survey; Boston Public Schools; ABCD Head Start
Most of the full-time capacity (66%) is for preschool aged children, followed by toddler capacity (22%) and infant capacity (12%). Total part-time capacity is only 2,926 slots, and again preschool slots account for an even larger percentage (86%) of the total. An examination of the distribution of slots by type of provider shows that 59% of the full-time slots are in center based care, 32% in family child care, 7% in Head Start, and 2% in the public schools. Center based providers account for an even greater percentage (66%) of the preschool aged care. Not surprisingly, family child care providers supply most (60%) of the full-time care to infants and almost half (48%) of the full-time care to toddlers.
The distribution changes when one examines part-time care. Of the total part-time care, 45% is provided by Head Start, followed by the Boston Public Schools (BPS) at 27%, family child care at 17% and centers at only 11%. Full-time capacity can be increased by 2,117 slots, or by 14%, by converting the BPS and Head Start part-time slots to full-time. The space these programs use is available; however, substantial funding would be required for the increased operating costs.
Tables 2 and 3 provide an overview of full-time subsidies available to children in Boston.
Table 2. Full-time Subsidies
BPS Centers Family Child Care Head Start Totals PS Inf. Tod. PS Inf Tod. PS Inf Tod PS Inf. Tod. PS 0-5 324 257 813 3096 309 589 759 4 28 998 570 1430 5177 7177
Seventy-two percent of the 7,177 full-time subsidies for children under five are for preschool aged children, followed by 20% for toddlers and only 8% for infants. Most subsidies (58%) go to children in center based care, followed by family child care (23%), Head Start (14%), and public schools (5%).
9
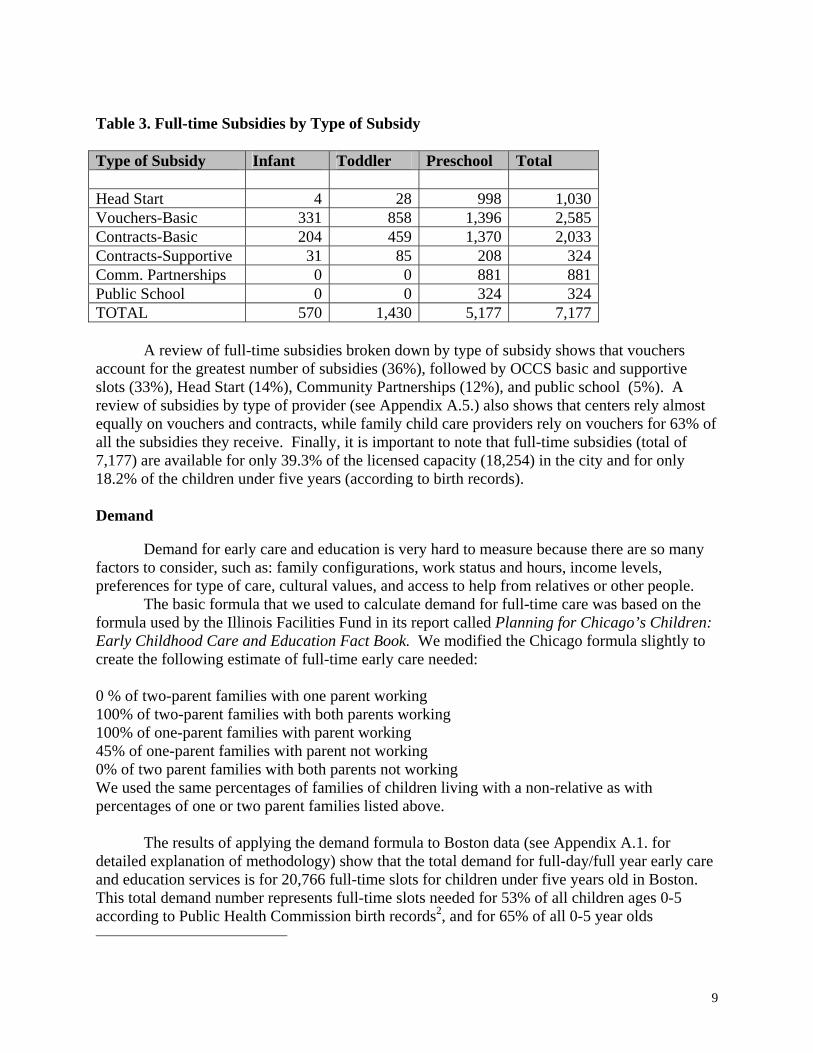
Table 3. Full-time Subsidies by Type of Subsidy
Type of Subsidy Infant Toddler Preschool Total Head Start 4 28 998 1,030 Vouchers-Basic 331 858 1,396 2,585 Contracts-Basic 204 459 1,370 2,033 Contracts-Supportive 31 85 208 324 Comm. Partnerships 0 0 881 881 Public School 0 0 324 324 TOTAL 570 1,430 5,177 7,177 A review of full-time subsidies broken down by type of subsidy shows that vouchers account for the greatest number of subsidies (36%), followed by OCCS basic and supportive slots (33%), Head Start (14%), Community Partnerships (12%), and public school (5%). A review of subsidies by type of provider (see Appendix A.5.) also shows that centers rely almost equally on vouchers and contracts, while family child care providers rely on vouchers for 63% of all the subsidies they receive. Finally, it is important to note that full-time subsidies (total of 7,177) are available for only 39.3% of the licensed capacity (18,254) in the city and for only 18.2% of the children under five years (according to birth records). Demand Demand for early care and education is very hard to measure because there are so many factors to consider, such as: family configurations, work status and hours, income levels, preferences for type of care, cultural values, and access to help from relatives or other people.
The basic formula that we used to calculate demand for full-time care was based on the formula used by the Illinois Facilities Fund in its report called Planning for Chicago’s Children: Early Childhood Care and Education Fact Book. We modified the Chicago formula slightly to create the following estimate of full-time early care needed: 0 % of two-parent families with one parent working 100% of two-parent families with both parents working 100% of one-parent families with parent working 45% of one-parent families with parent not working 0% of two parent families with both parents not working We used the same percentages of families of children living with a non-relative as with percentages of one or two parent families listed above.
The results of applying the demand formula to Boston data (see Appendix A.1. for detailed explanation of methodology) show that the total demand for full-day/full year early care and education services is for 20,766 full-time slots for children under five years old in Boston. This total demand number represents full-time slots needed for 53% of all children ages 0-5 according to Public Health Commission birth records2, and for 65% of all 0-5 year olds
10
according to the 2000 U.S. Census. Infant slots account for 4,112 or 20% of the total demand, toddler slots for 7,206 or 35% of the total, and preschool aged slots for 9,448 or 45% of the total demand.
To calculate the demand for Head Start services, we used the number of families living in
poverty with children under five as reported in the 2000 U.S. Census. Family work status or configuration was not taken into account because Head Start eligibility is determined solely on income. According to this calculation, there is demand for 7,862 full-time Head Start slots. Of the total demand 1,557 slots (20%) are needed for infants, 2,728(35%) for toddlers, and 3,577 (45%) for preschool aged children. It should be noted here that families who qualify for Head Start slots also qualify for other subsidized slots, so the total Head Start demand numbers would be reduced when family preference for type of subsidized care is taken into account.
We were unable to calculate the demand for other types of subsidized care. Eligibility for
OCCS contract slots, vouchers, and Community Partnerships slots is determined by family income and work status. As noted above family work status by age of child is available, but data related to family income and age of child is not available. We were also unable to refine our demand estimates by taking into account family preferences for type of care, because data on preferences was not available.
Another way to assess demand for subsidized care is to study the waitlists compiled by
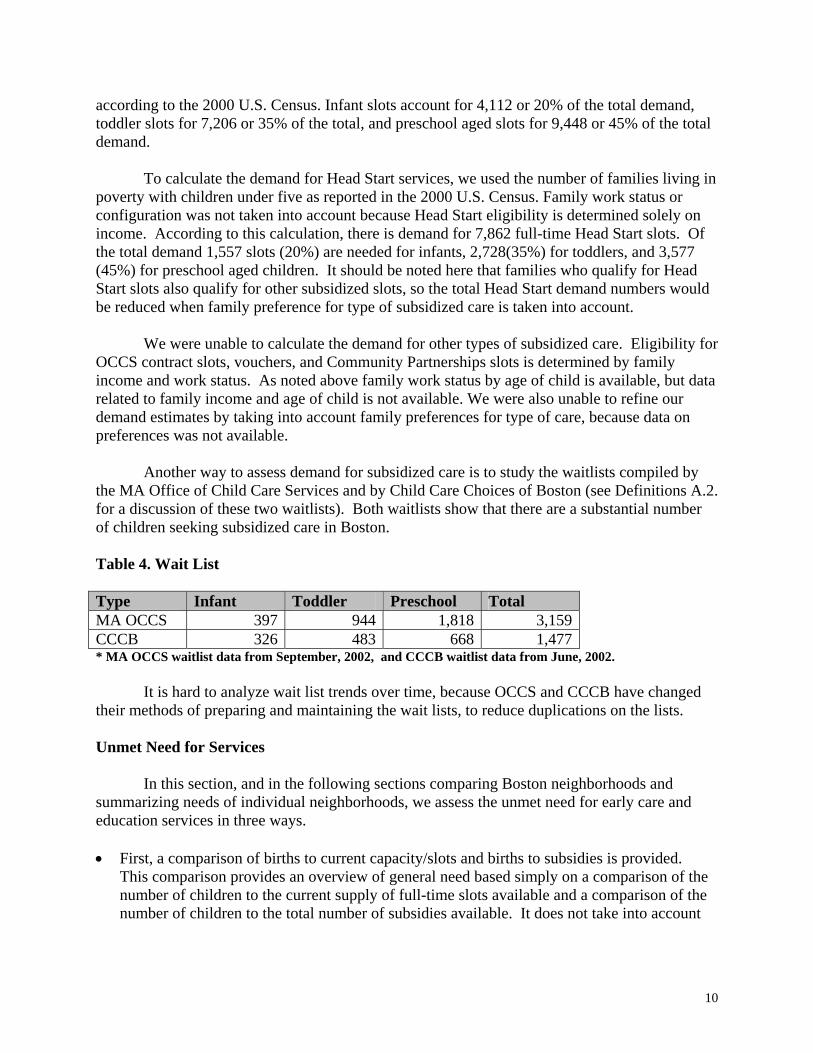
the MA Office of Child Care Services and by Child Care Choices of Boston (see Definitions A.2. for a discussion of these two waitlists). Both waitlists show that there are a substantial number of children seeking subsidized care in Boston.
Table 4. Wait List
Type Infant Toddler Preschool Total MA OCCS 397 944 1,818 3,159 CCCB 326 483 668 1,477 * MA OCCS waitlist data from September, 2002, and CCCB waitlist data from June, 2002.
It is hard to analyze wait list trends over time, because OCCS and CCCB have changed their methods of preparing and maintaining the wait lists, to reduce duplications on the lists. Unmet Need for Services In this section, and in the following sections comparing Boston neighborhoods and summarizing needs of individual neighborhoods, we assess the unmet need for early care and education services in three ways. • First, a comparison of births to current capacity/slots and births to subsidies is provided.
This comparison provides an overview of general need based simply on a comparison of the number of children to the current supply of full-time slots available and a comparison of the number of children to the total number of subsidies available. It does not take into account
11
parent needs based on parent work status or family income levels or parent preferences for type of care.
• Secondly, we compared the current capacity to the general demand formula numbers described above. This comparison provides a more precise assessment of the general unmet need for services by subtracting the current capacity (supply) from the general demand numbers calculated according to the formula.
• Finally, we were able to assess the general unmet need for Head Start services by comparing the results of the general Head Start demand formula to the current supply (capacity) of full-time and part-time Head Start slots. We were unable to develop more precise estimates of unmet need for other types of subsidized care because we could not obtain data on family income status according to the age of the children. We also could not obtain family income data according to statewide median income levels, which are the income criteria for the OCCS contract slots, voucher slots, and Community Partnerships slots.
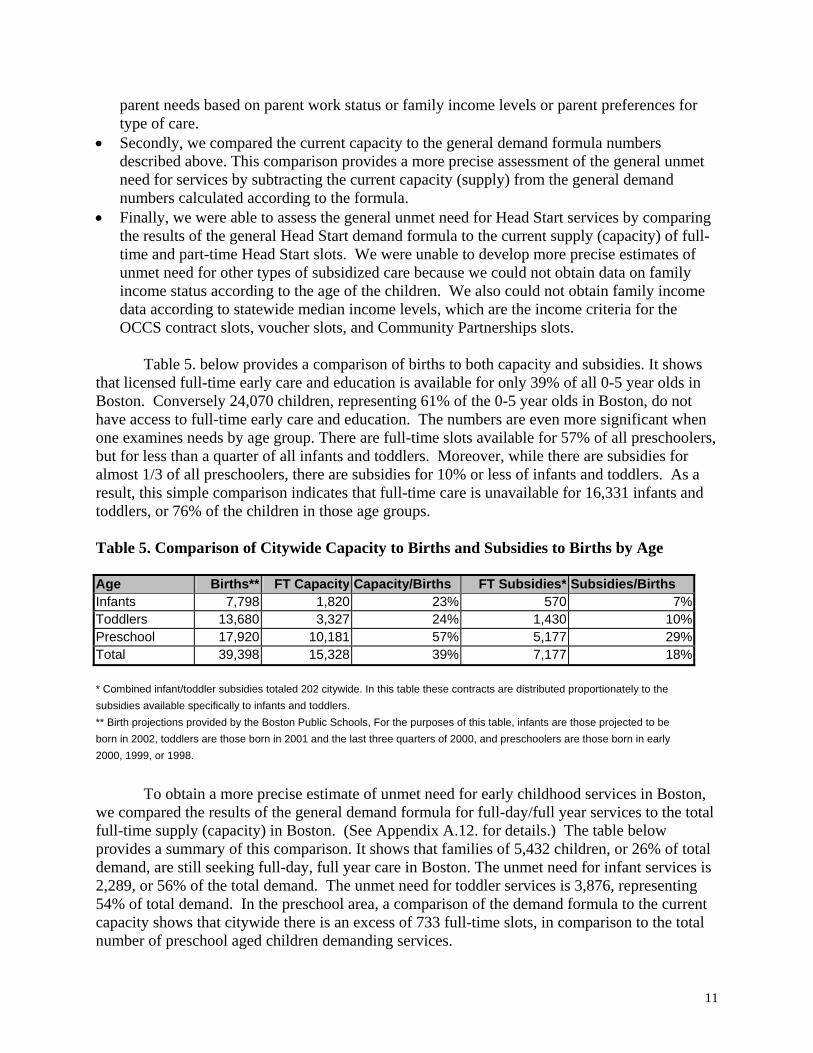
Table 5. below provides a comparison of births to both capacity and subsidies. It shows
that licensed full-time early care and education is available for only 39% of all 0-5 year olds in Boston. Conversely 24,070 children, representing 61% of the 0-5 year olds in Boston, do not have access to full-time early care and education. The numbers are even more significant when one examines needs by age group. There are full-time slots available for 57% of all preschoolers, but for less than a quarter of all infants and toddlers. Moreover, while there are subsidies for almost 1/3 of all preschoolers, there are subsidies for 10% or less of infants and toddlers. As a result, this simple comparison indicates that full-time care is unavailable for 16,331 infants and toddlers, or 76% of the children in those age groups. Table 5. Comparison of Citywide Capacity to Births and Subsidies to Births by Age
Age Births** FT Capacity Capacity/Births FT Subsidies* Subsidies/Births Infants 7,798 1,820 23% 570 7%Toddlers 13,680 3,327 24% 1,430 10%Preschool 17,920 10,181 57% 5,177 29%Total 39,398 15,328 39% 7,177 18%
* Combined infant/toddler subsidies totaled 202 citywide. In this table these contracts are distributed proportionately to the subsidies available specifically to infants and toddlers. ** Birth projections provided by the Boston Public Schools, For the purposes of this table, infants are those projected to be born in 2002, toddlers are those born in 2001 and the last three quarters of 2000, and preschoolers are those born in early 2000, 1999, or 1998.
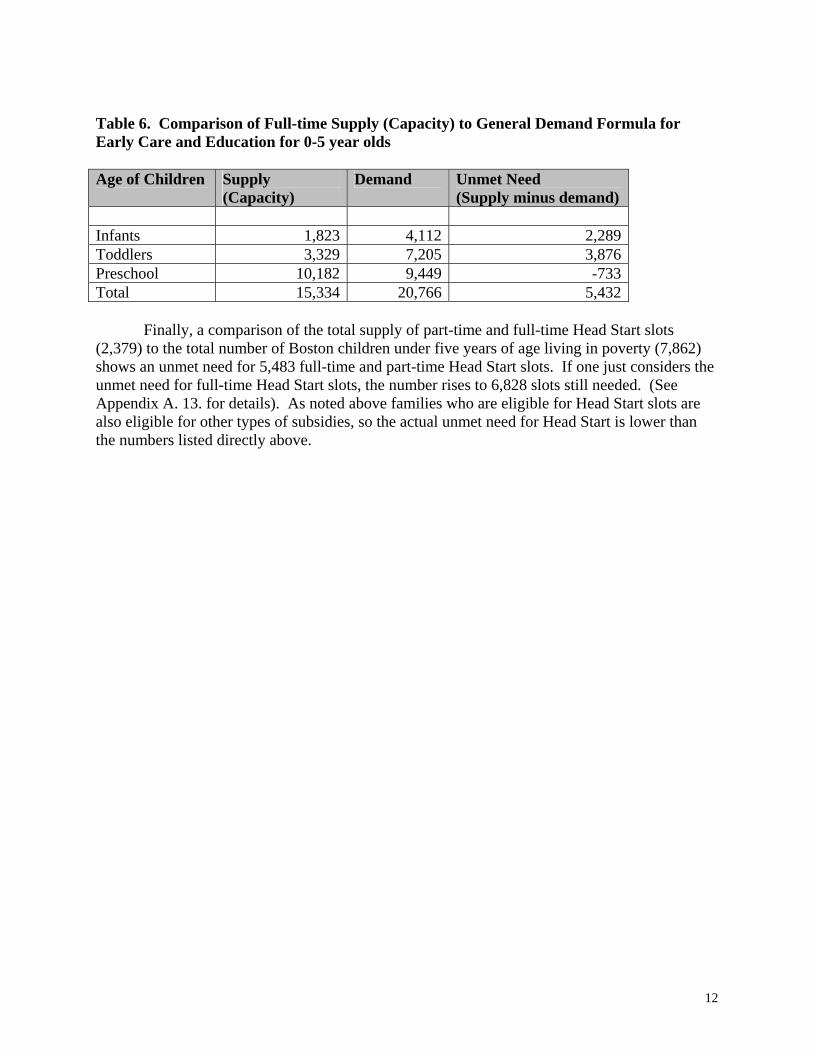
To obtain a more precise estimate of unmet need for early childhood services in Boston,
we compared the results of the general demand formula for full-day/full year services to the total full-time supply (capacity) in Boston. (See Appendix A.12. for details.) The table below provides a summary of this comparison. It shows that families of 5,432 children, or 26% of total demand, are still seeking full-day, full year care in Boston. The unmet need for infant services is 2,289, or 56% of the total demand. The unmet need for toddler services is 3,876, representing 54% of total demand. In the preschool area, a comparison of the demand formula to the current capacity shows that citywide there is an excess of 733 full-time slots, in comparison to the total number of preschool aged children demanding services.
12
Table 6. Comparison of Full-time Supply (Capacity) to General Demand Formula for Early Care and Education for 0-5 year olds Age of Children Supply
(Capacity) Demand Unmet Need
(Supply minus demand) Infants 1,823 4,112 2,289 Toddlers 3,329 7,205 3,876 Preschool 10,182 9,449 -733 Total 15,334 20,766 5,432 Finally, a comparison of the total supply of part-time and full-time Head Start slots (2,379) to the total number of Boston children under five years of age living in poverty (7,862) shows an unmet need for 5,483 full-time and part-time Head Start slots. If one just considers the unmet need for full-time Head Start slots, the number rises to 6,828 slots still needed. (See Appendix A. 13. for details). As noted above families who are eligible for Head Start slots are also eligible for other types of subsidies, so the actual unmet need for Head Start is lower than the numbers listed directly above.
13
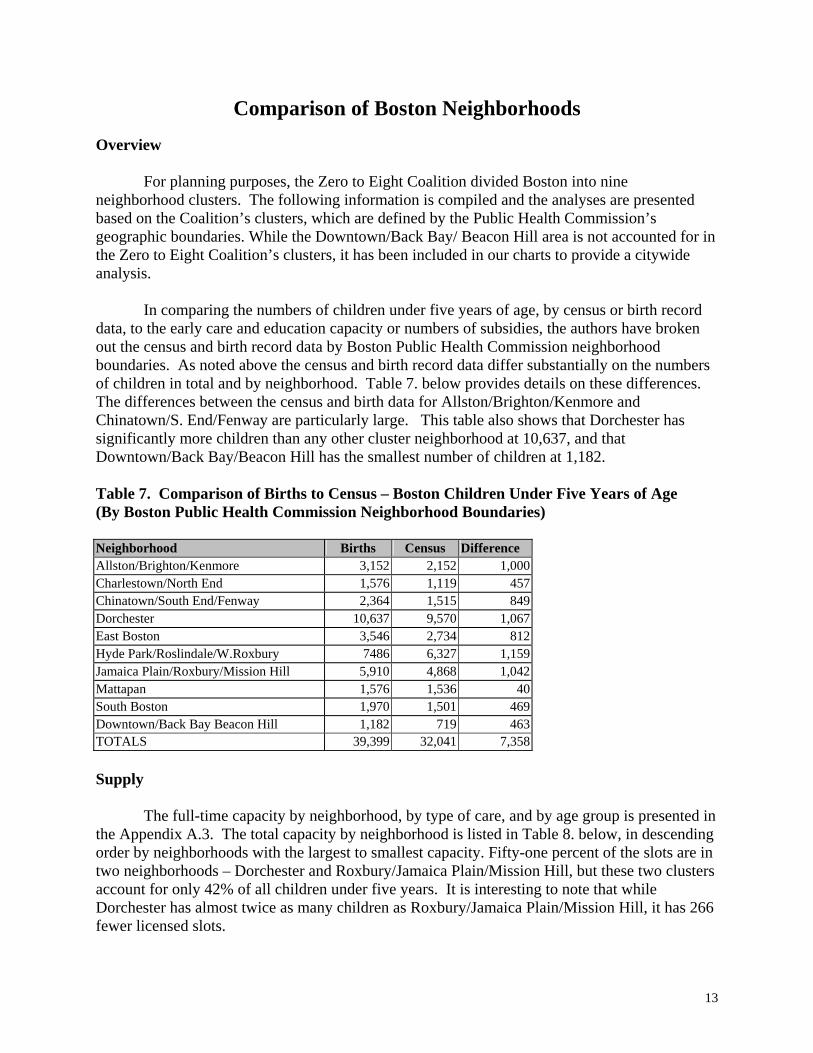
Comparison of Boston Neighborhoods Overview For planning purposes, the Zero to Eight Coalition divided Boston into nine neighborhood clusters. The following information is compiled and the analyses are presented based on the Coalition’s clusters, which are defined by the Public Health Commission’s geographic boundaries. While the Downtown/Back Bay/ Beacon Hill area is not accounted for in the Zero to Eight Coalition’s clusters, it has been included in our charts to provide a citywide analysis.
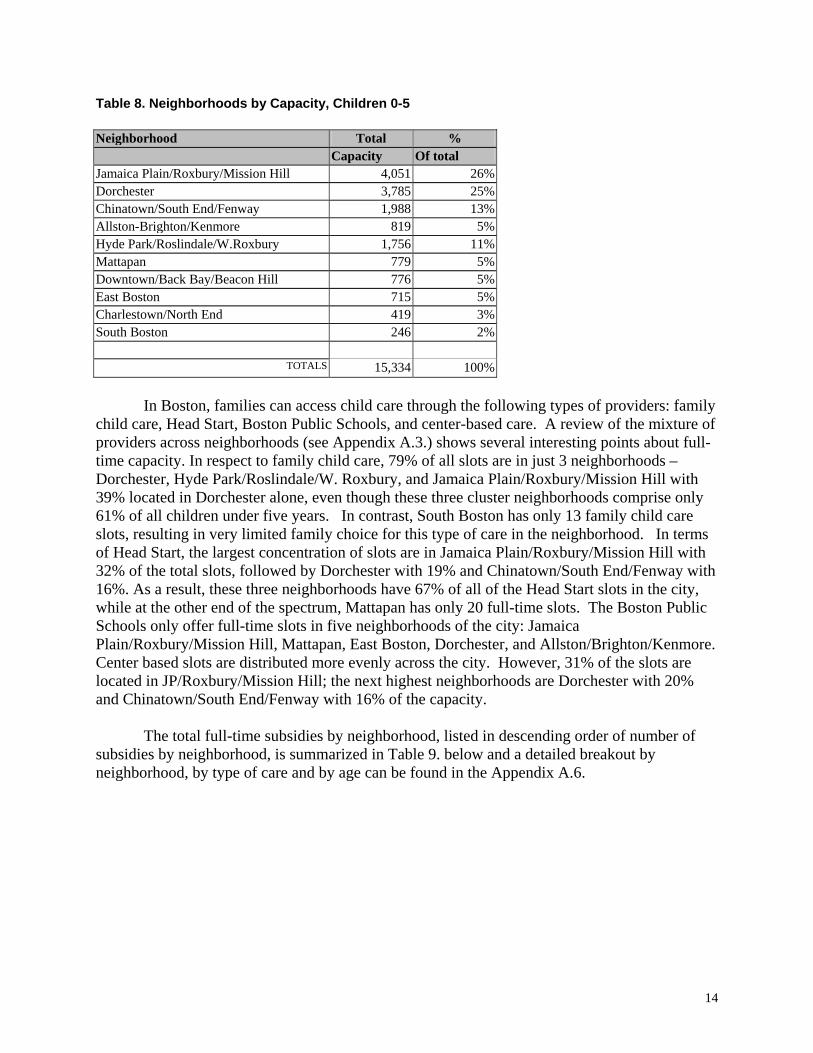
In comparing the numbers of children under five years of age, by census or birth record data, to the early care and education capacity or numbers of subsidies, the authors have broken out the census and birth record data by Boston Public Health Commission neighborhood boundaries. As noted above the census and birth record data differ substantially on the numbers of children in total and by neighborhood. Table 7. below provides details on these differences. The differences between the census and birth data for Allston/Brighton/Kenmore and Chinatown/S. End/Fenway are particularly large. This table also shows that Dorchester has significantly more children than any other cluster neighborhood at 10,637, and that Downtown/Back Bay/Beacon Hill has the smallest number of children at 1,182. Table 7. Comparison of Births to Census – Boston Children Under Five Years of Age (By Boston Public Health Commission Neighborhood Boundaries) Neighborhood Births Census Difference Allston/Brighton/Kenmore 3,152 2,152 1,000Charlestown/North End 1,576 1,119 457Chinatown/South End/Fenway 2,364 1,515 849Dorchester 10,637 9,570 1,067East Boston 3,546 2,734 812Hyde Park/Roslindale/W.Roxbury 7486 6,327 1,159Jamaica Plain/Roxbury/Mission Hill 5,910 4,868 1,042Mattapan 1,576 1,536 40South Boston 1,970 1,501 469Downtown/Back Bay Beacon Hill 1,182 719 463TOTALS 39,399 32,041 7,358 Supply The full-time capacity by neighborhood, by type of care, and by age group is presented in the Appendix A.3. The total capacity by neighborhood is listed in Table 8. below, in descending order by neighborhoods with the largest to smallest capacity. Fifty-one percent of the slots are in two neighborhoods – Dorchester and Roxbury/Jamaica Plain/Mission Hill, but these two clusters account for only 42% of all children under five years. It is interesting to note that while Dorchester has almost twice as many children as Roxbury/Jamaica Plain/Mission Hill, it has 266 fewer licensed slots.
14
Table 8. Neighborhoods by Capacity, Children 0-5
Neighborhood Total % Capacity Of total
Jamaica Plain/Roxbury/Mission Hill 4,051 26%Dorchester 3,785 25%Chinatown/South End/Fenway 1,988 13%Allston-Brighton/Kenmore 819 5%Hyde Park/Roslindale/W.Roxbury 1,756 11%Mattapan 779 5%Downtown/Back Bay/Beacon Hill 776 5%East Boston 715 5%Charlestown/North End 419 3%South Boston 246 2%
TOTALS 15,334 100% In Boston, families can access child care through the following types of providers: family child care, Head Start, Boston Public Schools, and center-based care. A review of the mixture of providers across neighborhoods (see Appendix A.3.) shows several interesting points about full-time capacity. In respect to family child care, 79% of all slots are in just 3 neighborhoods – Dorchester, Hyde Park/Roslindale/W. Roxbury, and Jamaica Plain/Roxbury/Mission Hill with 39% located in Dorchester alone, even though these three cluster neighborhoods comprise only 61% of all children under five years. In contrast, South Boston has only 13 family child care slots, resulting in very limited family choice for this type of care in the neighborhood. In terms of Head Start, the largest concentration of slots are in Jamaica Plain/Roxbury/Mission Hill with 32% of the total slots, followed by Dorchester with 19% and Chinatown/South End/Fenway with 16%. As a result, these three neighborhoods have 67% of all of the Head Start slots in the city, while at the other end of the spectrum, Mattapan has only 20 full-time slots. The Boston Public Schools only offer full-time slots in five neighborhoods of the city: Jamaica Plain/Roxbury/Mission Hill, Mattapan, East Boston, Dorchester, and Allston/Brighton/Kenmore. Center based slots are distributed more evenly across the city. However, 31% of the slots are located in JP/Roxbury/Mission Hill; the next highest neighborhoods are Dorchester with 20% and Chinatown/South End/Fenway with 16% of the capacity. The total full-time subsidies by neighborhood, listed in descending order of number of subsidies by neighborhood, is summarized in Table 9. below and a detailed breakout by neighborhood, by type of care and by age can be found in the Appendix A.6.
15
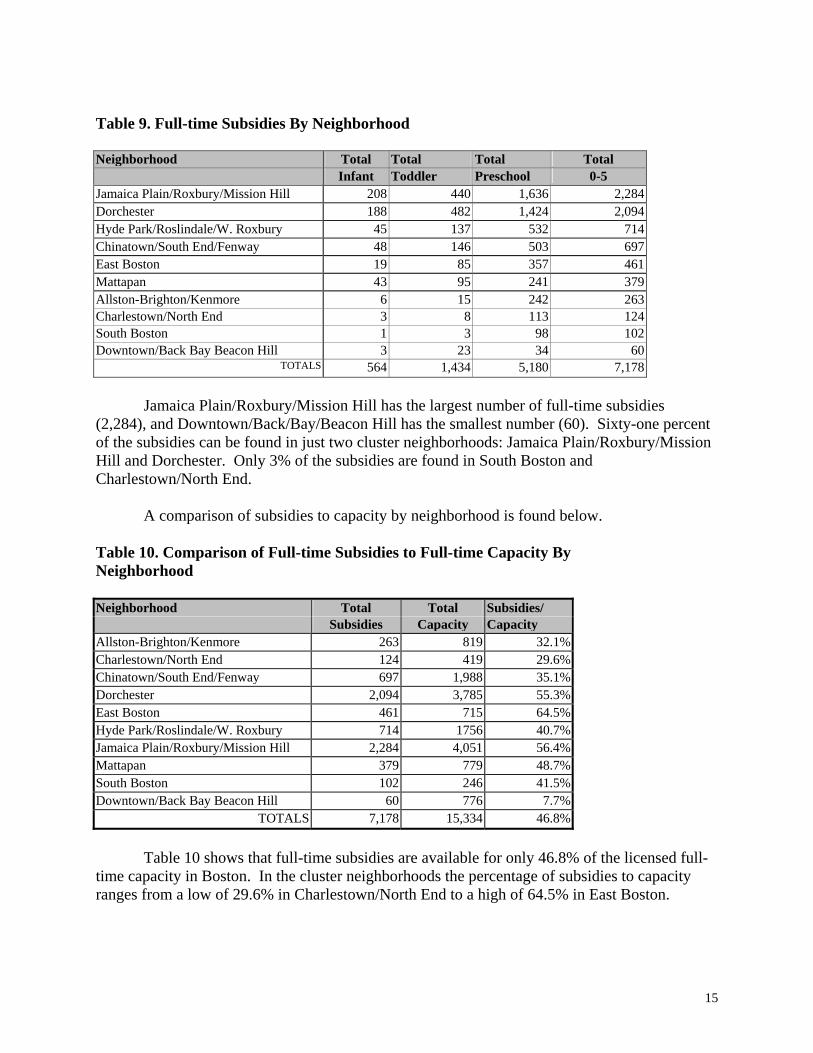
Table 9. Full-time Subsidies By Neighborhood Neighborhood Total Total Total Total
Infant Toddler Preschool 0-5 Jamaica Plain/Roxbury/Mission Hill 208 440 1,636 2,284 Dorchester 188 482 1,424 2,094 Hyde Park/Roslindale/W. Roxbury 45 137 532 714 Chinatown/South End/Fenway 48 146 503 697 East Boston 19 85 357 461 Mattapan 43 95 241 379 Allston-Brighton/Kenmore 6 15 242 263 Charlestown/North End 3 8 113 124 South Boston 1 3 98 102 Downtown/Back Bay Beacon Hill 3 23 34 60
TOTALS 564 1,434 5,180 7,178 Jamaica Plain/Roxbury/Mission Hill has the largest number of full-time subsidies (2,284), and Downtown/Back/Bay/Beacon Hill has the smallest number (60). Sixty-one percent of the subsidies can be found in just two cluster neighborhoods: Jamaica Plain/Roxbury/Mission Hill and Dorchester. Only 3% of the subsidies are found in South Boston and Charlestown/North End.
A comparison of subsidies to capacity by neighborhood is found below. Table 10. Comparison of Full-time Subsidies to Full-time Capacity By Neighborhood Neighborhood Total Total Subsidies/
Subsidies Capacity Capacity Allston-Brighton/Kenmore 263 819 32.1% Charlestown/North End 124 419 29.6% Chinatown/South End/Fenway 697 1,988 35.1% Dorchester 2,094 3,785 55.3% East Boston 461 715 64.5% Hyde Park/Roslindale/W. Roxbury 714 1756 40.7% Jamaica Plain/Roxbury/Mission Hill 2,284 4,051 56.4% Mattapan 379 779 48.7% South Boston 102 246 41.5% Downtown/Back Bay Beacon Hill 60 776 7.7%
TOTALS 7,178 15,334 46.8%
Table 10 shows that full-time subsidies are available for only 46.8% of the licensed full-time capacity in Boston. In the cluster neighborhoods the percentage of subsidies to capacity ranges from a low of 29.6% in Charlestown/North End to a high of 64.5% in East Boston.
16
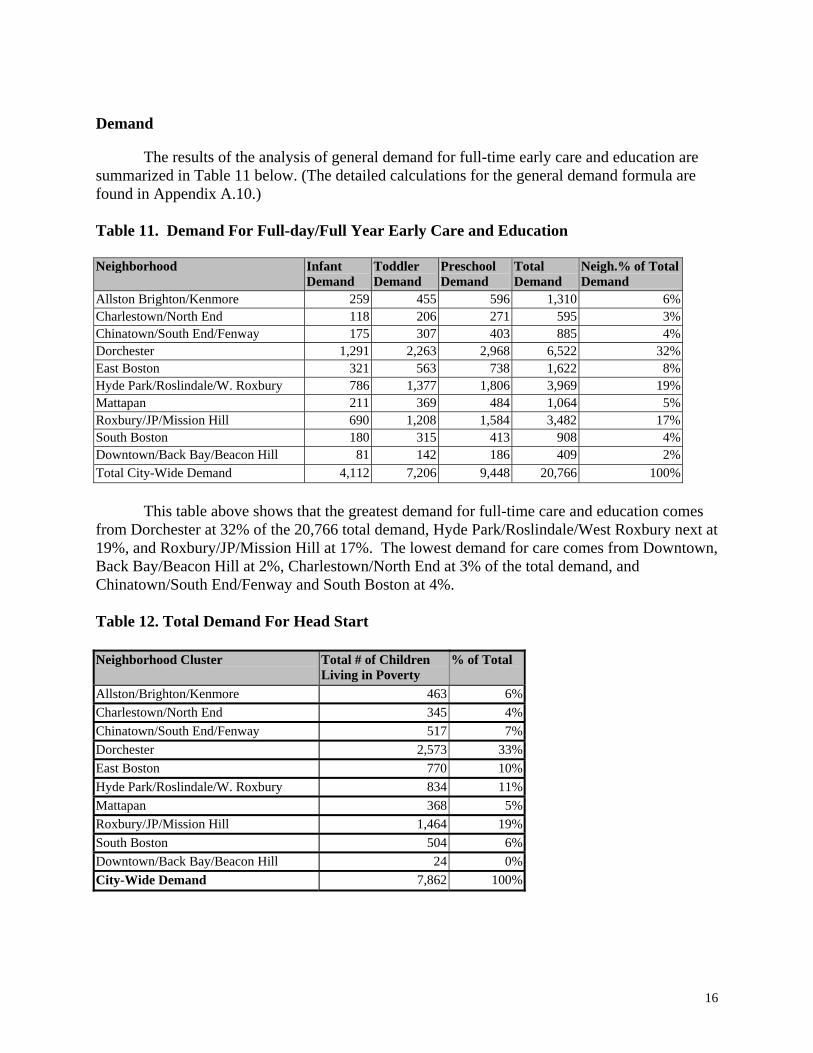
Demand The results of the analysis of general demand for full-time early care and education are summarized in Table 11 below. (The detailed calculations for the general demand formula are found in Appendix A.10.) Table 11. Demand For Full-day/Full Year Early Care and Education Neighborhood Infant
Demand Toddler Demand
Preschool Demand
Total Demand
Neigh.% of Total Demand
Allston Brighton/Kenmore 259 455 596 1,310 6%Charlestown/North End 118 206 271 595 3%Chinatown/South End/Fenway 175 307 403 885 4%Dorchester 1,291 2,263 2,968 6,522 32%East Boston 321 563 738 1,622 8%Hyde Park/Roslindale/W. Roxbury 786 1,377 1,806 3,969 19%Mattapan 211 369 484 1,064 5%Roxbury/JP/Mission Hill 690 1,208 1,584 3,482 17%South Boston 180 315 413 908 4%Downtown/Back Bay/Beacon Hill 81 142 186 409 2%Total City-Wide Demand 4,112 7,206 9,448 20,766 100%
This table above shows that the greatest demand for full-time care and education comes from Dorchester at 32% of the 20,766 total demand, Hyde Park/Roslindale/West Roxbury next at 19%, and Roxbury/JP/Mission Hill at 17%. The lowest demand for care comes from Downtown, Back Bay/Beacon Hill at 2%, Charlestown/North End at 3% of the total demand, and Chinatown/South End/Fenway and South Boston at 4%. Table 12. Total Demand For Head Start
Neighborhood Cluster Total # of Children
Living in Poverty % of Total
Allston/Brighton/Kenmore 463 6%Charlestown/North End 345 4%Chinatown/South End/Fenway 517 7%Dorchester 2,573 33%East Boston 770 10%Hyde Park/Roslindale/W. Roxbury 834 11%Mattapan 368 5%Roxbury/JP/Mission Hill 1,464 19%South Boston 504 6%Downtown/Back Bay/Beacon Hill 24 0%City-Wide Demand 7,862 100%
17
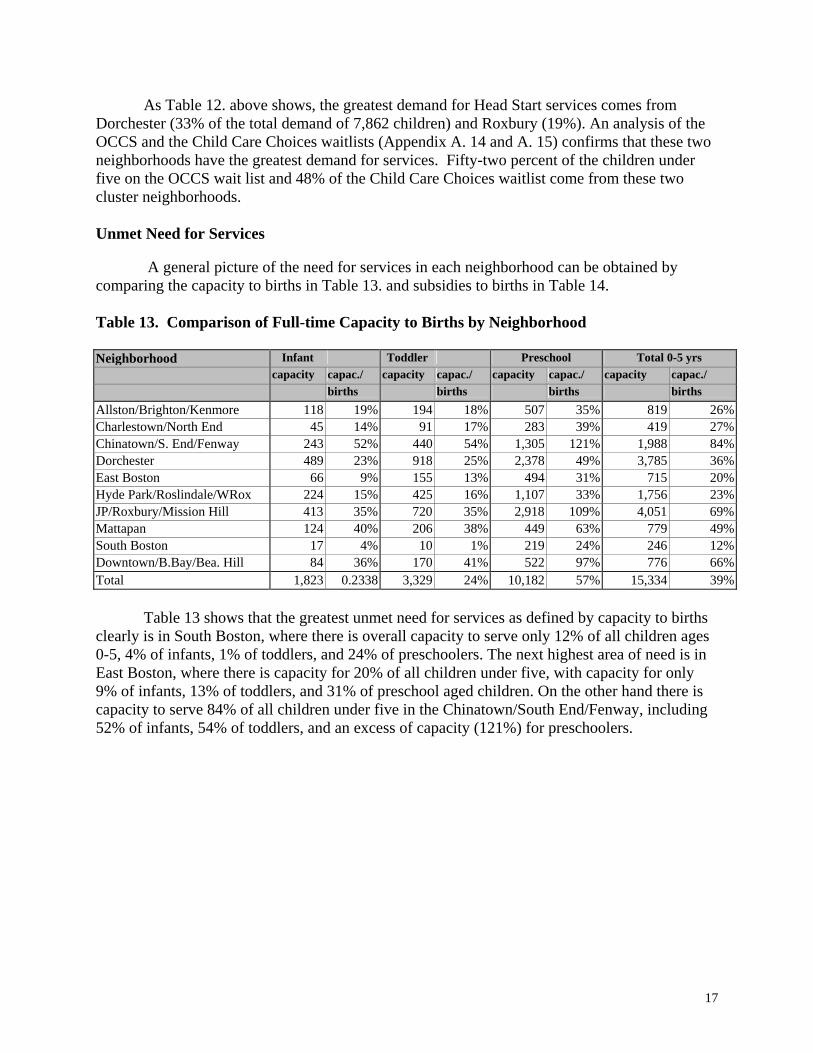
As Table 12. above shows, the greatest demand for Head Start services comes from Dorchester (33% of the total demand of 7,862 children) and Roxbury (19%). An analysis of the OCCS and the Child Care Choices waitlists (Appendix A. 14 and A. 15) confirms that these two neighborhoods have the greatest demand for services. Fifty-two percent of the children under five on the OCCS wait list and 48% of the Child Care Choices waitlist come from these two cluster neighborhoods. Unmet Need for Services A general picture of the need for services in each neighborhood can be obtained by comparing the capacity to births in Table 13. and subsidies to births in Table 14. Table 13. Comparison of Full-time Capacity to Births by Neighborhood Neighborhood Infant Toddler Preschool Total 0-5 yrs
capacity capac./ capacity capac./ capacity capac./ capacity capac./ births births births births
Allston/Brighton/Kenmore 118 19% 194 18% 507 35% 819 26%Charlestown/North End 45 14% 91 17% 283 39% 419 27%Chinatown/S. End/Fenway 243 52% 440 54% 1,305 121% 1,988 84%Dorchester 489 23% 918 25% 2,378 49% 3,785 36%East Boston 66 9% 155 13% 494 31% 715 20%Hyde Park/Roslindale/WRox 224 15% 425 16% 1,107 33% 1,756 23%JP/Roxbury/Mission Hill 413 35% 720 35% 2,918 109% 4,051 69%Mattapan 124 40% 206 38% 449 63% 779 49%South Boston 17 4% 10 1% 219 24% 246 12%Downtown/B.Bay/Bea. Hill 84 36% 170 41% 522 97% 776 66%Total 1,823 0.2338 3,329 24% 10,182 57% 15,334 39%
Table 13 shows that the greatest unmet need for services as defined by capacity to births clearly is in South Boston, where there is overall capacity to serve only 12% of all children ages 0-5, 4% of infants, 1% of toddlers, and 24% of preschoolers. The next highest area of need is in East Boston, where there is capacity for 20% of all children under five, with capacity for only 9% of infants, 13% of toddlers, and 31% of preschool aged children. On the other hand there is capacity to serve 84% of all children under five in the Chinatown/South End/Fenway, including 52% of infants, 54% of toddlers, and an excess of capacity (121%) for preschoolers.
18
Table 14. Comparison of Full-time Subsidies to Births by Neighborhood Neighborhood Infants Toddlers Preschool Total 0-5 yrs
Subsidies Subsidies/ Subsidies Subsidies/ Subsidies Subsidies/ Subsidies Subsidies/ births births births births
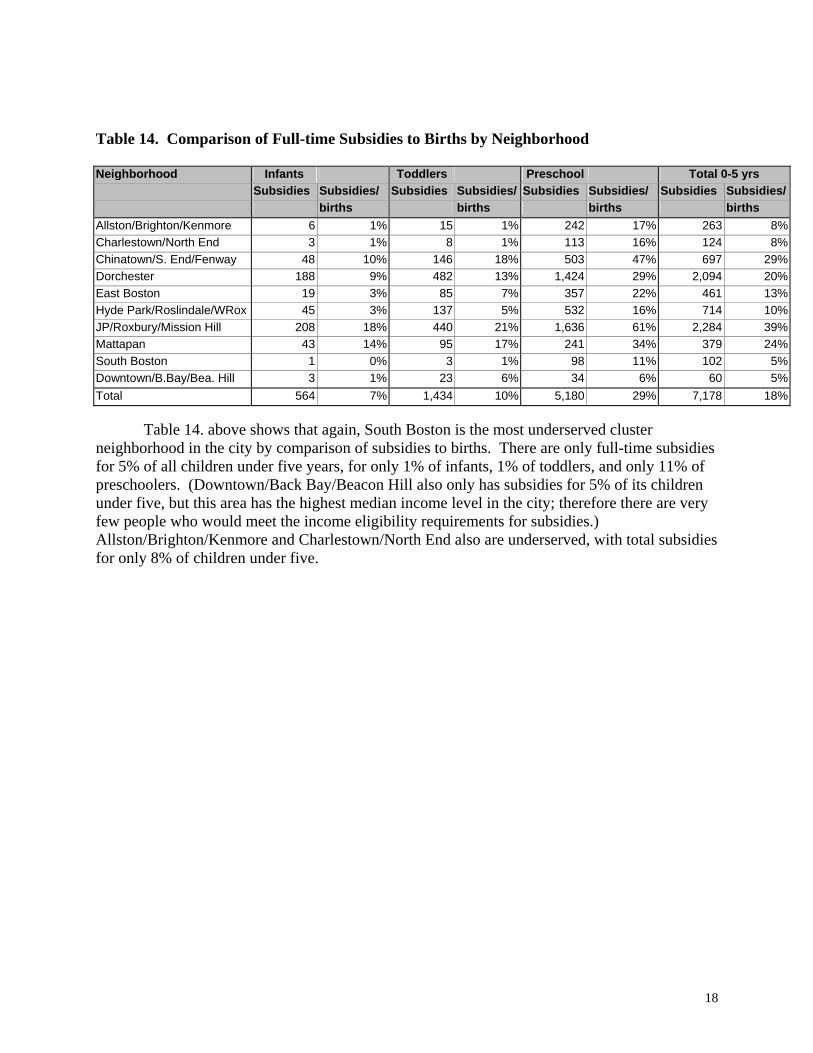
Allston/Brighton/Kenmore 6 1% 15 1% 242 17% 263 8%Charlestown/North End 3 1% 8 1% 113 16% 124 8%Chinatown/S. End/Fenway 48 10% 146 18% 503 47% 697 29%Dorchester 188 9% 482 13% 1,424 29% 2,094 20%East Boston 19 3% 85 7% 357 22% 461 13%Hyde Park/Roslindale/WRox 45 3% 137 5% 532 16% 714 10%JP/Roxbury/Mission Hill 208 18% 440 21% 1,636 61% 2,284 39%Mattapan 43 14% 95 17% 241 34% 379 24%South Boston 1 0% 3 1% 98 11% 102 5%Downtown/B.Bay/Bea. Hill 3 1% 23 6% 34 6% 60 5%Total 564 7% 1,434 10% 5,180 29% 7,178 18% Table 14. above shows that again, South Boston is the most underserved cluster neighborhood in the city by comparison of subsidies to births. There are only full-time subsidies for 5% of all children under five years, for only 1% of infants, 1% of toddlers, and only 11% of preschoolers. (Downtown/Back Bay/Beacon Hill also only has subsidies for 5% of its children under five, but this area has the highest median income level in the city; therefore there are very few people who would meet the income eligibility requirements for subsidies.) Allston/Brighton/Kenmore and Charlestown/North End also are underserved, with total subsidies for only 8% of children under five.
19
Table 15. Comparison of Supply (Capacity) to General Demand Formula Neighborhood AGE GROUP NEIGHBORHOOD Capacity Total Capacity/ Unmet Need
Demand Demand Demand - Capacity 0-5 years Allston/Brighton/Kenmore 819 1310 62.5% 491
Charlestown/North End 419 595 70.4% 176 Chinatown/South End/Fenway 1,988 885 310.0% -1,103 Dorchester 3,785 6,522 58.0% 2737 East Boston 715 1,622 52.2% 907 Hyde Park/Roslindale/W. Rox 1,756 3,969 44.2% 2,213 Mattapan 779 1,064 73.2% 285 Roxbury/Mission Hill/ JP 4,051 3,482 116.3% -569 South Boston 246 908 27.1% 662 Downtown/Back Bay/Beacon Hill 776 409 189.7% -367 Total 15,334 20,766 73.8% 5,432
Infants Allston/Brighton/Kenmore 118 259 45.6% 141 Charlestown/North End 45 118 38.1% 73 Chinatown/South End/Fenway 243 175 138.9% -68 Dorchester 489 1,291 37.9% 802 East Boston 66 321 20.6% 255 Hyde Park/Roslindale/W. Rox 224 786 28.5% 562 Mattapan 124 211 58.8% 87 Roxbury/Mission Hill/ JP 413 690 59.9% 277 South Boston 17 180 9.4% 163 Downtown/Back Bay/Beacon Hill 84 81 103.7% -3 Total 1,823 4,112 44.3% 2,289
Toddlers Allston/Brighton/Kenmore 194 455 42.6% 261 Charlestown/North End 91 206 44.2% 115 Chinatown/South End/Fenway 440 307 143.3% -133 Dorchester 918 2,263 40.6% 1,345 East Boston 155 563 27.5% 408 Hyde Park/Roslindale/W. Rox 425 1,377 30.9% 952 Mattapan 206 369 55.8% 163 Roxbury/Mission Hill/ JP 720 1,208 59.6% 488 South Boston 10 315 3.2% 305 Downtown/Back Bay/Beacon Hill 170 142 119.7% -28 Total 3,329 7,205 46.2% 3,876
Preschool Allston/Brighton/Kenmore 507 596 85.1% 89 Charlestown/North End 283 271 104.4% -12 Chinatown/South End/Fenway 1,305 403 323.8% -902 Dorchester 2,378 2,968 80.1% 590 East Boston 494 738 66.9% 244 Hyde Park/Roslindale/W. Rox 1,107 1,806 61.3% 699 Mattapan 449 484 92.8% 35 Roxbury/Mission Hill/ JP 2,918 1,584 184.2% -1,334 South Boston 219 413 53.0% 194 Downtown/Back Bay/Beacon Hill 522 186 280.6% -336 Total 10,182 9,449 107.8% -733
20
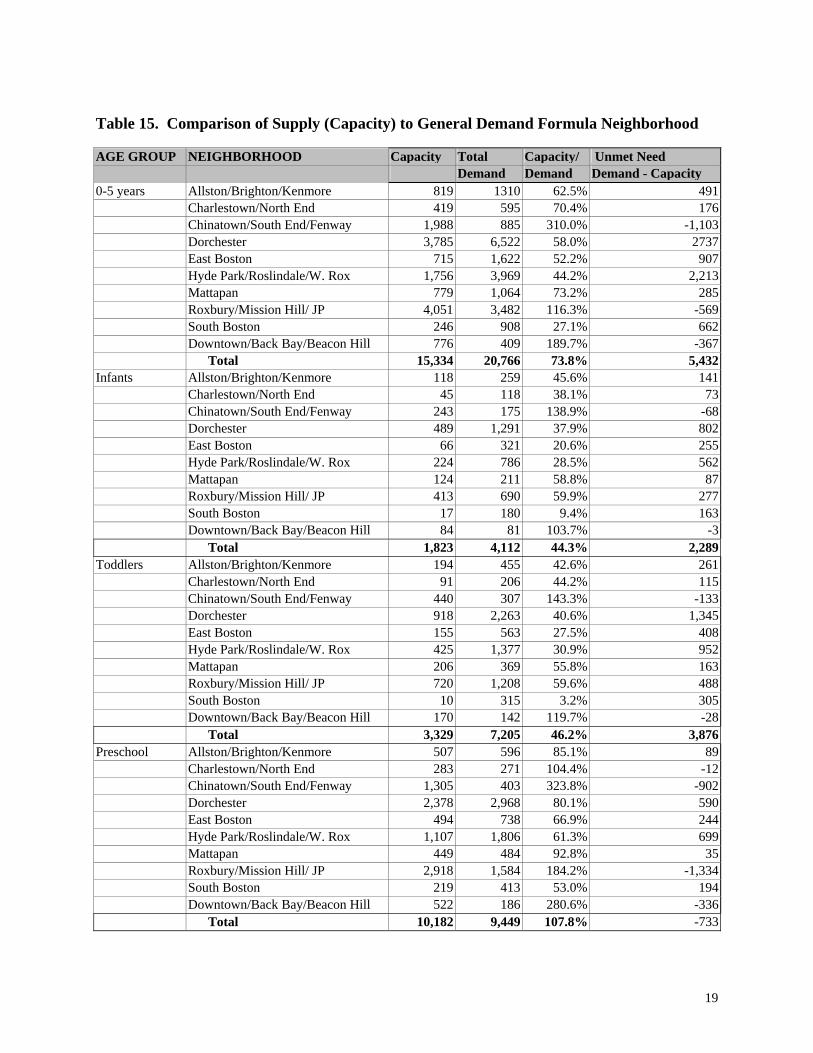
Table 15. shows that the greatest unmet needs for early care and education for all 0-5 year olds by numbers of unmet need are in Dorchester (2,737 children), Hyde Park/Roslindale/W. Roxbury (2,213) and East Boston (907). By percentage of capacity (supply) to overall demand, the greatest unmet needs are in South Boston (only 27.1% of need met), Hyde Park/ Roslindale/West Roxbury (44.2% of need met) and East Boston (52.2% of need met). There is an excess of capacity in comparison to demand in three neighborhoods: Chinatown/South End/Fenway (1,103 slots), Roxbury/JP/Mission Hill (569 slots), and Downtown/Back Bay/Beacon Hill (367 slots). Almost all the excess is found in slots for preschool aged children. There may be some errors in the data for the Chinatown/South End/Fenway and Roxbury/Jamaica Plain/Mission Hill neighborhoods, and we recommend that further study be done. It is interesting to note that in both the comparisons of capacity/births and capacity/demand formulas, the neighborhoods with the greatest percentages of unmet need are South Boston, Hyde Park/Roslindale/W. Roxbury, and East Boston. The lowest percentages of subsidies/births are in South Boston, Allston/Brighton/Kenmore, and Charlestown/North End, but the real unmet need for subsidized care (except for Head Start) could not be calculated due to our inability to collect income information for families with children 0-5 and by cluster neighborhood. Table 16. Unmet Need For Head Start Services Neighborhood Cluster Unmet Need For Full-time
Head Start (Eligible Children-Minus
Full-time Capacity)
Unmet Need For All Head Start (Eligible Children Minus Full-time and Part-time Capacity)
Allston/Brighton/Kenmore 408 272Charlestown/North End 267 191Chinatown/South End/Fenway 360 172Dorchester 2,356 2,039East Boston 719 586Hyde Park/Roslindale/W. Roxbury 756 733Mattapan 347 227Roxbury/JP/Mission Hill 1,143 891South Boston 452 352Downtown/Back Bay/Beacon Hill 20 20Citywide Unmet Need 6,828 5,483
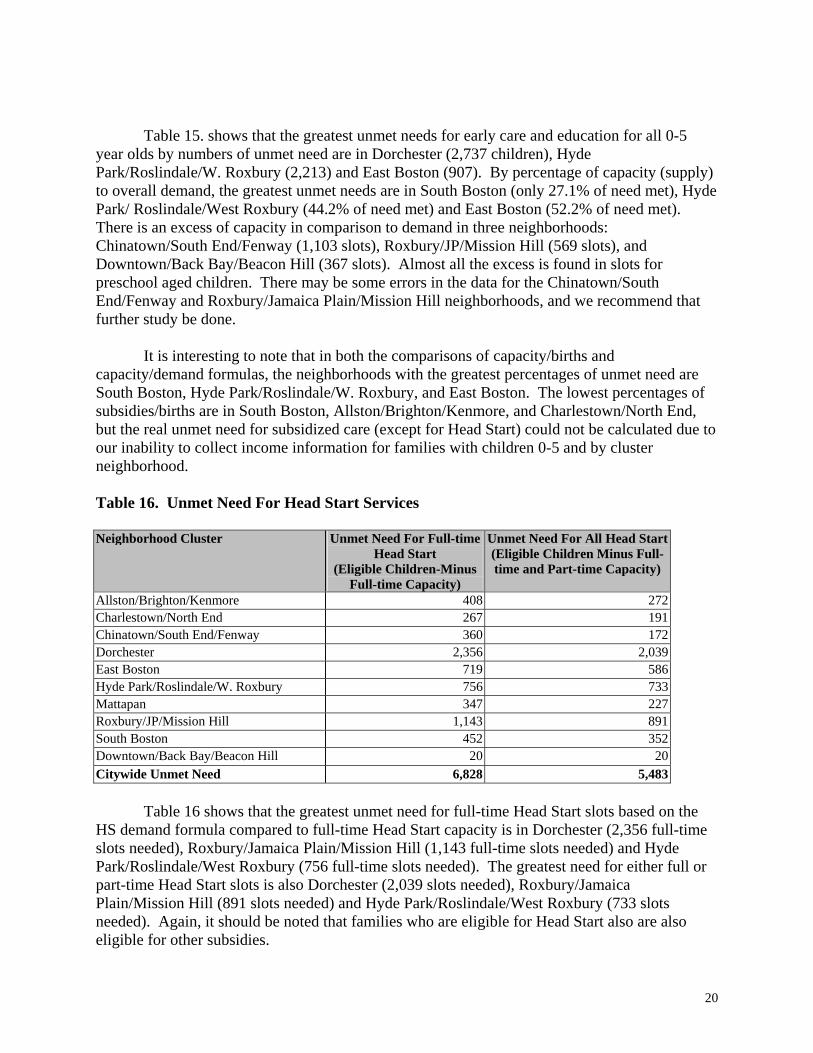
Table 16 shows that the greatest unmet need for full-time Head Start slots based on the HS demand formula compared to full-time Head Start capacity is in Dorchester (2,356 full-time slots needed), Roxbury/Jamaica Plain/Mission Hill (1,143 full-time slots needed) and Hyde Park/Roslindale/West Roxbury (756 full-time slots needed). The greatest need for either full or part-time Head Start slots is also Dorchester (2,039 slots needed), Roxbury/Jamaica Plain/Mission Hill (891 slots needed) and Hyde Park/Roslindale/West Roxbury (733 slots needed). Again, it should be noted that families who are eligible for Head Start also are also eligible for other subsidies.
21
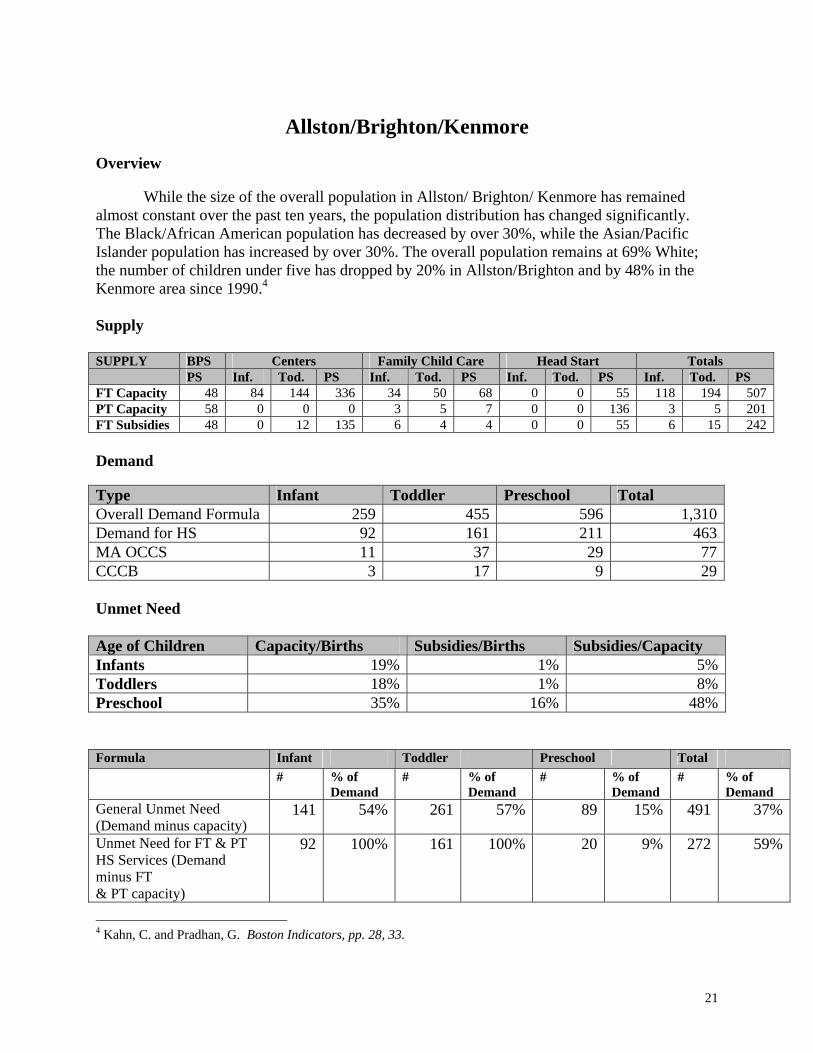
Allston/Brighton/Kenmore
Overview While the size of the overall population in Allston/ Brighton/ Kenmore has remained almost constant over the past ten years, the population distribution has changed significantly. The Black/African American population has decreased by over 30%, while the Asian/Pacific Islander population has increased by over 30%. The overall population remains at 69% White; the number of children under five has dropped by 20% in Allston/Brighton and by 48% in the Kenmore area since 1990.4 Supply SUPPLY BPS Centers Family Child Care Head Start Totals PS Inf. Tod. PS Inf. Tod. PS Inf. Tod. PS Inf. Tod. PS FT Capacity 48 84 144 336 34 50 68 0 0 55 118 194 507 PT Capacity 58 0 0 0 3 5 7 0 0 136 3 5 201 FT Subsidies 48 0 12 135 6 4 4 0 0 55 6 15 242 Demand Type Infant Toddler Preschool Total Overall Demand Formula 259 455 596 1,310Demand for HS 92 161 211 463MA OCCS 11 37 29 77CCCB 3 17 9 29 Unmet Need Age of Children Capacity/Births Subsidies/Births Subsidies/Capacity Infants 19% 1% 5%Toddlers 18% 1% 8%Preschool 35% 16% 48% Formula Infant Toddler Preschool Total # % of
Demand # % of
Demand # % of
Demand # % of
Demand General Unmet Need (Demand minus capacity)
141 54% 261 57% 89 15% 491 37%
Unmet Need for FT & PT HS Services (Demand minus FT & PT capacity)
92 100% 161 100% 20 9% 272 59%
4 Kahn, C. and Pradhan, G. Boston Indicators, pp. 28, 33.
22
Conclusions
Allston/Brighton/Kenmore’s capacity to serve infants and toddlers is particularly low at 18% and 19% respectively. While the full-time subsidies fill 48% of the preschool capacity, there are only subsidies for 5%and 8% of infant and toddler capacity respectively. The Allston/Brighton/Kenmore neighborhood has the third fewest subsidies/births in the city. The demand formulas indicate an overall demand of 1,310 children needing full-time early care and education. Forty-five percent of the total demand is for preschool care. Demand for Head Start alone is 463. When comparing demand to capacity, the general unmet need for 0-5 year olds is 491 children (37% of overall demand), and the unmet need for full-time or part-time Head Start services is 272 children, representing 59% of overall demand.
23
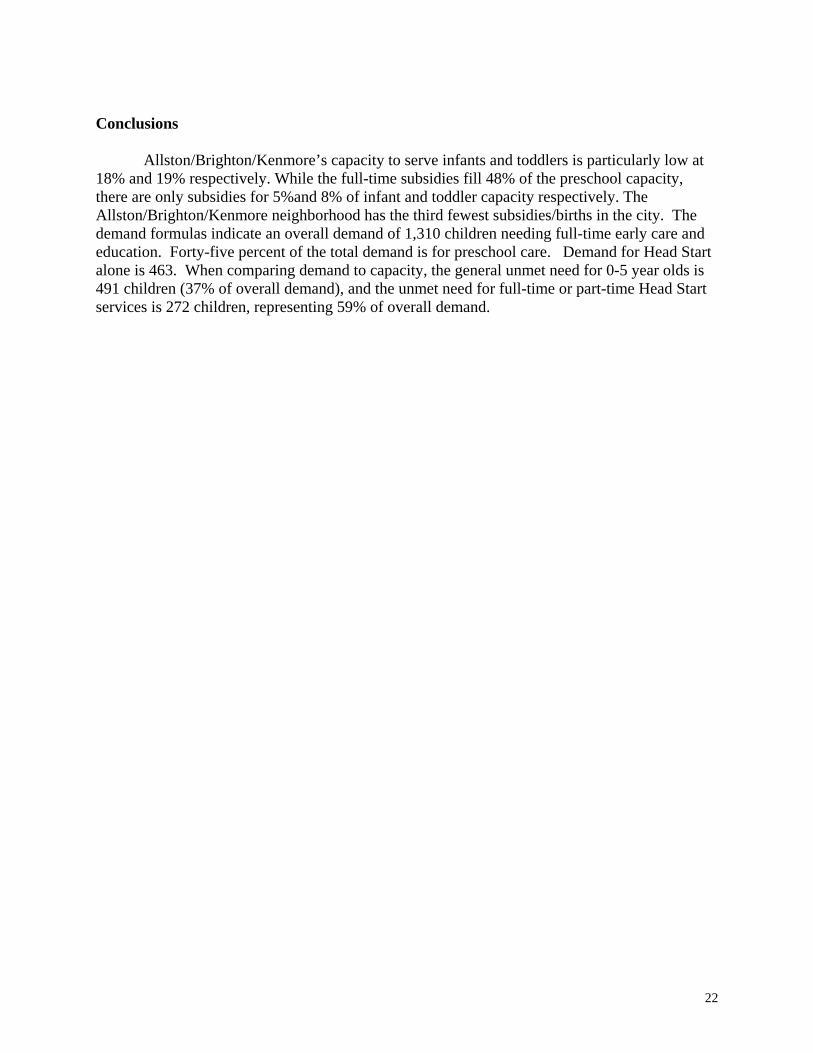
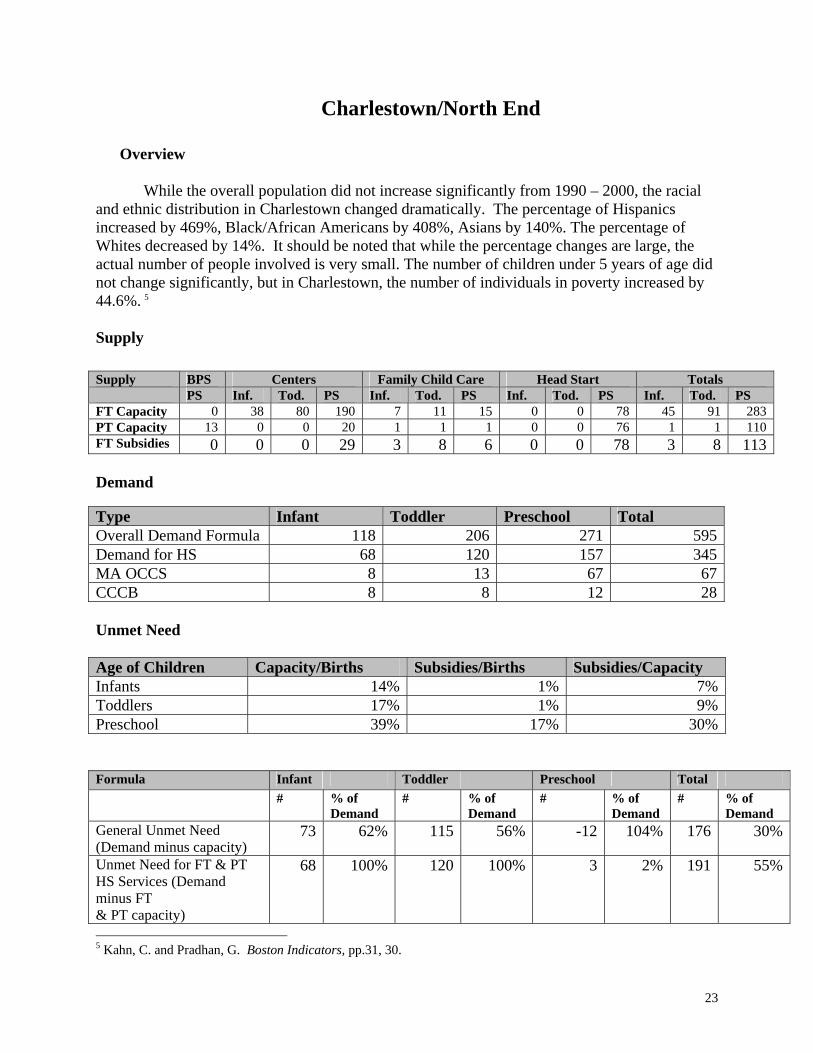
Charlestown/North End
Overview
While the overall population did not increase significantly from 1990 – 2000, the racial and ethnic distribution in Charlestown changed dramatically. The percentage of Hispanics increased by 469%, Black/African Americans by 408%, Asians by 140%. The percentage of Whites decreased by 14%. It should be noted that while the percentage changes are large, the actual number of people involved is very small. The number of children under 5 years of age did not change significantly, but in Charlestown, the number of individuals in poverty increased by 44.6%. 5
Supply
Supply BPS Centers Family Child Care Head Start Totals PS Inf. Tod. PS Inf. Tod. PS Inf. Tod. PS Inf. Tod. PS FT Capacity 0 38 80 190 7 11 15 0 0 78 45 91 283 PT Capacity 13 0 0 20 1 1 1 0 0 76 1 1 110 FT Subsidies 0 0 0 29 3 8 6 0 0 78 3 8 113 Demand Type Infant Toddler Preschool Total Overall Demand Formula 118 206 271 595Demand for HS 68 120 157 345MA OCCS 8 13 67 67CCCB 8 8 12 28 Unmet Need Age of Children Capacity/Births Subsidies/Births Subsidies/Capacity Infants 14% 1% 7%Toddlers 17% 1% 9%Preschool 39% 17% 30% Formula Infant Toddler Preschool Total # % of
Demand # % of
Demand # % of
Demand # % of
Demand General Unmet Need (Demand minus capacity)
73 62% 115 56% -12 104% 176 30%
Unmet Need for FT & PT HS Services (Demand minus FT & PT capacity)
68 100% 120 100% 3 2% 191 55%
5 Kahn, C. and Pradhan, G. Boston Indicators, pp.31, 30.
24
Conclusions Charlestown/North has no full-time BPS slots. In spite of that, it still does have the capacity to serve 39% of all preschoolers, but only 14% of infants and 17% of toddlers. It has almost no subsidies for infants and toddlers and only subsidies to serve 17% of the preschool age population. It also very little family child care capacity, representing only 5% of its overall preschool capacity. According to the demand formula, 595 children ages 0-5 have a need for full-time early care and education services. When capacity is taken into account, there is still an unmet need for 176 slots for children aged 0-5. Charlestown/North End has Head Start capacity to meet the needs of all but 2% of the eligible preschool aged children.
25
Chinatown/South End/Fenway
Overview
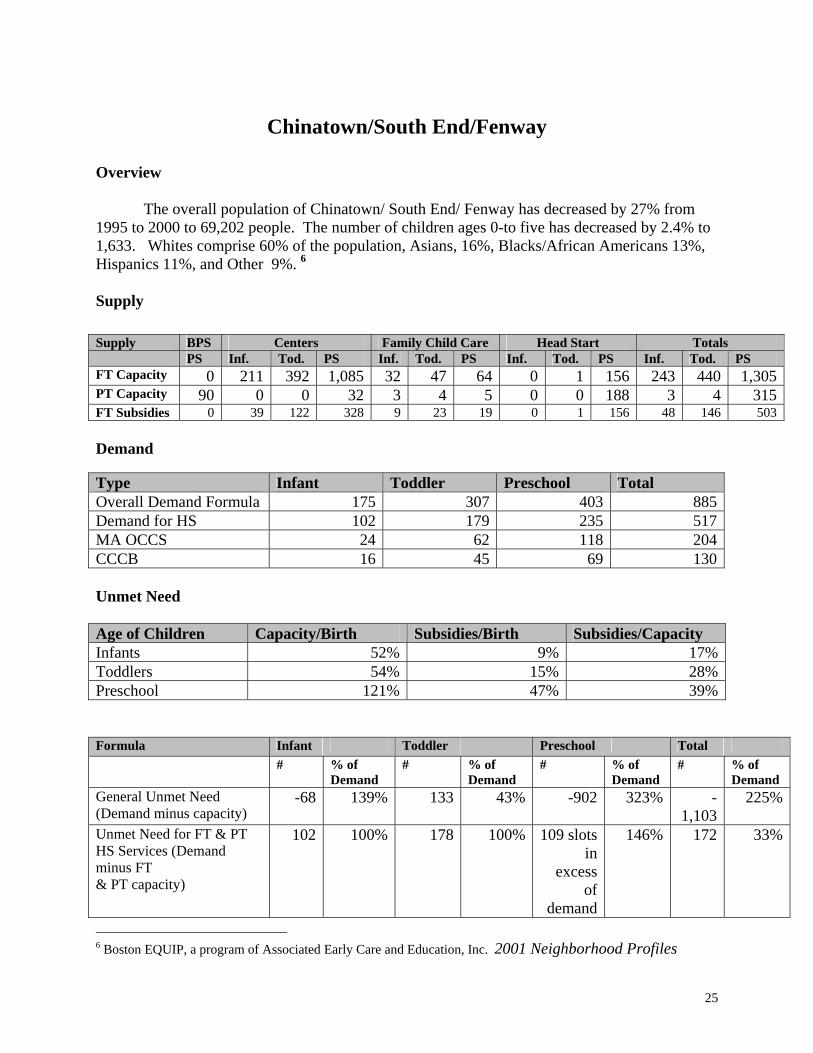
The overall population of Chinatown/ South End/ Fenway has decreased by 27% from 1995 to 2000 to 69,202 people. The number of children ages 0-to five has decreased by 2.4% to 1,633. Whites comprise 60% of the population, Asians, 16%, Blacks/African Americans 13%, Hispanics 11%, and Other 9%. 6 Supply
Supply BPS Centers Family Child Care Head Start Totals PS Inf. Tod. PS Inf. Tod. PS Inf. Tod. PS Inf. Tod. PS FT Capacity 0 211 392 1,085 32 47 64 0 1 156 243 440 1,305PT Capacity 90 0 0 32 3 4 5 0 0 188 3 4 315FT Subsidies 0 39 122 328 9 23 19 0 1 156 48 146 503 Demand Type Infant Toddler Preschool Total Overall Demand Formula 175 307 403 885Demand for HS 102 179 235 517MA OCCS 24 62 118 204CCCB 16 45 69 130 Unmet Need Age of Children Capacity/Birth Subsidies/Birth Subsidies/Capacity Infants 52% 9% 17%Toddlers 54% 15% 28%Preschool 121% 47% 39% Formula Infant Toddler Preschool Total # % of
Demand # % of
Demand # % of
Demand # % of
Demand General Unmet Need (Demand minus capacity)
-68 139% 133 43% -902 323% -1,103
225%
Unmet Need for FT & PT HS Services (Demand minus FT & PT capacity)
102 100% 178 100% 109 slots in
excess of
demand
146% 172 33%
6 Boston EQUIP, a program of Associated Early Care and Education, Inc. 2001 Neighborhood Profiles
26
Conclusions
This neighborhood has more capacity to births than anywhere else in the city. There is an excess of 21% in the capacity to serve preschool aged children, but capacity for only 52% of infants and 54% of toddlers. While there are subsidies to serve 47% of all preschool aged children, there are subsidies to serve only 9% and 15% of infants and toddlers respectively. There are no full-time BPS slots, but almost ½ of all Head Start slots are full-day/full year. Families of 885 children ages 0-5 are in need of full-time early care and education in this neighborhood. When the current supply is subtracted from the overall demand number, there remains an excess supply of 1,103 full-time slots for children aged 0-5. While there are no Head Start slots for infants and toddlers, this neighborhood has an excess of 46% of Head Start slots for the eligible number of children. (There may be errors in some of the data for this neighborhood. We recommend further review of the data.)
27
Dorchester
Overview
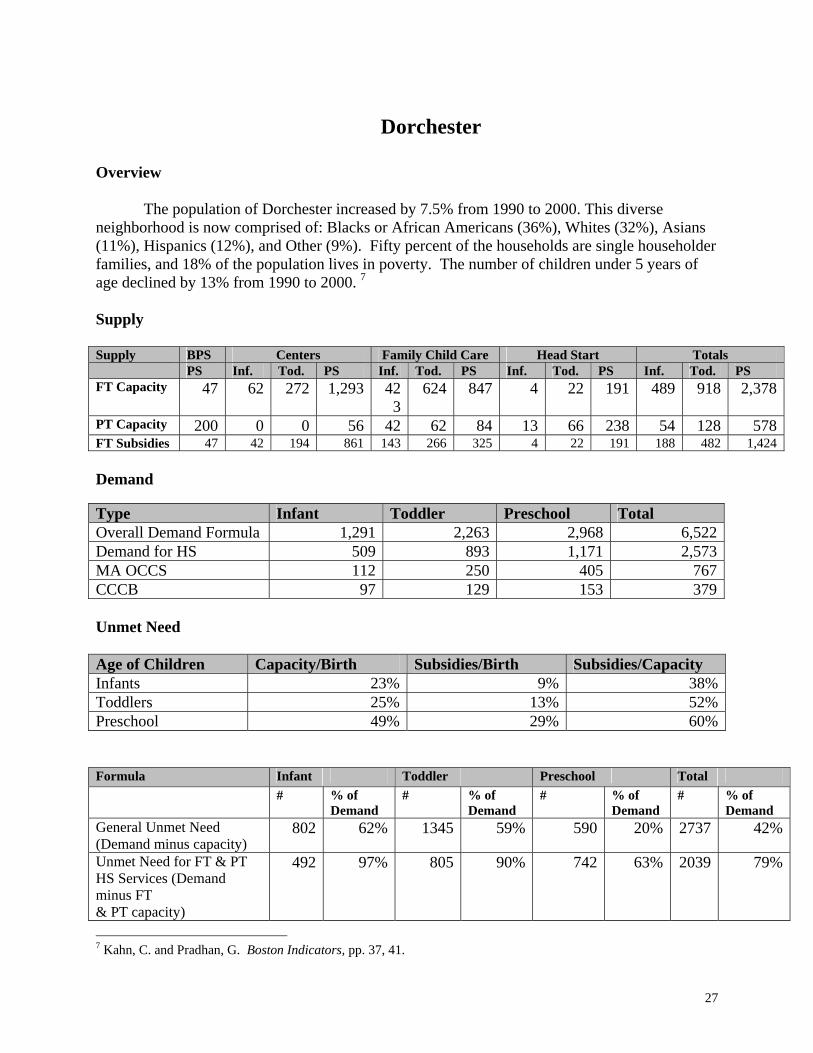
The population of Dorchester increased by 7.5% from 1990 to 2000. This diverse neighborhood is now comprised of: Blacks or African Americans (36%), Whites (32%), Asians (11%), Hispanics (12%), and Other (9%). Fifty percent of the households are single householder families, and 18% of the population lives in poverty. The number of children under 5 years of age declined by 13% from 1990 to 2000. 7 Supply Supply BPS Centers Family Child Care Head Start Totals PS Inf. Tod. PS Inf. Tod. PS Inf. Tod. PS Inf. Tod. PS FT Capacity 47 62 272 1,293 42
3624 847 4 22 191 489 918 2,378
PT Capacity 200 0 0 56 42 62 84 13 66 238 54 128 578FT Subsidies 47 42 194 861 143 266 325 4 22 191 188 482 1,424 Demand Type Infant Toddler Preschool Total Overall Demand Formula 1,291 2,263 2,968 6,522Demand for HS 509 893 1,171 2,573MA OCCS 112 250 405 767CCCB 97 129 153 379 Unmet Need Age of Children Capacity/Birth Subsidies/Birth Subsidies/Capacity Infants 23% 9% 38%Toddlers 25% 13% 52%Preschool 49% 29% 60% Formula Infant Toddler Preschool Total # % of
Demand # % of
Demand # % of
Demand # % of
Demand General Unmet Need (Demand minus capacity)
802 62% 1345 59% 590 20% 2737 42%
Unmet Need for FT & PT HS Services (Demand minus FT & PT capacity)
492 97% 805 90% 742 63% 2039 79%
7 Kahn, C. and Pradhan, G. Boston Indicators, pp. 37, 41.
28
Conclusions
The distribution of providers in Dorchester is unusual. Fully 50% of the capacity is in family child care homes, while center based programs account for only 43% of the total capacity, Head Start just 5%, and BPS only 1%. There are only 47 full-day BPS slots, and only 191 full-day Head Starts for this large community. While there is capacity to serve 49% of all preschoolers in licensed full-day programs, there is only capacity for 23-25% of the 0-3 year olds. Full-day subsidies are available for 29% of the preschoolers, but only 9-13% of younger children. According to the demand formula 32% of all the demand for early care and education services in the city (representing 6,522 children) comes from Dorchester families. When the supply is subtracted from overall demand, there is an unmet need for 2,737 full-time slots for children under five. This is the largest number of unmet need slots in any neighborhood in the city. While Dorchester is fortunate to have the largest number of Head Start slots in the city, there are still 2, 039 families who meet the eligibility requirements in excess of the total number of Head Start slots available.
29
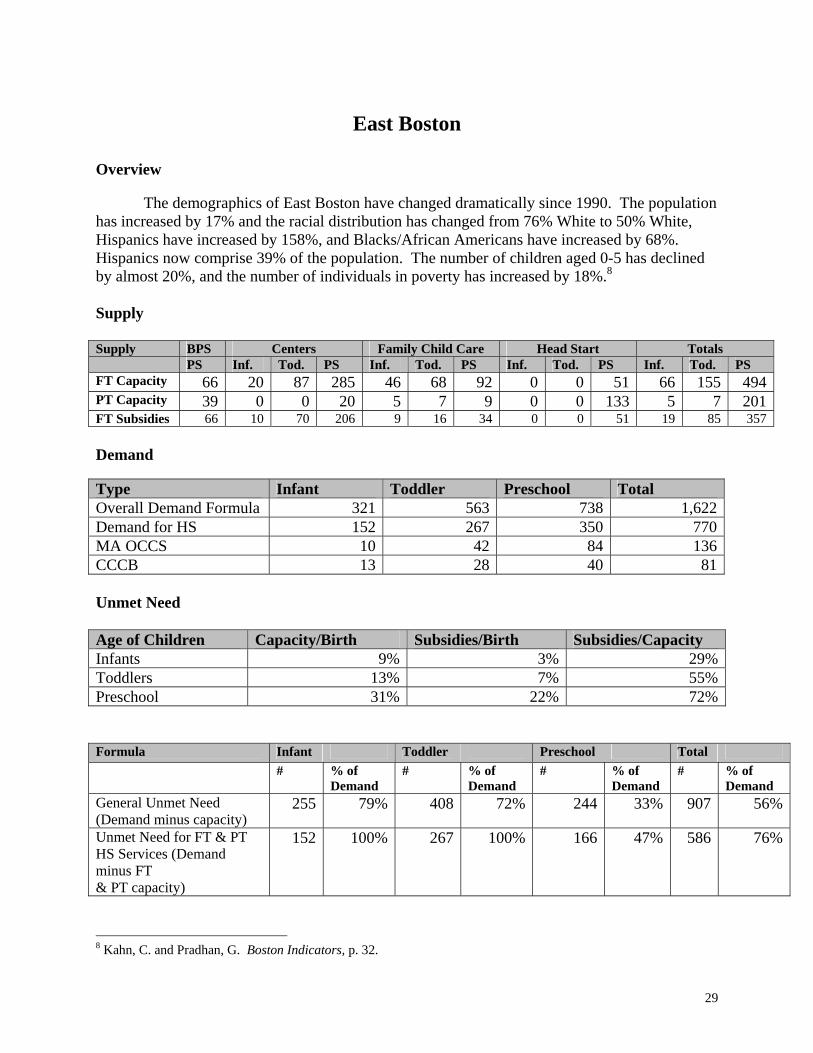
East Boston Overview The demographics of East Boston have changed dramatically since 1990. The population has increased by 17% and the racial distribution has changed from 76% White to 50% White, Hispanics have increased by 158%, and Blacks/African Americans have increased by 68%. Hispanics now comprise 39% of the population. The number of children aged 0-5 has declined by almost 20%, and the number of individuals in poverty has increased by 18%.8 Supply Supply BPS Centers Family Child Care Head Start Totals PS Inf. Tod. PS Inf. Tod. PS Inf. Tod. PS Inf. Tod. PS FT Capacity 66 20 87 285 46 68 92 0 0 51 66 155 494PT Capacity 39 0 0 20 5 7 9 0 0 133 5 7 201FT Subsidies 66 10 70 206 9 16 34 0 0 51 19 85 357 Demand Type Infant Toddler Preschool Total Overall Demand Formula 321 563 738 1,622Demand for HS 152 267 350 770MA OCCS 10 42 84 136CCCB 13 28 40 81 Unmet Need Age of Children Capacity/Birth Subsidies/Birth Subsidies/Capacity Infants 9% 3% 29%Toddlers 13% 7% 55%Preschool 31% 22% 72% Formula Infant Toddler Preschool Total # % of
Demand # % of
Demand # % of
Demand # % of
Demand General Unmet Need (Demand minus capacity)
255 79% 408 72% 244 33% 907 56%
Unmet Need for FT & PT HS Services (Demand minus FT & PT capacity)
152 100% 267 100% 166 47% 586 76%
8 Kahn, C. and Pradhan, G. Boston Indicators, p. 32.
30
Conclusions This neighborhood is one of the three most underserved neighborhoods in the city. There
is full-time capacity for only 31% of preschoolers, 13% of toddlers, and 9% of infants. Full-time subsidies are available for 22% of all preschoolers, but only 6-7% of younger children. BPS and Head Start offer a significant number of full-day slots in the community, yet 76% of the eligible families can not find part-day or full-day Head Start services in the neighborhood. The demand formula shows that 1,622 children ages 0-5 need full-time early care and education services in E. Boston, and when the current supply is taken into account, the unmet need drops to 907 children, representing 56% of the demand.
31
Hyde Park, Roslindale, West Roxbury
Overview
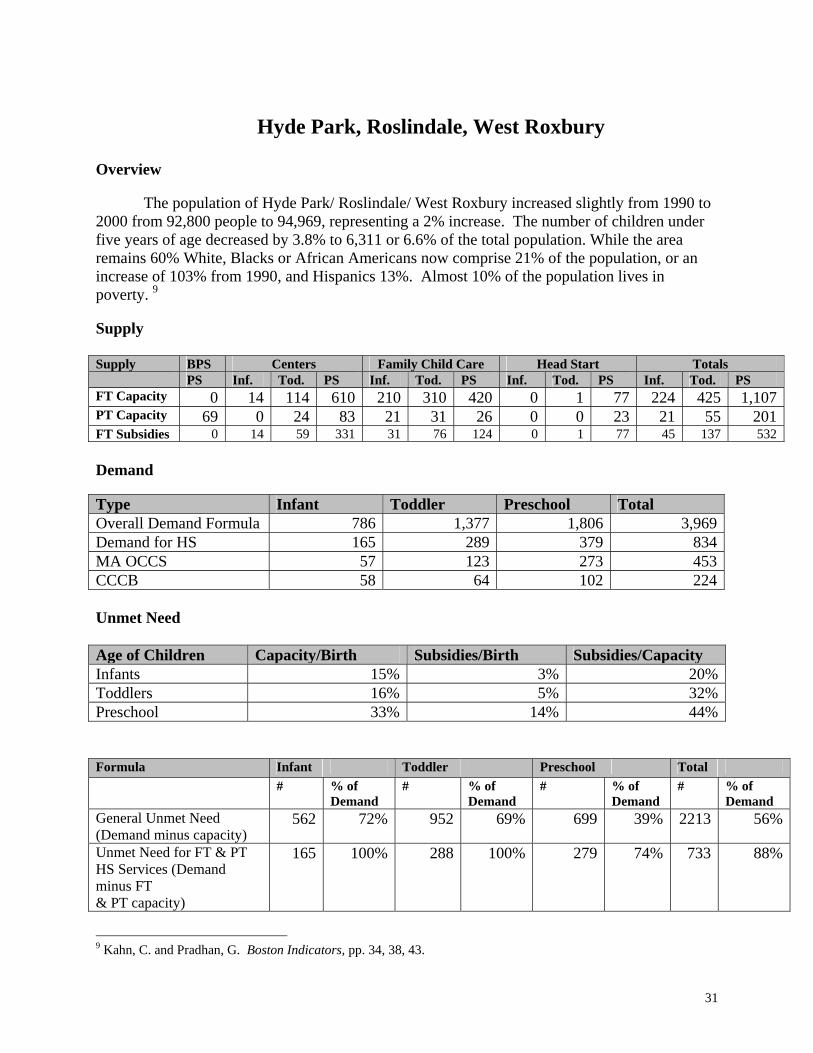
The population of Hyde Park/ Roslindale/ West Roxbury increased slightly from 1990 to 2000 from 92,800 people to 94,969, representing a 2% increase. The number of children under five years of age decreased by 3.8% to 6,311 or 6.6% of the total population. While the area remains 60% White, Blacks or African Americans now comprise 21% of the population, or an increase of 103% from 1990, and Hispanics 13%. Almost 10% of the population lives in poverty. 9
Supply Supply BPS Centers Family Child Care Head Start Totals PS Inf. Tod. PS Inf. Tod. PS Inf. Tod. PS Inf. Tod. PS FT Capacity 0 14 114 610 210 310 420 0 1 77 224 425 1,107PT Capacity 69 0 24 83 21 31 26 0 0 23 21 55 201FT Subsidies 0 14 59 331 31 76 124 0 1 77 45 137 532 Demand Type Infant Toddler Preschool Total Overall Demand Formula 786 1,377 1,806 3,969Demand for HS 165 289 379 834MA OCCS 57 123 273 453CCCB 58 64 102 224 Unmet Need Age of Children Capacity/Birth Subsidies/Birth Subsidies/Capacity Infants 15% 3% 20%Toddlers 16% 5% 32%Preschool 33% 14% 44% Formula Infant Toddler Preschool Total # % of
Demand # % of
Demand # % of
Demand # % of
Demand General Unmet Need (Demand minus capacity)
562 72% 952 69% 699 39% 2213 56%
Unmet Need for FT & PT HS Services (Demand minus FT & PT capacity)
165 100% 288 100% 279 74% 733 88%
9 Kahn, C. and Pradhan, G. Boston Indicators, pp. 34, 38, 43.
32
Conclusions
This neighborhood is one of the three most underserved neighborhoods in the city. It has
full-time capacity for only 15% of all infants, 16% of all toddlers, and 33% of all preschoolers. However, 44% of all licensed preschool slots are subsidized, in spite of the fact that BPS has no full-time slots in the neighborhood. Seventy-seven percent of all Head Start slots in the neighborhood are full-time, but 88% of the families who are eligible for Head Start services are unable to access them. Subsidies are available for only 3% of all infants and 5% of all toddlers. The demand formula calculations show that 3,969 0-5 year olds need care in this neighborhood, the second largest neighborhood total demand in the city. When supply is taken into account, there is still an unmet need for 2,213 full-time slots for 0-5 year olds.
33
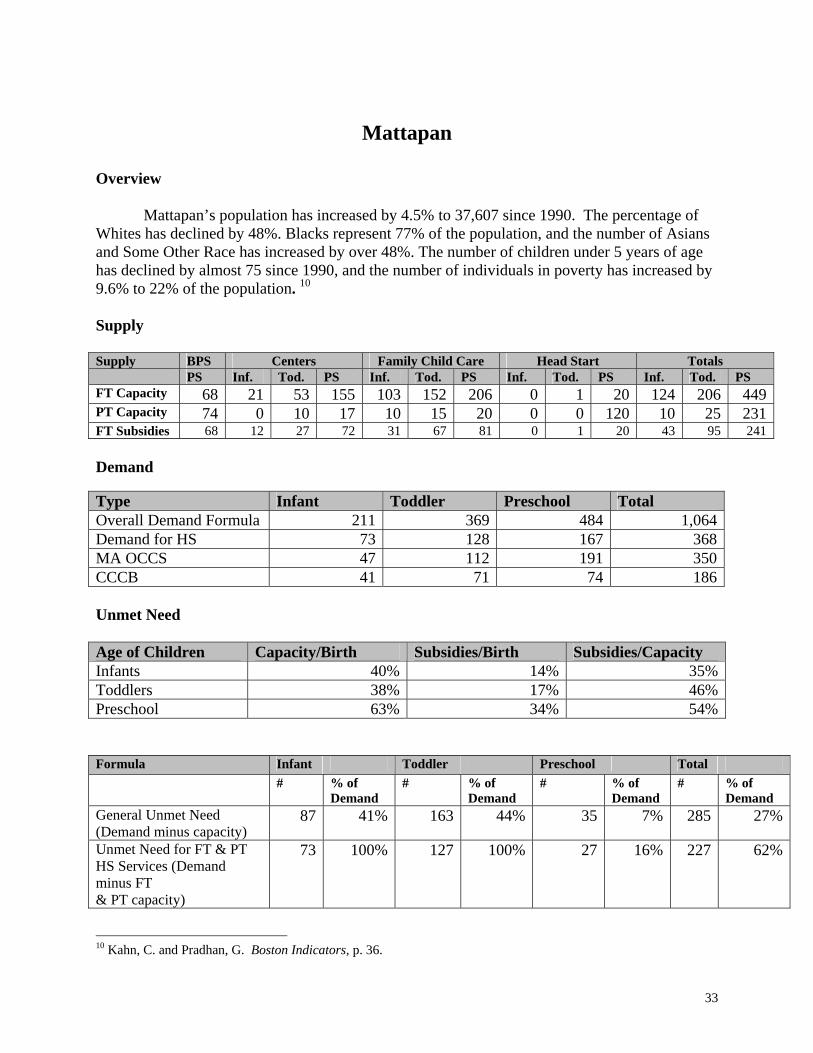
Mattapan
Overview Mattapan’s population has increased by 4.5% to 37,607 since 1990. The percentage of Whites has declined by 48%. Blacks represent 77% of the population, and the number of Asians and Some Other Race has increased by over 48%. The number of children under 5 years of age has declined by almost 75 since 1990, and the number of individuals in poverty has increased by 9.6% to 22% of the population. 10 Supply Supply BPS Centers Family Child Care Head Start Totals PS Inf. Tod. PS Inf. Tod. PS Inf. Tod. PS Inf. Tod. PS FT Capacity 68 21 53 155 103 152 206 0 1 20 124 206 449PT Capacity 74 0 10 17 10 15 20 0 0 120 10 25 231FT Subsidies 68 12 27 72 31 67 81 0 1 20 43 95 241 Demand Type Infant Toddler Preschool Total Overall Demand Formula 211 369 484 1,064Demand for HS 73 128 167 368MA OCCS 47 112 191 350CCCB 41 71 74 186 Unmet Need Age of Children Capacity/Birth Subsidies/Birth Subsidies/Capacity Infants 40% 14% 35%Toddlers 38% 17% 46%Preschool 63% 34% 54% Formula Infant Toddler Preschool Total # % of
Demand # % of
Demand # % of
Demand # % of
Demand General Unmet Need (Demand minus capacity)
87 41% 163 44% 35 7% 285 27%
Unmet Need for FT & PT HS Services (Demand minus FT & PT capacity)
73 100% 127 100% 27 16% 227 62%
10 Kahn, C. and Pradhan, G. Boston Indicators, p. 36.
34
Conclusions
Mattapan has an unusual mix of providers. Of the total preschool capacity, 46% of the full-time slots are in family child care, 35% in centers, 15% in BPS, and 4% in Head Start. Centers generally offer the majority of preschool slots in other neighborhoods. BPS offers 68 full-day slots in Mattapan. Mattapan has an unusually large number of family child care providers who provide 59% of the total full-time capacity for children 0-5. Mattapan also has capacity to serve a significant number of children -- fully 40% of all infants, 30% of toddlers, and 63% of all preschool aged children. The demand formula shows that 3,969 children ages 0-5 years old need early care and education in Mattapan, but when the current supply is taken into account, the unmet need drops to 285 or 27% of the total demand. However, 62% of all families who are eligible for Head Start services are unable to access the program.
35
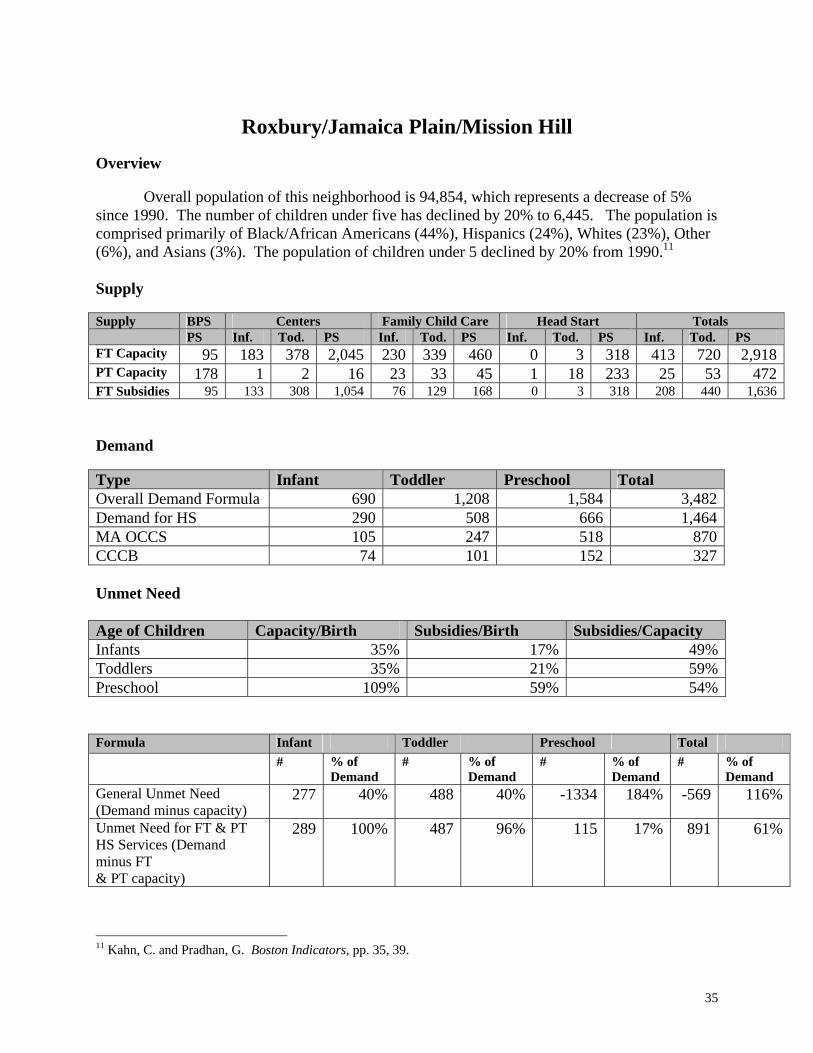
Roxbury/Jamaica Plain/Mission Hill
Overview Overall population of this neighborhood is 94,854, which represents a decrease of 5% since 1990. The number of children under five has declined by 20% to 6,445. The population is comprised primarily of Black/African Americans (44%), Hispanics (24%), Whites (23%), Other (6%), and Asians (3%). The population of children under 5 declined by 20% from 1990.11 Supply Supply BPS Centers Family Child Care Head Start Totals PS Inf. Tod. PS Inf. Tod. PS Inf. Tod. PS Inf. Tod. PS FT Capacity 95 183 378 2,045 230 339 460 0 3 318 413 720 2,918PT Capacity 178 1 2 16 23 33 45 1 18 233 25 53 472FT Subsidies 95 133 308 1,054 76 129 168 0 3 318 208 440 1,636 Demand Type Infant Toddler Preschool Total Overall Demand Formula 690 1,208 1,584 3,482Demand for HS 290 508 666 1,464MA OCCS 105 247 518 870CCCB 74 101 152 327 Unmet Need Age of Children Capacity/Birth Subsidies/Birth Subsidies/Capacity Infants 35% 17% 49%Toddlers 35% 21% 59%Preschool 109% 59% 54% Formula Infant Toddler Preschool Total # % of
Demand # % of
Demand # % of
Demand # % of
Demand General Unmet Need (Demand minus capacity)
277 40% 488 40% -1334 184% -569 116%
Unmet Need for FT & PT HS Services (Demand minus FT & PT capacity)
289 100% 487 96% 115 17% 891 61%
11 Kahn, C. and Pradhan, G. Boston Indicators, pp. 35, 39.
36
Conclusions
Roxbury/ Jamaica Plain/ Mission Hill has a broad range of types of care. There are 95 full-day BPS K0 and K1 slots, and 318 full-day, full year Head Start slots. However, 70% of all full-time preschool capacity is provided by centers. There is full-time capacity to serve a significant number of children, including 35% of all infants and 35% toddlers, but it also appears that there is 9% more preschool capacity than there are preschool aged children. While the demand formula indicates that 3,482 children ages 0-5 need full-time services, a comparison of existing supply (capacity) to this formula shows that again, there is excess supply of 569 slots over the general demand. There are a significant number of subsidies for all age groups, but in particular for preschool aged children (59%). It should be noted that Roxbury/JP/Mission Hill has the highest percentage of subsidized to licensed slots than any other neighborhood in the city. There is not enough Head Start capacity to serve 61% of the families who are eligible for Head Start services. (There may be some errors in the data for this neighborhood; we recommend that further research be done.)
37
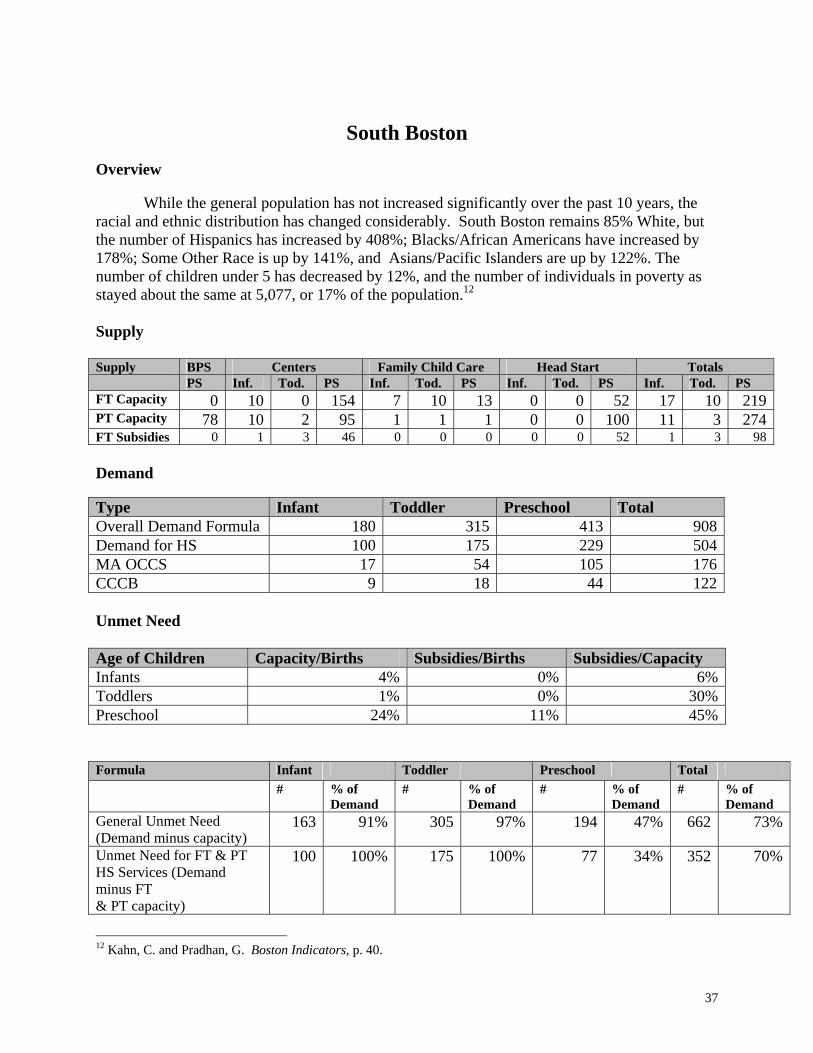
South Boston
Overview While the general population has not increased significantly over the past 10 years, the racial and ethnic distribution has changed considerably. South Boston remains 85% White, but the number of Hispanics has increased by 408%; Blacks/African Americans have increased by 178%; Some Other Race is up by 141%, and Asians/Pacific Islanders are up by 122%. The number of children under 5 has decreased by 12%, and the number of individuals in poverty as stayed about the same at 5,077, or 17% of the population.12 Supply Supply BPS Centers Family Child Care Head Start Totals PS Inf. Tod. PS Inf. Tod. PS Inf. Tod. PS Inf. Tod. PS FT Capacity 0 10 0 154 7 10 13 0 0 52 17 10 219PT Capacity 78 10 2 95 1 1 1 0 0 100 11 3 274FT Subsidies 0 1 3 46 0 0 0 0 0 52 1 3 98 Demand Type Infant Toddler Preschool Total Overall Demand Formula 180 315 413 908Demand for HS 100 175 229 504MA OCCS 17 54 105 176CCCB 9 18 44 122 Unmet Need Age of Children Capacity/Births Subsidies/Births Subsidies/Capacity Infants 4% 0% 6%Toddlers 1% 0% 30%Preschool 24% 11% 45% Formula Infant Toddler Preschool Total # % of
Demand # % of
Demand # % of
Demand # % of
Demand General Unmet Need (Demand minus capacity)
163 91% 305 97% 194 47% 662 73%
Unmet Need for FT & PT HS Services (Demand minus FT & PT capacity)
100 100% 175 100% 77 34% 352 70%
12 Kahn, C. and Pradhan, G. Boston Indicators, p. 40.
38
Conclusions
By all three methods of comparison (capacity/births, subsidies/births, and demand/capacity), South Boston is the most underserved neighborhood in the city. It does not have any full-day BPS slots, but there are 52 full-day Head Start slots for families who meet the federal poverty standard to obtain high quality early childhood development programming on a full-day/full year basis. Seventy percent of the preschool capacity is provided by centers, and another 24% is provided by Head Start. There are almost no family child care providers in South Boston. There is full-time capacity for only 4% of infants, 1% of toddlers, and 24% of preschoolers. Subsidies are available for less than 1% of infants and toddlers, and are only available for 11% of all preschoolers. The demand formula shows that families of 908 children ages 0-8 seek full-time early care and education in S. Boston, and that when current supply is taken into account, there is still an unmet need of 662 slots, representing 73% of total demand. The Head Start programs do not have the capacity to serve 70% of the families who are eligible.
1
A.1. RESEARCH METHODOLOGY A. DATA
Data was collected from a variety of sources for the supply and demand portion of this report. Data from other research reports is identified in #3 above. We used the most up to date data available. Some of the neighborhood based income level and work status data from the 2000 Census will not be available until the fall, 2002. The data sources used for this report are: Action for Boston Community Development (ABCD) Head Start • Program statistics for Early Head Start and Head Start, May, 2002 ABCD Child Care Choice of Boston Information from the Resource and Referral Agency database, including: • Waitlist for voucher slots, as of June 11, 2002 • Voucher supply data, by neighborhood, age group, and type of provide, as of June 4, 2002. The Boston Foundation • Creativity and Innovation: A Bridge to the Future: A summary of the Boston Indicators
Report 2002, by Kahn, Charlotte and Pradhan, Geeta Boston EQUIP, a program of Associated Early Care and Education, Inc. • “Total Child Care Capacity and Number of Children by Boston Public Health Commission
Neighborhoods”, dated March, 2002 and prepared for the 0-8 Coalition • Neighborhood Profiles, prepared for the 0-8 Coalition/Boston Public Schools in June, 2002. • A number of charts based on data provided from other agencies. Boston Public Schools • List of elementary schools, early learning centers and early education centers • Numbers of 3 year old, four year old, and five year old children in K0, K1, and K2 from the
“Analysis of Students by Race and Grade Report”, dated 5/16/02 • Numbers of children in full day (8-10 hour days) classrooms and numbers of children in part
day classrooms (including full school day and part school day), from the “Analysis of Students by Race and Grade Report”, dated 5/16/02.
• List of center based, Head Start, and Family Child Care Providers receiving slots funded by the MA Department of Education’s Community Partnerships programs, and the number of full day/full year, and part day/full year slots assigned to each provider, as of March, 2002 (not including the slots “frozen” in December-January, 2002).
Boston Redevelopment Authority • 2000 U.S. Census information. City of Boston Public Health Commission • Actual birth records for 1998, 1999, 2000, 2001 • Neighborhood boundaries for the nine neighborhood clusters

2
Massachusetts Office of Child Care Services • Basic and supportive contract slots for infants, toddlers, and preschool aged children for all
Boston centers, Head Start programs and family child care providers, as of February 20, 2003
• FY 02 list of licensed centers, Early Head Start, Head Start, and family child care providers • Wait list for subsidized slots, as of September 1, 2002. U.S. Bureau of the Census 2000 Census B. SUPPLY DATA Head Start Capacity – Full time Head Start included only those Head Start Slots that operated 8-10 hrs./day for the full year. These full time slots included the Head Start part day slot, with either Community Partnerships, voucher, or OCCS contract wrap around slots. All Head Start subsidies without the wrap around portion were listed as part day Head Start capacity. . Subsidies for Center Based Programs – The center-based full time subsidy numbers reported include CP, vouchers, and basic and supportive contracts through the Office of Child Care Services. The Office of Child Care Services allocates subsidies by the following age groups for both income eligible and supportive slots: Infant, Infant/Toddler, Preschool, and School-Age. Infant/Toddler contracts were distributed proportionately to the subsidies available specifically to infants and toddlers in each neighborhood. For the citywide subsidies, the infant/toddler contracts were distributed proportionately to the subsidies available specifically to infants and toddlers citywide. Subsidies for Family Child Care - The FCC full time subsidy numbers reported include CP, vouchers, and basic and supportive contracts through the Office of Child Care Services. The Office of Child Care Services reports Family Child Care subsidies by over two and under two years of age. To break down the FCC numbers by Infant, Toddler, and Preschool, all of the FCC over two and under two were added together and multiplied by the FCC utilization rate identified through Boston EQUIP. Subsidies for Head Start – Full time subsidies for Head Start included only those Head Start Slots that operated 8-10 hrs./day for the full year. These full time slots included the part day slot, with either Community Partnerships, voucher, or OCCS contract wrap around slots. All Head Start subsidies without the wrap around portion were listed as part day Head Start capacity. C. DEMAND FORMULA
General Demand Formula
Initially, information from the Boston Public Health Commission and from previous work by Associated Early Care and Education staff was used to determine the census tracts used to define each Boston Public Health Commission neighborhood within in the City of Boston;

3
Allston/Brighton, Charlestown/North End, Dorchester, East Boston, Hyde park/Roslindale/W. Roxbury, Mattapan, Roxbury/Jamaica Plain/Mission Hill, South Boston, and Downtown/Back Bay/Beacon Hill.
Next, using data from the 2000 Census, information on family arrangements and parent employment status was gathered for each neighborhood. For the general demand formula, after consultation with Viki Bok, Jenn Lutzy McDonald, John Lippitt, and Pat Xavier, we decided to use the Illinois Facilities Fund’s general demand formula contained in Planning for Chicago’s Children in the New Century, Early Childhood Care and Education Fact Book.
• 100 % of 2-parent families in which both parents are working • 100% of 1-parent families in which the parent is working • 0% of 2-parent families in which 1 parent is working; and • 45% of 1-parent families in which the parent is not working
To compile this information, the Census File called “Living Arrangements of Own
Children Under 18 Years in Families and Subfamilies by Employment Status of Parents” was used. The “universe” for this analysis was “Own Children Under 18 Years in Families and Subfamilies.” This file displays information based on ‘child” as the unit of analysis for children under 6 and for children between 6 and 17 years of age. The breakdown for family arrangement was as follows:
• Living with Two Parents: o Both Parents in Labor Force o Father Only in Labor Force o Mother Only in Labor Force o Neither Parent in Labor Force
• Living with One Parent: o Living with Father
In Labor Force Not In Labor Force
o Living with Mother In Labor Force Not in Labor Force
Using an excel worksheet, this data was aggregated from each census tract into the
neighborhood level for 2-parents both working, 2-parents one working, 1-parent working, and 1-parent not working.
Because the Census data included children age 5, and the supply data includes only children under the age of five, additional steps were taken to extract 5-year olds from this analysis. First, for each neighborhood, the proportion of children in each “family arrangement by work-status” category of interest was established. The formula’s used were:
• Number of children in 2-parent 2 working/ total number of children in 2-parent families • Number of children in 2-parent 1 working/ total number of children in 2-parent families
4
• Number of children in 1-parent working/ total number of children in 1-parent families; and
• Number of children in 1-parent not working/ total number of children in 1-parent families
Second, the number of five year-olds in each neighborhood was determined. This was done using data from the Census file “Poverty Status in 1999 of Related Children Under 18 years by Family Type by age by Race and Hispanic/Latino Origin” which gives the number of 5-year olds in poverty and the number of five-year olds not-in poverty, by family arrangement. These numbers were added to find the total number of children living in poverty for each neighborhood for two parent and single parent families.
Third, for each neighborhood the previously determined proportions of children in each family and employment category included in this analysis was utilized to determine how many 5-year olds should be included within each “family arrangement by work-status” category. This was done by applying to each neighborhood the proportion of children living in each “family arrangement by work-status” category of interest to the number of five year olds in the appropriate family type. For example, for the 2-parent 2 working “family arrangement by work-status” category, the number of five-year olds living in two-parent families was multiplied by the proportion of 2-parent children whose parents both work. This was done for each family arrangement by work-status category for each neighborhood to determine the number of five-year olds who should be taken out of the original demand formula equation.
Fourth, for each neighborhood the appropriate number of five-year olds were removed from the demand formula analyses such that the age ranged covered in the final demand formula includes children age 0-4.11 months old and is therefore comparable to the Supply side analyses.
Once this data was compiled, the “general demand formula” was applied to each neighborhood such that 100 % of children in families with 2-parents, both working, 0 % of children with 2-parents, one working, 100 % of children with 1-parent working, and 45 % of children with 1-parent who was not working were assumed to have a demand for early care and education. This data is presented for each neighborhood as well as for the City of Boston in Appendix A. 10. In addition, the overall number of children in the general demand formula was disaggregated into infants, toddlers and preschoolers. Calculations for each specific age group were based on percentages from the Supply side analyses that indicated that for each neighborhood 19.8% of the children were infants, 34.7% were toddlers, and 45.5% were preschoolers.
After an initial review of this data and comparison to census data on all children under 5,
we concluded that the above formula would underestimate demand by excluding those children not living within families or subfamilies. We decided to include these children in the demand formula and calculate their demand for child care by using an average demand calculated for the neighborhood in which they live.
The number of children living outside of families in each neighborhood was calculated using census data on all children under 5, as reported by the Boston Foundation Boston Indicators Report. The total number of children under 5 living with 2-parent and 1-parent
5
families in a neighborhood (calculated as explained above) was subtracted from the total number of children under 5 in that neighborhood. The remaining number was identified as those children who live with non-relatives.
The average demand for these children for each neighborhood was calculated by adding
up the total demand for all children living with 2-parent and 1-parent families in a neighborhood and dividing by the total number of children living with 2-parent and 1-parent families in that neighborhood:
demand for children in 2-parent 2 working + demand for children in 2-parent 1 working + demand for children in 1-parent 1 working + demand for children in 1-parent none working / total number of children living with 2-parent and 1-parent families
Those percentages then were applied to the children living with non-relatives. The subsequent numbers of children with non-relatives then were added to the demand numbers of children living with parents to arrive at the total demand numbers.
Head Start Demand Formula
As with the general demand formula, information from the Boston Public Health Commission and from the 2000 Census was used to complete this analysis. For the Head Start demand formula, it was determined that 100% of children eligible for Head Start, based on the federal Poverty Guidelines, would be included in the formula.
To compile this information, the Census File depicting “Poverty Status in 1999 of Related Children Under 18 years by Family Type by age by Race and Hispanic/Latino Origin” was used. The “universe” for this analysis was “Related Children Under 18 Years.” This file displayed information based on ‘child” as the unit of analysis for children under 5 years old, for 5 years olds, as well as for children from 6 to 17 years of age. The breakdown for family arrangement was as follows:
• In Married-Couple Families • In Male Householder, no Wife Families; and • In Female Householder, no Husband Families
Using an excel worksheet, this data was aggregated from each census tract into the neighborhood level for married couple families, male householder families, and female householder families that had family incomes below the 1999 Poverty Level.
Once this data was compiled, the “Head Start Demand Formula” was applied to each neighborhood such that 100 % of children under the age of 5 in any of these families living in poverty were eligible for, and therefore assumed to demand Head Start early care and education. In addition to compiling the data for overall Head Start demand, the number of infants, toddlers, and preschoolers for each neighborhood who were eligible for Head Start, and therefore included

6
in the Head Start demand formula, was determined. As with the general demand formula, this was done by applying birth percentages from the Supply side analyses such that the percentage of infants (19.8%), toddlers (34.7%), and preschoolers (45.5%) in each neighborhood were disaggregated.
It should be noted that the census file “Poverty Status in 1999 of Related Children Under 18 years by Family Type by age by race and Hispanic/latino Origin” was used since the unit of analysis was “children under 18” to allow the Head Start Demand Formula and the General Demand Formula to be comparable. However, it should be noted that the numbers provided in these two Census tables differ slightly because of the different “Universes” the census data originated from. Unfortunately, to be able to gather Census Data on family type, employment status, poverty status, and age of child; all needed for the General Demand and Head Start Demand formulas, these were the Tables that had to be used.

1
A.1. RESEARCH METHODOLOGY A. DATA
Data was collected from a variety of sources for the supply and demand portion of this report. Data from other research reports is identified in #3 above. We used the most up to date data available. Some of the neighborhood based income level and work status data from the 2000 Census will not be available until the fall, 2002. The data sources used for this report are: Action for Boston Community Development (ABCD) Head Start • Program statistics for Early Head Start and Head Start, May, 2002 ABCD Child Care Choice of Boston Information from the Resource and Referral Agency database, including: • Waitlist for voucher slots, as of June 11, 2002 • Voucher supply data, by neighborhood, age group, and type of provide, as of June 4, 2002. The Boston Foundation • Creativity and Innovation: A Bridge to the Future: A summary of the Boston Indicators
Report 2002, by Kahn, Charlotte and Pradhan, Geeta Boston EQUIP, a program of Associated Early Care and Education, Inc. • “Total Child Care Capacity and Number of Children by Boston Public Health Commission
Neighborhoods”, dated March, 2002 and prepared for the 0-8 Coalition • Neighborhood Profiles, prepared for the 0-8 Coalition/Boston Public Schools in June, 2002. • A number of charts based on data provided from other agencies. Boston Public Schools • List of elementary schools, early learning centers and early education centers • Numbers of 3 year old, four year old, and five year old children in K0, K1, and K2 from the
“Analysis of Students by Race and Grade Report”, dated 5/16/02 • Numbers of children in full day (8-10 hour days) classrooms and numbers of children in part
day classrooms (including full school day and part school day), from the “Analysis of Students by Race and Grade Report”, dated 5/16/02.
• List of center based, Head Start, and Family Child Care Providers receiving slots funded by the MA Department of Education’s Community Partnerships programs, and the number of full day/full year, and part day/full year slots assigned to each provider, as of March, 2002 (not including the slots “frozen” in December-January, 2002).
Boston Redevelopment Authority • 2000 U.S. Census information. City of Boston Public Health Commission • Actual birth records for 1998, 1999, 2000, 2001 • Neighborhood boundaries for the nine neighborhood clusters
2
Massachusetts Office of Child Care Services • Basic and supportive contract slots for infants, toddlers, and preschool aged children for all
Boston centers, Head Start programs and family child care providers, as of February 20, 2003
• FY 02 list of licensed centers, Early Head Start, Head Start, and family child care providers • Wait list for subsidized slots, as of September 1, 2002. U.S. Bureau of the Census 2000 Census B. SUPPLY DATA Head Start Capacity – Full time Head Start included only those Head Start Slots that operated 8-10 hrs./day for the full year. These full time slots included the Head Start part day slot, with either Community Partnerships, voucher, or OCCS contract wrap around slots. All Head Start subsidies without the wrap around portion were listed as part day Head Start capacity. . Subsidies for Center Based Programs – The center-based full time subsidy numbers reported include CP, vouchers, and basic and supportive contracts through the Office of Child Care Services. The Office of Child Care Services allocates subsidies by the following age groups for both income eligible and supportive slots: Infant, Infant/Toddler, Preschool, and School-Age. Infant/Toddler contracts were distributed proportionately to the subsidies available specifically to infants and toddlers in each neighborhood. For the citywide subsidies, the infant/toddler contracts were distributed proportionately to the subsidies available specifically to infants and toddlers citywide. Subsidies for Family Child Care - The FCC full time subsidy numbers reported include CP, vouchers, and basic and supportive contracts through the Office of Child Care Services. The Office of Child Care Services reports Family Child Care subsidies by over two and under two years of age. To break down the FCC numbers by Infant, Toddler, and Preschool, all of the FCC over two and under two were added together and multiplied by the FCC utilization rate identified through Boston EQUIP. Subsidies for Head Start – Full time subsidies for Head Start included only those Head Start Slots that operated 8-10 hrs./day for the full year. These full time slots included the part day slot, with either Community Partnerships, voucher, or OCCS contract wrap around slots. All Head Start subsidies without the wrap around portion were listed as part day Head Start capacity. C. DEMAND FORMULA
General Demand Formula
Initially, information from the Boston Public Health Commission and from previous work by Associated Early Care and Education staff was used to determine the census tracts used to define each Boston Public Health Commission neighborhood within in the City of Boston;
3
Allston/Brighton, Charlestown/North End, Dorchester, East Boston, Hyde park/Roslindale/W. Roxbury, Mattapan, Roxbury/Jamaica Plain/Mission Hill, South Boston, and Downtown/Back Bay/Beacon Hill.
Next, using data from the 2000 Census, information on family arrangements and parent employment status was gathered for each neighborhood. For the general demand formula, after consultation with Viki Bok, Jenn Lutzy McDonald, John Lippitt, and Pat Xavier, we decided to use the Illinois Facilities Fund’s general demand formula contained in Planning for Chicago’s Children in the New Century, Early Childhood Care and Education Fact Book.
• 100 % of 2-parent families in which both parents are working • 100% of 1-parent families in which the parent is working • 0% of 2-parent families in which 1 parent is working; and • 45% of 1-parent families in which the parent is not working
To compile this information, the Census File called “Living Arrangements of Own
Children Under 18 Years in Families and Subfamilies by Employment Status of Parents” was used. The “universe” for this analysis was “Own Children Under 18 Years in Families and Subfamilies.” This file displays information based on ‘child” as the unit of analysis for children under 6 and for children between 6 and 17 years of age. The breakdown for family arrangement was as follows:
• Living with Two Parents: o Both Parents in Labor Force o Father Only in Labor Force o Mother Only in Labor Force o Neither Parent in Labor Force
• Living with One Parent: o Living with Father
In Labor Force Not In Labor Force
o Living with Mother In Labor Force Not in Labor Force
Using an excel worksheet, this data was aggregated from each census tract into the
neighborhood level for 2-parents both working, 2-parents one working, 1-parent working, and 1-parent not working.
Because the Census data included children age 5, and the supply data includes only children under the age of five, additional steps were taken to extract 5-year olds from this analysis. First, for each neighborhood, the proportion of children in each “family arrangement by work-status” category of interest was established. The formula’s used were:
• Number of children in 2-parent 2 working/ total number of children in 2-parent families • Number of children in 2-parent 1 working/ total number of children in 2-parent families

4
• Number of children in 1-parent working/ total number of children in 1-parent families; and
• Number of children in 1-parent not working/ total number of children in 1-parent families
Second, the number of five year-olds in each neighborhood was determined. This was done using data from the Census file “Poverty Status in 1999 of Related Children Under 18 years by Family Type by age by Race and Hispanic/Latino Origin” which gives the number of 5-year olds in poverty and the number of five-year olds not-in poverty, by family arrangement. These numbers were added to find the total number of children living in poverty for each neighborhood for two parent and single parent families.
Third, for each neighborhood the previously determined proportions of children in each family and employment category included in this analysis was utilized to determine how many 5-year olds should be included within each “family arrangement by work-status” category. This was done by applying to each neighborhood the proportion of children living in each “family arrangement by work-status” category of interest to the number of five year olds in the appropriate family type. For example, for the 2-parent 2 working “family arrangement by work-status” category, the number of five-year olds living in two-parent families was multiplied by the proportion of 2-parent children whose parents both work. This was done for each family arrangement by work-status category for each neighborhood to determine the number of five-year olds who should be taken out of the original demand formula equation.
Fourth, for each neighborhood the appropriate number of five-year olds were removed from the demand formula analyses such that the age ranged covered in the final demand formula includes children age 0-4.11 months old and is therefore comparable to the Supply side analyses.
Once this data was compiled, the “general demand formula” was applied to each neighborhood such that 100 % of children in families with 2-parents, both working, 0 % of children with 2-parents, one working, 100 % of children with 1-parent working, and 45 % of children with 1-parent who was not working were assumed to have a demand for early care and education. This data is presented for each neighborhood as well as for the City of Boston in Appendix A. 10. In addition, the overall number of children in the general demand formula was disaggregated into infants, toddlers and preschoolers. Calculations for each specific age group were based on percentages from the Supply side analyses that indicated that for each neighborhood 19.8% of the children were infants, 34.7% were toddlers, and 45.5% were preschoolers.
After an initial review of this data and comparison to census data on all children under 5,
we concluded that the above formula would underestimate demand by excluding those children not living within families or subfamilies. We decided to include these children in the demand formula and calculate their demand for child care by using an average demand calculated for the neighborhood in which they live.
The number of children living outside of families in each neighborhood was calculated using census data on all children under 5, as reported by the Boston Foundation Boston Indicators Report. The total number of children under 5 living with 2-parent and 1-parent

5
families in a neighborhood (calculated as explained above) was subtracted from the total number of children under 5 in that neighborhood. The remaining number was identified as those children who live with non-relatives.
The average demand for these children for each neighborhood was calculated by adding
up the total demand for all children living with 2-parent and 1-parent families in a neighborhood and dividing by the total number of children living with 2-parent and 1-parent families in that neighborhood:
demand for children in 2-parent 2 working + demand for children in 2-parent 1 working + demand for children in 1-parent 1 working + demand for children in 1-parent none working / total number of children living with 2-parent and 1-parent families
Those percentages then were applied to the children living with non-relatives. The subsequent numbers of children with non-relatives then were added to the demand numbers of children living with parents to arrive at the total demand numbers.
Head Start Demand Formula
As with the general demand formula, information from the Boston Public Health Commission and from the 2000 Census was used to complete this analysis. For the Head Start demand formula, it was determined that 100% of children eligible for Head Start, based on the federal Poverty Guidelines, would be included in the formula.
To compile this information, the Census File depicting “Poverty Status in 1999 of Related Children Under 18 years by Family Type by age by Race and Hispanic/Latino Origin” was used. The “universe” for this analysis was “Related Children Under 18 Years.” This file displayed information based on ‘child” as the unit of analysis for children under 5 years old, for 5 years olds, as well as for children from 6 to 17 years of age. The breakdown for family arrangement was as follows:
• In Married-Couple Families • In Male Householder, no Wife Families; and • In Female Householder, no Husband Families
Using an excel worksheet, this data was aggregated from each census tract into the neighborhood level for married couple families, male householder families, and female householder families that had family incomes below the 1999 Poverty Level.
Once this data was compiled, the “Head Start Demand Formula” was applied to each neighborhood such that 100 % of children under the age of 5 in any of these families living in poverty were eligible for, and therefore assumed to demand Head Start early care and education. In addition to compiling the data for overall Head Start demand, the number of infants, toddlers, and preschoolers for each neighborhood who were eligible for Head Start, and therefore included
6
in the Head Start demand formula, was determined. As with the general demand formula, this was done by applying birth percentages from the Supply side analyses such that the percentage of infants (19.8%), toddlers (34.7%), and preschoolers (45.5%) in each neighborhood were disaggregated.
It should be noted that the census file “Poverty Status in 1999 of Related Children Under 18 years by Family Type by age by race and Hispanic/latino Origin” was used since the unit of analysis was “children under 18” to allow the Head Start Demand Formula and the General Demand Formula to be comparable. However, it should be noted that the numbers provided in these two Census tables differ slightly because of the different “Universes” the census data originated from. Unfortunately, to be able to gather Census Data on family type, employment status, poverty status, and age of child; all needed for the General Demand and Head Start Demand formulas, these were the Tables that had to be used.
1
A. 2. Definitions Basic slots – Includes income eligible slots from the MA Office of Child Care Services (where family income levels when receiving the slot must be less than 50% of the SMI or less than 85% if the child has a diagnosed special need) and DTA slots from the Department of Transitional Assistance slots for families currently receiving Transitional Assistance for Families With Dependent Children (TAFDC) or who are transitioning off TAFDC. Births – Total births for each year come from the Public Health Commission. The Public Health Commission neighborhood birth data from the most recent year available (1999) was used to figure out the proportion of total births in each neighborhood. These proportions were used to determine neighborhood births as a percentage of the total citywide births in subsequent years. Boston EQUIP – was established in 1995 by Associated Early Care and Education, Inc. and a community based advisory of early care and education providers, advocates, and policymakers in an effort to collect data and provide research support to improve the quality of early care and education in Boston. It conducts biannual surveys of center based, family child care, after school, and school based providers in Boston. It has established five sets of benchmarks for quality improvement in the areas of accreditation, facilities, teacher education and training, teacher salaries, and parent engagement and reports regularly on progress towards meeting those benchmarks. Boston Public Schools Kindergarten Programs – The Boston Public Schools (BPS) operates full school day kindergarten programs (K2 programs) for all five year olds whose families request a slot. BPS also operates some kindergarten programs for three and four year olds with special needs and enough regular education children to make inclusive classrooms. These programs are called K1 (for four year olds) and K0 (for three year olds. BPS operates three early learning centers and three early education centers which service children from K0 through first grade. These programs offer full day (8-10 hours) services for the children who are enrolled. Centers – Early childhood programs that are licensed by the MA Office of Child Care Services. Child Care Capital Investment Fund (CCCIF) – is a part of the Community Economic Development Assistance Corporation. Its mission is to improve the quality and expand the availability of early care and education programs for low and moderate income families in Massachusetts through investment in early childhood center based and family child care and school age child care facilities. Clusters – are Boston early childhood neighborhood based planning groups. They are part of the 0-8 Coalition, and their boundaries were agreed upon by the 0-8 Coalition, using the Boston Public Health Commission’s definitions of neighborhood boundaries. Each cluster has a planning group comprised of parents, providers and community leaders. They receive Community Partnerships funds from the 0-8 Coalition to distribute for expansion of early childhood care and education services, support services for children and their families, training and professional development for early childhood staff, parent involvement, and neighborhood planning.
2
Community Partnerships Program – is overseen by the MA Department of Education Division of Early Learning Services. Funds are distributed to cities and towns across the Commonwealth to: expand affordable and accessible early childhood care and education services to preschool aged children of working families (priority given to families whose incomes are less than 100% of the statewide median income); to improve the quality of these services; to provide comprehensive services to children and their families; to strengthen planning and collaboration at the local level; and to conduct community outreach to families who are difficult to reach. Community Partnerships funds in Boston are overseen by the 0-8 Coalition, as the local Community Partnerships Council, and administered by the Boston Public Schools, as lead agent for the grant. Contract Slots – The MA Office of Child Care Services enters into contracts with licensed centers, Head Start providers, and family child care systems to provide services for a specified number of children whose family income is less than 50% of the statewide median income level. These slots stay with the programs and become vacant when a child leaves the program. The provider can fill the slot with another eligible child. Family child care providers – are licensed by the MA Office of Child Care Services. Individual providers may belong to a family child care system, which provides administrative support, training, and quality control, or they may be independent. Full day slots – These slots are available 8-10 hours a day, on a full year basis. The only slots that have been included in this group that are full day but not full year are the Boston Public School slots in the early learning centers and early education centers (324). All voucher slots have been included in this category, even though Child Care Choices of Boston lists them as at least 30 hours a week, because we assume that almost all children are served for significantly more hours than the minimum every week. Full Time Adjusted Capacity/Births– For several years, the Zero to Eight Coalition has worked with Boston EQUIP to adjust neighborhood capacity numbers to reflect children who are served from outside the neighborhood (as reported in the EQUIP surveys). This adjustment is called the “adjusted capacity” for this study. The number of births in a given age group, was divided by the adjusted capacity to provide the % of children to available capacity. Full Time Capacity – Full time capacity is defined as full day at 8-10 hours a day, and full year at approximately 260 days/year, except in the case of Boston Public School slots, which are full day for the school year. The capacity numbers come from BPS, MA Office of Child Care Services, and ABCD Head Start. The combined infant/toddler slots were allocated proportionately to infants and toddlers. All slots are licensed, except the BPS slots, which are license exempt. It should be noted that regular 30 hrs/week for the school year Head Start slots are not considered full time for the purposes of this study. Head Start slots were considered to be full time when slots were available for the full day/full year period. Full Time Subsidies – Full time subsidies are those that are available for 8-10 hours/day for about 260 days/year. This category includes full day/full year Head Start slots that are funded
3
with a combination of federal funds, vouchers, contracts, or Community Partnerships funds. 98% of vouchers reported by CCCB were estimated to be full time. It also includes all basic and supportive contract slots from OCCS, Community Partnerships slots, and BPS full day/school year slots. Full Time Subsidies/Births – This percentage ratio is provided to describe how many subsidized slots are available for the number of children in a given age group. Head Start – is a federal early childhood education and development program which was started in 1965. Children between 3-5 years old whose families meet the federal poverty guidelines are eligible for the program. Early Head Start serves low-income pregnant women and their infants and toddlers from birth to age 3. While Head Start is primarily funded by the federal government, the Boston Head Start agencies have received Community Partnerships funds from the 0-8 Coalition and voucher and contract funds from the MA Office of Child Care Services to expand some of their Head Start slots to full day, full year slots. Infants – Children 0- 14 months of age or children who were born in 2001. Informal Slots – Informal slots were not included in the capacity figures, because they represent unlicensed and largely unregulated care. Part day slots – These slots are available for less than 8-10 hours/day on a full year or on a school year basis. All regular 30 hours/week Head Start slots and regular school day public school kindergarten slots fall into this category, as well as other part time services. Part Time Capacity – Part time capacity is anything less than 8 hours a day. The numbers come from the same sources as listed under full time capacity. Regular Head Start slots and BPS regular school day slots are included in this category. 2% of vouchers reported by CCCB were estimated to be part day. Preschool – Children aged 33-59 months or children who were born in 1998 and 1999. Population Characteristics – 2000 data is from the U.S. Census, 2000. Supportive slots – are designated by contracts between the MA Office of Child Care Services and centers, Head Start programs and family child care systems for children who are in a protective service status. Toddlers – are children from 15-32 months or children who were born in 1990. Vouchers – are subsidies that go with the eligible child to any early childhood provider the parents choose, as long as the provider is licensed by the MA Office of Child Care Services, has a current Voucher Agreement with Child Care Choices of Boston (the resource and referral agency for Boston), and accepts the vouchers. Families with incomes less than 50% of the statewide median income level (or 85% or less if the child has a diagnosed special need) are eligible to receive vouchers.
4
Wait lists – Many providers keep wait lists of families who would like to enroll their children, but the program has no vacant slots or no vacant subsidized slots. Child Care Choices of Boston (CCCB) maintains a wait list of families who have contact them and who meet the income eligibility requirements for a voucher. In this report, we report on the CCCB waitlist, as of June 11, 2002. We have also included The MA Office of Child Care Services waitlist which was published on September 1, 2002. It includes an unduplicated count of the CCCB list of families already determined eligible for a voucher and families whose names have been submitted by providers who have OCCS contracts. The CCCB wait list is as of June 11, 2002
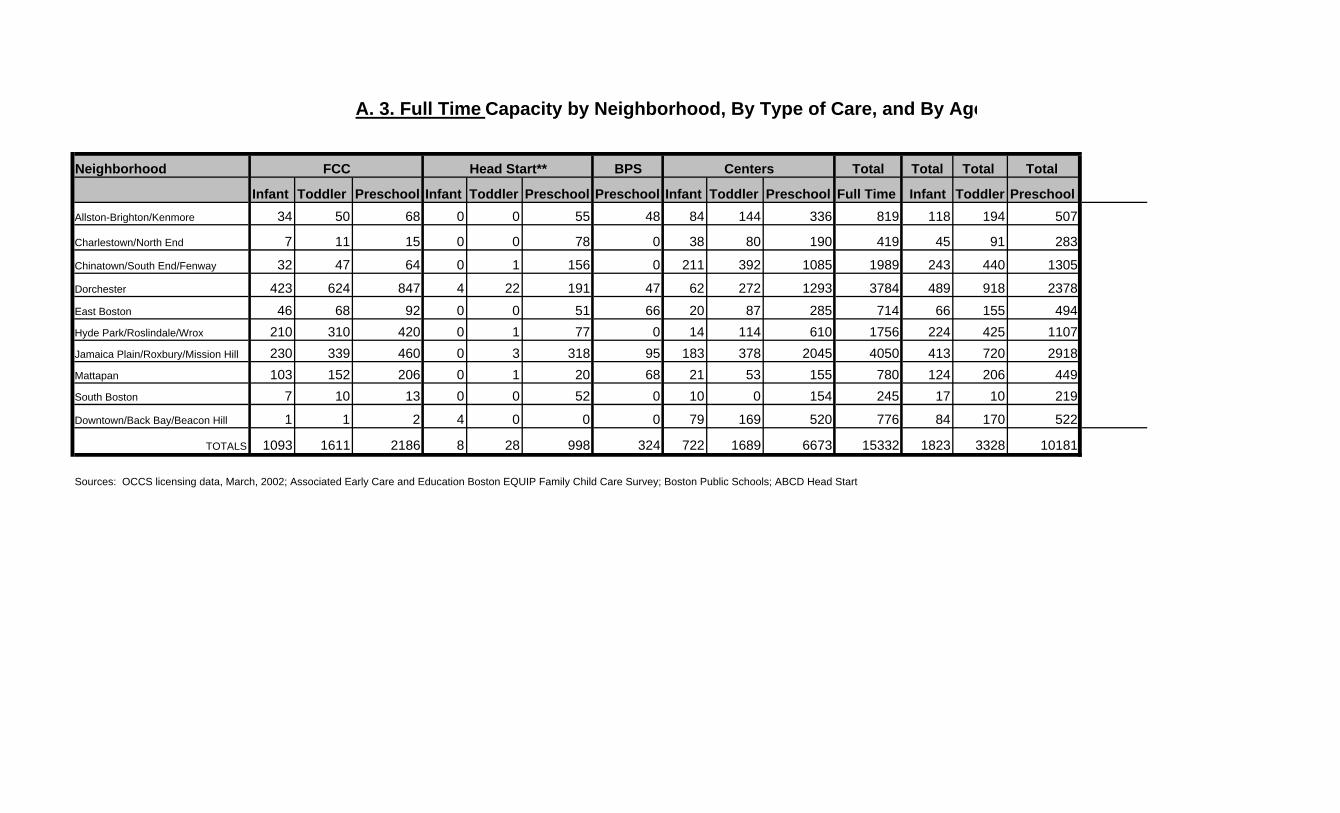
A. 3. Full Time Capacity by Neighborhood, By Type of Care, and By Age
Neighborhood BPS Total Total Total Total
Infant Toddler Preschool Infant Toddler Preschool Preschool Infant Toddler Preschool Full Time Infant Toddler PreschoolAllston-Brighton/Kenmore 34 50 68 0 0 55 48 84 144 336 819 118 194 507
Charlestown/North End 7 11 15 0 0 78 0 38 80 190 419 45 91 283
Chinatown/South End/Fenway 32 47 64 0 1 156 0 211 392 1085 1989 243 440 1305
Dorchester 423 624 847 4 22 191 47 62 272 1293 3784 489 918 2378
East Boston 46 68 92 0 0 51 66 20 87 285 714 66 155 494Hyde Park/Roslindale/Wrox 210 310 420 0 1 77 0 14 114 610 1756 224 425 1107Jamaica Plain/Roxbury/Mission Hill 230 339 460 0 3 318 95 183 378 2045 4050 413 720 2918Mattapan 103 152 206 0 1 20 68 21 53 155 780 124 206 449South Boston 7 10 13 0 0 52 0 10 0 154 245 17 10 219
Downtown/Back Bay/Beacon Hill 1 1 2 4 0 0 0 79 169 520 776 84 170 522
TOTALS 1093 1611 2186 8 28 998 324 722 1689 6673 15332 1823 3328 10181
Sources: OCCS licensing data, March, 2002; Associated Early Care and Education Boston EQUIP Family Child Care Survey; Boston Public Schools; ABCD Head Start
FCC Head Start** Centers
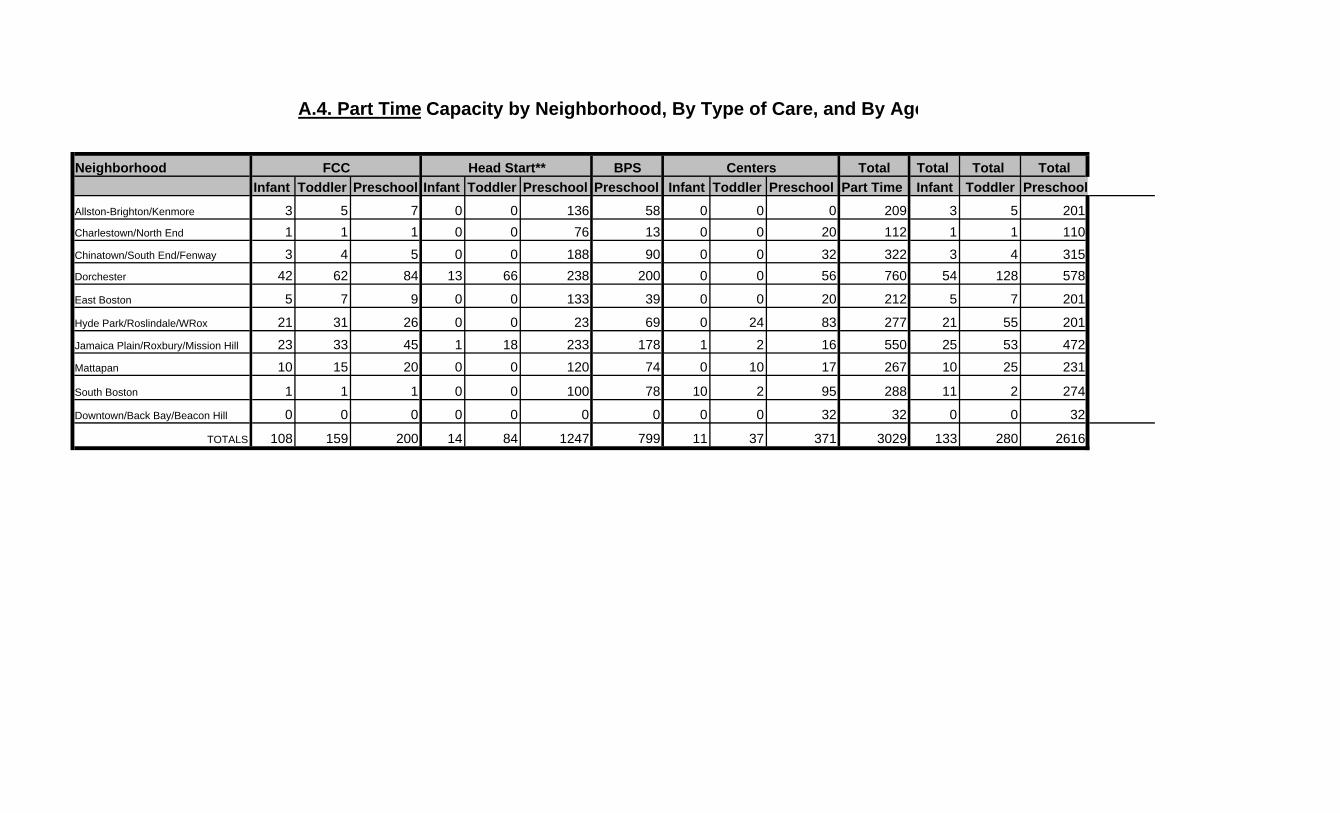
A.4. Part Time Capacity by Neighborhood, By Type of Care, and By Age
Neighborhood BPS Total Total Total TotalInfant Toddler Preschool Infant Toddler Preschool Preschool Infant Toddler Preschool Part Time Infant Toddler Preschool
Allston-Brighton/Kenmore 3 5 7 0 0 136 58 0 0 0 209 3 5 201Charlestown/North End 1 1 1 0 0 76 13 0 0 20 112 1 1 110
Chinatown/South End/Fenway 3 4 5 0 0 188 90 0 0 32 322 3 4 315Dorchester 42 62 84 13 66 238 200 0 0 56 760 54 128 578
East Boston 5 7 9 0 0 133 39 0 0 20 212 5 7 201
Hyde Park/Roslindale/WRox 21 31 26 0 0 23 69 0 24 83 277 21 55 201
Jamaica Plain/Roxbury/Mission Hill 23 33 45 1 18 233 178 1 2 16 550 25 53 472
Mattapan 10 15 20 0 0 120 74 0 10 17 267 10 25 231
South Boston 1 1 1 0 0 100 78 10 2 95 288 11 2 274
Downtown/Back Bay/Beacon Hill 0 0 0 0 0 0 0 0 0 32 32 0 0 32
TOTALS 108 159 200 14 84 1247 799 11 37 371 3029 133 280 2616
FCC Head Start** Centers
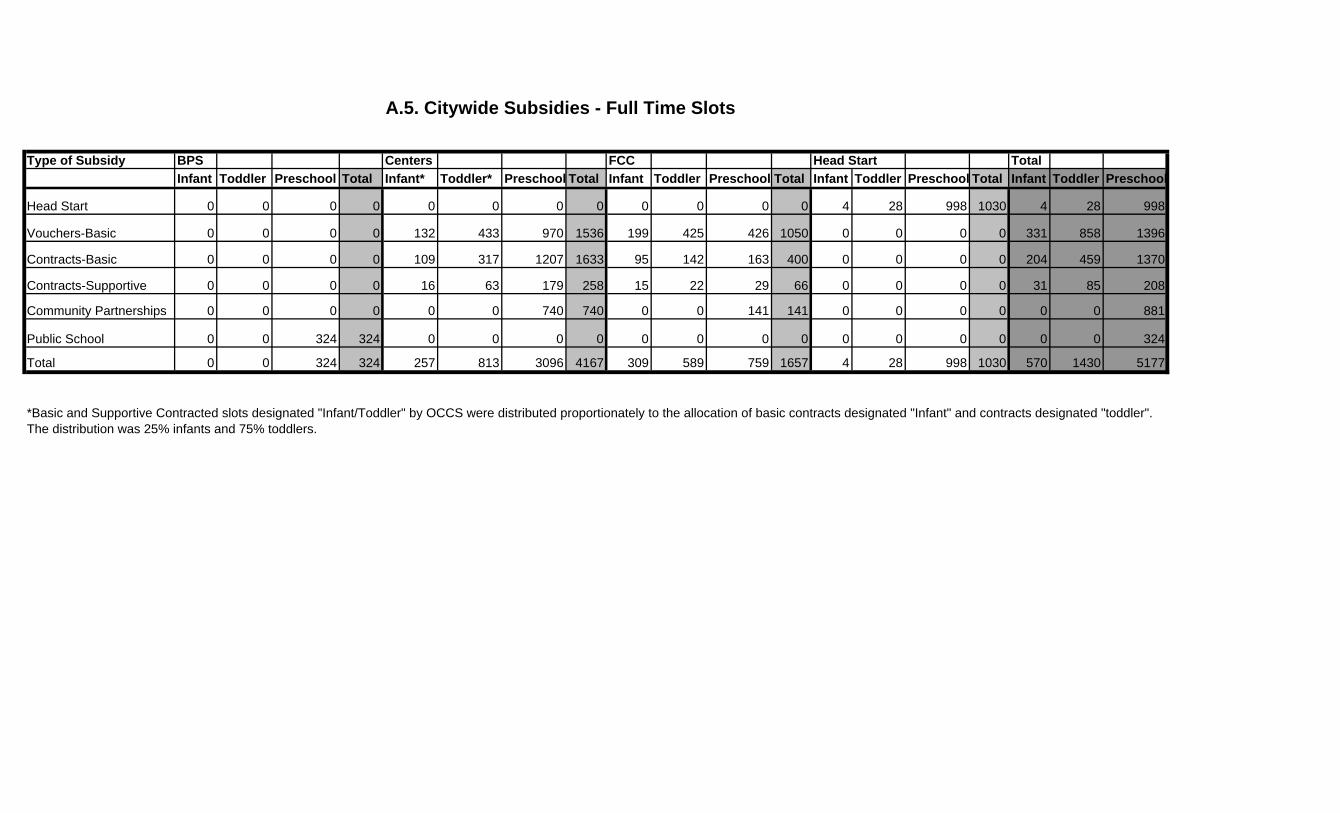
A.5. Citywide Subsidies - Full Time Slots
Type of Subsidy BPS Centers FCC Head Start TotalInfant Toddler Preschool Total Infant* Toddler* Preschool Total Infant Toddler Preschool Total Infant Toddler Preschool Total Infant Toddler Preschool
Head Start 0 0 0 0 0 0 0 0 0 0 0 0 4 28 998 1030 4 28 998
Vouchers-Basic 0 0 0 0 132 433 970 1536 199 425 426 1050 0 0 0 0 331 858 1396
Contracts-Basic 0 0 0 0 109 317 1207 1633 95 142 163 400 0 0 0 0 204 459 1370
Contracts-Supportive 0 0 0 0 16 63 179 258 15 22 29 66 0 0 0 0 31 85 208
Community Partnerships 0 0 0 0 0 0 740 740 0 0 141 141 0 0 0 0 0 0 881
Public School 0 0 324 324 0 0 0 0 0 0 0 0 0 0 0 0 0 0 324
Total 0 0 324 324 257 813 3096 4167 309 589 759 1657 4 28 998 1030 570 1430 5177
*Basic and Supportive Contracted slots designated "Infant/Toddler" by OCCS were distributed proportionately to the allocation of basic contracts designated "Infant" and contracts designated "toddler". The distribution was 25% infants and 75% toddlers.
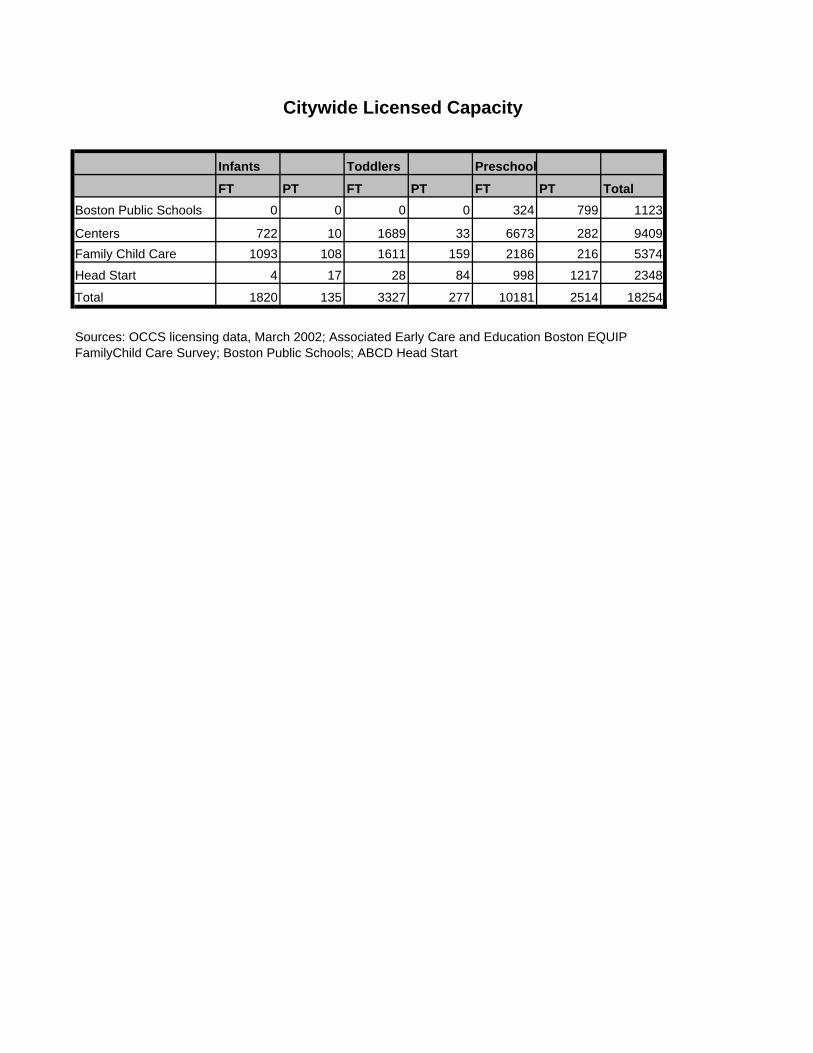
Citywide Licensed Capacity
Infants Toddlers Preschool
FT PT FT PT FT PT TotalBoston Public Schools 0 0 0 0 324 799 1123
Centers 722 10 1689 33 6673 282 9409Family Child Care 1093 108 1611 159 2186 216 5374
Head Start 4 17 28 84 998 1217 2348
Total 1820 135 3327 277 10181 2514 18254
Sources: OCCS licensing data, March 2002; Associated Early Care and Education Boston EQUIPFamilyChild Care Survey; Boston Public Schools; ABCD Head Start
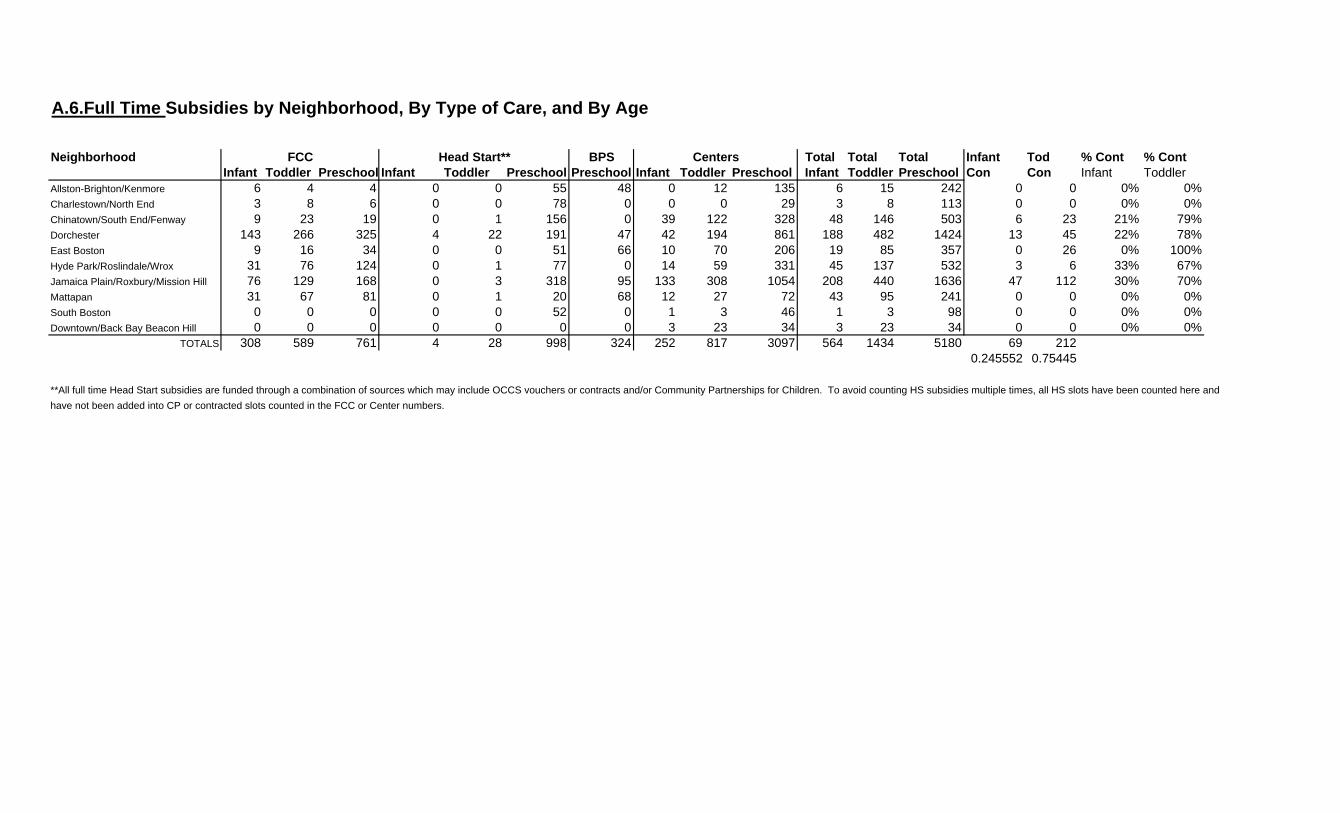
A.6.Full Time Subsidies by Neighborhood, By Type of Care, and By Age
Neighborhood BPS Total Total Total Infant Tod % Cont % ContInfant Toddler Preschool Infant Toddler Preschool Preschool Infant Toddler Preschool Infant Toddler Preschool Con Con Infant Toddler
Allston-Brighton/Kenmore 6 4 4 0 0 55 48 0 12 135 6 15 242 0 0 0% 0%Charlestown/North End 3 8 6 0 0 78 0 0 0 29 3 8 113 0 0 0% 0%Chinatown/South End/Fenway 9 23 19 0 1 156 0 39 122 328 48 146 503 6 23 21% 79%Dorchester 143 266 325 4 22 191 47 42 194 861 188 482 1424 13 45 22% 78%East Boston 9 16 34 0 0 51 66 10 70 206 19 85 357 0 26 0% 100%Hyde Park/Roslindale/Wrox 31 76 124 0 1 77 0 14 59 331 45 137 532 3 6 33% 67%Jamaica Plain/Roxbury/Mission Hill 76 129 168 0 3 318 95 133 308 1054 208 440 1636 47 112 30% 70%Mattapan 31 67 81 0 1 20 68 12 27 72 43 95 241 0 0 0% 0%South Boston 0 0 0 0 0 52 0 1 3 46 1 3 98 0 0 0% 0%Downtown/Back Bay Beacon Hill 0 0 0 0 0 0 0 3 23 34 3 23 34 0 0 0% 0%
TOTALS 308 589 761 4 28 998 324 252 817 3097 564 1434 5180 69 2120.245552 0.75445
**All full time Head Start subsidies are funded through a combination of sources which may include OCCS vouchers or contracts and/or Community Partnerships for Children. To avoid counting HS subsidies multiple times, all HS slots have been counted here and have not been added into CP or contracted slots counted in the FCC or Center numbers.
FCC Head Start** Centers
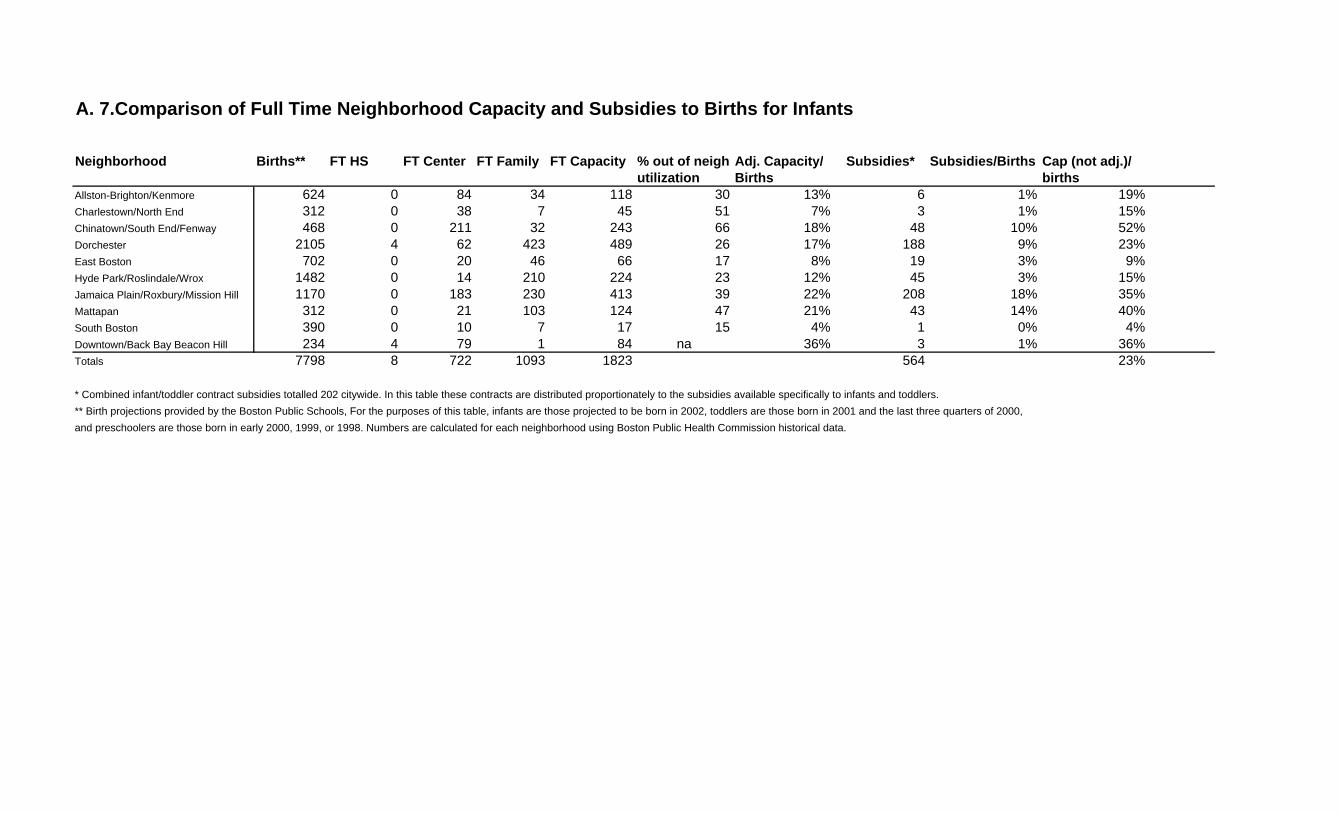
A. 7.Comparison of Full Time Neighborhood Capacity and Subsidies to Births for Infants
Neighborhood Births** FT HS FT Center FT Family FT Capacity % out of neigh Adj. Capacity/ Subsidies* Subsidies/Births Cap (not adj.)/utilization Births births
Allston-Brighton/Kenmore 624 0 84 34 118 30 13% 6 1% 19%Charlestown/North End 312 0 38 7 45 51 7% 3 1% 15%Chinatown/South End/Fenway 468 0 211 32 243 66 18% 48 10% 52%Dorchester 2105 4 62 423 489 26 17% 188 9% 23%East Boston 702 0 20 46 66 17 8% 19 3% 9%Hyde Park/Roslindale/Wrox 1482 0 14 210 224 23 12% 45 3% 15%Jamaica Plain/Roxbury/Mission Hill 1170 0 183 230 413 39 22% 208 18% 35%Mattapan 312 0 21 103 124 47 21% 43 14% 40%South Boston 390 0 10 7 17 15 4% 1 0% 4%Downtown/Back Bay Beacon Hill 234 4 79 1 84 na 36% 3 1% 36%Totals 7798 8 722 1093 1823 564 23%
* Combined infant/toddler contract subsidies totalled 202 citywide. In this table these contracts are distributed proportionately to the subsidies available specifically to infants and toddlers.** Birth projections provided by the Boston Public Schools, For the purposes of this table, infants are those projected to be born in 2002, toddlers are those born in 2001 and the last three quarters of 2000, and preschoolers are those born in early 2000, 1999, or 1998. Numbers are calculated for each neighborhood using Boston Public Health Commission historical data.
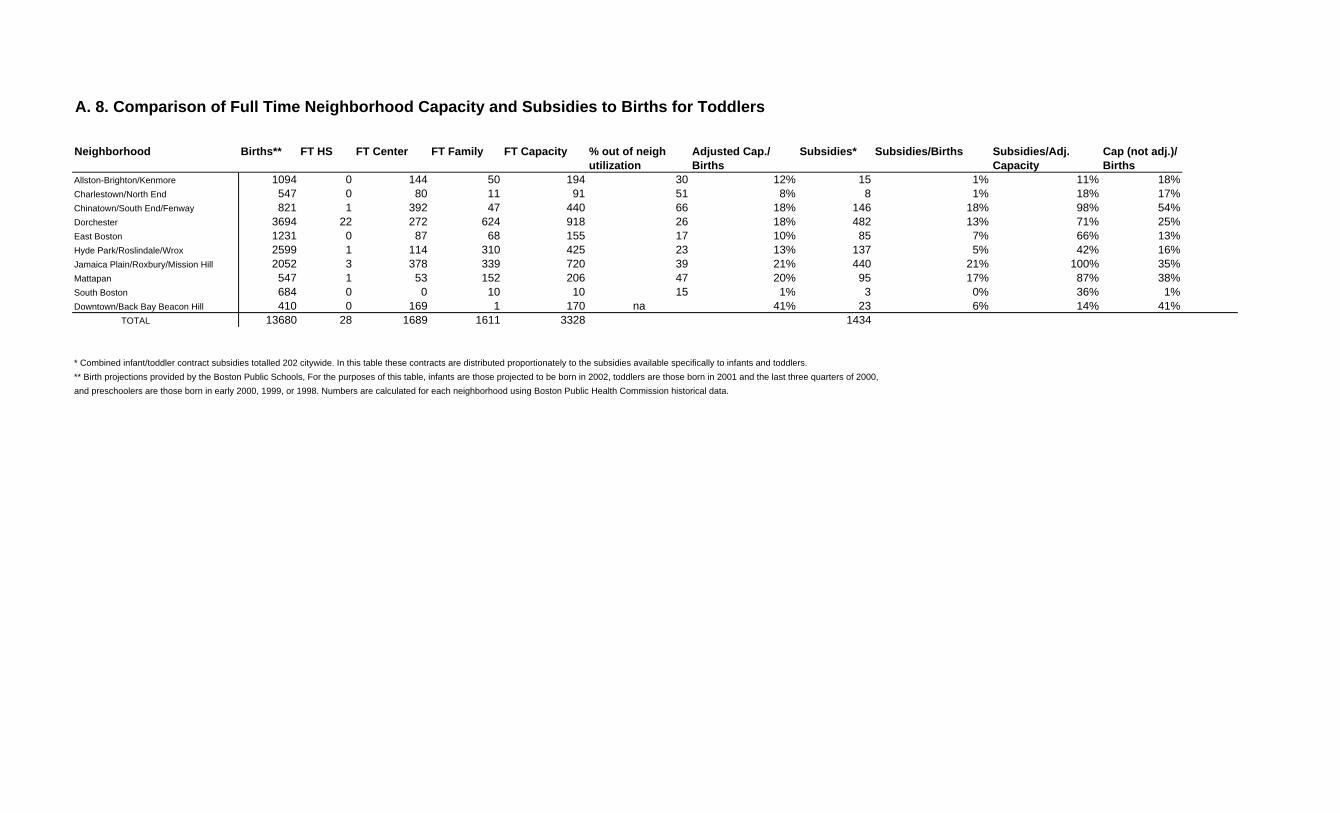
A. 8. Comparison of Full Time Neighborhood Capacity and Subsidies to Births for Toddlers
Neighborhood Births** FT HS FT Center FT Family FT Capacity % out of neigh Adjusted Cap./ Subsidies* Subsidies/Births Subsidies/Adj. Cap (not adj.)/utilization Births Capacity Births
Allston-Brighton/Kenmore 1094 0 144 50 194 30 12% 15 1% 11% 18%Charlestown/North End 547 0 80 11 91 51 8% 8 1% 18% 17%Chinatown/South End/Fenway 821 1 392 47 440 66 18% 146 18% 98% 54%Dorchester 3694 22 272 624 918 26 18% 482 13% 71% 25%East Boston 1231 0 87 68 155 17 10% 85 7% 66% 13%Hyde Park/Roslindale/Wrox 2599 1 114 310 425 23 13% 137 5% 42% 16%Jamaica Plain/Roxbury/Mission Hill 2052 3 378 339 720 39 21% 440 21% 100% 35%Mattapan 547 1 53 152 206 47 20% 95 17% 87% 38%South Boston 684 0 0 10 10 15 1% 3 0% 36% 1%Downtown/Back Bay Beacon Hill 410 0 169 1 170 na 41% 23 6% 14% 41% TOTAL 13680 28 1689 1611 3328 1434
* Combined infant/toddler contract subsidies totalled 202 citywide. In this table these contracts are distributed proportionately to the subsidies available specifically to infants and toddlers.** Birth projections provided by the Boston Public Schools, For the purposes of this table, infants are those projected to be born in 2002, toddlers are those born in 2001 and the last three quarters of 2000, and preschoolers are those born in early 2000, 1999, or 1998. Numbers are calculated for each neighborhood using Boston Public Health Commission historical data.
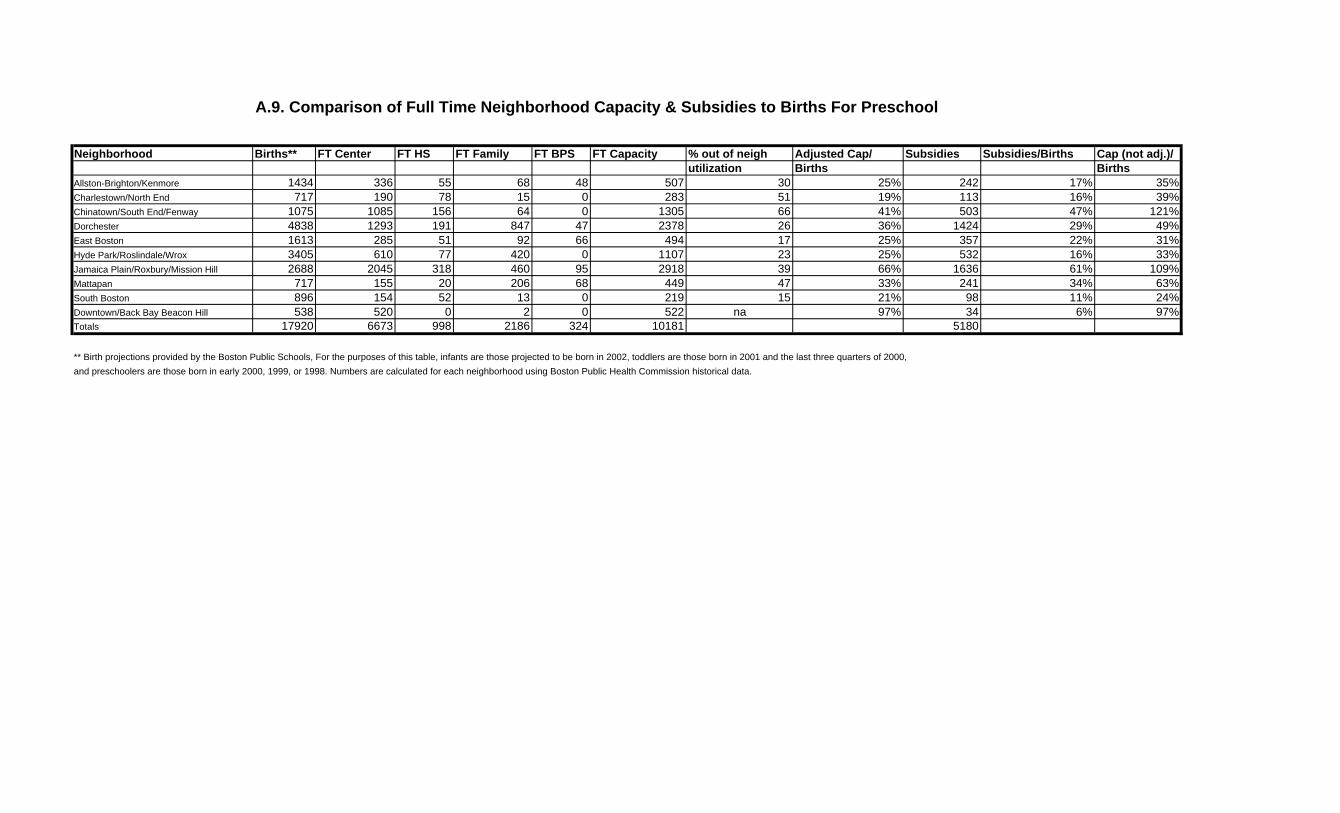
A.9. Comparison of Full Time Neighborhood Capacity & Subsidies to Births For Preschool
Neighborhood Births** FT Center FT HS FT Family FT BPS FT Capacity % out of neigh Adjusted Cap/ Subsidies Subsidies/Births Cap (not adj.)/utilization Births Births
Allston-Brighton/Kenmore 1434 336 55 68 48 507 30 25% 242 17% 35%Charlestown/North End 717 190 78 15 0 283 51 19% 113 16% 39%Chinatown/South End/Fenway 1075 1085 156 64 0 1305 66 41% 503 47% 121%Dorchester 4838 1293 191 847 47 2378 26 36% 1424 29% 49%East Boston 1613 285 51 92 66 494 17 25% 357 22% 31%Hyde Park/Roslindale/Wrox 3405 610 77 420 0 1107 23 25% 532 16% 33%Jamaica Plain/Roxbury/Mission Hill 2688 2045 318 460 95 2918 39 66% 1636 61% 109%Mattapan 717 155 20 206 68 449 47 33% 241 34% 63%South Boston 896 154 52 13 0 219 15 21% 98 11% 24%Downtown/Back Bay Beacon Hill 538 520 0 2 0 522 na 97% 34 6% 97%Totals 17920 6673 998 2186 324 10181 5180
** Birth projections provided by the Boston Public Schools, For the purposes of this table, infants are those projected to be born in 2002, toddlers are those born in 2001 and the last three quarters of 2000, and preschoolers are those born in early 2000, 1999, or 1998. Numbers are calculated for each neighborhood using Boston Public Health Commission historical data.
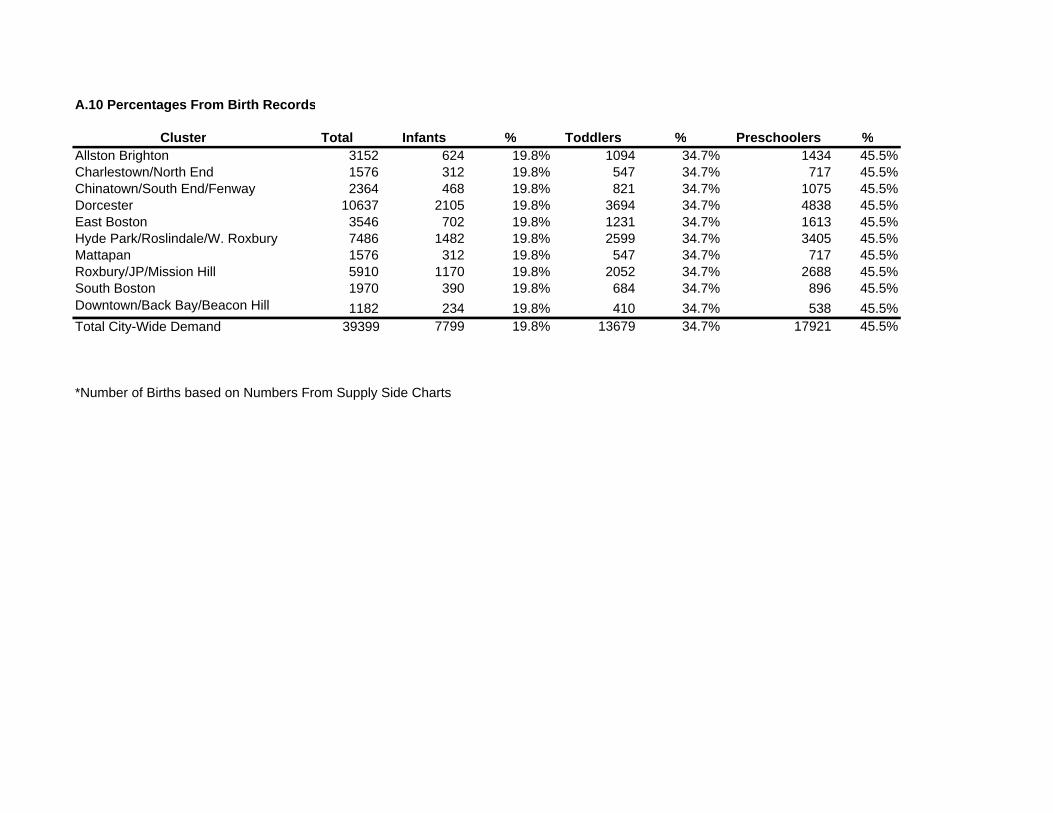
A.10 Percentages From Birth Records
Cluster Total Infants % Toddlers % Preschoolers %Allston Brighton 3152 624 19.8% 1094 34.7% 1434 45.5%Charlestown/North End 1576 312 19.8% 547 34.7% 717 45.5%Chinatown/South End/Fenway 2364 468 19.8% 821 34.7% 1075 45.5%Dorcester 10637 2105 19.8% 3694 34.7% 4838 45.5%East Boston 3546 702 19.8% 1231 34.7% 1613 45.5%Hyde Park/Roslindale/W. Roxbury 7486 1482 19.8% 2599 34.7% 3405 45.5%Mattapan 1576 312 19.8% 547 34.7% 717 45.5%Roxbury/JP/Mission Hill 5910 1170 19.8% 2052 34.7% 2688 45.5%South Boston 1970 390 19.8% 684 34.7% 896 45.5%Downtown/Back Bay/Beacon Hill 1182 234 19.8% 410 34.7% 538 45.5%Total City-Wide Demand 39399 7799 19.8% 13679 34.7% 17921 45.5%
*Number of Births based on Numbers From Supply Side Charts
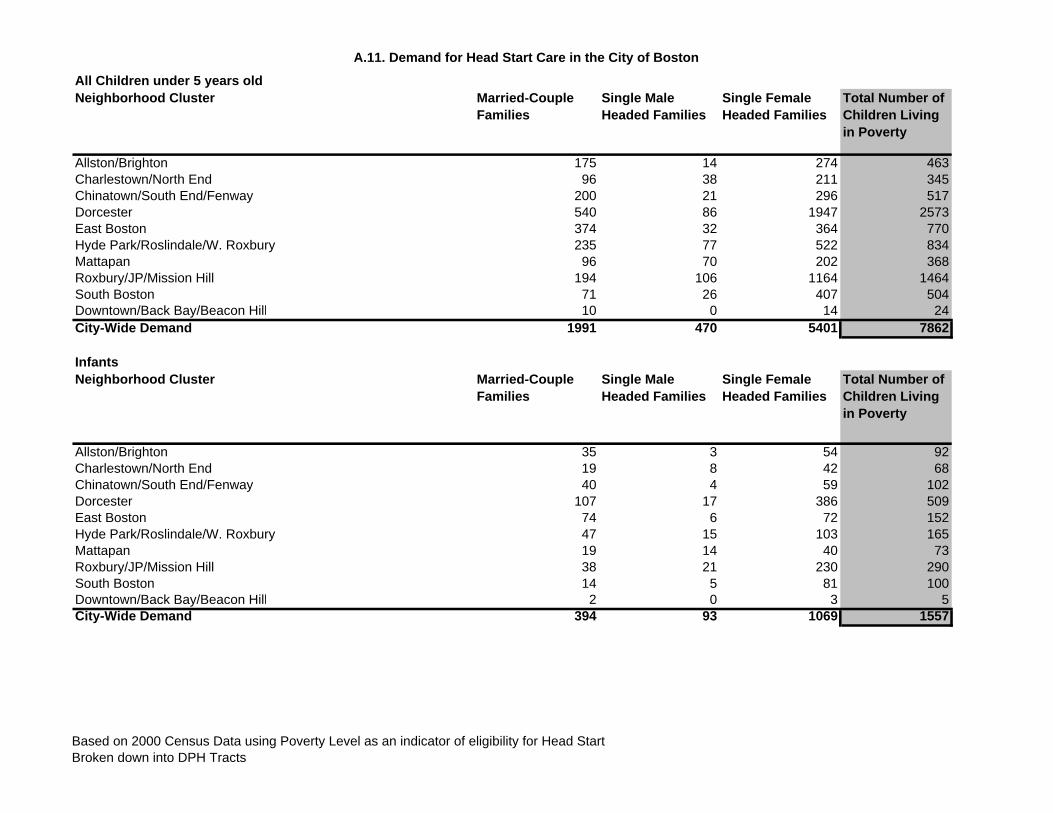
A.11. Demand for Head Start Care in the City of Boston
All Children under 5 years oldNeighborhood Cluster Married-Couple
FamiliesSingle Male Headed Families
Single Female Headed Families
Total Number of Children Living in Poverty
Allston/Brighton 175 14 274 463Charlestown/North End 96 38 211 345Chinatown/South End/Fenway 200 21 296 517Dorcester 540 86 1947 2573East Boston 374 32 364 770Hyde Park/Roslindale/W. Roxbury 235 77 522 834Mattapan 96 70 202 368Roxbury/JP/Mission Hill 194 106 1164 1464South Boston 71 26 407 504Downtown/Back Bay/Beacon Hill 10 0 14 24City-Wide Demand 1991 470 5401 7862
InfantsNeighborhood Cluster Married-Couple
FamiliesSingle Male Headed Families
Single Female Headed Families
Total Number of Children Living in Poverty
Allston/Brighton 35 3 54 92Charlestown/North End 19 8 42 68Chinatown/South End/Fenway 40 4 59 102Dorcester 107 17 386 509East Boston 74 6 72 152Hyde Park/Roslindale/W. Roxbury 47 15 103 165Mattapan 19 14 40 73Roxbury/JP/Mission Hill 38 21 230 290South Boston 14 5 81 100Downtown/Back Bay/Beacon Hill 2 0 3 5City-Wide Demand 394 93 1069 1557
Based on 2000 Census Data using Poverty Level as an indicator of eligibility for Head Start Broken down into DPH Tracts
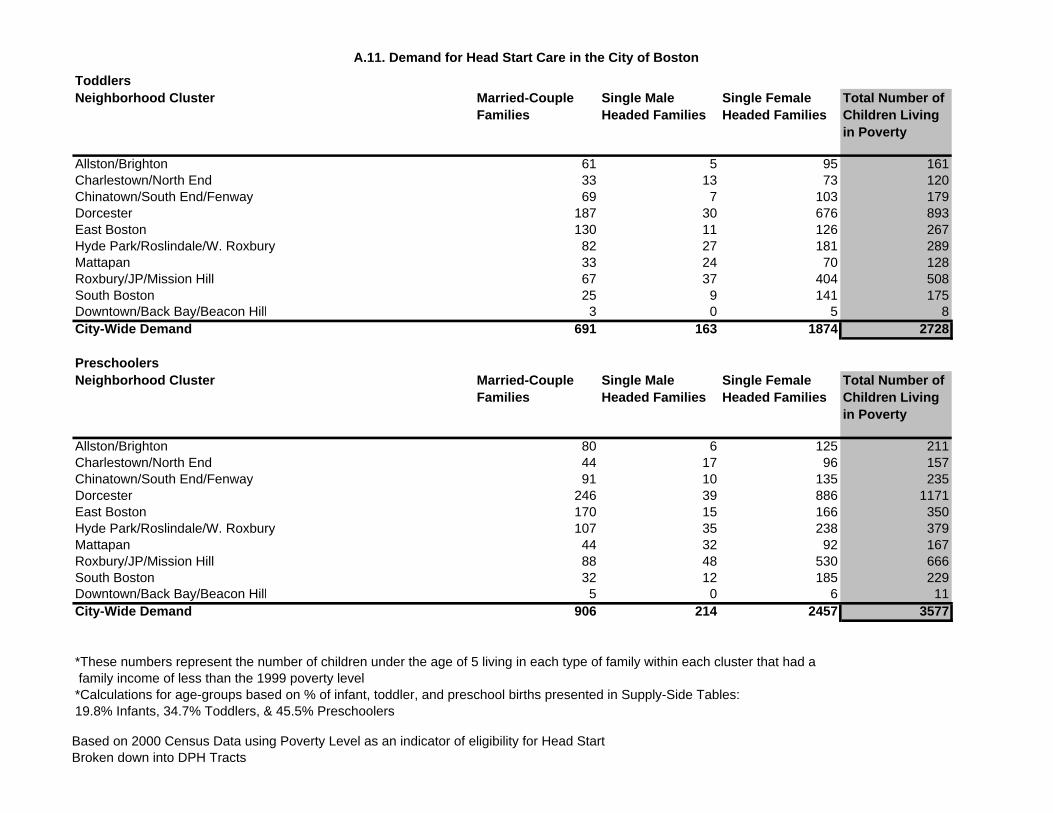
A.11. Demand for Head Start Care in the City of Boston
ToddlersNeighborhood Cluster Married-Couple
FamiliesSingle Male Headed Families
Single Female Headed Families
Total Number of Children Living in Poverty
Allston/Brighton 61 5 95 161Charlestown/North End 33 13 73 120Chinatown/South End/Fenway 69 7 103 179Dorcester 187 30 676 893East Boston 130 11 126 267Hyde Park/Roslindale/W. Roxbury 82 27 181 289Mattapan 33 24 70 128Roxbury/JP/Mission Hill 67 37 404 508South Boston 25 9 141 175Downtown/Back Bay/Beacon Hill 3 0 5 8City-Wide Demand 691 163 1874 2728
PreschoolersNeighborhood Cluster Married-Couple
FamiliesSingle Male Headed Families
Single Female Headed Families
Total Number of Children Living in Poverty
Allston/Brighton 80 6 125 211Charlestown/North End 44 17 96 157Chinatown/South End/Fenway 91 10 135 235Dorcester 246 39 886 1171East Boston 170 15 166 350Hyde Park/Roslindale/W. Roxbury 107 35 238 379Mattapan 44 32 92 167Roxbury/JP/Mission Hill 88 48 530 666South Boston 32 12 185 229Downtown/Back Bay/Beacon Hill 5 0 6 11City-Wide Demand 906 214 2457 3577
*These numbers represent the number of children under the age of 5 living in each type of family within each cluster that had a family income of less than the 1999 poverty level*Calculations for age-groups based on % of infant, toddler, and preschool births presented in Supply-Side Tables: 19.8% Infants, 34.7% Toddlers, & 45.5% Preschoolers
Based on 2000 Census Data using Poverty Level as an indicator of eligibility for Head Start Broken down into DPH Tracts
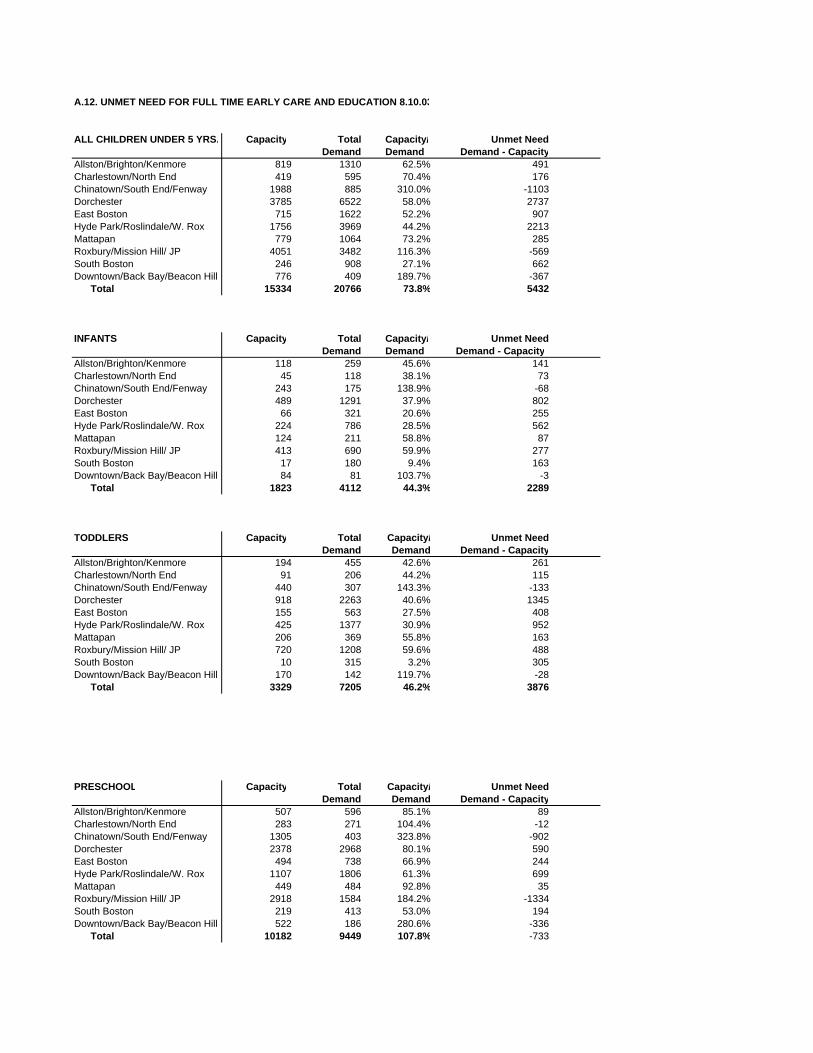
A.12. UNMET NEED FOR FULL TIME EARLY CARE AND EDUCATION 8.10.03
ALL CHILDREN UNDER 5 YRS. Capacity Total Capacity/ Unmet NeedDemand Demand Demand - Capacity
Allston/Brighton/Kenmore 819 1310 62.5% 491Charlestown/North End 419 595 70.4% 176Chinatown/South End/Fenway 1988 885 310.0% -1103Dorchester 3785 6522 58.0% 2737East Boston 715 1622 52.2% 907Hyde Park/Roslindale/W. Rox 1756 3969 44.2% 2213Mattapan 779 1064 73.2% 285Roxbury/Mission Hill/ JP 4051 3482 116.3% -569South Boston 246 908 27.1% 662Downtown/Back Bay/Beacon Hill 776 409 189.7% -367 Total 15334 20766 73.8% 5432
INFANTS Capacity Total Capacity/ Unmet NeedDemand Demand Demand - Capacity
Allston/Brighton/Kenmore 118 259 45.6% 141Charlestown/North End 45 118 38.1% 73Chinatown/South End/Fenway 243 175 138.9% -68Dorchester 489 1291 37.9% 802East Boston 66 321 20.6% 255Hyde Park/Roslindale/W. Rox 224 786 28.5% 562Mattapan 124 211 58.8% 87Roxbury/Mission Hill/ JP 413 690 59.9% 277South Boston 17 180 9.4% 163Downtown/Back Bay/Beacon Hill 84 81 103.7% -3 Total 1823 4112 44.3% 2289
TODDLERS Capacity Total Capacity/ Unmet NeedDemand Demand Demand - Capacity
Allston/Brighton/Kenmore 194 455 42.6% 261Charlestown/North End 91 206 44.2% 115Chinatown/South End/Fenway 440 307 143.3% -133Dorchester 918 2263 40.6% 1345East Boston 155 563 27.5% 408Hyde Park/Roslindale/W. Rox 425 1377 30.9% 952Mattapan 206 369 55.8% 163Roxbury/Mission Hill/ JP 720 1208 59.6% 488South Boston 10 315 3.2% 305Downtown/Back Bay/Beacon Hill 170 142 119.7% -28 Total 3329 7205 46.2% 3876
PRESCHOOL Capacity Total Capacity/ Unmet NeedDemand Demand Demand - Capacity
Allston/Brighton/Kenmore 507 596 85.1% 89Charlestown/North End 283 271 104.4% -12Chinatown/South End/Fenway 1305 403 323.8% -902Dorchester 2378 2968 80.1% 590East Boston 494 738 66.9% 244Hyde Park/Roslindale/W. Rox 1107 1806 61.3% 699Mattapan 449 484 92.8% 35Roxbury/Mission Hill/ JP 2918 1584 184.2% -1334South Boston 219 413 53.0% 194Downtown/Back Bay/Beacon Hill 522 186 280.6% -336 Total 10182 9449 107.8% -733
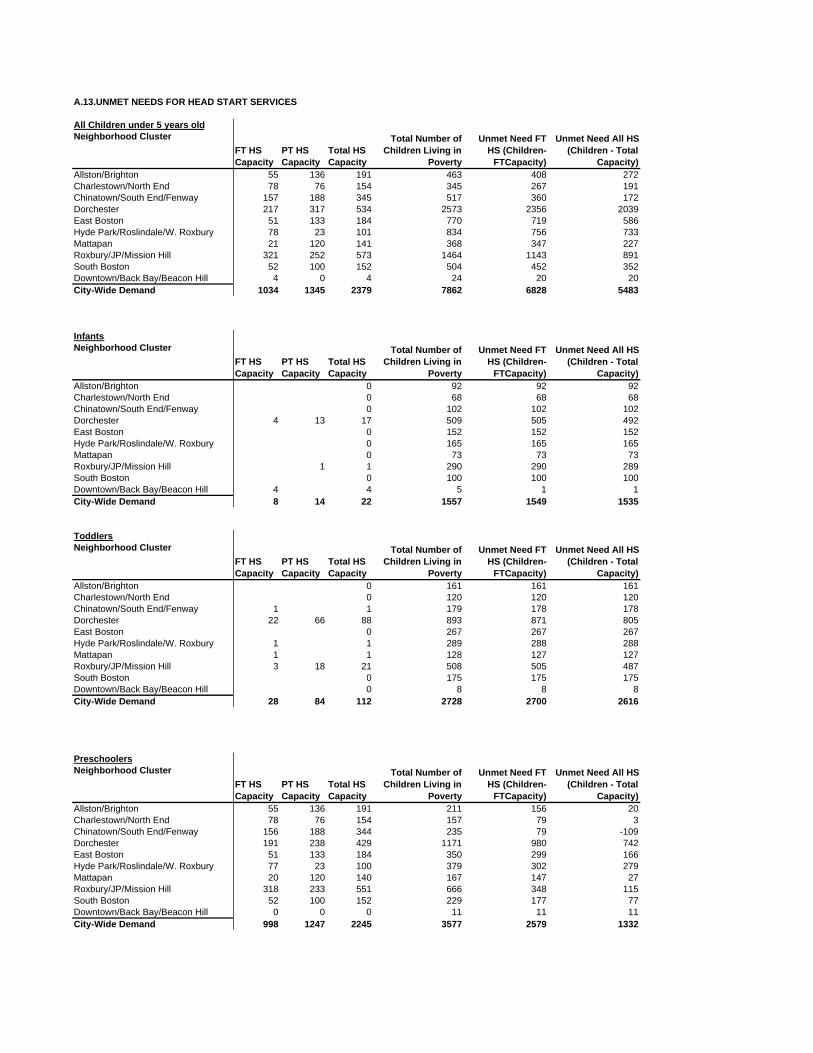
A.13.UNMET NEEDS FOR HEAD START SERVICES
All Children under 5 years oldNeighborhood Cluster
FT HS Capacity
PT HS Capacity
Total HS Capacity
Total Number of Children Living in
Poverty
Unmet Need FT HS (Children-
FTCapacity)
Unmet Need All HS (Children - Total
Capacity)Allston/Brighton 55 136 191 463 408 272Charlestown/North End 78 76 154 345 267 191Chinatown/South End/Fenway 157 188 345 517 360 172Dorchester 217 317 534 2573 2356 2039East Boston 51 133 184 770 719 586Hyde Park/Roslindale/W. Roxbury 78 23 101 834 756 733Mattapan 21 120 141 368 347 227Roxbury/JP/Mission Hill 321 252 573 1464 1143 891South Boston 52 100 152 504 452 352Downtown/Back Bay/Beacon Hill 4 0 4 24 20 20City-Wide Demand 1034 1345 2379 7862 6828 5483
InfantsNeighborhood Cluster
FT HS Capacity
PT HS Capacity
Total HS Capacity
Total Number of Children Living in
Poverty
Unmet Need FT HS (Children-
FTCapacity)
Unmet Need All HS (Children - Total
Capacity)Allston/Brighton 0 92 92 92Charlestown/North End 0 68 68 68Chinatown/South End/Fenway 0 102 102 102Dorchester 4 13 17 509 505 492East Boston 0 152 152 152Hyde Park/Roslindale/W. Roxbury 0 165 165 165Mattapan 0 73 73 73Roxbury/JP/Mission Hill 1 1 290 290 289South Boston 0 100 100 100Downtown/Back Bay/Beacon Hill 4 4 5 1 1City-Wide Demand 8 14 22 1557 1549 1535
ToddlersNeighborhood Cluster
FT HS Capacity
PT HS Capacity
Total HS Capacity
Total Number of Children Living in
Poverty
Unmet Need FT HS (Children-
FTCapacity)
Unmet Need All HS (Children - Total
Capacity)Allston/Brighton 0 161 161 161Charlestown/North End 0 120 120 120Chinatown/South End/Fenway 1 1 179 178 178Dorchester 22 66 88 893 871 805East Boston 0 267 267 267Hyde Park/Roslindale/W. Roxbury 1 1 289 288 288Mattapan 1 1 128 127 127Roxbury/JP/Mission Hill 3 18 21 508 505 487South Boston 0 175 175 175Downtown/Back Bay/Beacon Hill 0 8 8 8City-Wide Demand 28 84 112 2728 2700 2616
PreschoolersNeighborhood Cluster
FT HS Capacity
PT HS Capacity
Total HS Capacity
Total Number of Children Living in
Poverty
Unmet Need FT HS (Children-
FTCapacity)
Unmet Need All HS (Children - Total
Capacity)Allston/Brighton 55 136 191 211 156 20Charlestown/North End 78 76 154 157 79 3Chinatown/South End/Fenway 156 188 344 235 79 -109Dorchester 191 238 429 1171 980 742East Boston 51 133 184 350 299 166Hyde Park/Roslindale/W. Roxbury 77 23 100 379 302 279Mattapan 20 120 140 167 147 27Roxbury/JP/Mission Hill 318 233 551 666 348 115South Boston 52 100 152 229 177 77Downtown/Back Bay/Beacon Hill 0 0 0 11 11 11City-Wide Demand 998 1247 2245 3577 2579 1332
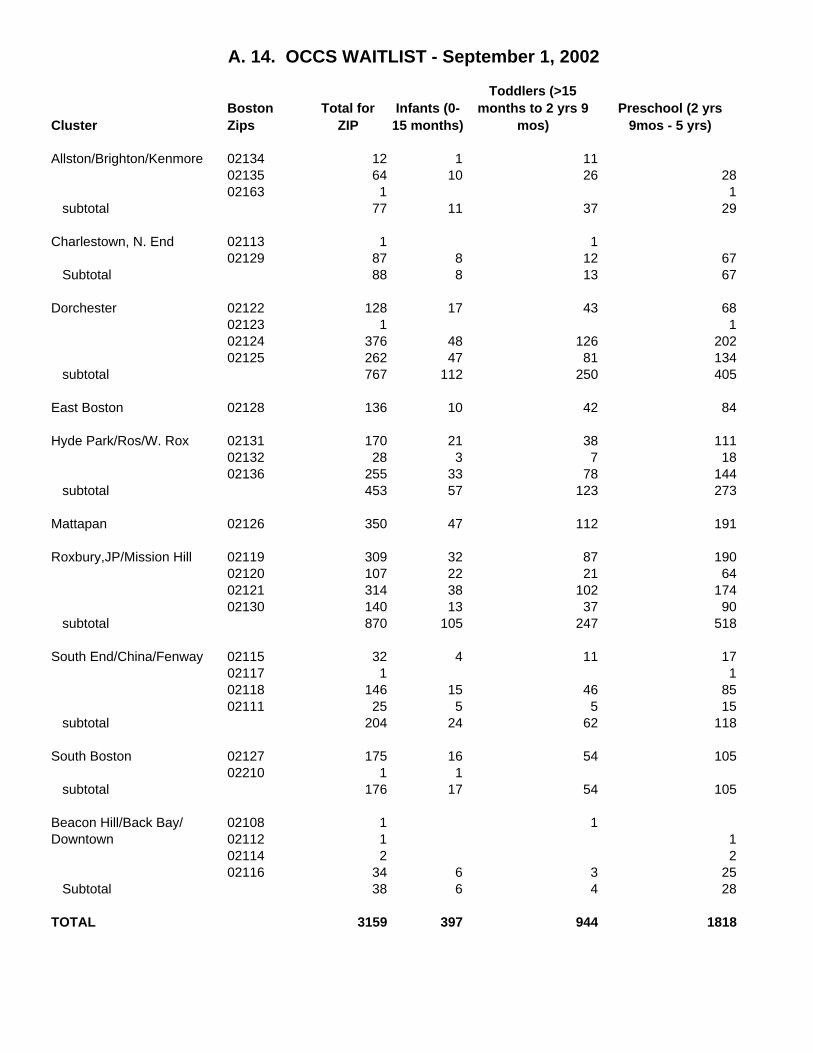
A. 14. OCCS WAITLIST - September 1, 2002
ClusterBoston Zips
Total for ZIP
Infants (0-15 months)
Toddlers (>15 months to 2 yrs 9
mos)Preschool (2 yrs
9mos - 5 yrs)
Allston/Brighton/Kenmore 02134 12 1 1102135 64 10 26 2802163 1 1
subtotal 77 11 37 29
Charlestown, N. End 02113 1 102129 87 8 12 67
Subtotal 88 8 13 67
Dorchester 02122 128 17 43 6802123 1 102124 376 48 126 20202125 262 47 81 134
subtotal 767 112 250 405
East Boston 02128 136 10 42 84
Hyde Park/Ros/W. Rox 02131 170 21 38 11102132 28 3 7 1802136 255 33 78 144
subtotal 453 57 123 273
Mattapan 02126 350 47 112 191
Roxbury,JP/Mission Hill 02119 309 32 87 19002120 107 22 21 6402121 314 38 102 17402130 140 13 37 90
subtotal 870 105 247 518
South End/China/Fenway 02115 32 4 11 1702117 1 1
02118 146 15 46 8502111 25 5 5 15
subtotal 204 24 62 118
South Boston 02127 175 16 54 10502210 1 1
subtotal 176 17 54 105
Beacon Hill/Back Bay/ 02108 1 1Downtown 02112 1 1
02114 2 202116 34 6 3 25
Subtotal 38 6 4 28
TOTAL 3159 397 944 1818
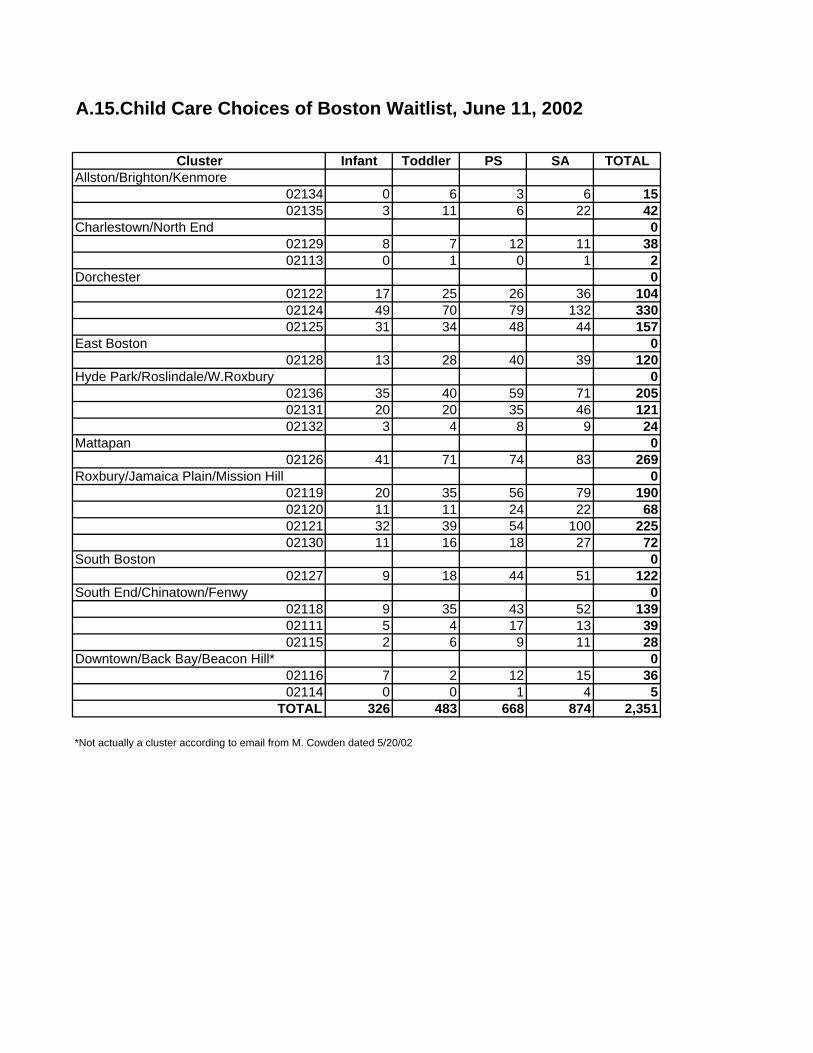
A.15.Child Care Choices of Boston Waitlist, June 11, 2002
Cluster Infant Toddler PS SA TOTALAllston/Brighton/Kenmore
02134 0 6 3 6 1502135 3 11 6 22 42
Charlestown/North End 002129 8 7 12 11 3802113 0 1 0 1 2
Dorchester 002122 17 25 26 36 10402124 49 70 79 132 33002125 31 34 48 44 157
East Boston 002128 13 28 40 39 120
Hyde Park/Roslindale/W.Roxbury 002136 35 40 59 71 20502131 20 20 35 46 12102132 3 4 8 9 24
Mattapan 002126 41 71 74 83 269
Roxbury/Jamaica Plain/Mission Hill 002119 20 35 56 79 19002120 11 11 24 22 6802121 32 39 54 100 22502130 11 16 18 27 72
South Boston 002127 9 18 44 51 122
South End/Chinatown/Fenwy 002118 9 35 43 52 13902111 5 4 17 13 3902115 2 6 9 11 28
Downtown/Back Bay/Beacon Hill* 002116 7 2 12 15 3602114 0 0 1 4 5
TOTAL 326 483 668 874 2,351
*Not actually a cluster according to email from M. Cowden dated 5/20/02