unmet need for contraception in south asia: levels, … · articles unmet need for contraception in...
TRANSCRIPT

Articles
Unmet Need forContraception in SouthAsia: Levels, Trends
and Determinants
Fear of side effects and/or other health concerns,religious prohibition, the desire for more children, opposition
from husbands, and a lack of knowledge about and/or access to,contraceptive methods are the major barriers to contraception
By Rafiqul Huda Chaudhury*
“Unmet need for family planning”, which refers to the conditionof wanting to avoid or postpone childbearing but not using any method ofcontraception, has been a core concept in international population for more thanthree decades (Casterline and Sinding, 2000; Freedman, 1987). The importanceof the unmet need for family planning or satisfying an individual’s reproductive
* Adviser on Population Policies and Development Strategies, United Nations PopulationFund, Country Support Team for South and West Asia, Kathmandu. The views expressed in thispaper are those of the author only and do not necessarily reflect those of the SAWA.
Asia-Pacific Population Journal, September 2001 3

aspirations as a rationale for formulating population programmes was furtherexplicitly reiterated by the Programme of Action of the InternationalConference on Population and Development (ICPD), which states that“Government goals for family planning should be defined in terms of unmetneeds for information and services” and that “all countries should, over thenext several years, assess the extent of national unmet need for good-qualityfamily planning services (United Nations, 1994). ICPD+5 has called for a 50per cent reduction in the unmet need for contraception by 2005 and its totalreduction by 2015.
Designing effective programmes to reduce unmet need will require,among other things, an assessment of the extent of unintended fertility and,correspondingly, of the amount of unsatisfied demand for fertility regulations,and the proper identification of women with unmet need, in terms of its causesand their socio-economic and demographic characteristics. This paper, coveringselected countries of the South Asian region, attempts (a) to examine levelsand trends in unmet need for contraception; (b) to identify the socio-economicand demographic characteristics of those women with the highest unmet needfor contraception, at the country and regional levels; (c) to delineate the majorreasons for not using contraception; and (d) to draw policy and programmelessons in order to meet the unmet need for contraception.
Data and methods
The paper is based on the analysis of secondary data, particularly thosecollected by Demographic and Health Surveys (DHSs) from 1990/1991 to1999/2000. The DHSs were based on national probability samples ofever-married women. The paper is also based on information collected fromcurrently married women between the reproductive ages of 15 and 49 years.
The unmet need for contraception was defined in DHSs as currentlymarried pregnant women whose pregnancy was mistimed (that is, they did notwant a child so soon) or unwanted (that is, they did not want a child at all),amenorrhoeic women whose last birth was mistimed or unwanted, and womenwho were neither pregnant nor amenorrhoeic and who either wanted to waittwo or more years for their next birth or have no more children, but were notusing contraception. Women who wanted to space the next birth or who wantedno more children were referred to as unmet need for spacing births, or spacers,
1/ Infecund women are those who are unable to give birth to a child even if they try.
4 Asia-Pacific Population Journal, Vol. 16, No. 3
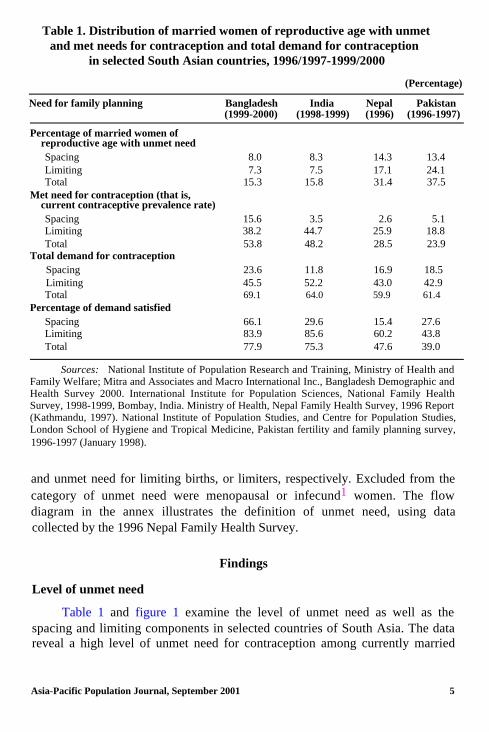
Table 1. Distribution of married women of reproductive age with unmetand met needs for contraception and total demand for contraception
in selected South Asian countries, 1996/1997-1999/2000
(Percentage)
Need for family planning Bangladesh India Nepal Pakistan(1999-2000) (1998-1999) (1996) (1996-1997)
Percentage of married women ofreproductive age with unmet needSpacingLimitingTotal
Met need for contraception (that is,current contraceptive prevalence rate)SpacingLimitingTotal
Total demand for contraceptionSpacingLimitingTotal
Percentage of demand satisfiedSpacingLimitingTotal
8.0 8.3 14.3 13.47.3 7.5 17.1 24.1
15.3 15.8 31.4 37.5
15.6 3.5 2.6 5.138.2 44.7 25.9 18.853.8 48.2 28.5 23.9
23.6 11.8 16.9 18.545.5 52.2 43.0 42.969.1 64.0 59.9 61.4
66.1 29.6 15.4 27.683.9 85.6 60.2 43.877.9 75.3 47.6 39.0
Sources: National Institute of Population Research and Training, Ministry of Health andFamily Welfare; Mitra and Associates and Macro International Inc., Bangladesh Demographic andHealth Survey 2000. International Institute for Population Sciences, National Family HealthSurvey, 1998-1999, Bombay, India. Ministry of Health, Nepal Family Health Survey, 1996 Report(Kathmandu, 1997). National Institute of Population Studies, and Centre for Population Studies,London School of Hygiene and Tropical Medicine, Pakistan fertility and family planning survey,1996-1997 (January 1998).
and unmet need for limiting births, or limiters, respectively. Excluded from thecategory of unmet need were menopausal or infecund1 women. The flowdiagram in the annex illustrates the definition of unmet need, using datacollected by the 1996 Nepal Family Health Survey.
Level of unmet need
Findings
Table 1 and figure 1 examine the level of unmet need as well as thespacing and limiting components in selected countries of South Asia. The datareveal a high level of unmet need for contraception among currently married
Asia-Pacific Population Journal, September 2001 5

Figure 1. Percentage distribution of currently married women ofreproductive age with unmet need for contraception by components
in selected South Asian countries, 1996/1997-1999/2000
Bangladesh India Nepal Pakistan
n Total 0 Limiting q Spacing
women in South Asia. At least one in five currently married women in thecountries surveyed want to stop or delay childbearing, but are not usingcontraception. However, the level of unmet need for contraception variesconsiderably across the countries, ranging from 15.3 per cent in Bangladesh to15.8 per cent in India, 31.4 per cent in Nepal and 37.5 per cent in Pakistan. Inother words, nearly two in five currently married women in Pakistan, one inthree in Nepal, and one in six in Bangladesh and India are in need ofcontraception for the purpose of spacing or limiting births. The high unmetneed in Pakistan and Nepal can, to a great extent, be attributed to the highdemand for limiting births (17-24 per cent), which exceeds the unmet need forlimiting births in Bangladesh and India by 128-230 per cent.
Estimated number of women with unmet need
For the purpose of programme planning, an estimate is also made of thenumber of women in the reproductive age group with unmet need in eachcountry.2 This provides valuable information on the number of potential usersof family planning services and helps programme managers to plan appropriate
2/ An estimate of the number of women with unmet need is obtained by multiplyingthe number of women in the reproductive age group with the total unmet need for contraception.Data on the number of women in the reproductive age group are taken from World ContraceptiveUse, 1998 (wall chart), United Nations, 1999.
6 Asia-Pacific Population Journal, Vol. 16, No. 3

Figure 2. Number of currently married women of reproductiveage with unmet need for contraception in selected South
Asian countries, 1996/1997-1999/2000
India Pakistan Bangladesh Nepal
strategies to meet potential demand. In the South Asian countries covered bythis paper, nearly 41 million women would like to postpone their next birth fortwo or more years or to stop childbearing, but are not using contraception. InIndia alone, around 28 million women have an unmet need for contraception,compared with 8 million in Pakistan, 3.4 million in Bangladesh and 1.3 millionin Nepal (figure 2). This paper provides a conservative estimate of the numberof women with an unmet need for contraception. The number would have beenmuch higher if (a) the estimate had included the unmet need for contraceptionamong individuals who were not living in marital union, and (b) the definitionof unmet need had been broadened to include those women dissatisfied withtheir current methods of contraception, those who were using less efficaciouscontraceptive methods or those who sought services other than contraception,such as menstrual regulation or treatment of infecundity.
Level of total demand for contraception
Table 1 also provides an estimate of the total demand for contraception,obtained by adding the total unmet need to the contraceptive prevalence rate.Total demand may be interpreted as the contraceptive prevalence that wouldhave been observed at the time of the survey if the women had previously fullyimplemented their spacing and limiting preferences (Bongaarts, 1991). The datain table 1 reveal a high level of total demand for contraception in almost all thecountries surveyed, with little variation among them. The total demand forcontraception varies within a narrow range of 60-64 per cent for most of the
Asia-Pacific Population Journal, September 2001 7

Figure 3. Percentage distribution of currently married women ofreproductive age with total demand for contraception, met need and
unmet need, selected South Asian countries, 1996/1997-1999/2000
Per cent of married women
H Total demand 0 Met 0 Unmet
countries surveyed. However, there is substantial variation with respect to thelevel that is reached in satisfying total demand.
Level of satisfaction in meeting total demand for contraception
The extent to which the total demand for contraception is satisfied is alsoestimated by dividing the contraceptive prevalence rate by the sum of the totalunmet need and prevalence rate. The estimate will provide, on the one hand, ameasure of the success achieved by the family planning programme in meetingthe demand for contraception while reminding the programme managers oftheir unfinished task of meeting the need of those whose demand forcontraception still remains unrealized. The data in table 1 and figure 3 indicatea big gap between demand and satisfaction. Only 65 per cent of the totalpotential demand for contraception is currently being satisfied. However, thelevel of satisfaction varies widely by country in the region. The percentage ofthe total demand for contraception that is currently satisfied ranges from a highof 75-78 per cent in India and Bangladesh to 48 per cent in Nepal and 39 percent in Pakistan. It is also important to note that the proportion of satisfied
8 Asia-Pacific Population Journal, Vol. 16, No. 3

Figure 4. Level and trend in unmet need for contraception by planningstatus in selected South Asian countries, 1991 to 1999/2000
45
40171
|
20
15
10
1
‘O’,II
5
0To To Total To To Total | To To Total
30
Bangladesh
Bangladesh n 1993/94
cl 1999/00
35
25 |
I i
| To To Totalspace limit space limit space limit space limit
India Nepal Pakistan
India m 1992/93 Nepal/Pakistan n 1991
0 1998/99 0 1996
demand for limiting births far outweighs the proportion of satisfied demand forspacing births in all countries covered by this survey (figure 3). This mayreflect, among other things, programme emphasis on terminal rather thanspacing methods. It calls for ensuring greater accessibility of spacing methodsand popularizing them, particularly among young couples who have not yetachieved their desired family size and are in need of contraception for spacingbirths. The findings indicate that most countries in the region need tosubstantially improve their programme efforts to enhance the contraceptive userate (for example, at least 28-33 per cent in Bangladesh and India, and 110-157per cent in Nepal and Pakistan, respectively) in order to meet the total demandfor contraception.
Trend in unmet need
The data in figure 4 show a mixed trend in unmet need and the totaldemand for contraception by its components. In Bangladesh and India unmet
Asia-Pacific Population Journal, September 2001 9

Table 2. Estimated total fertility rate using regression equationTFR = 7.178 - 0.0682 CPR + e
Country Current total Current Unmet need Total Estimatedfertility rate contraceptive demand for TFR if total
(TFR) prevalence contraception demand forrate (CPR) contraception
(A) (B) (C) (B+C)satistied
Bangladesh 3.3 53.8 15.3 69.1 2.46India 2.9 48.2 15.8 64.0 2.81
Nepal 5.6 28.5 31.4 59.9 3.09Pakistan 5.3 23.9 37.5 61.4 2.99
Sources: National Institute of Population Research and Training, Ministry of Health andFamily Welfare; Mitra and Associates and Macro International Inc., Bangladesh Demographic andHealth Survey 2000. International Institute for Population Sciences, National Family HealthSurvey, 1998-1999, Bombay, India. Ministry of Health, Nepal Family Health Survey, 1996 Report(Kathmandu, 1997). National Institute of Population Studies, and Centre for Population Studies,London School of Hygiene and Tropical Medicine, Pakistan fertility and family planning survey,1996-1997 (January 1998).
need has declined, while in Nepal and Pakistan it has increased. In India andBangladesh, the unmet need for family planning among currently marriedwomen declined by 19-21 per cent between the early and late 1990s. Thisdecline was also noticed among both spacers and limiters of births. In Nepal,the unmet need for contraception increased, albeit modestly, by 2 per cent,while in Pakistan it increased considerably by 33 per cent between the earlyand late 1990s. This increase was noticed among both spacers and limiters ofbirths in Pakistan. In Nepal, the unmet need for contraception for spacing andlimiting of births showed an opposite trend, in which the former declined whilethe latter increased. The increase in unmet need for contraception in Pakistanand Nepal may be attributed to greater reproductive preference for smallerfamily size and the increased availability of family planning services, amongother factors.
Demographic impact
The question of whether unmet need for family planning is high enoughin South Asian countries to have a significant impact on fertility if that need issatisfied is investigated using a simple regression model (TFR = 7.178 -0.0682 CPR + e), developed by Bongaarts (1990). The result in table 2 showsthat a significant demographic impact would follow for a majority of the South
10 Asia-Pacific Population Journal, Vol. 16, No. 3

Asian countries surveyed if all women who wished to limit or postpone birthsbecame contraceptive users. For example, the total fertility of Bangladesh,Nepal and Pakistan would be greatly reduced, from 3.3 to 2.5 births (24 percent), 5.6 to 3.1 births (45 per cent) and 5.3 to 3.0 births (43 per cent),respectively, if the unmet need for contraception was satisfied. Only in the caseof India would the corresponding decline be marginal: from 2.9 to 2.8 births(3 per cent). These countries would become 15 to 30 per cent closer toreplacement-level fertility of 2.1 births per woman (table 2) if women withunmet need for contraception became contraceptive users.
Co-variates of unmet need for contraception:who has unmet need?
The magnitude of unmet need for contraception varies substantiallyaccording to the demographic and social characteristics of women, the mostprominent of which are age, number of living children, residence andeducation. Also, the characteristics of women with unmet need who areinterested in spacing differ from those interested in limiting births. Examinationof co-variates of unmet need will enable the identification of women withgreater unmet need and their characteristics. This information will providevaluable inputs to the formulation of targeted strategies for meeting the demandfor contraception of women with varying needs.
The data in table 3 show a negative association between age and unmetneed for contraception for all of the South Asian countries surveyed,except Pakistan. In Pakistan, age shows a positive relationship with unmet needfor contraception. The relationship between age and unmet need becomessharper and uniform across all the countries when unmet need is dividedinto its spacing and limiting components. Age shows a negative relationshipwith unmet need for spacing and a positive relationship with limitation ofbirths. This indicates a concentration of unmet need for spacing and limitingbirths among younger and older women, respectively. This is to be expectedbecause younger women will still want to have more children, while olderwomen have achieved their desired number of children.
Number of living children
The relationship between the number of living children and the level ofunmet need assumes the same pattern as that of age, in which women with
Asia-Pacific Population Journal, September 2001 11

Table 3. Percentage distribution of currently married women with unmet need for contraceptionby background characteristics in selected South Asian countries, 1996/1997-1999/2000
Background characteristics Unmet need for contraceptionBangladesh (1999-2000) India (1998-1999) Nepal (1996) Pakistan (1996-1997)
To To Total To To Total To To Total To To Totalspace limit space limit space limit space limit
Age15-1920-2425-2930-3435-3940-4445-49
Number of living children01
3456+
ResidenceUrbanRural
EducationNo educationPrimarySecondary +Total
18.3 1.7 20.0 25.6 1.6 27.1 38.9 1.613.2 4.9 18.1 18.4 5.9 24.4 28.8 9.06.7 9.5 16.2 8.1 10.5 18.6 12.9 21.64.2 10.3 14.5 3.1 11.1 14.1 5.3 27.0I.5 11.8 13.3 1.1 9.1 10.2 2.3 26.80.6 9.3 9.9 0.2 5.5 5.7 0.8 21.40.0 4.6 4.6 0.1 3.0 3.1 0.1 9.1
13.820.6
2 7.9 4.12.92.42.0
6.3 6.1 12.4 6.78.4 7.6 16.0 8.9
6.9 9.7 16.6 7.88.6 8.3 16.9 9.28.5 3.9 12.4 8.88.0 7.3 15.3 8.3
40.5 22.4 0.6 23.037.8 25.9 7.1 33.034.6 19.6 18.1 37.732.3 10.6 24.1 34.729.1 3.8 35.8 39.522.2 1.8 43.0 44.7
52.6
0.2 14.12.6 23.27.1 15.07.8 11.99.7 12.5
14.2 16.620.5 22.5
22.9 0.232.0 3.418.2 13.89.2 20.13.2a/ 30.3a/
9.2 0.8 51.8
23.135.432.129.333.5a/
6.7 13.4 7.4 14.3 21.7 11.8 24.2 36.07.8 16.7 14.9 17.4 32.3 14.0 24.1 38.1
8.5 16.2 12.7 18.4 31.1 13.3 26.2 39.56.1 15.2 21.1 15.0 36.2 14.6 20.3 34.86.3 15.1 19.0 8.8 27.8 12.9 15.9 28.87.5 15.8 14.3 17.1 31.4 13.4 24.1 37.5
Sources: National Institute of Population Research and Training, Ministry of Health and Family Welfare; Mitra and Associates andMacro International Inc., Bangladesh Demographic and Health Survey 2000. International Institute for Population Sciences, National FamilyHealth Survey, 1998-1999, Bombay, India. Ministry of Health, Nepal Family Health Survey, 1996 Report (Kathmandu, 1997). NationalInstitute of Population Studies, and Centre for Population Studies, London School of Hygiene and Tropical Medicine, Pakistan fertility andfamily planning survey, 1996-1997 (January 1998).
a/ Refers to 4 and above.

fewer living children are more interested in contraception for spacing thanwomen with high parity. The latter are more concerned with limiting births(table 3).
Place of residence
In all the South Asian countries covered by this paper, the unmet need forcontraception is generally higher in rural areas than in urban areas. This may beattributed, among other factors, to the higher availability of contraceptiveservices and the preference for smaller families in urban areas. The overallfinding of a higher need for contraception in rural areas also holds for theunmet need to space births across all the South Asian countries surveyed, andfor limiting births, except in Pakistan. The data show no variation betweenrural and urban areas of Pakistan with regard to unmet need for limiting births(table 3).
Female education
Examination of the relationship between female education and the levelof unmet need shows the following pattern: in all of the countries included inthe survey, unmet need for family planning is lower among women withsecondary and higher education than among women with little or no education(table 3). However, the overall pattern of the relationship between educationand unmet need changes when unmet need is divided into spacing and limitingcomponents. In all of the countries under study, the unmet need for limitingbirths is more concentrated among women with little or no education, while theunmet need for spacing is more concentrated among women with primaryeducation followed by those with secondary education, except in Pakistan. InPakistan, both spacers and limiters tend to be more concentrated among womenwith little or no education. The finding of a relatively higher concentration ofspacers among women with higher education and a greater number of limitersamong women with little or no education may be attributed, among otherfactors, to their age differences. Since women with higher education arerelatively younger than women with little or no education, the former willtherefore be more interested than the latter in spacing births. Moreover, theformer are more knowledgeable than the latter about method mix and sourcesof contraceptives.
Differences among women with unmet need
Women with unmet need do not form a homogeneous group. Severalimportant differences exist among women with unmet need that deserve
Asia-Pacific Population Journal, September 2001 13

Table 4. Composition of unmet need for contraception by pregnancystatus and contraceptive intention in selected South Asian countries
(Percentage)
Country
Bangladesh (1993-1994)a/
Nepal (1996)b/
Pakistan (1990-1991)a/
Pregnant or Who have neveramenorrhoeic used contraception
22.0 51.0
26.5 78.0
26.0 82.0
Who intend touse contraception
79.0
76.0
26.0
a/ Demographic and Health Surveys, quoted in Population Reports, vol. XXIV, No. 1,September 1996, Johns Hopkins University School of Public Health, Centre for CommunicationPrograms.
b/ Aryal, R.H and T.B. Dangi (1997). “Attitudes towards family planning and reasons fornon-use among women with unmet need for family planning in Nepal”, in Insights on FamilyHealth Issues in Nepal (Kathmandu, Ministry of Health).
consideration from a programmatic viewpoint. These differences includewhether unmet need is for limiting or spacing of births, the pregnancyor exposure status, the previous use of contraception and the intention to usecontraception in the future.
Limiting versus spacing
The classification of unmet need into two components (the need forspacing and the need for limiting births) has important family planningprogramme implications. This will provide valuable information to programmemanagers that will be helpful in selecting the appropriate method mix formeeting the demand of potential users of contraception, that is, whether theyare interested in spacing or limiting births.
Data show no systematic distribution pattern of the components of unmetneed across the South Asian countries covered by this study. The unmet need ishigher for limiting than spacing births in Nepal and Pakistan, while in Indiaand Bangladesh it is the reverse (table 1).
Pregnancy or exposure status
The unmet need for contraception was also assessed for women who arepregnant or amenorrhoeic women by asking whether (a) their currentpregnancy or recent birth was mistimed (that is, the child was either not wantedso soon or was unintended (that is, not wanted at all), and (b) any method offamily planning was being used at the time of conception. Table 4 shows that a
14 Asia-Pacific Population Journal, Vol. 16, No. 3

sizeable proportion of women with unmet need are pregnant or amenorrhoeic,accounting for at least one fifth of the total in all the South Asian countriesincluded in this study. The finding indicates that unmet need is fairly commonamong amenorrhoeic women, that is, those who have recently given birth. Thisfinding has significant programme implications. Although such women are notimmediately at risk of pregnancy, they may become pregnant sooner thanexpected if their unmet need for contraception is not met in a timely andadequate way, a fact confiied by studies conducted in several countries. Forexample, survey data from 33 countries found that 17-22 per cent ofpregnancies occurred within nine months of a previous birth (Hobcraft, 1991).Another set of data collected from 25 countries found that, on average, 11 percent of women intended to have another birth within two years of a previousbirth, but that 35 per cent had actually given birth sooner. Those figuresconfirm that many amenorrhoeic women give birth much earlier than theywould like (Westoff and Bankole, 1995). One lesson that can be learnt fromthese findings is that the unmet need for contraception of amenorrhoeic womenshould be met in a timely way in order to avoid unwanted births.
Prior use of family planning
As observed elsewhere, the data from selected South Asian countries alsoconfirm that the majority of women with an unmet need have never usedcontraception. The past use of contraception ranges from a high of 49 per centin Bangladesh to a low of 18 and 22 per cent in Pakistan and Nepal,respectively.
Intention to use contraception
The data on intention to use contraception in the future are very useful asthey enable a fairly robust estimate to be made of potential demand forcontraception. There is a close association between intention to use and actualuse of contraception. A recent longitudinal study in Morocco revealed thatmore than 75 per cent of a cohort of women who indicated their intention touse family planning in 1992 actually did so in 1995 (Johns Hopkins UniversitySchool of Public Health, 1996). The data in table 4 show a high potentialdemand for contraception among women with unmet need in most countries ofthe region, except Pakistan. At least three out of four women in Bangladeshand Nepal intended to use contraception in the future. In Pakistan, only one infour intended to use contraception in the future. This could be attributed to theprevailing low level of unmet need and inadequate supply of familyplanning services in 1990-1991. However, the situation could have changed by
Asia-Pacific Population Journal, September 2001 15

the late 1990s. Unfortunately, no recent comparative data are available formeasuring that change over time.
Reasons for not using contraception
This section identifies and discusses the factors inhibiting the use ofcontraception by married women who are apparently willing to postpone orlimit births, by utilizing data collected during the DHS surveys. The reasons fornot using contraception are identified for two groups of women with unmetneed: (a) women with total unmet need; and (b) women with unmet need whodo not intend to use contraception in the future. Proper identification of thereasons why so much demand remains unsatisfied will lead to the formulationof appropriate strategies for meeting the unmet need of potential users.
Reasons for not using contraception: women with total unmet need
The most frequently mentioned reasons cited by women with unmet needfor not using contraception in Nepal, as reported in the 1996 DHS, were: (a) adesire for more children (27 per cent); (b) side effects and/or health concerns(22 per cent); (c) infrequent sex and/or not having sex (11 per cent); (d)husband’s disapproval (6 per cent); (e) a lack of knowledge and/or sources of,and a lack of access to, contraceptive methods, (12 per cent); (f) religion (3 percent); and (g) postpartum breastfeeding (7 per cent) (table 5).
In Bangladesh and Pakistan, religion and the partner’s opposition werecited as the principal reasons for not using contraception by women with unmetneed in the 1990/1991 and 1993 DHSs (Macro International, 1998). A 1997survey in the province of Punjab, Pakistan revealed that among the eightpossible barriers to contraceptive use, the most prevalent was disapproval bythe husband, followed by fear of side effects (Population Council, 1997).Opposition by the husband was also identified as a major reason for non-use ofcontraception in India (Viswanathan, Godfrey and Yinger, 1998).
In Sri Lanka, the principal reasons cited by women with unmet need fornon-use of contraception included: (a) health concerns (19.3 per cent); (b)husband’s disapproval (14.6 per cent); (c) infrequent sex (13.3 per cent); (d)lack of knowledge (10.4 per cent); (e) religion (3.6 per cent); and (f) lack ofaccess (3.2 per cent) (Bongaarts and Bruce, 1994). In 2000, health concernswere still cited (11 per cent) as the single most important non-biological reasonfor not using contraception, followed by husband’s disapproval (3.9 per cent)and religious opposition (3 per cent), among married non-pregnant women who
16 Asia-Pacific Population Journal, Vol. 16, No. 3

Table 5. Percentage distribution of women with unmet need forcontraception by main reason for non-use, Nepal 1996
Reasons for non-use Unmet needSpacing Limiting Total
Not having sex 2.2 2.5 2.4Infrequent sex 8.5 7.9 8.2Menopausal/hysterectomy 0.0 0.0 0.0Sub-fecund, infecund 0.0 0.1 0.0Postpartum, breastfeeding 7.7 6.3 6.9Want more children 47.1 9.4 26.6Pregnant 3.4 3.7 3.6Respondent opposed 1.0 2.1 1.6Husband opposed 2.9 9.1 6.3Others opposed 0.8 0.8 0.8Religious prohibition 3.0 3.4 3.2Knows no method 3.8 4.8 4.4Knows no source 2.7 3.3 3.1Health concerns 1.4 9.8 6.0Fear of side effects 6.8 23.5 15.9Lack of access 2.7 6.0 4.5Costs too much 0.1 0.1 0.1Inconvenient to use 0.4 0.1 0.2Interferes with body 0.0 0.4 0.2Others 4.1 6.4 5.3Don’t know 1.3 0.2 0.7Total 100 100 100Number of women 1,138 1,366 2,504
Source: Aryal, R.H. and T.B. Dangi (1997). “Attitudes towards family planning andreasons for non-use among women with unmet need for family planning in Nepal”, in Insights onFamily Health Issues in Nepal (Kathmandu, Ministry of Health and Macro International Inc.).
were not currently using a method of contraception and who reported beingunhappy if they became pregnant too soon (Department of Census andStatistics, 2001).
Reasons for not intending to use contraception in the future
The group of women who are apparently willing to postpone or limit theirbirths, but are not intending to use contraception in the future, deserve specialfocus from a programme point of view. The reason for such focus is that theyare not likely to respond spontaneously to family planning programme effortseasily, unless their concerns for not intending to use contraception in the
Asia-Pacific Population Journal, September 2001 17

Table 6. Percentage of women with unmet need intending to usecontraception in the future, and reasons of those not intendingto use contraception by components of unmet need, Nepal 1996
Components of unmet needSpacing Limiting Total
Intend to use 81.0 70.9 75.5Do not intend to use 19.0 29.1 24.5Total 100 100 100Number of women 1,138 1,366 2,504Do not intend to use owing to:
Infrequent sex 4.0 8.6 7.0Menopausal 0.0 0.1 0.1Want (more) children 35.5 0.2 12.6Respondent opposed 3.2 5.7 4.8Husband opposed 5.0 8.8 7.5Others opposed 1.4 0.0 0.5Religious prohibition 16.8 10.6 12.8Knows no method 6.2 3.1 4.2Knows no sources 4.6 2.2 3.1Health concerns 1.9 14.3 9.9Fear of side effects 19.1 32.6 27.8Lack of access/too far 0.7 1.9 1.5Interferes with body 0.0 0.4 0.2Others 0.0 10.8 7.0Don’t know 1.6 0.8 1.0
Total 100 100 100Number of women 216 397 613
Source: Aryal, R.H. and T.B. Dangi (1997). “Attitudes towards family planning andreasons for non-use among women with unmet need for family planning in Nepal”, in Insights onFamily Health Issues in Nepal (Kathmandu, Ministry of Health and Macro International Inc.).
future are adequately understood and addressed. This calls for a thoroughinvestigation into, and understanding of, the reasons inhibiting currentlymarried women with unmet need from using contraception in the future.Utilizing data from the 1996 Nepal DHS, Aryal and Dangi (1997) looked at thereasons why women with unmet need did not intend to use contraception in thefuture, and noted the following frequently cited reasons: (a) fear of side effectsand/or health concerns (38 per cent); (b) religious prohibition (13 per cent); (c)a desire for more children (13 per cent); (d) husband’s disapproval (8 per cent);and (e) a lack of knowledge and/or sources of contraceptive methods, and lackof access to contraceptive methods (9 per cent) (table 6).
18 Asia-Pacific Population Journal, Vol. 16, No. 3

Table 6 shows that the principal non-biological reasons given by womenwith unmet need who do not intend to use any contraceptive method in thefuture tend to be: (a) health concerns about contraceptives and side effects; (b)desire for more children; (c) husband’s disapproval; (d) a lack of knowledgeand/or access; and (e) religious opposition.
Programme implications
The research findings clearly point to the need for (a) improvingaccess to, and the quality of, reproductive health and family planning (RH/FP)services; (b) ensuring that the programme is more focused and targeted; (c)enhancing male participation in reproductive health; and (d) undertakingvigorous information, education and communication programmes as majorstrategies for meeting the existing unmet need for contraception.
Improving the quality and accessibility of reproductive health serviceswould dispel health concerns and reduce the side effects of contraceptives aswell as improve the limited choice of methods, particularly spacing methods,which are the two major barriers to the use of contraception. This wouldinvolve developing programme strategies that would (a) institutionalize regularfollow-up services for the users of contraceptives in order to monitor andmanage health-related side effects; (b) provide counselling and accurateinformation on how to use the method selected, and promote discussions ofpossible side effects and how to manage them; (c) ensure the local availabilityof a wider choice of method mix to meet the need of both spacers and limitersof births; and (d) inform women about various choices of contraceptivemethods, the possibility of switching methods whenever their needs change,and/or alternative sources of supply. This would require sound training of fieldworkers and the development of effective educational materials.
The targeted programme approach would help meet demand forcontraception by women with the highest unmet need (that is, women withlittle or no education, rural women, adolescent girls and young women, andamenorrhoeic women). This would require programme-devising services basedon a thorough understanding of reproductive health needs and contraceptivechoices. As this understanding is as yet very limited, in-depth research studieson the subject, in order to fill gaps and formulate knowledge-based programmestrategies, would need to be carried out.
Male involvement in reproductive health will reduce opposition to familyplanning decisions made by partners. Opposition from husbands is a major
Asia-Pacific Population Journal, September 2001 19

barrier to the use of contraception by wives. Many studies have shown thatwhen men are provided with information about reproductive health services,they are likely to be supportive of their partners’ family planning decisions.Hence, family planning programmes should devise services and communicationstrategies for reaching women and men by (a) conducting male-orientedsurveys and research on male perspectives; (b) training programme plannersand service providers to give them a better understanding of men’sreproductive health needs; (c) emphasizing male-female partnership throughbetter spousal communication; and (d) supporting women’s autonomy andreproductive rights. A study conducted in Pakistan in 1999 found that unmetneed was somewhat lower among women who had more autonomy in house-hold decision-making, were free to travel to health facilities on their own, andwere able to freely discuss family planning with their husbands (PopulationCouncil, 1997).
A desire to have more children, opposition from a husband to the use ofcontraception by his wife, religious prohibition and a lack of knowledge aboutmethods are the major barriers to the use of contraception. To circumvent thesebarriers, family planning programmes should develop appropriate information,education and communication strategies that would (a) promote the value of thesmall family; (b) dispel the misinterpretation of religion with regard to birthcontrol; (c) foster interpersonal communication on reproductive health orfamily planning issues; (d) promote reproductive rights, including the right tochoose the number and spacing of children, gender equity and equality; and (e)increase awareness of contraceptive methods.
20 Asia-Pacific Population Journal, Vol. 16, No. 3

Flow diagram for estimation of unmet need for family planning:an example for currently married women in Nepal, 1996
(Percentages)
All currentlymarried women
Source: Aryal, R.H. and T.B. Dangi (1997). “Attitudes towards family planning andreasons for non-use among women with unmet need for family planning in Nepal”, in Ministry ofHealth and Macro International Inc. Insights on Family Health Issues in Nepal (Kathmandu).
Asia-Pacific Population Journal, September 2001 21

References
Aryal, R.H. and T.B. Dangi (1997). “Attitudes towards family planning and reasons for non-useamong women with unmet need for family planning in Nepal”, in Ministry of Health andMacro International Inc., Insights on Family Health Issues in Nepal (Kathmandu).
Bongaarts, J. (1990). “The measurement of wanted fertility”, Population and Development Review,16(2).
(1991). “The kap-gap and the unmet need for contraception”, Population and
Development Review, 17(2).
and J. Bruce (1994). “The causes of unmet need for contraception and the socialcontext of services”, Working Paper No. 69, Population Council.
Casterline, J.B. and S. Sinding (2000). “Unmet need for family planning and implications forpopulation policy”, Population and Development Review, 26(4), December 2000.
Department of Census and Statistics (2001). Demographic and Health Survey, Sri Lanka, 2000,(Colombo, Ministry of Finance and Planning).
Freedman, R. (1987). “The contribution of social science research to population policy and familyplanning programme effectiveness”, Studies in Family Planning 18(2):57-82.
Hobcraft, J. (1991). “Child spacing and child mortality”. Proceedings of the Demographic andHealth Surveys World Conference, 5-7 August, 1991 (Washington, DC, InternationalResource Development/Macro International), 2: 1157-l 182.
Johns Hopkins University School of Public Health, Center for Communication Programs (1996).Population Reports, vol. XXIV, No. 1.
Macro International (1998). “Unmet need: 1990-1994”, press release, 29 June 1998.
Population Council (1997), The Gap Between Reproductive Intentions and Behaviour: a Study ofPunjabi Men and Women (Islamabad).
Viswanathan, H., S. Godfrey and N. Yinger (1998). Reaching Women: a Study of Unmet Need inUttar Pradesh, India (Washington, D.C, International Center for Research on Women).
Westoff, C.F. and A. Bankole (1995). “Unmet Need: 1990-1994”, Demographic and HealthSurveys Comparative Studies No. 16 (Calverton, Maryland, Macro International), pp. 55.
United Nations (1994). Programme of Action of the International Conference on Population andDevelopment, held at Cairo, 5-13 September 1994.
22 Asia-Pacific Population Journal, Vol. 16, No. 3

Fertility Decline inSri Lanka: Are All
Ethnic Groups Party tothe Process?
Ethnic differentials in family planning acceptanceand practice are diverse in Sri Lanka, with the
Sinhalese demonstrating the highest rate
By P. Puvanarajan and W. Indralal De Silva*
Sri Lanka has played the role of a virtual laboratory in understanding theprocess of demographic transition in low-income countries. The advancedstages of demographic transition in any context entail irreversible populationgrowth patterns that affect the population growth components of fertility,mortality and migration. The significant demographic transitional effects arethe fertility changes that these communities undergo, tending towards achievingreplacement or below replacement fertility levels (De Silva, 1994). It wouldtherefore be of interest to investigate the course of such changes occurring in aheterogeneous society.
* P. Puvanarajan, Senior Lecturer, Department of Geography and W. Indralal De Silva,Professor and Head, Department of Demography, University of Colombo, Colombo, Sri Lanka.
Asia-Pacific Population Journal, September 2001 23

Sri Lankan society is diverse, as it is composed of a multiracial,multireligious and multilinguistic population. The Sinhalese, as the majoritygroup, predominate. The Tamil and Moor communities form the other majorethnic groups. Malays and Burghers form minorities of insignificantproportions. The majority of the Sinhalese are Buddhists, while the majority ofthe Tamils are Hindus. However, Christianity prevails among the Sinhalese,Tamil and Burgher ethnic groups, while the Moors are followers of Islam.
The ethno-religious composition of the population and the relativenumerical strengths and balances of each group during the process ofdemographic transition are important factors. These factors should beconsidered when investigating fertility levels and patterns of selected ethnicgroups as they will have differential effects on fertility performance. Tables 1and 2 indicate the relative numerical strength of the different ethnic andreligious groups in terms of their fertility, mortality and migration behaviouralpatterns. The information presented in these tables, except for 1994, is basedentirely on census data collected since 1881. It should be noted that dataobtained from the 1994 Demographic Survey do not include the Northern andEastern provinces. Therefore, in terms of ethnic balance, the numberspresented, as well as the rates, ratios and percentage distributions calculated for1994 should be interpreted with caution, especially when those measures arecompared with previous years.
Table 3 indicates the percentage distribution of the Sri Lankan populationby ethnicity and religion in 1981. The data confirm that, although Sri Lankansform a heterogeneous society, there is a unique ethno-religious relationship ineach ethnic group as a large majority in each ethnic group adheres largely to aparticular religion. For example, at least 93 per cent of Sinhalese are Buddhists,about 85 per cent of Tamils are Hindus and approximately 93 per cent ofMoors are Muslims.
While differentials exist among the ethnic groups in respect of the levelsand patterns of fertility decline, there may also be substantial differences in thesocio-economic and cultural determinants that affect such a decline (Abeykoon,2001). Based on the relative declining trends and patterns of fertility, mortalityand migration of the various ethnic groups, concern may arise among somegroups experiencing a decline in their numbers. The current ethnic conflict,which is largely ethno-based, might add to such concern, especially among theTamil, Moor and Sinhalese communities. Therefore, an ethno-based analysis offertility changes among the Sri Lankan ethnic groups and associated researchcould bring clarity to the issue. It could also be deemed a contribution to thecurrent knowledge of the transitional theory.
24 Asia-Pacific Population Journal, Vol. 16, No. 3

Table 1. Numerical and percentage distribution of population by ethnicity, 1881-199402 Ethniciity 1881 1891 1901 1911 1921 1946 1953 1963 1971 1981 1994
Tamilsa/
uLzs All groups 2,944,280 100 3,007,789 100 3,565,754 100 4,106,350 100 4,497,854 100 6,657,339 100 8,097,895 100 10,582,064 100 12,689,897 100 14,846,750 100 15,022,000 100
Sinhalese 1,846,614 66.9 2,041,158 67.9 2,330,807 65.4 2,715,420 66.1 3,015,970 67.1 4,620,507 69.4 5,616,705 69.4 7,512,915 71.0 9,131,241 72.0 10,979,561 74.0 12,598,000 83.9
Moorsa/
Sri Lankan 687,248 24.9 723,853 24.1 951,740 26.7 528,024 12.9 517,189 11.5 733,731 11.0 884,703 10.9 1,164,689 11.0 1,423,981 11.2 1,886,872 12.7 809,000 5.4
Indian Tamils 530,983 12.9 602,510 13.4 780,589 11.7 974,098 12.0 1,122,961 10.6 1,174,606 9.3 818,654 5.5 544,000 3.6
Sri Lankan 185,542 6.7 197,166 6.6 228,034 6.4 233,901 5.7 251,925 5.6 373,559 5.6 463,963 5.7 625,301 5.9 828,304 6.5 1,046,926 7.1 954,000 6.4
Indian Moors 32,724 0.8 32,923 0.7 35,624 0.5 47,462 0.6 56,913 0.5 27,420 0.2 - - - -
Burghers 17,886 0.6 21,231 0.7 23,482 0.7 26,663 0.6 29,403 0.7 41,926 0.6 45,950 0.6 45,944 0.4 45,376 0.4 39,374 0.3 41,000 0.3
Malays 8,895 0.3 10,133 0.3 11,902 0.3 12,990 0.3 13,395 0.3 22,508 0.3 25,464 0.3 33,430 0.3 43,459 0.3 46,963 0.3 46,000 0.3
Others 14,553 0.5 14,248 0.5 19,789 0.6 25,645 0.6 34,539 0.8 48,895 0.7 39,550 0.5 19,911 0.2 15,510 0.1 28,398 0.2 30,000 0.2
Source: Various reports of the Registrar General’s Department and the Department of Census and Statistics, Sri Lanka.a/ In the censuses of 1881, 1891 and 1901, the Indian Tamils were included in the Sri Lankan Tamils category, while the Indian Moors
were included in the Sri Lankan Moors category.

Religion
Table 2. Numerical and percentage distribution of population by religion, 1881-1994
1881 1891 1901 1911 1921 1946 1953 1963 1971 1981 1994
All religions 2,759,800 100 3,007,700 100 3,565,900 100 4,106,400 100 4,498,600 100 6,657,400 100 8,097,700 100 10,582,000 100 12,689,600 100 14,846,700 100 15,02l,500 100
Buddhist 1,698,100 61.5 l,877,000 62.4 2,141,400 60.1 2,474,200 60.3 2,769,800 61.6 4,294,900 64.5 5,209,400 64.3 7,003,300 66.2 8,536,800 67. 3 10,288,300 69.3 11,752,000 78.2
z-. Hindu 593,600 21.5 615,900 20.50, 826,800 23.2 938,300 22.8 982,100 21.8 1,320,400 19.8 1,610,500 19.9 1,958,400 18.5 2,238,600 17.6 2,297,800 15.5 1,127,800 7.5
Muslim 197,800 7.2 212,000 7.0 246,100 6.9 283,600 6.9 302,500 6.7 436,600 6.6 541,500 6.7 724,000 6.8 901,700 7.1 1,121,700 7.6 1,008,600 6.7
300” Christian 268,000 9.7 302,100 10.0 349,200 9.8 409,200 10.0 443,400 9.9 603,200 9.1 724,400 8.9 884,900 8.4 1,004,300 7.9 1,130,600 7.6 1,127,600 7.5
wE Others 2,300 0.1 700 0.0 2,400 0.1 1,100.0 0.0 800 0.0 2,300 0.0 11,900 0.1 11,400 0.1 8,200 0.1 8,300 0.1 5,500 0.0
B
2
iSource: Various reports of the Department of Census and Statistics, Sri Lanka.
3“E

The present study attempts to examine a number of objectives. First, itinvestigates the relative size of the various ethnic groups in Sri Lanka andchanges in them over past decades. Second, it compares fertility trends andlevels within each ethnic group, as well as ethnic differentials in levels andpatterns of fertility decline. Ethno-religious differences in the context of social,economic and cultural determinants of fertility decline among variouscommunities are also highlighted. Third, the determinants of fertility trends andlevels of various ethnic groups are investigated. Such an investigation throwslight on the demographic transition process under way and provides a betterunderstanding of the socio-cultural milieu determining the process of fertilitydecline in respect of the various ethnic identities. The determinants underreview in this study are those of age at marriage and contraceptive use withinthe different ethnic groups.
Ethnic groups in Sri Lanka and their origins
The origins of the Sinhalese, according to the historical chronicles,Mahawansa and Thupawansa, can be traced back to the early Aryan Period ofRig Vedic Janapadas in northern India. At that time, Prince Vijaya, exiled froma Janapada in northern India, migrated to Sri Lanka and started theSinhala Janapada in the north of the country.
The Tamils of Sri Lanka have their origins rooted in the Dravidians ofsouthern India, who migrated to Sri Lanka from time to time. They introducedsouthern Indian cultural patterns into Sri Lankan society and are located largelyin the northern and eastern parts of the country. A second wave of theDravidian population and their cultural traits came into the country when, inthe middle of the nineteenth century, the British imported Tamils to work onthe newly founded plantations in the central parts of the country. The latternow form a segment of the naturalized population located in the centralhighlands of Sri Lanka.
The origins of the Moors in Sri Lanka can be traced back to the earlyAnuradhapura period, when Arabian traders migrated to Sri Lanka and becamethe forefathers of the Moor Islamic culture. Those ancient Arab traders, calledYavanas or Yonas, are referred to in the Mahawansa. The Moor settlements aswell as the pre-Moor Arabian settlements, were initially located around theports of Sri Lanka.
At a later stage, other groups of Moors migrated to Sri Lanka from theMalabar coast of India and settled largely in the south-western quadrant of theisland. Census data pertaining to recent geographical locations of Sri LankanMoors show that they comprise a substantial proportion of the population in thedistricts of Colombo, Mannar, Batticaloa, Trincomalee and Kurunegala. Moor
Asia-Pacific Population Journal, September 2001 27

Religion
Table 3. Religious composition of ethnicity, 1981
EthnicitySinhalese Sri Indian Sri Burghers Malays Others
Lankan Tamils LankanTamils Moors
Buddhist 93.3 1.8 1.8 0.2 2.9 2.1 7.5Hindu 0.1 80.7 90.0 6.7 0.4 3.4 15.3Muslim 0.1 0.7 0.5 92.6 1.6 89.2 48.7Roman Catholic 6.1 14.3 6.2 0.4 79.3 2.2 11.6Christian 0.4 2.4 1.4 0.1 15.3 0.6 12.1Other 0.1 0.1 0.1 0.1 0.5 2.5 4.8Total % 100 100 100 100 100 100 100Total numbers 10,979,561 1,886,872 818,656 1,046,926 39,374 46,963 28,398
Source: Department of Census and Statistics, Sri Lanka (1986).
culture, as much as the cultures of other ethnic communities in the country, hasan ancient history and is woven into the cultural fabric of Sri Lanka.
The Malays, who arrived at a later stage in Sri Lankan history, have closeconnections with the Moors. Their origin can be traced back to Java; they arefollowers of Islam and are distributed throughout the island. The origins of theBurghers can be traced back to Western rule by the Portuguese and Dutch fromthe fifteenth to the eighteenth century. They are largely descendants of the civiland military employees of the former Western rulers.
Ethnic groups: their relative sizes
Tables 1 and 2 show the relative strength of the various ethnic groups inSri Lanka. The two groups that comprise the Sinhalese population, that is, thelow-country Sinhalese and the Kandyan Sinhalese, accounted for nearly 74 percent of the total population in 1981. In 1881, the Sinhalese accounted forapproximately 67 per cent of the total population. During the subsequent 100years, the Sinhalese community increased by 7 percentage points. In thetwentieth century, their proportionate share in the total population increasedfrom 65 per cent in 1901 to 74 per cent in 1981 (table 1).
The proportionate share of the Tamil community (both Sri Lankan andIndian) in the total population showed only a slight decline of 0.8 of apercentage point during the final decade of the nineteenth century. Neverthe-less, the percentage share of the community had increased to 27 per cent bythe beginning of the twentieth century. Subsequently, the proportionate share ofthe Tamil population declined to 18 per cent, according to the 1981 census.
28 Asia-Pacific Population Journal, Vol. 16, No. 3

In the final decade of the nineteenth century, the Moor populationcomprised about 7 per cent of the total population. However, the proportionateshare of this ethnic group declined to 6.4 per cent in the first quarter of thetwentieth century. From 1946 to 1981, the proportion of the Moor communityin the total population increased from 6.1 to 7.1 per cent. By 1971, the Moorsformed the fourth largest ethnic group in the country (table 1).
Calculations based on the census data presented in table 1 also show thatbetween 1946 and 1971 there was an overall population increase of 121.7 percent in the Sri Lankan Moor community while during the same periodthe overall increase for the Sinhalese population was 97.6 per cent. The rate ofpopulation increase among the Sri Lankan Tamils during the same period was94.1 per cent, although from 1911 to 1953 a steady growth in the Sri LankanTamil and Indian Tamil communities had been observed. Of the two ethnicgroups, the Indian Tamils was the largest at that time. Nonetheless, between1963 and 1971, Sri Lankan Tamils outnumbered Indian Tamils (table 1).
The 1911-1971 inter-censual increase in the Malay population wasrelatively moderate. For example, from 1911 to 1946, the increase was in theregion of 73.2 per cent, while from 1946 to 1971 it amounted to 93.1 per cent,showing that the inter-censual increase had been on the rise. Between 1911 and1946, the inter-censual rate of increase among the Burghers amounted to 57.2per cent, while subsequent censuses up until 1971 revealed a decreasing rate.That trend was substantiated by a very sharp drop in the rate to 8.2 per cent in1971. Malays comprised 0.3 per cent of the total population in the 1981 census(table 1). Despite being a minority, Malays have a stronger footing becausethey are aligned to the Moor community through the Islamic faith.
The declines seen in the population of the Sri Lankan Tamils and theIndian Tamils can be attributed to different sets of reasons. The former showeda rise in keeping with the growth rates prevalent in the country. Nonetheless, asignificant kink observed in the trends in 1994 was owing to the fact thata national census was not held in 1991 and the figures were drawn from theDemographic Survey of 1994. That survey did not cover the Northern andEastern provinces, the inhabitants of which are predominantly Sri LankanTamils. Apparently, the figures fail to portray the true picture. In accountingfor the rather significant declines observed among the Indian Tamils, thedeterminants are political rather than demographic, since the reversal waslargely due to the repatriation of Indian Tamils as agreed upon and concludedin October 1964 between the Governments of India and Sri Lanka under theSirima-Shasthri pact. Under the agreement, 525,000 persons of Indian originwere to be repatriated to India over a 15-year period. Hence, the consequentout-migration would account for the decline in their numbers.
Asia-Pacific Population Journal, September 2001 29

Ethnic groups and their fertility trends
The effective fertility of any society, observed through the number ofbirths that would have occurred during a given period of time, is influenced byvarious factors, such as the relative number of child-bearing females and males,their nuptial behaviour, attitudes towards child-bearing outside marriage,conception control practices and attitudes, the related sociocultural andbiological characteristics of the population, and, above all, the religiousattitudes of and health facilities available to the communities.
The rate at which a population adds to itself by births during any givenperiod of time is a measure of the fertility performance of that population. Thismeasure may be in relation to the total population of the country, a particularreligious or ethnic group, or a population representing a region of the urban andrural sectors. The fertility trends of Sri Lanka and its ethno-religious fertilitybehavioural differentials are discussed below, utilizing the various measures offertility.
Crude birth rate
The simplest and most common measure of fertility is the crude birth rate(CBR), which is defined as the number of live births for a given year per 1,000population. Usually, the mid-year population is taken as the denominator.CBRs for Sri Lanka and its various ethnic groups, computed on the basis ofmid-year data collected since the early 1960s, show the demographic transitionthat is in force in Sri Lanka and reflect a decline in the fertility levels of allethnic groups. Between 1955 and 1989, the CBR of Sri Lanka fell from 37.9 to21.6 per 1,000 population, indicating a decline of almost 40 per cent (table 4).It would be of interest to examine whether each ethnic group in Sri Lanka wasinvolved in this process of decline.
From 1958 to 1989, data for the Sinhalese, Sri Lankan Tamils, SriLankan Moors and Malays all indicated a similar percentage decline in CBR(table 4). The Burgher and Indian Tamil communities show a relatively lowlevel of decline in CBR during the same period. Throughout the referenceperiod, the Burghers recorded the lowest fertility of all the ethnic groups. Thelow percentage decline in fertility among the Indian Tamil community could beexplained by the fact that they started with a relatively low CBR and, for thatreason, only experienced a 23 per cent decline during the period under review.
In order to investigate the change in CBR among the different ethnicgroups during the 1980s, the percentage change from 1981 to 1989 wascomputed. During that period, the Sri Lankan Tamils experienced the highestdecline in CBR (25.9 per cent). The Sinhalese and the Sri Lankan Moorsreported declines that placed them in second and third positions, respectively,
30 Asia-Pacific Population Journal, Vol. 16, No. 3

Year
Table 4. Crude birth rate by ethnicity, 1955 to 1989
All Sinhalese Sri Sri Burghers Malays Indianraces Lankan Lankan Tamils
Tamils Moors1955 37.9 38.3 37.2 40.71956 36.4 36.8 35.4 41.01957 36.5 36.9 36.2 42.01958 35.8 35.8 37.7 41.81959 37.0 37.1 39.7 43.51960 36.6 36.5 38.8 42.71961 35.8 35.7 38.4 42.91962 35.5 35.0 39.7 43.91963 34.1 34.1 36.9 41.71964 32.2 32.7 37.2 42.91965 33.1 33.1 36.5 40.91966 32.3 32.1 35.4 42.31967 31.6 31.3 34.6 40.91968 30.0 32.2 33.7 40.91969 30.4 30.5 32.0 39.21970 29.4 29.2 31.5 38.81971 30.4 29.7 31.3 36.91972 30.0 29.5 31.0 35.61973 28.0 27.6 28.2 33.41974 27.5 26.8 28.8 32.21975 27.8 26.9 29.4 32.11976 27.8 26.7 29.9 32.81977 27.9 27.3 28.2 32.61978 28.5 27.8 30.2 32.91979 28.9 27.9 30.8 35.21980 28.4 27.3 31.7 33.21981 28.2 27.6 29.9 31.81982 26.9 26.3 27.2 31.31983 26.3 25.7 25.2 29.41984 25.1 24.3 24.3 27.81985 24.6 23.9 23.2 28.61986 22.4 21.6 21.3 27.31987 21.8 21.4 20.3 26.21988 20.7 20.1 20.9 24.91989 21.6 21.0 22.1 25.5Percentage change 39.7 41.4 41.2 39.0
1958-1989Percentage change 23.5 24.0 25.9 20.0
1981-1989
- -- --
26.2-36.5
- -- -- -- -- -- -- -20.7 29.619.9 26.519.1 26.419.0 25.517.5 23.222.9 27.2 30.521.9 24.5 29.520.3 22.8 28.017.4 24.8 29.717.5 20.817.6 22.3 31.317.4 20.8 30.615.5 20.715.3 19.1 32.114.6 20.0 31.219.4 18.1 30.025.3 20.2 29.718.2 18.9 33.719.5 17.2 34.720.5 24.1 33.517.6 21.4 30.220.2 23.4 26.116.2 21.8 24.018.8 21.6 24.428.2 40.8 23.4
3.4 -19.2 18.9
36.934.732.631.832.033.131.431.429.127.727.126.327.126.425.625.8
32.0
30.5
Source: Various reports of the Registrar General’s Department and the Department ofCensus and Statistics, Sri Lanka
Note: Crude death rates for different ethnic groups after 1989 cannot be computed dueto the lack of availability of relevant data.
Asia-Pacific Population Journal, September 2001 31

Figure 1. Crude birth rate, 1958, 1968, 1978 and 1988
45
40
35.-3z 30
g 25
zG 20
zP, 15
gu
10
5
0
41 8
‘I? ::-- Ia%
- f3 - Sinhalese 20 I
+ Sri Lankan Tamils- Indian Tamils+3 Sri Lankan Moors
-A- Malays
1958 1968 1978 1988
whereas CBR of the Burghers indicated the lowest decline (3 per cent). How-ever, the Malays, one of the smallest ethnic groups in Sri Lanka, reported anincrease in CBR, possibly due to their limited number (46,000 in the 1981census). Calculations based on such a small base population frequently tend toreport significant fluctuations in CBR.
These trends clearly indicate the extreme diversity in the fertility levelsthat prevailed half a century ago in the various ethno-religious communities inSri Lanka, but which was later narrowed down significantly (figure 1). Ethnicdifferentials of fertility reduction show that, commencing in the latter part ofthe 1950s, a significant decline occurred in fertility among the Sri LankaMoors. Nevertheless, by 1989, CBR of the Moor community was 25.5 livebirths per 1,000 population. That was the highest rate for any ethnic group inSri Lanka. The next highest CBR was reported for the Indian Tamils while theSinhalese and Malay groups each recorded 21 live births per 1,000 populationduring the same year.
Distribution of births by ethnic group
The distribution of the total population for the country by ethnic group isnot available for the period following 1989. Nevertheless, births reported by thedifferent ethnic groups are routinely recorded and published by the birthregistration system in Sri Lanka. Such data on live births, collected by theRegistrar General’s Department, has been used in this study in order toestablish the pattern of fertility change among the different ethnic groups.
32 Asia-Pacific Population Journal, Vol. 16, No. 3

Table 5. Number of live births by ethnicity, 1981, 1986, 1991 and 1995
Ethnicity 1981 1986 1991 1995 Percentage change(1981-1995)
SinhaleseSri Lankan TamilsSri Lankan MoorsIndian TamilsBurghersMalaysIndian MoorsOthersTotal
304,33652,31333,62530,959
953907-
700423,793
258,796 252,609 243,83543,556 46,356 44,20032,161 36,532 36,88424,987 18,611 16,057
723 803 747983 1,169 1,048236 123 73293 390 380
361,735 356,593 343,224
-19.88-15.51
9.69-48.13-21.6215.55
--45.71-19.01
Source: Various reports of the Registrar General’s Departmnet and the Department ofCensus and Statistics, Sri Lanka.
Table 5 shows that approximately 424,000 live births were reportedamong all ethnic groups in Sri Lanka in 1981. However, by 1995, the figurehad declined to 343,000. This trend indicates that Sri Lankan fertility, in termsof total live births, declined by 19 per cent between 1981 and 1995. However,it is necessary to investigate whether this declining trend is common to all theethnic groups in the country.
The number of live births reported by different ethnic groups, that is,Sinhalese, Sri Lankan Tamils, Indian Tamils and Burghers, from 1981 to 1995,shows a declining trend (table 5). A deviation in this trend is shown by the SriLankan Moors and Malays, among whom an increase in live births was recordedduring that period. The highest decline in live births during the same period,reported for the Indian Tamils, could be attributed to the process of repatriationand the consequent decline in their numbers from the 1970s (table 1).
Birth order
Apart from reckoning the age of the mother, another dimension of theanalysis of fertility is to look at the “birth order” of the child, with the aim ofunderstanding the behavioural patterns of fertility. For the purposes of analysis,the definition of the term “birth order” is the number of children born alive tothe mother, including the present child.
Fertility trends indicated by birth order analysis suggest that arelatively lower number of women in the present generation have moved tohigher parities compared with earlier generations. For the country as a whole,the percentage of first order births (when compared with all other orders ofbirth) increased from approximately 40 per cent in 1992 to 46 per cent in 1996,while the percentage of higher order births, such as seventh and over, showed asteady decline during the same period (table 6).
Asia-Pacific Population Journal, September 2001 33

Table 6. Percentage distribution of births by birthorder and ethnic group, 1992-1996
Year and ethnicityFirst Second Third Fourth Fifth Sixth Seventh
Birth order
and over1992
Sri LankaSinhaleseSri Lankan TamilsSri Lankan MoorsBurghersMalaysIndian Tamils
1993Sri LankaSinhaleseSri Lankan TamilsSri Lankan MoorsBurghersMalaysIndian Tamils
1994Sri LankaSinhaleseSri Lankan TamilsSri Lankan MoorsBurghersMalaysIndian Tamils
1995Sri LankaSinhaleseSri Lankan TamilsSri Lankan MoorsBurghersMalaysIndian Tamils
1996Sri LankaSinhaleseSri Lankan TamilsSri Lankan MoorsBurghersMalaysIndian Tamils
39.72 28.57 16.88 8.43 3.46 1.65 1.3042.06 28.91 15.95 7.35 3.21 1.43 1.0932.96 28.41 19.03 12.44 3.78 1.91 1.4734.72 25.44 18.66 10.45 4.90 3.05 2.7947.08 27.25 14.23 8.52 1.95 0.36 0.6143.14 32.55 14.76 5.38 2.52 0.87 0.7833.07 30.22 21.57 9.47 3.32 1.38 0.97
39.25 28.81 17.13 8.32 3.66 1.54 1.2940.88 29.28 17.02 7.41 3.12 1.31 0.9835.10 26.52 16.66 12.29 5.60 1.99 1.8434.31 26.52 17.75 10.25 5.44 2.81 2.9344.71 33.99 12.55 5.92 1.27 1.13 0.4242.83 33.76 14.34 5.07 1.85 0.78 1.3735.61 32.78 19.64 7.04 2.96 1.16 0.79
40.90 27.93 16.81 7.85 3.64 1.63 1.2442.56 28.74 16.50 6.96 3.03 1.31 0.8936.78 24.34 16.70 11.46 5.94 2.60 2.1835.83 25.58 18.77 9.82 5.30 2.75 2.5543.24 32.30 15.44 5.15 2.19 0.90 0.7742.04 32.61 14.73 6.72 1.73 1.08 1.0837.97 30.81 19.29 6.91 2.91 1.27 0.84
42.75 27.94 16.28 7.18 3.17 1.45 1.2445.48 28.78 15.59 5.99 2.40 1.03 0.7334.38 25.02 17.45 11.53 5.54 3.03 3.0535.63 25.82 19.09 9.66 4.89 2.52 2.3947.26 28.38 13.39 6.83 2.41 0.54 1.2046.33 28.41 14.87 5.82 2.57 1.05 0.9540.04 27.99 17.32 7.69 4.40 1.19 1.36
45.8548.1940.3337.3944.7749.1246.58
28.79 14.73 6.25 2.46 1.06 0.8629.38 14.10 5.08 1.84 0.79 0.6227.81 14.91 10.28 3.90 1.56 1.2126.13 18.32 9.32 4.60 1.40 2.0530.21 13.32 7.02 2.86 1.04 0.7830.51 12.00 5.49 2.05 0.47 0.3728.91 15.49 4.90 2.42 1.02 0.69
---Source: Various reports of the Registrar General’s Department and the Department of
Census and Statistics, Sri Lanka.
34 Asia-Pacific Population Journal, Vol. 16, No. 3

The analysis was pursued in order to identify whether individual ethnicgroups in Sri Lanka experienced the same pattern of fertility change in respectof birth order achievements. The percentage distribution of births by order ofbirths for some ethnic groups clearly indicates a substantial variation. For allthe years investigated, the frequency of births for some ethnic groups wasdifferent from what had been previously observed (table 6). The percentage offirst order births in 1992 was highest among the Burghers, followed by theMalays and Sinhalese, while the lowest percentage (33 per cent) was identifiedamong both the Sri Lankan and Indian Tamils (figure 2). In contrast, thepercentage of higher order births was relatively high among the Sri LankanMoors followed by the Sri Lankan Tamils. For example, about 21 per cent ofthe total Moor births in 1992 were reported as being fourth or higher orderbirths.
The analysis clearly established that all ethnic groups had contributed tothe process of fertility decline in Sri Lanka. The proportion of higher orderbirths for all ethnic groups declined between 1992 and 1996, while thepercentage of fourth or higher order births among the Indian Tamils declinedfrom 15 to 9 per cent. Even the Moors experienced a decline, from 21 to 19 percent, during that period, while the proportionate decline among the Sinhalesewas from 13 to 9 per cent.
By 1996, the relative contribution of first order births had increased forall ethnic groups. Sinhalese, Burghers, Malays and Indian Tamils all indicated ahigher percentage of first order births than any other birth orders. Only the SriLankan Tamils and the Sri Lankan Moors had a relatively low level of firstorder births. The achieved fertility behaviour of the different ethnic groups, asindicated by the birth order analysis, suggests that at present the highestfertility levels in Sri Lanka are experienced by the Sri Lankan Moor and Tamilethnic groups.
The level and change in ethnic fertility was further examined bycomputing the mean birth order for each ethnic group, which is reported inparentheses in figure 2. In 1992, the highest mean birth order, that is, 2.46, wasobserved for the Sri Lankan Moors, followed by 2.37 for the Sri LankanTamils. The estimate for the Sinhalese was 2.09, while the Burghers recordedthe lowest mean birth order.
The mean birth order for Sri Lankan Moors amounted to 2.32 in 1996,suggesting that they still had the highest fertility. The figure for the Sinhalesedeclined from 2.09 in 1992 to 1.88 in 1996. Only in the case of the Burgherswas a marginal increase recorded between 1992 and 1996; nevertheless, theirlevel of fertility remained low (figure 2).
Asia-Pacific Population Journal, September 2001 35

Figure 2. Percentage distribution of births by order and ethnicity
1992
(2.46) (2.37) (2.28) (2.09) (1.97) (1.95)
Sri LankanMoors
Sri Lankan IndianTamils Tamils
Sinhalese
1996
Malays Burghers
/1 (2.32) (2.19) (1.99) (1.93) (1.88) (1.84)
Sri LankanMoors
Sri Lankan BurghersTamils
IndianTamils
Sinhalese Malays
m First Second q Third 0 Fourth and over
Note: Figures in parantheses indicate the mean birth order per woman.
The relative contribution of the different ethnic groups to fertility decline,as reflected in the changes that occurred in the mean birth orders (figure 3),illustrates that the Indian Tamils experienced the highest decline in the changeof mean birth order among the different ethnic groups.
In that regard, Puvanarajan (1994) observed similar declining trends inthe fertility of Indian Tamils, which he attributed to negative factors, poornutritional levels and the resultant infecund state of the Indian Tamil women of
36 Asia-Pacific Population Journal, Vol. 16, No. 3

Figure 3. Percentage decline in mean birth order by ethnicity, 1992-1996
Indian Sinhalese Sri Lankan Sri LankanTamils Tamils Moors
Malays Burghers
childbearing age. However, the decline now observed is an outcome of thebeneficial effects of the amelioration programmes mooted thereafter, whichpaved the way for a healthy transition to lower fertility.
Figure 3 shows that the Indian Tamils experienced the highest decline, atover 15 per cent in mean birth order. The Sinhalese had the second highestdecline, while the Sri Lankan Tamils were in third position. Although thehighest figures for both 1992 and 1996 were recorded for the Sri LankanMoors, it is evident from figure 3 that there was a decline in fertility of about 7per cent among Sri Lankan Moors during the same period.
Child-woman ratio
A more useful and simpler summary measure of fertility, which isparticularly useful in projecting subnational populations, is the child-womanratio (the ratio of young children to women of reproductive age group at agiven period of time). A commonly used age category of women and childrenthat is applied to compute this ratio is the number of children aged under fiveyears and women who are aged 15 to 49 years. The ratio does not directly referto any actual number of births in the incidence of childbearing, but rather to thechild population between the ages of 0-4 years; assuming that the children wereenumerated correctly by age, they ought to be the survivors of births during thefive-year period preceding the census.
This ratio can be computed using census or large sample data. The datarequired to compute the child-woman ratio for the entire country, as well as thedifferent ethnic groups are presented in tables 7 and 8. In table 7, the
Asia-Pacific Population Journal, September 2001 37

Table 7. Distribution of population aged 0-4 years by ethnicity, 1963-1994
Year Total Sinhalese Sri Sri Burghers Malays Indian Othera/Lankan Lankan TamilsTamils Moors
1963 1,599,140 1,134,980 178,430 118,870 5,440 3,610 151,630 6,1801971 1,664,677 1,190,059 183,447 129,403 4,374 5,479 146,310 5,6051981 1,854,738 1,325,314 244,038 154,301 3,418 5,466 118,965 3,2361981b/ 1,562,389 1,284,689 62,304 97,486 2,842 5,268 106,915 2,8851994b/ 1,322,661 1,088,482 69,640 107,680 2,673 5,044 47,242 1,900
a/ Indian Moors included.b/ Excludes northern and eastern provinces.
population aged 0-4 years in different ethnic groups from 1963 to 1994 ispresented. Table 8 provides data on the female population aged 15-49 years forthe same period. In this regard, it should be noted that the last populationcensus was taken in 1981. Figures reported for 1994 were obtained from the1994 Demographic Survey, which did not cover the entire country since itexcluded the northern and eastern provinces.
Child-woman ratios computed for the period from 1963 to 1994 suggestthat, commencing from the early 1960s, there had been a gradual decline in SriLankan fertility. In 1963, for every 1,000 women aged between 15 and 49years there were 680 children aged 0-4 years (table 9). The ratio declined to489 per 1,000 women in 1981. If the 1963 figure is taken as 100 (680 = 100),the estimated figure for 1981, (when the last census was held in Sri Lanka) is72. The above analysis also confirms that during the 1963-1981 period SriLanka fertility, measured in terms of the child-woman ratio, declined by 28 percent.
Table 8. Distribution of female population aged15-49 years by ethnicity, 1963-1994
Year Total Sinhalese Sri Sri Burghers Malays Indian Othera/Lankan Lankan TamilsTamils Moors
1963 2,352,770 1,670,730 252,520 137,070 10,970 5,260 268,860 7,3601971 3,015,198 2,176,313 330,303 182,235 11,346 10,602 295,945 8,4541981 3,800,062 2,826,155 468,617 253,759 10,210 11,857 222,480 6,9841981b/ 3,301,118 2,768,953 131,329 168,040 9,036 11,493 205,739 6,5281994b/ 4,201,707 3,526,488 228,566 265,430 10,921 13,764 148,820 7,718
a/ Indian Moors included.b/ Excludes northern and eastern provinces.
38 Asia-Pacific Population Journal, Vol. 16, No. 3

Year
Table 9. Child-woman ratio by ethnicity, 1963-1994
Total Sinhalese Sri Sri Burghers Malays Indian Othera/Lankan Lankan TamilsTamils Moors
1963 680 (100) 679 (100) 707 (100) 867 (100) 496 (100) 686 (100) 564 (100) 840 (100)
1971 552 (81) 547 (81) 555 (79) 710 (82) 386 (78) 517 (75) 494 (88) 663 (79)
1981 489 (72) 469 (69) 521 (74) 608 (70) 335 (68) 461 (67) 535 (95) 463 (55)
1981b/ 473 (100) 464 (100) 474 (100) 580 (100) 315 (100) 458 (100) 520 (100) 442 (100)
1994b/ 315 (67) 309 (67) 305 (64) 406 (70) 245 (78) 366 (80) 317 (67) 246 (56)
Notes: The child-woman ratio is the ratio of young children (0-4 years) to women in thereproductive age group (15-49 years).
a/ Indian Moors included.b/ Excludes northern and eastern provinces.
The trend in fertility behaviour, as reflected in the child-woman ratiosafter 1981, was examined by using the data collected from the 1994Demographic Survey. Since the survey excluded the Northern and Easternprovinces, for the purpose of comparison a special computation was made ofthe child-woman ratio excluding the two provinces. As noted in column 1 oftable 9, the child-woman ratio declined from 473 to 315 per 1,000 womenduring the 1981- 1994 period. In other words it declined from 100 to 67. Theestimated child-woman ratio for Sri Lanka when the northern and easternprovinces were excluded was 473. This was found to be lower than thecalculated ratio for the entire country in 1981. This indicates that the northernand eastern provinces together demonstrated, on average, a slightly higher levelof fertility than the rest of Sri Lanka (De Silva, Gajanayake and Dissanayake,1986).
It would be interesting to examine whether the fertility decline in SriLanka during the past four decades was similar among all ethnic groups. Asnoted in figure 4 and table 9, the child-woman ratio was highest among theMoors in 1963, while the Burghers recorded the lowest ratio. Even in 1971, thesame pattern of fertility persisted among those communities.
In 1981, only 335 children were born per 1,000 Burgher women ofreproductive age, while 608 children were born per 1,000 women of the SriLankan Moor community. The figure for the Sinhalese, who comprise the mainethnic group, was 469 children per 1,000 women.
The supposition that the population in the northern and eastern provincesrepresents a higher level of fertility than the population living in other parts ofthe country is worth examining. Taking into consideration the ethnic variable in1981, estimates of fertility that exclude the northern and eastern provinces
Asia-Pacific Population Journal, September 2001 39

Figure 4. Child-woman ratio by ethnicity
867 1963
707 6 8 6 6 7 9
5 6 44 9 6
I~lLll,- - - -
Sri lankan Sri lankan Malays Sinhalese Indian BurghersMoors Tamils Tamils
Moors Tamils Tamils
r
608 1981
Note: The child-woman ratio is the ratio of young children (0-4 years) per woman in thereproductive age group (15-49 years).
40 Asia-Pacific Population Journal, Vol. 16, No. 3

Figure 5. Child-woman ratio for the entire country and excludingthe Northern and Eastern provinces by ethnicity, 1981
(4.6%)
Sri lankan IndianMoors Tamils
Sri lankanTamils
Sinhalese Malays
q Entire country q Excluding Northern and Eastern provinces
Note: Figures in parantheses indicate the difference in terms of percentage.
show that all the ethnic groups surveyed had experienced somewhat lowerlevels of fertility compared with the figures for the whole country (figure 5).Among all the ethnic groups, Sri Lankan Tamils and Sri Lankan Moorsreported the highest differences. In other words, Sri Lankan Tamils and SriLankan Moors who largely lived in the northern and eastern provinces in 1981reported higher levels of fertility than their counterparts in the rest of thecountry. Interestingly, the members of the Sinhalese community, irrespective ofwhere they lived, did not show any significant difference.
The level of fertility decline after 1981 among the different ethnic groupsin Sri Lanka is examined, using data presented in the last two rows of table 9.Each ethnic group indicated a substantial decline in fertility during the 1981-1994 period. Even though the Sri Lankan Moors and Malays had the highestlevels of fertility, both groups reported a steady decline. The Sri LankanTamils, Sinhalese and Indian Tamils demonstrated greater declines in fertilitythan did the other groups. For example, the decline in the child-woman ratio ofthose groups, taking 100 as the base, was at a low level of 64-67 in 1994.
However, the decline of the Sri Lankan Moors is not very different, asfertility dropped from the base 100 in 1981 to 70 in 1994. The Malaypopulation reported the smallest decline over that period (table 9).
A comparison of all five ethnic groups in terms of their fertility change ispresented in figure 6. The Sri Lankan Moors started with a very high level offertility in 1963, but had shown a significant drop by 1994. Nevertheless,
Asia-Pacific Population Journal, September 2001 41
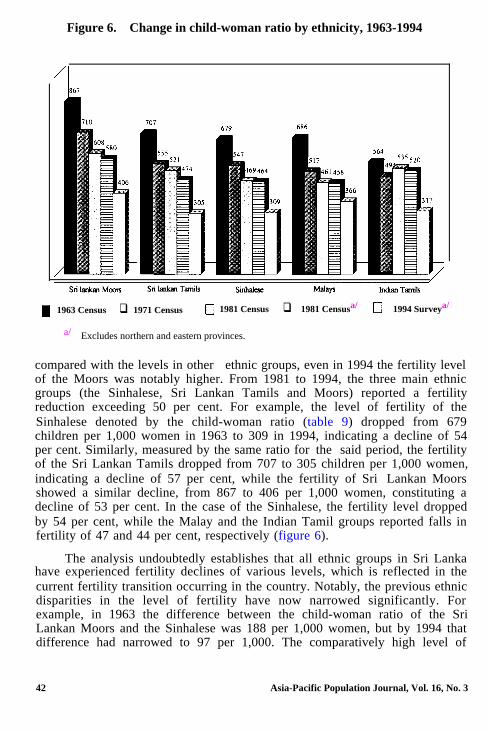
Figure 6. Change in child-woman ratio by ethnicity, 1963-1994
m 1963 Census q 1971 Census 0 1981 Census q 1981 Censusa/ 0 1994 Surveya/
a/ Excludes northern and eastern provinces.
compared with the levels in other ethnic groups, even in 1994 the fertility levelof the Moors was notably higher. From 1981 to 1994, the three main ethnicgroups (the Sinhalese, Sri Lankan Tamils and Moors) reported a fertilityreduction exceeding 50 per cent. For example, the level of fertility of theSinhalese denoted by the child-woman ratio (table 9) dropped from 679children per 1,000 women in 1963 to 309 in 1994, indicating a decline of 54per cent. Similarly, measured by the same ratio for the said period, the fertilityof the Sri Lankan Tamils dropped from 707 to 305 children per 1,000 women,indicating a decline of 57 per cent, while the fertility of Sri Lankan Moorsshowed a similar decline, from 867 to 406 per 1,000 women, constituting adecline of 53 per cent. In the case of the Sinhalese, the fertility level droppedby 54 per cent, while the Malay and the Indian Tamil groups reported falls infertility of 47 and 44 per cent, respectively (figure 6).
The analysis undoubtedly establishes that all ethnic groups in Sri Lankahave experienced fertility declines of various levels, which is reflected in thecurrent fertility transition occurring in the country. Notably, the previous ethnicdisparities in the level of fertility have now narrowed significantly. Forexample, in 1963 the difference between the child-woman ratio of the SriLankan Moors and the Sinhalese was 188 per 1,000 women, but by 1994 thatdifference had narrowed to 97 per 1,000. The comparatively high level of
42 Asia-Pacific Population Journal, Vol. 16, No. 3
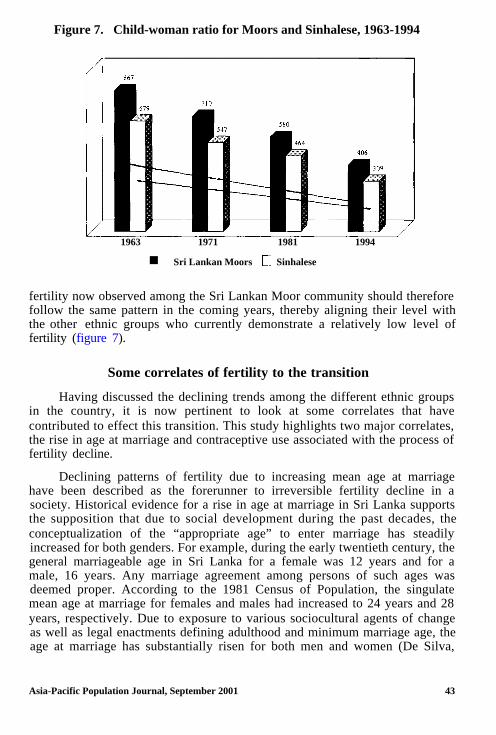
Figure 7. Child-woman ratio for Moors and Sinhalese, 1963-1994
1963 1971 1981 1994
n Sri Lankan Moors 0 Sinhalese
fertility now observed among the Sri Lankan Moor community should thereforefollow the same pattern in the coming years, thereby aligning their level withthe other ethnic groups who currently demonstrate a relatively low level offertility (figure 7).
Some correlates of fertility to the transition
Having discussed the declining trends among the different ethnic groupsin the country, it is now pertinent to look at some correlates that havecontributed to effect this transition. This study highlights two major correlates,the rise in age at marriage and contraceptive use associated with the process offertility decline.
Declining patterns of fertility due to increasing mean age at marriagehave been described as the forerunner to irreversible fertility decline in asociety. Historical evidence for a rise in age at marriage in Sri Lanka supportsthe supposition that due to social development during the past decades, theconceptualization of the “appropriate age” to enter marriage has steadilyincreased for both genders. For example, during the early twentieth century, thegeneral marriageable age in Sri Lanka for a female was 12 years and for amale, 16 years. Any marriage agreement among persons of such ages wasdeemed proper. According to the 1981 Census of Population, the singulatemean age at marriage for females and males had increased to 24 years and 28years, respectively. Due to exposure to various sociocultural agents of changeas well as legal enactments defining adulthood and minimum marriage age, theage at marriage has substantially risen for both men and women (De Silva,
Asia-Pacific Population Journal, September 2001 43

1997). The marriage laws have been amended to define the “lawful age ofmarriage” as 18 for both sexes. However, there are other non-demographicfactors that have contributed to delayed marriage in Sri Lanka, most notablyeconomic constraints (Puvanarajan, 1994).
Given the levels of stress prevalent in modem society it becomes sociallyand morally wrong for those of a very young age, and who need to beeducated, to be burdened with the stress and sexual responsibilities of marriageas well as early childbirth.
Women of the Sri Lankan Moor community have been exposed to theafore-mentioned process of sociocultural development, in keeping withpatriarchal-oriented social guidance. Consequent to such patrilinial guidance,Moor women were the least affected by the ongoing social change. Forexample, their singulate mean age at marriage (SMAM) was the lowest amongall other communities. Consequently, fertility differentials of ethnicity suggestthat the Moor community had experienced higher rates of fertility. Oneexplanation that has been put forward is that Moor women enter marriage at anearlier age than women in other communities and, therefore, are exposed toeffective fertility for a longer period of time than women of other communities.The mean age at marriage computed for various districts shows that it iscomparatively low for districts that constitute a higher proportion of the Moorcommunity (Department of Census and Statistics, 1986). For example, inAmapara, where 42 per cent of the district population are Moors, SMAM is21.8 years, while in Mannar, which has a 26 per cent Moor population, SMAMis 21.9 years. Batticaloa has a Moor population of approximately 24 per centand a SMAM of 22.3 years, while the Moor population in Trincomalee is 29per cent with a SMAM of 21.3 years. Nevertheless, it should be noted that themean age at marriage in those districts has increased during the past threedecades. This could be attributed to an increased exposure of Moor women tohigher education, thereby delaying marriage.
Moreover, awareness, acceptance and the use of various traditional andmodern family planning practices can be identified as important correlates ofirreversible fertility decline within the institution of marriage. Family planningwas introduced to Sri Lankan society during the 1950s with the help of theUnited Nations and local non-governmental organizations such as the FamilyPlanning Association, which initiated nationwide family planning projects(United Nations, 1976).
In the initial stage, when family planning was being introduced, strongresistance was voiced by various religious and political groups. Objectionswere put forward, especially against modern methods such as sterilization, thatdirectly affected the fertility component of population growth (De Silva, 1992).However, the catalysts that have brought about changes in the prevalent
44 Asia-Pacific Population Journal, Vol. 16, No. 3

pattern, such as educating the community about family planning, have gone farto clear up misconceptions about the use of various contraceptive methods.
Ethnic differentials in family planning acceptance reveal diversebehaviour. The current user rates of family planning methods among theSinhalese are higher than in the other communities. The lower user rates incommunities such as the Tamils and Moors indicate that family planning hasnot been practised to any great extent by them.
As reported in the 1982 Contraceptive Prevalence Survey (CPS), thehighest use of contraceptives was by the Sinhalese, at 60.2 per cent, while theMoors and others recorded the lowest rate of 37 per cent (Department ofCensus and Statistics, 1983). It should be noted that the 1982 CPS, which wasthe last survey in Sri Lanka, covered the entire country and provides estimateson ethnic differentials in contraceptive use. The other large surveys on fertilityand contraception, that is, the Demographic and Health Surveys of 1987 and1993, did not include samples from the northern and eastern provinces,where a significantly large proportion of Sri Lankan Tamils and Moors live.Therefore, estimates from those two surveys were not prepared for ethnicdifferentials in contraceptive use.
The difference observed in the ages at marriage among the ethnic groupsand the differentials shown in respect of adopting contraceptive practices maywell account for the ethnic disparities seen in fertility performance.
Policy implications
Sri Lankan society is diverse as it is composed of a multiracial,multireligious and multilinguistic population. Since the 1960s, the overallfertility of the country has shown a significant decline. However, a pertinentquestion is whether all ethnic groups are party to the fertility declining process.If all the groups have contributed to the decline, it has to be regarded as asuccessful outcome of the family planning programmes and activities that wereinitiated about five decades ago. Alongside the programmes aimed at curbingfertility, the ongoing social change in the country has enhanced the receptivityand acceptance rates of those efforts.
All the measures applied in the present study have established that allethnic groups in Sri Lanka have experienced significant fertility declines atvarious levels, as reflected in the current fertility transition occurring in thecountry. Over the past two decades, ethnic disparities in the levels of fertilityhave narrowed significantly. The two main factors that have directlycontributed to this decline among the ethnic groups is the increase in theaverage age at marriage and the increasing use of contraception. Although theMoor women seem to be least affected by ongoing social change, together with
Asia-Pacific Population Journal, September 2001 45

the other ethnic groups they have shown a marked increase in the average ageat marriage, a change observed particularly among the females.
The provision of free education since the 1940s and the associated changein aspirations, particularly among females, could be regarded as the mostpowerful single agent related to ongoing social change. It could stronglyinfluence further narrowing of the ethnic differences in fertility.
There have been claims that the population size of some ethnic groups isincreasing faster than others and that, consequently, the present ethnic balancein the country could change considerably. This argument has been levelled inparticular against the Moor community, whose level of fertility is still higherthan all other ethnic groups in the country. However, it has been demonstratedthat the Moors have also participated in the fertility transition, even thoughthey have been slower than the others to enter the transition process.
However, among all the ethnic groups in Sri Lanka there are pockets ofpopulation where a significantly higher level of fertility could be identified thatmay contribute to the concern among the other ethnic groups over high fertilitybehaviour and the consequent effect on the prevalent ethnic balance. Therefore,it is important from a policy point of view to identify such pockets of relativelyhigh fertility performance and implement specially designed family planningactivities suitable for such cultures in order to complement and strengthenacceptance of ongoing social change. This would be a step in the right directionas it would allay any misconceptions and concern among ethnic groups, whichcould be an impediment to ethnic harmony in the country.
ReferencesAbeykoon, A.T.P.L. (2001). “Demographic trends among major ethnic groups in Sri Lanka”, Sri
Lanka Journal of Population Studies, 4:27-39.
De Silva, W.I. (1997). “The Ireland of Asia: trends in marriage timing in Sri Lanka”, Asia-PacificPopulation Journal, 12(2):3-24.
(1994). “Ahead of target: Achievement of replacement level fertility in SriLanka before the year 2000”, Asia-Pacific Population Journal, 9(4):3-22.
(1992). “Do fertility intentions and behaviour influence sterilization in Sri Lanka?”Asia-Pacific Population Journal, 7(4):41-60.
I. Gajanayake and D.M.S.S.L. Dissanayake (1986). “Fertility levels and trends in SriLanka, 1971-1981”, Sri Lanka Population Digest, 1(3)11.
Department of Census and Statistics (1986). Census of Population and Housing 1981, AnnualReport, Vol. 3, Colombo.
(1983). Sri Lanka Contraceptive Prevalence Survey, 1982, Colombo.
Puvanarajan, P. (1994). “Social change and fertility transition in Sri Lanka”, unpublished Ph.D.Thesis, University of Durham, Department of Geography, Durham, United Kingdom.
United Nations (1976). Population of Sri Lanka, Country Monograph Series, No. 4 (Bangkok,Economic and Social Commission for Asia and the Pacific).
46 Asia-Pacific Population Journal, Vol. 16, No. 3

Gender Dimensions ofMigration in Kerala:
Macro and Micro Evidence
A subtle transformation has occurred among the wives of themigrants that will leave a lasting imprint on Keralan society
By K.C. Zachariah and S. Irudaya Rajan*
Women follow men in migration from Kerala; men follow women inmigration back to that State. Female migrants are better qualified than malemigrants, but a lower proportion of them obtain paid employment. Migrationcauses the separation of wives and husbands. The numbers are the same amongboth. Wives rarely migrate without husbands, but husbands migrating withoutwives accompanying them are more the rule than the exception. Men andwomen both have their own separate gains and losses arising from migration,but women are less capable of handling them without help from their spouses.
* K.C. Zachariah, Honorary Fellow, and S. Irudaya Rajan, Associate Fellow, both at theCentre for Development Studies, Thiruvanathapuram, Kerala, India.
Asia-Pacific Population Journal, September 2001 47

They have greater problems in dealing with the trauma arising from separation.For many, the trauma is worth the trouble, because, at the end of the day, theybecome well-equipped to face the world on their own. This article deals withthese and other gender differentials in migration. It is an analysis of howwomen differ from men in the migration process, in terms of levels, trends,characteristics and impacts.
Objectives and sources of data
This article is based on a large research project entitled “Migration fromKerala: Social, economic and demographic consequences”, undertaken by theCentre for Development Studies. This research was sponsored by the IndianCouncil for Social Science Research, New Delhi under its Indo-DutchProgramme on Alternatives in Development. In 1998, data for the study werecollected through a large-scale field survey covering 10,000 households from200 panchayats (village councils) selected at random from all the 14 districtsand all the 61 taluks (groups of villages) of the State.
The major objectives of the study included measurement of emigrationfrom Kerala and return migrants, study of the impact of migration onKerala’s demographic transition and on the elderly, women, employment,unemployment and several other economic aspects. One special area ofinvestigation in the study was the consequences of migration for women,especially women who are left by emigrant husbands. This article is concernedwith the consequences of migration on Keralan women.
The study collected information on four types of migrants: (a) emigrantsor usual members of a household who had emigrated out of Kerala and wereliving outside India at the time of the survey; (b) return emigrants or usualmembers of a household who had returned to Kerala after living outside Indiafor a year or more or a lesser period, if the stay outside was for the purpose ofstudy or work or looking for a job; (c) out-migrant or usual members of ahousehold who had migrated out of Kerala and were living outside the State(but within India) at the time of the survey; and (d) return out-migrants or usualmembers of a household who had returned to Kerala after living outside Kerala(but within India) for a year or more, or for a lesser period, if the stay outsideKerala was for the purpose of study or work or seeking employment.
The emigrants and out-migrants counted in this study had to have roots inKerala, otherwise there would be no one in Kerala to give information aboutthem. Migration within Kerala was not included in this study.
48 Asia-Pacific Population Journal, Vol. 16, No. 3

This article is divided into two parts. The first part brings together generalgender issues in migration based on the analysis of data from all 10,000households studied. The second part deals with an analysis of the data from aspecial survey conducted in selected districts (Thiruvanathapuram, Kollam,Pathanamthitta, Alappuzha, Ernakulam, Thrissur, Palakkad and Kozhikode) onthe special problems faced by women whose husbands are living away or havelived away from them as emigrants.
Review of literature
The Government of Kerala conducted three separate surveys at differenttimes to assess the international migration situation and has produced reportson the subject (Department of Economics and Statistics, 1982; 1987; 1994).Although no analysis of the survey data was produced as the data wereinaccessible to individual researchers, a few researchers have conductedmigration research on macro issues such as remittances, capital flows andreturn migration based on various official and unofficial documents producedby the Government of Kerala and India such as the Reserve Bank of India(Nayyar, 1994; Issac, 1997; Prakash, 1998). Some others have also conductedsmall-scale surveys to study the various aspects of migration (Prakash, 1978;Mathew and Nair, 1978; Nair, 1989). This is the first systematic migrationsurvey covering the entire State of Kerala (for more details, see Zachariah,Mathew and Rajan, 2001a; 2001b). Only one study exists in Kerala whichassessed the impact of male migration on women, However, this work is basedon an in-depth qualitative study of only 10 women in Kerala (Gulati, 1993).The census of India also provides data for analysing inter-state migration, butnot international migration (Zachariah, Mathew and Rajan, 2000). Thus, thislarge-scale survey was undertaken to assess international migration in Kerala.
Main findings
Sex differentials in migration
The total number (stock) of migrants in Kerala in 1998 (emigrants,out-migrants, return emigrants and return out-migrants) was 3,752,000; of thatnumber, women constituted only 654,000 or 9.6 per cent. However, their sharevaries considerably between internal and external migration (table 1).
In 1998, the total number of female emigrants was 126,000, out of a totalof 1,362,000, and the number of female return emigrants was 81,000, out of atotal of 739,000. Thus, for both emigration and return emigration, only one outof every 10 migrants was a woman; emigration from and back to Kerala isessentially a male affair.
Asia-Pacific Population Journal, September 2001 49

Table 1. Gender composition of Kerala migrants, 1998
A. Onward migrants Emi- Percen- Out- Percen- Total Percen-grants tage migrants tage tage
Males 1,235,426 90.7 524,796 75.9 1,760,222 85.7Females 126,528 9.3 166,899 24.1 293,727 14.3
B. Return migrants Return Percen- Return Percen- Total Percen-to Kerala emigrants tage out- tage tage
migrants
Males 58,733 89.1 678,494 70.8 1,331,227 78.7Females 80,512 10.9 280,332 29.2 360,844 21.3
Women have higher representation among internal migrants. Among theonward migrants, one in four is a woman, 167,000 females and 525,000 males.The number of female return out-migrants was 280,000, compared with679,000 males. Thus, females had a higher representation (29 per cent)among the return out-migrants.
Female return out-migrants exceeded female out-migrants by 113,000.Corresponding to every 100 female emigrants there were only 64 femalereturn-emigrants; on the other hand, corresponding to every 100 female out-migrants there were 167 female return out-migrants.
Female migrants by community
More than half the number of all emigrants were Muslims; however,Muslims contributed only about a quarter of the total number of femaleemigrants. The highest proportion of female emigrants was among the SyrianChristian community (27 per cent). Together with Roman Catholics, theChristian community contributed nearly half the number of female emigrants.Nairs had a relatively low proportion of females among the emigrants, butMuslims had the lowest proportion (table 2).
About one fifth of the emigrants from the Christian community werefemales. On the other hand, less than 5 per cent of the Muslim emigrants werefemales. The corresponding proportion among Nairs was not much higher.
Among the various communities, the highest proportion of femaleout-migrants to total out-migrants was among the Christians, totalling some 38per cent each among the Syrian and Latin Christians. The lowest proportionwas among the Muslims, at only 3 per cent. About one third of the femaleout-migrants belonged to the Syrian Christian community. On the other hand,less than 2 per cent were Muslims.
50 Asia-Pacific Population Journal, Vol. 16, No. 3

Table 2. Female and male migrants by community in Kerala
Percentage Females as
Males Females Totalpercentage of total
Emigrants by caste and religionScheduled caste/scheduled tribe 1.4 2.1 1.5 12.9Ezhawas 7.5 9.7 7.7 11.7Nairs 14.0 8.2 13.4 5.7Syrian Christian 10.6 21.2 12.1 20.8Roman Catholic 7.4 19.0 8.4 20.9Muslim 52.0 25.1 49.5 4.7Others 7.1 8.7 7.3 11.1
Total 100 100 100 9.3Out-migrants by sex and religion
Scheduled caste/scheduled tribe 4.9 4.5 4.8 22.6Ezhawas 21.2 18.1 20.4 21.4Nairs 24.2 14.3 21.8 15.9Syrian Christian 17.1 32.8 20.9 38.0Roman Catholic 8.9 17.7 11.0 38.8Muslim 15.6 1.5 12.2 3.0Others 8.2 10.9 8.8 29.9
Total 100 100 100 24.2
Destination of female migrants
The destination of the largest proportion of emigrants, both men andwomen, was Saudi Arabia. However, the proportion of females was smaller,totalling 21.5 for females, compared with 39.1 for males. The United ArabEmirates was next, Dubai alone accounting for 14 per cent. The otherdestinations in the United Arab Emirates were: Sharjha (8.2 per cent) and AbuDhabi (7.7 per cent). Kuwait, Oman, Qatar and Bahrain together accounted for31.8 per cent. The proportion of emigrants to the United States of Americaformed another 9.2 per cent.
In relative terms, the difference between males and females was thelargest in the case of emigration to the United States. While only 1.5 per centof males went to the United States, as many as 9.2 per cent of female emigrantswent to that destination. A similar situation was observed with respect toKuwait and Qatar. In many of the Persian Gulf countries, emigrant workers arenot given family visas for wives and children unless they earn a certain incomelevel set by the respective Governments. This greatly contributes, especially inthe Persian Gulf region, to the number of wives left behind at home (Zachariah,Mathew and Rajan, 2001). However, this is not true in the case of the UnitedStates, where there is family migration.
Asia-Pacific Population Journal, September 2001 51

The largest number of male and female out-migrants went to MaharashtraState. The principal determinant of the destination of female out-migrants wasthe destination of male out-migrants. The major destinations of out-migrantswere Maraharastra, Tamil Nadu, Karnataka and the city of Delhi. The largestmale-female differential was in Delhi. While only 7.7 per cent of maleout-migrants went to Delhi, almost twice as many (14.8 per cent) femaleout-migrants did so. Andhra Pradesh is another State in which the proportion offemale out-migrants from Kerala (6.1 per cent) was much higher than theproportion of male out-migrants (3.8 per cent)
Return emigration
The number of female return emigrants was estimated to be 81,000, orabout 11 per cent of the total number of return emigrants. Return female out-migrants numbered some 280,000, constituting 29.2 per cent of the total returnout-migrants. Thus, the number of return out-migrants was much larger than allother migration streams. The return out-migrants numbered 2.2 times thefemale emigrants, 1.7 times more than out-migrants, and 3.5 times more thanreturn emigrants. A comparison between the number of female out-migrantsand the number of female return out-migrants is particularly informative. Whilethe number of female out-migrants was only 167,000, as many as 280,000female out-migrants returned to Kerala.
Educational attainment of female migrants
Female emigrants were found to be better educated than male emigrants.As long as emigrants earn more money abroad compared to their counterpartsin Kerala, parents will approve the marriage of their educated daughters withless educated men. This is purely for economic reasons. Among those whoreported their educational attainment, 28.2 per cent had a degree, while thecorresponding proportion among male emigrants was only 9 per cent (table 3).While about 66 per cent of the female emigrants had passed the secondary levelof education, only 38 per cent of the male emigrants had attained that level.
Looked at from a different perspective, it was found that, of emigrants asa whole, 7.4 per cent were female; but among degree-holding emigrants asmany as 20 per cent were female. The male-female differential in educationalattainment by emigrants was 28.1 per cent.
Similar differentials were also noted among out-migrants (table 4).Female out-migrants had higher levels of educational attainment than males.About 21 per cent of the female out-migrants had a degree, compared with only11 per cent among male out-migrants. Among females, there was anapproximate 11 percentage point advantage with respect to only secondarylevel of education. However, the overall differential between male and female
52 Asia-Pacific Population Journal, Vol. 16, No. 3

Table 3. Distribution of Kerala emigrants bysex and educational attainment
Education level
IlliterateLiterate without schoolingPrimary (incomplete)PrimaryLower secondarySecondaryDegree
Males Females
0.7 0.71.0 0.73.3 5.4
11.4 3.445.2 23.529.4 38.39.0 28.2
100 100
(Percentage)Females as
percentage of total7.15.3
11.42.34.09.5
20.07.4
Note: Differential index = 28.1. This is the sum of the positive (or negative) differencesbetween the percentage distributions of male and female emigrants.
out-migrants was less than that among emigrants (only 20.4 per cent amongout-migrants, compared with 28.1 per cent among emigrants).
Economic activity
As expected, the economic activity rate was lower among females thanamong males. The same relationship held at all stages: before migration inKerala, after migration at the destinations and after return to Kerala. Thedifferential was largest among return migrants. Females tended to drop out ofeconomic activity after a stint at emigration or out-migration. At thedestinations, the gender differential among emigrants was only 45.3 per centbefore emigration, but as high as 76.3 per cent after return to Kerala.Similarly, the differential among out-migrants was only 31.3 per cent beforeout-migration, but as much as 64.8 per cent after return to Kerala. Thus,
Table 4. Distribution of Kerala out-migrants bysex and educational attainment
Educational level
IlliterateLiterate without schoolingPrimary (incomplete)PrimaryLower secondarySecondaryDegree
Males Females
0.9 0.0 0.00.8 0.4 16.71.2 0.9 16.77.2 4.3 14.5
34.2 17.8 12.744.8 55.8 26.211.3 21.0 34.5
100 100 22.1
(Percentage)Females as
percentage of total
Note: Differential index = 20.7.
Asia-Pacific Population Journal, September 2001 53

Table 5. Occupational distribution of Kerala males and femalesbefore emigration, at destination and after return
Before emigration At destination After returnMales Females Males Females Males Females
Government and semi-government 2.5 11.8 3.2 8.9 2.7 21.1Private sector 15.6 30.3 41.2 61.1 6.0 26.3Self-employment and unpaid 15.9 3.9 4.1 2.2 47.2 21.1
family workerAgricultural labourer 2.0 0.0 0.1 0.0 5.2 0.0Non-agricultural labourer 36.9 7.9 50.4 22.2 31.3 10.6Job seekers 27.1 46.1 0.5 5.6 7.6 21.1All occupations 100 100 100 100 100 100
emigration and out-migration tended to increase labour force participation byfemales. However, their return was associated with lower rates.
Sex differentials in occupation
Considerable sex differentials exist in the occupational profiles of thelabour force (those not in the labour force have not been included in thecalculation of rates). The proportion of the unemployed is much higher amongfemale emigrants as well as out-migrants. The same pattern of sex differentialsholds among migrants before migration, among migrants at their destination,and among return migrants. Similarly, the proportion of the labour forcein the private sector is higher among females before migration, aftermigration and after return to Kerala. Females are over-represented ingovernment and semi-government employment. On the other hand, femalesare under-represented in the labour force in self-employment, and amongagricultural and non-agricultural labourers (tables 5 and 6).
Table 6. Occupational distribution of Kerala male and femaleout-migrants, before emigration, at destination and after return
Before migration At destination After returnMales Females Males Females Males Females
Government and semi-governmentPrivate sectorSelf-employment and unpaid
family workerAgricultural labourerNon-agricultural labourerJob seekersAll occupations
4.7 4.0 21.7 15.2 14.6 20.58.7 11.2 38.0 69.7 8.9 6.39.4 4.8 10.9 3.0 31.0 22.3
1.0 0.0 0.0 0.0 7.6 8.923.0 2.4 27.5 4.5 30.5 7.153.1 77.6 2.0 7.6 7.6 34.6
100 100 100 100 100 100
54 Asia-Pacific Population Journal, Vol. 16, No. 3

Figure 1. Percentage of unemployed in Keralaby sex and migration status
80
z 70
8
i
60
3 50 n Males% 0 FemalesB 40
z8b
30
&20
Before At des- After Before At des- Afteremigration tination return out- tination return
emigration migration out-migration
Unemployment among females
Almost half (46 per cent) of the economically active female emigrantswere “job seekers” before emigration (figure 1). The corresponding percentageamong the males was only 27 per cent. The percentages were much lower atthe destination, but the differentials persisted: 5.6 per cent among females and0.5 per cent among males. Among the return emigrants, the level of unemploy-ment was higher, but the pattern of differentials persisted: 21.1 per cent amongfemales and 7.6 per cent among males. The pattern of sex differentials amongthe out-migrants was similar but at higher levels of unemployment.
Separation of spouses: excess of married women
One of the major impacts of migration on women was separation fromhusbands who emigrated or moved to other States in India, leaving their wivesand children at home.
The number of married men and women in the sample totalled 10,712and 12,253, respectively, giving an excess of 1,541 married females. Thedifference, as a proportion of the number of married women, that is, husband-
Asia-Pacific Population Journal, September 2001 55

Figure 2. Approximate percentage of Kerala wivesseparated from husbands, by age
20-29/27-36 25-34/32-41 30-39/37-46 35-44/42-51 40-49/47-56
Age in years
1 Husband-wife separation ratio
Note: These percentages assume that the husband is older than the wife by seven years,and that the husbands of women aged 20-29 years are all aged 27-36 years.
wife separation ratio (HWSR), was 12.6 per cent. Thus, a minimum of 12.6 percent of the married women in Kerala were living apart from their hus-bands. Applying the ratio to the total number of married females in the State,981,000 married women in Kerala were living apart from their husbands.
The extent of spousal separation varied considerably by age of the wife(figure 2), decreasing as age advanced. For example, it was about 24 per centamong women aged 20-29 years, but less than 15 per cent for higher agegroups. In about 15 per cent of the households, the number of married femaleswas higher than the number of married males. The percentage variedconsiderably from district to district and from community to community. Thehighest HWSR was in Malappuram district (28 per cent) and the lowest inIdukki district (1.7 per cent). The separation ratio was more than 30 per centamong Muslims and only 4.4 per cent among the scheduled castes.
In households where the number of married females exceeded the numberof married males, 69 per cent had migrants and 31 per cent had no migrants.Among households where the number of married males exceeded the numberof married females, only 6 per cent had migrants and 94 per cent had no
56 Asia-Pacific Population Journal, Vol. 16, No. 3

Table 7. Age distribution of Kerala “Gulf wives and husbands”(Percentage)
Age (years) Wife Husband
20-24 11.0 0.025-29 21.7 4.830-34 22.9 19.435-39 20.0 24.640-44 13.6 18.945-49 7.6 17.750+ 3.3 14.6Total 100 100Average age of wife 34.0 yearsAverage age of husband 40.9 yearsDifference 6.9 years
migrants. Viewed another way, among households with migrants, 67 per centhad more married females than married men. Among households withoutmigrants, only 6 per cent of the households had more married females thanmarried males. These figures indicate that migration was the major underlyingfactor for the existence of more married females than married males in manyhouseholds in Kerala.
“Gulf wives”
The term “Gulf wives” refers to married women whose husbands are, orhave been migrants. They include women whose husbands were migrants at thetime of the survey and whose husbands had returned after migration to thePersian Gulf countries. The consequences of migration for those women wouldbe different from those experienced by women in non-migrant households orwho had themselves been migrants. Therefore, a special survey was conductedin 8 of the 14 districts to elicit information on the consequences of emigrationon Gulf wives. Altogether, 891 women were included in this special survey. Alittle more than half the number were wives of emigrants (52 per cent) and thebalance (48 per cent) were wives of return emigrants.
Characteristics of Gulf wives
The Gulf wives were neither very young nor very old. Nearly 80 per centof them were in the 25-year to 40-year age group. The average age of wives ofreturn emigrants was slightly higher (35.7 years) than that of the wives ofcurrent emigrants (32.5 years). The largest proportion of wives of emigrantswas in the 30-year to 34-year age group, with the largest number of wives ofreturn migrants being in the 35 to 39 year age group (table 7).
Asia-Pacific Population Journal, September 2001 57

Table 8. Difference in age between husband and wife
Difference (years) Percentage
Less than 2 5.22-4 12.94-6 19.36-8 20.88-10 20.510-12 13.912+ 8.3
Total 100
The husbands of Gulf wives were, on average, seven years older. Thisdifference is slightly more than the average difference among the generalpopulation. There were no cases of a wife being older than her husband, butthere were a few cases (8.3 per cent) where the husband was older by morethan 12 years (table 8).
The average age of Gulf wives at marriage was 20.5 years, slightly lowerthan the State average, while the average age of their husbands was 27.5 years,slightly higher than the State average. The average was slightly lower amongwives of return migrants, compared with that of the wives of emigrants.Twenty-one per cent of the Gulf wives were married before the legal age of 18years, but only 1.5 per cent of the Gulf husbands were married before theywere 20 years old (table 9).
Table 9. Age at marriage of Kerala Gulf wives and husbands(Percentage)
Age at marriage (years) Wife Husband
Below 16 7.4 0.116-17 13.9 0.418-19 21.9 0.920-21 20.7 5.722-23 16.6 10.424-25 9.1 16.926-27 4.5 18.128-29 3.4 17.230-31 1.7 13.832-33 0.4 8.6Above 33 0.4 7.7
Total 100 100Average 20.5 27.5
58 Asia-Pacific Population Journal, Vol. 16, No. 3

Figure 3. Schematic diagram of the impact of migration on Gulf wives
Impact of migration on Gulf wives
The impact of migration on Gulf wives has. made itself felt in severalways, but principally through remittances and husband-wife physical separation(figure 3). Remittances have brought in considerable income to Gulf wives andtheir households. Increased income has led to several changes in lifestyle andconsumption patterns, such as ownership of land, housing and householdamenities; the nutritional and health status of the members of the households;social status, as reflected in the relationship of the family and the community;and the quality of children’s education. Women who had previously beenaccustomed to a protected lifestyle have been called upon to take charge of anumber of household tasks, both within the house and outside it, as a result oftheir husbands’ migration. Women who had been unaccustomed to handlinglarge sums of money have become responsible for the financial management ofthe household. They have had to open bank accounts and approach publicoffices for a variety of purposes. Women who have succeeded in taking on theadditional responsibilities have developed new expertise and self-confidence.They have become more autonomous and have risen in social status. Otherswho have failed to rise to the challenge have become targets of displeasureamong their husbands and other members of their families and have evendeveloped social and psychological problems.
Asia-Pacific Population Journal, September 2001 59

Table 10a. Adverse consequences of migration reportedby Gulf wives in Kerala in terms of choice
(Percentage)
Adverse consequences First choice 1-3 choices
LonelinessAdded responsibilitiesWorries about futureDebtLess securityChildren’s healthMental anxietyThings not done properlyLand disputeNo financial gainsDependent on others
Total
43.45.33.1
10.60.00.22.10.40.2
12.91.2
100
28.231.65.98.30.30.32.60.50.1
10.212.0
100
The impact of migration on women can be positive, negative or both,depending on the ability and background, as well as the family environment inwhich the women are placed. A starting point for examining the impact is pro-vided by the answers given by Gulf wives to the question about problems theyhave faced and the benefits they have received from the migration of theirhusbands. All the Gulf wives in the sample were asked a general questionabout the good and the bad things they had experienced as a result of themigration of their husbands. They were asked to list three good experiencesand three bad experiences in their order of importance. The answers on adverseexperiences are detailed in tables 10a and 10b.
Table 10b. First choice of adverse consequences of migrationreported by Gulf wives in Kerala by age group
(Percentage)Adverse consequences
LonelinessAdded responsibilitiesWorries about futureDebtLess securityChildren’s healthMental anxietyThings not done properlyLand disputeNo financial gainsDependent on others
Total
First choiceBelow 30 years
55.015.01.7
11.70.00.05.00.00.0
10.80.8
100
30+ years39.928.4
3.510.30.00.32.00.50.3
13.61.3
100
60 Asia-Pacific Population Journal, Vol. 16, No. 3

Adverse consequences of migration
As tables 10a and 10b indicate, loneliness is by far the leading problem,followed by added responsibilities, indebtedness owing to loans raised at thetime of emigration, inadequate fmancial returns from emigration, and anxiety.
Loneliness
In the multiple-choice question, 43 per cent of the women reportedloneliness as their most important problem. However, if the first three choicesare combined, the proportion who reported loneliness declines to 28 per cent,which is lower than the number of respondents who felt that “additionalresponsibilities” constituted their major problem .
More than half the number (55 per cent) of the younger wives (agedbelow 30 years) felt that loneliness was their main problem. Among the olderwomen the proportion was lower at only 40 per cent, but loneliness retained theleading position. Loneliness of wives is thus observed to be the mostimportant, but unfortunately, unavoidable consequence of emigration from theState.
Under the current pattern of emigration in Kerala, the separation ofmarried emigrant men from their wives lasts for several years. In this study, theextent of loneliness was reckoned in terms of three measures: (a) the number ofwomen living apart from their husbands; (b) the period of separation; and (c)the frequency of communication between husbands and wives.
In a previous section, it was indicated that 981,000 women (one out ofevery eight married women) were beset with the problem of living apart fromtheir husbands. Classification of wives by age indicated that the number ofmarried women aged 20-29 years was larger than the number of married menaged 27- 36 years by 24 per cent (the interval between the age at marriage ofmen and women was assumed to be seven years on average). The husband-wifephysical separation ratio decreased with the age of the woman, but it remainedat about 15 per cent even in the age group of 40-49 years. Thus, the problem ofseparation of wives from husbands was clearly more severe among youngerwomen than older women,
The length of separation is another measure of the HWSR problem. Table11 gives the distribution of Gulf wives according to the period of separation. Itshows that in 2.4 per cent of the Gulf wives, the husband emigrated within afew days of his marriage. In about 13 per cent, the husband emigrated within amonth after marriage. In a vary large proportion of cases (about 45 per cent),the husband emigrated in the first year of marriage. However, the departure ofthe husband occurred more than five years after marriage in about one third ofthe cases.
Asia-Pacific Population Journal, September 2001 61

Table 11. Interval between marriage and first emigration from Kerala(Percentage)
Interval between marriage and All women Women aged Women agedfirst migration (in months) below 30 years 30+ yearsLess than a month 2.4 2.7 2.31 10.1 12.5 9.22 12.7 20.1 10.03 7.7 14.7 5.24 3.7 6.3 2.85 1.4 1.8 1.36 months 2.0 2.7 1.87-12 3.6 2.7 3.912-24 7.7 14.7 5.224-36 6.5 5.3 6.636-48 4.8 4.9 4.748-60 4.0 2.7 4.560+ 32.0 5.8 41.5Husband migrated before marriage 1.3 2.2 1.0
Total 100 100 100
Younger women were affected by the separation problem more frequentlythan older women. In the case of half the younger women, the husbandemigrated within the first three months after marriage. The correspondingpercentage among the older women (aged above 30 years) was only 27 percent.
The main message to be drawn from the table is not completely contraryto the commonly held view. Our data support the commonly-held notion that inKerala, a fairly large number of Gulf brides were left alone by their migranthusbands within days or a month of their marriage. But for the majority, theemigration of the husbands occurred several years after the marriage.
The interval between the first emigration and the first homecoming isequally relevant in assessing the degree of loneliness of Gulf wives. The longerthe interval, the higher the degree of loneliness. The average interval is abouttwo years, but here again, the average masks the intensity of loneliness. Forexample, in more than 40 per cent of the cases, the interval was more than twoyears (table 12).
There is little that the husband or the wife can do, under currentconditions, to avoid physical separation. However, there are several ways ofmitigating the pain of separation and lessen the feeling of loneliness, such ascommunication and family and community networks. Periodic remittances,gifts and messages received from husbands through visits from friendsreturning on leave also help to lessen the severity of the problem.
62 Asia-Pacific Population Journal, Vol. 16, No. 3

Table 12. Distribution of “Gulf wives” in Kerala by the intervalbetween first emigration after marriage and first homecoming
Interval (months) Percentage
0-6 3.97-12 12.913-24 39.525-36 26.937-48 10.849-60 3.960+ 2.2
Total 100
Communication between a Gulfwife and her husband
One way to ameliorate a woman’s problem of loneliness, mental strainand misunderstanding is to have constant contact with her husband throughletters, telephone calls and other means of communication. In this matter, theGulf wives from Kerala are fairly well placed. Almost all Gulf wives indicatedthat they regularly communicated with their migrant husbands. They used allavailable means of communication, the most common being letters andtelephone calls. Nearly 70 per cent of the Gulf wives used both letters andtelephones for communicating with their husbands. The remaining women usedonly letters.
The majority of the husbands wrote letters at least once in two weeks.Another 36 per cent wrote once a month. The husbands called their wives bytelephone less frequently. Only 37 per cent of the respondents reported havingreceived telephone calls from their husbands. Thirty per cent had neverreceived telephone calls.
The frequency of letter writing by Gulf wives to their emigrant husbandsfollowed the same pattern as that of the husbands: 42 per cent wrote once intwo weeks and 34 per cent sent mail once a month. Thus, the frequency ofletter writing by the wife was dependent on the frequency of letters receivedfrom the husband.
Frequent communication links between husband and wife therefore play amajor role in easing the severity of loneliness and avoiding its extremeconsequences.
Increased responsibilities
“Increased responsibilities” was another common complaint of the Gulfwives. Tables 10a and 10b show that (all the three choices together) about 32
Asia-Pacific Population Journal, September 2001 63

per cent of the Gulf wives felt “added responsibility” to be their mainproblem; loneliness came second, with 28 per cent. However, if we considerthe first choice only, “added responsibilities” takes second place, as only 25per cent of the Gulf wives mentioned it as a problem. On the other hand, 43per cent mentioned loneliness as a problem. Among the younger women,“added responsibilities” was much less important, with only 15 per centmentioning it as a problem. Among the older women, the proportion washigher (28 per cent), but even among them, it stood only second to loneliness.Increased responsibility occurs in several areas, the most important amongthem being management of children’s education.
Education of children
One of the major additional responsibilities of Gulf wives that resultedfrom their husbands’ emigration was the management of their children’seducation. Before migration, the husbands were largely in charge of theirchildren’s education; after the husband’s departure, the wife had to take overthe responsibility.
Almost all Gulf wives had children. Nearly 80 per cent had two or morechildren, 3 per cent had four or more children. The average was, however,much smaller, at 2.2 children.
About 74 per cent of the women had children who were students. Most ofthe children were attending school classes 1 to 10. Nearly two fifths of themwere attending lower primary school. Thus, the children of Gulf wives fallwithin age groups that demand concentrated attention from their mothers.
About 41 per cent of the children were taking private tuition, whichnecessitated the mother arranging tuition and making arrangements for thetransportation of children to and from the place of tuition. Most of the studentstravelled to school on foot or by public transport. Travel in a family-ownedvehicle was limited to a small percentage of children. The majority of childrenattending private tuition travelled independently. However, in about 8 per centof the cases, their mothers took them to and from the place of tuition.
Most housewives helped their children with learning. Among the womenwhose husbands were, or had been, emigrants, more than 75 per cent helpedtheir children with their homework. This was seen as a major addedresponsibility.
Taking care of children’s education is not the only added responsibilitythey have taken upon themselves. Managing family finances and remittancesreceived from husbands, keeping contacts with husbands abroad and takingcare of the health of the members of the family are a few of the other addedresponsibilities.
64 Asia-Pacific Population Journal, Vol. 16, No. 3

Increased anxiety: problems with in-laws
About 6 per cent of the Gulf wives mentioned that one of the problemsarising from their husbands’ migration was a heightened anxiety level about thefamily and its future. About 3 per cent reported a high level of anxiety as theirmajor problem. Young Gulf wives were new to their husbands’ families, andhad little time to get to know them before their husbands’ departure onemigration. It is understandable that they encountered serious mental problems.With regard to the specific question of whether they had any problems within-laws, more than 25 per cent gave a positive answer.
Problems could also arise between the husband and the wife due to livingapart for several years at a stretch. However, only a very small proportion ofthe wives (2.1 per cent) mentioned that some misunderstanding had occurredwith their husbands. They did not, however, discuss the matter with strangers.
Another point of strain was misunderstandings with the family of thehusband. However, only 8.5 per cent mentioned that they had problems withmembers of the husband’s family. What little misunderstanding there wasmainly concerned financial matters.
One problem for the Gulf wife occurred during periods of illness offamily members, particularly in cases where there was no one else in the familyto take the sick person for medical consultation and treatment. This problemwas observed, however, to be more imaginary than real in most cases. In anoverwhelming majority (two thirds) of cases, the relatives had provided theneeded services. It had been the sole responsibility of the wife of the emigrantin only 31 per cent of the cases.
The effect of the absence of the father on the education of his children isalso likely to be serious. Indebtedness incurred in meeting the expenses ofhusbands’ migration and inability to repay the debt was another problem aboutwhich a significant number of women indicated concern.
Specific reference was made to the effect of migration on children. Only8 per cent of the women surveyed felt that because the father was away thechildren had become a problem to the mother.
Benefits from migration of husbands
As stated above, the women respondents were asked about the benefitsaccruing to them from the migration of husbands. According to 56.3 per cent ofthe women, financial gain was the leading benefit from emigration (table 13).
Seventy-five per cent of the women noted that the best part of theirhusbands’ emigration was the financial gain. Almost all the beneficial aspects
Asia-Pacific Population Journal, September 2001 65

Table 13. Distribution of Gulf wives in Kerala bygains accruing from emigration
(Percentage)Benefit All Young women Older women
Financial gain 56.3 64.7 53.1Able to own a house 21.7 19.5 30.2Able to own ornaments 1.6 0.8 1.8Able to buy land 1.2 1.5 1.2Able to improve nutrition 0.2 0.0 0.2Able to help relatives 2.6 3.0 2.5Able to pay back debt 6.0 9.0 5.1Improved lifestyle 1.8 0.8 2.1Better education 2.1 0.0 2.8Others 0.5 0.8 0.5
Total 100 100 100
of emigration were economic in nature: ownership of land and houses,acquisition of jewellery, ability to help relatives, capacity to clear debts, and soforth. The economic gains came mainly through remittances.
Remittances
In addition to the fact that most husbands wrote letters or made telephonecalls to their wives, they also sent remittances home on a regular basis. In the12-month period prior to the survey, 60 per cent of the Gulf wives had receivedremittances. The average amount received by way of remittance was Rs. 21,141(1997 exchange rate: approximately Rs. 46/US$ 1) when women who did notreceive remittances were included. However, the amount increased to Rs.34,924 when only those who received remittances were considered (table 14).
Table 14. Distribution of Gulf wives in Kerala byannual remittances received
Remittance per year Percentage of Gulf wives
Below Rs. 10,000 2.010,000-20,000 7.520,000-30,000 14.030,000-40,000 15.440,000-50,000 9.8Above 50,000 11.9Not sent 39.5
Total 100
66 Asia-Pacific Population Journal, Vol. 16, No. 3

Table 15. Distribution of Gulf wives in Kerala accordingto disposition of own incomes
Category of use First choice All choices
According to husband’s directions 50.7 19.7Routine consumption requirements of the family 14.9 11.1Emergency needs 9.1 13.5Savings 0.4 0.8Religious purposes 15.9 20.4Buying ornaments 8.9 25.7Other uses 0.1 8.7
Total 100 100
Most of the remittances were spent by the recipient wives in accordancewith the directions of their husbands (59 per cent). However, in about 35 percent of the cases, expenditure was made according to the recipients’ owndiscretion. This fact indicates the considerable degree of autonomy enjoyed bythe Gulf wives.
Women’s autonomy
The study collected several pieces of information regarding the autonomyof Gulf wives. One important aspect of female autonomy is the role of the wifein managing the finances of the household. In reply to the question of whomanaged the family’s financial matters, nearly 60 per cent of the women saidthat they did so themselves. Another 16 per cent said they followed theirhusbands’ directions. In about 22 per cent of the households, it was thehusband’s family who managed the household finances.
More than 50 per cent of the respondent Gulf wives had some property intheir name, either a house or a piece of land. About one third of them hadhouses. About 25 per cent some source of income of their own. Most of thepersonal income came from agriculture (43 per cent). The other major sourceswere wages (22 per cent) and salaries (17 per cent). Much of the money wasused for the routine consumption requirements of the household, meetingemergencies and religious purposes (table 15).
A fairly large proportion of the Gulf wives said they kept bank accounts(69 per cent), but only a few had joined chit funds or similar financialinvestment schemes. About 75 per cent made independent decisions on mattersof spending. In some cases, they consulted their husbands. In 10 per cent of thecases, permission was sought from the husband’s family.
Asia-Pacific Population Journal, September 2001 67

Conclusions
There are both positive and negative consequences for Gulf wives as aresult of their husbands’ emigration. On balance, the situation was clearlydefined by the respondent through their answers to the following two questionsconcerning the net effect of migration.
1. “Would it not be nice if your husband left his Gulf job and returnedhome? ”
Surprisingly, nearly 60 per cent of the women answered that they reallywished that their husbands would leave their Gulf jobs and return home. Forthem, the added responsibilities and the loneliness weighed too much. But forthe other 40 per cent of respondents, the economic benefits outweighed theburdens and privations resulting from the absence of their husband.
2. “lf you have a daughter of marriageable age, whom would you like herto marry? Somebody working in Kerala, somebody working in anotherState in India, or somebody working in the Gulf countries?”
Most of the respondents reported that they would like their daughters tomarry persons working in Kerala (an overwhelming 83 per cent). The nextchoice was for persons working abroad (14 per cent). Surprisingly, very fewwanted a husband for their daughters from among persons working outsideKerala but within India.
Thus, in spite of the huge increase in family income, women who hadgone through the trauma of separation from their husbands did not want theirdaughters to go through the same experience.
The reason given for opting for a person working in Kerala was the ideathat life in Kerala was more comfortable than anywhere else. Income was notthe main consideration. A job in Kerala was likely to provide a better futurethan a job outside Kerala.
The women who opted for sons-in-law working in Gulf countries were ofthe view that a Gulf job ensured a brighter future for the family. Surprisingly,economic considerations were not specifically mentioned as a factor in theirpreference patterns.
How to interpret these figures? Having gone through the experience as aGulf wife they appeared to have second thoughts about their husbands’emigration. It was acceptable from an economic point of view, but notacceptable when all the related factors were taken into consideration.
68 Asia-Pacific Population Journal, Vol. 16, No. 3

Those who had gone through the trauma of separation would prefer a jobin Kerala for their husbands. For them, all that glittered in the Arabian sandswas not gold. Considerable sacrifices had to be made on the part of themigrants themselves, as well as by their wives and children back in Kerala.
However, there is still another side to the whole question of balance.What is described above is the viewpoint of individual Gulf wives. The pictureis different from the viewpoint of society in general. More important than thevisible economic benefits to the Gulf wives, but partly as a result of them, arethe subtle changes in the level of their self-confidence and ability to get thingsdone in a man’s world. Loneliness, mental strain, hard work, minor problemswith in-laws and children all have to be faced; however, the Gulf wives willhave developed an innate capacity to get things done, not only within thehousehold but also in the community. The existence of International SubscriberDialling and email booths in every part of the State have proved to be veryuseful in preventing the problem of loneliness from getting out of hand. Thehusband may be absent, but his helping hand is close by at the other end of atelephone line. The husband’s absence, increased economic resources at thedisposal of the wife and the ability to communicate with him whenever neededhave all became instrumental in transforming a shy, dependent woman into aself-confident autonomous manager with a status equal to that of any man inthe neighbourhood. She has also gained a larger vision of the world around her.The subtle transformation that has taken place among the Gulf wives will leavea more lasting imprint on Keralan society than any of the material changes thatmigration has brought about.
Acknowledgements
This article is based on a larger project, “Migration from Kerala: Social,economic and demographic consequences”. The Centre for DevelopmentStudies sponsored the research and the Indian Council for Social ScienceResearch, New Delhi, under its Indo-Dutch Programme on Alternatives inDevelopment, provided the necessary funding.
References
Department of Economics and Statistics (1982). Survey on Housing and Employment(Thiruvanathapuram, Government of Kerala).
(1987). Report of the Survey on the Utilisation of Gulf Remittances in Kerala(Thiruvanathapuram, Government of Kerala).
Asia-Pacific Population Journal, September 2001 69

(1994). Report on Migration Survey 1992-93 (Thiruvanathapuram, Government ofKerala).
Gopinathan Nair, P.R. (1989). “Incidence, impact and implications of migration to the Middle Eastfrom Kerala”, in Rashid Amjad (eds.), To the Gulf and Back (New Delhi, ILO-ARTEP).
Gulati, L. (1993). In the Absence of Men: the Impact of Male Migration on Women (New Delhi,Sage Publications).
Issac, T. (1997). “Economic consequences of Gulf migration ” in K.C. Zachariah (ed.), Kerala'sDemographic Transition: Determinants and Consequences (New Delhi, Sage Publications),chapter 15, pp. 269-309.
Mathew, E.T. and P.R. Gopinathan Nair (1978). “Socio-economic characteristics of emigrantsand emigrants’ households: A case study of two villages in Kerala” Economic and PoliticalWeekly, vol. XIII, No. 28, pp. 1141-1153.
Nayyar, D. (1994). “Migration, remittances and capital flows: the Indian experience” (New Delhi,Oxford University Press).
Prakash, B.A. (1978). “Impact of foreign remittances: A case study of Chavakkad Villagein Kerala” Economic and Political Weekly, vol. XIII, No. 27, pp. 1107-1111.
(1998). “Gulf migration and its impact: the Kerala experience” Economic andPolitical Weekly, vol. XXXIII, No. 50, pp. 3209-3213.
Zachariah, K.C., E.T. Mathew and S. Irudaya Rajan (2000). Dynamics of Migration in Kerala:Dimensions, Differentials and Consequences (Thiurvanathapuram, Centre for DevelopmentStudies and Indo-Dutch Programme on Alternatives in Development).
(2001a). “Impact of migration on Kerala’s economy and society” InternntionalMigration 39(1):63-88.
(2001b). “Socio-economic and demographic consequences of migration on Keralasociety” International Migration 39(2):pp. 43-71.
Zachariah, K.C., B.A. Prakash and S. Irudaya Rajan (2001). Kerala Emigrants in the United ArabEmirates: Issues, Problems and Prospects, prepared for the Government of Kerala,Thiruvanathapuram.
70 Asia-Pacific Population Journal, Vol. 16, No. 3

Demographers’ Notebook
Demographic Impactof AIDS on
the Thai Population
By Orratai Rhucharoenpornpanichand Aphichat Chamratrithirong*
Thailand continues to feel the impact of a long-standing acquiredimmunodeficiency syndrome AIDS epidemic. Encouraged by the readyavailability of epidemiological and behavioural data, a number of modellingefforts have been undertaken in an attempt to understand the impact of theepidemic since 1990. However, as better models are developed and the courseof the epidemic changes, owing to behaviourial modifications as well asadvances in therapy, there remains an ongoing need to provide new estimatesand projections of the impact of AIDS on the Thai population. This paperprojects the important demographic parameters of population size and annualgrowth rate. In addition, mortality indicators such as the crude death rate, age-specific death rate, infant mortality rate, child mortality rate (1-4 years) and lifeexpectancy at birth are projected. These projections are made through acomparison of two scenarios: in the absence of AIDS and with AIDS. Thepaper concludes with a discussion of some of the potential social and economicimpacts of AIDS.
AIDS is recognized as a critical problem that will lead to increased adultand child mortality in many countries around the world, particularly in Africa,where HIV prevalence rates are high and mortality among adults is rising.However, the fact that many questions remain regarding the severity of theimpact of the AIDS epidemic mortality in the Thai population has encouraged
* Orratai Rhucharoenpornpanich, Academe of AIDS Control Division, BangkokMetropolitan Administration, 124/16 Krungthonburi Road, Klongsan, Bangkok 10600, Thailand;Aphichat Chamratrithirong, United Nations Population Fund, Country Technical Service Team forEast and South-East Asia, ESCAP. Any correspondence may be directed to the first author at thefollowing email address: [email protected]
Asia-Pacific Population Journal, September 2001 71

extensive modelling to clarify that impact. However, only a few studies havefocused directly on the impact on demographic processes (Brown and others,1994; Van Griensven, Surasaingsunk and Alessio, 1998; Wongboonsin andothers, 1997).
The extent of the impact of AIDS upon demographic processes dependson the degree of severity of the HIV/AIDS epidemic and the age pattern ofHIV infection among the adult population. Since AIDS victims are mostly inthe highly sexually-active age range, the potential exists for both fertility andeconomic productivity to be affected. This is true in the Thai setting, as can beinferred from the age pattern among reported AIDS cases, which shows that 90per cent are in the 20- to 49-year age group, with the peak age for developingAIDS coming between 25 and 34 years. In addition, over 80 per cent of AIDScases have acquired HIV through heterosexual transmission, showing that thetype and pattern of the HIV epidemic in Thailand has been driven byheterosexual transmission. This suggests that the HIV/AIDS epidemic affectsboth adult and child mortality.
In terms of impact, HIV prevalence among the general populationindicates the potential severity of the effect on the Thai population. Rates ofinfection on pregnant women attending antenatal clinics (ANC) can provide amajor source of information on HIV prevalence, which is useful for estimatingthe prevalence in the whole population. However, the quality of ANC data isbased on the quality of the sentinel sero-surveillance system. Therefore, it isnecessary to determine accuracy, both of prevalence data and the sentinelsystem, before undertaking the projections.
Accuracy of ANC data
Although ANC data have been collected from all provinces in Thailand,from 1989 to 1995 the sentinel sites for the population were based only inurban areas. Rural coverage only began in 1996 when the Ministry of PublicHealth expanded the sites to include community hospitals. The ANC data showthe prevalence level derived from rural sites to be lower than that of urbansites. This implies that national HIV prevalence derived from ANC data priorto 1996 may have been overestimated.
Variations in the method of data collection may affect the accuracy ofANC data. Some sites use an unlinked anonymous process, while other sitesuse voluntary confidential testing for collecting blood tests. The latter methodtypically results in much larger sample sizes, leading to a high level ofdiversity in sample sizes among the sites. Since such variations can result inunder- or over-representation of prevalence, some adjustment is required.
The initial adjustment to reduce bias is made by using median prevalenceinstead of mean prevalence when representing national HIV prevalence. By
72 Asia-Pacific Population Journal, Vol. 16, No. 3

Figure 1. Weaknesses in ANC prevalence data from sentinelsero-surveillance system and adjustments
Weaknesses Adjustments
Whole populationAge-sex structure ofpopulation, age ratioof HIV cases
Age-sex structure ofpopulation, sex ratioof HIV cases
Age-specific fertilityof HIV infected anduninfected women
Attendance bias age, sex,locality socio-economicstatus, education etc.
All pregnantwomen
- Pregnant womenattending ANC
clinics
Percent age-sex distri-bution of HIV infections
Male-female ratios
Rely on assumption thatfertility between HIV-infected and uninfectedwomen are similar
Use median prevalence
Source: Adapted from UNAIDS (1999) . Trends in HIV incidence and prevalence: Naturalcourse of the epidemic or results of behavioral change? UNAIDS in collaboration with WelcomeTrust Centre for the Epidemiology of Infectious Diseases, UNAIDS/99.12E.
using the median approach, the effect of outliers in the sample among sites isreduced (Schwartlander and others, 1999). This adjustment also reduces urbanbias, lowering the estimated prevalence outside urban areas.
Another weakness of ANC data is that, if not adjusted, such data cannotrepresent the prevalence for all women or the general population. The age-sexdistribution of HIV prevalence can be used to adjust the ANC data in order toprovide an estimate of the HIV prevalence for the overall adult population. Thedata required are the female-to-male ratio of HIV infection and the agedistribution of HIV infection, while the adjustment for the difference in theage-specific fertility rate between infected and non-infected women relies onthe assumption that they are similar. The weaknesses in, and adjustments to,ANC data are illustrated in figure 1.
Asia-Pacific Population Journal, September 2001 73

Figure 2. Epidemiological curve of the Thai AIDS epidemicfor 1985-2010, with and without smoothing
tWitbut smoothing t Third smoothing
Methods used for projection
The method of projection used for this study involves two main steps.The first is to estimate and project HIV prevalence for adults. The second stepinvolves using the model to estimate and project the magnitude and mortalityimpact of HIV/AIDS on the Thai population.
Procedure for estimating and projecting HIV prevalence
Prevalence estimates require two basic inputs. First, the year the epidemicbegan and the point prevalence estimates for 1985-1999. The starting year ofthe Thai epidemic is generally taken to be 1985 and the point prevalenceestimates are based on median prevalence derived from ANC data. Theprevalence over time and the starting date of the epidemic are then used todetermine the epidemiological curve of prevalence that best describes the HIVepidemic in Thailand. A three-year moving average is used to create the Thaiepidemiological curve. These new values of prevalence derived from thistechnique are used as the prevalence estimates for 1985-1999 (figure 2).
The prevalence during the period 2000-2010 was projected and illustratedusing two scenarios, based on the assumption that prevalence would slightlydecline until the end of the projection periods. The first scenario, derived fromforecasting the trend, assumed that the prevalence would decline slightly at alinear rate to 1.27 per cent by 2010. The second scenario showed a faster rateof decline, with a decrease to 1 per cent by the end of the projection periods.Such a rate came from the Ministry of Public Health objective of controlling
74 Asia-Pacific Population Journal, Vol. 16, No. 3

Figure 3. Comparison of two scenarios of HIV prevalence, 2000-2010
HIV infection among pregnant women at no higher than 1 per cent (Ministry ofPublic Health, 1997). However, the first scenario was chosen to represent themost feasible picture of the Thai epidemic (figure 3).
Projecting the demographic impact of AIDS
The models used to produce the estimate and projection weredemographic projections and the AIDS Impact Model (AIM) (Stover, 1997 and1999). The first model was used to prepare a population projection as the basisfor the HIV/AIDS calculations, while the second model was used to project thepast and future course of the HIV/AIDS epidemic in the population. Thesemodels was the latest version of a computer program prepared in 1991 incollaboration with the Futures Group International and Family Health In-ternational, under the AIDS Technical Support and AIDS Control andPrevention Projects. The latest version (1.52), revised by John Stover, was usedfor this study.
The impact of HIV/AIDS on the demographic process was assessed bycomparing estimates and projections that make allowance for the impact ofAIDS with those that hypothetically exclude AIDS. The estimates andprojections were made in several steps. First, the model was used to estimatethe annual incidence of the disease on the basis of the estimate and projectionof prevalence; that is, the annual number of newly infected individuals wasderived from the information on the total number of HIV positive individuals atparticular points in time. Second, with an assumption about the probability of
Asia-Pacific Population Journal, September 2001 75

progressing from HIV to AIDS and from AIDS to death, the model was used toestimate the annual number of deaths caused by AIDS.
The estimated number of paediatric HIV cases is necessarily based on theassumption about the proportion of HIV cases that occur among women, thelikely age distribution for the total number of infected women and a set ofage-specific fertility rates. On the basis of these assumptions, and assuming25.7 per cent to be the average percentage of children in the Thai setting whoare born to HIV-positive women and who will themselves be infected, thenumber of new paediatric HIV-positive cases expected per year is calculated bythe program.
The mortality impact of AIDS on demographic parameters is thencalculated. The impact will be illustrated in terms of important demographicparameters of population size, annual growth rate and mortality indicators, suchas the crude death rate, age-specific death rate, infant mortality rate, childmortality rate and life expectancy at birth. The impact is displayed through acomparison of two scenarios: the absence of AIDS and with AIDS.
Assumptions about disease progression ratesand vertical transmission
Data on the rates of disease progression are still scarce in Thailand andthere is little knowledge about the incubation period among Thai HIV-infectedpersons. Two cohort studies in Thailand related to the rate of diseaseprogression were undertaken among female sex workers and militaryconscripts. Those studies only suggested that the median survival time fromHIV to AIDS deaths might be more than seven years. However, individualsincluded in specific cohort studies were aware of their HIV infection andtherefore might not be representative of the general population of HIV-infectedpersons, many of whom were unaware of their infection. The progression rateamong those who did not know they were infected could be expected to beequal to, or slower than the rate among those who enrolled in the cohortstudies.
Moreover, the specific progression rates need to be based on judgementsabout access to and the quality of the health-care system. The slower rate of 10years or over may best represent progression in Western countries with goodhealth-care systems. However, the progression rate among Thais may not be asslow as those in developed countries. Therefore, we set the median time of theexpected progression rate from HIV to AIDS at approximately eight years forinfected Thai adults and 2.5 years for children. The survival time from AIDS todeath is assumed to be approximately one year, for both adults and children.
76 Asia-Pacific Population Journal, Vol. 16, No. 3

Vertical transmission has also seen substantial variation in the overallrates between developing and industrialized countries. In countries where breastfeeding is the norm and access to obstetric care is lower, vertical HIVtransmission is expected to be 35 per cent (Schwartlander and others, 1999). InThailand, where voluntary HIV counselling and testing was introducedcomparatively early and more mothers have therefore been made aware of theirinfection, the approximate rate of 25 per cent is appropriate. Some studies inThailand have found relatively high rates of HIV transmission from mother tochild that varied between 24.2-35 per cent among the regions. The highest ratewas found in the northern region (Brown and others, 1995) while the lowestrate was recorded in Bangkok (Chotpitayasunondh and others, 1994; Shafferand others, 1999; Wasi, Chearskul and Roongpisuthipong, 1995). The rate of25.7 per cent is the average expected value from the studies.
Age-sex distribution of HIV infection in theThai population and fertility rates
Calculating the number of HIV-infected children and AIDS orphansrequires data on the age distribution of HIV-infected women and age-specificfertility rates. The age-distribution for HIV-infected women is derived fromreported AIDS cases, while the age-specific fertility rate is based on projectionsmade by the National Economic and Social Development Board WorkingGroup (1995) and the Survey of Population Change undertaken by the NationalStatistical Office (1997). These data are used, together with estimates ofprevalence among women and the rate of vertical transmission, to produce thenumber of infected children and AIDS orphans.
The assumption about the percentage reduction in fertility for HIV-infected women is related to the impact of HIV/AIDS on children. Recentstudies in Africa have shown a reduction in fertility among HIV-infectedwomen, but no data are available for Thailand. Data from the sero-surveillancesystem collected among women attending ANC clinics, provide informationshowing that the proportion of infected women with 1-2 children is parallelwith those women who were primigravida (Division of Epidemiology, 1999).This information suggests that the expected reduction in fertility amonginfected women in the Thai setting, where low fertility is the norm, should beless limited. Therefore, we assume that the fertility of HIV-infected womenwill be 10 per cent lower than that of non-infected women.
To estimate the impact of AIDS on the infant mortality rate requiresinformation about the proportion of infants with AIDS that die in the first yearof life. This information is used to calculate the number of infected infants whohave developed AIDS in their first year and will die before their first birthday.
Asia-Pacific Population Journal, September 2001 77

Figure 4. Number of people living with HIV/AIDS in Thailand, 1985-2010
1985 1987 1989 1991 1993 1995 1997 1999 2001 2003 2005 2007 2009
-tScenario 1 +Scenario2
The proportion of children who will develop AIDS and die in that year is set atapproximately 0.67. Such a value is used as the best estimate, based oninternational literature, and is applicable to any country (Stover, 1997 and1999).
Results
The results of the two scenarios are presented in figures 4-6. Acomparison of the estimates and projections for the with- and without-AIDSscenarios shows that the disease has already affected the Thai population.
Figure 5. Annual number of AIDS deaths in Thailand, 1985-2010
1985 1987 1989 1991 1993 1995 1997 1999 2001 2003 2005 2007 2009
--t Scenario 1 + Scenario 2
78 Asia-Pacific Population Journal, Vol. 16, No. 3

Figure 6. Cumulative AIDS deaths in Thailand, 1985-2010
1985 1987 1989 1991 1993 1995 1997 1999 2001 2003 2005 2007 2009
q Scenario 1 m Scenario 2
In the fist scenario, the number of people living with HIV/AIDS inThailand climbed rapidly from 1987 to 1995, reaching a peak of more than600,000, or around 1 per cent of the population during 1996 and 1997.Subsequently, the number of infected persons is projected to gradually declineto less than 600,000 by 2005 and to just over 500,000 by 2010.
In the second scenario, the projected number of infected persons is lowerafter 2000 because the prevalence is assumed to fall more rapidly than in thefirst scenario. This scenario produces approximately 100,000 fewer infectedpersons by 2010 (figure 4).
The projected number of AIDS deaths is shown in figure 5. In the firstscenario, the number is projected to increase rapidly to approximately 60,000per year from 2000 to 2005, then decline slightly to approximately 50,000 by2010. The second scenario produces some 6,000 fewer AIDS deaths by 2010.
According to data on cumulative AIDS deaths in Thailand (figure 6),there were approximately 300,000 AIDS-related deaths from the beginning ofthe epidemic until the end of 2000. More deaths occurred among males thanfemales, with the ratio being around 2.5:1. It is projected that this ratio willdecrease to approximately 1.6:1 by 2010. The cumulative number of AIDSdeaths among the Thai population is projected to reach nearly 900,000 by theend of the projection period. If the prevalence falls more rapidly as in thesecond scenario, that number will be reduced to approximately 25,000 by 2010.
Asia-Pacific Population Journal, September 2001 79

Figure 7. Population size in with- and without-AIDS scenariosfor Thailand, 1985-2010
+NoAIDS -@- With AIDS
Demographic impact of AIDS
The impact of AIDS on the demographic process in Thailand can beillustrated by population size, annual growth rates and mortality indicators suchas the crude death rate, age-specific death rate, infant mortality rate, childmortality rate and the life expectancy at birth. These parameters are projectedthrough a comparison of scenarios for absence of AIDS and with AIDS.
It is now clear that the mortality impact of the AIDS epidemic on theThai population has been substantial. However, comparisons of the estimatesand projections of with- and without-AIDS show that the disease has had amore limited effect on Thai population dynamics.
Population size and annual growth rate
Figures 7 and 8 present the projected population sizes and annual growthrates for the with- and without-AIDS scenarios for 1985-2010. The differencebetween the projections indicates that by 2010 the cumulative impact of AIDSwill result in the population size being 1-2 per cent lower than it would havebeen in the absence of AIDS. Although the impact of AIDS on population sizedoes not appear large when examining the total population, the effect on theincrease over the period 2000-2010 is, in fact, substantial. This can be seenfrom an examination of population growth-rate projections.
The data shown in figure 8 indicate that the with-AIDS scenario results ina growth rate that is substantially displaced by approximately three yearscompared with the scenario without AIDS. For example, in the presence ofAIDS, the growth rate in 2000 was approximately equal to the expected growthrate in 2003 without AIDS.
80 Asia-Pacific Population Journal, Vol. 16, No. 3

Number of deaths
The impact of AIDS is projected to be most severe in Thailand when thefocus shifts to mortality. The total annual number of deaths in 2010 isprojected to be 17 per cent higher under the AIDS scenario compared with thenon-AIDS scenario. By the end of the projection period, AIDS is projected toresult in approximately 50,000 more deaths per year than would have occurredin the absence of AIDS (figure 9).
Figure 9. Total deaths in the with- and without-AIDSscenarios in Thailand, 1985-2010
320 l l l l l l l ,,,,,,,,,,,,,,,,,,,,,1985 1987 1989 1991 1993 1995 1997 1999 2001 2003 2005 2007 2009
+ No AIDS -[]- With AIDS
Asia-Pacific Population Journal, September 2001 81

Figure 10. Crude death rate in with- and without-AIDSscenarios in Thailand, 1985-2010
Crude death rate
In the absence of AIDS, the crude death rate is expected to decline from 7deaths per 1,000 during 1985-1990 to 5.5 per 1,000 at the end of the projectionperiod. AIDS will result in the crude death rate remaining at approximatelyseven deaths until 2000. The percentage difference of the crude death rateaccording to the with- and without-AIDS projections will peak during 2000-2005, when AIDS will be responsible for an increase of approximately 17 percent in the crude death rate. At that point, the crude death rate is projected tobe around 7 deaths per 1,000 with AIDS, instead of 6 deaths per 1,000 withoutAIDS (figure 10).
Age-specific mortality rate
The impact of AIDS on the age-specific mortality rates in Thailand isshown in figure 11. The greatest impact is in the group of highest sexualactivity, aged between 25 and 39 years. The increase in mortality rates in thatgroup is quite large, with a peak between the ages of 30 and 34 years.
Life expectancy at birth
Life expectancy at birth is a measure for indicating the average number ofyears that a newborn child can expect to live. Even in the presence of AIDS,life expectancy is projected to increase until the end of the projection period.However, for the years 2000-2005, life expectancy is estimated at 71 years, orthree years less than without AIDS. In addition, levels are expected to remainunchanged until the end of the projection period (figure 12).
82 Asia-Pacific Population Journal, Vol. 16, No. 3

Figure 11. Age-specific mortality rates with andwithout AIDS in Thailand, 2000
0-4 5-9 10-14 15-19 20-24 25-29 30-34 35-39 40-44 45-49 50-54 55-59 60-64 65-69 70-74
+ No AIDS -o-With AIDS
Infant and child mortality
Approximately 25 to 33 per cent of children born to HIV-positive womenare likely to acquire the infection from their mothers. Paediatric HIV infectionis expected to have a substantial impact on mortality during infancy andchildhood, particularly among children aged 1-5 years.
Even in the presence of AIDS, infant mortality is projected to declinefrom 39 deaths among infants aged less than 1 year per 1,000 live births
Figure 12. Life expectancy at birth with and without
78
76
74
72
70
$ 68
66
64
62
60
AIDS in Thailand, 1985-2010
1985 1987 1989 1991 1993 1995 1997 1999 2001 2003 2005 2007 2009
q No AIDS n With AIDS
Asia-Pacific Population Journal, September 2001 83

Figure 13. Infant mortality rate with and withoutAIDS in Thailand, 1985-2010
25
1985 1987 1989 1991 1993 1995 1997 1999 2001 2003 2005 2007 2009
Cl No AIDS m With AIDS
between 1985 and 1990 to 12 per 1,000 live births from 2005 to 2010. Even inthe absence of AIDS, a similar decline to 11 per 1000 is expected by the end ofthe projection period (figure 13).
Child mortality rate is defined as the probability of dying between theages of 1 and 5 years. In the presence of AIDS, the child mortality rate will beaffected more than the infant mortality rate, as most infected children willsurvive their first year of life only to die before they reach their fifth birthday.The projections show that AIDS can be expected to result in child mortalityrates that are 14 per cent higher than they would have been in the absence ofAIDS between 2000-2005, and 30 per cent higher in 2010 (figure 14).
AIDS orphans
HIV/AIDS will have a serious impact on children, both directly andindirectly. Some children of infected mothers will be infected with HIV andwill die from AIDS; the remainder will not be infected, but will be at risk ofbecoming orphans when their mothers die from AIDS. With anti-retroviralintervention for preventing mother-to-child HIV transmission, these relation-ships will change. A positive impact is that a large portion of children will beprotected from HIV infection; only about 10 per cent of children born toHIV-infected mothers will be infected. However, those surviving children willbecome orphans, because the same anti-retroviral therapy will not benefit theirmothers.
The number of orphans resulting from AIDS mortality is already largeand is expected to increase rapidly in the near future. The projection shows thatthe cumulative total number of AIDS orphans in Thailand is expected to climb
84 Asia-Pacific Population Journal, Vol. 16, No. 3

Figure 14. Child mortality rate with and withoutAIDS in Thailand, 1985-2010
60
1985 1987 1989 1991 1993 1995 1997 1999 2001 2003 2005 2007 2009
0 No AIDS m With AIDS
to 60,000 by 2000, then to double by 2005. The projection also shows that thenumber of AIDS orphans in Thailand is expected to reach nearly 200,000 bythe end of the projection period (figure 15).
The seriousness of the dramatic increase in orphans due to the AIDSepidemic has not been fully appreciated nor planned for. Some studies inThailand show that AIDS orphans are brought up by extended families, forexample, by grandfathers and mothers (Brown and others, 1995; Thamathikul,1997; Yoktri, 1996). However, those children are mostly in resource-poor
Figure 15. Number of AIDS orphans in Thailand, 1985-2010
1985 1987 1989 1991 1993 1995 1997 1999 2001 2003 2005 2007 2009
n Number of AIDS orphans
Asia-Pacific Population Journal, September 2001 85

families that need social and financial support. They also face discriminationand social exclusion by neighbours and the community. This translates into thedenial of access to playing, joining activities and schooling within thecommunity. Any help or support for children orphaned by AIDS within thefamily network or community should therefore be aimed at reducingdiscrimination in society and at providing necessary financial subsidies in termsof nutrition and school fees for such children.
Discussion and conclusion
The results of the projections presented in this paper may differ fromprojections given elsewhere, owing to varying assumptions about past andcurrent adult HIV prevalence as well as future prevalence. Differences mayalso result from the assumed length of the incubation period and the rate ofperinatal transmission. Median prevalence, which is derived from ANC data, isused instead of mean prevalence in this paper as it is more representative ofadult prevalence at the national level. Therefore, the projected numbers of thosewho will be affected are somewhat lower than those found in other studies.However, considerable effort was devoted during this study to examining theaccuracy of ANC data and adjusting those data so that they could bestrepresent the level of prevalence in adult Thais.
HIV prevalence in Thailand is declining. Furthermore, current levels ofprevalence are low when compared to African countries. However, even withthis low level of HIV prevalence (not more than 2 per cent), the impact islarge, partly because most of those infected are within the reproductive agegroup. Although the AIDS epidemic in Thailand is not expected to reducepopulation size and growth rate, it will substantially reduce the amount bywhich the population would have grown in the absence of AIDS. Theprojections suggest a decline in total population size of about 1-2 per cent. Thedecline in the population growth rate as a result of HIV/AIDS mortality will beabout 0.1 percentage point.
The long-standing nature of the AIDS epidemic in Thailand means thatthe cumulative impact of mortality will have a significant impact on somedemographic parameters. Since the increase in mortality as a result of AIDShas occurred mainly in adults of reproductive age, it inevitably has an impacton child survival. Both adult and child mortality indicators show AIDS ishaving a large impact. The social, economic, emotional and health costs of thisimpact will be enormous. By 2010, AIDS is projected to result in 50,000additional deaths, or a 17 per cent increase in the number of annual deaths thatwould have occurred in the absence of AIDS. The effect on child mortality isprojected to be even greater.
86 Asia-Pacific Population Journal, Vol. 16, No. 3

The economic impact of AIDS derives, in part, from its demographicimpact. AIDS kills prime-age adults, many of whom are at the peak of theireconomic productivity. Thus, it affects the productivity and efficiency oflow- and semi-skilled workers, creates labour shortages as a result of sicknessand strains the effectiveness of both formal and informal insurancemechanisms. That may encourage the replacement of sick or deceased workerswith migrant labour from neighbouring countries. However, that approachcould further emphasize any problems created by those migrants.
Although the macroeconomic effect of AIDS is likely to be small inThailand, the effect on the health sector and the poor will be severe. Amongthe households that suffer AIDS deaths, lower income will mean that thosehouseholds will be less able to cope with the medical expenses and loss ofincomes. Therefore, AIDS will tend to worsen poverty and increase equalityamong the poor households.
One of the most tragic effects of the AIDS epidemic is the increase in thenumber of orphans who have lost one or both parents. AIDS is the cause notonly of orphanhood but also of a decrease in human resource development inchildren, in terms of both physical and psychosocial aspects, as well as adecline in nutritional status, a reduction in schooling and an increase in thenumbers of street children. These aspects form only the measurable impact.There remains the immeasurable impact of grief and phychological pain that isexperienced by children who lose a parent. These effects are likely to begreatest among the poor, since they are more likely to become infected withHIV.
The projections presented in this paper have one core message. Thehuman and social costs of AIDS are enormous, even at relatively low levels ofprevalence. Prevention is straightforward and is much cheaper than treatment.Small decreases in prevalence can have significant effects in reducing thedemographic impact of AIDS and, therefore, the economic and social costs thatsociety has to face.
Acknowledgements
The findings presented in this article were funded by the Royal GoldenJubilee PhD programme of the Thailand Research Fund throughout the three-year period of the study and related work. The authors would like to expresstheir appreciation to Dr. Philip Guest for his insight and invaluable comments,as well as his editorial guidance in improving the paper. The authors are alsograteful to John Stover of the Futures Group International, for his guidance andenthusiastic interest in the processing and outcome of this paper.
Asia-Pacific Population Journal, September 2001 87

ReferencesBrown, T., C. Gullaprawit, W. Sittitrai, S. Thanprasertsuk and A. Chamratrithirong (1994). Projec-
tions for HIV/AIDS in Thailand: 1987-2020 (Bangkok, Technical Report, Human resourcesPlanning Division, National Economic and Social Development Board).
Brown, T., W. Sittitrai, S. Obremskey, S. Sheffer and others (1995). The Impact of HIV onChildren in Thailand (Bangkok, Programme on AIDS, Thai Red Cross Society).
Chotpitayasunondh, T., S. Chearskul, W. Siriwasin and others (1994). “HIV-1 vertical transmissionin Bangkok, Thailand”, paper presented at the Xth International Conference on AIDS,August, Yokohama, Japan.
Division of Epidemiology (1999). “Sentinel serosurveillance, June 1999”, Weekly EpidemiologySurveillance Report (Bangkok, Ministry of Public Health).
Ministry of Public Health (1997). Public Health Statistics (Bangkok).
National Statistical Office (1997). Report of the 1995-1996 Survey of Population Change(Bangkok).
(1997). Report of the I996 Survey of Fertility in Thailand (Bangkok).
National Economic and Social Development Board Working Group (1995). Population Projectionsfor Thailand 1987-2020 (Bangkok).
Schwartlander, B., K.A. Stanecki, T. Brown, P.O. Way and others (1999). “Country-specificestimates and models of HIV and AIDS: methods and limitations”, AIDS 13(17):2445-2458.
Shaffer, N., R. Chuachoowong, P.A. Mock, C. Bbhadrakom, C. Wasi and others (1999). “Short-course Zidovudine for perinatal HIV-l,2 transmission in Bangkok, Thailand: a randomizedcontrolled trial”, Lancet 353:773-777.
Stover, J. (1997). AIM Manual; a computer program for making HIV/AIDS projections andexamining the social and economic impacts of AIDS (United States of America, the FuturesGroup International).
(1999). AIM Manual; a computer program for making HIV/AIDS projections andexamining the social and economic impacts of AIDS (Revised version) (United States ofAmerica, the Futures Group International).
Thamathikul, A. (1997). “The study addressing social welfare for AIDS orphans in Chieng Mai”.Unpublished M.A. thesis, Faculty of Social Service, Thamasart University, Bangkok,Thailand.
Van Griensven, G.J.P., S. Surasaingsunk and P. Alessio (1998). The use of mortality statistics as aproxy indicator for the impact of the AIDS epidemic on the Thai population (Bangkok,Institute of Population Studies, Chulalongkorn University).
Wasi, C., S. Chearskul and A. Roongpisuthipong (1995). “The vertical transmission of HIV-1 inThailand”, paper presented at the Second International Conference on HIV in Children andMothers, 7-10 September, Edinburgh, United Kingdom.
Wongboonsin, K., S. Keeranan, S. Surasiengsunk, G.J.P. Van Griensven and others (1997).Demographic Impact of the HIV/AIDS Epidemic in Thailand: Mathematical and StatisticalProjections, IPS Publication No. 267/98 (Bangkok, Institute of Population Studies,Chulalongkorn University).
Yoktri, M. (1996). “AIDS orphans and hope”, Journal of Thai Public Welfare (May-June): 46-47.
88 Asia-Pacific Population Journal, Vol. 16, No. 3