unlocking the performance potential of waterborne latex … · unlocking the performance potential...
TRANSCRIPT

UNLOCKING THE PERFORMANCE POTENTIAL OF WATERBORNE LATEX PSAs Sekhar Sundaram, Project Team Leader, Rohm & Haas Company, Spring House, PA Laura Picraux, Senior Scientist, Rohm & Haas Company, Spring House, PA Rob Slone, Global Research Manager, Rohm & Haas Company, Spring House, PA Abstract One of the time-tested challenges for waterborne latex pressure sensitive adhesives (PSAs) is to match the cohesive strength and resistance properties of a solventborne system while still providing the environmental impact and handling advantages that come with waterborne adhesives. In this paper, we will discuss the fundamental factors that have historically prevented acrylic latex PSAs from achieving the cohesive strength of solventborne dispersions. We will also discuss new technologies (including traditional and nanotechnology approaches) that have helped bridge the waterborne-solventborne cohesive strength gap and have enabled the use of waterborne PSA products in adhesive applications formerly reserved for solventborne systems. Replacing Solventborne Technology: A Multi-dimensional Problem Achieving the balance of adhesive and cohesive properties has been a challenge for waterborne latex PSA technology; however, the medium to high-end specialty PSA products have many additional requirements for acceptable performance. These properties include resistance to water degradation, water-whitening, and heat and humidity.
0
1
2
3
4
5
T ack
Peel
Shear
Hot shear
SAF T
H/H
Resistances
Adhesion
Cohesion
Heat /Humidity
Tack
Peel
RT Shear
Hot Shear
SAFT
Figure 1: Multi-dimensional performance space

The multi-dimensional performance space that will have to be met to successfully compete against solvent technology is illustrated in Figure 1. For simplicity, the fourth dimension viz. aesthetics of the final film like color stability and clarity, which is critical for certain end-use applications will not be discussed. Over the years, various techniques (Figure 2) have been explored to tackle the adhesion-cohesion balance of waterborne PSAs. One approach has been to crosslink a soft (low Tg) polymer backbone. The resultant system provides adequate cohesive strength but often at the expense of tack and peel (bold arrow in Figure 2). Tackification of a high-cohesive strength polymer has been another commonly used approach. The adhesion properties are improved but the cohesive strength of the polymer decreased to an unacceptable level (bold arrow in Figure 2). These examples demonstrate that traditional techniques are not sufficient to move beyond the ‘classical behavior’ of waterborne PSAs, noted in Figure 2.
Classical Behavior
Tackification
X-link
SolventAcrylics
Adh
esio
n
Pee
l
Cohesion Shear
Figure 2: Various approaches illustrated
In this paper, a more fundamental approach is described to achieve a waterborne adhesive system that has high cohesive strength while maintaining tack and peel. This is accomplished by understanding the basic film formation mechanism and the relationship between particle morphology and visco-elastic properties. These studies have provided the basis to produce an aqueous acrylic polymer which is comparable to solventborne acrylic systems. Emulsion Polymers & Film Formation For solventborne systems, high cohesive strength can be readily obtained by the continuous network morphology formed in the dry film. In contrast, emulsion polymers produce films which contain discrete colloidal particles and, in general, weaker adhesives1. Understanding the various aspects which are important from the emulsion polymerization to the final film formation allows a better approach to improving the final film morphology and thereby improving the PSA properties of the adhesive.

Polymer Particle10 - 400 nm
Surfactant
Figure 3: Emulsion Polymer
The emulsion contains discrete polymer particles stabilized by surfactants with the hydrophobic moiety adsorbed onto the polymer particle and the hydrophilic moiety extended into the aqueous phase (Figure 3). It has been shown that the surfactant surrounding each polymer particle contributes to the stability of the overall aqueous system and to the colloidal nature of the dried film. Thus, the choice of surfactant, viz. anionic, nonionic or polymeric, influences the storage and handling of the emulsion, morphology of the film, and the performance of the PSA. The emulsion is then drawn down to form a film. Figure 4 illustrates the various stages of film-formation for waterborne latexes2. The film formation process can be broken down into three steps.
Polymer particle
WaterEvaporation
WaterEvaporation
PolymerDeformation+
Coalescence+
Film Formation
Figure 4: Steps in film formation
In the first-stage, most of the water evaporates from the film bringing the latex particles close together.

Next, further evaporation occurs and the particles deform creating a mechanically weak polyhedral cell-like structure. In the initial drying of the film the cell boundaries are populated by the surfactants and maintain the discrete particle nature. The rate of drying and, by extension, drying temperature influences the degree of particle deformation. The Tg of the latex will also affect the particle shape; a lower Tg system will have greater chain mobility at temperature typically used for drying.
500 nm
Latex was cast into a film. Ultra thin sections were cut from the films by cryo-microtomy at -90 oC.
Stained with RuO4 (ruthenium tetroxide) and imaged by Transmission Electron Microscopy.
These samples have undergone compaction and fully formed films.
The dark regions are surfactant rich.
Figure 5: TEM image of surfactant adsorbed at particle boundaries
In the final stage, the cohesive strength of the film is developed by coalescence of the latex particles and inter-diffusion of polymer molecules across the cell boundary. Partitioning of surfactants to the interface can retard particle coalescence, and film formation (see Figure 5) resulting in weaker films. The fundamental nature of film-formation for waterborne latexes makes it challenging to build a system that performs analogously to solventborne PSAs. The presence of the surfactants in the system affects the final coalescence of the film and, as a result, influences the final cohesive strength of the system. After film formation, the surfactants remain in the film. These migratory water-soluble species are one of the main reasons for poor water and moisture resistance. In addition, the mechanical properties of the film depend upon the particle morphology which in turn impacts the peel and tack. Therefore, improving the final polymer network will lead to enhanced PSA properties in the waterborne system. Particle Morphology Particle morphology of the latexes has been used as a means to tailor the physical properties of films3. With the availability of a wide range of monomers and with a greater understanding of the emulsion polymerization process, chemists have been successful in designing composite latex particles to meet the requirements for specific end-use applications.

Hard-Soft
SSP
OpaquePolymer
Core/Shell
Nano-composite
Figure 6: Some examples where nanotechnology has been utilized to achieve unique
performance For example, ‘core-shell’ latex particles are prepared by a series of consecutive emulsion polymerization steps. The resultant particle will have an inner-core with one composition and an outer-shell with a different composition. Similarly, there are numerous examples of nano-sized features deliberately designed within the latex particles resulting in differentiated performance (Figure 6). Some examples of nano-structures are hard and soft composites4, polymer shell with hollow cores (opaque polymer) and controlled shells (soluble shell polymers, SSP)5. Each of these systems has been developed for high value additives, binders and pressure sensitive adhesives. Composites of polymer and nano-clays6 have been evaluated for PSA applications where increased film toughness was required. A unique balance of PSA properties has been achieved by these systems. In this study, results are presented from the latest developments in waterborne technology by leveraging nanotechnology to provide a unique balance of PSA properties. Experimental Methods PSA Tests All samples were prepared by direct coating the emulsion onto 2 mil polyester, and covering the sample with a release liner. The dried sample had a coat weight of 53 g/m2 ± 2 g/m2. All tests were performed in a controlled environment of 21 °C and 50 % relative humidity. All data reported are the average of six individual tests. Peel tests were performed using PSTC-101 Test Method A. Two different dwell times were used; 30 min (initial) and 24 hr. The PSTC-107 Procedure A was followed for the creep experiments. Loop tack was measured using the PSTC-16 Test Method B.

Tensile Strength and Elongation. The tensile strength and elongation of a free film were measured according to PSTC-131 test method. The free film was prepared by casting the wet sample in a petri dish and allowing it to dry for 7 days at 21 °C and 50 % relative humidity. The dry films were then transferred to a 50 °C oven for 2 days. The film was removed from the petri dishes by placing them on dry ice for 30 min and twisting the dish motion to eject the film. It was then warmed to room temperature. It was found that this procedure allowed easy removal of the films without stretching or deforming them. The film thickness was approximately .035 ± 2 inches. These films were then cut into a dumb-bell shape, where the central dimensions were 0.725 in. long by 0.25 in. wide. The samples were elongated until break at a rate of 2 in/min. Water Absorption The water absorption of each sample was measured. Free films were prepared as in the tensile strength and elongation experiment. Circular 0.375 inch discs were cut from the films. The weight of each disc was recorded and then the disc was placed in 20 mL of H2O in a glass vial. The discs were removed at 24 hr, 4 days, and 7 days, blotted with cheese cloth, and weighed. After each weighing the disc was returned to the glass vial. The % weight gain was calculated and reported. DMA The dynamic mechanical analysis (DMA) was performed on a Rheometrics RDA-II rheometer. Free films of all samples were prepared as described above. From these films, 0.375 inch discs (thickness 0.8 to 1.0 mm) were cut and used for sample analysis. The experiments were performed in the dynamic temperature mode using a frequency of 6.28 rad/s. Parallel plate geometry (8mm diameter) was used for all testing. The temperature range used for each sample was -70 °C to 180 °C with a 0.5 °C temperature step increment. All experiments were performed by increasing the temperature from -70 °C. Results & Discussions PSA Testing and Water Absorption. The primary goal for the current development was to build cohesive strength in the polymers without compromising the adhesion. In an effort to optimize the peel-shear balance, acrylic latex polymers were synthesized using traditional metal cross-linking (A) techniques7 and incorporating nanotechnology (B and C). These systems are compared to a general purpose solvent acrylic (SA) adhesive. Note that values shown for the general purpose SA system are based on typical target values, rather than test results of a specific solvent acrylic product. Within the general purpose category there is a range of performance. Using broad market input, a set of desired characteristics for a general purpose solventborne PSA was created to allow comparison to the developmental waterborne PSAs.

0
20
40
60
80
A B C SA10
100
1000
SS 1
80o
Peel
24
hrs
(oz/
in)
RT
Shea
r 1”X
1”X4
lbs
(hrs
)
MetalX-link
General PurposeSolvent Acrylic
Figure 7: Adhesion-cohesion balance
The PSA properties were evaluated for the new systems. The classical peel-shear balance is evident from Figure 7. Polymer A has the highest cohesive strength (shear) and the lowest peel value. With the development of technology, B, the high cohesive strength was maintained while improving the adhesion characteristics. With latex C, a better balance of high cohesive strength and good adhesion was achieved. These results are favorable to a general purpose SA system.
0
75
150
225
A B C SA0
10
20
30
40
50
SAFT
(o C) O
R,
65o C
Hot
She
ar (h
rs)
Loop
Tac
k (O
z/in
)
MetalX-link
General PurposeSolvent Acrylic
1”X1
”X1
kg.
SAFT
SAFT
SAFT
SAFT
Figure 8: SAFT, hot shear and loop tack
The resistances of the water-based films were evaluated. Figure 8 illustrates the heat resistance of the polymers under static (hot shear at 65 oC) and dynamic shear adhesion failure temperature (SAFT) conditions. For polymers A, B, and C, the static hot shear experiments were stopped after 100 hrs. It is evident from Figure 8 that the aqueous

systems developed here had excellent static heat resistance that was comparable to or better than the general purpose solvent acrylic. Polymers A, B and C have excellent SAFT results. Comparing the improved resistance of these new systems to the tack, it is apparent that the general purpose solvent acrylic is able to maintain a higher level of tack (Figure 8); however the overall characteristics are much improved over the typical waterborne system and are similar to the sovlentborne system noted here. The impact of aging the PSA film closed with a release liner under heat (35 oC) and humidity (90 % RH) for 7 days was also tested. Initial (30 min dwell on stainless steel panels) 180o peel testing was performed on these adhesive strips after removing them from the oven and equilibrating them in a controlled atmosphere (22 oC and 50 % RH) for 2-3 hrs.
0
20
40
60
80
100
A B C SA0
10
20
30
40
50
% S
S Pe
el R
eten
tion
(Initi
al)
% W
ater
Abs
orpt
ion
(7 d
ays)
MetalX-link
General PurposeSolvent Acrylic
Figure 9: Peel retention under heat (35 oC) and humidity (90% RH) and water absorption Figure 9 reports the percent peel retention compared to the initial peel as obtained without heat and humidity aging. The metal cross-linking technology (A), had the best peel retention but is a low peel and tack system which is not acceptable for many applications. Samples B and C have higher peel and tack but lower heat and humidity resistance. Sample C approaches the SA system the closest. Figure 9 also illustrates the percent water absorption after soaking the polymer (see above for experimental protocol) for 7 days. The polymer A with metal cross-linking technology fares very poorly under these conditions. With the incorporation of nanotechnology, polymer B achieves water absorption of about 20 percent compared to an expected value of 10 percent for a SA PSA. Tensile Strength and Elongation. Measurement of the stress-strain behavior of a polymer allows the deformation and fracture energy of the system to be understood8. The behavior of the systems studied here is shown in Figure 10. Polymer A demonstrates the expected behavior for a cross-linked system. At high elongation, there is an up-turn in the stress-strain curve due to the
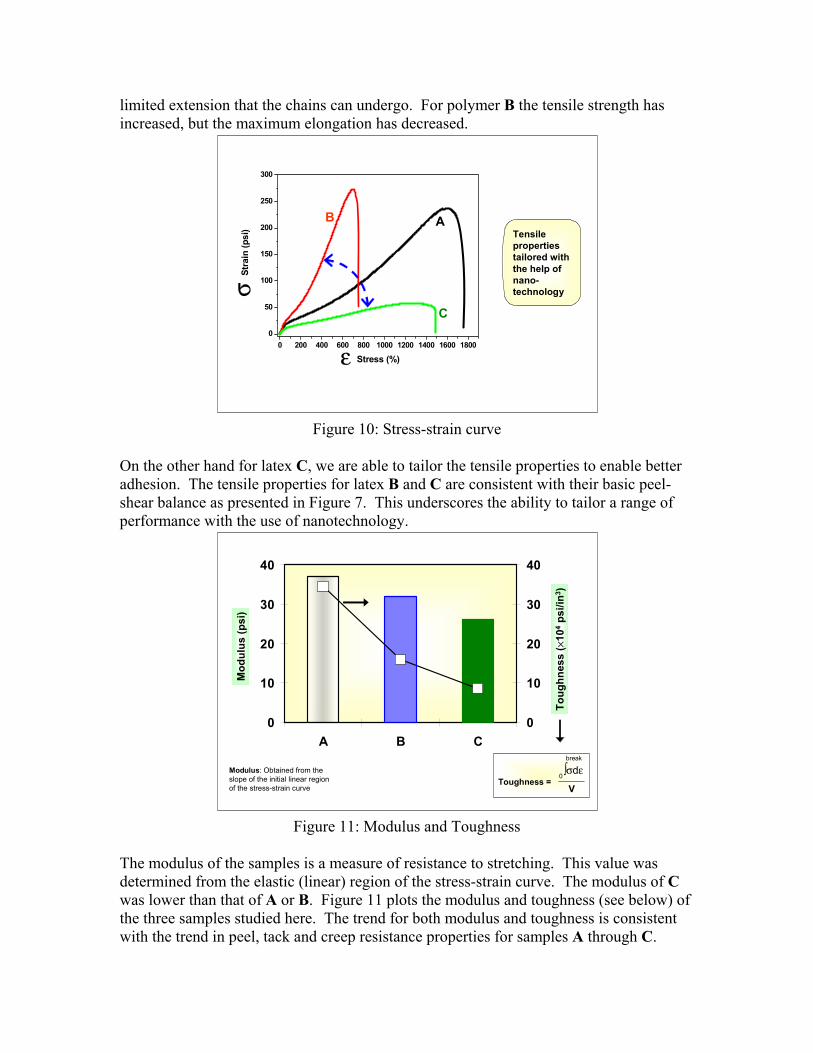
limited extension that the chains can undergo. For polymer B the tensile strength has increased, but the maximum elongation has decreased.
Tensile properties tailored with the help of nano-technology
ε0 200 400 600 800 1000 1200 1400 1600 1800
0
50
100
150
200
250
300
Stra
in (p
si)
Stress (%)
AB
C
σ
Figure 10: Stress-strain curve
On the other hand for latex C, we are able to tailor the tensile properties to enable better adhesion. The tensile properties for latex B and C are consistent with their basic peel-shear balance as presented in Figure 7. This underscores the ability to tailor a range of performance with the use of nanotechnology.
Toughness = V
0
10
20
30
40
A B C0
10
20
30
40
Mod
ulus
(psi
)
Toug
hnes
s (×
104
psi/i
n3 )
Modulus: Obtained from the slope of the initial linear region of the stress-strain curve
∫σdεbreak
0
Figure 11: Modulus and Toughness
The modulus of the samples is a measure of resistance to stretching. This value was determined from the elastic (linear) region of the stress-strain curve. The modulus of C was lower than that of A or B. Figure 11 plots the modulus and toughness (see below) of the three samples studied here. The trend for both modulus and toughness is consistent with the trend in peel, tack and creep resistance properties for samples A through C.

The toughness, calculated by the area under the stress (ε) - strain (σ) curve divided by the volume (V), followed a similar trend as the modulus. During a peel experiment, which demonstrates a nonlinear response, the legging and flow during the de-bonding process has been suggested to be related to the stress-strain behavior. It was found that the peel strength (for similar failure modes) followed the same trend as the tensile strength. Although this trend is suggestive, a complex range of factors such as the viscous flow, chain entanglement, and adhesive-surface interactions will all be important during the peel experiment. These examples underscore the interplay between polymer morphology and the observed properties of the system under tensile elongation. DMA The viscoelastic properties can be examined over a large magnitude of temperatures (frequencies) using DMA. From this experiment, information regarding the polymer structure and properties may be determined. The DMA curves are presented in Figures 12-13. Correlating the mechanical properties with the performance of PSAs is of great interest. It has been discussed in the literature that the high temperature terminal zone region of the DMA curves are relevant to the long time failure tests such as creep resistance9. Similarly, the low temperature transition zone has been related to the short time scale, debonding processes such as peel tests9.
ω = 6.28 rad/s
-100 -50 0 50 100 150 200
104
105
106
107
108
109
G' (
Pa)
Temperature (oC)
Sample A Sample B Sample C
B
C
Figure 12: DMA curve, G’ (storage modulus) as a function of temperature
The plateau region of the G’ curves in Figure 12 are relatively flat for sample A which employs traditional metal cross-linking chemistry. The G’ curve of B has some slope to it, and sample C turns the corner. Thus, the developments presented here help to build cohesive strength and increase the creep resistance without using traditional metal cross-linking technology.

ω = 6.28 rad/s
-100 -50 0 50 100 150 200
104
105
106
107
108
G" (
Pa)
Temperature (oC)
Sample A Sample B Sample C
B
C
Figure 13: DMA curve, G” (loss modulus) as a function of temperature
The transition region of the G” curves (Figure 13) are consistent with the observed tack behavior of the adhesives. The lower loss modulus and higher dissipation energy is observed for all samples, indicating the pressure sensitive adhesive nature of the samples.
0.00
0.50
1.00
1.50
2.00
2.50
A B C
G’×
10-5
(at T
g+
60o C
), Pa
Figure 14: G’ (modulus) at [Tg + 60 oC]
The storage modulus of each system can be compared to obtain additional information about the viscoelastic properties. A summary of G’ for three samples is noted in Figure 14 at Tg + 60oC. Sample B has the highest G’ value, followed by A, and then C. This roughly predicts the modulus of the polymer in the terminal zone. It is also interesting to note that structures have been generated that behave as if they were cross-linked yet with adequate flow.

Technology Optimization Further technology enhancement of polymer C resulted in two polymer systems, D and E that met, or, in some cases exceeded all of the SA target performance.
180o SS Peel(oz/in)
0
1
2
3
4
5
HDPE Peel
SS Peel
Loop Tack
RT ShearHot shear
SAFT
H/H
SADE
Resistances
Adhesion
Cohesion
60
20
8
24
40
30
90
150
16
48
80
1030 50
120
200
20
60
180o HDPE Peel(oz/in)
Heat/Humidity Aging(% Retention)
4 lbs RT Shear(hrs)
SAFT (oC)Loop Tack
(oz/in)
1 kg Hot Shear 65oC(hrs)
40
100
100
Figure 15: Summary of performance data with the latest technology optimization Figure 15 summarizes the data in a spider chart. Most notable for the new polymers D and E is that the peel values for both low surface energy (HDPE) and high surface energy (SS) substrates as well as heat resistances are enhanced without compromising the cohesive strength of the polymers. The hot shear (at 65 oC) and SAFT for polymer D is greater than SA. This balance of adhesion along with cohesive strength is unique. The results demonstrate the tremendous progress made in utilizing nanotechnology to build heat, humidity, and water resistance without overly compromising peel and tack for waterborne latex PSAs. Summary & Conclusions Nanotechnology techniques have been utilized to design waterborne latexes with PSA properties approaching those of a general purpose solvent acrylic. In particular, these systems demonstrate that polymers can be synthesized with a wide range of adhesion and cohesion properties to meet the needs of a specific application. In summary, the next generation water based acrylic technology presented here is closing the gap with general purpose solvent acrylic performance while providing environmental benefits.

Reference 1. Blackley, P. C. Emulsion Polymerization, Theory and Practice, Applied Science
Publishers, London, 1975. 2. Steward, P. A. et al., Advances in Colloid & Interface Science, 86, p195-267, 2000. 3. Lovell, P. A. and El-Aasser, M. S., Emulsion Polymerization and Emulsion Polymers,
John Wiley & Sons, p291, 1998. 4. Kowalski et al., US Patent 4,427,836. 5. Lorah, D. P., US Patent 4,876, 313. 6. Lofton, L., Clay/Polymer Nanocomposites for PSAs, PSTC Annual Meeting, 2004. 7. Czech, Z., Polymer International, 52, p347-357, 2003. 8. Sperling, L. H. Introduction to Physical Polymer Science; Wiley-Interscience
Publication, New York, 1986. 9. Chang, E. P. J. Adhesion, 60, p233-248, 1997. Acknowledgements The authors would like to thank Dr. A. Nakatani for helpful discussions in relation to polymer rheology and PSA properties, Dr. J. Reffner for providing TEM images, Dr. W. Griffith for valuable discussions, and finally D. Pierson for his suggestions regarding the manuscript.
