unlocking potential: global approaches to insurable …...unlocking potential: global approaches to...
TRANSCRIPT
Unlocking potential: global approaches to insurable benefit financingMultinational Pooling and Benefit Captives Research Report 2016/2017
The use of multinational pooling and employee benefit captives is delivering cost savings to companies.In a world where multinationals seek cost management approaches to create a competitive advantage, this opportunity represents statistically proven and relatively “low-hanging fruit.” Those companies not actively managing their insurable benefit risks should act now to start realizing larger savings.
Unlocking potential: global approaches to insurable benefit financingMultinational Pooling and Benefit Captives Research Report 2016/2017
1 Unlocking potential: global approaches to insurable benefit financing
Table of contents
Research highlights .........................................................................................2
About the research/database ......................................................................3
Research results ...............................................................................................4
Strategies for sustained success ............................................................... 7
Multinational pooling .....................................................................................10
Benefit captives .............................................................................................. 16
Participants ...................................................................................................... 21
Appendices
Appendix 1 Sample Participant bespoke benchmarking ................................ 24
Appendix 2 How to become a research study participant ..............................27
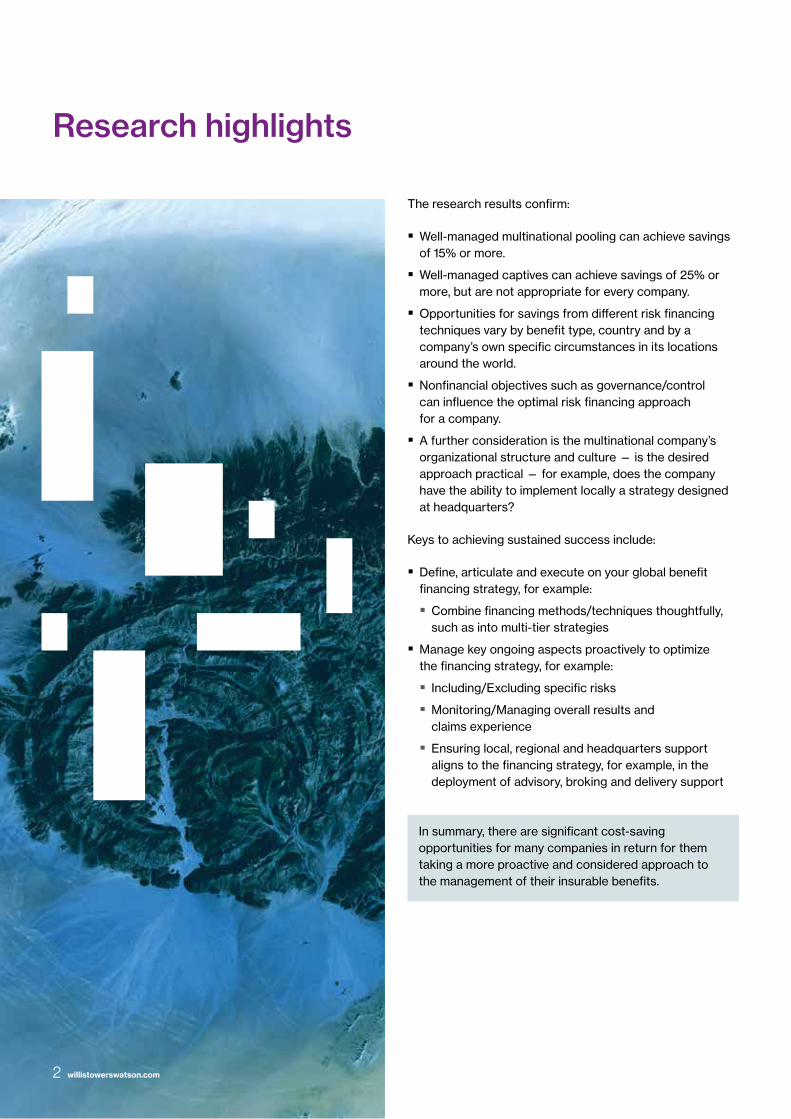
Research highlights
The research results confirm:
�� Well-managed multinational pooling can achieve savings of 15% or more.
�� Well-managed captives can achieve savings of 25% or more, but are not appropriate for every company.
�� Opportunities for savings from different risk financing techniques vary by benefit type, country and by a company’s own specific circumstances in its locations around the world.
�� Nonfinancial objectives such as governance/control can influence the optimal risk financing approach for a company.
�� A further consideration is the multinational company’s organizational structure and culture — is the desired approach practical — for example, does the company have the ability to implement locally a strategy designed at headquarters?
Keys to achieving sustained success include:
�� Define, articulate and execute on your global benefit financing strategy, for example:
�� Combine financing methods/techniques thoughtfully, such as into multi-tier strategies
�� Manage key ongoing aspects proactively to optimize the financing strategy, for example:
�� Including/Excluding specific risks
�� Monitoring/Managing overall results and claims experience
�� Ensuring local, regional and headquarters support aligns to the financing strategy, for example, in the deployment of advisory, broking and delivery support
2 willistowerswatson.com
In summary, there are significant cost-saving opportunities for many companies in return for them taking a more proactive and considered approach to the management of their insurable benefits.
3 Unlocking potential: global approaches to insurable benefit financing
The purpose of the research is to enable multinational companies to access data and insights to help optimize the financing of their insurable benefits.
The research was conducted during 2016 and reflects the responses of over 200 multinational companies. These include 37 of the FTSE Global 100 companies, eight of which are listed among the FTSE Global 20. Participant data:
�� Includes over 1,500 multinational pooling and captive reports
�� Covers US$6 billion in premiums
�� Covers benefit plans in 118 countries
�� Spans up to five years
This input combines into an extensive database from which we have analyzed the different types of benefit plans, including life, accident, disability, medical and some retirement plans (for example, risk-related elements such as spouse or orphan benefits). The results and our related insights provide a valuable resource to help multinational companies optimize the financing of their insurable benefits around the world, including effective deployment of multinational pooling, employee benefit captive solutions and other approaches.
For details on the participants, see pages 21 to 23.
The volume of data means the results are statistically valuable in terms of assessing trends, comparing approaches and measuring profitability across risk financing techniques or countries.
The database also enables companies to benchmark their approaches and results:
�� Appendix 1 shows a sample of one type of benchmarking output, which is provided to research study participants in return for them providing their data.
�� Appendix 2 provides information on how other organizations can participate.
Our research seeks to help global benefit leaders and insurance/risk managers answer their questions about multinational pooling and employee benefit captive approaches. Common questions include:
�� How effective different approaches are in mitigating employee benefit costs/risks and whether they are worth the effort
�� How multinational pooling and captive approaches/results compare with each other
�� Which countries and contracts are best/worst for multinational pooling or reinsuring to a captive
�� How multinational pooling results compare across the different risk mechanisms of loss carry forward (LCF), stop loss (SL) and small group (SG) pools
�� What more successful companies do to ensure their multinational pooling or captive strategies are effective
About the research/database
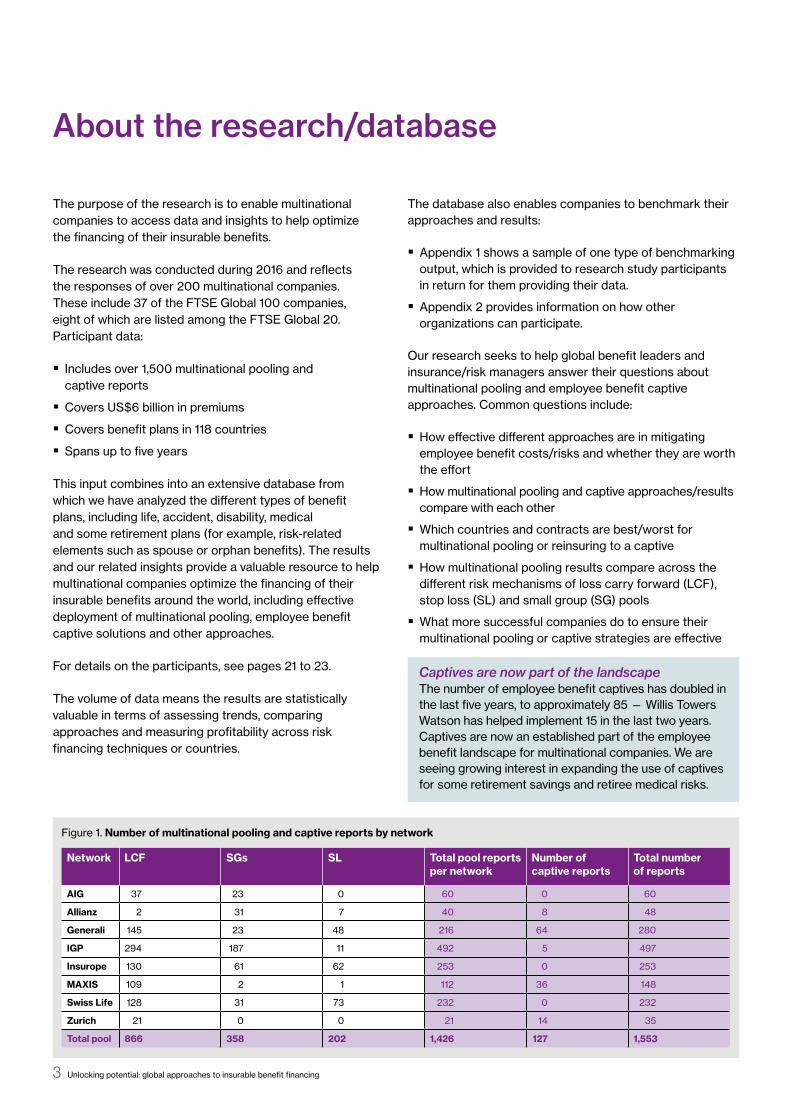
Figure 1. Number of multinational pooling and captive reports by network
Network LCF SGs SL Total pool reports per network
Number of captive reports
Total number of reports
AIG 37 23 0 60 0 60
Allianz 2 31 7 40 8 48
Generali 145 23 48 216 64 280
IGP 294 187 11 492 5 497
Insurope 130 61 62 253 0 253
MAXIS 109 2 1 112 36 148
Swiss Life 128 31 73 232 0 232
Zurich 21 0 0 21 14 35
Total pool 866 358 202 1,426 127 1,553
Captives are now part of the landscapeThe number of employee benefit captives has doubled in the last five years, to approximately 85 — Willis Towers Watson has helped implement 15 in the last two years. Captives are now an established part of the employee benefit landscape for multinational companies. We are seeing growing interest in expanding the use of captives for some retirement savings and retiree medical risks.
4 willistowerswatson.com
Research results
Context
Global costs of employee health and risk benefits — including medical, life and disability protection — are already significant and continue to rise.
Annual costs for insurable benefits can easily exceed US$20 million for a company with 20,000 employees around the world. For a company with 50,000 employees, including a substantial portion in countries such as France, the U.K. or the U.S., the cost can often exceed US$100 million per year.
Willis Towers Watson’s 2016 Global Medical Trends research shows an average 9.1% annual cost increase across the world, with wide variations by country/region.
The increasing costs of employee benefits are hitting the radar of senior finance and other company executives more regularly, with the result that there is greater urgency to understand and manage the drivers of these costs and their growth.
As finance and risk professionals become more involved in employee benefit decisions, they apply risk management techniques that they have been using on the non-life side of the business. The aftermath of Sarbanes-Oxley and the more recent financial crisis have also motivated companies to understand their risk exposures and manage them cost-effectively.
This research focuses on how companies leverage vendor relationships through multinational pooling and captive financing strategies to create cost efficiencies. However, it is clear from our thousands of interactions with multinational companies at headquarters, regional and local levels over the course of a year that one size doesn’t fit all when it comes to a strategy for optimizing the financing of employee benefits.
We often see multinational companies deploy multi-tier strategies when financing their employee benefits. For example:
�� Larger multinational companies may have much higher risk tolerance so may consider self-financing in markets where it makes sense, and employ a captive or aggressive multinational pooling strategy in other markets.
�� Smaller multinational companies may view risk differently and prefer a protective multinational pooling strategy for particular contracts and commercial insurance where they are unsure of the exposure.
Companies’ different organizational structures or cultures may make some approaches unrealistic and others more suitable. Other factors to consider include corporate appetite for risk, the availability of internal resources and expertise, and the transaction costs (whether consulting fees, broker commissions or a mixture of the two to utilize external resources).
From a practical perspective:
�� A multinational company with a track record of successfully launched global initiatives, including global property and casualty programs, and good channels of communication, might be in a position to consider a captive solution.
�� A multinational company with little knowledge of its global benefits and limited track record of influencing local decision making about choice of insurer should be realistic about its short-term objectives and perhaps take a more evolutionary approach.
While not directly measured by this research, we are observing much greater interest in health and well-being activities that support healthier lifestyles for employees. One driver is an expectation that these activities will eventually lead to lower claims on employee benefit plans, increased levels of productivity and improved business performance.

5 Unlocking potential: global approaches to insurable benefit financing
Results
The research results confirm:
1. Multinational pooling delivers cost savings for companies. The multinational pools included in this study returned international dividends of US$273 million, which is a 6.0% ROI. The top quartile of pools (excluding SG pools) produce dividends of 14.5%. At the other end of the spectrum, one in every three pools delivered a nil return, pushing overall median results down to 1.5%. For example, 385 LCF pool reports generated zero dividends, leading to an overall median result of 1.7% for LCF pools. We are certain the majority of these loss-making pools are not being deliberately managed to achieve zero returns, but instead are in urgent need of attention, such as excluding perpetually loss-making contracts. The message is clear: Inaction leads to suboptimal financial performance.
2. Captive arrangements deliver additional savings for some companies. Captive arrangements returned average surpluses of 8.1%, while the median captive return was 14.7%. The difference between the median and mean is largely attributable to the experience of one participating company with significant losses. When that captive is excluded, the mean and median returns are very similar, and both are higher than the results achieved under multinational pooling. These results are encouraging to captive users and those interested in using their captives, especially because some of the research participants have actively discounted premiums up front, ahead of reinsuring them to their captives — so their overall return is higher than the captive performance captured in the results. That said, we urge caution: Captives are not for everyone, and there are considerable costs and time involved in establishing and running successful captive programs, which are not reflected in the results.
3. Optimizing long-term employee benefit costs will contribute to companies’ attempts to achieve competitive advantage. While we cannot be conclusive, the results achieved by multinational companies that we know have a clearly articulated and proactive approach to managing their arrangements are significantly higher than the averages across the whole database. Those multinationals tend to expand their use of multinational pools and captives more successfully and explore new opportunities, while thoughtfully assessing whether to terminate arrangements that perform poorly. Conversely, we see significant cost-saving opportunities for many companies in return for them taking a more proactive approach to the management of their pools.
4. There are wide variations in profitability based on geography. For multinational pooling, Sweden produced the largest savings as a percentage of total premium pooled at +41%, while contracts in Canada were the worst performers with average returns of –16%. For captives, geographic variations in profitability were even wider. Japan produced the largest returns at +55%, while Ireland was the worst performer with average returns of –24%. This doesn’t mean companies should automatically include every benefit plan in Sweden or Japan, or exclude every contract in Canada or Ireland. Rather they should conduct due diligence and consider their own objectives, claims experience, premium rates, network retention levels and other factors before adding or continuing to include any contract in their pool or captive.
6 willistowerswatson.com
5. Returns vary based on coverage types. Life contracts were the most consistently profitable, with returns of 26.8% for captive business and 19.0% for multinational pooling. Stand-alone medical contracts produced average returns of 0.7% for captives but were consistent deficit producers for pools, with average returns of –6.3%. Companies should be wary of pooling stand-alone medical contracts in most countries, proceeding only where projected claims experience and network retention levels support pooling.
6. The right risk mechanism for multinational pooling depends on the pooling strategy and the types of coverage. Companies should check at least once a year that their strategy is working. Almost all multinational pools include risk mechanisms that provide varying levels of protection against losses. Companies need to understand the available risk mechanisms and select the one that matches their tolerance for risk. If, for example, a company wants to drive consistent dividends rather than minimize up-front premiums, then LCF pools may be the best option since their lower retentions — or amounts retained to cover administrative and other costs, including profits — provide opportunities for higher dividends. Conversely, companies using multinational pooling first and foremost to drive down premium rates may prefer SL pools so that one or two bad years don’t leave their pools with large unrecoverable deficits.
7. Average dividend returns for multinational pooling were similar between LCF (6.5%) and SL (6.4%) pools. Intuitively, one might expect there to be a larger gap in performance, as SL pools carry higher risk retentions, so profits should be lower on a like-for-like performance basis than under an LCF approach. One possible explanation is that even if the significant minority of LCF pools stuck in large deficit positions have positive results in a given year, no dividends are returned due to those surpluses being used to reduce the historic losses being carried forward.
Benchmarking: the need for care in interpreting individual company resultsUnderstanding the different approaches taken by companies is critical to interpreting the research results. Some companies seek to drive consistent dividends from multinational pooling, while others focus on reducing up-front premium costs by contract or across a book of business looking for a volume discount. Similarly, some captives operate on a break-even approach or offer up-front discounts, meaning that their results can be understated. When assessing the performance of their multinational pooling or captives, companies should take their individual objectives into account.
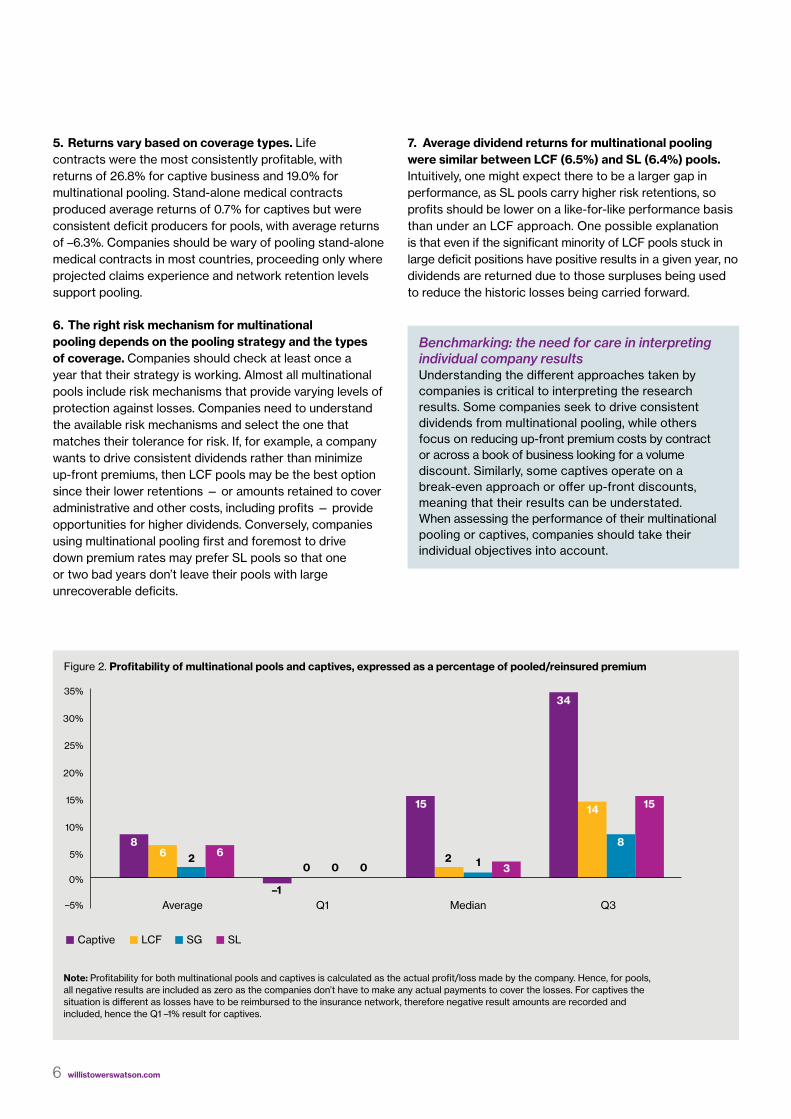
Figure 2. Profitability of multinational pools and captives, expressed as a percentage of pooled/reinsured premium
–5%
0%
5%
10%
15%
20%
25%
30%
35%
Captive LCF SG SL
Average Q1 Median Q3
86 2 6
–1
0 0 0
15
2 1 3
14
8
15
34
Note: Profitability for both multinational pools and captives is calculated as the actual profit/loss made by the company. Hence, for pools, all negative results are included as zero as the companies don’t have to make any actual payments to cover the losses. For captives the situation is different as losses have to be reimbursed to the insurance network, therefore negative result amounts are recorded and included, hence the Q1 –1% result for captives.
Implementing a successful benefit financing strategy
More multinational companies than ever are managing their insurable employee benefit plans and costs pro-actively. Our client activity indicates record levels of interest in assessing:
�� The type(s) of approach to adopt: multinational pooling, captive, others such as global underwriting/pricing models or cross-border insurance policies
�� The method(s) of delivery: use of a global broker, reduction or elimination of broker commissions or a fully transparent mixture based on value added
We often see companies struggling with making these assessments. The key point is to select an optimal strategy which best fits a company’s own circumstances. This is often a mix of financing approaches because one approach may not be best for all a multinational company’s insurable benefits around the world.
Let’s compare two client examples that we have supported closely for several years:
Example: global energy companyA large energy company has the following strategy:
�� Self-finance the large insurable benefit plans where there is appropriate administration capability in-house or it can be sourced externally (such as via a pension fund)
�� Reinsure to the captive all other insurable benefit plans
�� Insure any insurable benefit plans which cannot be captive financed (typically ones that are very small or where it is not possible due to local legislation)
Strategies for sustained success
Example: global technology companyA global technology company adopts a quite different financing strategy:
�� Place all insurable benefits plans that look profitable in one of two multinational pooling arrangements and monitor closely
�� Insure all other insurable benefit plans and monitor closely
Both these companies have made a success of their financing strategies but why are they different? The key difference lies in the fact that the two company’s philosophies around risk are different:
�� The energy company already manages many large risks and associated exposures as part of its overall business. It is comfortable with retaining many measurable risks, including employee benefits, which is why their preferred approach is self-finance followed by the next closest method; use of captive. Employee benefits risks do not appear high on their top risks log compared to oil and gas extraction sites and exploration operations.
�� The technology company has a different view, and employee benefits risks are high on their risks log. They are not comfortable with retaining employee benefit risks on balance sheets, so they look to externalize these risks through multinational pooling and commercial insurance.
So there is no universally right or wrong answer – the optimal approach is company specific.
7 Unlocking potential: global approaches to benefit financing
8 willistowerswatson.com
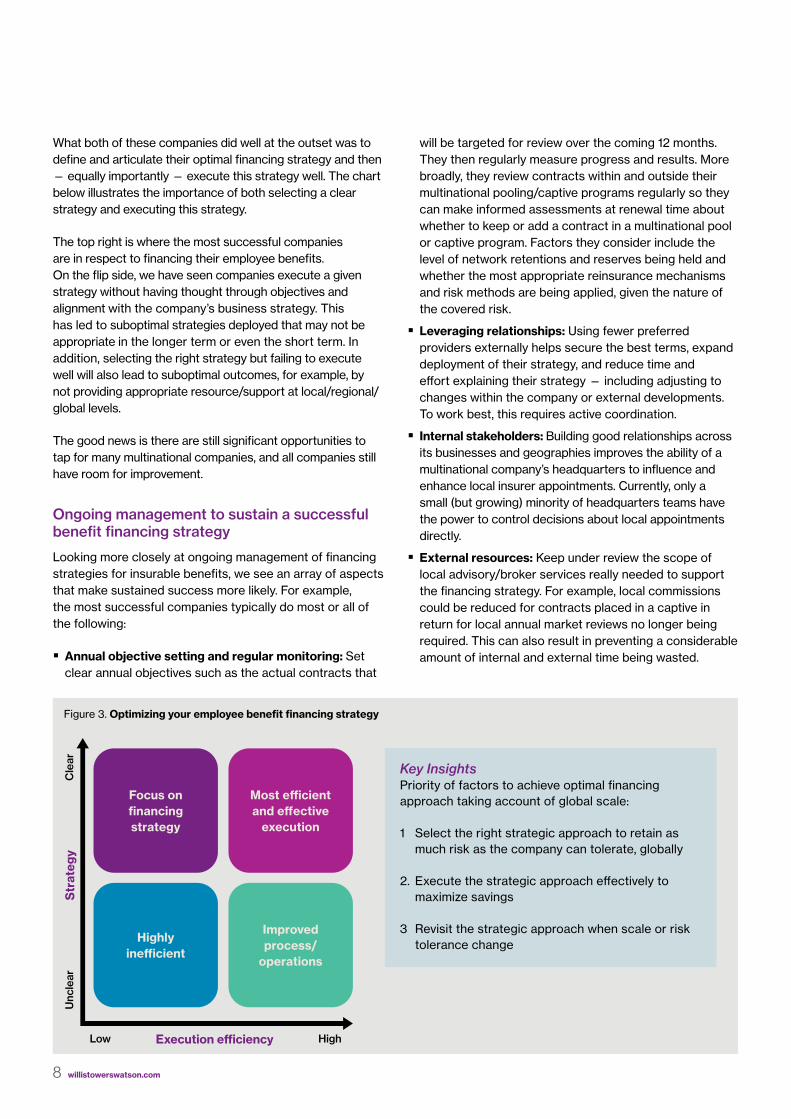
What both of these companies did well at the outset was to define and articulate their optimal financing strategy and then — equally importantly — execute this strategy well. The chart below illustrates the importance of both selecting a clear strategy and executing this strategy.
The top right is where the most successful companies are in respect to financing their employee benefits. On the flip side, we have seen companies execute a given strategy without having thought through objectives and alignment with the company’s business strategy. This has led to suboptimal strategies deployed that may not be appropriate in the longer term or even the short term. In addition, selecting the right strategy but failing to execute well will also lead to suboptimal outcomes, for example, by not providing appropriate resource/support at local/regional/global levels.
The good news is there are still significant opportunities to tap for many multinational companies, and all companies still have room for improvement.
Ongoing management to sustain a successful benefit financing strategy
Looking more closely at ongoing management of financing strategies for insurable benefits, we see an array of aspects that make sustained success more likely. For example, the most successful companies typically do most or all of the following:
�� Annual objective setting and regular monitoring: Set clear annual objectives such as the actual contracts that
Figure 3. Optimizing your employee benefit financing strategy
Key InsightsPriority of factors to achieve optimal financing approach taking account of global scale:
1 Select the right strategic approach to retain as much risk as the company can tolerate, globally
2. Execute the strategic approach effectively to maximize savings
3 Revisit the strategic approach when scale or risk tolerance change
will be targeted for review over the coming 12 months. They then regularly measure progress and results. More broadly, they review contracts within and outside their multinational pooling/captive programs regularly so they can make informed assessments at renewal time about whether to keep or add a contract in a multinational pool or captive program. Factors they consider include the level of network retentions and reserves being held and whether the most appropriate reinsurance mechanisms and risk methods are being applied, given the nature of the covered risk.
�� Leveraging relationships: Using fewer preferred providers externally helps secure the best terms, expand deployment of their strategy, and reduce time and effort explaining their strategy — including adjusting to changes within the company or external developments. To work best, this requires active coordination.
�� Internal stakeholders: Building good relationships across its businesses and geographies improves the ability of a multinational company’s headquarters to influence and enhance local insurer appointments. Currently, only a small (but growing) minority of headquarters teams have the power to control decisions about local appointments directly.
�� External resources: Keep under review the scope of local advisory/broker services really needed to support the financing strategy. For example, local commissions could be reduced for contracts placed in a captive in return for local annual market reviews no longer being required. This can also result in preventing a considerable amount of internal and external time being wasted.
Focus on financing strategy
Highly inefficient
Most efficient and effective
execution
Improved process/
operations
Cle
arU
ncle
arS
trat
egy
HighLow Execution efficiency
9 Unlocking potential: global approaches to insurable benefit financing
�� Identifying and monitoring savings: Savings can arise from both up-front premium reductions and enhanced returns from expanded multinational pools or captives as new contracts are added. In addition, a larger spread of risk included in the multinational pool or captive can be expected to reduce the overall volatility of experience, depending on the risks included. In turn, this greater predictability of outcome can reduce risk charges in multinational pools or the need for reinsurance within a captive.
�� Ensuring service levels are appropriate and maintained: Improvements in contract terms and provider service should also be a goal, for example, through global and local service-level agreements. While these concepts are not new, our research/experience confirms that multinational companies that apply them systematically and thoroughly save more money on a global basis over the long term.
�� Explore opportunities to reduce up-front premiums: Multinational pooling and captives provide excellent information on premium, claims and claim ratio history that can be used to help attain lower premiums instead of waiting for annual dividends to be distributed from multinational pools.
�� Explore feasibility of a captive: Captives are most effective for companies with the capacity to take on additional risk in employee benefits on a global basis, and when companies apply significant experience in applying risk management principles to other business lines to employee benefits. A positive partnership between finance/risk management and HR (for example, global benefit managers) is key, as is having sufficient premium volume in an arrangement to make setup and running costs more reasonable.
�� Monitor cash flow for captives: Ensure you are receiving the expected level of net premiums, when you expected them.
Multicountry insurance policies are widely used for travel accident, AD&D, health care/other insurances for expatriates/IMEs. Some multinational companies have had success in using them more broadly as part of their overall strategy to provide effective solutions for small country populations or pan-European workforces.

10 willistowerswatson.com
What is multinational pooling?
Multinational pooling combines a company’s group insurance contracts for employee benefits in different countries under one financing arrangement to create savings through economies of scale. Sources of these economies of scale include risk reduction, administrative efficiencies and experience rating.
Multinational pooling
Multinational pooling helps companies take advantage of economies of scale to realize relatively easy savings.
Figure 4. Before and after pooling
There are eight multinational insurance networks that support multinational pooling.
A company gains financial savings through them from:
�� Favorable claims experience
�� Reduced insurer profit in return for contracts remaining with the insurer longer
�� Global purchasing power to leverage local premium rates
Nonfinancial benefits include improvement in service and improvement in contract terms, such as underwriting limits.
Pre
miu
ms
Before pooling
Expense/risk chargeInsurer profit Expense/risk charge
Insurer profit
Claims reserve Claims reserve
Local dividends Local dividends
Commission Commission
Claims Claims
Typical after pooling
International dividend
11 Unlocking potential: global approaches to insurable benefit financing
The three main pooling risk mechanisms used by companies are:
Loss carry forward (LCF): In LCF pools, any deficit at the end of the year is carried forward to the next year. Variations include limited LCF and multinational pools, which write off deficits after a specific time period such as three years.
Small groups (SGs): An SG pool is a multiemployer pool where surpluses and losses are shared among participants. SG pool mechanisms are typically used as a default when a company’s employee benefit business with the multinational pooling network does not meet certain thresholds for premium volume or spread of lives.
Stop loss (SL): In SL pools, all losses are borne by the multinational pooling network in return for a higher retention charge, but surpluses are paid out to the company.
A very small minority of multinational pools do not include any risk mechanism.
Multinational pooling is profitable for many companies. Nearly two-thirds (60%) of the 1,426 pooling reports we reviewed resulted in dividends. The average dividend was 6.0%, and 29% of reports produced dividends greater than 10%. The median dividend was much lower (1.5%), reflecting that a minority of companies receive the biggest returns. Figure 1 on page 3 provides a summary of the multinational pooling reports included in the research/database, by network and by pool risk mechanism. Figure 6 on page 12 shows the multinational pooling results split by risk mechanism.
Different strategies yield different results
From our client work, we know that different companies often have different strategic objectives, which influences the size of their dividend. So assessing dividend performance can be complex and, at an individual company level, shouldn’t be considered in isolation. For example, some prefer to leverage multinational pooling providers at their renewal dates to reduce the premiums paid up front. This can be a successful strategy even if it reduces the potential for dividends to be generated by the pool.
This approach is most effective for life and accident coverage because the purchasing decision depends largely on price. In contrast, medical and long-term disability insurer selection decisions often rest on quality of service, such as timely payment of claims and case management capabilities.
Other companies aim for higher, more consistent dividends from their multinational pools, using the proceeds to finance corporate activities or to reward the local business operations whose positive performance contributed to the dividend. Often companies adopt a mixed approach, keeping a portion of the dividend for corporate activities such as covering the expenses associated with the pool or providing seed money for other initiatives, and sharing the balance with local affiliates.
Companies that actively manage their multinational pools with a particular approach in mind increase the chances that their pool will be financially successful.
LCF pools are the most commonly used risk mechanisms. This may be because companies are at least in part attracted by the lower retention charges and opportunities for higher dividends when experience is good. Still, at 6.5% and 6.4%, respectively, LCF and SL pools yielded comparable average dividends. In contrast, dividends from SG pools were much lower.
Because LCF and SL pools both returned healthy dividends, neither seems to be more valuable than the other. Instead, companies are choosing between them based on their appetite for risk and the mix of employee benefit business in the pool. SL pools, for example, tend to be better suited for multinational pools that are imbalanced (for example, one country makes up 70% or more of the total lives or premium of the pool), or have a smaller spread of lives or risks.
Most companies in SG pools should move beyond them to SL or LCF as soon as they have sufficient scale in terms of head count and premiums. Several of the largest multinational networks’ results have been at historic lows over the past few years. For example, the majority of SG participants in this research have their pools with IGP who are paying zero SG pool dividends for 2016. This means the average dividend of just 1.7% of SG pooled premiums is likely to reduce even further in future research study reports as those zero return reports enter our database.
Risk mechanisms
12 willistowerswatson.com
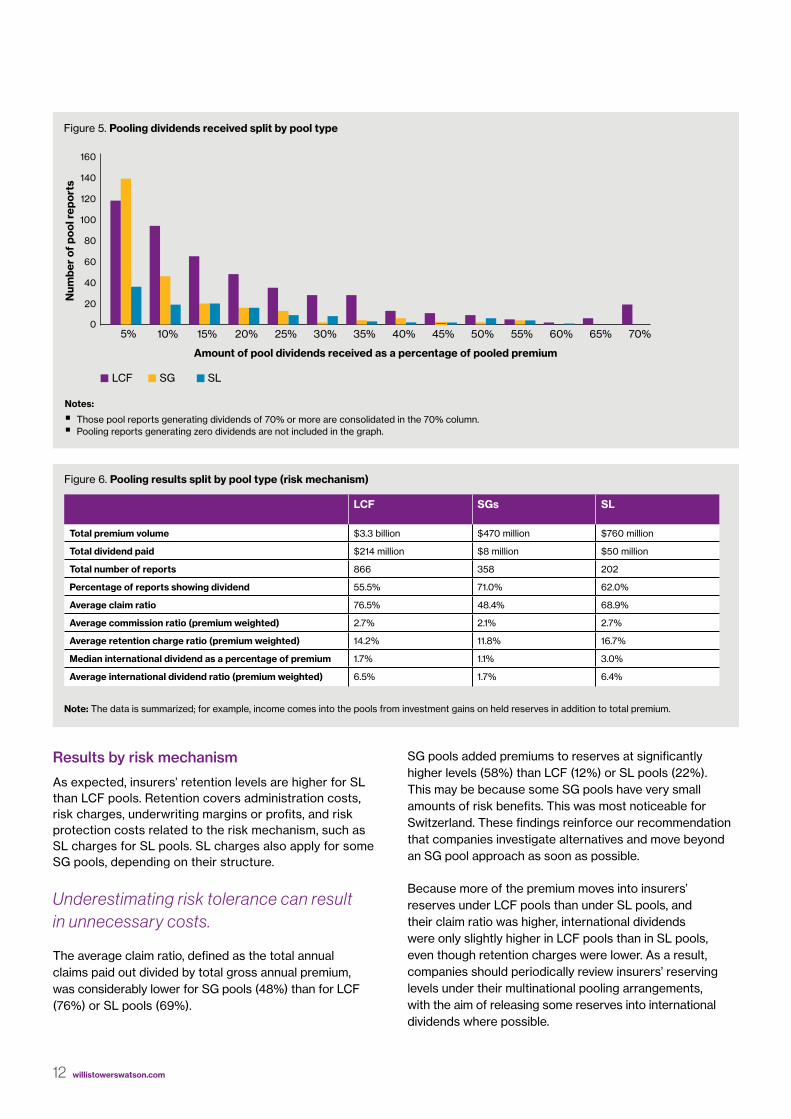
Figure 5. Pooling dividends received split by pool type
0
20
40
60
80
100
120
140
160
70%65%60%55%50%45%40%35%30%25%20%15%10%5%
LCF SG SL
Num
ber
of p
ool r
epor
ts
Amount of pool dividends received as a percentage of pooled premium
Notes:
�� Those pool reports generating dividends of 70% or more are consolidated in the 70% column. �� Pooling reports generating zero dividends are not included in the graph.
Figure 6. Pooling results split by pool type (risk mechanism)
LCF SGs SL
Total premium volume $3.3 billion $470 million $760 million
Total dividend paid $214 million $8 million $50 million
Total number of reports 866 358 202
Percentage of reports showing dividend 55.5% 71.0% 62.0%
Average claim ratio 76.5% 48.4% 68.9%
Average commission ratio (premium weighted) 2.7% 2.1% 2.7%
Average retention charge ratio (premium weighted) 14.2% 11.8% 16.7%
Median international dividend as a percentage of premium 1.7% 1.1% 3.0%
Average international dividend ratio (premium weighted) 6.5% 1.7% 6.4%
Note: The data is summarized; for example, income comes into the pools from investment gains on held reserves in addition to total premium.
Results by risk mechanism
As expected, insurers’ retention levels are higher for SL than LCF pools. Retention covers administration costs, risk charges, underwriting margins or profits, and risk protection costs related to the risk mechanism, such as SL charges for SL pools. SL charges also apply for some SG pools, depending on their structure.
Underestimating risk tolerance can result in unnecessary costs.
The average claim ratio, defined as the total annual claims paid out divided by total gross annual premium, was considerably lower for SG pools (48%) than for LCF (76%) or SL pools (69%).
SG pools added premiums to reserves at significantly higher levels (58%) than LCF (12%) or SL pools (22%). This may be because some SG pools have very small amounts of risk benefits. This was most noticeable for Switzerland. These findings reinforce our recommendation that companies investigate alternatives and move beyond an SG pool approach as soon as possible.
Because more of the premium moves into insurers’ reserves under LCF pools than under SL pools, and their claim ratio was higher, international dividends were only slightly higher in LCF pools than in SL pools, even though retention charges were lower. As a result, companies should periodically review insurers’ reserving levels under their multinational pooling arrangements, with the aim of releasing some reserves into international dividends where possible.
13 Unlocking potential: global approaches to insurable benefit financing
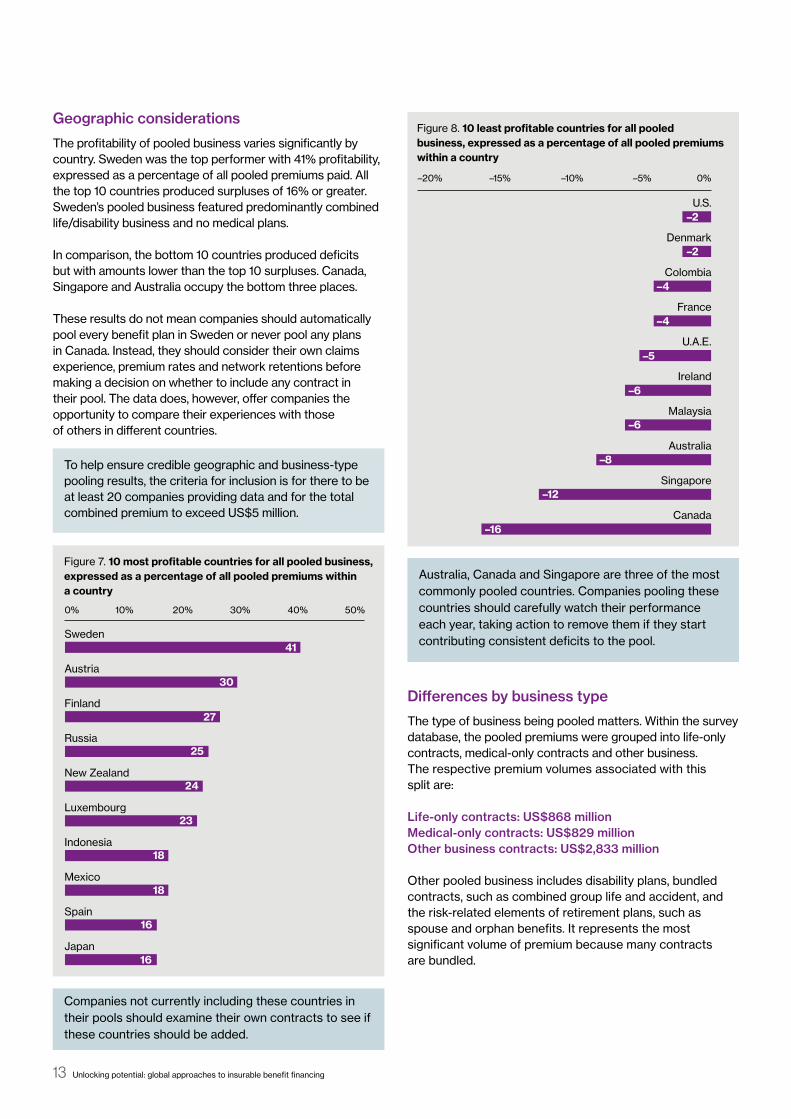
Geographic considerations
The profitability of pooled business varies significantly by country. Sweden was the top performer with 41% profitability, expressed as a percentage of all pooled premiums paid. All the top 10 countries produced surpluses of 16% or greater. Sweden’s pooled business featured predominantly combined life/disability business and no medical plans.
In comparison, the bottom 10 countries produced deficits but with amounts lower than the top 10 surpluses. Canada, Singapore and Australia occupy the bottom three places.
These results do not mean companies should automatically pool every benefit plan in Sweden or never pool any plans in Canada. Instead, they should consider their own claims experience, premium rates and network retentions before making a decision on whether to include any contract in their pool. The data does, however, offer companies the opportunity to compare their experiences with those of others in different countries.
To help ensure credible geographic and business-type pooling results, the criteria for inclusion is for there to be at least 20 companies providing data and for the total combined premium to exceed US$5 million.
Figure 7. 10 most profitable countries for all pooled business, expressed as a percentage of all pooled premiums within a country
0% 10% 20% 30% 40% 50%
Japan
Spain
Mexico
Indonesia
Luxembourg
New Zealand
Russia
Finland
Austria
Sweden41
30
27
25
24
23
18
18
16
16
Companies not currently including these countries in their pools should examine their own contracts to see if these countries should be added.
Figure 8. 10 least profitable countries for all pooled business, expressed as a percentage of all pooled premiums within a country
–20% –15% –10% –5% 0%
Canada
Singapore
Australia
Malaysia
Ireland
U.A.E.
France
Colombia
Denmark
U.S.–2
–2
–4
–4
–5
–6
–6
–8
–12
–16
Australia, Canada and Singapore are three of the most commonly pooled countries. Companies pooling these countries should carefully watch their performance each year, taking action to remove them if they start contributing consistent deficits to the pool.
Differences by business type
The type of business being pooled matters. Within the survey database, the pooled premiums were grouped into life-only contracts, medical-only contracts and other business. The respective premium volumes associated with this split are:
Life-only contracts: US$868 million Medical-only contracts: US$829 million Other business contracts: US$2,833 million
Other pooled business includes disability plans, bundled contracts, such as combined group life and accident, and the risk-related elements of retirement plans, such as spouse and orphan benefits. It represents the most significant volume of premium because many contracts are bundled.
14 willistowerswatson.com
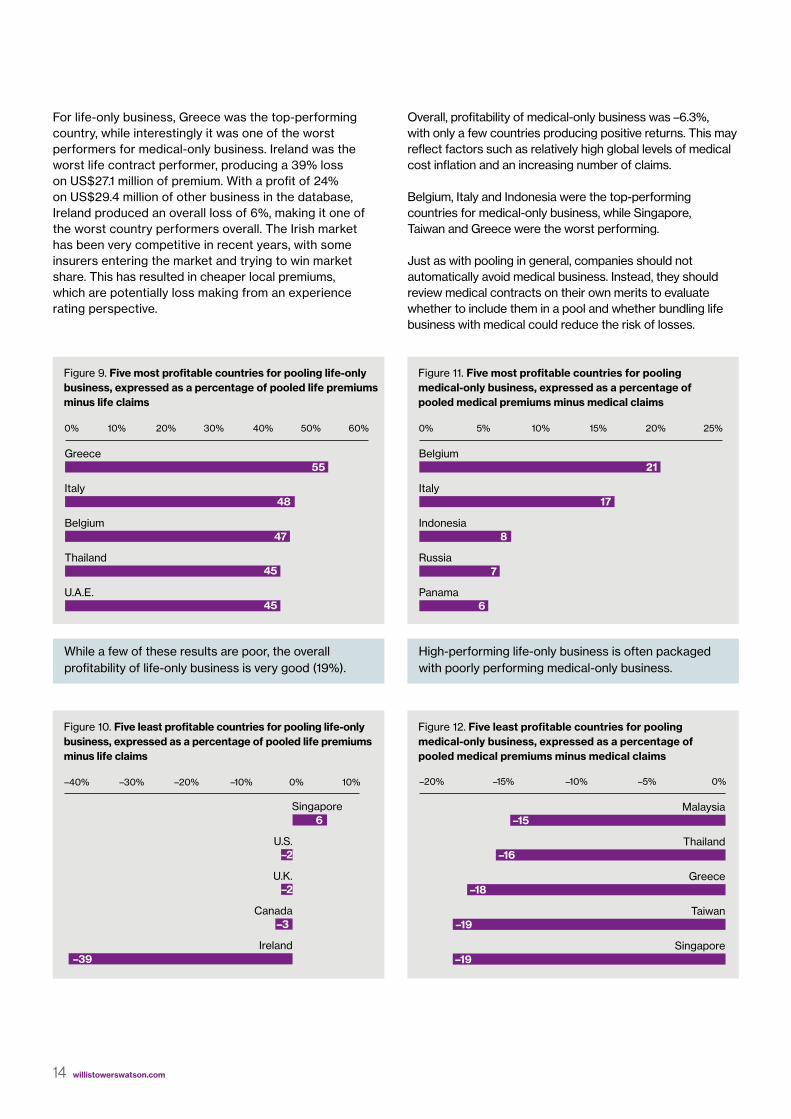
For life-only business, Greece was the top-performing country, while interestingly it was one of the worst performers for medical-only business. Ireland was the worst life contract performer, producing a 39% loss on US$27.1 million of premium. With a profit of 24% on US$29.4 million of other business in the database, Ireland produced an overall loss of 6%, making it one of the worst country performers overall. The Irish market has been very competitive in recent years, with some insurers entering the market and trying to win market share. This has resulted in cheaper local premiums, which are potentially loss making from an experience rating perspective.
Overall, profitability of medical-only business was –6.3%, with only a few countries producing positive returns. This may reflect factors such as relatively high global levels of medical cost inflation and an increasing number of claims.
Belgium, Italy and Indonesia were the top-performing countries for medical-only business, while Singapore, Taiwan and Greece were the worst performing.
Just as with pooling in general, companies should not automatically avoid medical business. Instead, they should review medical contracts on their own merits to evaluate whether to include them in a pool and whether bundling life business with medical could reduce the risk of losses.
Figure 9. Five most profitable countries for pooling life-only business, expressed as a percentage of pooled life premiums minus life claims
0% 10% 20% 30% 40% 50% 60%
U.A.E.
Thailand
Belgium
Italy
Greece55
48
47
45
45
23
18
18
16
16
High-performing life-only business is often packaged with poorly performing medical-only business.
While a few of these results are poor, the overall profitability of life-only business is very good (19%).
Figure 10. Five least profitable countries for pooling life-only business, expressed as a percentage of pooled life premiums minus life claims
Ireland
Canada
U.K.
U.S.
Singapore6
–2
–3
–39
23
18
18
16
16
0%–10%–20%–30%–40% 10%
–2
Figure 11. Five most profitable countries for pooling medical-only business, expressed as a percentage of pooled medical premiums minus medical claims
Figure 12. Five least profitable countries for pooling medical-only business, expressed as a percentage of pooled medical premiums minus medical claims
0% 5% 10% 15% 20% 25%
Panama
Russia
Indonesia
Italy
Belgium21
17
8
7
6
–20% –15% –10% –5% 0%
Singapore
Taiwan
Greece
Thailand
Malaysia–15
–16
–18
–19
–19
23
18
18
16
16
15 Unlocking potential: global approaches to insurable benefit financing
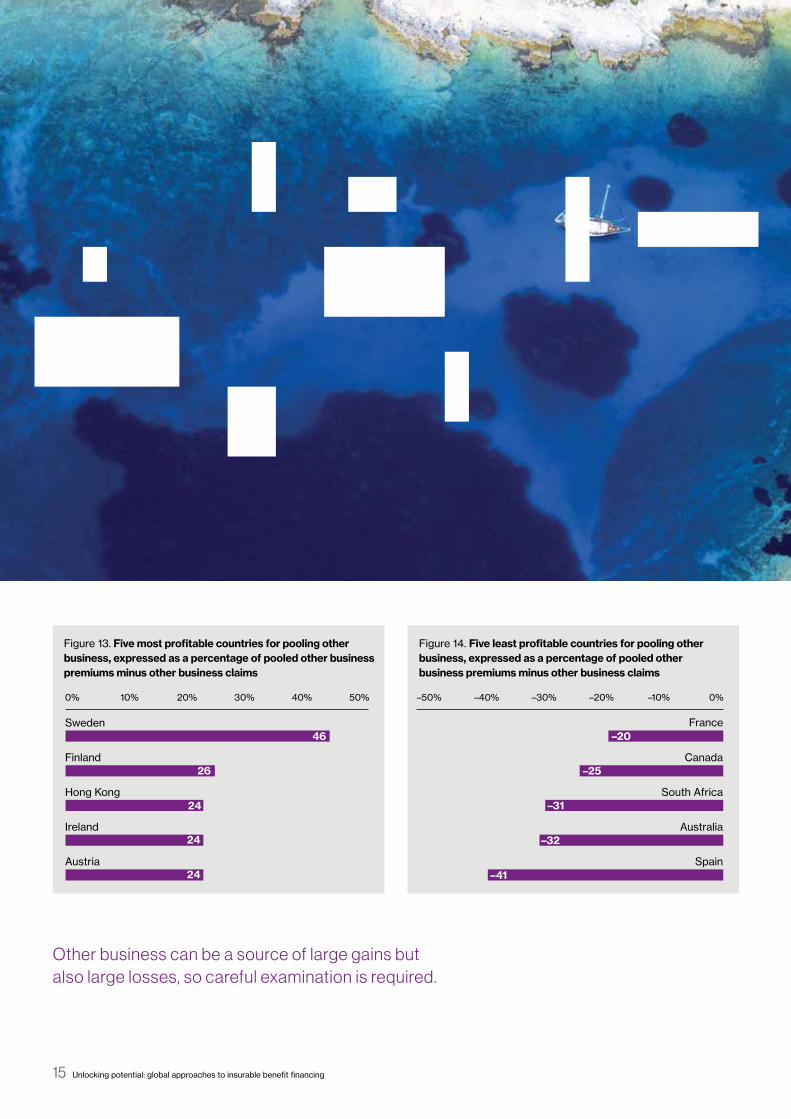
Other business can be a source of large gains but also large losses, so careful examination is required.
Figure 13. Five most profitable countries for pooling other business, expressed as a percentage of pooled other business premiums minus other business claims
Figure 14. Five least profitable countries for pooling other business, expressed as a percentage of pooled other business premiums minus other business claims
0% 10% 20% 30% 40% 50%
Austria
Ireland
Hong Kong
Finland
Sweden46
26
24
24
24
–50% –40% –30% –20% –10% 0%
Spain
Australia
South Africa
Canada
France–20
–25
–31
–32
–41
23
18
18
16
16
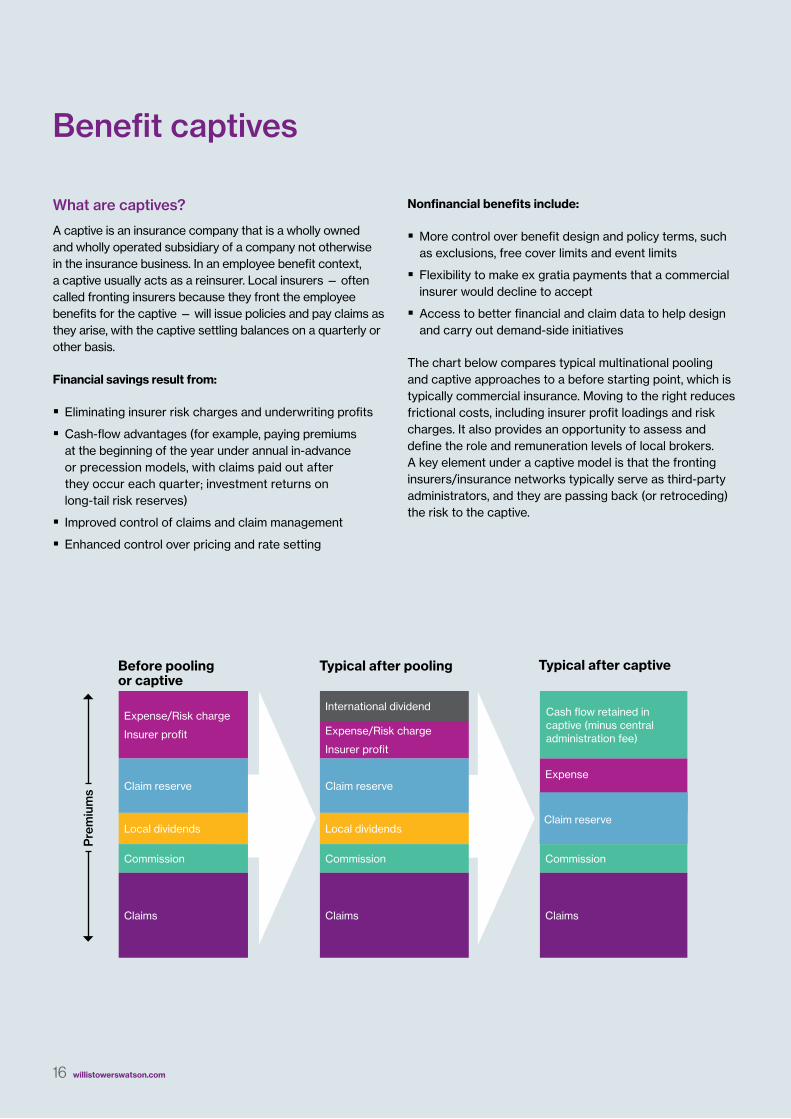
What are captives?
A captive is an insurance company that is a wholly owned and wholly operated subsidiary of a company not otherwise in the insurance business. In an employee benefit context, a captive usually acts as a reinsurer. Local insurers — often called fronting insurers because they front the employee benefits for the captive — will issue policies and pay claims as they arise, with the captive settling balances on a quarterly or other basis.
Financial savings result from:
�� Eliminating insurer risk charges and underwriting profits
�� Cash-flow advantages (for example, paying premiums at the beginning of the year under annual in-advance or precession models, with claims paid out after they occur each quarter; investment returns on long-tail risk reserves)
�� Improved control of claims and claim management
�� Enhanced control over pricing and rate setting
Benefit captives
Nonfinancial benefits include:
�� More control over benefit design and policy terms, such as exclusions, free cover limits and event limits
�� Flexibility to make ex gratia payments that a commercial insurer would decline to accept
�� Access to better financial and claim data to help design and carry out demand-side initiatives
The chart below compares typical multinational pooling and captive approaches to a before starting point, which is typically commercial insurance. Moving to the right reduces frictional costs, including insurer profit loadings and risk charges. It also provides an opportunity to assess and define the role and remuneration levels of local brokers. A key element under a captive model is that the fronting insurers/insurance networks typically serve as third-party administrators, and they are passing back (or retroceding) the risk to the captive.
Pre
miu
ms
Before pooling or captive
Typical after pooling Typical after captive
Expense/Risk charge
Insurer profit
International dividend Cash flow retained in captive (minus central administration fee)
Expense/Risk charge
Insurer profit
Claim reserve Claim reserveExpense
Local dividends Local dividends
Commission Commission Commission
Claims Claims Claims
Claim reserve
16 willistowerswatson.com
17 Unlocking potential: global approaches to benefit financing
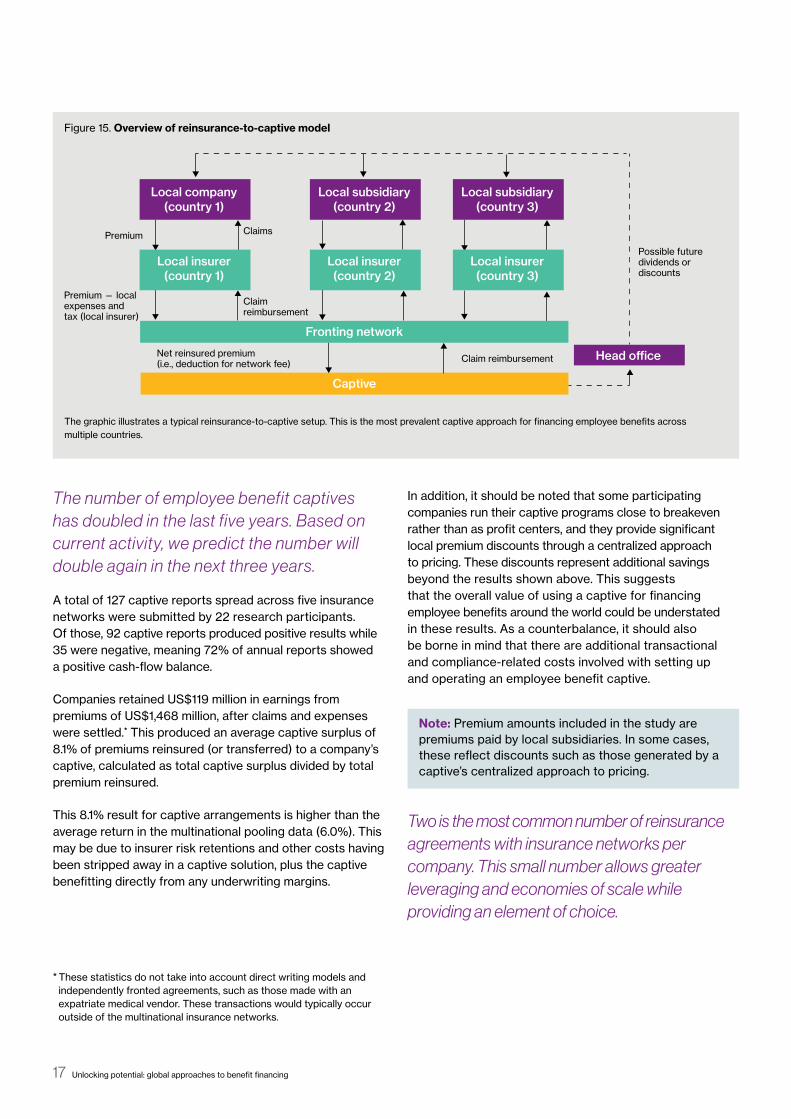
Figure 15. Overview of reinsurance-to-captive model
The graphic illustrates a typical reinsurance-to-captive setup. This is the most prevalent captive approach for financing employee benefits across multiple countries.
Captive
Fronting network
Local company(country 1)
Local insurer(country 1)
Local subsidiary(country 2)
Local insurer(country 2)
Local subsidiary(country 3)
Local insurer(country 3)
Head o�ceClaim reimbursementNet reinsured premium(i.e., deduction for network fee)
Claim reimbursement
Claims
Premium
Premium — local expenses and tax (local insurer)
Possible future dividends or discounts
The number of employee benefit captives has doubled in the last five years. Based on current activity, we predict the number will double again in the next three years.
A total of 127 captive reports spread across five insurance networks were submitted by 22 research participants. Of those, 92 captive reports produced positive results while 35 were negative, meaning 72% of annual reports showed a positive cash-flow balance.
Companies retained US$119 million in earnings from premiums of US$1,468 million, after claims and expenses were settled.* This produced an average captive surplus of 8.1% of premiums reinsured (or transferred) to a company’s captive, calculated as total captive surplus divided by total premium reinsured.
This 8.1% result for captive arrangements is higher than the average return in the multinational pooling data (6.0%). This may be due to insurer risk retentions and other costs having been stripped away in a captive solution, plus the captive benefitting directly from any underwriting margins.
In addition, it should be noted that some participating companies run their captive programs close to breakeven rather than as profit centers, and they provide significant local premium discounts through a centralized approach to pricing. These discounts represent additional savings beyond the results shown above. This suggests that the overall value of using a captive for financing employee benefits around the world could be understated in these results. As a counterbalance, it should also be borne in mind that there are additional transactional and compliance-related costs involved with setting up and operating an employee benefit captive.
* These statistics do not take into account direct writing models and independently fronted agreements, such as those made with an expatriate medical vendor. These transactions would typically occur outside of the multinational insurance networks.
Note: Premium amounts included in the study are premiums paid by local subsidiaries. In some cases, these reflect discounts such as those generated by a captive’s centralized approach to pricing.
Two is the most common number of reinsurance agreements with insurance networks per company. This small number allows greater leveraging and economies of scale while providing an element of choice.
18 willistowerswatson.com
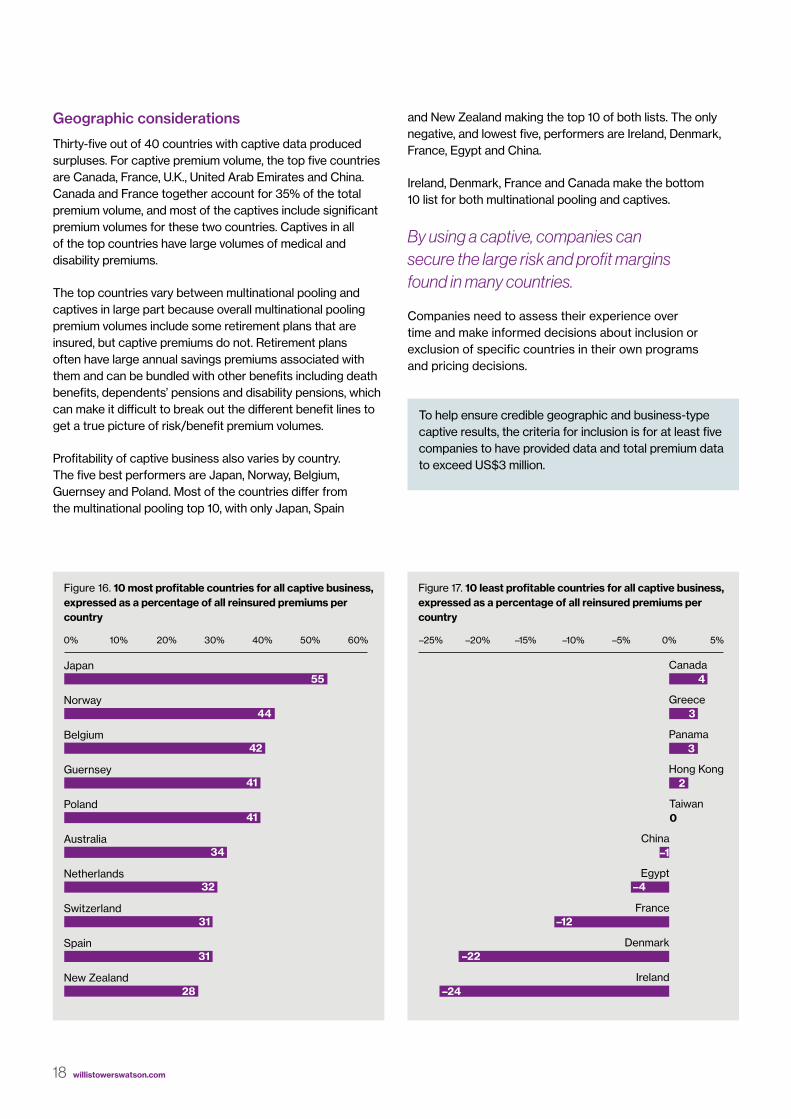
Geographic considerations
Thirty-five out of 40 countries with captive data produced surpluses. For captive premium volume, the top five countries are Canada, France, U.K., United Arab Emirates and China. Canada and France together account for 35% of the total premium volume, and most of the captives include significant premium volumes for these two countries. Captives in all of the top countries have large volumes of medical and disability premiums.
The top countries vary between multinational pooling and captives in large part because overall multinational pooling premium volumes include some retirement plans that are insured, but captive premiums do not. Retirement plans often have large annual savings premiums associated with them and can be bundled with other benefits including death benefits, dependents’ pensions and disability pensions, which can make it difficult to break out the different benefit lines to get a true picture of risk/benefit premium volumes.
Profitability of captive business also varies by country. The five best performers are Japan, Norway, Belgium, Guernsey and Poland. Most of the countries differ from the multinational pooling top 10, with only Japan, Spain
and New Zealand making the top 10 of both lists. The only negative, and lowest five, performers are Ireland, Denmark, France, Egypt and China.
Ireland, Denmark, France and Canada make the bottom 10 list for both multinational pooling and captives.
By using a captive, companies can secure the large risk and profit margins found in many countries.
Companies need to assess their experience over time and make informed decisions about inclusion or exclusion of specific countries in their own programs and pricing decisions.
Figure 16. 10 most profitable countries for all captive business, expressed as a percentage of all reinsured premiums per country
0% 10% 20% 30% 40% 50% 60%
New Zealand
Spain
Switzerland
Netherlands
Australia
Poland
Guernsey
Belgium
Norway
Japan55
44
42
41
41
34
32
31
31
28
Figure 17. 10 least profitable countries for all captive business, expressed as a percentage of all reinsured premiums per country
–25% –20% –15% –10% –5% 0% 5%
4
3
3
2
0
–1
–4
–12
–22
–24Ireland
Denmark
France
Egypt
China
Taiwan
Hong Kong
Panama
Greece
Canada
To help ensure credible geographic and business-type captive results, the criteria for inclusion is for at least five companies to have provided data and total premium data to exceed US$3 million.

19 Unlocking potential: global approaches to insurable benefit financing
Variations by type of business
For life-only contracts in captive arrangements, the overall profitability was 26.8%, while the most profitable countries delivered well over 50%. In Belgium and Japan, which are tariff countries, local insurance pricing is mandated by the regulator. Tariff-related pricing is typically more prudent than in an open commercial market, so including such contracts in a captive can release significant value.
Ireland stands out as a very poor performer, having produced significant losses for captive participants. This is completely aligned with its similarly poor performance within pooling arrangements and has occurred for the same reasons.
Figure 18. Five most profitable countries for life-only business in captives, expressed as a percentage of reinsured life premiums minus life claims
Figure 20. Five most profitable countries for medical-only business in captives, expressed as a percentage of reinsured medical premiums minus medical claims
0% 10% 20% 30% 40% 50% 60% 70% 80%
U.A.E.
Germany
Italy
Japan
Belgium61
59
59
57
54
23
18
18
16
16
0% 5% 10% 15% 20%
Mexico
Indonesia
Colombia
Chile
Turkey16
12
12
10
7
23
18
18
16
16
Figure 19. Five least profitable countries for life-only business in captives, expressed as a percentage of reinsured life premiums minus life claims
Figure 21. Five least profitable countries for medical-only business in captives, expressed as a percentage of reinsured medical premiums minus medical claims
–50% –40% –30% –20% –10% 0% 10%
Ireland
Hong Kong
Canada
U.K.
South Africa9
7
4
3
–44
23
18
18
16
16
–12% –10% –8% –6% –4% –2% 0% 2%
Malaysia
China
U.K.
Egypt
Greece–8
–8
–9
–10
–12
23
18
18
16
16
Turkey is the best-performing country for medical-only contracts in captive arrangements, while Malaysia and China are the worst performers and should be regularly reviewed.
Companies often express concern about placing medical-only business in a captive, but with overall profitability of 0.7%, the study validates our experience that it can be effective to transfer some medical-only business to a captive as long as the company understands and monitors the plan, its experience and pricing.
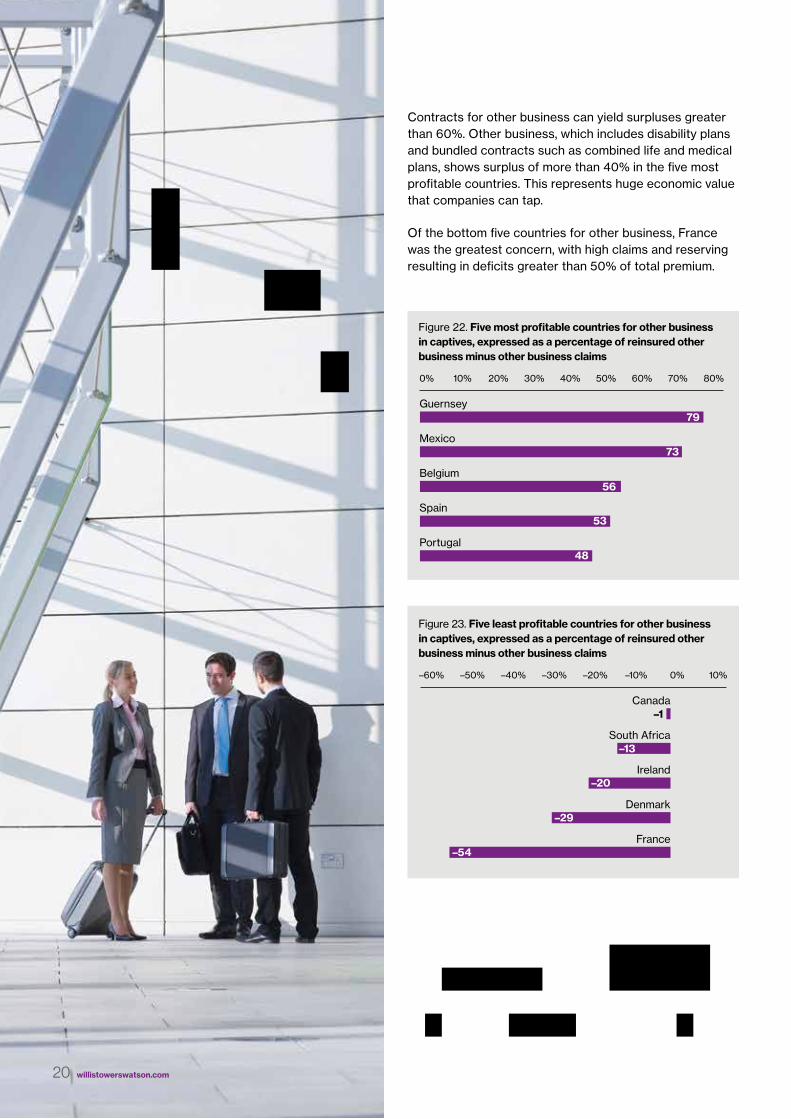
Contracts for other business can yield surpluses greater than 60%. Other business, which includes disability plans and bundled contracts such as combined life and medical plans, shows surplus of more than 40% in the five most profitable countries. This represents huge economic value that companies can tap.
Of the bottom five countries for other business, France was the greatest concern, with high claims and reserving resulting in deficits greater than 50% of total premium.
20 willistowerswatson.com
Figure 22. Five most profitable countries for other business in captives, expressed as a percentage of reinsured other business minus other business claims
0% 10% 20% 30% 40% 50% 60% 70% 80%
Portugal
Spain
Belgium
Mexico
Guernsey79
73
56
53
48
23
18
18
Figure 23. Five least profitable countries for other business in captives, expressed as a percentage of reinsured other business minus other business claims
–60% –50% –40% –30% –20% –10% 0% 10%
France
Denmark
Ireland
South Africa
Canada–1
–13
–20
–29
–54
23
18
18
16
16
Technology/Media/Telecommunications
Manufacturing
Natural Resources
Financial Institutions
Agriculture, Food and Beverages
Pharmaceuticals and Life Sciences
Health Care
Business Services
Construction
Transportation
Other
Automotive
Retail and Distribution
Leisure
45
30
271713
12
107
6 5
11
13
52
Asia
Europe
North America
58
120
10
Asia
Europe
North America
South America
1
14
2
5
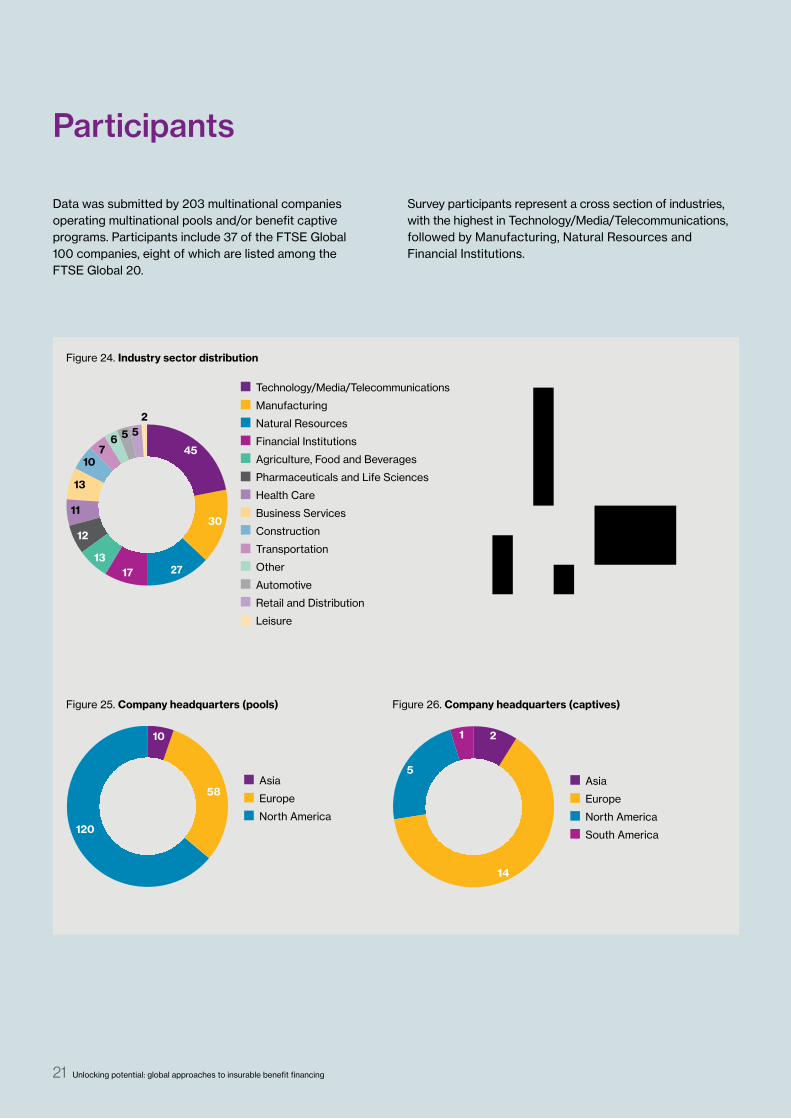
Figure 24. Industry sector distribution
Figure 25. Company headquarters (pools) Figure 26. Company headquarters (captives)
Participants
Data was submitted by 203 multinational companies operating multinational pools and/or benefit captive programs. Participants include 37 of the FTSE Global 100 companies, eight of which are listed among the FTSE Global 20.
Survey participants represent a cross section of industries, with the highest in Technology/Media/Telecommunications, followed by Manufacturing, Natural Resources and Financial Institutions.
21 Unlocking potential: global approaches to insurable benefit financing

3M [C]
ABB
Abbott Laboratories
AbbVie
Accenture
Adidas [C]
AECOM Technology Corp.
Air Products and Chemicals Inc.
Alcatel-Lucent [C+P]
Alcoa Inc.
Allergan
Alliance Data Systems Corp.
Alstom
Amadeus IT Group SA
Amazon.com Inc.
Amcor
American Express Co.
American International Group Inc.
Anglo American Plc
Apple Inc.
Applied Materials Inc.
Arrow Electronics Inc.
Arup
AT Kearney
Atradius
AT&T
Avis Budget Group Inc.
Bacardi Ltd
Baker Hughes Inc.
Ball Corp.
Barclays Plc
BASF AG
Baxter International Inc.
Bekaert
BHP Billiton [C]
Biogen Idec
Black & Veatch
Bloomberg LP
BMC Software
BNP Paribas
BNY Mellon
BP [C]
Bristol-Myers Squibb
Broadridge Financial Solutions Inc.
Brown Brothers Harriman
BT Group Plc [C]
Cameron International Corp.
Capgemini
CargillThe Carlyle Group
Celanese Corp.
Celgene Corp.
Cemex [C]
Cisco Systems Inc.
Citigroup Inc.
Coca-Cola Company [C]Coca-Cola European Partners
Colt Group SA
Commerzbank AG
ConocoPhillips
Corning Inc.
Covance Inc.
CR Bard Inc.
Credit Suisse Group AG
Cytec Industries Inc.
Daimler AG
Danaher
Deutsche Lufthansa AG
DeutschePost (DHL) [C]
Diageo [C+P]
Diebold Inc.
Dover Corp.
The Dow Chemical Co. [C+P]
EY
Eaton Corp.
El Du Pont de Nemours & Co.
Energizer Holdings Inc.
Ericsson
Expedia Inc. Experian
F Hoffmann-La Roche LtdFidelity Investment Management Ltd
Fluor Corp.
FMC Technologies Inc.
Ford Motor Co.
Freshfields Bruckhaus Deringer LLP
Fujitsu Ltd
G4S Plc
Gate Gourmet
GEA Group AG
General Electric
General Mills Inc.
Genworth Financial Inc.
Georg Fischer AG
Givaudan
GKN Plc
Glaxo Smithkline [C]
The Goodyear Tire & Rubber Co.
Harlequin Enterprises Ltd.
Hewlett Packard Enterprise
Hitachi
H Lundbeck A/S
22 willistowerswatson.com
Participants*

23 Unlocking potential: global approaches to insurable benefit financing
Honeywell
HSBC [C]
Huntsman International
IBM
Illinois Tool Works Inc.
Infineum International Ltd.
Ingersoll Rand
Intercontinental Hotels Group
International Paper
Interpublic Group
Itron Inc.
Jacobs Engineering Group Inc.
Jeld-Wen Inc.Johnson & Johnson
Johnson Matthey
JP Morgan Chase & Co.
JT International SA
JVC Kenwood
KBR Inc.
Kelly Services Inc.
Lear Corp.
The Linde Group
Lonza
L'Oreal Group
The Lubrizol Corp.
LyondellBasell Industries
Masco Corp.
Mastercard
Merck & Co. Inc.
Molex Inc.
Momentive Performance Materials Holdings LLC
Mondelez International Inc. [C+P]
Monsanto Co.
NCR Corp.
NEC Corp.
Nestle [C]
Net App
Novartis AG
Nuance Communications Inc.
NXP Semiconductors
Oce Technologies
Oracle
Owens Illinois Inc.
Panasonic
Pearson Plc
PepsiCo Inc.
Pfizer Inc.
Philip Morris
Pitney Bowes Inc.
Praxair Inc.
Qualcomm Inc.
Rabobank
Ralph Lauren Corp.
*Notes: [C] represents companies whose captive reports are included in our research study. [C+P] represents companies whose captive and pooling reports are included in our research study. For all others companies, our study includes their pooling reports only.
Company names are reported in accordance with the pool or captive reports received. In a few cases, these names may not reflect recent mergers, divestitures or acquisitions.
Reckitt Benckiser Group plc
Rexel SA
Richemont [C]
Rockwell Automation
Roquette Freres
Sandvik AB
Sanofi
SC Johnson & Son Inc.
Scotiabank
Seagate Technology
Sealed Air Corp.
SGS SA
Shell [C]
Sika
SMC
Smith & Nephew Plc
Sony Corp. [C+P]
Stanley, Black & Decker Inc.
Starwood Hotels & Resorts Worldwide Inc.
St. Jude Medical Inc.
Stryker Corp.Sumitomo Corporation
Symantec Corp.
Syngenta [C+P]
Terumo
Tetra Laval
Textron Inc.
Thomson Reuters
Total
Trinseo
Tyco
UBM
Unilever [C+P]
Unisys Corp.
United Continental Holdings Inc.
UPS Inc.
Verizon
Visa Inc.
Vmware Inc.
Vodafone [C]
Walmart
The Walt Disney Co.
The Western Union Co.
Willis Towers Watson
Wolters Kluwer NV
Yahoo! Inc.
Appendix 1 Sample participant company XYZ bespoke benchmarking report
24 willistowerswatson.com
25 Unlocking potential: global approaches to insurable benefit financing
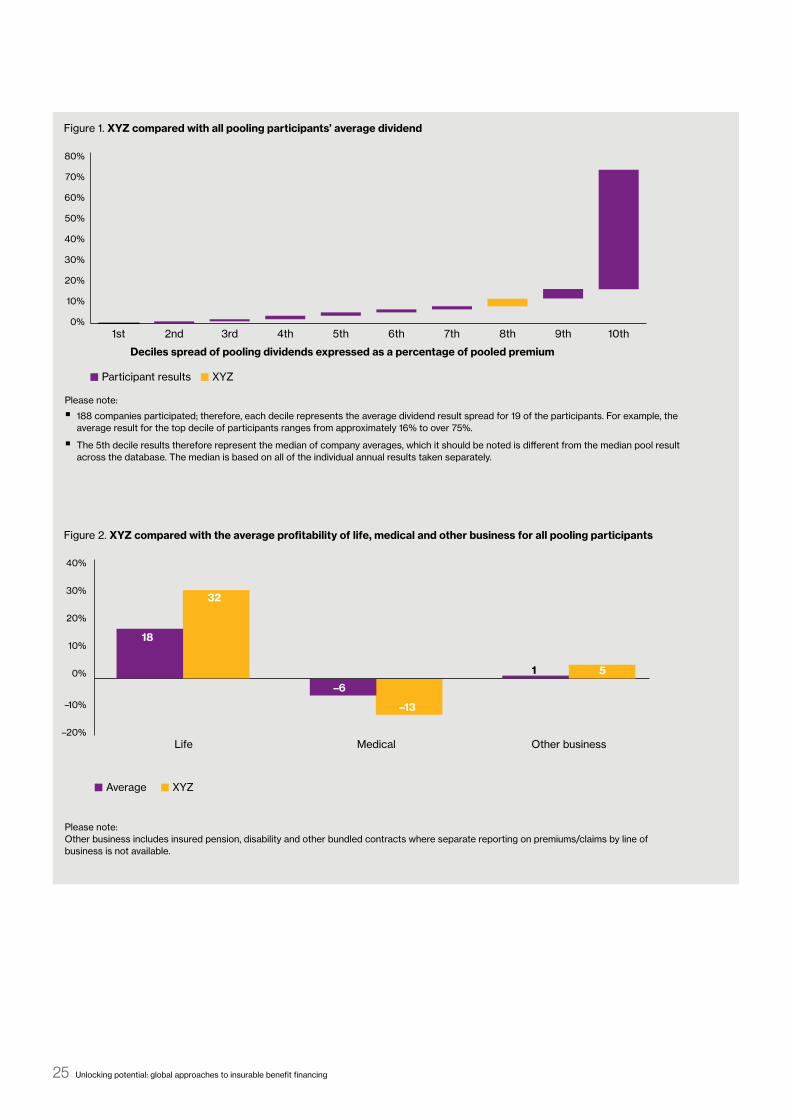
Figure 1. XYZ compared with all pooling participants’ average dividend
Figure 2. XYZ compared with the average profitability of life, medical and other business for all pooling participants
Participant results XYZ
Deciles spread of pooling dividends expressed as a percentage of pooled premium
0%
10%
20%
30%
40%
50%
60%
70%
80%
10th9th8th7th6th5th4th3rd2nd1st
Average XYZ
–20%
–10%
0%
10%
20%
30%
40%
Other businessMedicalLife
18
32
–6
–13
1 5
Please note:
�� 188 companies participated; therefore, each decile represents the average dividend result spread for 19 of the participants. For example, the average result for the top decile of participants ranges from approximately 16% to over 75%.
�� The 5th decile results therefore represent the median of company averages, which it should be noted is different from the median pool result across the database. The median is based on all of the individual annual results taken separately.
Please note: Other business includes insured pension, disability and other bundled contracts where separate reporting on premiums/claims by line of business is not available.
26 willistowerswatson.com
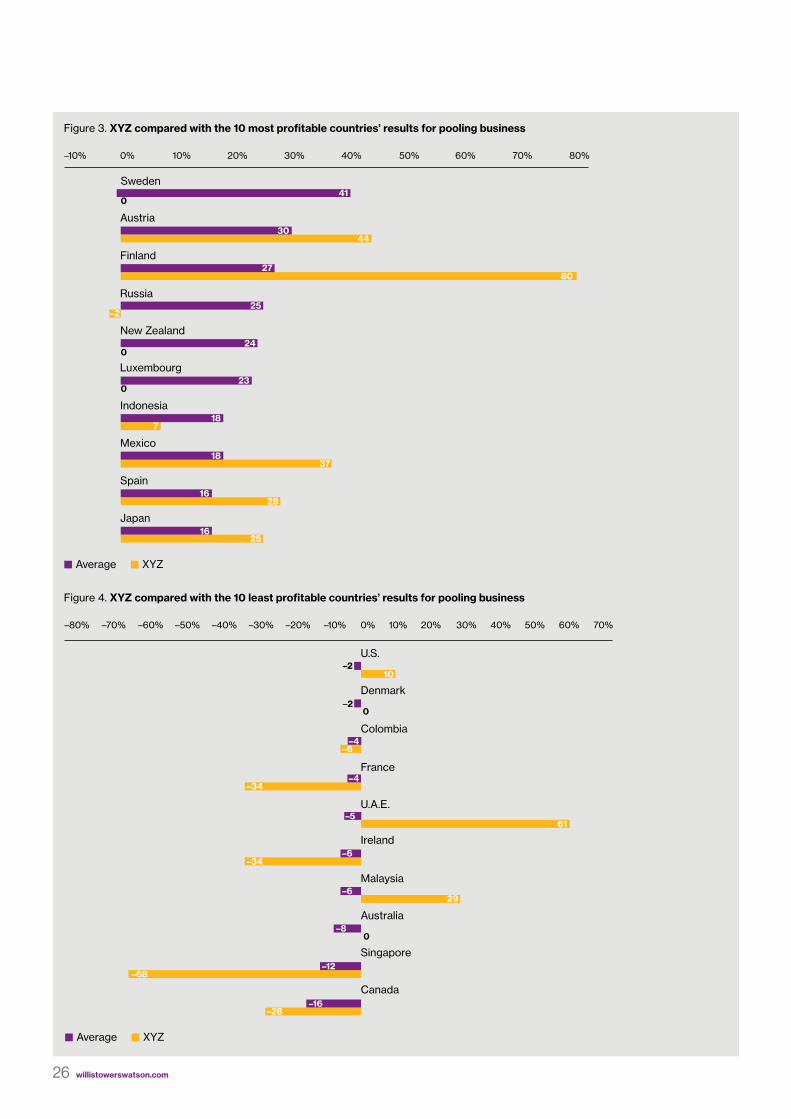
Figure 3. XYZ compared with the 10 most profitable countries’ results for pooling business
Figure 4. XYZ compared with the 10 least profitable countries’ results for pooling business
Average XYZ
–10% 0% 10% 20% 30% 40% 50% 60% 70% 80%
Japan
Spain
Mexico
Indonesia
Luxembourg
New Zealand
Russia
Finland
Austria
Sweden41
3044
2780
–225
24
230
0
0
187
1837
1628
1625
Average XYZ
–80% –70% –60% –50% –40% –30% –20% –10% 0% 10% 20% 30% 40% 50% 60% 70%
Canada
Singapore
Australia
Malaysia
Ireland
U.A.E.
France
Colombia
Denmark
U.S.–2
–20
–6
–34–4
–5
–6–34
0
–629
–12–68
–28
10
61
–16
–8
–4
Appendix 2 How to become a research study participant
More than 200 of the world’s leading multinationals supply data to aid our research into multinational pooling and captive benefit financing approaches. This provision of data enables us to analyze approaches and outcomes and to produce the kind of results and observations contained within this research report.
More data helps us provide more credible statistical observations designed to help multinational companies optimize the financing of their employee benefit pooling or captive arrangements. Therefore, we are continuing to seek new participants and their latest pooling and captive reports plus fresh data from existing participants.
In return for participants sharing data with us, we provide participants only with complimentary bespoke benchmarking data (see Appendix 1 for an example) on:
�� Your pool’s/captive’s overall financial performance compared to others
�� Your pool’s/captive’s financial performance by country and line of business (life, medical and other)
�� Your claims experience (life, medical and other) as a percentage of premium in your main countries of business and how this compares to others
How to participate? All you need to do is email copies of your last three years of annual pooling or captive reports to [email protected]. If you do not have copies of all your reports at hand, please email us your authorization and we will contact your pooling/captive networks on your behalf.
Please note:
�� All data will be kept confidential and used solely for the purpose of this research study.
�� Results will only be shown in the aggregate, with no identification of individual company data.
�� Results will be published in research reports such as this one periodically.
�� Your company name will be listed as a participant in the same way that participants are listed in this report.
�� Only participating companies will receive their own detailed benchmarking reports at no charge, and this will be provided within three months of sharing their data.
Thank you in advance for your participation. If you have any questions, please ask your Willis Towers Watson consultant or email [email protected].
27 Unlocking potential: global approaches to insurable benefit financing
For more information
Please contact your Willis Towers Watson consultant or:
Roger Beech [email protected]
Alternatively, please contact:
Americas Ricardo Anderson [email protected]
Kathleen Waslov [email protected]
Europe, Middle East and Africa Mark Cook [email protected]
Asia Pacific Rajesh Daswani [email protected]
Yoichi Okamoto [email protected]
28 willistowerswatson.com

Copyright © 2017 Willis Towers Watson. All rights reserved.WTW-GL-16-RES-5043e
willistowerswatson.com
About Willis Towers WatsonWillis Towers Watson (NASDAQ: WLTW) is a leading global advisory, broking and solutions company that helps clients around the world turn risk into a path for growth. With roots dating to 1828, Willis Towers Watson has 39,000 employees in more than 120 countries. We design and deliver solutions that manage risk, optimize benefits, cultivate talent, and expand the power of capital to protect and strengthen institutions and individuals. Our unique perspective allows us to see the critical intersections between talent, assets and ideas — the dynamic formula that drives business performance. Together, we unlock potential. Learn more at willistowerswatson.com.
Willis Towers Watson71 High HolbornLondonWC1V 6TP
Towers Watson Limited (trading as Willis Towers Watson) is authorised and regulated by the Financial Conduct Authority in the UK.
The information in this publication is of general interest and guidance. Action should not be taken on the basis of any article without seeking specific advice.
To unsubscribe, email [email protected] with the publication name as the subject and include your name, title and company address.
willistowerswatson.com/social-media