university of zurich - zurich open repository and … · university of zurich ... shaper and...
TRANSCRIPT
University of ZurichZurich Open Repository and Archive
Winterthurerstr. 190
CH-8057 Zurich
http://www.zora.uzh.ch
Year: 2010
Enhancing signal detection and completely eliminating scatteringusing quasi-phase-cycling in 2D IR experiments
Bloem, R; Garrett-Roe, S; Strzalka, H; Hamm, P; Donaldson, P M
Bloem, R; Garrett-Roe, S; Strzalka, H; Hamm, P; Donaldson, P M (2010). Enhancing signal detection andcompletely eliminating scattering using quasi-phase-cycling in 2D IR experiments. Optics Express,18(26):27067-27078.Postprint available at:http://www.zora.uzh.ch
Posted at the Zurich Open Repository and Archive, University of Zurich.http://www.zora.uzh.ch
Originally published at:Bloem, R; Garrett-Roe, S; Strzalka, H; Hamm, P; Donaldson, P M (2010). Enhancing signal detection andcompletely eliminating scattering using quasi-phase-cycling in 2D IR experiments. Optics Express,18(26):27067-27078.
Enhancing signal detection and completely eliminating scatteringusing quasi-phase-cycling in 2D IR experiments
Abstract
We demonstrate how quasi-phase-cycling achieved by sub-cycle delay modulation can be used toreplace optical chopping in a box-CARS 2D IR experiment in order to enhance the signal size, and, atthe same time, completely eliminate any scattering contamination. Two optical devices are describedthat can be used for this purpose, a wobbling Brewster window and a photoelastic modulator. They aresimple to construct, easy to incorporate into any existing 2D IR setup, and have attractive features suchas a high optical throughput and a fast modulation frequency needed to phase cycle on a shot-to-shotbasis. (C) 2010 Optical Society of America
Enhancing signal detection andcompletely eliminating scattering using
quasi-phase-cycling in 2D IRexperiments
Robbert Bloem,1 Sean Garrett-Roe,1 Halina Strzalka, Peter Hamm,1,∗Paul Donaldson1,2
1Physical Chemistry Institute, University of Zurich, Winterthurerstrasse 190, 8057 Zurich,Switzerland
[email protected]∗[email protected]
Abstract: We demonstrate how quasi-phase-cycling achieved bysub-cycle delay modulation can be used to replace optical chopping in abox-CARS 2D IR experiment in order to enhance the signal size, and, at thesame time, completely eliminate any scattering contamination. Two opticaldevices are described that can be used for this purpose, a wobbling Brewsterwindow and a photoelastic modulator. They are simple to construct, easyto incorporate into any existing 2D IR setup, and have attractive featuressuch as a high optical throughput and a fast modulation frequency neededto phase cycle on a shot-to-shot basis.
© 2010 Optical Society of America
OCIS codes: (120.6200) Spectrometers and spectroscopic instrumentation; (320.7150) Ultra-fast spectroscopy; (300.6300) Spectroscopy, fourier transforms.
References and links1. S. Mukamel and R. M. Hochstrasser, “2D spectroscopy,” Chem. Phys. 266, 135–136 and all articles in that issue
(2001).2. R. M. Hochstrasser, “Multidimensional ultrafast spectroscopy,” Proc. Natl. Acad. Sci. USA 104, 14189 and all
articles in that issue (2007).3. S. Mukamel, Y. Tanimura, and P. Hamm, “Coherent multidimensional optical spectroscopy,” Acc. Chem. Re-
search 42, 1207–1209 and all articles in that issue (2009).4. S. Mukamel, “Multidimensional femtosecond correlation spectroscopies of electronic and vibrational excita-
tions,” Annu. Rev. Phys. Chem. 51, 691–729 (2000).5. P. Hamm and R. M. Hochstrasser, “Structure and dynamics of proteins and peptides: Femtosecond two-
dimensional infrared spectroscopy,” in Ultrafast Infrared and Raman Spectroscopy, M. D. Fayer, ed. (MarcelDekker, New York, 2001), pp. 273–347.
6. M. T. Zanni and R. M. Hochstrasser, “Two-dimensional infrared spectroscopy: a promising new method for thetime resolution of structures,” Curr. Opin. Struct. Biol. 11, 516–522 (2001).
7. N. H. Ge and R. M. Hochstrasser, “Femtosecond two-dimensional infrared spectroscopy: IR-COSY andTHIRSTY,” Phys. Chem. Comm. 5, 17–26 (2002).
8. S. Woutersen and P. Hamm, “Nonlinear 2D vibrational spectroscopy of peptides,” J. Phys.: Condens. Matter 14,R1035–R1062 (2002).
9. D. M. Jonas, “Two-dimensional femtosecond spectroscopy,” Ann. Rev. Phys. Chem. 54, 425–463 (2003).10. M. Cho, “Coherent two-dimensional optical spectroscopy,” Bull. Korean Chem. Soc. 27, 1940–1960 (2006).11. J. Zheng, K. Kwak, and M. D. Fayer, “Ultrafast 2D IR vibrational echo spectroscopy,” Acc. Chem. Research 40,
75–83 (2007).12. J. Bredenbeck, J. Helbing, C. Kolano, and P. Hamm, “Ultrafast 2D-IR spectroscopy of transient species,”
ChemPhysChem 8, 1747–1756 (2007).
#136705 - $15.00 USD Received 20 Oct 2010; revised 11 Nov 2010; accepted 16 Nov 2010; published 8 Dec 2010(C) 2010 OSA 20 December 2010 / Vol. 18, No. 26 / OPTICS EXPRESS 27067
13. I. J. Finkelstein, J. Zheng, H. Ishikawa, S. Kim, K. Kwak, and M. D. Fayer, “Probing dynamics of complexmolecular systems with ultrafast 2D IR vibrational echo spectroscopy,” Phys. Chem. Chem. Phys. 9, 1533–1549(2007).
14. P. Hamm, J. Helbing, and J. Bredenbeck, “Two-dimensional infrared spectroscopy of photoswitchable peptides,”Annu. Rev. Phys. Chem. 59, 291–317 (2008).
15. Z. Ganim, H. S. Chung, A. W. Smith, L. P. DeFlores, K. C. Jones, and A. Tokmakoff, “Amide I two-dimensionalinfrared spectroscopy of proteins,” Acc. Chem. Res. 41, 432–441 (2008).
16. Y. S. Kim and R. M. Hochstrasser, “Applications of 2D IR spectroscopy to peptides, proteins, and hydrogen-bonddynamics,” J. Phys. Chem. B 113, 8231–8251 (2009).
17. M. Cho, Two-Dimensional Optical Spectroscopy (CRC Press, Boca Raton, 2009).18. S. H. Shim and M. T. Zanni, “How to turn your pump-probe instrument into a multidimensional spectrometer:
2D IR and Vis spectroscopies via pulse shaping,” Phys. Chem. Chem. Phys. 11, 748–761 (2009).19. P. Hamm and M. T. Zanni, Concepts and Methods of 2D Infrared Spectrsocopy (Cambridge University Press,
Cambridge, 2011).20. E. R. Andresen, R. Gremaud, A. Borgschulte, A. J. Ramirez-Cuesta, A. Zuttel, and P. Hamm, “Vibrational dy-
namics of LiBH4 by infrared pump-probe and 2D spectroscopy,” J. Phys. Chem. A 113, 12838–12846 (2009).21. S. H. Shim, D. B. Strasfeld, Y. L. Ling, and M. T. Zanni, “Automated 2D IR spectroscopy using a mid-IR pulse
shaper and application of this technology to the human islet amyloid polypeptide,” Proc. Natl. Acad. Sci. USA104, 14197–14202 (2007).
22. D. Keusters, H. Tan, and W. Warren, “Role of pulse phase and direction in two-dimensional optical spectroscopy,”J. Phys. Chem. A 103, 10369–10380 (1999).
23. W. DeBoeij, M. Pshenichnikov, and D. Wiersma, “Phase-locked heterodyne-detected stimulated photon echo. Aunique tool to study solute-solvent interactions,” Chem. Phys. Lett. 238, 1–8 (1995).
24. A. Albrecht, J. Hybl, S. Faeder, and D. M. Jonas, “Experimental distinction between phase shifts and time delays:Implications for femtosecond spectroscopy and coherent control of chemical reactions,” J. Chem. Phys. 111,10934–10956 (1999).
25. P. Tian, D. Keusters, Y. Suzaki, and W. Warren, “Femtosecond phase-coherent two-dimensional spectroscopy,”Science 300, 1553–1555 (2003).
26. P. Tekavec, G. Lott, and A. Marcus, “Fluorescence-detected two-dimensional electronic coherence spectroscopyby acousto-optic phase modulation,” J. Chem. Phys. 127, 214307 (2007).
27. E. M. Grumstrup, S.-H. Shim, M. A. Montgomery, N. H. Damrauer, and M. T. Zanni, “Facile collection of two-dimensional electronic spectra using femtosecond pulse-shaping technology,” Optics Express 15, 16681 (2007).
28. J. A. Myers, K. L. M. Lewis, P. F. Tekavec, and J. P. Ogilvie, “Two-color two-dimensional Fourier transformelectronic spectroscopy with a pulse-shaper,” Opt. Express 16, 17420–17428 (2008).
29. A. D. Bristow, D. Karaiskaj, X. Dai, T. Zhang, C. Carlsson, K. R. Hagen, R. Jimenez, and S. T. Cundiff, “Aversatile ultrastable platform for optical multidimensional fourier-transform spectroscopy,” Rev. Sci. Instrum.80, 073108 (2009).
30. W. Warren and A. Zewail, “Multiple phase-coherent laser pulses in optical spectroscopy. I. The technique andexperimental applications,” J. Chem. Phys. 78, 2279 (1983).
31. J. Helbing and P. Hamm, “A compact implementation of Fourier transform 2D-IR spectroscopy without phaseambiguity,” J. Opt. Soc. Am. B (submitted).
32. M. Bonmarin and J. Helbing, “Polarization control of ultrashort mid-IR laser pulses for transient vibrationalcircular dichroism measurements,” Chirality 21, E298–E306 (2009).
33. F. Dostal, “Resonant torsional oscillators - patent 3609485,” United States Patent (1969).
1. Introduction
In recent years, 2D IR spectroscopy has developed rapidly into a powerful technique for study-ing structural dynamics of increasingly large and complex molecules [1–19]. For the applica-tion of 2D IR spectroscopy to low concentration analytes such as proteins, signal-to-noise andsignal-to-background ratios place constraints on what systems can be studied. The challengeis to develop experimental setups that produce the strongest 2D IR signal and measure it withthe minimum amount of signal loss. A number of experimental techniques have been devel-oped for acquiring 2D IR spectra, each with their own balance of simplicity, flexibility andsignal-to-noise levels [19].
In this paper, we focus on experimental arrangements where the 2D IR signal can be spatiallyisolated from the three incident beams through phase matching and then heterodyne detectedusing a separate local oscillator pulse (which, for brevity, we will denote loosely as a ‘box-CARS’ arrangement). The box-CARS geometry allows for the most flexible control of all pulse
#136705 - $15.00 USD Received 20 Oct 2010; revised 11 Nov 2010; accepted 16 Nov 2010; published 8 Dec 2010(C) 2010 OSA 20 December 2010 / Vol. 18, No. 26 / OPTICS EXPRESS 27068
parameters, and is, at the same time, potentially the most sensitive 2D IR setup. However, notonly the desired heterodyned 2D IR signal is measured but also unwanted contributions whichoriginate from interference between scattered light of any pairwise combination of the threeincident beams, the local oscillator and the signal field. Scattering occurs when imperfectionsin the windows are present (scratches, fingerprints), when the sample is impure or when thesample is intrinsically scattering (polycrystalline materials [20], macroscopic aggregates [21]).The scattering signal appears on the diagonal of the 2D IR spectrum and adds significantly tothe challenge of measuring small signals.
In most realizations of 2D IR spectroscopy, an optical chopper is used to block one of theincident beams every other laser shot. By taking the difference between the two measurements,all contributions that are present in both measurements (i.e. all combinations except those whichinclude the chopped beam) will be removed, while the signal remains. However, choppingcomes at a high price, as the signal is measured only every other laser shot. Furthermore, itdoes not remove scattering contributions involving the chopped pulse.
In NMR spectroscopy, carefully chosen phase-cycling sequences are used to select certaincontributions and remove others [22]. In short, if the phase difference between two measure-ments is π , the sign of the two measurements is opposite and a subtraction will result in doublethe signal of a single measurement while an addition will result in total elimination. Compara-ble schemes have been implemented for the optical counterparts, see for example Wiersma andcoworkers [23], Jonas [24], Warren [25], Marcus [26], Zanni [18, 27], Ogilvie [28] and Cun-diff [29]. While phase shifts and pulse delays are completely independent in NMR sequences,this is not necessarily the case for optical spectroscopy (Fig. 1). With a pulse shaper or an acous-tic optical modulator (AOM), phase and delay can in fact be modulated independently [30]. Ifsome of the pulses are collinear, as in a pump/probe 2D IR setup [18], a single pulse shapercan modulate the phase of two interactions [18,27,28]. Modulation of an experiment with fourindependent beams, such as a box-CARS 2D IR arrangement, would imply adding more pulseshapers or AOMs to achieve the necessary phase control, as for example Marcus does in thevisible [26], with the drawback that IR AOM’s are not very efficient (30-50%).
In this paper, we will present a simple quasi-phase-cycling scheme achieved by sub-cycledelay modulation, which makes full use of all available laser shots in order to maximize the2D IR signal-to-noise ratio. A sub-cycle delay modulation is introduced by either a wobblingbrewster window or a photo-elastic modulator (PEM), both of which modulate the optical pathlength. Despite the fact that these devices generate a sub-cycle pulse delay rather than a purephase shift (Fig. 1a), we will show that they affect the desired 2D IR signal only minimally overa bandwidth of many 100 cm−1, while at the same time completely suppressing all scatteringcontributions in a way similar to pure phase-cycling. These devices are simple to constructand can easily be incorporated into any existing 2D IR setup, as they do not redirect the beampath. Furthermore, they have essentially 100% throughput and do not cause any light losses.We focus our discussion on 2D IR spectroscopy, but the concepts will work equally well in thevisible or UV spectral range.
2. Theory
We describe all relevant laser fields in the time domain as
E(t) = E(t)e−i(ω0t+φ), (1)
where E(t) is the envelope, ω0 the carrier frequency and φ the phase. The frequency domainrepresentation of this pulse is:
E(ω) = E(ω)e−i(ωt0+φ), (2)
#136705 - $15.00 USD Received 20 Oct 2010; revised 11 Nov 2010; accepted 16 Nov 2010; published 8 Dec 2010(C) 2010 OSA 20 December 2010 / Vol. 18, No. 26 / OPTICS EXPRESS 27069
No shift
� pure phaseshift
�* quasiphase shift
t=0 Time
π
–π
0
Spe
ctra
l pha
se
(a) (b)
No shift
Pure phase shiftQuasi phase shift
10.9 1.1Frequency (ω/ω0)
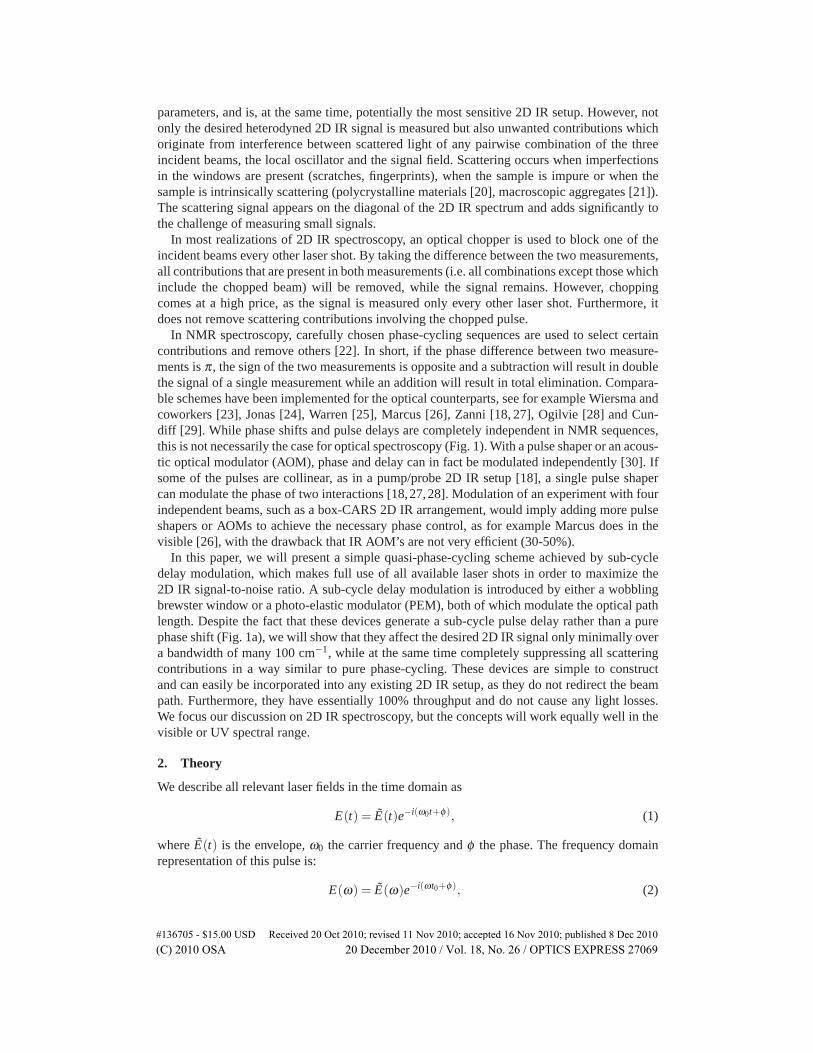
Fig. 1. A pure π phase shift versus a quasi-phase shift achieved by a sub-cycle delay. (a)In the time domain, a pure π phase shift will move the carrier only but keeps the pulseenvelope constant in time. A quasi-phase shift, in contrast, will move both the envelopeand the carrier. (b) In the frequency domain, the spectral phase of a pure phase modulationis independent of the frequency (solid line). A quasi-phase shift will have a spectral phasethat varies linearly with frequency (dotted line).
where t0 is the time delay of the pulse, and where we assume E(ω) to be real-valued (i.e.a bandwidth-limited pulse). For spectral interferometry, the interference between any pair ofpulses i and j is given as
|Ei(ω)+E j(ω)|2 = E2i (ω)+ E2
j (ω)+2Ei(ω)E j(ω)cos(ωΔt +Δφ) (3)
where Δt the time delay difference between the two pulses and Δφ the phase difference. We areonly interested in the cross term, which we define as
Si j(Δt,Δφ)≡ Ei(ω)E j(ω)cos(ωΔt +Δφ) (4)
In this expression, pulses Ei and E j can be any pairwise combination of the incident pumppulses E1, E2, E3, the local oscillator ELO, and the signal field E2DIR.
In a heterodyne detected 2D IR experiment (Fig. 2), three incident fields E1, E2, E3 withdifferent k-vectors k1, k2 and k3 interact with the sample and generate the signal field E2DIR,which is emitted in a certain phase matching direction (k2DIR =±k1∓k2+k3). It is then hetero-dyned with the local oscillator by spectral interferometry, Eq. (4), to give E2DIRELO. This termis measured as a function of t1 by scanning pulses 1 and/or 2 in time and Fourier transformingit to obtain the ω1 axis of the 2D spectrum, while the Fourier transformation with respect totime t3, revealing the ω3 axis, is measured directly using a grating spectrometer and an arraydetector.
In addition to the desired E2DIRELO term, many other interference terms are present on thedetector. These originate from scattered light so phase-matching can no longer be used to elim-inate them. For example, pulse 1 might scatter into the direction of the local oscillator andinterfere on the detector, causing a signal E1ELO. As time t1 is scanned during the experiment,this signal will oscillate according to Eq. (4) (Δt equals t1 + t2 + t3 in this case), and will giverise to a signal along the diagonal of the 2D IR spectrum after the t1-Fourier transformation.The goal of this work is to suppress these types of signals.
#136705 - $15.00 USD Received 20 Oct 2010; revised 11 Nov 2010; accepted 16 Nov 2010; published 8 Dec 2010(C) 2010 OSA 20 December 2010 / Vol. 18, No. 26 / OPTICS EXPRESS 27070
12
3LOTime
t1t2t3
Modulator 1,2Modulator 3
2DIR signal
Sample
Beamsplitters
Translation stages
IR
Time periods
Spectrometerand array
detector
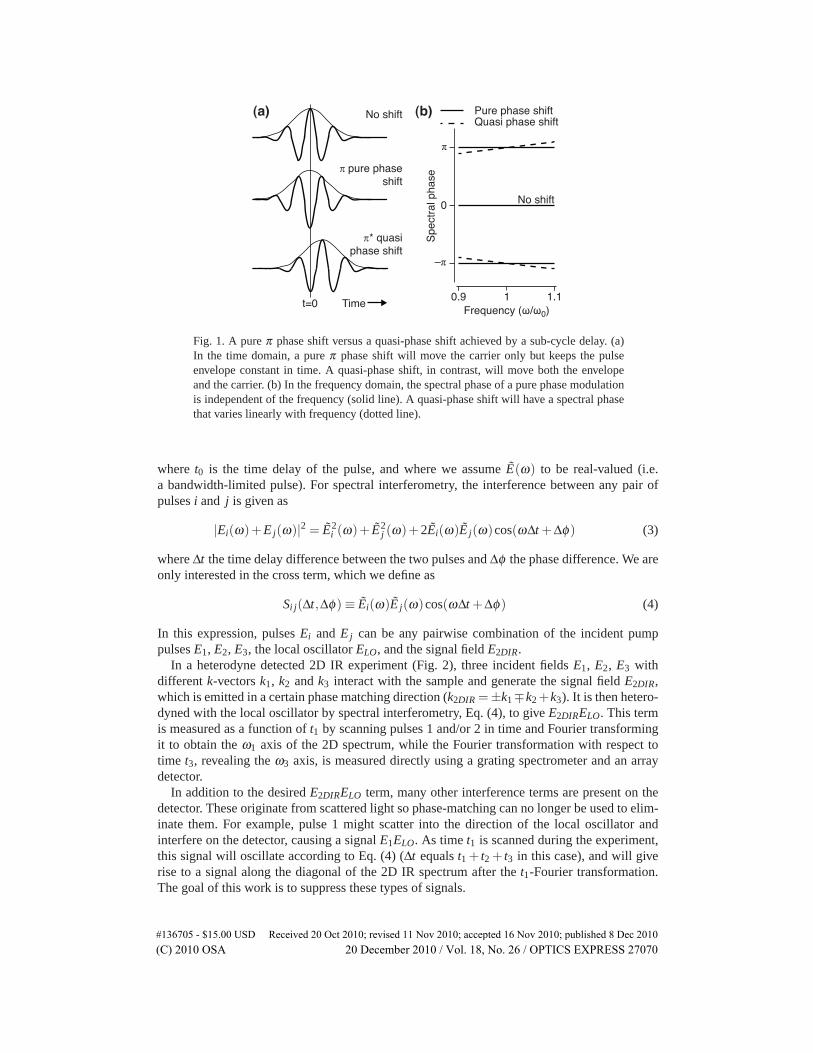
Fig. 2. A schematic drawing of the box-CARS 2D IR setup. An IR pulse is split into fourpulses E1, E2, E3 and ELO. Pulses 1 and 2 are transmitted together through one modulatorbefore they are split, while pulse 3 is modulated independently. The three incident pulsesgenerate the signal field E2DIR, which is heterodyned with the local oscillator by spectralinterferometry. The timing notation is defined at the bottom of the figure.
Finally, we note that depending on the phase matching geometry, pump-probe signals canbe present as well. They are 3rd-order signals that take two field interactions from either ofthe pump-pulses 1, 2, or 3, and use the local oscillator for both the 3rd field interaction aswell as heterodyning. The pump-probe signals are inherently not phase sensitive, thus are notoscillatory. They will appear at essentially zero-frequency after the t1-Fourier transformation,and hence are not so much of a concern here because they will be suppressed anyway.Nevertheless, the phase-cycling schemes described below will also suppress these pump-probecontributions.
2.1. Simple phase-cycling scheme
In order to illustrate the basic concept of phase-cycling, and also the difference between a purephase shift and quasi-phase shift achieved through sub-cycle delay modulation, we start outwith a simple phase-cycling scheme that modulates only pulse 3. That is, pulse 3 will havephase φ3 = 0 for one laser shot, and phase φ3 = π for the next. The phase of the signal fieldE2DIR depends on the phases of all three incident pulses:
φ2DIR =±φ1 ∓φ2 +φ3, (5)
hence, it will have the same phase as φ3 and thus will be modulated as well in this phase-cyclingscheme. Subtracting the two measurements results in
S2DIR,LO(Δt) = S2DIR,LO (Δt,Δφ = 0)−S2DIR,LO (Δt,Δφ = π)= 2E2DIR(ω)ELO(ω)cos(ωΔt) (6)
Since the sign of the two measurements is opposite due to the π-phase shift in the secondmeasurement, subtraction will double the signal.
The optical devices we discuss below cause a sub-cycle delay modulation δ t rather than apure phase modulation (Fig. 1a). Equation (4) then becomes
Si j(Δt +dt) = Ei(ω)E j(ω)cos(ω(Δt +δ t)). (7)
#136705 - $15.00 USD Received 20 Oct 2010; revised 11 Nov 2010; accepted 16 Nov 2010; published 8 Dec 2010(C) 2010 OSA 20 December 2010 / Vol. 18, No. 26 / OPTICS EXPRESS 27071
where we assumed that the pure phase difference is Δφ = 0. In effect, the sub-cycle delaymodulation δ t will take over the role of a phase shift Δφ . That is, we will use a time delayδ t that equals half an optical period of the carrier frequency, δ t = π/ω0. This will result ina spectral phase that equals π at the center of the pulse bandwidth (ω = ω0) but will deviatelinearly from π for ω �= ω0 (Fig. 1b). Equation (6) is then modified into
S2DIR,LO(Δt) = S2DIR,LO(Δt)−S2DIR,LO(Δt +π/ω0)
= 2E2DIR(ω)ELO(ω)sin
(ωΔt +
πω2ω0
)sin
(ωπ2ω0
). (8)
The oscillatory term is slightly different (in fact we have sin(ωΔt +πω/2ω0) ≈ cos(ωΔt) forω ≈ ω0), but more important is the additional sin(ωπ/2ω0)-term, which can be interpreted asa spectral response. For the center frequency of the pulse (ω = ω0), the spectral response is 1and the pure and quasi-phase shift have the same amplitude. For off-center frequencies ω �= ω0,the spectral response is < 1. However, the signal reduction is very small, less than 1.2% for afrequency window of ±10% around the center frequency. For convenience, we will call a sub-cycle delay of δ t = π/ω0 a quasi-phase shift Δφ∗ = π∗ in the following, where the asteriskdenotes that this is strictly correct only for ω = ω0.
We reiterate that both pure and quasi-phase modulation will double the 2D IR signal com-pared to a configuration with a chopper, simply because the signal is measured every singlelaser shot while the chopper wastes half of them. At the same time, the subtraction will sup-press, for example, the scattering term E1ELO, since neither pulses 1 nor the local oscillatorare phase modulated, hence do not change sign in the two measurements. The same holds forE2ELO. In contrast, the scattering term E3ELO is not suppressed; in fact it is amplified just likethe 2D IR signal. Nevertheless, this term is not modulated as time t1 is scanned, hence it ap-pears at zero frequency after the t1-Fourier transform and is suppressed this way. It is thereforecrucial to put a single phase-modulator into beam 3, and not beam 1 or 2.
However, there are additional scattering terms that will not be suppressed by this simplephase-cycling scheme. Consider for example the term E1E3, which originates from interferenceof light scattered from pulse 1 with light scattered from pulse 3. Pulse 3 is phase-modulatedin this scheme, hence the sign of E1E3 is inverted just like that of the desired 2D IR signal,and the intensity of this scattering term is actually doubled. A chopper would not suppressthis type of signal either. One might assume that E1E3 is small because it is the interferencebetween two scattered and thus weak fields. However, pulses 1 and 3 are intense, whereas thelocal oscillator is typically much weaker, hence we observe in our lab that scattering terms likeE1E3 are actually not so much smaller than scattering terms like E1ELO, and severely disturb2D IR spectra as well. In the next section, we will introduce a quasi-phase-cycling scheme thateliminates all scattering terms.
2.2. Double phase-cycling
To remove all scattering terms, we introduce a second modulator that phase-shifts pulses 1and 2 together, while pulse 3 is modulated independently. The cycle is now periodic over 4measurements. The upper part of Tab. 1 shows the states of the two modulators during thesefour measurements and the signs with which they contribute to the final signal (see also Fig. 3a).We will compare two sequences which differ by φ3 in the fourth measurement that is either +π∗or −π∗. If these were pure phase shifts, then +π and −π would of course be identical, but thesame is not true for quasi-phase shift. We will see that a −π∗ quasi-phase shift leads to anexact suppression of all scattering terms for all frequencies. A +π∗ quasi-phase, in contrast,suppresses them only at ω = ω0, with the scattering amplitude rising linearly around the center
#136705 - $15.00 USD Received 20 Oct 2010; revised 11 Nov 2010; accepted 16 Nov 2010; published 8 Dec 2010(C) 2010 OSA 20 December 2010 / Vol. 18, No. 26 / OPTICS EXPRESS 27072
(a) Time domain: modulation of the pulsesExactFirst order
∆t-δt
∆t
∆t
∆t1,2 3
time
Modulators
Mea
sure
men
ts1
2
3
4
∆t-δt
∆t
∆t
∆t-δt
Mea
sure
men
ts
1
2
3
4
∆t1,2 3
time
Modulators
∆t+δt
Frequency (ω/ω0)
(b) Spectral phase for scattering term E1E3
0
π
–πSpe
ctra
l pha
se
1&4
2&3
Exact
10.9 1.1Frequency (ω/ω0)
1
Spe
ctra
l pha
se
1
2&3
4
First order
0.9 1.1
0
π
–π
(c) Spectral responses
100%
0%
100%99%98%97%
10x zoom
1 1.05 1.10.950.9
164015601480 1720 1800typical range (cm-1)
Frequency (ω/ω0)
2DIR signal
Scattering E1E3
Chopper
1st order
Exact
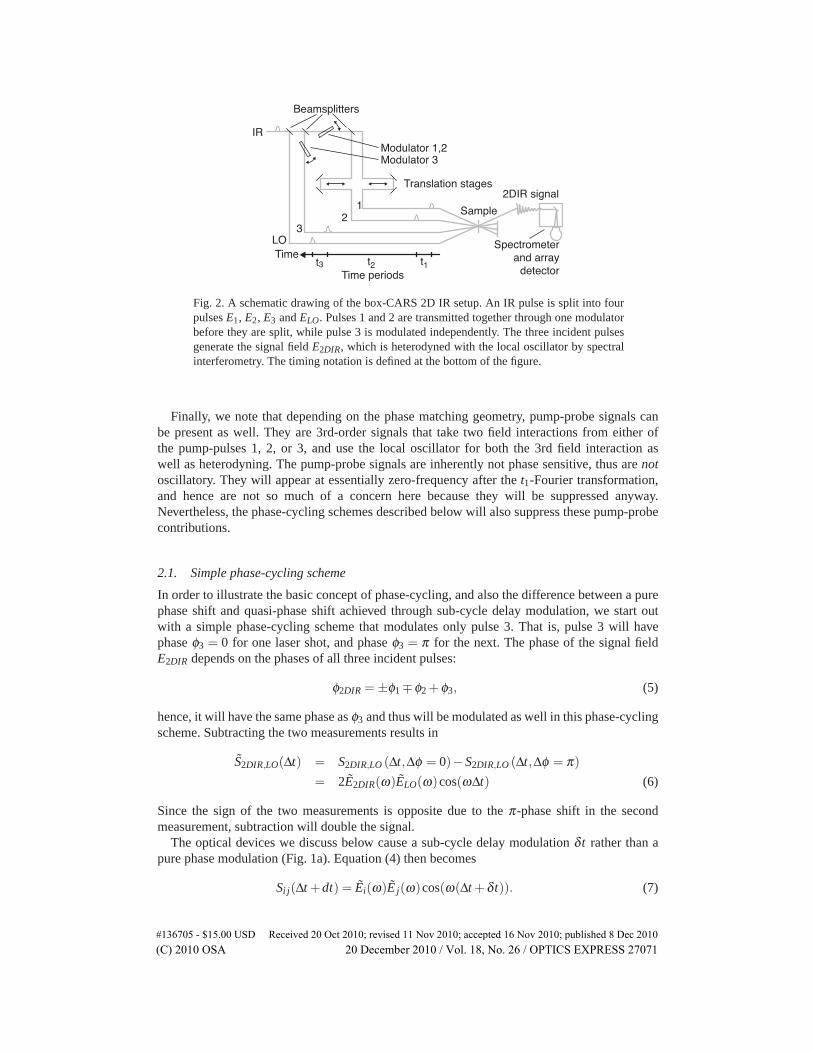
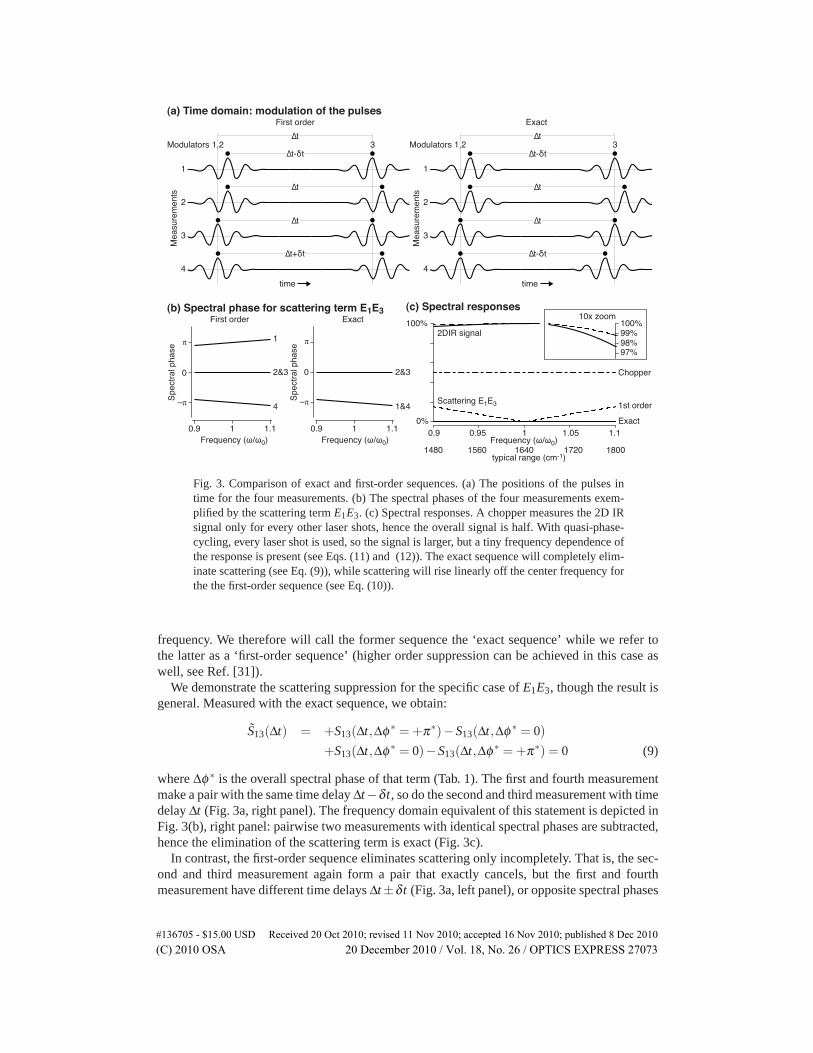
Fig. 3. Comparison of exact and first-order sequences. (a) The positions of the pulses intime for the four measurements. (b) The spectral phases of the four measurements exem-plified by the scattering term E1E3. (c) Spectral responses. A chopper measures the 2D IRsignal only for every other laser shots, hence the overall signal is half. With quasi-phase-cycling, every laser shot is used, so the signal is larger, but a tiny frequency dependence ofthe response is present (see Eqs. (11) and (12)). The exact sequence will completely elim-inate scattering (see Eq. (9)), while scattering will rise linearly off the center frequency forthe the first-order sequence (see Eq. (10)).
frequency. We therefore will call the former sequence the ‘exact sequence’ while we refer tothe latter as a ‘first-order sequence’ (higher order suppression can be achieved in this case aswell, see Ref. [31]).
We demonstrate the scattering suppression for the specific case of E1E3, though the result isgeneral. Measured with the exact sequence, we obtain:
S13(Δt) = +S13(Δt,Δφ ∗ =+π∗)−S13(Δt,Δφ ∗ = 0)
+S13(Δt,Δφ ∗ = 0)−S13(Δt,Δφ ∗ =+π∗) = 0 (9)
where Δφ ∗ is the overall spectral phase of that term (Tab. 1). The first and fourth measurementmake a pair with the same time delay Δt−δ t, so do the second and third measurement with timedelay Δt (Fig. 3a, right panel). The frequency domain equivalent of this statement is depicted inFig. 3(b), right panel: pairwise two measurements with identical spectral phases are subtracted,hence the elimination of the scattering term is exact (Fig. 3c).
In contrast, the first-order sequence eliminates scattering only incompletely. That is, the sec-ond and third measurement again form a pair that exactly cancels, but the first and fourthmeasurement have different time delays Δt±δ t (Fig. 3a, left panel), or opposite spectral phases
#136705 - $15.00 USD Received 20 Oct 2010; revised 11 Nov 2010; accepted 16 Nov 2010; published 8 Dec 2010(C) 2010 OSA 20 December 2010 / Vol. 18, No. 26 / OPTICS EXPRESS 27073
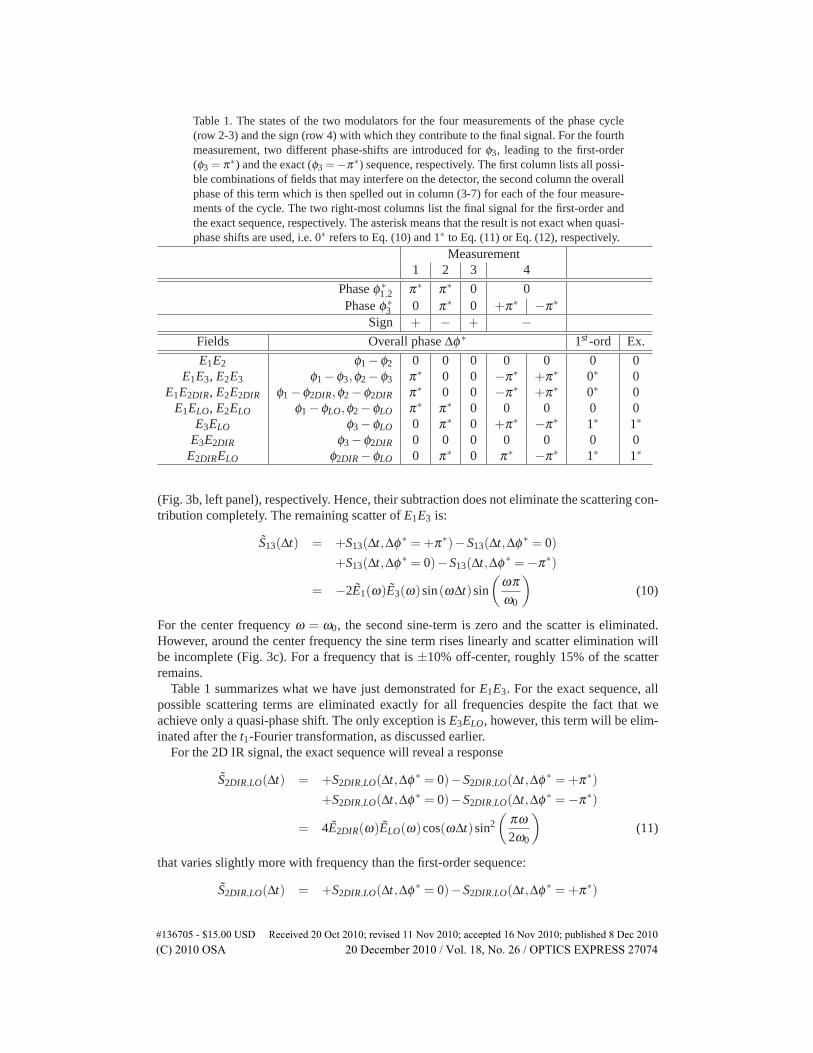
Table 1. The states of the two modulators for the four measurements of the phase cycle(row 2-3) and the sign (row 4) with which they contribute to the final signal. For the fourthmeasurement, two different phase-shifts are introduced for φ3, leading to the first-order(φ3 = π∗) and the exact (φ3 =−π∗) sequence, respectively. The first column lists all possi-ble combinations of fields that may interfere on the detector, the second column the overallphase of this term which is then spelled out in column (3-7) for each of the four measure-ments of the cycle. The two right-most columns list the final signal for the first-order andthe exact sequence, respectively. The asterisk means that the result is not exact when quasi-phase shifts are used, i.e. 0∗ refers to Eq. (10) and 1∗ to Eq. (11) or Eq. (12), respectively.
Measurement1 2 3 4
Phase φ∗1,2 π∗ π∗ 0 0
Phase φ∗3 0 π∗ 0 +π∗ −π∗
Sign + − + −Fields Overall phase Δφ∗ 1st -ord Ex.
E1E2 φ1 −φ2 0 0 0 0 0 0 0E1E3, E2E3 φ1 −φ3,φ2 −φ3 π∗ 0 0 −π∗ +π∗ 0∗ 0
E1E2DIR, E2E2DIR φ1 −φ2DIR,φ2 −φ2DIR π∗ 0 0 −π∗ +π∗ 0∗ 0E1ELO, E2ELO φ1 −φLO,φ2 −φLO π∗ π∗ 0 0 0 0 0
E3ELO φ3 −φLO 0 π∗ 0 +π∗ −π∗ 1∗ 1∗E3E2DIR φ3 −φ2DIR 0 0 0 0 0 0 0
E2DIRELO φ2DIR −φLO 0 π∗ 0 π∗ −π∗ 1∗ 1∗
(Fig. 3b, left panel), respectively. Hence, their subtraction does not eliminate the scattering con-tribution completely. The remaining scatter of E1E3 is:
S13(Δt) = +S13(Δt,Δφ ∗ =+π∗)−S13(Δt,Δφ ∗ = 0)
+S13(Δt,Δφ ∗ = 0)−S13(Δt,Δφ ∗ =−π∗)
= −2E1(ω)E3(ω)sin(ωΔt)sin
(ωπω0
)(10)
For the center frequency ω = ω0, the second sine-term is zero and the scatter is eliminated.However, around the center frequency the sine term rises linearly and scatter elimination willbe incomplete (Fig. 3c). For a frequency that is ±10% off-center, roughly 15% of the scatterremains.
Table 1 summarizes what we have just demonstrated for E1E3. For the exact sequence, allpossible scattering terms are eliminated exactly for all frequencies despite the fact that weachieve only a quasi-phase shift. The only exception is E3ELO, however, this term will be elim-inated after the t1-Fourier transformation, as discussed earlier.
For the 2D IR signal, the exact sequence will reveal a response
S2DIR,LO(Δt) = +S2DIR,LO(Δt,Δφ ∗ = 0)−S2DIR,LO(Δt,Δφ ∗ =+π∗)+S2DIR,LO(Δt,Δφ ∗ = 0)−S2DIR,LO(Δt,Δφ ∗ =−π∗)
= 4E2DIR(ω)ELO(ω)cos(ωΔt)sin2(
πω2ω0
)(11)
that varies slightly more with frequency than the first-order sequence:
S2DIR,LO(Δt) = +S2DIR,LO(Δt,Δφ ∗ = 0)−S2DIR,LO(Δt,Δφ ∗ =+π∗)
#136705 - $15.00 USD Received 20 Oct 2010; revised 11 Nov 2010; accepted 16 Nov 2010; published 8 Dec 2010(C) 2010 OSA 20 December 2010 / Vol. 18, No. 26 / OPTICS EXPRESS 27074
Measurements1 2 3 4
1) Optical window
2) Coil
3) Aluminum block
4) NdFeB magnet5) Torsion member
π
–π
Qua
si p
hase
shi
ft
π
–π
1st order
Exact
Modulator 1,2
Modulator 3
(a) (b)
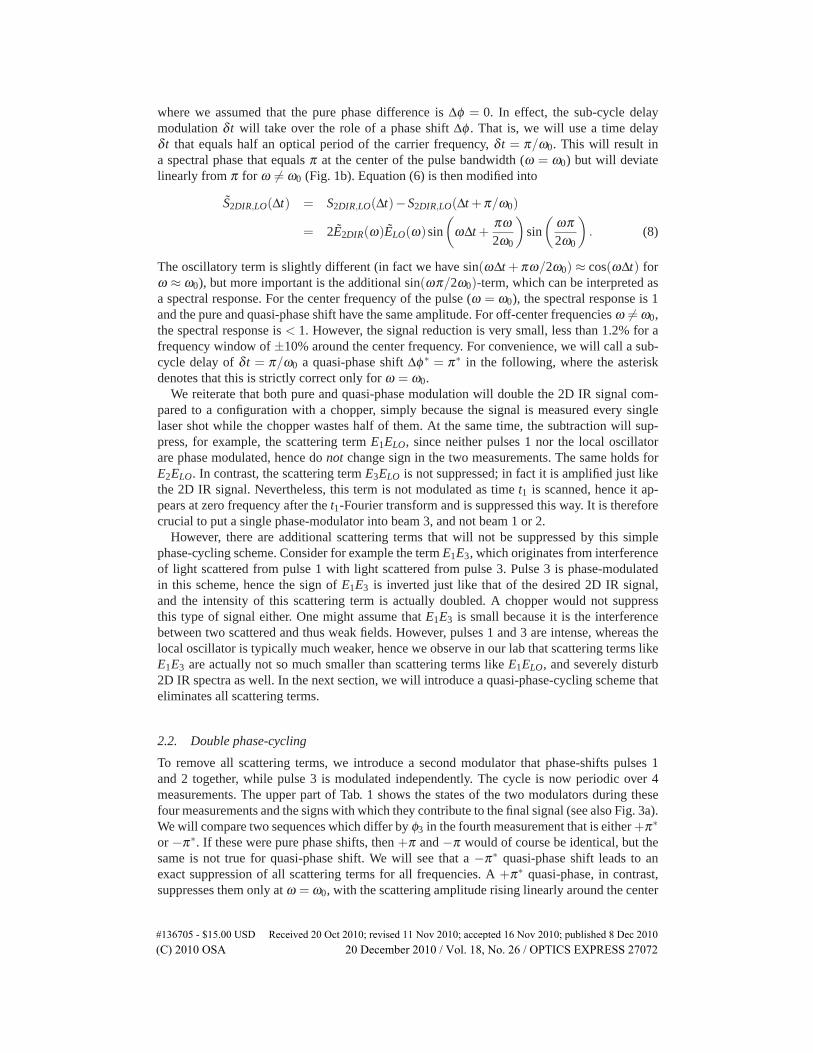
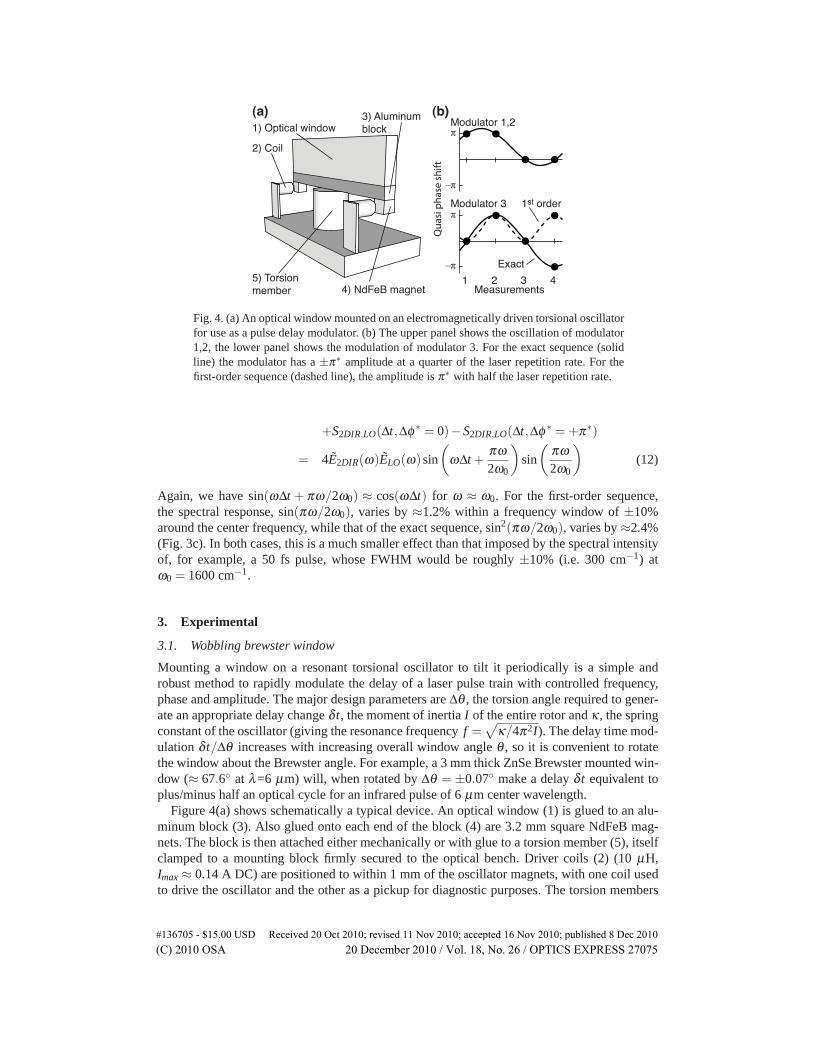
Fig. 4. (a) An optical window mounted on an electromagnetically driven torsional oscillatorfor use as a pulse delay modulator. (b) The upper panel shows the oscillation of modulator1,2, the lower panel shows the modulation of modulator 3. For the exact sequence (solidline) the modulator has a ±π∗ amplitude at a quarter of the laser repetition rate. For thefirst-order sequence (dashed line), the amplitude is π∗ with half the laser repetition rate.
+S2DIR,LO(Δt,Δφ ∗ = 0)−S2DIR,LO(Δt,Δφ ∗ =+π∗)
= 4E2DIR(ω)ELO(ω)sin
(ωΔt +
πω2ω0
)sin
(πω2ω0
)(12)
Again, we have sin(ωΔt + πω/2ω0) ≈ cos(ωΔt) for ω ≈ ω0. For the first-order sequence,the spectral response, sin(πω/2ω0), varies by ≈1.2% within a frequency window of ±10%around the center frequency, while that of the exact sequence, sin2(πω/2ω0), varies by ≈2.4%(Fig. 3c). In both cases, this is a much smaller effect than that imposed by the spectral intensityof, for example, a 50 fs pulse, whose FWHM would be roughly ±10% (i.e. 300 cm−1) atω0 = 1600 cm−1.
3. Experimental
3.1. Wobbling brewster window
Mounting a window on a resonant torsional oscillator to tilt it periodically is a simple androbust method to rapidly modulate the delay of a laser pulse train with controlled frequency,phase and amplitude. The major design parameters are Δθ , the torsion angle required to gener-ate an appropriate delay change δ t, the moment of inertia I of the entire rotor and κ , the springconstant of the oscillator (giving the resonance frequency f =
√κ/4π2I). The delay time mod-
ulation δ t/Δθ increases with increasing overall window angle θ , so it is convenient to rotatethe window about the Brewster angle. For example, a 3 mm thick ZnSe Brewster mounted win-dow (≈ 67.6◦ at λ=6 μm) will, when rotated by Δθ = ±0.07◦ make a delay δ t equivalent toplus/minus half an optical cycle for an infrared pulse of 6 μm center wavelength.
Figure 4(a) shows schematically a typical device. An optical window (1) is glued to an alu-minum block (3). Also glued onto each end of the block (4) are 3.2 mm square NdFeB mag-nets. The block is then attached either mechanically or with glue to a torsion member (5), itselfclamped to a mounting block firmly secured to the optical bench. Driver coils (2) (10 μH,Imax ≈ 0.14 A DC) are positioned to within 1 mm of the oscillator magnets, with one coil usedto drive the oscillator and the other as a pickup for diagnostic purposes. The torsion members
#136705 - $15.00 USD Received 20 Oct 2010; revised 11 Nov 2010; accepted 16 Nov 2010; published 8 Dec 2010(C) 2010 OSA 20 December 2010 / Vol. 18, No. 26 / OPTICS EXPRESS 27075
tested here are single ended pivot (flexure) bearings (Riverhawk) and thin stainless steel tubes.A flexure bearing is an arrangement of stainless steel spring leafs connecting two independentlyrotating cylinders, allowing limited low friction torsional movement of one of these cylinders.
In the device we constructed, the ZnSe window had dimensions 3×1×0.3 cm3. The flexurebearing had a factory specified spring constant and moment of inertia of 21 N cm/degree and4.4 g cm2, respectively. The total moment of inertia of the bearing, window, magnets and alu-minum block together was 8.2 g cm2, giving a resonance frequency of 550 Hz with a width ofa few Hz. For the 1 kHz repetition rate lasers used in our experiments, the modulator resonancewas adjusted to ≈500 or 250 Hz by adding mass to the aluminum block. When using a steeltube as torsion member, in contrast, the spring constant of a tube with length L and shear modu-lus G is κ = Gπ(D4−d4)/32L (where D and d are the outer and inner diameters, respectively).Therefore the resonance frequency can be adjusted simply by changing the length of the tubeprotruding from the mounting block. For the devices tested, the coils and magnets used arecapable of driving both torsion members at amplitudes of several degrees with drive levels ofless than 10 V. This corresponds to tens of optical cycles scanned at 6 μm.
The devices are driven by a square wave with either 250 or 500 Hz, divided down fromthe regenerative amplifier 1 kHz Pockels cell trigger (since oscillation of the wobbler is aresonance effect, driving it with a square wave results in a sine-modulation). A tunable delayis used to adjust the wobbler’s phase relative to the Ti:S laser pulse train, and a tunable gainamplifier to adjust the amplitude of the modulation. Adjustments of these parameters are madeduring operation of the 2D IR experiment to optimize for signal and at the same time minimizescatter.
3.2. Photo elastic modulator
For higher laser repetition rates, a Photo Elastic Modulators (PEM) can be used. A PEM com-presses and stretches a crystal at its acoustic resonance frequency. The two extremes have oppo-site birefringence and act as waveplates in perpendicular directions. PEMs are commonly usedas a way to change the polarization of a beam but can also be used to introduce a quasi-phaseshift by orienting the modulation induced optical axis parallel or perpendicular to the beam po-larization. The crystal is driven at its sharply defined resonance frequency and is factory-set foran individual device. This makes it necessary to synchronize the laser to the PEM [32]. For thesimple two-cycle scheme (Sect. 2.1), the laser frequency is derived from the PEM frequency asfLaser = 2 fPEM/(2n+ 1), using a phase locked loop (PLL, to double fPEM) and a subsequentdivider by an odd number. The integer number n is chosen such that the repetition rate fLaser
closely matches that for which the Ti:S amplifier is optimized. In this way, one laser shot willsee one extreme of the crystal oscillation, and the next laser shot the other extreme (after aproper phase adjustment of the oscillation).
A ZnSe based PEM (Hinds Instruments) with a resonance frequency of 50 kHz is used here.The modulation depth of this PEM is sufficient to achieve a π quasi phase shift for wavelengthsless than 6.5 μm. Anti reflective coating of the ZnSe crystal gives 80-90% transmittancebetween 3 and 6 μm. In principle, a 50 kHz resonance allows for laser repetition rates of up to100 kHz (i.e. n = 0), or even 200 kHz if the four phase-cycle sequence is used. However, in thelatter case, two PEM’s have to be synchronized to each other.
3.3. Experimental verification
The quality of scattering elimination was tested using two wobbling brewster windows. Pulses1 and 3 (with a pulse separation of Δt ≈ 1.5 ps) were scattered from a 30 μm pinhole and their
#136705 - $15.00 USD Received 20 Oct 2010; revised 11 Nov 2010; accepted 16 Nov 2010; published 8 Dec 2010(C) 2010 OSA 20 December 2010 / Vol. 18, No. 26 / OPTICS EXPRESS 27076
1
0
–1
No modulation
1st order
ExactIn
tens
ity (
norm
aliz
ed)
1
0
–11
0
–1
10x zoom
400x zoom
1550 1600 1650 17001500ω/2πc (cm-1)
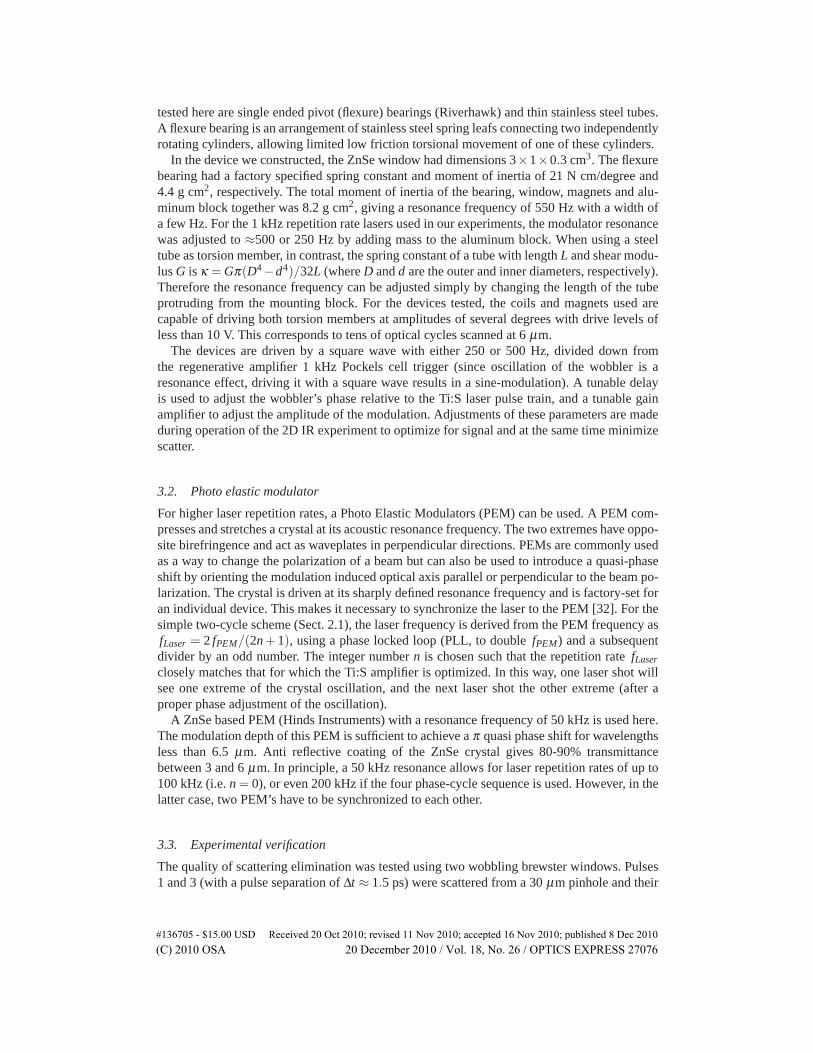
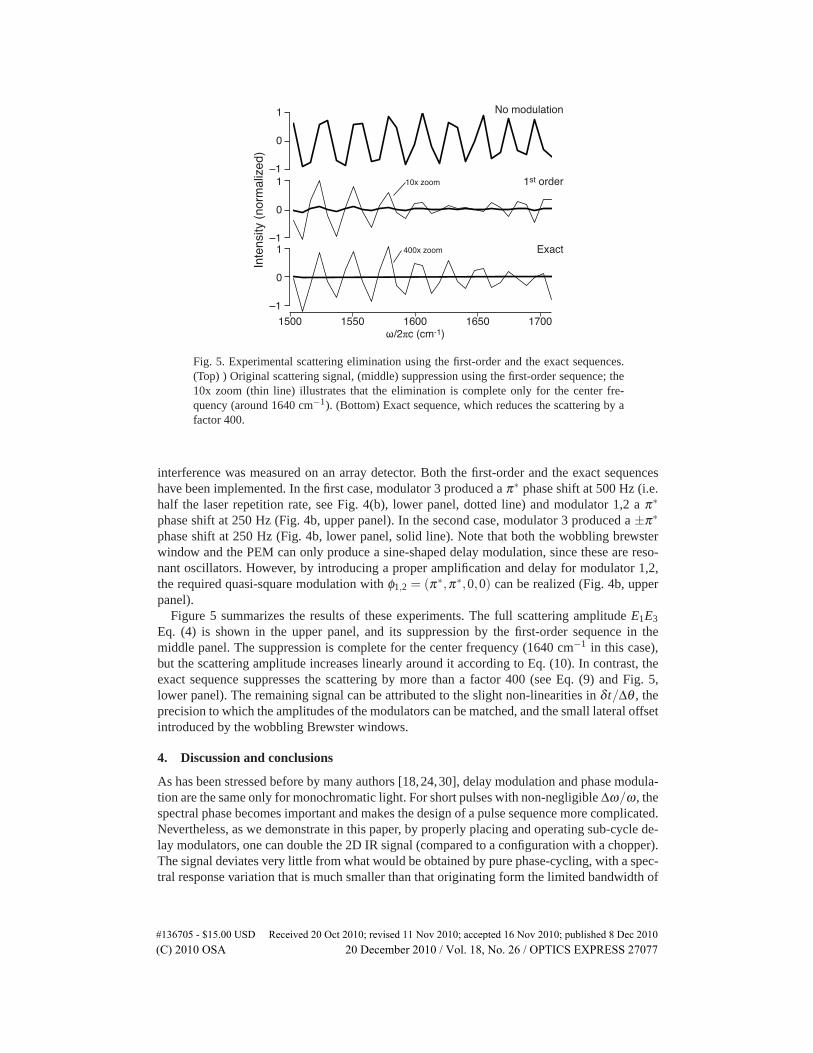
Fig. 5. Experimental scattering elimination using the first-order and the exact sequences.(Top) ) Original scattering signal, (middle) suppression using the first-order sequence; the10x zoom (thin line) illustrates that the elimination is complete only for the center fre-quency (around 1640 cm−1). (Bottom) Exact sequence, which reduces the scattering by afactor 400.
interference was measured on an array detector. Both the first-order and the exact sequenceshave been implemented. In the first case, modulator 3 produced a π∗ phase shift at 500 Hz (i.e.half the laser repetition rate, see Fig. 4(b), lower panel, dotted line) and modulator 1,2 a π∗phase shift at 250 Hz (Fig. 4b, upper panel). In the second case, modulator 3 produced a ±π∗phase shift at 250 Hz (Fig. 4b, lower panel, solid line). Note that both the wobbling brewsterwindow and the PEM can only produce a sine-shaped delay modulation, since these are reso-nant oscillators. However, by introducing a proper amplification and delay for modulator 1,2,the required quasi-square modulation with φ1,2 = (π∗,π∗,0,0) can be realized (Fig. 4b, upperpanel).
Figure 5 summarizes the results of these experiments. The full scattering amplitude E1E3
Eq. (4) is shown in the upper panel, and its suppression by the first-order sequence in themiddle panel. The suppression is complete for the center frequency (1640 cm−1 in this case),but the scattering amplitude increases linearly around it according to Eq. (10). In contrast, theexact sequence suppresses the scattering by more than a factor 400 (see Eq. (9) and Fig. 5,lower panel). The remaining signal can be attributed to the slight non-linearities in δ t/Δθ , theprecision to which the amplitudes of the modulators can be matched, and the small lateral offsetintroduced by the wobbling Brewster windows.
4. Discussion and conclusions
As has been stressed before by many authors [18,24,30], delay modulation and phase modula-tion are the same only for monochromatic light. For short pulses with non-negligible Δω/ω , thespectral phase becomes important and makes the design of a pulse sequence more complicated.Nevertheless, as we demonstrate in this paper, by properly placing and operating sub-cycle de-lay modulators, one can double the 2D IR signal (compared to a configuration with a chopper).The signal deviates very little from what would be obtained by pure phase-cycling, with a spec-tral response variation that is much smaller than that originating form the limited bandwidth of
#136705 - $15.00 USD Received 20 Oct 2010; revised 11 Nov 2010; accepted 16 Nov 2010; published 8 Dec 2010(C) 2010 OSA 20 December 2010 / Vol. 18, No. 26 / OPTICS EXPRESS 27077
the pump pulses. Furthermore, population time t2 is modulated as well, effectively reducing thet2-time resolution by 10 fs for 6 μm light. At the same time, all possible scattering contributionare suppressed exactly for all frequencies, despite the fact that only a quasi-phase-cycling isachieved. Both modulation devices discussed here (wobbling brewster window and PEM) aresimple and can be implemented in essentially any existing 2D IR setup, as they do not requireany change of the beam geometry. Furthermore, in particular the wobbling brewster windowhas practically no losses since the window is introduced in the Brewster angle.
Modulating the pulses on a shot-to-shot basis gives the best correlation between laser shotsand hence the lowest possible noise. The home built phase modulator devices were designedto operate at the 250 Hz frequencies dictated by the 1 kHz amplifier. As higher laser repetitionrates are becoming more common, we also investigated the feasibility of achieving higher mod-ulator resonance frequencies. A 1× 1.5× 0.1 cm3 BK7 window mounted on an L = 0.35 cmtube was found to have a resonance frequency of 2.5 kHz and Δθ = 0.1 ◦ for a 10 V drivelevel, indicating that based on the principles described here, suitable IR modulators may beconstructed for laser systems running at up to 10 kHz. We note that a more complicated taperedrod design for mirror scanning is described in the literature that achieves large angular excur-sions at frequencies up to 10 kHz [33]. For repetition rates that are beyond the feasibility of awobbling Brewster window, a PEM can be used.
We have restricted our discussion to infrared modulation. We note that for visible experi-ments, although modulator options are more varied (e.g AOMs, EOMs, liquid crystal modula-tors etc.) than for the infrared, the modulators proposed here offer a convenient and low costalternative as well.
A detailed scheme of the wobbling Brewster window is available from the authors and willbe developed into a kit for interested laboratories.
Acknowledgments
We would like to thank Jan Helbing for helpful discussions and Martin Haller for friendlytechnical support. This work was financially supported by an ERC advanced investigator grant(DYNALLO).
#136705 - $15.00 USD Received 20 Oct 2010; revised 11 Nov 2010; accepted 16 Nov 2010; published 8 Dec 2010(C) 2010 OSA 20 December 2010 / Vol. 18, No. 26 / OPTICS EXPRESS 27078