university of wisconsin system solid waste … · leaching characteristics of fly ash from...
TRANSCRIPT
Leaching Characteristics of Fly Ash
from Municipal Solid Waste Incineration
May 2014
Student Investigator: Yibo Zhang, Jiannan Chen, Kevin Perthel
Advisors: Tuncer B. Edil, William J. Likos
University of Wisconsin-Madison
UNIVERSITY OF WISCONSIN SYSTEM SOLID WASTE RESEARCH PROGRAM Student Project Report
Leaching Characteristics of Fly Ash from Municipal Solid Waste Incineration
Yibo Zhang
Graduate Research Assistant, Department of Geological Engineering, University of Wisconsin-Madison,
E-mail: [email protected]
Jiannan Chen
Graduate Research Assistant, Department of Geological Engineering, University of Wisconsin-Madison,
E-mail: [email protected]
Kevin Perthel
Undergraduate Research Assistant, Department of Geological Engineering, University of Wisconsin-
Madison, E-mail: [email protected]
Tuncer B. Edil
Professor Emeritus and Research Director, Recycled Materials Resource Center, Department of
Geological Engineering, University of Wisconsin-Madison, E-mail: [email protected]
William J. Likos
Associate Professor, Department of Geological Engineering, Civil and Environmental Engineering,
University of Wisconsin-Madison, E-mail: [email protected]
ABSTRACT:
Laboratory tests using samples of municipal solid waste incineration fly ash (MSWIFA) indicate that
leachate produced using synthetic precipitation leaching procedures contains heavy metal elements, with
Selenium (Se) and Antimony (Sb) exceeding the USEPA drinking water standard. pH-dependent leaching
tests indicate that MSWIFA releases more metal elements under acidic conditions. Initial results from this
study will be used to develop a characterization of the elements’ leaching behavior and to assess
laboratory leaching methods that best simulate field conditions. The long-term objective is to develop
environmental impact evaluations and recommendations for the treatment and beneficial reuse of
MSWIFA.
KEYWORDS: Municipal Solid Waste incineration fly ash, MSWIFA, leachate, pH, heavy metals.
NTRODUCTION
Ever-increasing municipal construction along with daily garbage generation in the United States (U.S.) is
causing increased demand of MSW landfill space. In 2010, Americans generated approximately 250
million tons of MSW, in which 54.2 % (135.5 million tons) was discarded to landfills and other disposal
facilities (USEPA 2010). To reduce the waste volume, landfill operators implemented controlled burning
processes to incinerate the waste. The incineration of MSW is conducted under combustion and
incineration regulations (40 CFR Part 60), which includes emissions guidelines and compliance times for
municipal waste combustors. Additionally, if properly equipped, the heat generated can be converted into
electrical power (USEPA 2012a).
Currently, the United States has about 872 operational MSW-fired power generation plants, producing
approximately 2,500 megawatts (about 0.3 percent of total national power generation) (USEPA 2013).
The combustion of MSW produces two types of residuals: fly ash and bottom ash. The amount of ash
generated ranges from 15 to 25 percent by weight of the original MSW, and 5 to15 percent of the volume
of the original MSW (USEPA 2012b). Fly ash refers to the fine particles that are removed or captured
from the flue gas by air pollution control devices, such as scrubbers. Fly ash typically amounts 10 to 20
percent by weight of the total ash.
Municipal solid waste incineration fly ash (MSWIFA) may contain toxic materials, e.g., heavy metals,
inherited from the original waste or created during the combustion process, such as Hg, Cd, Cr and As
(Wu and Ting 2005; Shi and Kan 2008). To prevent migration of these substances into the groundwater
and soil, incineration residuals must be analyzed regularly to ensure disposal safety. Hazardous ash must
be managed and disposed of as hazardous waste, while non-hazardous ash, depending on state and local
regulations, may be disposed of in a MSW landfill or recycled for beneficial uses.
1. BACKGROUND
Previous studies from University Wisconsin-Madison Geological Engineering have accumulated a broad
knowledge and database for coal ash leaching characteristics (Bin-Shafique et al. 2006; Li et al. 2008),
and various leaching tests, i.e., column leaching tests, batch leaching tests and serial batch leaching tests,
were conducted on coal ash and other industrial byproducts (Bin-Shafique et al. 2006; Li et al. 2008;
Chen et al. 2012).
In this study, samples of fly ash from waste incineration from LaCrosse Co. Landfill (LaCrosse, WI) have
been investigated for leaching characteristics. The primary contents of the processed waste are wood and
MSW. Batch leaching tests, including synthetic precipitation leaching procedure (SPLP, USEPA method
1312) and pH-dependent leaching tests (USEPA method 1313), have been conducted to characterize the
leaching behavior under simulated precipitation and different pH scenarios. Both testing methods will be
used to more generally assess MSWIFA leaching characteristics. Environmental impact evaluations and
recommendations will be provided for treatment and beneficial reuse of MSWIFA.
The primary objective of this study is to evaluate the environmental concern of leaching elements from
Municipal Solid Waste incineration fly ash (MSWIFA) by investigating the hazardous heavy metal in
leachate using laboratory leaching tests. The testing results will be used as references for MSWIFA
disposal and treatment. The outcomes shall be developing a characterization of the elements’ leaching
behavior and comparing lab leaching methods to find the best way to simulate field conditions.
2. TEST MATERIALS AND METHODS
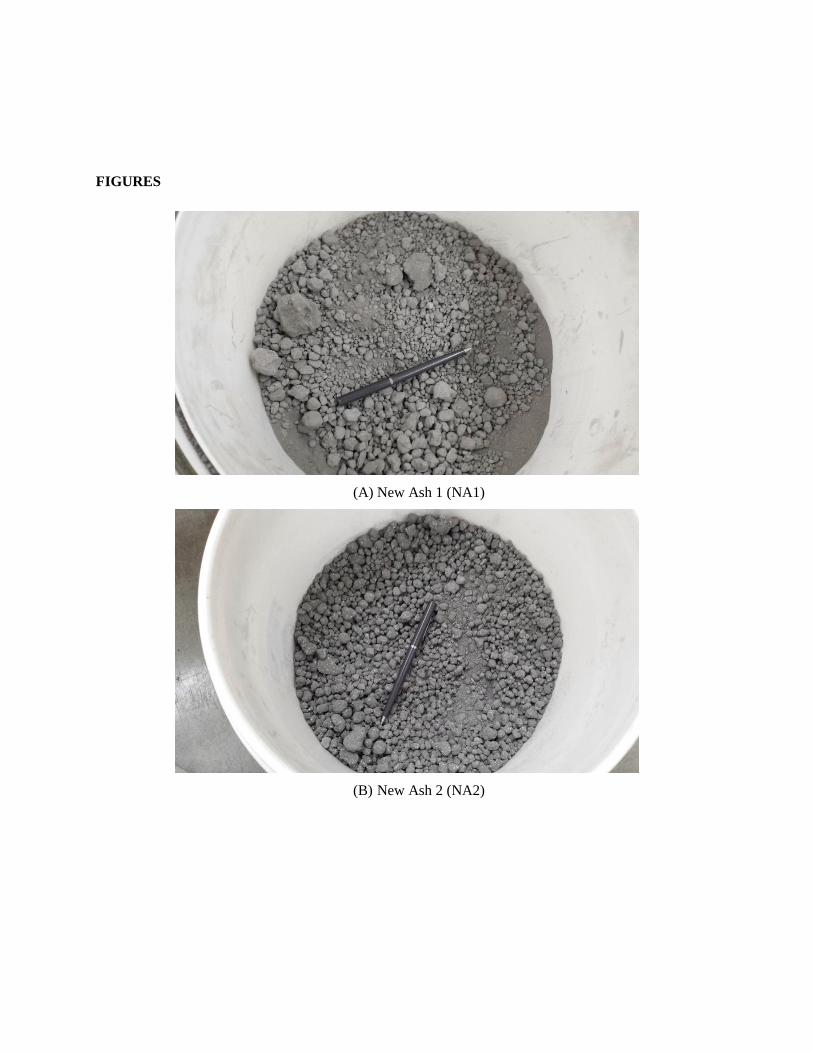
Four samples of MSWIFA from Lo Crosse Co. landfill (Figure 1) were analyzed in this study. New Ash
Sample 1 and 2 (NA1 and NA2) were sampled from the La Crosse Co. landfill ash monofill at different
locations. Ash was generated during Sep. 2013 and was sampled within 10 days. Old Ash sample 1 and 2
(OA1 and OA2) was sampled from the La Crosse Co. landfill ash monofill at different locations. Ash was
generated in 2013 but was in place for several months in the monofill.
2.1. Physical Properties
The physical and hydraulic properties of materials were tested according to standards of ASTM
International (ASTM) and the American Association of State Highway and Transportation Officials
(AASHTO). The material physical and hydraulic characterization tests including grain size analysis,
water content, dry unit weight, specific gravity and compaction characteristics were performed.
2.1.1. Grain Size Analysis
The grain size distribution of four MSWIFA samples was determined according to ASTM D 422. The
samples were first wet sieved through sieve No. 200 to separate coarse and fine particles. The coarse
portions were oven dried in 105℃ ± 2℃ for 24 hours prior to mechanical sieving, while the distribution of
particle sizes smaller than 75 μm was determined by a sedimentation process using a hydrometer.
2.1.2. Moisture Content.
Moisture content was measured for each sample following ASTM D2216. A representative specimen was
taken from each sample and oven dried in 105℃±2℃ for 24 hours. The mass loss was used to compute
the moisture in the bulk specimen.
2.1.3. Specific Gravity.

The specific gravity of samples was determined by ASTM D854 for soil solids that pass the 4.75-mm (No.
4) sieve using a water pycnometer. Test procedures adopted were exactly as the standard described.
2.1.4. Compaction.
Harvard miniature compactions were performed on the MSWIFA samples with standard effort following
ASTM D 4609 and modified impact by Tastan at University of Wisconsin-Madison. Maximum dry unit
weights and corresponding optimum moisture contents were estimated from the resulting compaction
curves.
2.2. Chemical Properties
The total elemental composition of all four MSWIFA samples was determined by acid digestion
according to EPA 3050B. Tests were conducted in triplicate. A 1:1 nitric acid digestion of 1 g of solid
sample was performed at 90 to 95°C for 2 h, and 30% H2O2 was added to start a peroxide reaction. The
total carbon (TC), total inorganic carbon (TIC), and total organic carbon (TOC) were determined with a
SC144 DR sulfur and carbon analyzer (LECO Inc., St. Joseph, MO, USA) by UW-Madison’s Soil and
Plant Analysis Lab.
2.3. Leaching Tests
Laboratory batch leaching tests including Synthetic Precipitation Leaching Procedure (SPLP) and pH-
dependent leaching were performed to characterize the MSWIFA leaching behavior.
2.3.1. Synthetic Precipitation Leaching Procedure (SPLP).
SPLP testing was conducted following the USEPA method 1312 with two replicate tests for each ash
sample. 50 grams of dry ash was mixed with 1000 mL of SPLP extraction liquid in a 1.5 L LDPE bottle
(Figure 2), and sent into a tumbler for 20 ± 2 h agitation at as speed of 30±2 revolutions per min (rpm)
(Figure 3). Sample pH, electrical conductivity (EC), and oxidation-reduction potential (ORP) were
determined after testing. Eluate was filtered through 0.45 μm filter paper and preserved to pH < 2 with
nitric acid. The #1 SPLP extraction liquid was used to represent the precipitation east of Mississippi River.
Two reasons for selecting #1 SPLP extraction liquid: (1) the monofill of MSWIFA is located at the east
side of Mississippi River, and the projects that potentially involve beneficial use ash are located mostly in
La Cross County. The #1 liquid is also more aggressive than #2 and #3 liquid, and thus is considered
representative of a worst case scenario.
2.3.2. pH-dependent Leaching Test.
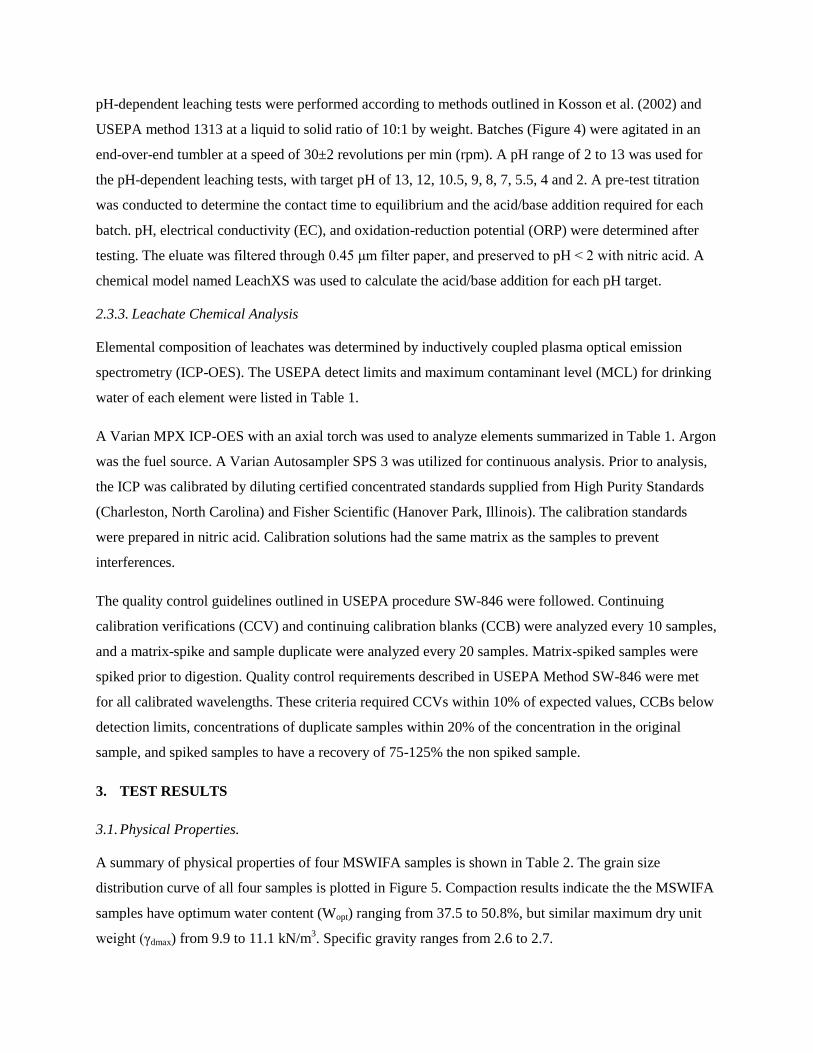
pH-dependent leaching tests were performed according to methods outlined in Kosson et al. (2002) and
USEPA method 1313 at a liquid to solid ratio of 10:1 by weight. Batches (Figure 4) were agitated in an
end-over-end tumbler at a speed of 30±2 revolutions per min (rpm). A pH range of 2 to 13 was used for
the pH-dependent leaching tests, with target pH of 13, 12, 10.5, 9, 8, 7, 5.5, 4 and 2. A pre-test titration
was conducted to determine the contact time to equilibrium and the acid/base addition required for each
batch. pH, electrical conductivity (EC), and oxidation-reduction potential (ORP) were determined after
testing. The eluate was filtered through 0.45 μm filter paper, and preserved to pH < 2 with nitric acid. A
chemical model named LeachXS was used to calculate the acid/base addition for each pH target.
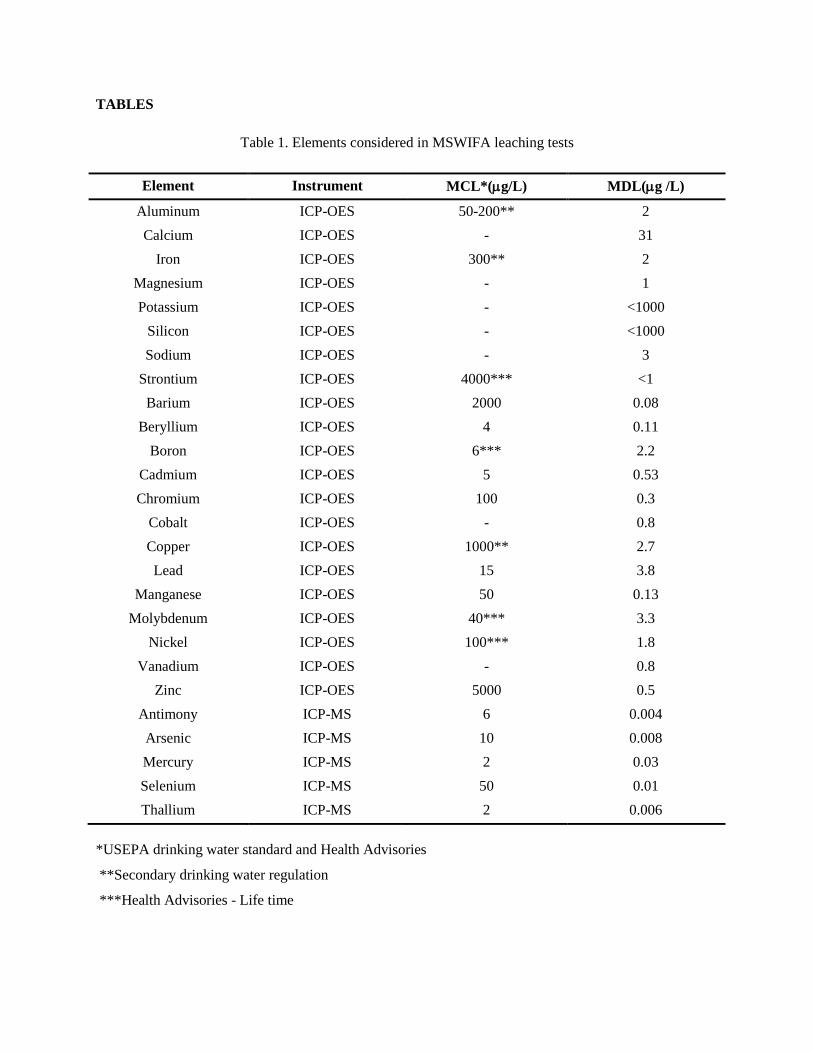
2.3.3. Leachate Chemical Analysis
Elemental composition of leachates was determined by inductively coupled plasma optical emission
spectrometry (ICP-OES). The USEPA detect limits and maximum contaminant level (MCL) for drinking
water of each element were listed in Table 1.
A Varian MPX ICP-OES with an axial torch was used to analyze elements summarized in Table 1. Argon
was the fuel source. A Varian Autosampler SPS 3 was utilized for continuous analysis. Prior to analysis,
the ICP was calibrated by diluting certified concentrated standards supplied from High Purity Standards
(Charleston, North Carolina) and Fisher Scientific (Hanover Park, Illinois). The calibration standards
were prepared in nitric acid. Calibration solutions had the same matrix as the samples to prevent
interferences.
The quality control guidelines outlined in USEPA procedure SW-846 were followed. Continuing
calibration verifications (CCV) and continuing calibration blanks (CCB) were analyzed every 10 samples,
and a matrix-spike and sample duplicate were analyzed every 20 samples. Matrix-spiked samples were
spiked prior to digestion. Quality control requirements described in USEPA Method SW-846 were met
for all calibrated wavelengths. These criteria required CCVs within 10% of expected values, CCBs below
detection limits, concentrations of duplicate samples within 20% of the concentration in the original
sample, and spiked samples to have a recovery of 75-125% the non spiked sample.
3. TEST RESULTS
3.1. Physical Properties.
A summary of physical properties of four MSWIFA samples is shown in Table 2. The grain size
distribution curve of all four samples is plotted in Figure 5. Compaction results indicate the the MSWIFA
samples have optimum water content (Wopt) ranging from 37.5 to 50.8%, but similar maximum dry unit
weight (γdmax) from 9.9 to 11.1 kN/m3. Specific gravity ranges from 2.6 to 2.7.
3.2. Chemical Properties.
Results from total elemental analysis by acid digestion and carbon content analysis are shown in Table 3.
Al, Fe, and K are the major constituents in all four samples with more than 1% weight percentage
(>10,000mg/kg). All MSWIFA samples have similar content in the major elements, while sample OA1
has a lower concentration in K. For trace elements, all four MSWIFA samples showed higher
concentration of Cu, Mg, P, Zn, Ba, Mn, Pb, and Ti than other elements, and OA1 also showed a lower
concentration than others. All four samples of MSWIFA had similar total carbon (TC) content with 1.1 to
1.6% wt, total inorganic carbon (TIC) (0.5 to 0.8% wt) and total organic carbon (TOC) (0.5 to 0.9% wt).
Sample OA2 has a lower content than other samples.
3.3. Synthetic Precipitation Leaching Procedure (SPLP) Results
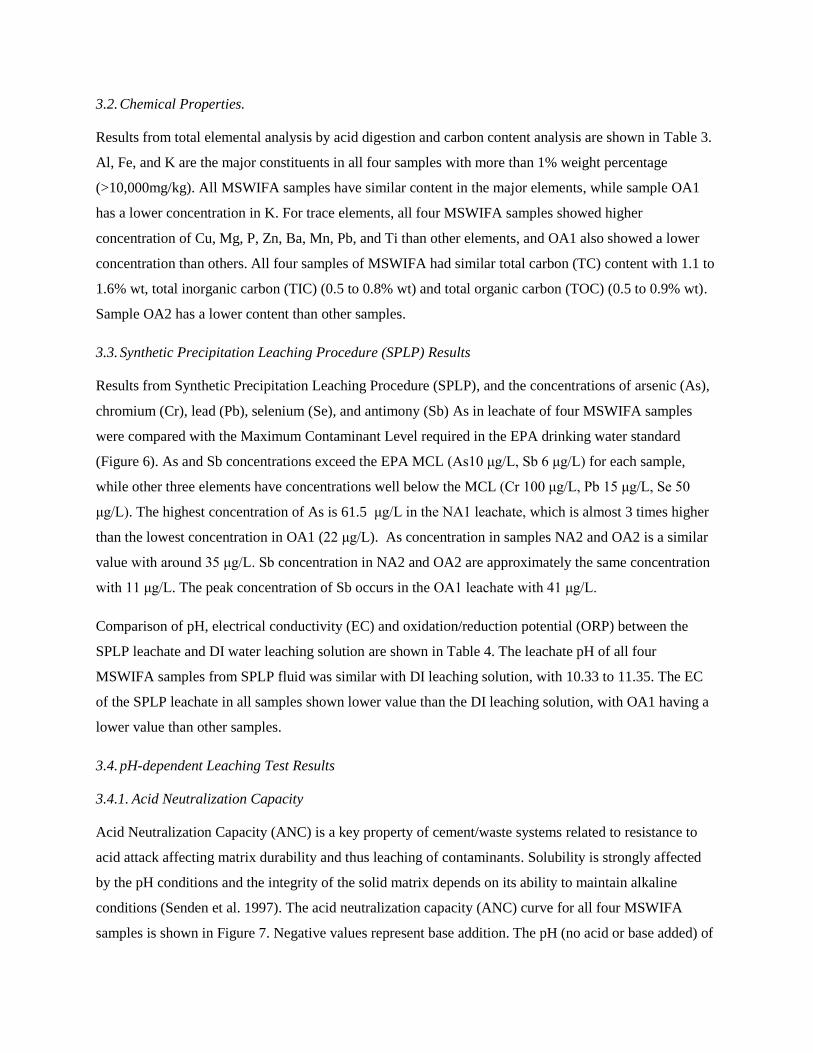
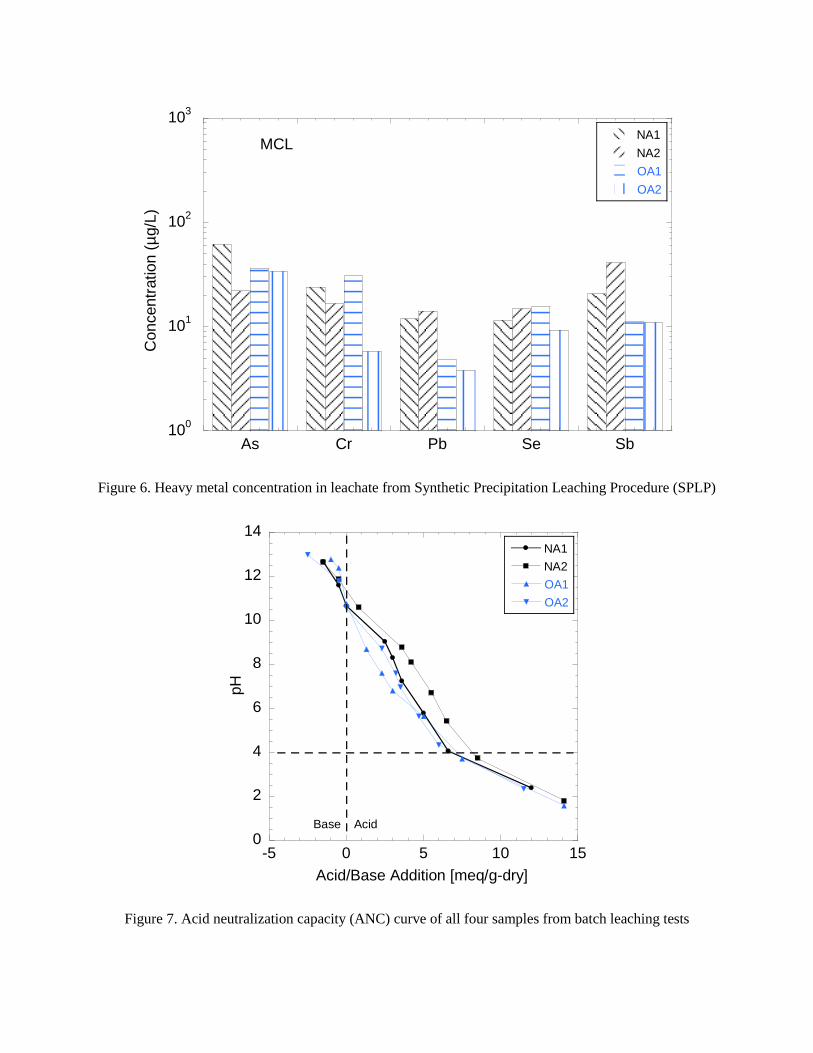
Results from Synthetic Precipitation Leaching Procedure (SPLP), and the concentrations of arsenic (As),
chromium (Cr), lead (Pb), selenium (Se), and antimony (Sb) As in leachate of four MSWIFA samples
were compared with the Maximum Contaminant Level required in the EPA drinking water standard
(Figure 6). As and Sb concentrations exceed the EPA MCL (As10 μg/L, Sb 6 μg/L) for each sample,
while other three elements have concentrations well below the MCL (Cr 100 μg/L, Pb 15 μg/L, Se 50
μg/L). The highest concentration of As is 61.5 μg/L in the NA1 leachate, which is almost 3 times higher
than the lowest concentration in OA1 (22 μg/L). As concentration in samples NA2 and OA2 is a similar
value with around 35 μg/L. Sb concentration in NA2 and OA2 are approximately the same concentration
with 11 μg/L. The peak concentration of Sb occurs in the OA1 leachate with 41 μg/L.
Comparison of pH, electrical conductivity (EC) and oxidation/reduction potential (ORP) between the
SPLP leachate and DI water leaching solution are shown in Table 4. The leachate pH of all four
MSWIFA samples from SPLP fluid was similar with DI leaching solution, with 10.33 to 11.35. The EC
of the SPLP leachate in all samples shown lower value than the DI leaching solution, with OA1 having a
lower value than other samples.
3.4. pH-dependent Leaching Test Results
3.4.1. Acid Neutralization Capacity
Acid Neutralization Capacity (ANC) is a key property of cement/waste systems related to resistance to
acid attack affecting matrix durability and thus leaching of contaminants. Solubility is strongly affected
by the pH conditions and the integrity of the solid matrix depends on its ability to maintain alkaline
conditions (Senden et al. 1997). The acid neutralization capacity (ANC) curve for all four MSWIFA
samples is shown in Figure 7. Negative values represent base addition. The pH (no acid or base added) of
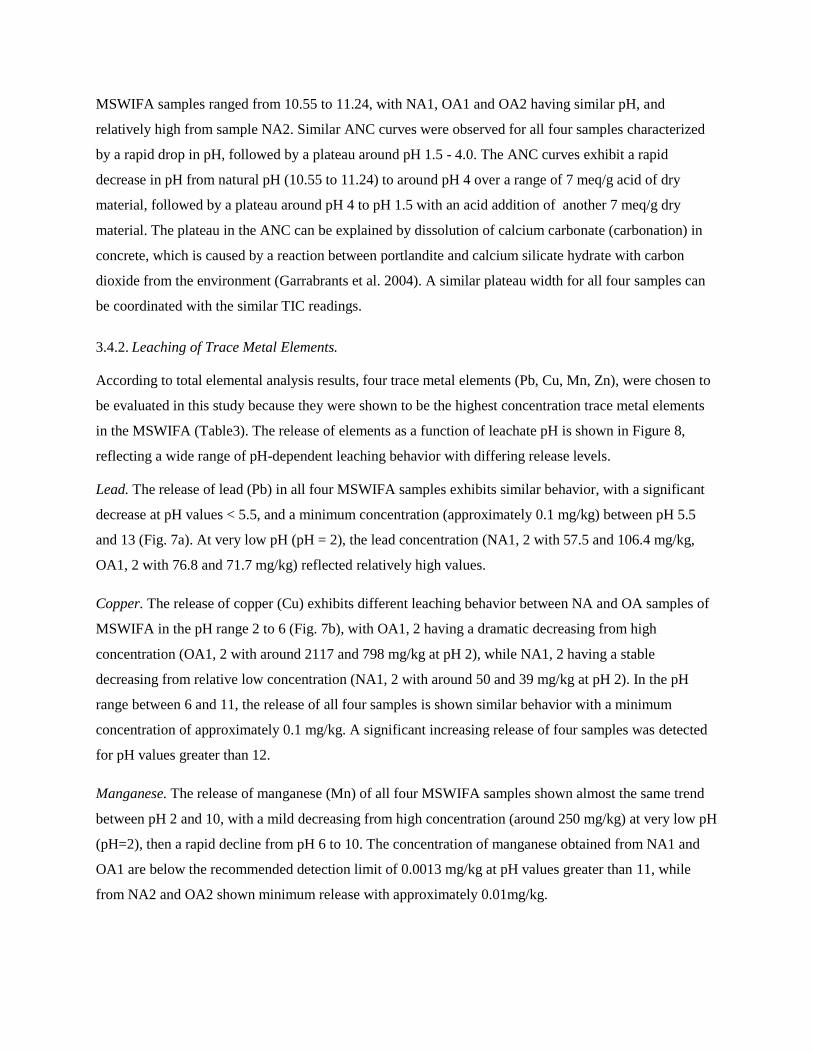
MSWIFA samples ranged from 10.55 to 11.24, with NA1, OA1 and OA2 having similar pH, and
relatively high from sample NA2. Similar ANC curves were observed for all four samples characterized
by a rapid drop in pH, followed by a plateau around pH 1.5 - 4.0. The ANC curves exhibit a rapid
decrease in pH from natural pH (10.55 to 11.24) to around pH 4 over a range of 7 meq/g acid of dry
material, followed by a plateau around pH 4 to pH 1.5 with an acid addition of another 7 meq/g dry
material. The plateau in the ANC can be explained by dissolution of calcium carbonate (carbonation) in
concrete, which is caused by a reaction between portlandite and calcium silicate hydrate with carbon
dioxide from the environment (Garrabrants et al. 2004). A similar plateau width for all four samples can
be coordinated with the similar TIC readings.
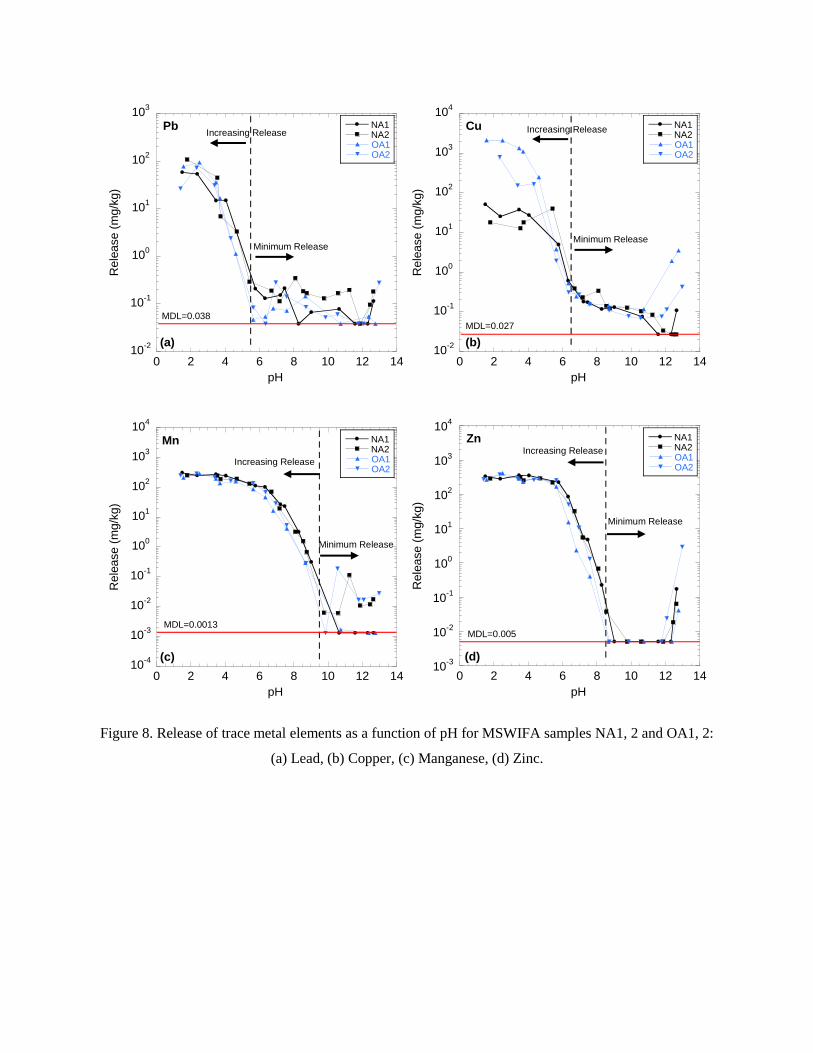
3.4.2. Leaching of Trace Metal Elements.
According to total elemental analysis results, four trace metal elements (Pb, Cu, Mn, Zn), were chosen to
be evaluated in this study because they were shown to be the highest concentration trace metal elements
in the MSWIFA (Table3). The release of elements as a function of leachate pH is shown in Figure 8,
reflecting a wide range of pH-dependent leaching behavior with differing release levels.
Lead. The release of lead (Pb) in all four MSWIFA samples exhibits similar behavior, with a significant
decrease at pH values < 5.5, and a minimum concentration (approximately 0.1 mg/kg) between pH 5.5
and 13 (Fig. 7a). At very low pH (pH = 2), the lead concentration (NA1, 2 with 57.5 and 106.4 mg/kg,
OA1, 2 with 76.8 and 71.7 mg/kg) reflected relatively high values.
Copper. The release of copper (Cu) exhibits different leaching behavior between NA and OA samples of
MSWIFA in the pH range 2 to 6 (Fig. 7b), with OA1, 2 having a dramatic decreasing from high
concentration (OA1, 2 with around 2117 and 798 mg/kg at pH 2), while NA1, 2 having a stable
decreasing from relative low concentration (NA1, 2 with around 50 and 39 mg/kg at pH 2). In the pH
range between 6 and 11, the release of all four samples is shown similar behavior with a minimum
concentration of approximately 0.1 mg/kg. A significant increasing release of four samples was detected
for pH values greater than 12.
Manganese. The release of manganese (Mn) of all four MSWIFA samples shown almost the same trend
between pH 2 and 10, with a mild decreasing from high concentration (around 250 mg/kg) at very low pH
(pH=2), then a rapid decline from pH 6 to 10. The concentration of manganese obtained from NA1 and
OA1 are below the recommended detection limit of 0.0013 mg/kg at pH values greater than 11, while
from NA2 and OA2 shown minimum release with approximately 0.01mg/kg.
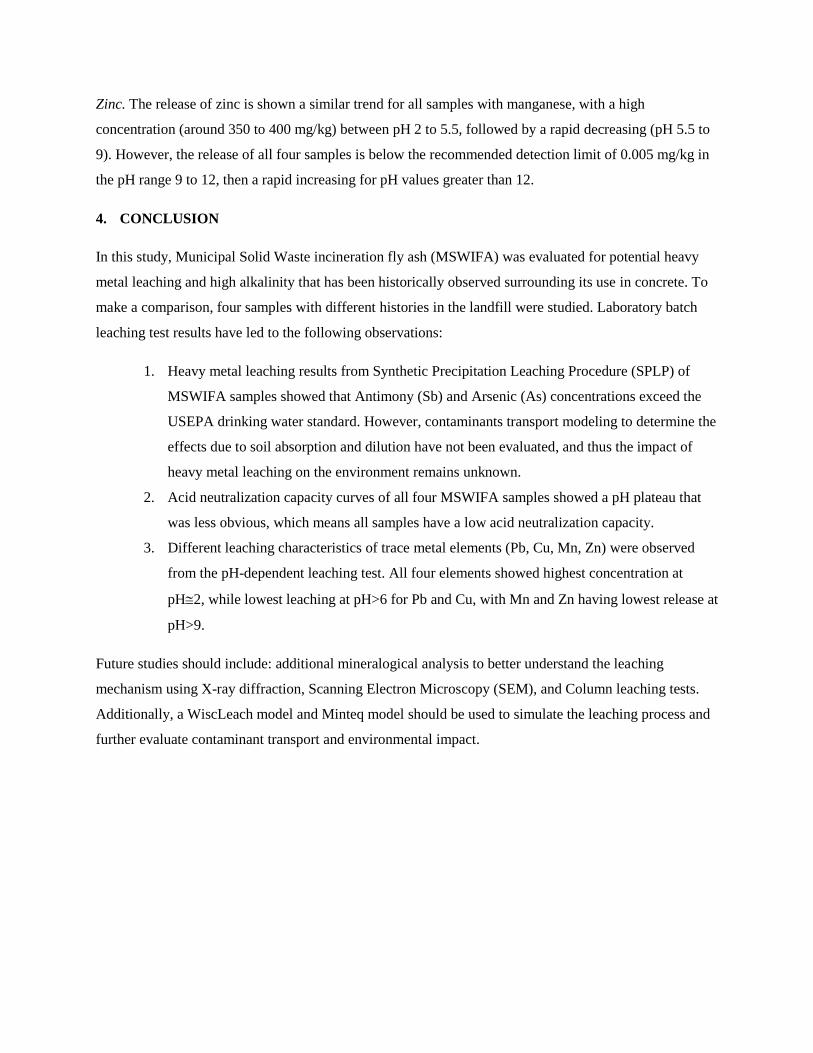
Zinc. The release of zinc is shown a similar trend for all samples with manganese, with a high
concentration (around 350 to 400 mg/kg) between pH 2 to 5.5, followed by a rapid decreasing (pH 5.5 to
9). However, the release of all four samples is below the recommended detection limit of 0.005 mg/kg in
the pH range 9 to 12, then a rapid increasing for pH values greater than 12.
4. CONCLUSION
In this study, Municipal Solid Waste incineration fly ash (MSWIFA) was evaluated for potential heavy
metal leaching and high alkalinity that has been historically observed surrounding its use in concrete. To
make a comparison, four samples with different histories in the landfill were studied. Laboratory batch
leaching test results have led to the following observations:
1. Heavy metal leaching results from Synthetic Precipitation Leaching Procedure (SPLP) of
MSWIFA samples showed that Antimony (Sb) and Arsenic (As) concentrations exceed the
USEPA drinking water standard. However, contaminants transport modeling to determine the
effects due to soil absorption and dilution have not been evaluated, and thus the impact of
heavy metal leaching on the environment remains unknown.
2. Acid neutralization capacity curves of all four MSWIFA samples showed a pH plateau that
was less obvious, which means all samples have a low acid neutralization capacity.
3. Different leaching characteristics of trace metal elements (Pb, Cu, Mn, Zn) were observed
from the pH-dependent leaching test. All four elements showed highest concentration at
pH2, while lowest leaching at pH>6 for Pb and Cu, with Mn and Zn having lowest release at
pH>9.
Future studies should include: additional mineralogical analysis to better understand the leaching
mechanism using X-ray diffraction, Scanning Electron Microscopy (SEM), and Column leaching tests.
Additionally, a WiscLeach model and Minteq model should be used to simulate the leaching process and
further evaluate contaminant transport and environmental impact.
REFERENCES
Bin-Shafique, S., Benson, C., Edil, T., and Hwang, K. (2006), Leachate Concentrations from Water Leach
and Column Leach Tests on Fly-Ash Stabilized Soil, Environmental Engineering Science, 23(1), 51-65.
Chen, J., Bradshaw, S., Benson, C., Tinjum, J., and Edil, T. (2012), pH-Dependent Leaching of Trace
Elements from Recycled Concrete Aggregate, State of the Art and Practice in Geotechnical Engineering,
GSP No. 225, R. Hryciw et al., Eds., ASCE, Reston VA, 3729-3738.
Garrabrants, A. C., Sanchez, F., Kosson, D. S. (2004). ―Changes in constituent equilibrium leaching and
pore water characteristics of a Portland cement mortar as a result of Carbonation.‖ Waste Manage. 24(1),
19–36.
Kosson, D. S., Van Der Sloot, H. A., Sanchez, F., and Garrabrants, A. C. (2002). ―An integrated
framework for evaluating leaching in waste management and utilization of secondary
materials.‖Environmental Engineering Science, 19(3), 159-204.
Li, L., Benson, C., Edil, T., and Hatipoglu, B. (2008), Sustainable Construction Case History: Fly Ash
Stabilization of Recycled Asphalt Pavement Material, Geotechnical and Geological Engineering, 26, 177-
187.
Senden, G.J., van der Sloot, H.A., Goumans, J.J.J.M. (1997). Waste Materials in Construction: Putting
Theory into Practice, Studies in Environmental Science, vol. 71, Elsevier, Amsterdam, pp. 803–814.
Shi, H. and Kan, L. (2008). ―Leaching behavior of heavy metals from municipal solid wastes incineration
(MSWI) fly ash used in concrete.‖ Journal of Hazardous Materials, Volume 164, Issues 2–3, Pages 750–
754.
USEPA (2010). ―Municipal Solid Waste Generation, Recycling, and Disposal in the United States: Facts
and Figures for 2010.‖ United States Environmental Protection Agency, Washington, DC.
USEPA (2012a). ―Municipal Solid Waste Combustion.‖ United States Environmental Protection Agency,
Washington, DC. http://www.epa.gov/epawaste/nonhaz/municipal/combustion.htm
USEPA (2012b). ―Municipal Solid Waste – Basic Information.‖ United States Environmental Protection
Agency, Washington, DC. http://www.epa.gov/wastes/nonhaz/municipal/wte/basic.htm
USEPA (2013). ―Clean Energy - Municipal Solid Waste.‖ United States Environmental Protection
Agency, Washington, DC. http://www.epa.gov/cleanenergy/energy-and-you/affect/municipal-sw.html
Wu, H. and Ting, Y. (2005). ―Metal extraction from municipal solid waste (MSW) incinerator fly ash—
Chemical leaching and fungal bioleaching.‖ Enzyme and microbial technology, volume 38, p 839 – 847.
TABLES
Table 1. Elements considered in MSWIFA leaching tests
Element Instrument MCL*(g/L) MDL(g /L)
Aluminum ICP-OES 50-200** 2
Calcium ICP-OES - 31
Iron ICP-OES 300** 2
Magnesium ICP-OES - 1
Potassium ICP-OES - <1000
Silicon ICP-OES - <1000
Sodium ICP-OES - 3
Strontium ICP-OES 4000*** <1
Barium ICP-OES 2000 0.08
Beryllium ICP-OES 4 0.11
Boron ICP-OES 6*** 2.2
Cadmium ICP-OES 5 0.53
Chromium ICP-OES 100 0.3
Cobalt ICP-OES - 0.8
Copper ICP-OES 1000** 2.7
Lead ICP-OES 15 3.8
Manganese ICP-OES 50 0.13
Molybdenum ICP-OES 40*** 3.3
Nickel ICP-OES 100*** 1.8
Vanadium ICP-OES - 0.8
Zinc ICP-OES 5000 0.5
Antimony ICP-MS 6 0.004
Arsenic ICP-MS 10 0.008
Mercury ICP-MS 2 0.03
Selenium ICP-MS 50 0.01
Thallium ICP-MS 2 0.006
*USEPA drinking water standard and Health Advisories
**Secondary drinking water regulation
***Health Advisories - Life time
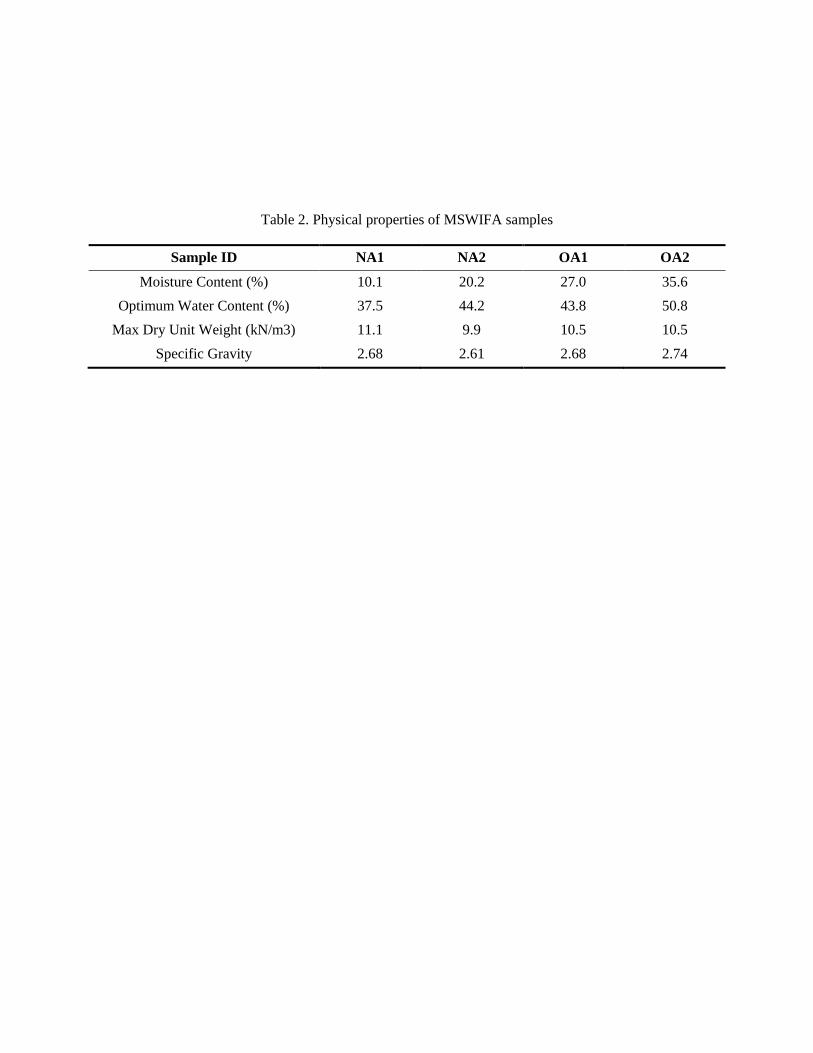
Table 2. Physical properties of MSWIFA samples
Sample ID NA1 NA2 OA1 OA2
Moisture Content (%) 10.1 20.2 27.0 35.6
Optimum Water Content (%) 37.5 44.2 43.8 50.8
Max Dry Unit Weight (kN/m3) 11.1 9.9 10.5 10.5
Specific Gravity 2.68 2.61 2.68 2.74
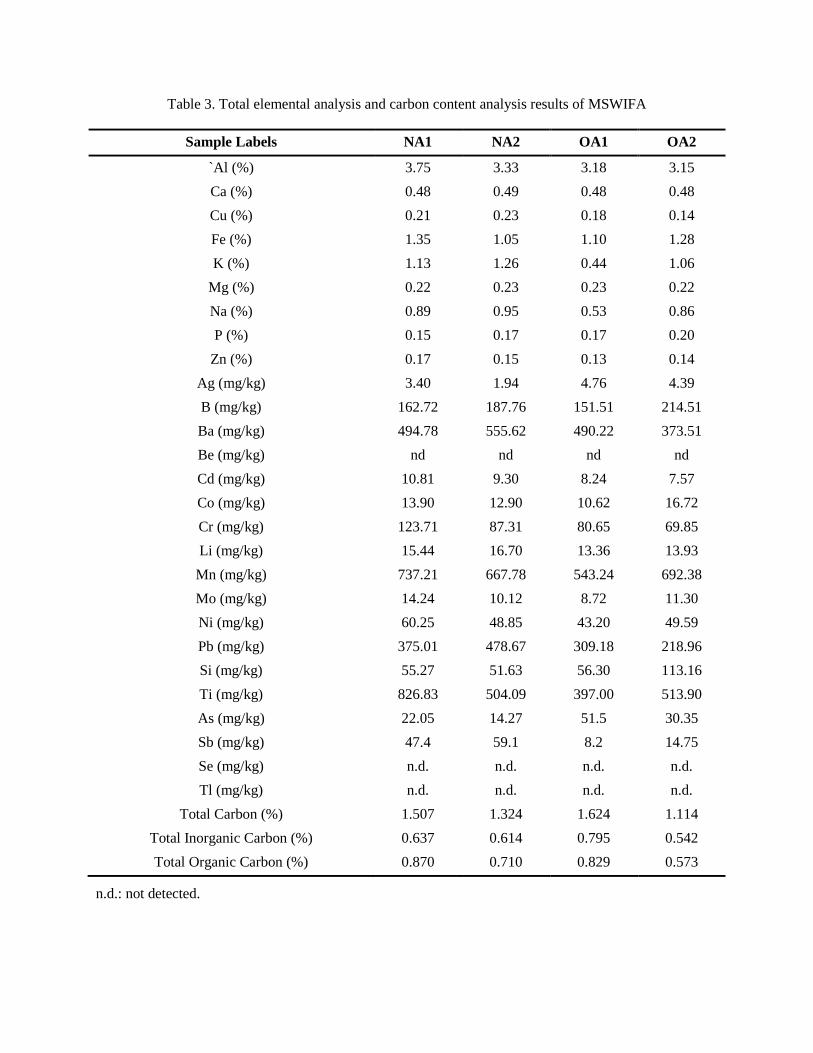
Table 3. Total elemental analysis and carbon content analysis results of MSWIFA
Sample Labels NA1 NA2 OA1 OA2
`Al (%) 3.75 3.33 3.18 3.15
Ca (%) 0.48 0.49 0.48 0.48
Cu (%) 0.21 0.23 0.18 0.14
Fe (%) 1.35 1.05 1.10 1.28
K (%) 1.13 1.26 0.44 1.06
Mg (%) 0.22 0.23 0.23 0.22
Na (%) 0.89 0.95 0.53 0.86
P (%) 0.15 0.17 0.17 0.20
Zn (%) 0.17 0.15 0.13 0.14
Ag (mg/kg) 3.40 1.94 4.76 4.39
B (mg/kg) 162.72 187.76 151.51 214.51
Ba (mg/kg) 494.78 555.62 490.22 373.51
Be (mg/kg) nd nd nd nd
Cd (mg/kg) 10.81 9.30 8.24 7.57
Co (mg/kg) 13.90 12.90 10.62 16.72
Cr (mg/kg) 123.71 87.31 80.65 69.85
Li (mg/kg) 15.44 16.70 13.36 13.93
Mn (mg/kg) 737.21 667.78 543.24 692.38
Mo (mg/kg) 14.24 10.12 8.72 11.30
Ni (mg/kg) 60.25 48.85 43.20 49.59
Pb (mg/kg) 375.01 478.67 309.18 218.96
Si (mg/kg) 55.27 51.63 56.30 113.16
Ti (mg/kg) 826.83 504.09 397.00 513.90
As (mg/kg) 22.05 14.27 51.5 30.35
Sb (mg/kg) 47.4 59.1 8.2 14.75
Se (mg/kg) n.d. n.d. n.d. n.d.
Tl (mg/kg) n.d. n.d. n.d. n.d.
Total Carbon (%) 1.507 1.324 1.624 1.114
Total Inorganic Carbon (%) 0.637 0.614 0.795 0.542
Total Organic Carbon (%) 0.870 0.710 0.829 0.573
n.d.: not detected.
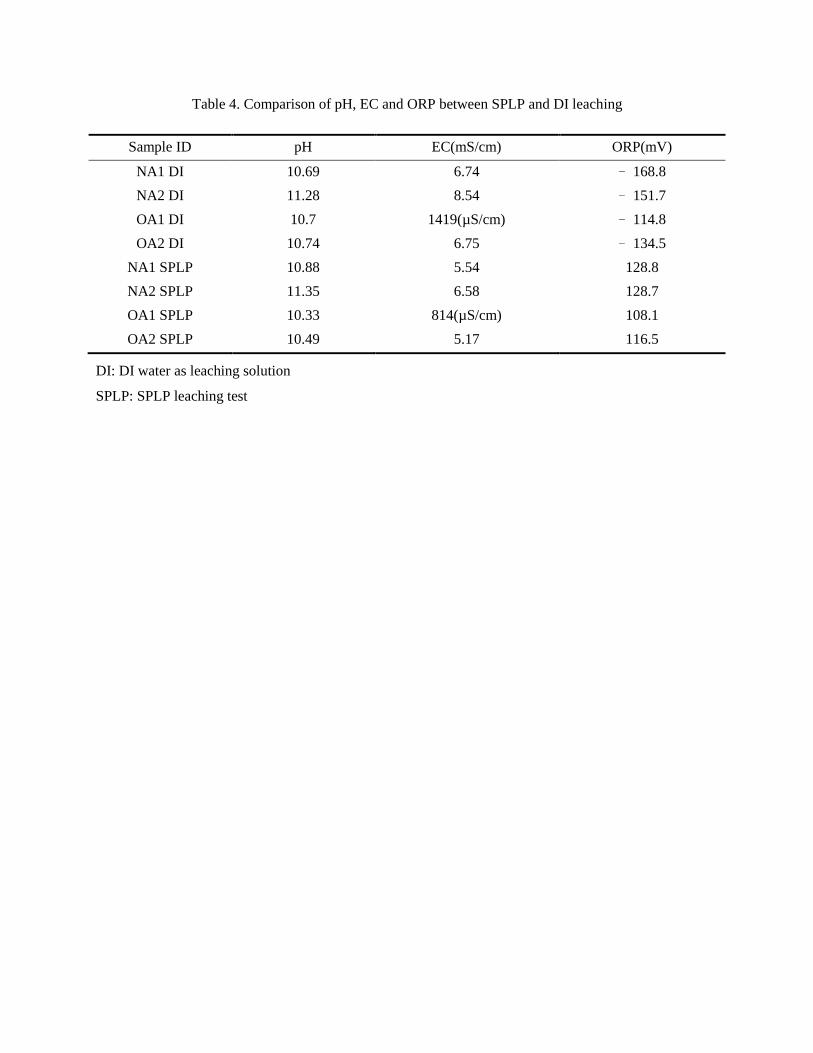
Table 4. Comparison of pH, EC and ORP between SPLP and DI leaching
Sample ID pH EC(mS/cm) ORP(mV)
NA1 DI 10.69 6.74 ﹣168.8
NA2 DI 11.28 8.54 ﹣151.7
OA1 DI 10.7 1419(µS/cm) ﹣114.8
OA2 DI 10.74 6.75 ﹣134.5
NA1 SPLP 10.88 5.54 128.8
NA2 SPLP 11.35 6.58 128.7
OA1 SPLP 10.33 814(µS/cm) 108.1
OA2 SPLP 10.49 5.17 116.5
DI: DI water as leaching solution
SPLP: SPLP leaching test
FIGURES
(A) New Ash 1 (NA1)
(B) New Ash 2 (NA2)
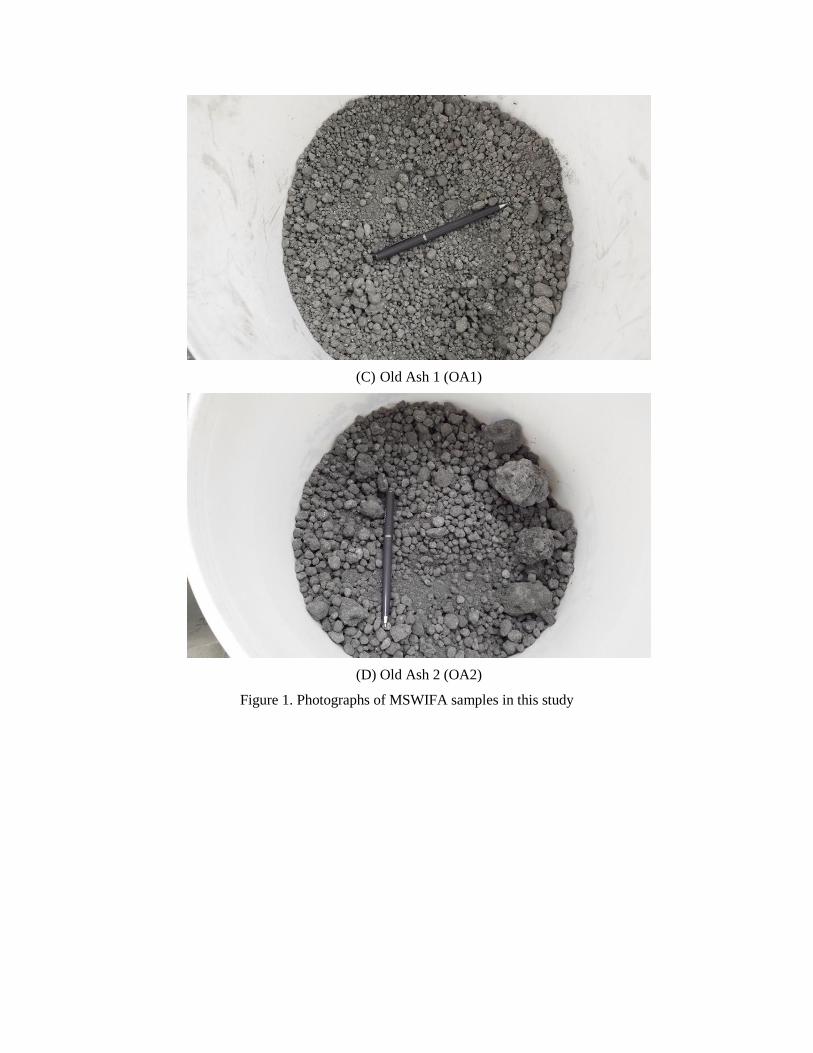
(C) Old Ash 1 (OA1)
(D) Old Ash 2 (OA2)
Figure 1. Photographs of MSWIFA samples in this study
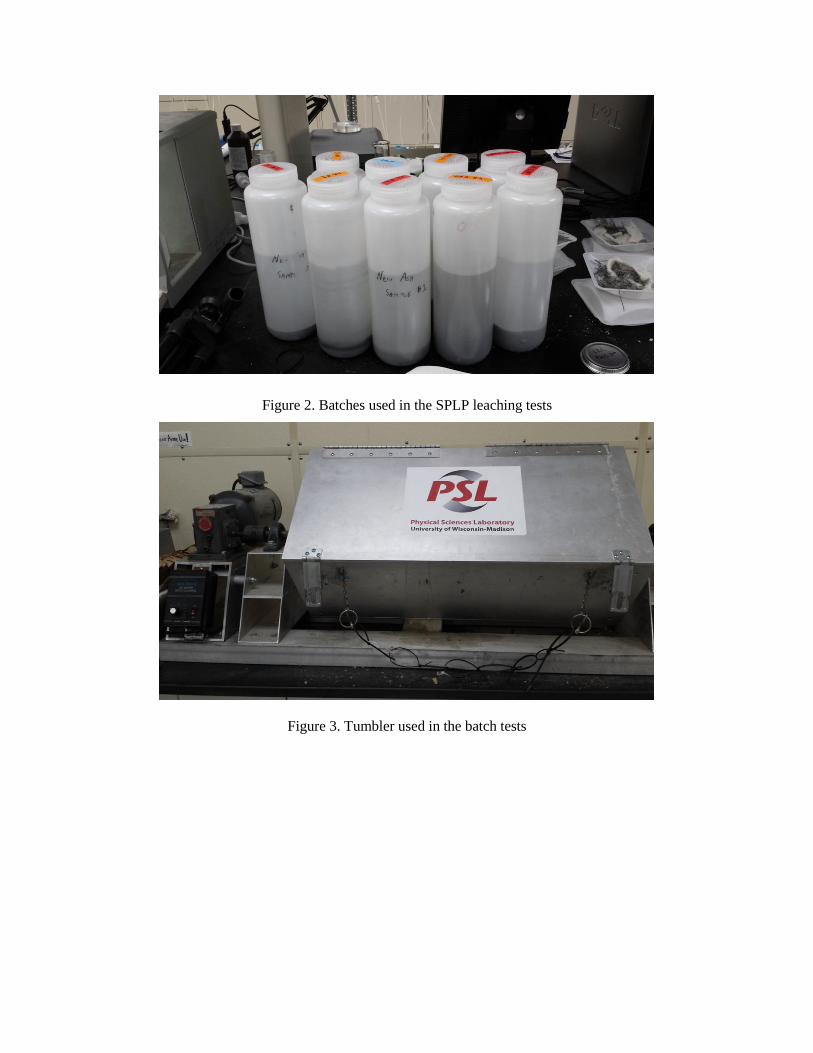
Figure 2. Batches used in the SPLP leaching tests
Figure 3. Tumbler used in the batch tests
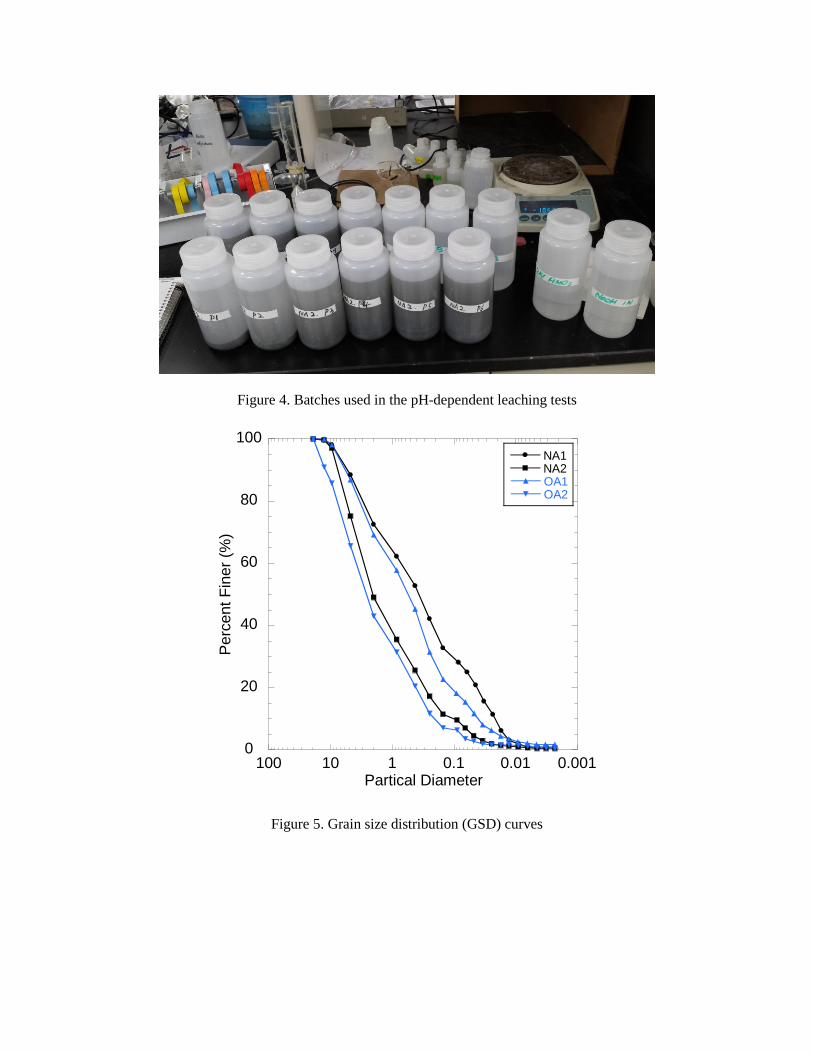
Figure 4. Batches used in the pH-dependent leaching tests
0
20
40
60
80
100
0.0010.010.1110100
NA1NA2OA1OA2
Perc
ent
Fin
er
(%)
Partical Diameter
Figure 5. Grain size distribution (GSD) curves
100
101
102
103
As Cr Pb Se Sb
NA1
NA2
OA1
OA2
Con
centr
ation (
µg/L
)MCL
Figure 6. Heavy metal concentration in leachate from Synthetic Precipitation Leaching Procedure (SPLP)
0
2
4
6
8
10
12
14
-5 0 5 10 15
NA1
NA2
OA1
OA2
pH
Acid/Base Addition [meq/g-dry]
Base Acid
Figure 7. Acid neutralization capacity (ANC) curve of all four samples from batch leaching tests
10-2
10-1
100
101
102
103
0 2 4 6 8 10 12 14
NA1NA2OA1OA2
Rele
ase (
mg/k
g)
pH
PbIncreasing Release
Minimum Release
(a)
MDL=0.038
10-2
10-1
100
101
102
103
104
0 2 4 6 8 10 12 14
NA1NA2OA1OA2
Rele
ase (
mg/k
g)
pH
Cu Increasing Release
Minimum Release
(b)
MDL=0.027
10-4
10-3
10-2
10-1
100
101
102
103
104
0 2 4 6 8 10 12 14
NA1NA2OA1OA2
Rele
ase (
mg/k
g)
pH
Mn
Increasing Release
Minimum Release
(c)
MDL=0.0013
10-3
10-2
10-1
100
101
102
103
104
0 2 4 6 8 10 12 14
NA1NA2OA1OA2
Rele
ase (
mg
/kg)
pH
ZnIncreasing Release
Minimum Release
(d)
MDL=0.005
Figure 8. Release of trace metal elements as a function of pH for MSWIFA samples NA1, 2 and OA1, 2:
(a) Lead, (b) Copper, (c) Manganese, (d) Zinc.