university of trieste - core.ac.uk · malattie neurodegenerative esaminate finora, l'attività...
TRANSCRIPT
UNIVERSITY OF TRIESTE
PHD PROGRAM IN NEUROSCIENCE AND COGNITIVE SCIENCE – NEUROBIOLOGY
XXIII CYCLE
Identification of tissue transglutaminase protein network
(Scientific field: Genetics – BIO/18)
CANDIDATE COORDINATOR
Ana-Marija Sulić Prof. Pierpaolo Battaglini
University of Trieste
TUTOR
Prof. Paolo Edomi
University of Trieste
SUPERVISOR
Prof. Daniele Sblattero
University of Eastern Piedmont
CO-TUTOR
Prof. Roberto Marzari
University of Trieste
ACADEMIC YEAR 2009/2010
TABLE OF CONTENTS
1
TABLE OF CONTENTS
ABSTRACT ....................................................................................................................................... 3
RIASSUNTO ..................................................................................................................................... 4
INTRODUCTION ............................................................................................................................. 5
1 Transglutaminases ....................................................................................................................... 5
2 Tissue transglutaminase .............................................................................................................. 7
2.1 Function of tissue tranglutaminase in the cell ...................................................................... 9
2.1.1 TG2 knockout mice ..................................................................................................... 12
2.2 TG2 substrates and interactors ........................................................................................... 12
3 Tissue transglutaminase in disease ............................................................................................ 15
3.1 Celiac disease ..................................................................................................................... 15
3.2 TG2 in inflammation and cancer ........................................................................................ 16
3.3 Neurodegenerative diseases ............................................................................................... 19
3.3.1 Alzheimer's disease ..................................................................................................... 20
3.3.2 Huntington's disease .................................................................................................... 22
3.3.3 Parkinson‟s disease ..................................................................................................... 23
3.4 TG2 inhibitors .................................................................................................................... 24
4 Gene expression technologies ................................................................................................... 27
4.1 Expression libraries ............................................................................................................ 27
4.2. Display systems ................................................................................................................. 29
4.3 Phage Display .................................................................................................................... 31
4.3.1 pPAO vector ................................................................................................................ 35
AIM OF THE RESEARCH ............................................................................................................. 38
RESULTS ........................................................................................................................................ 39
1 Introduction to results ............................................................................................................... 39
1.1 Strategy .............................................................................................................................. 39
1.2 Construction of the phage display ORFs cDNA library .................................................... 41
1.3 cDNA library characterization by massive sequencing ..................................................... 41
2 Selection of the phage display library ....................................................................................... 44
2.1 Solid phase selection .......................................................................................................... 44
2.2 Soluble biotinylated selection ............................................................................................ 45
3 Selection output analysis ........................................................................................................... 47
3.1 Approach 1: Random analysis of the output clones ........................................................... 47
3.2 Approach 2: Massive analysis of the output clones ........................................................... 50
TABLE OF CONTENTS
2
3.2.1 The focus index ........................................................................................................... 51
3.2.2 Ranking of reads ......................................................................................................... 52
3.2.3 Clone identification and ELISA validation ................................................................. 57
4 Validation of the interacting clones .......................................................................................... 60
4.1 Validation by the protein complementation assay ............................................................. 61
4.2 Characterization of TG2 interacting proteins as possible TG2 substrates ......................... 62
4.2.1 Construction of the pET28b-GST(QN)-6xHis expression vector ............................... 63
4.2.2 Production of GST(QN)-fusion proteins ..................................................................... 64
4.2.3 Transamidation assay .................................................................................................. 65
5 Restriction of TG2-FN1 interaction domain ............................................................................. 67
5.1 Rescue of the FN1 cDNA inserts and validation .............................................................. 67
5.2 Validation of TG2 interaction ............................................................................................ 68
DISCUSSION .................................................................................................................................. 70
MATERIALS AND METHODS ..................................................................................................... 78
BIBLIOGRAPHY ............................................................................................................................ 95
ABSTRACT
3
ABSTRACT
Tissue transglutaminase (TG2) is a multifunctional enyzme involved in cell growth and
differentiantion, receptor mediated endocytosis, cell adhesion and morphology,
stabilization of extracellular matrix, membrane trafficking and structure/function, signal
transduction, regulation of cytoskeleton and apoptosis. Multiple lines of evidence suggest
an involvement of TG2 autoimmune diseases, cancer and in neurodegenerative diseases,
including Alzheimer's disease, progressive supranuclear palsy, Huntington's disease and
Parkinson's disease. In all of the neurodegenerative diseases examined to date, TG2
activity is upregulated in selectively vulnerable brain regions, TG2 proteins are associated
with inclusion bodies characteristic of the diseases, and prominent proteins in the inclusion
bodies are modified by TG2 enzyme. It is important to identify TG2 substrates as they
may offer an understanding of how the TG2-catalyzed post-translational modification has
an impact on physiology and disease. Identification of these substrates may lead to novel
drug targets and new diagnostic markers for several TG2-related diseases. A variety of
different methods have been proposed for the identification of TG2 substrates. In this work
we applied a new method for identification of TG2 substrates (interactors) by using a
selection of cDNA phage display libraries followed by massive gene sequencing with 454
system. Ranking and analysis of more than 120,000 sequences allowed us to identify
several potential substrates and interactors, which were subsequently confirmed in
functional assays. Within the identified clones, some had been previously described as
interacting proteins (fibronectin, SMOC1, EIF4G2, MYO18A, GSTO2), while others were
new. When compared to standard systems, such as microtiter ELISA, the method described
here is dramatically faster and yields far more information about the interaction under
study, allowing better characterization of complex systems. For example, in the case of
fibronectin, it was possible to identify the specific domains involved in the interaction. We
expect that this approach to library and selection analysis can also be extended to other
methods traditionally used to study protein-protein interactions, as well as to the study of
the selection of peptides and antibodies by phage display.
RIASSUNTO
4
RIASSUNTO
L'enzima transglutaminasi tissutale è un enzima multifunzionale. Questa proteina gioca un
ruolo importante durante lo sviluppo, crescita e differenziamento cellulare, endocitosi
mediata da recettore, adesione e morfologia cellulare, stabilizzazione della matrice
extracellulare, traffico e struttura/funzione di membrana, trasduzione del segnale,
regolazione del citoscheletro ed apoptosi. Molteplici evidenze indicano un coinvolgimento
di TG2 in diverse patologie neurodegenerative, incluso il morbo di Alzheimer, la paralisi
progressiva supranucleare, il morbo di Huntington e quello di Parkinson. In tutte le
malattie neurodegenerative esaminate finora, l'attività della TG2 è aumentata in specifiche
regioni cerebrali e le proteine sono associate in corpi d‟inclusione caratteristici di tali
patologie dove vengono modificate dall'enzima TG2. E‟ importante identificare i substrati
della TG2 per comprendere come le modifiche post-traduzionali introdotte da questo
enzima siano coinvolte nella patogenesi delle suddette malattie. Molteplici metodiche
sperimentali sono state proposte ai fini dell'identificazione dei substrati della TG2. In
questo lavoro è stato applicato un nuovo metodo per l‟identificazione dei substrati della
TG2 (interattori), selezionando una libreria di cDNA espressa come phage display, seguito
da un sequenziamento genico massivo utilizzando il sistema 454 Life Sciences. La
classificazione e l‟analisi di più di 120,000 sequenze di DNA ha permesso di identificare
molti substrati e potenziali interattori, che sono stati successivamente confermati con le
analisi funzionali. All‟interno dei cloni identificati, alcuni erano già stati precedentemente
descritti come proteine interagenti (interattori) (fibronectina, SMOC1, EIF4G1, MYO18A,
GSTO2), mentre altri sono stati identificati come nuovi. Nella comparazione con i metodi
standard, come, ad esempio, ELISA, il metodo qui descritto risulta enormemente più
rapido e fornisce un numero molto maggiore di informazioni relative alle interazioni
analizzate, permettendo quindi una migliore caratterizzazione di sistemi complessi. Ad
esempio, nel caso della fibronectina, è stato possibile identificare i domini specifici
coinvolti nell‟interazione. Prevediamo che questo approccio per l‟analisi e la selezione di
librerie, possa essere applicato anche ad altri metodi tradizionalmente usati per lo studio di
interazioni proteina- proteina, così come allo studio di selezioni di peptidi e anticorpi
tramite la tecnica del phage display.
INTRODUCTION
5
INTRODUCTION
1 Transglutaminases
Transglutaminases (TGase EC 2.3.2.13) are a family of enzymes that catalyze
posttranslation modification of proteins via Ca2+
- dependent cross-linking reactions
through an acyl-transfer reaction between the γ-carboxamide group of peptide-bound
glutamine and the ε-amino group of peptide-bound lysine, resulting in a ε-(γ-
glutamyl)lysine isopeptide bond [1]. This bond is highly resistant to proteolysis and
denaturants and it gives stable, rigid and insoluble protein complexes. The term
transglutminase was first described in 1957 by Clarke and al. [2] in the study of
transamidating activity in guinea-pig liver. TGases have been identified in micro-
organisms [3], plants [4], invertebrates [5] and vertebrates [2]. In mammals, eight TGase
isoenzymes, and one TGase-like protein, have been identified at genomic level (Table
1.1.), but only six of them have been isolated and characterized at protein level. These nine
evolutionary related genes, clustered on five different chromosomes are the products of
sucessive duplication and rearrangement. They have a structural homology and belong to a
papain-like superfamily of cysteine proteases that possess a catalytic triad of Cys-His-Asp
or Cys-His-Asn. The tissue content of the different isoenzymes is tightly regulated at the
transcriptional level. Described isoenzymes are:
the circulating zymogen Factor XIII is converted into the active TGase Factor
XIIIa (plasma TGase) by a thrombin-dependent proteolysis, it is involved in
stabilization of fibrin clots and in wound healing;
the keratinocyte TGase (TG1) exists in membrane-bound and soluble forms, it is
also activated by proteolysis and is involved in the terminal differentiation of
keratinocytes;
the ubiquitous type 2 tissue TGase (TG2) exists in extracellular and intracellular
form in various tissue types, has an increasing number of biological functions, like
differentiation, transmembrane signalling, cell adhesion, organization of the
extracellular matrix, and pro- and anti-apoptotic roles;
INTRODUCTION
6
the epidermal/hair follicle TGase (TG3), which also requires proteolysis to
become active and, like TG1, is involved in the terminal differentiation of the
keratinocyte;
the prostatic secretory TGase (TG4), essential for fertility in rodents and is a
novel target for prostate-related diseases in humans [6];
TG5 probably plays a role in keratinocyte differentiation and the cornified cell
envelope assembly [7];
TG6 has a close homology to TG2 and TG3 and is predominantly expressed by a
subset of neurons in the central nervous system (CNS) [8];
recently discovered TG7;
erythrocyte protein band 4.2, TGase-like protein characterized from red blood
cells, has strong sequence identity with the TGase family of proteins, but is inactive
because of a substitution of alanine for the active-site cysteine, has no enzymatic
activity, forms a major component of the erythrocyte membrane skeleton and
maintains erythrocyte membrane integrity.
All isoenzymes require Ca2+
for catalytic activity and four of them (TG2, TG3, TG4 and
TG5) are inhibited by GTP [9-11].
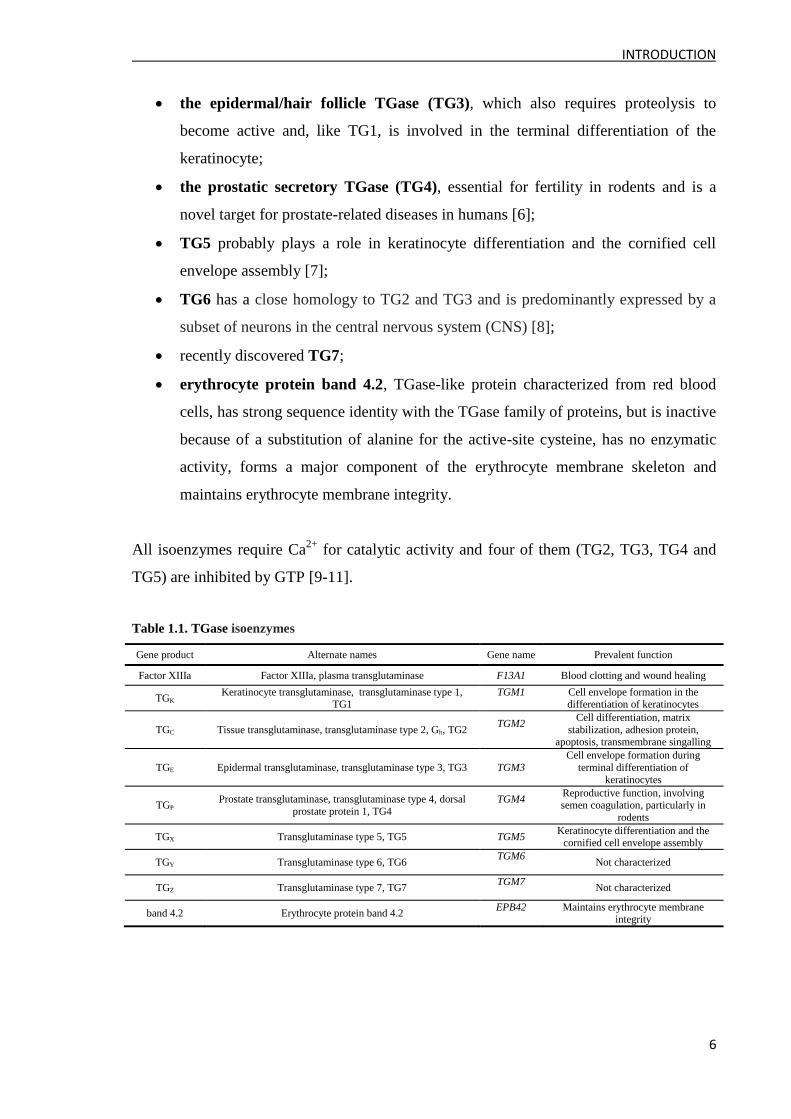
Table 1.1. TGase isoenzymes
Gene product Alternate names Gene name Prevalent function
Factor XIIIa Factor XIIIa, plasma transglutaminase F13A1 Blood clotting and wound healing
TGK Keratinocyte transglutaminase, transglutaminase type 1,
TG1 TGM1
Cell envelope formation in the differentiation of keratinocytes
TGC Tissue transglutaminase, transglutaminase type 2, Gh, TG2 TGM2
Cell differentiation, matrix
stabilization, adhesion protein, apoptosis, transmembrane singalling
TGE Epidermal transglutaminase, transglutaminase type 3, TG3 TGM3
Cell envelope formation during
terminal differentiation of
keratinocytes
TGP Prostate transglutaminase, transglutaminase type 4, dorsal
prostate protein 1, TG4
TGM4
Reproductive function, involving semen coagulation, particularly in
rodents
TGX Transglutaminase type 5, TG5 TGM5 Keratinocyte differentiation and the
cornified cell envelope assembly
TGY Transglutaminase type 6, TG6 TGM6
Not characterized
TGZ Transglutaminase type 7, TG7 TGM7
Not characterized
band 4.2 Erythrocyte protein band 4.2 EPB42
Maintains erythrocyte membrane
integrity
INTRODUCTION
7
2 Tissue transglutaminase
Tissue transglutaminase (TG2) is the most diverse and ubiquitous transglutaminase
izoenzyme with a variety of biochemical functions. TG2 is predominantly an intracellular
protein (localized in the cytosol, nucleus and cell membrane compartments), but it can also
be secreted outside the cell by a still unknown mechanism, where it has extracellular
functions. Expression levels of TG2 are highest in endothelial cells and monocyte-derived
macrophages, although vascular smooth muscle cells, connective tissue fibroblasts,
osteoblasts, neurons, astrocytes, hepatocytes and epidermal keratinocytes also express
significant amounts of the protein [12-14].
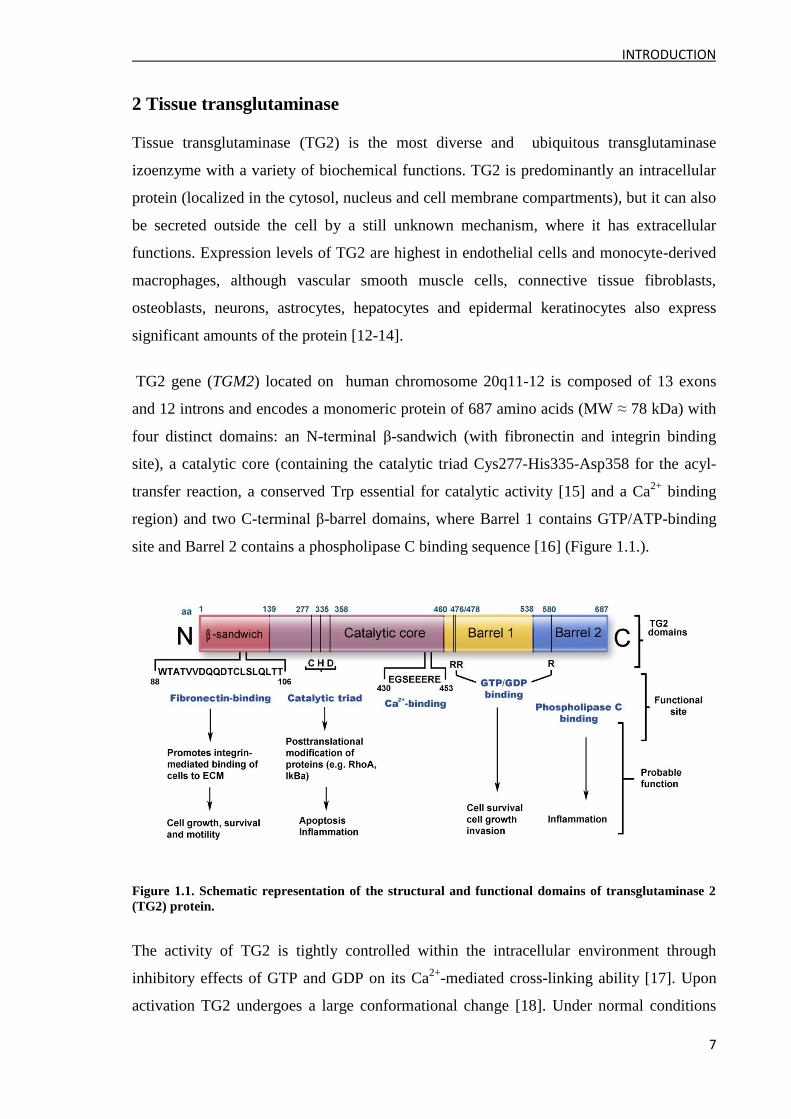
TG2 gene (TGM2) located on human chromosome 20q11-12 is composed of 13 exons
and 12 introns and encodes a monomeric protein of 687 amino acids (MW ≈ 78 kDa) with
four distinct domains: an N-terminal β-sandwich (with fibronectin and integrin binding
site), a catalytic core (containing the catalytic triad Cys277-His335-Asp358 for the acyl-
transfer reaction, a conserved Trp essential for catalytic activity [15] and a Ca2+
binding
region) and two C-terminal β-barrel domains, where Barrel 1 contains GTP/ATP-binding
site and Barrel 2 contains a phospholipase C binding sequence [16] (Figure 1.1.).
Figure 1.1. Schematic representation of the structural and functional domains of transglutaminase 2
(TG2) protein.
The activity of TG2 is tightly controlled within the intracellular environment through
inhibitory effects of GTP and GDP on its Ca2+
-mediated cross-linking ability [17]. Upon
activation TG2 undergoes a large conformational change [18]. Under normal conditions
INTRODUCTION
8
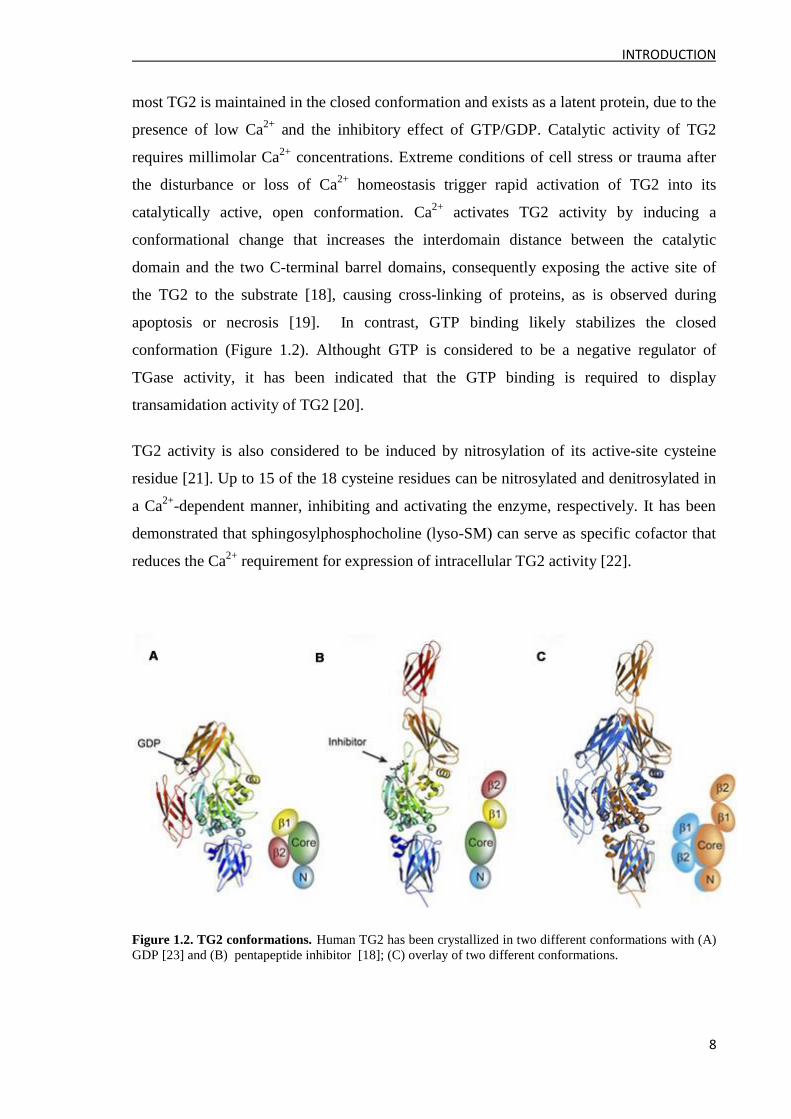
most TG2 is maintained in the closed conformation and exists as a latent protein, due to the
presence of low Ca2+
and the inhibitory effect of GTP/GDP. Catalytic activity of TG2
requires millimolar Ca2+
concentrations. Extreme conditions of cell stress or trauma after
the disturbance or loss of Ca2+
homeostasis trigger rapid activation of TG2 into its
catalytically active, open conformation. Ca2+
activates TG2 activity by inducing a
conformational change that increases the interdomain distance between the catalytic
domain and the two C-terminal barrel domains, consequently exposing the active site of
the TG2 to the substrate [18], causing cross-linking of proteins, as is observed during
apoptosis or necrosis [19]. In contrast, GTP binding likely stabilizes the closed
conformation (Figure 1.2). Althought GTP is considered to be a negative regulator of
TGase activity, it has been indicated that the GTP binding is required to display
transamidation activity of TG2 [20].
TG2 activity is also considered to be induced by nitrosylation of its active-site cysteine
residue [21]. Up to 15 of the 18 cysteine residues can be nitrosylated and denitrosylated in
a Ca2+
-dependent manner, inhibiting and activating the enzyme, respectively. It has been
demonstrated that sphingosylphosphocholine (lyso-SM) can serve as specific cofactor that
reduces the Ca2+
requirement for expression of intracellular TG2 activity [22].
Figure 1.2. TG2 conformations. Human TG2 has been crystallized in two different conformations with (A)
GDP [23] and (B) pentapeptide inhibitor [18]; (C) overlay of two different conformations.
INTRODUCTION
9
2.1 Function of tissue tranglutaminase in the cell
TG2 has been proposed to act as a versatile multifunctional protein, involved in a variety
of biological functions. It is thought to serve distinct physiological functions within
different cellular compartments and it is possible that its functions are dictated by its
cellular location, interaction with other proteins and binding to co-factors.
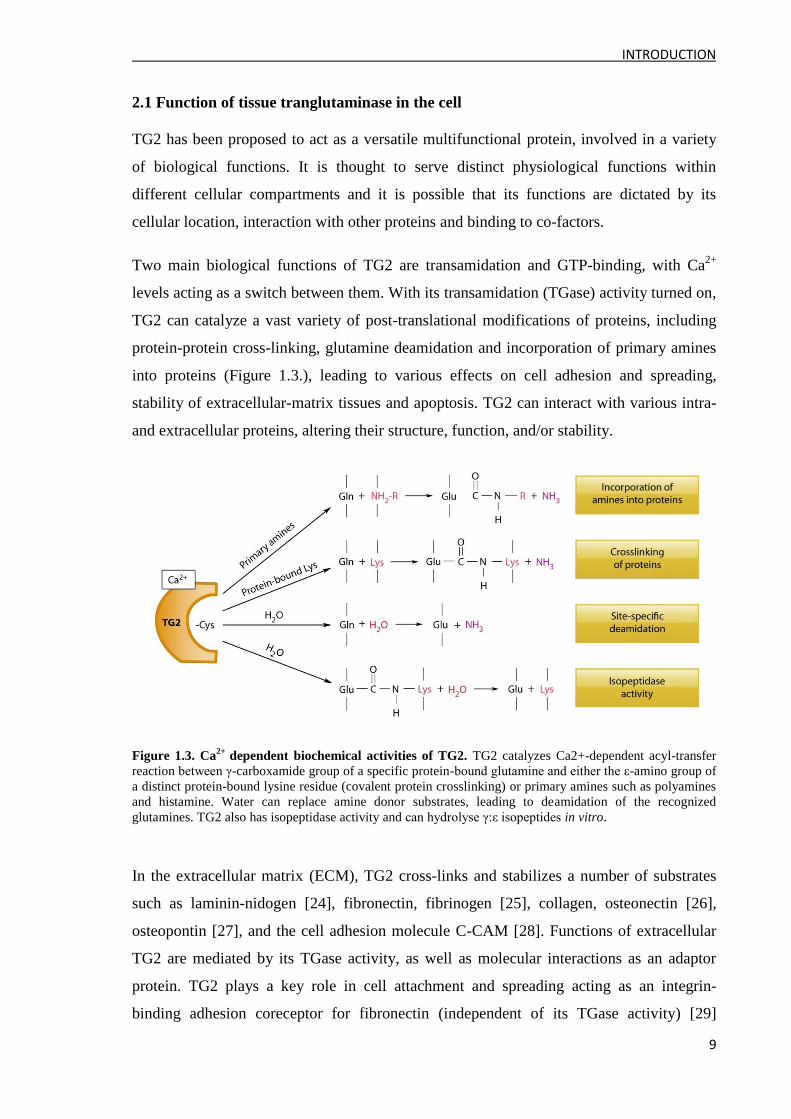
Two main biological functions of TG2 are transamidation and GTP-binding, with Ca2+
levels acting as a switch between them. With its transamidation (TGase) activity turned on,
TG2 can catalyze a vast variety of post-translational modifications of proteins, including
protein-protein cross-linking, glutamine deamidation and incorporation of primary amines
into proteins (Figure 1.3.), leading to various effects on cell adhesion and spreading,
stability of extracellular-matrix tissues and apoptosis. TG2 can interact with various intra-
and extracellular proteins, altering their structure, function, and/or stability.
Figure 1.3. Ca2+
dependent biochemical activities of TG2. TG2 catalyzes Ca2+-dependent acyl-transfer
reaction between γ-carboxamide group of a specific protein-bound glutamine and either the ε-amino group of
a distinct protein-bound lysine residue (covalent protein crosslinking) or primary amines such as polyamines
and histamine. Water can replace amine donor substrates, leading to deamidation of the recognized
glutamines. TG2 also has isopeptidase activity and can hydrolyse γ:ε isopeptides in vitro.
In the extracellular matrix (ECM), TG2 cross-links and stabilizes a number of substrates
such as laminin-nidogen [24], fibronectin, fibrinogen [25], collagen, osteonectin [26],
osteopontin [27], and the cell adhesion molecule C-CAM [28]. Functions of extracellular
TG2 are mediated by its TGase activity, as well as molecular interactions as an adaptor
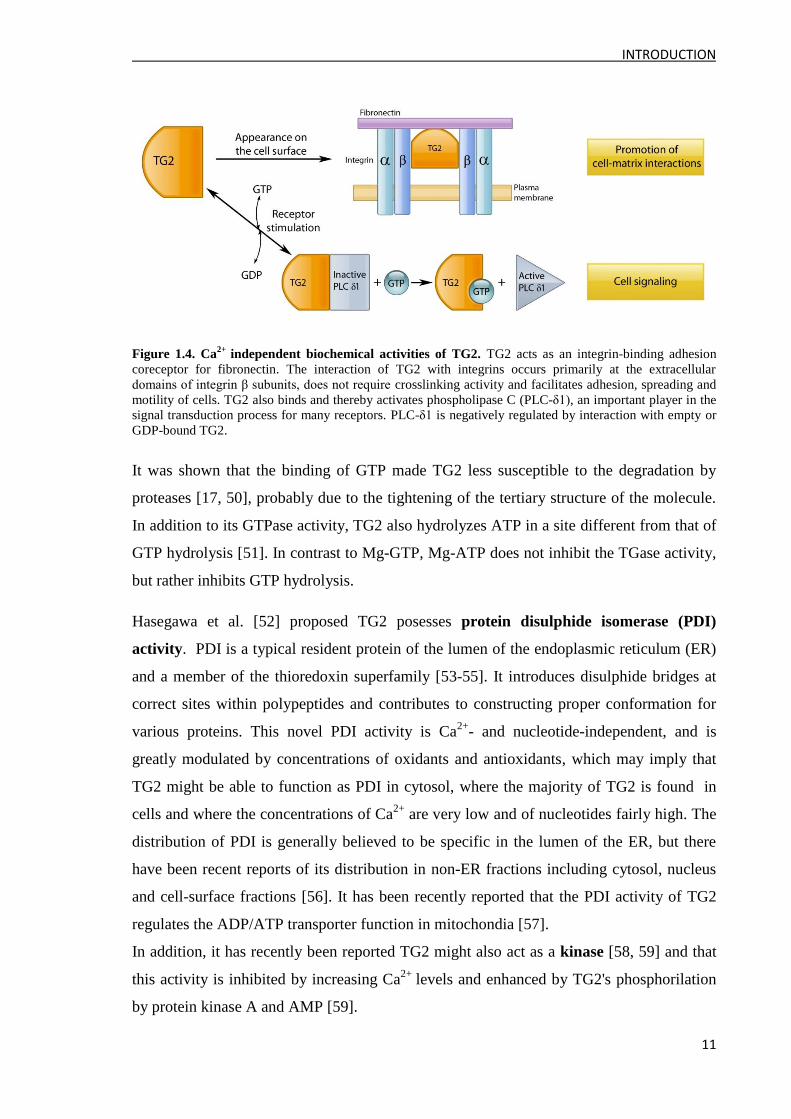
protein. TG2 plays a key role in cell attachment and spreading acting as an integrin-
binding adhesion coreceptor for fibronectin (independent of its TGase activity) [29]

INTRODUCTION
10
(Figure 1.4.), wound healing through association with syndecan-4 in fibroblasts [30], the
stabilization of ECM through protein cross-linking, outside-in signaling by promoting
integrin clustering in the membrane [29] and promotion [31] or inhibition of angiogenesis
[32, 33]. Externalization of TG2 into ECM is not clear. TG2 is translocated to the plasma
membrane and subsequently deposited into the ECM via a non-classical secretory
mechanism reportedly dependent on an intact fibronectin-binding site in the amino-
terminal β sandwich domain of TG2 (Figure 2.1.) [34] and an intact active-site cystein
[35], implying that its tertiary conformation is critical for its externalization mechanism.
TG2 is subsequently internalized and degraded in lysosomes through interaction with the
major endocytic receptor, low-density lipoprotein receptor-related protein 1 (LRP1) [36].
TGase activity has been linked to apoptosis [37] and TG2 being pro-apoptotic [38]. TG2
levels and TGase activity are elevated when apoptosis is induced and Ca2+
homeostasis
lost. TG2 activation leads to the irreversible assembly of a cross-linked protein scaffold in
dead cells. Thus, TG2-catalyzed protein polymerization contributes to the ultrastructural
changes typical of dying apoptotic cells; it stabilizes the integrity of the apoptotic cells,
preventing the release of harmful intracellular components into the extracellular space and,
consequently, inflammation and scar formation [39]. However, it has been reported TG2
can also attenuate apoptosis through TGase activity [40], and also differentially modulate it
in a stimuli-dependent manner [41]. In this way, if the stressor increases the TGase
activity, TG2 will be pro-apoptotic. However, if the stressor did not result in an increase in
TGase activity, TG2 ameliorates apoptosis. Anti-apoptotic effect of TG2 has been
observed in several cancer cell lines via activation of the NF-κB pathway [42, 43].
TG2 is also a GTP-binding protein (GTPase activity) [44] and its ability to bind and
hydrolyze GTP with affinity and rates like those of traditional G proteins distinguishes it
from other transglutaminases and suggests that TG2, like other G proteins, participates in
signaling pathways acting as a signalling intermediary coupling cell-surface receptors to
intracellular effectors [45-47]. TG2 activates phospholipase C (PLC)-δ1 [48], a key player
in the signal transduction process for many receptors. PLC-δ1 is negatively regulated by
interaction with empty or GDP-bound TG2. The activity of PLC-δ1 is suppressed by
interaction with TG2. However, the association between the two proteins would be negated
by the binding of GTP to TG2, which, in turn, would cause the activation of PLC-δ1 [49]
(Figure 1.4.).
INTRODUCTION
11
Figure 1.4. Ca2+
independent biochemical activities of TG2. TG2 acts as an integrin-binding adhesion
coreceptor for fibronectin. The interaction of TG2 with integrins occurs primarily at the extracellular
domains of integrin β subunits, does not require crosslinking activity and facilitates adhesion, spreading and
motility of cells. TG2 also binds and thereby activates phospholipase C (PLC-δ1), an important player in the
signal transduction process for many receptors. PLC-δ1 is negatively regulated by interaction with empty or
GDP-bound TG2.
It was shown that the binding of GTP made TG2 less susceptible to the degradation by
proteases [17, 50], probably due to the tightening of the tertiary structure of the molecule.
In addition to its GTPase activity, TG2 also hydrolyzes ATP in a site different from that of
GTP hydrolysis [51]. In contrast to Mg-GTP, Mg-ATP does not inhibit the TGase activity,
but rather inhibits GTP hydrolysis.
Hasegawa et al. [52] proposed TG2 posesses protein disulphide isomerase (PDI)
activity. PDI is a typical resident protein of the lumen of the endoplasmic reticulum (ER)
and a member of the thioredoxin superfamily [53-55]. It introduces disulphide bridges at
correct sites within polypeptides and contributes to constructing proper conformation for
various proteins. This novel PDI activity is Ca2+
- and nucleotide-independent, and is
greatly modulated by concentrations of oxidants and antioxidants, which may imply that
TG2 might be able to function as PDI in cytosol, where the majority of TG2 is found in
cells and where the concentrations of Ca2+
are very low and of nucleotides fairly high. The
distribution of PDI is generally believed to be specific in the lumen of the ER, but there
have been recent reports of its distribution in non-ER fractions including cytosol, nucleus
and cell-surface fractions [56]. It has been recently reported that the PDI activity of TG2
regulates the ADP/ATP transporter function in mitochondia [57].
In addition, it has recently been reported TG2 might also act as a kinase [58, 59] and that
this activity is inhibited by increasing Ca2+
levels and enhanced by TG2's phosphorilation
by protein kinase A and AMP [59].
INTRODUCTION
12
2.1.1 TG2 knockout mice
Although TG2-/-
knockout (KO) mice, carrying the homozygous deletion of the TG2 gene,
were viable and phenotypically normal [60, 61], a closer look revealed several
abnormalities. The lack of severe phenotypes could be explaind by other transglutaminases
in mammalian tissues compensating for the loss of TG2. However, the other mammalian
transglutaminases do not have GTPase, PDI or kinase activity, and, with the exception of
FXIIIa, they have not been found on the cell surface.
In general, TG2-/-
animals develop with age different inflamatory, as well as autoimmune
reactions, because of compromised anti-inflamatory reactions involving TG2 [62].
Induction of apoptosis in the thymus or liver of TG2-/-
mice showed defective clearance of
apoptotic cells, accompanied by an inflammatory reaction, indicating that TG2 is required
for efficient phagocytosis of apoptotic bodies [62]. Macrophages isolated from TG2-/-
mice
had imapired ability to engulf dying cells, potentiating the susceptibility to inflammatory
pathologies [63]. It has been reported that primary fibroblast of TG2-/-
mice showed
decreased adhesion ability [60] and impaired wound healing, as well as an alteration in
cytoskeleton dynamics of fibroblasts [12]. TG2 KO mice also show glucose intolerance
and hyperglycaemia because of reduced insulin secretion, a phenotype resembling the one
of maturity-onset diabetes of the young (MODY) [64]. Also, a defect in ATP synthesis was
identified in the hearts of TG2-/-
animals, as a result of impaired mitochondrial production
[65]. In TG2 KO mice tumor progression was increased and survival rate reduced
compared to wild-type mice [33].
2.2 TG2 substrates and interactors
Identification of proteins acting as TG2 substrates and interactors is of critical importance
for the establishment of the functional role of TG2 in various cells and tissues. In addition,
TG2 has been implicated in a numerous pathological states (will be described in more
detail in the next chapter), therefore identification of TG2 substrates and interactors would
give us a better understanding of the role TG2 has in these states, and it may lead to novel
drug targets and new diagnostic markers. Up to now, 142 TG2 substrates, and only 9
interaction partners, have been identified, according to TRANSDAB online database
(http://genomics.dote.hu/wiki/) [66]. Human Protein Reference Database
(http://www.hprd.org/) reports 80 TG2 protein interactors. STRING,
INTRODUCTION
13
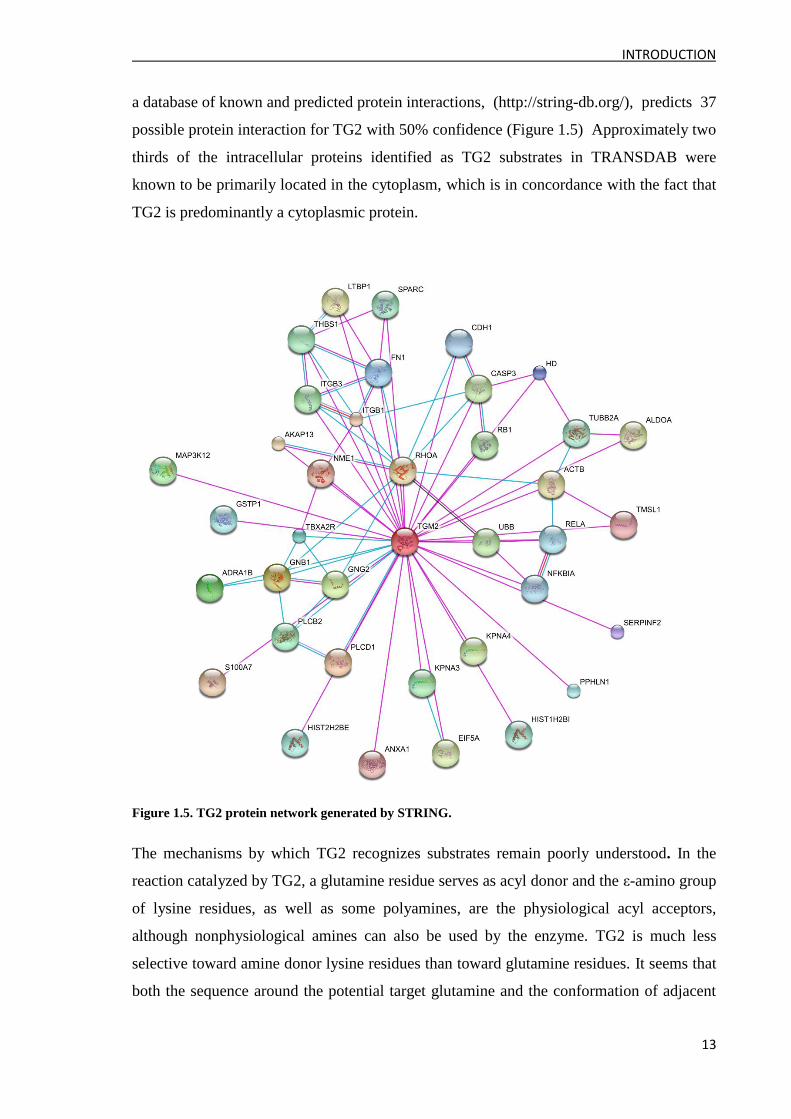
a database of known and predicted protein interactions, (http://string-db.org/), predicts 37
possible protein interaction for TG2 with 50% confidence (Figure 1.5) Approximately two
thirds of the intracellular proteins identified as TG2 substrates in TRANSDAB were
known to be primarily located in the cytoplasm, which is in concordance with the fact that
TG2 is predominantly a cytoplasmic protein.
Figure 1.5. TG2 protein network generated by STRING.
The mechanisms by which TG2 recognizes substrates remain poorly understood. In the
reaction catalyzed by TG2, a glutamine residue serves as acyl donor and the ε-amino group
of lysine residues, as well as some polyamines, are the physiological acyl acceptors,
although nonphysiological amines can also be used by the enzyme. TG2 is much less
selective toward amine donor lysine residues than toward glutamine residues. It seems that
both the sequence around the potential target glutamine and the conformation of adjacent
INTRODUCTION
14
regions of the protein could determine whether a glutamine residue can be reactive [67].
To act as TG2 substrates, glutamine residues must be exposed at the surface of the protein
where they can be accessible to covalent modification [68]. It has been proposed that
glutamine will not be recognized as a substrate if it is placed at the N- or C-terminal,
between two positively charged residues or between two proline residues [67], although it
has been shown that N-terminal glutamines can act as amine acceptor sites [69]. Not many
consensus sequences and structures have been identified around the reactive glutamine
residues. It has been reported that adjacent glutamine residues act as amine acceptors in a
consecutive reaction [69, 70], and that the spacing between the targeted glutamine and
neighbouring residues is a crucial factor in the specificity of TG2. Positively charged
residues flanking the glutamine residue discourage the TGase reaction, at least in unfolded
protein regions, while positively charged residues, at two or four residues from the
glutamine, promote the reaction [71]. Recent work also emphasized the role of chain
mobility or local unfolding in the enzymatic reaction [72].
A variety of different methods have been proposed for the identification of TG2 substrates.
Usually, they focus on the incorporation of radioactive, fluorescent or biotinilated amines
[73] in the substrate polypeptides, on the selection of random interacting peptides from
phage display libraries [74, 75] or functional proteomics strategies that combine gel
electrophoresis separation with MS-based analyses [76].
While a large body of data is available on TG2 substrate research, there are very few
identified TG2 interactors. TG2 is an enzyme with many different functions, TGase
activity being only one of them, therefore discovery of new TG2 interactors will give a
better insight in the enyzme's biological functions. Thus far, identified TG2 interactors
include, among others, proteins included in cell signaling (integrin α subunit [77], PLC-δ1
[48]), nuclear transport (importin-alpha3 [78]) and ECM interactions (fibronectin [79]).
It has beed suggested that TG2 inhibition, either via drug treatments or genetic approaches,
might be beneficial for the treatment of TG2 related pathologies [80, 81], but without
knowing the molecular details of TG2's contribution to these diseases, it is difficult to
conclude what would be the true benefits and consequences of TG2 inhibiton.
INTRODUCTION
15
3 Tissue transglutaminase in disease
TG2 has been implicated in a wide variety of pathological states: inflamatory and
autoimmune disorders (including celiac disease [82]), maturity-onset diabetes of the
young (MODY) [64], neurodegenerative disorders including Huntington‟s [83],
Alzheimer‟s [84], and Parkinson‟s diseases [85] and progressive supranuclear palsy [86],
and cancer [87].
3.1 Celiac disease
TG2-catalysed post-translational modifications of proteins may generate auto-antibodies,
as happens in autoimmune disorders such as celiac disease (CD) [82, 88]. Celiac disease or
gluten-sensitive enteropathy, is a chronic multifactorial disease caused by a permanent
intolerance to ingested wheat gluten or related proteins from rye and barely [89]. It affects
about 1% of the population, both children and adults. The conventional treatment is gluten-
free diet (GFD).
A 33-amino-acid (33-mer) peptide, resistant, both in vitro and in vivo, to digestion by
brush-border enzymes of the small intestinal mucosa of rats and humans, was identified as
a primary initiator of the inflammatory response to gluten in CD patients [90]. Chronic
inflammation in the small intestine develops as a result of an abnormal CD4+ T-cell-
initiated immune response to gluten (triggering antigen) and results in villous atrophy and
flattening of the mucosa [91, 92] (Figure 1.6.) CD is strongly associated with the genes
encoding for HLA-DQ2 and -DQ8 [92]. The intestinal T cells best recognize gluten
peptides when glutamines are converted to glutamic acid. Deamidation of gliadins by TG2
creates an epitope that binds efficiently to HLA receptors DQ2 and is recognized by gut-
derived T cells, thus initiating the inflammatory cascade that leads to the mucosal damage
[93, 94]. However, TG2 is itself an antigen (autoantigen) characteristic of the disease. CD
patients have increased levels of serum antibodies not only to gluten but also to TG2 [82].
It has been hypothesized that, apart from the deamidation of gliadin peptide, TG2 can
crosslink itself to gliadin, thus acting as hapten in the generation of autoantibodies, the
carrier being gliadin. Thus, the production of anti-TG2 IgA antibodies could be dependent
on the help provided by gliadin-specific T cells to normally silent B cells specific for TG2
INTRODUCTION
16
[94]. IgG and IgA anti-TG2 antibodies are found in the great majority of CD patients,
making them a powerful diagnostic tool, in particular the IgA class [95].
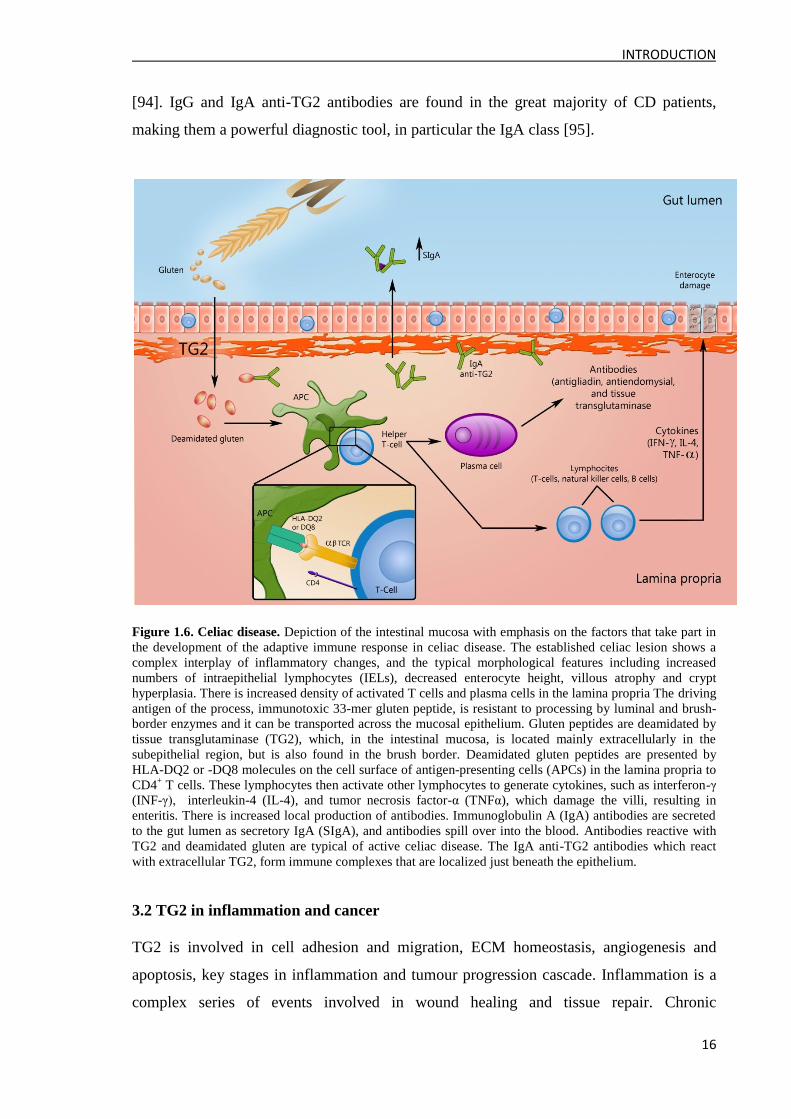
Figure 1.6. Celiac disease. Depiction of the intestinal mucosa with emphasis on the factors that take part in
the development of the adaptive immune response in celiac disease. The established celiac lesion shows a
complex interplay of inflammatory changes, and the typical morphological features including increased
numbers of intraepithelial lymphocytes (IELs), decreased enterocyte height, villous atrophy and crypt
hyperplasia. There is increased density of activated T cells and plasma cells in the lamina propria The driving
antigen of the process, immunotoxic 33-mer gluten peptide, is resistant to processing by luminal and brush-
border enzymes and it can be transported across the mucosal epithelium. Gluten peptides are deamidated by
tissue transglutaminase (TG2), which, in the intestinal mucosa, is located mainly extracellularly in the
subepithelial region, but is also found in the brush border. Deamidated gluten peptides are presented by
HLA-DQ2 or -DQ8 molecules on the cell surface of antigen-presenting cells (APCs) in the lamina propria to
CD4+ T cells. These lymphocytes then activate other lymphocytes to generate cytokines, such as interferon-γ
(INF-γ), interleukin-4 (IL-4), and tumor necrosis factor-α (TNFα), which damage the villi, resulting in
enteritis. There is increased local production of antibodies. Immunoglobulin A (IgA) antibodies are secreted
to the gut lumen as secretory IgA (SIgA), and antibodies spill over into the blood. Antibodies reactive with
TG2 and deamidated gluten are typical of active celiac disease. The IgA anti-TG2 antibodies which react
with extracellular TG2, form immune complexes that are localized just beneath the epithelium.
3.2 TG2 in inflammation and cancer
TG2 is involved in cell adhesion and migration, ECM homeostasis, angiogenesis and
apoptosis, key stages in inflammation and tumour progression cascade. Inflammation is a
complex series of events involved in wound healing and tissue repair. Chronic
INTRODUCTION
17
inflammation caused by ageing, infection or stress (physical, chemical or hormonal) can
lead to serious pathological conditions, such as degenerative fibrotic diseases and cancer.
Increased TG2 expression and transamidation activity is a common feature of many
inflammatory diseases and events. Involvement of TG2 during initial phase of wound
healing and inflammation has been indicated [96]. Cytokines and growth factors secreted
during the initial phase of cell injury regulate TG2 expression. Transforming growth factor
(TGF)-β1 induces TG2 expression in keratinocytes [97] and dermal fibroblasts [98] via the
TGF-β1 response element, which is located in the TGM2 gene promoter [99]. TG2
synthesis can also be increased by tumor necrosis factor (TNF)-α [100], nuclear factor
(NFκB) [101], interleukin (IL)-1 [102] and IL-6 [103].
Among the first cell types to accumulate at sites of inflammation or tissue injury are
macrophages. They contribute to the resolution of inflammation by generating TGF-β1 and
also synthesize large amounts of TG2. Studies in TG2-/-
mice showed an impaired ability
of macrophages to phagocytose apoptotic cells, which results in autoimmunity [104]. TG2
has an important role in promoting cell-ECM interactions, critical in regulating cell
growth, survival, migration and invasion signaling, and in the inflammatory environment,
it may play a physiological role in protecting cells from cell death and promoting their
motility.
Inflammatory responses play a critical role during tumor initiation, promotion, invasion
and metastasis. Nuclear, cytosolic, membranous, or extracellular TG2 may impact cell
growth, survival or invasion in completely different ways. Multiple studies have shown
elevated TG2 expression in many types of cancer cells, including pancreatic carcinoma
[105], breast carcinoma [106], malignant melanoma [107] and glioblastoma [108]. Down-
regulated TG2 expression in primary tumors and upregulated in secondary metastatic
tumors, or those resistant to chemotherapy and its expression has been implicated in
disease progression [109, 110]. Negative regulators of cell cycle are inactivated during
cancer development and the concomitant decrease in TG2 expression in the developed
tumours is possibly a manifestation of such a feedback mechanism [46]. Aberrant
expression of TG2 is propossed to confer resistance to chemotherapeutic drugs and
promote invasive potential of cells [111, 112]. Recent reports have shown that epigenetic
silencing of TG2 expression may explain relative sensitivity of primary tumors to
chemotherapeutic drugs [113], while increased TG2 expression in cancer cells has been
linked to an increased drug resistance, metastasis and poor patient survival [109, 114].

INTRODUCTION
18
However, a recent study has demonstrated a catalytically null mutant of TG2 was also able
to support doxorubicin resistance in glioma cells indicating that transglutaminase activity
is not necessary for the resistance phenotype [115].
An important trait of the highly malignant tumor cell is its ability to survive in hostile host
environments and to dock with and adhere to tissues where they are able to metastasize
[116]. This may explain why the expression of TG2 is upregulated in secondary, rather
than in primary tumors. TG2 expression has been shown to correlate positively with the
propensity of human tumors to metastasize [117].
TG2 has been described as a supressor of tumor growth in numerous reports. For example,
transfection of TG2 into a highly malignant hamster fibrosarcoma cell line led to a
significant reduction of tumor incidence [118] and exogenous TG2 inhibited angiogenesis
and tumor growth, and tumor growth in TG2-/-
mice was enhanced [33]. It is not well
understood how TG2 suppresses tumor growth. Recently, the C-terminus of TG2 was
shown to interact with the N-terminus of GPR56, a member of a newly described family of
G protein-coupled receptors [119]. GPR56 was shown to play an important role in
suppressing tumor growth and metastasis [119], which might be related to its role in cell
adhesion [120]. Therefore, it is possible to speculate that the extracellular TG2–GPR56
interaction suppresses tumor growth and metastasis [120].
As discussed in the previous chapter, TG2 is involved in the stabilization of ECM. An
increased presence of TG2 in ECM has been demonstrated under pathological conditions,
both in vitro and in vivo, giving rise to increased deposition and accumulation of ECM
proteins [121]. A stable ECM is intrinsically anti-angiogenic and inhibitory towards
malignant cell proliferation and migration because it is more resistant to protease digestion
and mechanical disruption by the expanding tumour mass, making it an effective barrier to
growth and metastasis of tumours by restricting infiltration by tumour cells and growth of
new blood vessels [32]. Decreased TG2 expression in tumors might serve to destabilise the
matrix facilitating both tumour spread and angiogenesis [33].
Angiogenesis is a prerequisite for neoplastic cells to grow into primary tumours and
metastasize, since solid tumours cannot expand in size beyond 1–2 mm in diameter in the
absence of new independent blood supply [122]. This also gives them new ways to escape
into circulation. The angiogenic process is regulated by growth factors, proteases, the
expression of cell surface receptors and the ECM. As stated earlier, TG2 can promote [31]
INTRODUCTION
19
or inhibit [32, 33] angiogenesis. Its role in this process is still poorly understood. TG2-/-
mice do not present vascular abnormalities [61].
As discussed in the previous chapter, TG2 can act both as a pro- and anti-apoptotic factor.
It is believed that TG2 may play a role downstream of the apoptotic cascade, as part of a
„fail safe‟ mechanism separate from the cell-death commitment machinery that ensures
protection against excessive inflammation mediated by necrosis following loss of Ca2+
homeostasis [19]. Apoptosis resistant cells can exhibit increased levels of TG2 expression
and activity, some even up to 40–60 fold both in vitro and in vivo [123]. Several anticancer
agents, such as adriamycin, actinomycin D and mithrimycin, have been shown to serve as
amine substrates for TG2 [124], suggesting that TG2 might protect the cells against
apoptosis by clearing away drugs via their covalent incorporation. A recent study reported
that TG2 plays an active role in the response of neuroblastoma cells to etoposide-induced
DNA-damage cell response by suppressing p53 activation and p53-induced apoptotic cell
death [125].
3.3 Neurodegenerative diseases
At least four transglutaminases are expressed in the brain; TG1, TG2, TG3 [126] and TG6
[8], and TG2 has been implicated in numerous and diverse processes in the central and
peripheral nervous systems. The involvement of transglutaminases in the pathophysiology
of a neurodegenerative disease, namely Alzheimer's disease (AD), was first suggested in
1982 by Dennis Selkoe et al. [84]. In their investigations on neurofibrillary tangles they
demonstrated the presence of brain transglutaminase (TG2) in the postmortem human brain
of normal and AD individuals and showed TG2 can covalently cross-link neurofilament
proteins into insoluble polymers in vitro. Since then, increased levels and activity of TG2
have been observed in many neurodegenerative diseases in afflicted brain regions
compared to non-afflicted brain regions [127]. Furthermore, proteins thought to be
pathogenic in these diseases are often TG2 substrates, while increases in intracellular Ca2+
levels, the main transglutaminase activator, are recognized to be an important, if not
essential, factor in the etiology of neurological diseases. TG2 is associated with the ECM,
cell membranes and cytosol of neurons, and TG2 activity has been identified in
synaptosomes [128], mitochondria [129], and nucleus [130]. In a variety of examined
neurodegenerative diseases, TG2 activity is upregulated in selectively vulnerable brain
INTRODUCTION
20
regions, TG2 proteins are associated with inclusion bodies characteristic of the diseases,
and prominent proteins in the inclusion bodies, like huntingtin, amyloid β, tau and α-
synuclein, are good substates, modified by TG2 enzyme.
3.3.1 Alzheimer's disease
Alzheimer‟s disease (AD) is the most common age-related neurodegenerative disorder,
associated with the selective damage of brain regions and neural circuits, including
neurons in the neocortex, hippocampus, and amygdala. Dysfunction and loss of neurons in
these neural circuits results in impaired memory, thinking and behavior. Many factors
likely involved in the pathogenesis of AD, like traumatic brain injury [131], aging [132],
inflammation [133], ischemic damage [134] and brain stress [135] overly induce TG2
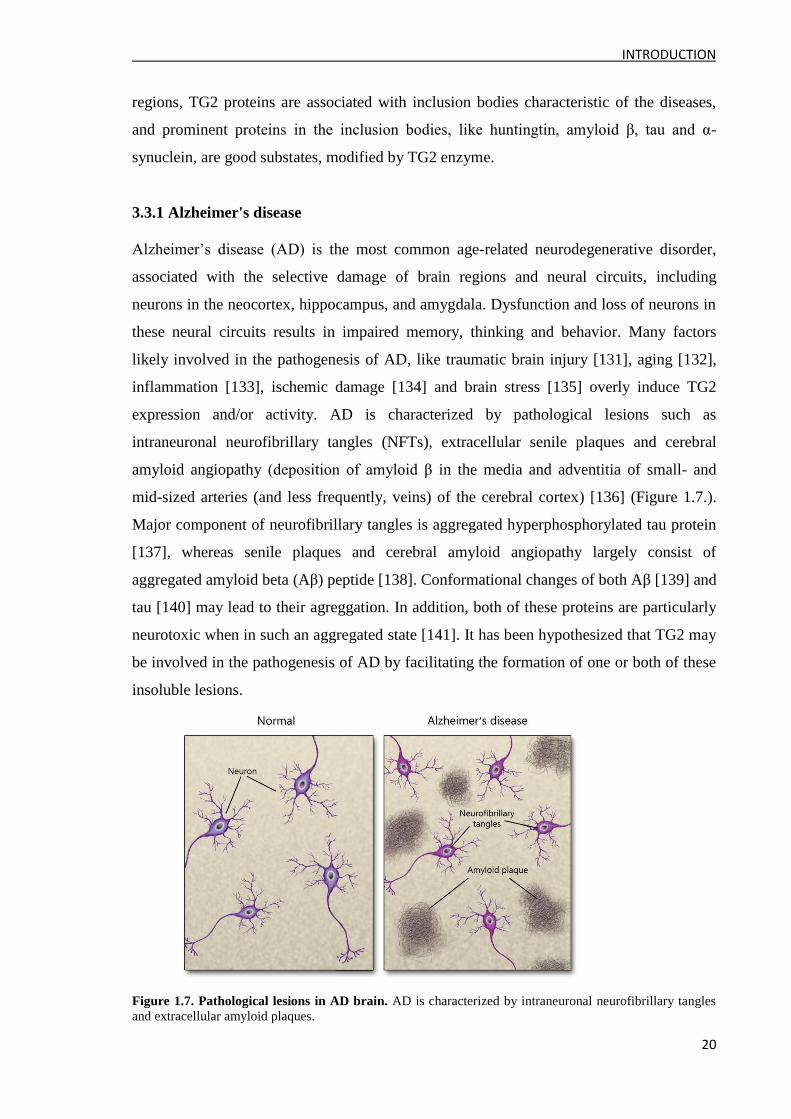
expression and/or activity. AD is characterized by pathological lesions such as
intraneuronal neurofibrillary tangles (NFTs), extracellular senile plaques and cerebral
amyloid angiopathy (deposition of amyloid β in the media and adventitia of small- and
mid-sized arteries (and less frequently, veins) of the cerebral cortex) [136] (Figure 1.7.).
Major component of neurofibrillary tangles is aggregated hyperphosphorylated tau protein
[137], whereas senile plaques and cerebral amyloid angiopathy largely consist of
aggregated amyloid beta (Aβ) peptide [138]. Conformational changes of both Aβ [139] and
tau [140] may lead to their agreggation. In addition, both of these proteins are particularly
neurotoxic when in such an aggregated state [141]. It has been hypothesized that TG2 may
be involved in the pathogenesis of AD by facilitating the formation of one or both of these
insoluble lesions.
Figure 1.7. Pathological lesions in AD brain. AD is characterized by intraneuronal neurofibrillary tangles
and extracellular amyloid plaques.
INTRODUCTION
21
Senile plaques contain amyloid fibrils composed of the Aβ, a 39-42 amino acid peptide
which is proteolytically derived from a larger transmembrane glycoprotein, the amyloid
precursor protein (APP), with longer forms of Aβ (e.g., Aβ42) aggregating faster than
shorter ones [142]. It has been shown that TG2 can cross-link Aβ1-28 [143], Aβ1-42 [144]
and APP [145]. In vitro models of fibrillogenesis by self-aggregation [146] require Aβ
concentrations significantly higher than physiologic concentrations [147]. Recent report
demonstated that TG2 induces monomeric Aβ to rapidly form protease-resistant oligomers
and aggregates in a time- and concentration-dependent manner similar to self-assembly,
and lowers the concentration for Aβ oligomerization, so it can occur at physiological Aβ
levels [148].
Tau protein is an excellent TG2 substrate both in vitro and in vivo [149]. A study on human
specimens indicated TG2 may be involved in cross-linking of tau pathology seen in AD
brains [150]. TG2 activity was 3-fold higher in the prefrontal cortex of AD samples, where
neurofibrillary pathology is usually abundant, compared to controls. Interestingly, there
were no differences in the cerebellum, which is usually spared in AD. More recent finding
has shown a 5-fold increase in TG2 in AD brains with co-localization with neurofibrillary
tangles, and, for the first time it has been demonstrated that these tau-containing NFTs are
the site of γ-glutamyl-ε-lysine crosslinks in these same locations in brains from AD
patients [151]. Tau protein cross-linking catalyzed by TG2 has been recently confirmed in
P301L tau transgenic mice that develop neurofibrillary tangles and have cross-linked tau
protein [152].
It has been reported that TG2 undergoes alternative splicing in AD brain due to intron-
exon swapping of TG2 mRNA [151], resulting in a short (S) and long (L) isoforms, while
the control samples yielded only the L form [153]. The truncation of the TG2 C-terminal
region through alternative splicing results in the loss of Barrel 2 domain partly required for
GTP binding (Figure 1.1.), presumably making the enzyme much more active in that the
inhibitory effect of GTP on TGase activity is abolished. However, a recent report
demonstrated that TG2-S exibits only a weak TGase activity, but it has the ability to form
self-aggregates when expressed in cells, suggesting that although full-length TG2 typically
provides a protective effect against cellular insults and apoptotic challenges, because of its
transamidation activity, the TG2-S isoform promotes apoptosis, apparently through its
aberrant aggregation independent of its TGase activity [154].
INTRODUCTION
22
3.3.2 Huntington's disease
Huntington's disease (HD) is an autosomal dominant, progressive, fatal, neurodegenerative
disorder caused by a mutation in the huntingtin gene, an expanded CAG repeat, which
encodes an abnormally long polyglutamine (polyQ) repeat in the N-terminus of huntingtin
protein (Htt). When the length of the polyQ domain exceeds 35-40 glutamines, HD occurs.
HD is characterized by involuntary movements (chorea), subcortical dementia and
emotional disturbance. Despite the widespread expression of huntingtin, the brains of HD
patients show selective neuronal loss in the striatum and the deep layers of the cerebral
cortex. Aggregation of mutated Htt, transcriptional dysregulation, altered energy
metabolism, excitotoxicity, impaired axonal transport and altered synaptic transmission
culminate in neuronal dysfunction and death. The age of onset is normaly between 30 and
50 years (for polyQ expansions of 40-45 repeats), although there is a HD form (with polyQ
expansions of 70 repeats or more) that affects children and teenagers.
Howard Green was the first to hypothesize that, because of the role glutamine plays in the
reaction catalyzed by TG2, increasing the number of glutamines beyond a threshold may
result in a protein becoming a TG2 substrate and contribute to aggregate formation in HD
brain [155]. This hypothesis was tested in vitro and confirmed that polyQ peptides are
excellent TG2 substrates which, in the presence of TG2, form insoluble aggregates with
the proteins of brain extracts and that these aggregates contain (γ-glutamyl)ε- lysine cross-
links [156]. It was soon demonstrated that Htt proteins with long polyamine expansions,
when incubated with TG2, form crosslinked polymers more rapidly than huntingtin protein
with short expansions [157]. TG2 levels are increased in HD brain [158], while recent
reports also show an increased TG2 activity [159]. However, there are reports
demonstrating TG2 is not essential for the formation of huntingtin aggregates in HD brain.
Experiments on human neuroblastoma SH-SY5Y cell line demonstated that TG2 does not
modify Htt, it is totaly excluded from Htt inclusions and mutant Htt aggregates are formed
in the absence of TG2 [160]. Research on TG2-/-
HD mice also suggested that the
formation of inclusions might not depend on TG2 activity. Moreover, TG2-/-
HD mice
showed a significant delay in the onset of motor dysfunction and death. While the Htt
aggregate number was similarly increased in the striatum of TG2-/-
HD and control
animals, only TG2-/-
HD mice showed a delayed disease progression [161]. Therefore, it is
currently unclear whether enzymatically active TG2 plays a role in Htt aggregate
formation, and if it does, what is its function in the HD pathogenesis.
INTRODUCTION
23
3.3.3 Parkinson’s disease
After Alzheimer's disease, Parkinson's disease (PD) is the most common
neurodegenerative disorder. It is caused by a selective loss of dopaminergic neurons in the
substantia nigra pars compacta (SNc), the part of the brain responsible for controlling
movement. Pathological charachteristic of PD are proteinaceous cytoplasmic inclusions
known as Lewy bodies [162], also found in some variants of AD [163]. PD is characterized
by tremor, bradykinesia, rigidity and postural instability. Major constituent of Lewy bodies
is α-synuclein [164], a small 140-amino acid presynaptic protein, nativly present in
unfolded conformation [165], which makes it prone to self-aggregation and causing the
aggregation of other proteins. Expression of human α-synuclein in mice results in
progressive accumulation of α-synuclein inclusions and a concomitant loss of dopamine-
containing neurons in the basal ganglia [166].
As in AD and HD, increased TG2 levels have been found in PD patients [167]. It has been
shown that TG2 catalyzes the formation of α-synuclein aggregates in vitro as well as in
cellular models and analysis of post-mortem brain tissues from PD and Lewy bodies in
dementia patients has confirmed the colocalization of TG2-catalyzed cross-linked α-
synuclein monomers and higher molecular aggregates in Lewy bodies within dopaminergic
neurons [85]. However, recent in vitro studies with full-length α-synuclein have shown that
TG2 catalyzes intramolecular cross-linking of monomeric α-synuclein and inhibits, rather
than promotes, the assembly of structured oligomers required for disruption of membranes
and for progression into fibrils in vitro [168]. Another recent report suggested that TG2
may protect against α-synuclein toxicity by increasing its solubility and inhibiting its
ability to form toxic aggregates (i.e. protofibrils and fibrils) [169]. TG2 peforms
intramolecular cross-linking of α-synuclein without disrupting its normal function(s).
Although intramolecularly TG2 cross-linked α-synuclein monomers remain capable of
forming high molecular weight aggregates, these aggregates appear to be off-pathway or
dead-end products. Therefore, the increased levels of TG2 measured in the cerebrospinal
fluid [170], as well as the presence of cross-linked α-synuclein in post-mortem brain tissue
of PD patients [171] and during normal aging [172], may reflect the activation of natural
defense mechanisms to prevent amyloid formation or promote clearance of α-synuclein
aggregates.
INTRODUCTION
24
3.4 TG2 inhibitors
Involment of TG2 in various pathological states prompted the development of inhibitors,
capable of blocking TG2 enzymatic activity. Use of these inhibitor in biological systems
gave promissing results in a number of different disease models, proposing a potential use
for therapeutic treatment of human diseases. Upon their mechanism of inhibition, TG2
inhibitors can be devided into 3 classes: (1) competitive amine inhibitors, (2) reversible
inhibitors, and (3) irreversible inhibitors [80].
Competitive amine inhibitors. These are probably the most widely used TG2
inhibitors because of their commercial availability, chemical stability, and relative
non-toxicity in living systems [173]. Some of the most commonly used are
putrescine, monodansylcadaverine and 5-(biotinamido) pentylamine. Competitive
amine inhibitors do not completely abolish TG2 activity, but rather inhibit it by
competing with natural amine substrates, such as protein-bound lysine residues, in
the transamidation reaction. Therefore, transamidation continues to occur, however,
favoured isopeptide crosslink is the one formed with between the natural glutamine
substrate and the competitive amine inhibitor rather than between the natural
glutamine substrate and natural amine substrate. Cystamine has a dual inhibitory
effect. Apart from being a competitive amine inhibitor of TG2, it has been shown to
inactivate TG2 in a time-dependent manner suggesting an irreversible inhibition
mechanism [174].
Reversible inhibitors. Reversible TG2 inhibitors prevent TG2 activity by blocking
substrate access to the active site without covalently modifying the enzyme. Some
examples of reversible inhibitors are TG2 cofactors, such as GTP and GDP [175];
GTP analogues, such as GTPγS and GMP-PCP [175]; and divalent metal ion Zn2+
which competes with Ca2+
for metal-binding sites in TG2 [174, 176].
Irreversible inhibitors. Irreversible TG2 inhibitors (suicide inhibitors) prevent
enzyme activity by covalently modifying the enzyme and preventing substrate
binding. Most of them are designed to target the active site cysteine using chemical
functional groups that are reactive in the presence of a nucleophilic atom, but form
relatively stable chemical bonds after reacting. One of the simplest irreversible TG2
inhibitors is iodoacetamide [177], and one of the most studied are 3-halo-4,5-
dihydroisoxazoles, which show good bioavailability and low toxicity in mice [178],
INTRODUCTION
25
but have very low solubility [80]. A set of peptidomimetic irreversible inhibitors
was designed using a gluten peptide sequence as the inhibitor backbone [179].
Potential benefits of TG2 inhibiton have been shown in CD. Use of competitive amine
(irreversible) inhibitor cytsamine showed that treatment of celiac biopsies with TG2
inhibitors can reduce the proliferative response of gluten-reactive T-cells [180]. In
addition, treatment of celiac patient biopsies with irreversible inhibitior of endogenous
TG2 can prevent gluten peptide deamidation and, therefore, reduce T-cell activation [181].
Good results were obtained with the use of TG2 inhibitors in multiple biological models of
neurodegenerative diseases. Treatment of cell lines expressing polyQ [182] or α-synuclein
[85] proteins with the TG2 inhibitors, cystamine and CMT, respectively, lead to a decrease
in protein aggregate formation. Cystamine also had beneficial therapeutic effect in vivo in
mouse models of HD where it showed improved motor function, less severe weight loss,
and increased survival compared to non-treated controls [183]. However, despite the
activity of cystamine in mouse models of HD, it is not clear how much of the therapeutic
effect is due to TG2 enzymatic inhibition. Recent study on TG2-/-
demonstrated that HD
TG2-/-
mice treated with cystamine, showed improved motor function and increased
lifespan statistically not that different from the improvement seen in HD TG2+/+
mice
treated with cystamine.
Competitive amine inhibitors have been used in assays with cultured cancer cells.
Treatment of these cells with monodansylcadaverine reversed anti-apoptotic activity of
TG2 [111], while in another study apoptosis was reversed using 5-
(biotinamido)pentylamine [107].
Although application of TG2 inhibitors have shown therapeutic potential in some animal
models of human diseases, without knowing the molecular details of implication in these
diseases, it is difficult to conclude whether the improvement in symptoms seen in these
models is due to TG2 inhibition alone or off-target inhibition of other disease relevant
proteins, or both. The precise biological functions of TG2 are still not yet clear. TG2
should be studied in its natural environment, in cell cultures, and especially in vivo,
together with gathering more in vivo data concerning the enzymatic activity status of the
different conformational populations of TG2. Trapping TG2 in one of its conformations,
such as that observed in the inhibitor bound crystal structure (Figure 1.2.) could cause a a
wide variety of potential side effects. Therefore, correlating TG2 conformation to
INTRODUCTION
26
biological function, as well as designing inhibitors that allow for conformational
flexibility, may provide successfull means for pharmacological therapy of TG2-related
diseases.
INTRODUCTION
27
4 Gene expression technologies
Gene expression technologies provide a direct physical association between phenotype (the
protein under analysis) and genotype (the gene encoding this protein). Protein of interest
can be immediately characterized by simple DNA sequencing, while the availability of the
coding sequences allows it to be easily manipulated with common molecular biology and
genetic engineering techniques.
Despite the wide variety of expression technologies, the source of nucleic acid sequences is
represented by cDNA or genomic DNA expression libraries.
4.1 Expression libraries
Expression libraries are very similar to more traditional libraries (e.g. genomic libraies),
but instead of screening for the DNA of interest, the system (prokaryotic or eukaryotic)
transcribes and translates the genes into proteins, which can then be screened by
antibodies, proteins, sera, etc. This technology is useful in the study of expression profiles
of biological systems. There are two main goals in proteomic research with expression
libraries (i) possibility to assay, at the same time, thousands of proteins expressed by the
library; (ii) obtaining a proper molecular sensing device, to detect any characteristic of
interest, e.g. an interaction, at high sensitivity, when either the proteins of the library or the
interactors in a biological sample are present at very low levels.
Expression libraries have been developed in a number of formats. They can be used for the
study of complex mixtures of proteins and for high-throughput screening. Bacterial
systems are preferred, although eukaryotic systems, as the baculovirus system [184] and
yeast [185] are also used. Gram-negative bacterium E.coli remains one of the most
attractive hosts because of its ability to grow rapidly and at high density on inexpensive
substrates, its well-characterized genetics and the availability of an increasingly large
number of cloning vectors and mutant host strains [186]. Although bacterial systems are
easy to manage, expression of eukaryotic proteins can be problematic, due to aggregation,
formation of insoluble inclusion bodies and degradation of the expression product. Another
disadvantage of the bacterial systems is that they lack the post-translational modifications
typical of eukaryotes [187]. While eukaryotic systems could be preferred for these reasons
INTRODUCTION
28
they also have a number of drawbacks, mainly lower yields of heterologous protein, high
demands on sterility or time-consuming cloning procedures.
cDNA libraries are the most common source of DNA for screening approaches. The
complete cDNA library of an organism contains at least one cDNA clone representing each
mRNA in the cell and gives the total of the proteins the organism can possibly express.
Since their development [188], cDNA libraries have been made from nearly every human
tissue, as well as from other organisms, either animals, plants or yeasts [188-192]. cDNA
libraries lack the non-coding and regulatory elements found in genomic DNA. They are
prepared from total single stranded mRNA (that represents the expressed genes) converted
into a double-stranded DNA using the enzyme reverse transcriptase. The cDNA fragments
can be inserted into an appropriate vector for maintenance and cloning. The population of
recombinant vectors (the library) will represent the entire set of expressed genes from the
source from which the mRNA was isolated.
Concerning microorganisms, due to the lower complexity of DNA and to the absence of
introns in mRNA, the source of nucleic acid sequences is generally genomic DNA,
physically or enzymatically fragmented into the desired size [186].
cDNA libraries can be screened by PCR, DNA hybridization [193], two-hybrid systems
[194], enzymatic activity [195], high-throughput structure determination [196] and by
recognition with antibodies [197], depending on the application.
Fragmented cDNA libraries are preferred in some applications, such as display
technologies, that will be discussed later in this chapter. Random fragmentation or
bioinformatics-driven analysis aimed to predict the likely stable globular domains are used
to generate DNA fragment libraries to identify stable, functionally or structurally tractable
fragments of polypeptides. In this case, fragmentation is performed by means of physical
methods (sonication, nebulization, hydrodynamic shearing), enzymatic methods (DNaseI,
restriction endonucleases, S1 nuclease) and PCR-based methods [198]. The advantages of
using random fragmented cDNA libraries are: i) the enhanced expression and exposition
(in display systems) of polypeptides; ii) the increased diversity of peptides produced
(alternative ORFs can be generated); iii) the chance to identify restricted binding sites (in
protein-protein interaction screenings) or epitopes (in antigen-antibody screenings).
INTRODUCTION
29
4.2. Display systems
The principle underlying display technologies is the physical association between
phenotype of polypeptides under analysis, and the genotype. This means the identification
of displayed protein leads to the isolation of the sequence encoding for that protein. The
sequence can than be immediately characterized and modified.
By means of recombinant DNA technology, it is possible to create a ''display library'', a
collection of billions of different particles displaying different polypeptides. Through
selection strategies, these complex libraries can be enriched for clones with a desired
reactivity, allowing the isolation of specific proteins, and hence the coresponding genes,
from a background of billions of other polypeptides.
Depending on the display platform, four main grups can be identified: i) two-hybrid
systems; ii) in vitro display; iii) cell surface display; iv) virus/phage display.
Two-hybrid systems include Yeast Two-Hybrid (YTH) [199] and Bacterial
Two-Hybrid (BTH) systems. In YTH Each of the two interacting polypeptides
(e.g. antigen-antibody, hormone-receptor, enzyme-substrate) is fused with one of
the two functional subunits of a transcription factor, while BTH can also use other
proteins like RNA-polymerase [200] and inteins [201]. Interaction between the two
polypeptides reconstitutes the the transcription factor, enabling the transcription of
a reporter gene, normally represented by the resistance to an antibiotic or a
chromogenic enzyme.
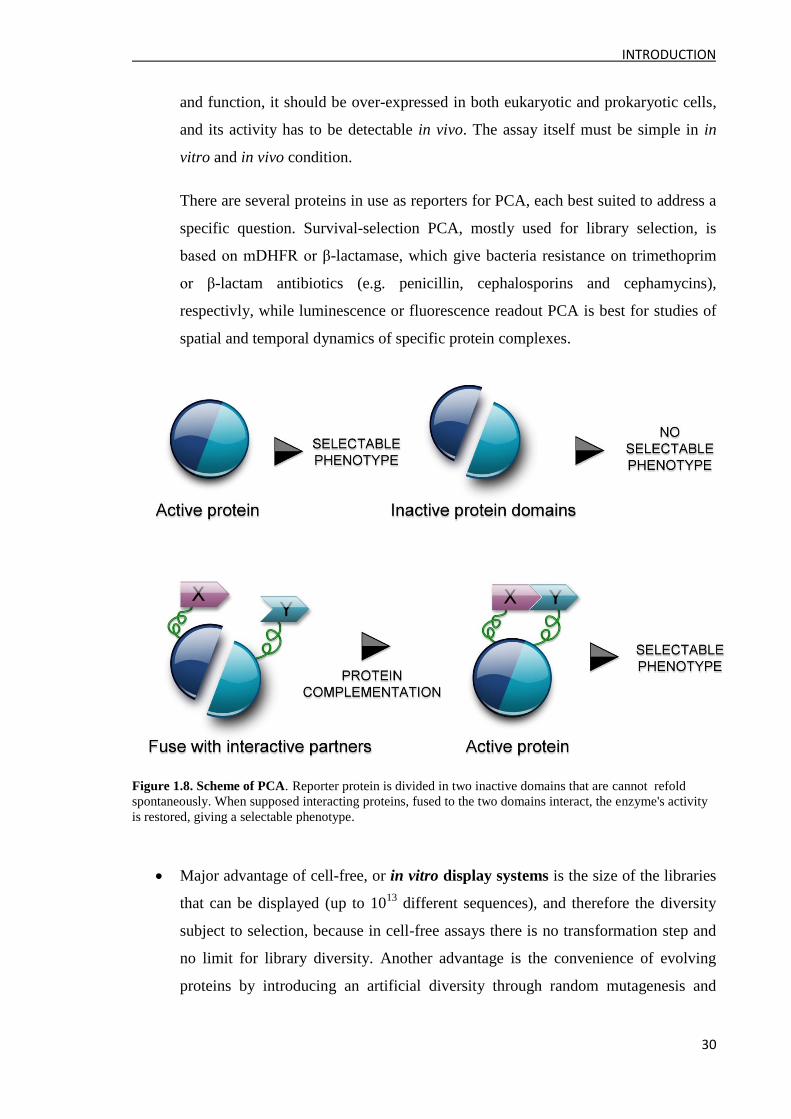
When enzymes are used for functional reconstitution we refer to this systems as
Protein-fragment Complementation Assay (PCA). Here we have functional
reconstitution of the reporter protein, an enzyme, usually murine dihydrofolate
reductase (mDHFR) [202], adenilate cyclase (AC) [203] or β-lactamase are used.
Reporter protein is rationally dissected into two fragments [204, 205]. The
refolding of the reporter protein from its fragments is catalyzed by the binding of
the supposed interacting proteins, and is detected as reconstitution of enzyme
activity (Figure 1.8.). A fundamental feature of protein fragments is that they
cannot fold spontaneously because it would lead to a false-positive signal. For this
reason not all enzymes can be used in PCA. A good reporter enzyme should be
relatively small and monomeric protein with available information on its structure
INTRODUCTION
30
and function, it should be over-expressed in both eukaryotic and prokaryotic cells,
and its activity has to be detectable in vivo. The assay itself must be simple in in
vitro and in vivo condition.
There are several proteins in use as reporters for PCA, each best suited to address a
specific question. Survival-selection PCA, mostly used for library selection, is
based on mDHFR or β-lactamase, which give bacteria resistance on trimethoprim
or β-lactam antibiotics (e.g. penicillin, cephalosporins and cephamycins),
respectivly, while luminescence or fluorescence readout PCA is best for studies of
spatial and temporal dynamics of specific protein complexes.
Figure 1.8. Scheme of PCA. Reporter protein is divided in two inactive domains that are cannot refold
spontaneously. When supposed interacting proteins, fused to the two domains interact, the enzyme's activity
is restored, giving a selectable phenotype.
Major advantage of cell-free, or in vitro display systems is the size of the libraries
that can be displayed (up to 1013
different sequences), and therefore the diversity
subject to selection, because in cell-free assays there is no transformation step and
no limit for library diversity. Another advantage is the convenience of evolving
proteins by introducing an artificial diversity through random mutagenesis and
INTRODUCTION
31
selection [206]. In vitro display systems can be divided in three major categories:
ribosome display [207], mRNA display [208] and DNA display [209].
In cell surface display cells are transfected with the DNA library and library
encoded polypeptides are expresses as fusions with extracellular receptors and
exposed on the surface of bacterial [210], yeast [211] or mammalian cells [212].
Virus/phage display sytems use eukaryotic viruses and bacteriophages. Display
systems based on eukaryotic viruses allow exposition of properly folded and active
eukaryotic proteins. Retrovirus [213], adeno-associated virus [214] and baculovirus
[215] have been developed as display platforms. However, display on the surface of
filamentous phages is the most commonly used technology. Phage display will be
described in detail in the next paragraph.
4.3 Phage Display
The concept of displaying polypeptides on the surface of filamentous M13 bacteriophage
(phage) was first introduced by Smith and colleagues in 1985 [216]. Smith demonstrated
that phages displaying an antigen could be affinity purified against an immobilized specific
antibody, allowing more than a 1,000-fold enrichment of fusion phage from a background
of phage particles displaying no antigen.
The general concept is that a phage encoding a specific fusion protein on its surface, could
be isolated for its binding property to a given protein from a collection of billions of
phages. This technique was originally developed to map epitope-binding sites of antibodies
by panning random peptide-phage libraries on immobilized immunoglobulins. Since then,
phage display has been used as a powerful method to establish polypeptide binding with a
diverse range of applications.
Filamentous phage and phagemid based on M13, f1 or fd are the most commonly used for
phage display, although T7 [217] and lambda [218] are also used. Filamentous
bacteriophages are a group of related viruses that infect only gram-negative bacteria. In
contrast to the lytic bacteriophage species (e.g. T4), filamentous phages replicate and
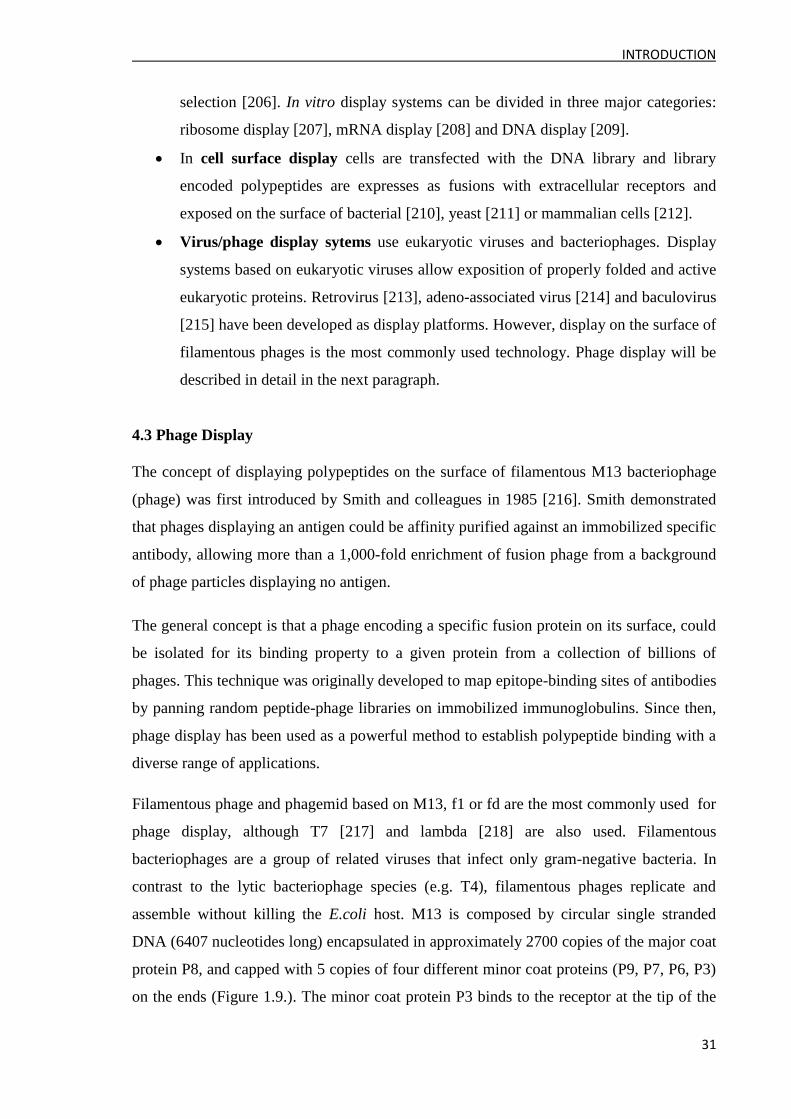
assemble without killing the E.coli host. M13 is composed by circular single stranded
DNA (6407 nucleotides long) encapsulated in approximately 2700 copies of the major coat
protein P8, and capped with 5 copies of four different minor coat proteins (P9, P7, P6, P3)
on the ends (Figure 1.9.). The minor coat protein P3 binds to the receptor at the tip of the
INTRODUCTION
32
F-pilus of the host E.coli [219]. In the phage display system, the most important proteins
are P3 and P8, although P6 is also used. P8 is a major coat protein, found in 2700 copies
per phage. It is a small protein (50 amino acids) which is not very tolerant to large
insertions. P6 is a minor coat protein found at the same end of the phage as P3. It is not
known to be involved in infection and has a characteristic that the C-terminus rather than
the N-terminus is exposed.
Figure 1.9. M13 bacteriophage structure. Coat proteins are indicated.
To create the diversity at the DNA level, i.e. to make a phage display library, DNA
fragments to be analyzed are usually cloned upstream the gene encoding the protein 3, or
the protein 8, of the phage: in the first case, there are 3 to 5 recombinant proteins at one
end of the phage; in the second, all 2700 copies of the major coat protein are recombinant.
Excluding the display of short peptides, the protein 3 based system is generally preferred.
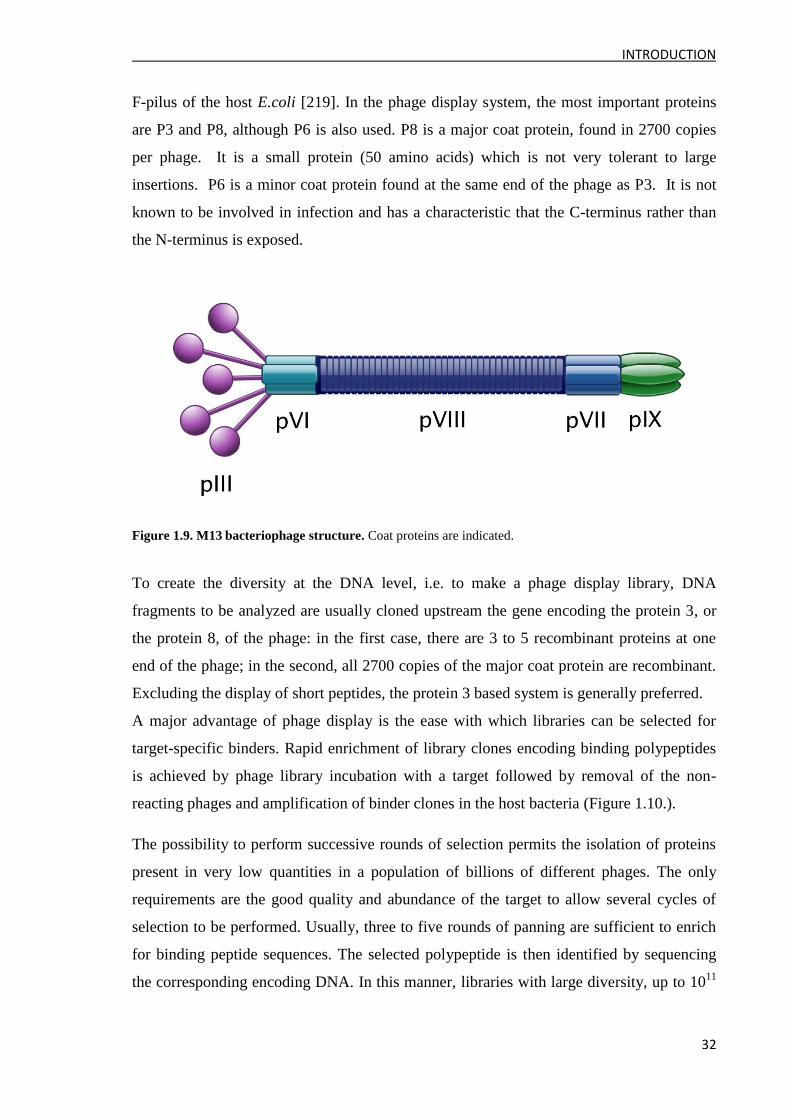
A major advantage of phage display is the ease with which libraries can be selected for
target-specific binders. Rapid enrichment of library clones encoding binding polypeptides
is achieved by phage library incubation with a target followed by removal of the non-
reacting phages and amplification of binder clones in the host bacteria (Figure 1.10.).
The possibility to perform successive rounds of selection permits the isolation of proteins
present in very low quantities in a population of billions of different phages. The only
requirements are the good quality and abundance of the target to allow several cycles of
selection to be performed. Usually, three to five rounds of panning are sufficient to enrich
for binding peptide sequences. The selected polypeptide is then identified by sequencing
the corresponding encoding DNA. In this manner, libraries with large diversity, up to 1011
INTRODUCTION
33
unique sequences [220], can be created, amplified, stored, and screened against a target of
interest.
Figure 1.10. Phage display selection cycle. The isolation of a specific phage for its binding to a ligand leads
to the isolation of the corresponding gene, while the unreactive clones are eliminated from the selection. Up
to five rounds of selection can be performed, resulting in enrichment for phages that are represented in very
low numbers in the original library.
Phagemid vectors have been developed as it is extremely difficult to work with phage
genomes. There are two basic types of polypeptide display in phage libraries: polyvalent
and monovalent. In polyvalent phage display, each copy of the capside protein (such as P3
or P8) displays the polypeptide. These libraries are based on vectors derived directly from
the phage genome and encode all the proteins needed for phage replication and assembly.
Polyvalent display is limited to small peptides as larger insets interfere with the function of
the coat proteins, making the phage poorly infective. Monovalent phage display is the
choice for cDNA libraries which encode proteins or protein domains too large to allow P3
to retain its function. In monovalent display, coat protein fusion is expressed from a
phagemid, while a helper phage supplies a large excess of the wild-type coat protein [221,
222]. The purpose of the helper phage (a phage with a packaging signal disabled or weaker
than that of phagemid vector) is to provide all the proteins required for phagemid
replication, ssDNA production and packaging. This makes the phages functional, because
the recombinant protein forms only a small amount of the total coat protein (>99% of
phage virions display either one or no copies of the fusion proteins), and for this reason
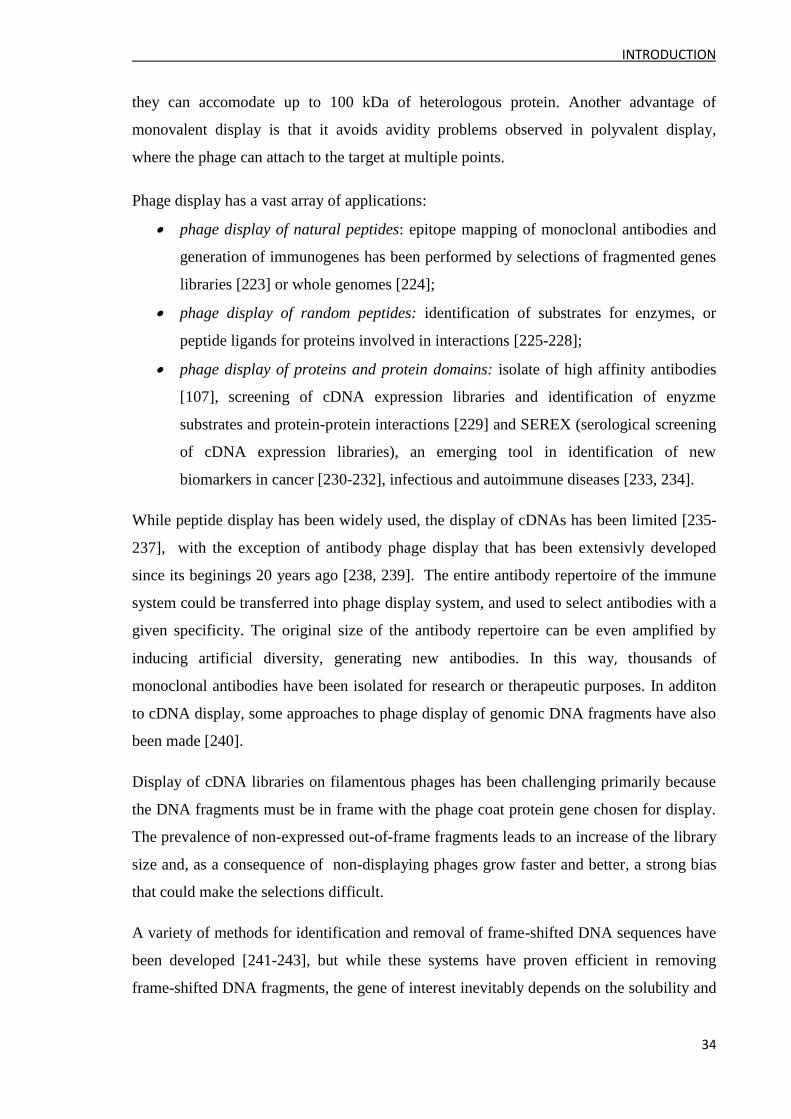
INTRODUCTION
34
they can accomodate up to 100 kDa of heterologous protein. Another advantage of
monovalent display is that it avoids avidity problems observed in polyvalent display,
where the phage can attach to the target at multiple points.
Phage display has a vast array of applications:
phage display of natural peptides: epitope mapping of monoclonal antibodies and
generation of immunogenes has been performed by selections of fragmented genes
libraries [223] or whole genomes [224];
phage display of random peptides: identification of substrates for enzymes, or
peptide ligands for proteins involved in interactions [225-228];
phage display of proteins and protein domains: isolate of high affinity antibodies
[107], screening of cDNA expression libraries and identification of enyzme
substrates and protein-protein interactions [229] and SEREX (serological screening
of cDNA expression libraries), an emerging tool in identification of new
biomarkers in cancer [230-232], infectious and autoimmune diseases [233, 234].
While peptide display has been widely used, the display of cDNAs has been limited [235-
237], with the exception of antibody phage display that has been extensivly developed
since its beginings 20 years ago [238, 239]. The entire antibody repertoire of the immune
system could be transferred into phage display system, and used to select antibodies with a
given specificity. The original size of the antibody repertoire can be even amplified by
inducing artificial diversity, generating new antibodies. In this way, thousands of
monoclonal antibodies have been isolated for research or therapeutic purposes. In additon
to cDNA display, some approaches to phage display of genomic DNA fragments have also
been made [240].
Display of cDNA libraries on filamentous phages has been challenging primarily because
the DNA fragments must be in frame with the phage coat protein gene chosen for display.
The prevalence of non-expressed out-of-frame fragments leads to an increase of the library
size and, as a consequence of non-displaying phages grow faster and better, a strong bias
that could make the selections difficult.
A variety of methods for identification and removal of frame-shifted DNA sequences have
been developed [241-243], but while these systems have proven efficient in removing
frame-shifted DNA fragments, the gene of interest inevitably depends on the solubility and
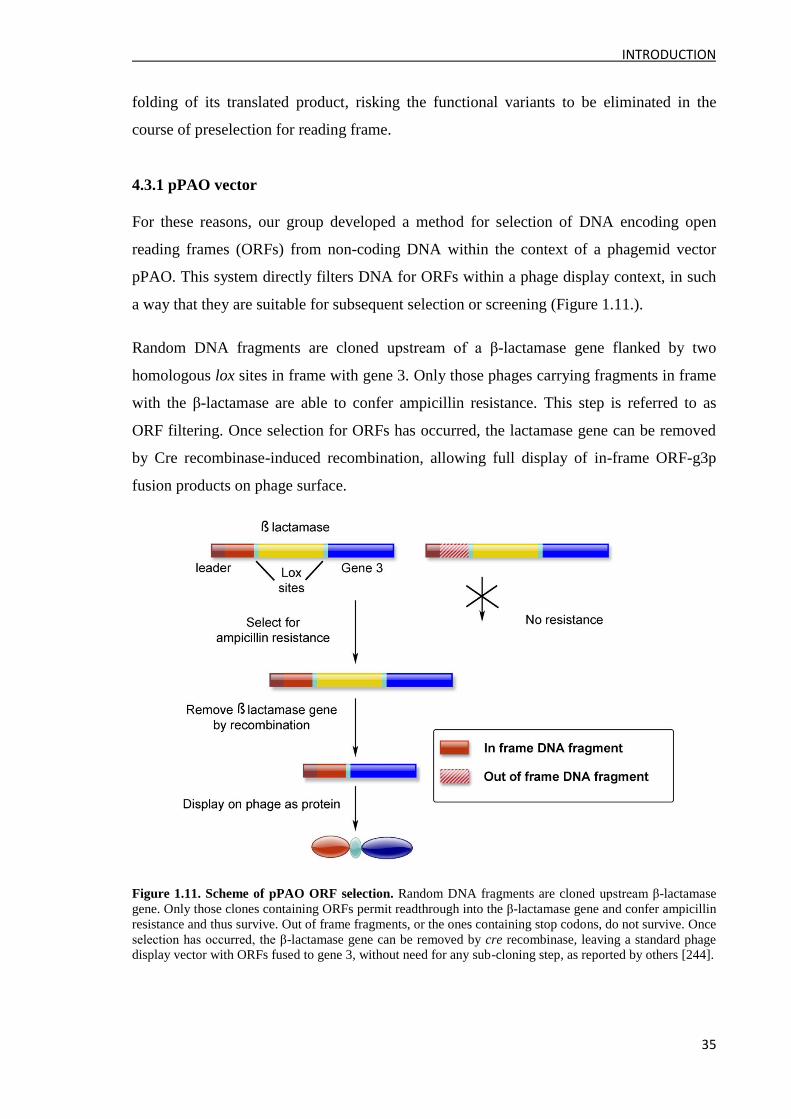
INTRODUCTION
35
folding of its translated product, risking the functional variants to be eliminated in the
course of preselection for reading frame.
4.3.1 pPAO vector
For these reasons, our group developed a method for selection of DNA encoding open
reading frames (ORFs) from non-coding DNA within the context of a phagemid vector
pPAO. This system directly filters DNA for ORFs within a phage display context, in such
a way that they are suitable for subsequent selection or screening (Figure 1.11.).
Random DNA fragments are cloned upstream of a β-lactamase gene flanked by two
homologous lox sites in frame with gene 3. Only those phages carrying fragments in frame
with the β-lactamase are able to confer ampicillin resistance. This step is referred to as
ORF filtering. Once selection for ORFs has occurred, the lactamase gene can be removed
by Cre recombinase-induced recombination, allowing full display of in-frame ORF-g3p
fusion products on phage surface.
Figure 1.11. Scheme of pPAO ORF selection. Random DNA fragments are cloned upstream β-lactamase
gene. Only those clones containing ORFs permit readthrough into the β-lactamase gene and confer ampicillin
resistance and thus survive. Out of frame fragments, or the ones containing stop codons, do not survive. Once
selection has occurred, the β-lactamase gene can be removed by cre recombinase, leaving a standard phage
display vector with ORFs fused to gene 3, without need for any sub-cloning step, as reported by others [244].
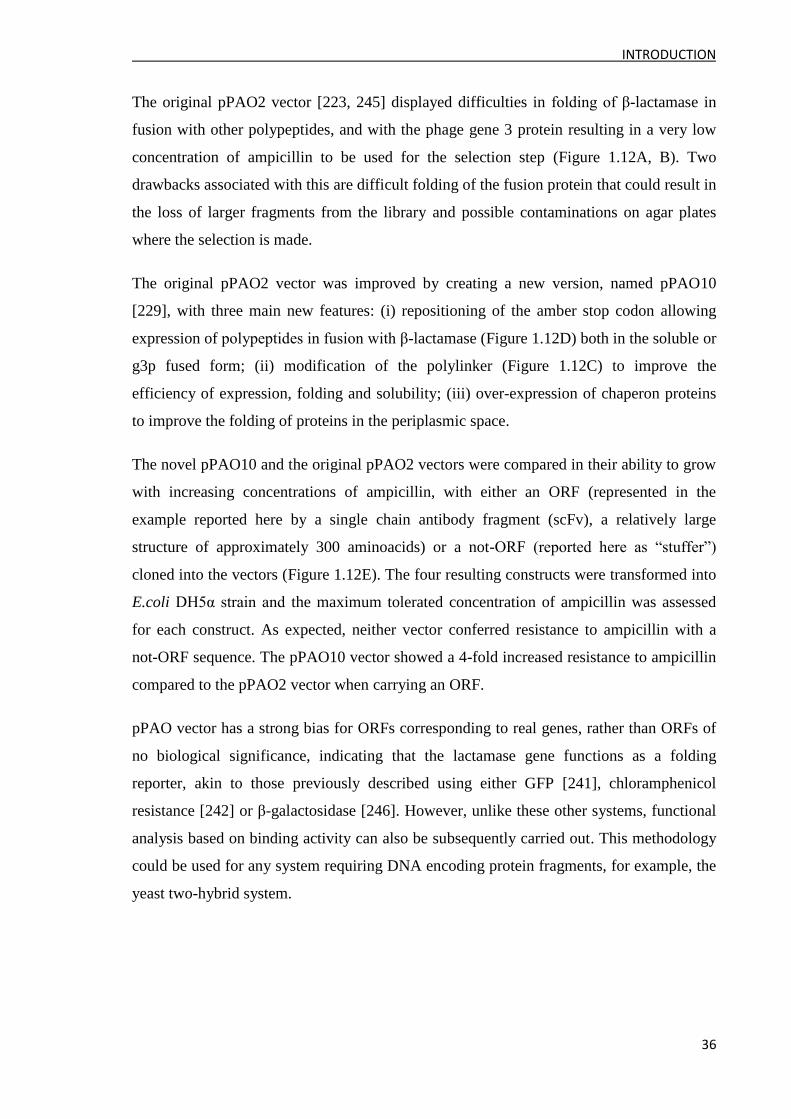
INTRODUCTION
36
The original pPAO2 vector [223, 245] displayed difficulties in folding of β-lactamase in
fusion with other polypeptides, and with the phage gene 3 protein resulting in a very low
concentration of ampicillin to be used for the selection step (Figure 1.12A, B). Two
drawbacks associated with this are difficult folding of the fusion protein that could result in
the loss of larger fragments from the library and possible contaminations on agar plates
where the selection is made.
The original pPAO2 vector was improved by creating a new version, named pPAO10
[229], with three main new features: (i) repositioning of the amber stop codon allowing
expression of polypeptides in fusion with β-lactamase (Figure 1.12D) both in the soluble or
g3p fused form; (ii) modification of the polylinker (Figure 1.12C) to improve the
efficiency of expression, folding and solubility; (iii) over-expression of chaperon proteins
to improve the folding of proteins in the periplasmic space.
The novel pPAO10 and the original pPAO2 vectors were compared in their ability to grow
with increasing concentrations of ampicillin, with either an ORF (represented in the
example reported here by a single chain antibody fragment (scFv), a relatively large
structure of approximately 300 aminoacids) or a not-ORF (reported here as “stuffer”)
cloned into the vectors (Figure 1.12E). The four resulting constructs were transformed into
E.coli DH5α strain and the maximum tolerated concentration of ampicillin was assessed
for each construct. As expected, neither vector conferred resistance to ampicillin with a
not-ORF sequence. The pPAO10 vector showed a 4-fold increased resistance to ampicillin
compared to the pPAO2 vector when carrying an ORF.
pPAO vector has a strong bias for ORFs corresponding to real genes, rather than ORFs of
no biological significance, indicating that the lactamase gene functions as a folding
reporter, akin to those previously described using either GFP [241], chloramphenicol
resistance [242] or β-galactosidase [246]. However, unlike these other systems, functional
analysis based on binding activity can also be subsequently carried out. This methodology
could be used for any system requiring DNA encoding protein fragments, for example, the
yeast two-hybrid system.
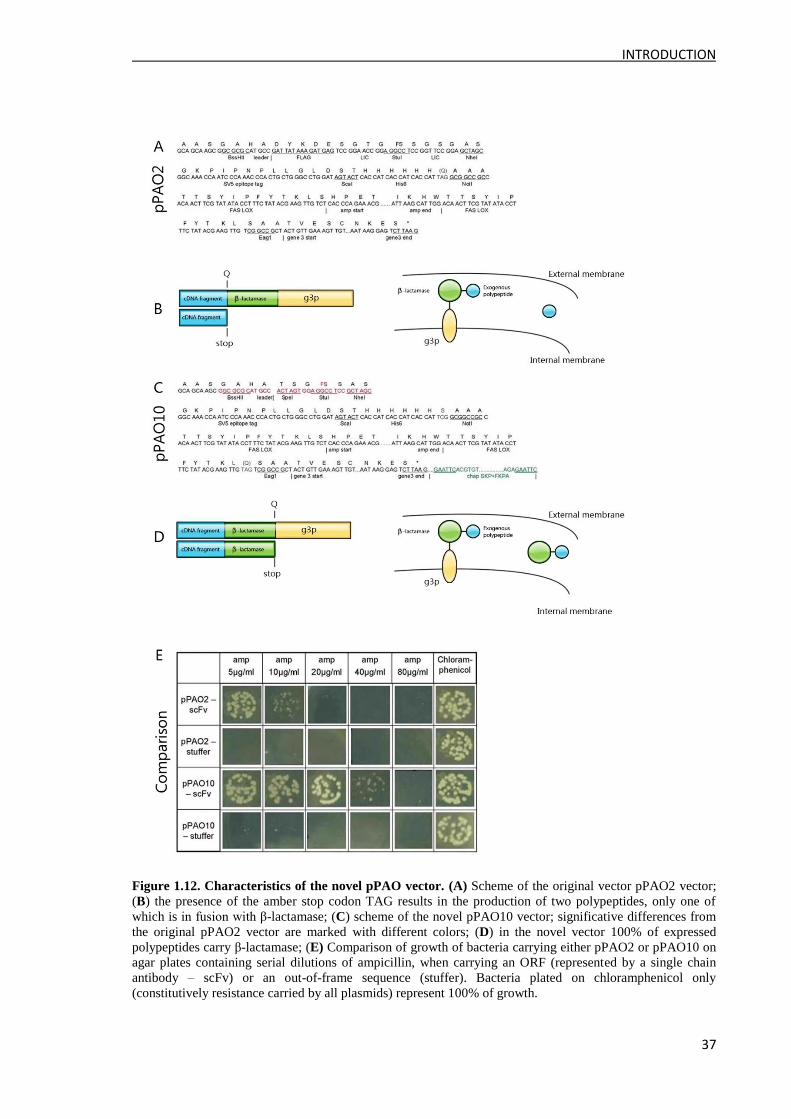
INTRODUCTION
37
Figure 1.12. Characteristics of the novel pPAO vector. (A) Scheme of the original vector pPAO2 vector;
(B) the presence of the amber stop codon TAG results in the production of two polypeptides, only one of
which is in fusion with β-lactamase; (C) scheme of the novel pPAO10 vector; significative differences from
the original pPAO2 vector are marked with different colors; (D) in the novel vector 100% of expressed
polypeptides carry β-lactamase; (E) Comparison of growth of bacteria carrying either pPAO2 or pPAO10 on
agar plates containing serial dilutions of ampicillin, when carrying an ORF (represented by a single chain
antibody – scFv) or an out-of-frame sequence (stuffer). Bacteria plated on chloramphenicol only
(constitutively resistance carried by all plasmids) represent 100% of growth.
AIM OF THE RESEARCH
38
AIM OF THE RESEARCH
Protein-protein interactions are crucial for all biological processes. While TG2 has been
asigned many biological functions and has been implicated in a wide variety of
pathological states ranging from inflamatory and autoimmune disorders to
neurodegenerative pathologies and cancer, little is known about TG2 substrates and
interactors (see Chapters 2 and 3). Identification of these proteins is of critical importance
for the establishment of the functional role of TG2 in various cells and tissues, as well as
in pathological states. It is therefore clear that an approach attempting to systematically
identify TG2 protein binding partners is very much needed.
Methods used for screening of protein-protein interactions, like yeast two hybrid system
(Y2H), protein complementation assays (PCA), ribosome/RNA display [247, 248] and
phage display [249], generally imply time consuming picking and assessment of individual
clones after a selection or screening procedure. If a large number of different binders is
expected, such as occurs in the screening of a protein with multiple interaction partners, or
a few clones are over-represented during the selection process, manual random picking
strategies cannot identify all possible interactions with a given bait protein.
The aim of this work is to apply a novel approach to identification of protein-protein
interactions, in which the number of screened clones could be increased by several orders
of magnitude and would therefore represent a major advance in the field. In this study we
focused on the identification of TG2 „‟interactome‟‟. TG2 is only one of many proteins
with very complex interaction network, the characterization of which requires appropriate
tools that allow the screening of a large number of potential interacting partners.
The main goals of the research would be:
a) construction of a cDNA ORF filtered phage display library;
b) selection of proteins with desired reactivity from a background of millions of
other analytes;
c) identification and simultaneous analysis of restricted or large interactome
repertoires, both in a quantitative and qualitative fashion;
d) validation of the selected ORFs and the assessment on the reliability of the
approach in the study of protein-protein interactions.
RESULTS
39
RESULTS
1 Introduction to results
1.1 Strategy
The overall strategy we have developed to identify the TG2 interactome consists of 4 key
steps as outlined in Figure 2.1. The key steps are:
A. Generation of an ORF filtered phage display library. mRNA is fragmented into
calibrated lengths, reverse transcribed into cDNA, normalized, cloned into the
filtering vector and clones encoding ORFs are filtered out using ampicillin
selection.
B. Selection of interacting ORFs on a target protein. After eliminating the ß-
lactamase coding region by Cre-lox mediated recombination, ORF displaying
phages are challenged with purified recombinant TG2 through two cycles of
selection and amplification.
C. Identification of restricted or large interactome repertoires. In order to identify
TG2 interacting clones, selected phages were processed by two distinct approaches
based on random or massive analyses, both aimed to identify the clones most
reactive to TG2 that could be novel substrates or interacting partners. In the first
approach, a random analysis was performed, where a defined number of clones
from each round of selection was analyzed. In the second approach, a massive
analysis strategy was performed: potential interacting clones were identified by the
454 massive sequencing technology according to their relative enrichment during
phage display selections.
D. Validation of the most frequent ORFs. Most frequent clones reactive to TG2
were validated by ELISA and the Protein Complementation Assay (PCA), whereas
substrate preference was assessed by incorporation of 5-biotinamidopentylamine in
TG2 reaction.
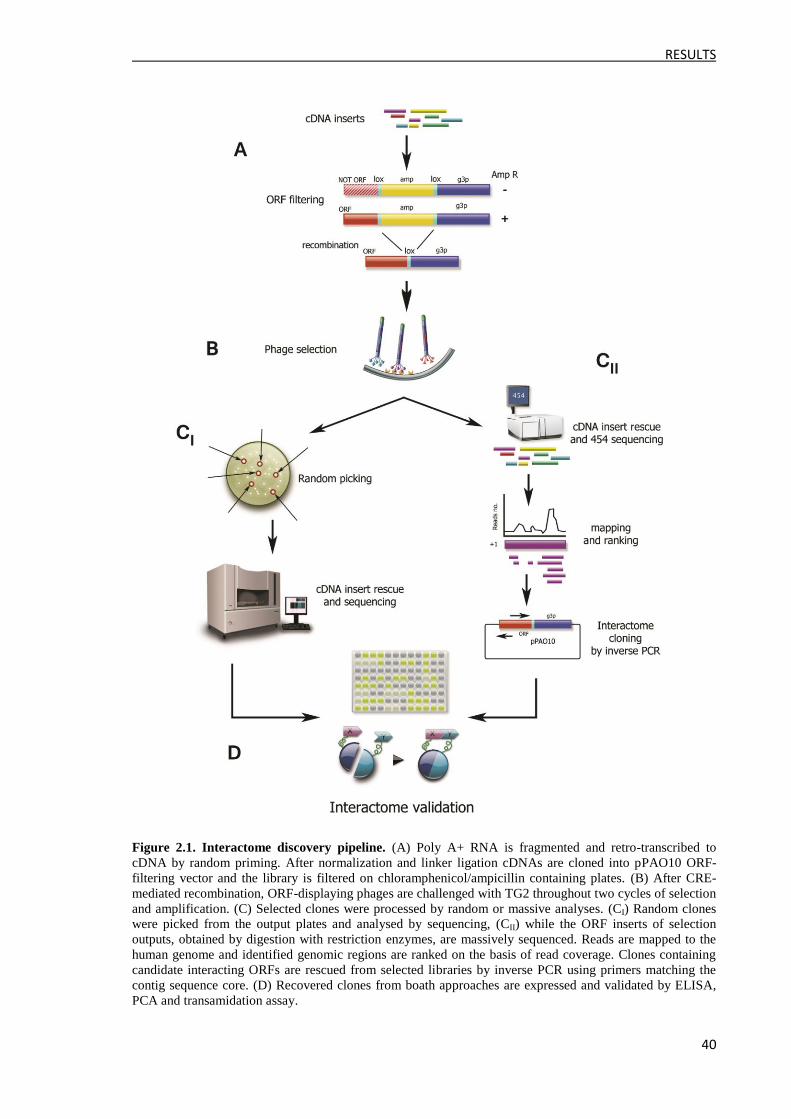
RESULTS
40
Figure 2.1. Interactome discovery pipeline. (A) Poly A+ RNA is fragmented and retro-transcribed to
cDNA by random priming. After normalization and linker ligation cDNAs are cloned into pPAO10 ORF-
filtering vector and the library is filtered on chloramphenicol/ampicillin containing plates. (B) After CRE-
mediated recombination, ORF-displaying phages are challenged with TG2 throughout two cycles of selection
and amplification. (C) Selected clones were processed by random or massive analyses. (CI) Random clones
were picked from the output plates and analysed by sequencing, (CII) while the ORF inserts of selection
outputs, obtained by digestion with restriction enzymes, are massively sequenced. Reads are mapped to the
human genome and identified genomic regions are ranked on the basis of read coverage. Clones containing
candidate interacting ORFs are rescued from selected libraries by inverse PCR using primers matching the
contig sequence core. (D) Recovered clones from boath approaches are expressed and validated by ELISA,
PCA and transamidation assay.
RESULTS
41
1.2 Construction of the phage display ORFs cDNA library
Generating an ORF filtered phage display library was the first step in identifying the TG2
interactome [229]. cDNA phage display library was constructed by our group from human
colon carcinoma cells, human lung fibroblasts and purified human pancreatic islets, and
used as a starting point in the identification of the TG2 interactome using purified
recombinant human TG2 as the target.
PolyA+ RNA was obtained from human colon carcinoma cells (HCC), human lung
fibroblasts (HF) and purified human pancreatic islets (HPI). mRNA samples were
fragmented with a calibrated length of 100-600 bases in order to improve the uniformity of
sequence coverage across transcripts [250]. Orientated cDNA fragments [251] were
prepared after random primer reverse transcription and normalization [252]. Finally, a
cDNA display library was created within the context of the pPAO10 phagemid vector
(Figure 1.12.). After cDNA fragment ligation and E. coli transformation two libraries of
9x10⁶ and 2.1x10
7 clones were obtained for pooled HCC+HF or HPI cDNAs, respectively.
The size of the libraries was reduced to 4x10⁵ and 1.2x10
6, respectively, after ORF filtering
by ampicillin selection. This corresponds to a reduction in clone numbers of around 95%
(95.6% for HCC+LF and 94.3% for HPI) which is in line with theoretical expectations as
well as with previous observations [245], and indicates that ORF filtration was successful.
On the basis of the observed numbers, each library represents a potential of at least 40
ORF fragments per gene, assuming that all 24,000 human genes are equally represented in
the normalized cDNA.
1.3 cDNA library characterization by massive sequencing
cDNA fragments from the two pooled libraries (termed NS, for “not selected” library)
were recovered after pooled phagemid digestion with BssHII and NheI restriction enzymes
and were subjected to 454 sequencing. We obtained 67,587 reads from the NS library
(Table 2.4.). Reads were aligned to the human genome sequence (NCBI build 36) using
gmap software.
51071 sequences had at least 95% identity and 90% overlap. 7576 genes were identified by
at least 1 read (Figure 2.2A) confirming the high diversity of the NS library. Complete data
are available at www.interactomeataglance.org. The efficacy of cDNA normalization was
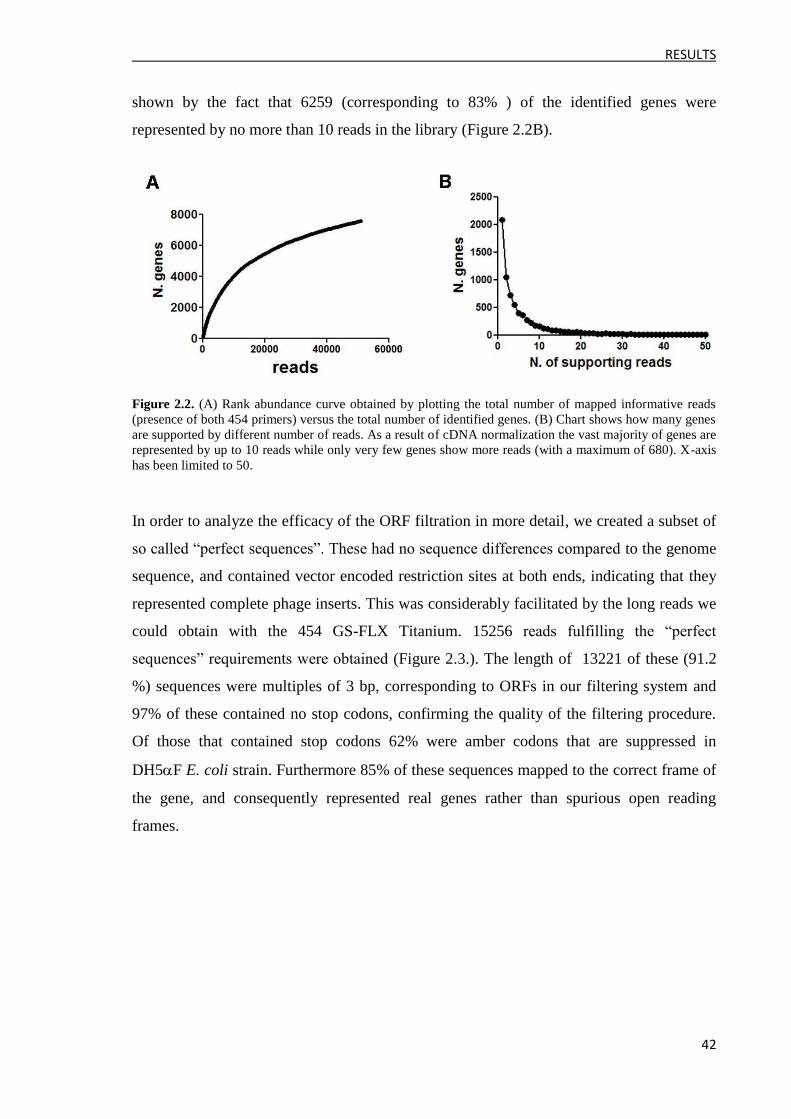
RESULTS
42
shown by the fact that 6259 (corresponding to 83% ) of the identified genes were
represented by no more than 10 reads in the library (Figure 2.2B).
Figure 2.2. (A) Rank abundance curve obtained by plotting the total number of mapped informative reads
(presence of both 454 primers) versus the total number of identified genes. (B) Chart shows how many genes
are supported by different number of reads. As a result of cDNA normalization the vast majority of genes are
represented by up to 10 reads while only very few genes show more reads (with a maximum of 680). X-axis
has been limited to 50.
In order to analyze the efficacy of the ORF filtration in more detail, we created a subset of
so called “perfect sequences”. These had no sequence differences compared to the genome
sequence, and contained vector encoded restriction sites at both ends, indicating that they
represented complete phage inserts. This was considerably facilitated by the long reads we
could obtain with the 454 GS-FLX Titanium. 15256 reads fulfilling the “perfect
sequences” requirements were obtained (Figure 2.3.). The length of 13221 of these (91.2
%) sequences were multiples of 3 bp, corresponding to ORFs in our filtering system and
97% of these contained no stop codons, confirming the quality of the filtering procedure.
Of those that contained stop codons 62% were amber codons that are suppressed in
DH5F E. coli strain. Furthermore 85% of these sequences mapped to the correct frame of
the gene, and consequently represented real genes rather than spurious open reading
frames.
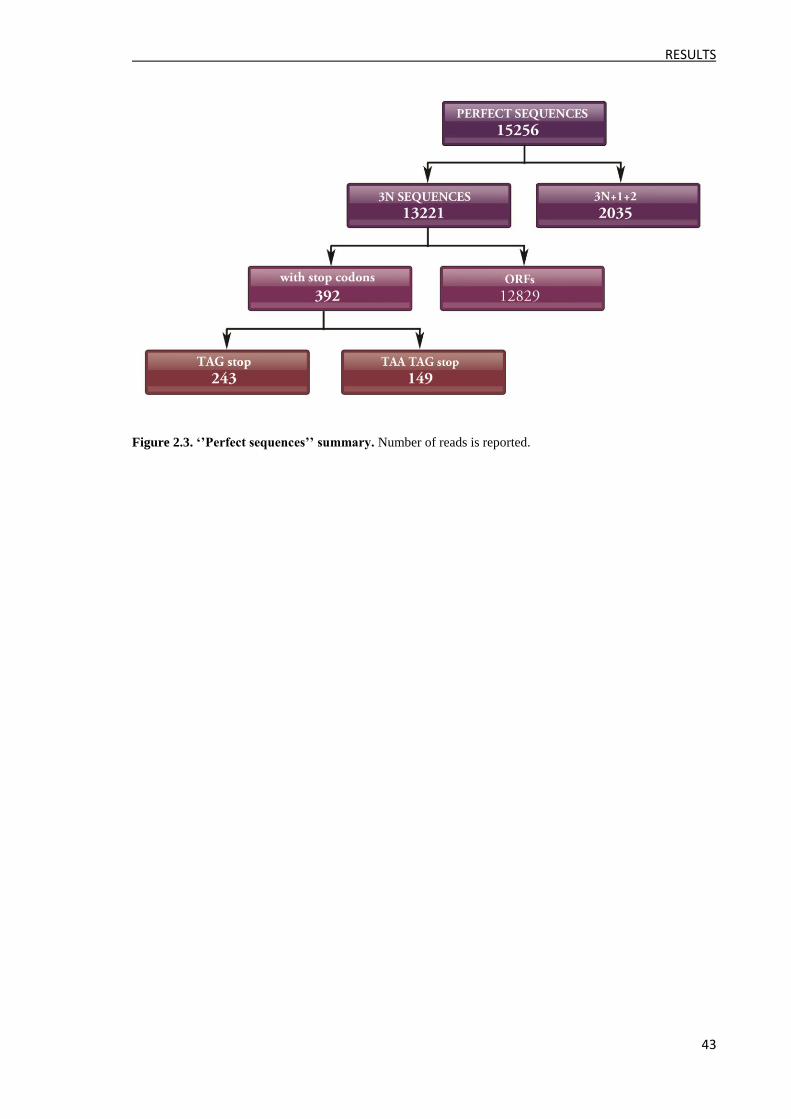
RESULTS
43
Figure 2.3. ‘’Perfect sequences’’ summary. Number of reads is reported.

RESULTS
44
2 Selection of the phage display library
The majority of the proteins that are expressed by the tissue/organ from which the mRNA was
originally isolated are represented in cDNA libraries. Consequently, libraries display thousands
of different clones, whereas only a few of them are possible substrates or interactors of TG2,
the object of this study. To isolate the clones reactive to TG2 from the background represented
by all other phage clones ORF displaying phages from the previously constructed NS
library were selected on the recombinant human TG2 (hTG2). As already discussed, TG2
is a structurally complex four-domain enzyme that undergoes extensive conformational
changes under different physiological conditions (Figure 1.2.) [18, 253]. In order to
account for the possibility that TG2 may be denatured by solid-phase absorption (perhaps
leading to the binding of different targets), selection was carried out using two different
methods: (i) solid phase (SP) selection where the library was challenged with human TG2
immobilized on a solid surface (immunotube); (ii) biotinylated (BIO) selection in which
the library was challenged using the soluble biotinylated TG2.
In order to avoid a significant restriction in output diversity [254] only two cycles were
performed for both the SP and BIO selection.
2.1 Solid phase selection
Selection on TG2 immobilized on a solid surface was done using immunotubes (Figure
2.4.). Briefly:
step 1: human recombinant TG2 was coated on a plastic surface of the
immunotube;
step 2: phages obtained from a cDNA display library were incubated with TG2;
step 3: extensive washes were performed to remove the unbound phages;
step 4: phages bound to TG2 were eluted with E.coli bacteria and plated.
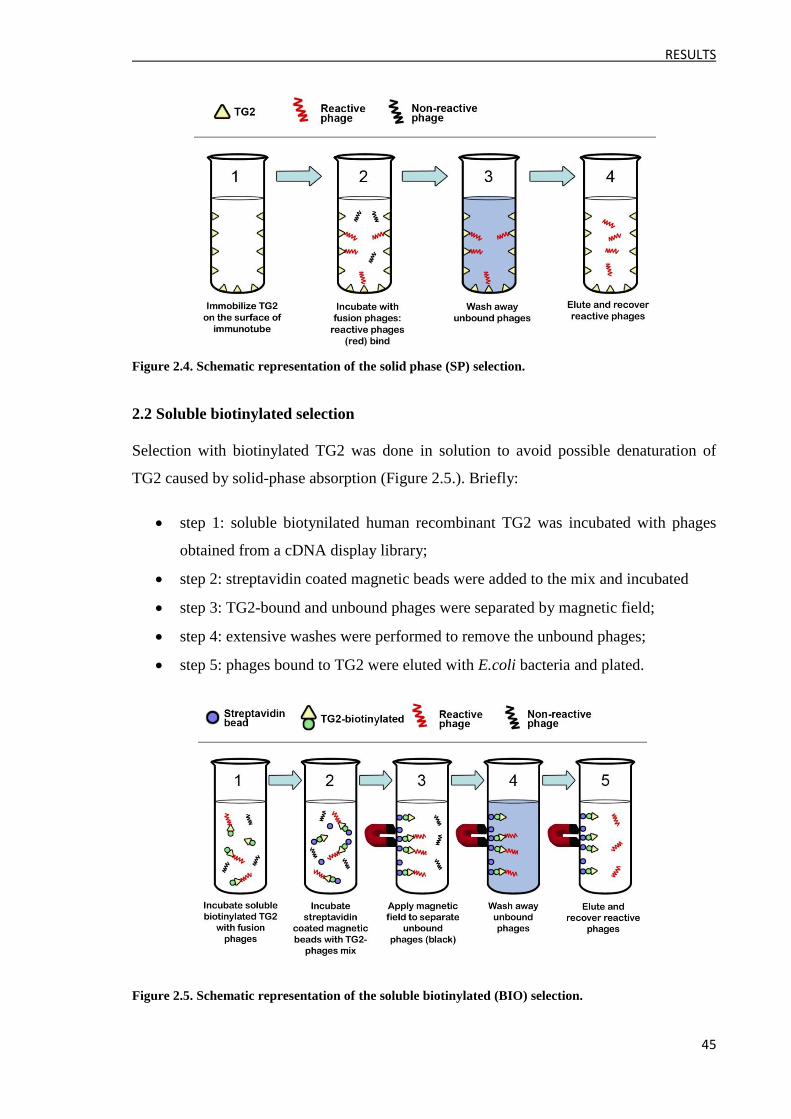
RESULTS
45
Figure 2.4. Schematic representation of the solid phase (SP) selection.
2.2 Soluble biotinylated selection
Selection with biotinylated TG2 was done in solution to avoid possible denaturation of
TG2 caused by solid-phase absorption (Figure 2.5.). Briefly:
step 1: soluble biotynilated human recombinant TG2 was incubated with phages
obtained from a cDNA display library;
step 2: streptavidin coated magnetic beads were added to the mix and incubated
step 3: TG2-bound and unbound phages were separated by magnetic field;
step 4: extensive washes were performed to remove the unbound phages;
step 5: phages bound to TG2 were eluted with E.coli bacteria and plated.
Figure 2.5. Schematic representation of the soluble biotinylated (BIO) selection.
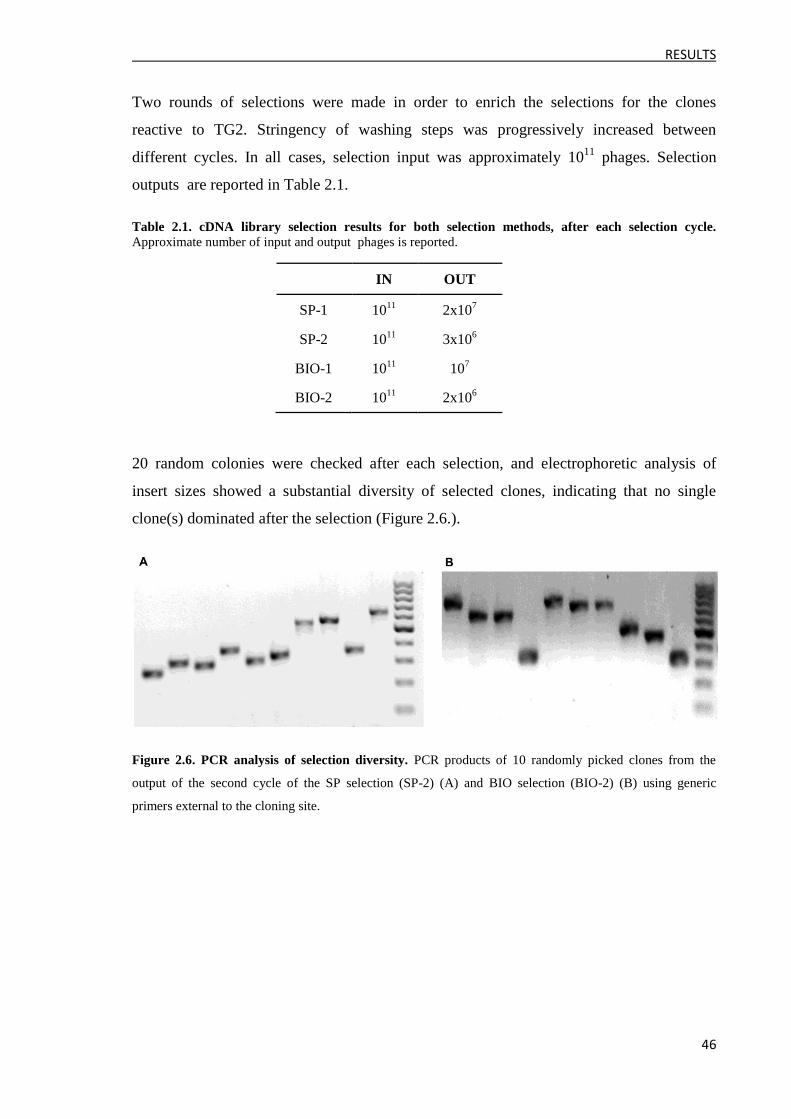
RESULTS
46
Two rounds of selections were made in order to enrich the selections for the clones
reactive to TG2. Stringency of washing steps was progressively increased between
different cycles. In all cases, selection input was approximately 1011
phages. Selection
outputs are reported in Table 2.1.
Table 2.1. cDNA library selection results for both selection methods, after each selection cycle.
Approximate number of input and output phages is reported.
IN OUT
SP-1 1011
2x10⁷
SP-2 1011
3x10⁶
BIO-1 1011
107
BIO-2 1011
2x10⁶
20 random colonies were checked after each selection, and electrophoretic analysis of
insert sizes showed a substantial diversity of selected clones, indicating that no single
clone(s) dominated after the selection (Figure 2.6.).
Figure 2.6. PCR analysis of selection diversity. PCR products of 10 randomly picked clones from the
output of the second cycle of the SP selection (SP-2) (A) and BIO selection (BIO-2) (B) using generic
primers external to the cloning site.
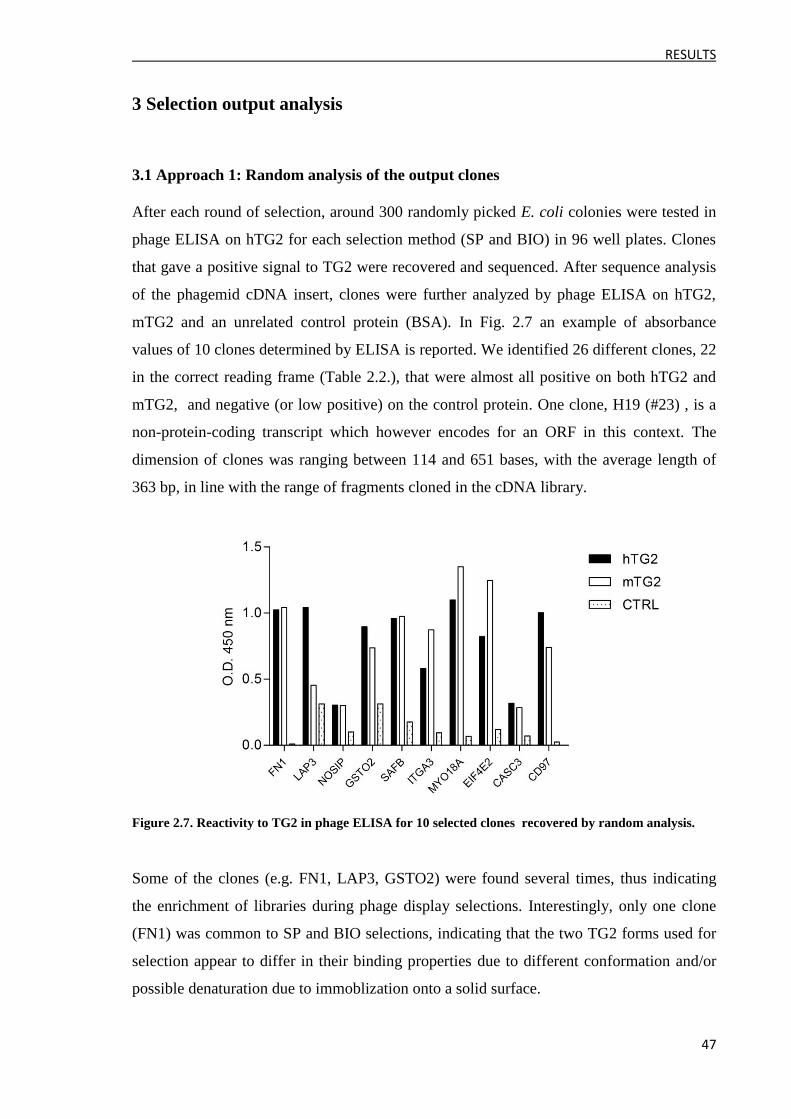
RESULTS
47
3 Selection output analysis
3.1 Approach 1: Random analysis of the output clones
After each round of selection, around 300 randomly picked E. coli colonies were tested in
phage ELISA on hTG2 for each selection method (SP and BIO) in 96 well plates. Clones
that gave a positive signal to TG2 were recovered and sequenced. After sequence analysis
of the phagemid cDNA insert, clones were further analyzed by phage ELISA on hTG2,
mTG2 and an unrelated control protein (BSA). In Fig. 2.7 an example of absorbance
values of 10 clones determined by ELISA is reported. We identified 26 different clones, 22
in the correct reading frame (Table 2.2.), that were almost all positive on both hTG2 and
mTG2, and negative (or low positive) on the control protein. One clone, H19 (#23) , is a
non-protein-coding transcript which however encodes for an ORF in this context. The
dimension of clones was ranging between 114 and 651 bases, with the average length of
363 bp, in line with the range of fragments cloned in the cDNA library.
Figure 2.7. Reactivity to TG2 in phage ELISA for 10 selected clones recovered by random analysis.
Some of the clones (e.g. FN1, LAP3, GSTO2) were found several times, thus indicating
the enrichment of libraries during phage display selections. Interestingly, only one clone
(FN1) was common to SP and BIO selections, indicating that the two TG2 forms used for
selection appear to differ in their binding properties due to different conformation and/or
possible denaturation due to immoblization onto a solid surface.
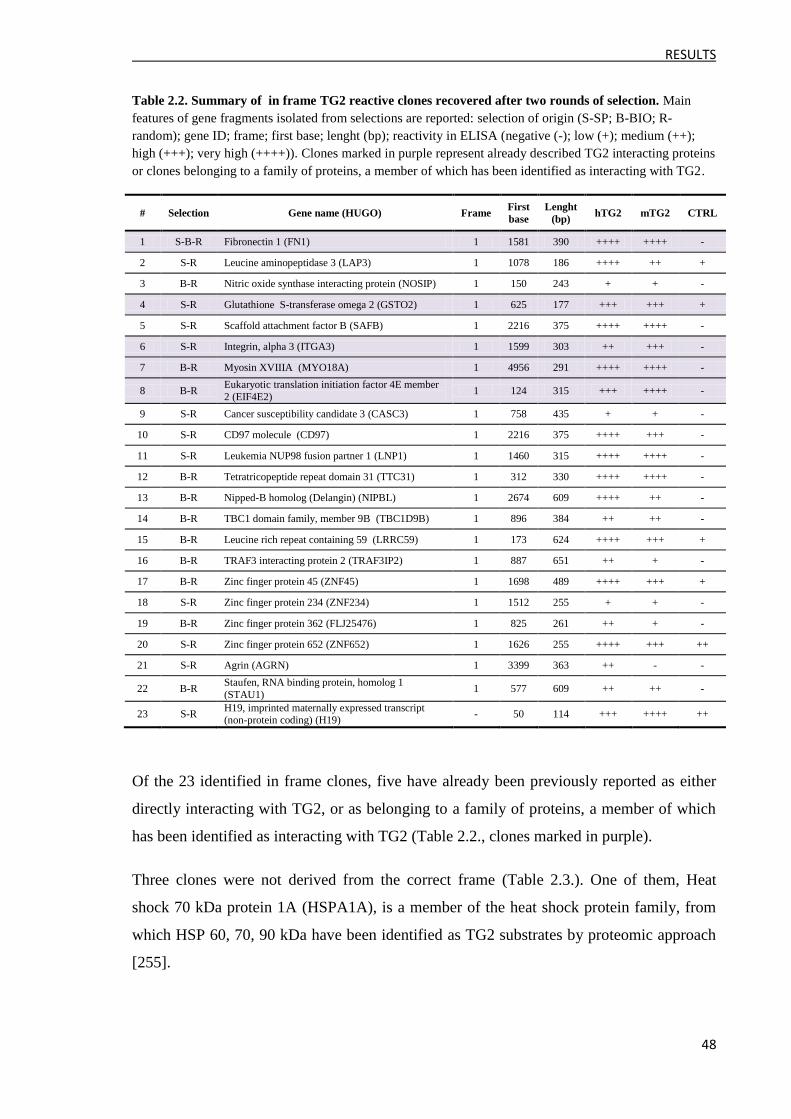
RESULTS
48
Table 2.2. Summary of in frame TG2 reactive clones recovered after two rounds of selection. Main
features of gene fragments isolated from selections are reported: selection of origin (S-SP; B-BIO; R-
random); gene ID; frame; first base; lenght (bp); reactivity in ELISA (negative (-); low (+); medium (++);
high (+++); very high (++++)). Clones marked in purple represent already described TG2 interacting proteins
or clones belonging to a family of proteins, a member of which has been identified as interacting with TG2.
# Selection Gene name (HUGO) Frame First
base
Lenght
(bp) hTG2 mTG2 CTRL
1 S-B-R Fibronectin 1 (FN1) 1 1581 390 ++++ ++++ -
2 S-R Leucine aminopeptidase 3 (LAP3) 1 1078 186 ++++ ++ +
3 B-R Nitric oxide synthase interacting protein (NOSIP) 1 150 243 + + -
4 S-R Glutathione S-transferase omega 2 (GSTO2) 1 625 177 +++ +++ +
5 S-R Scaffold attachment factor B (SAFB) 1 2216 375 ++++ ++++ -
6 S-R Integrin, alpha 3 (ITGA3) 1 1599 303 ++ +++ -
7 B-R Myosin XVIIIA (MYO18A) 1 4956 291 ++++ ++++ -
8 B-R Eukaryotic translation initiation factor 4E member
2 (EIF4E2) 1 124 315 +++ ++++ -
9 S-R Cancer susceptibility candidate 3 (CASC3) 1 758 435 + + -
10 S-R CD97 molecule (CD97) 1 2216 375 ++++ +++ -
11 S-R Leukemia NUP98 fusion partner 1 (LNP1) 1 1460 315 ++++ ++++ -
12 B-R Tetratricopeptide repeat domain 31 (TTC31) 1 312 330 ++++ ++++ -
13 B-R Nipped-B homolog (Delangin) (NIPBL) 1 2674 609 ++++ ++ -
14 B-R TBC1 domain family, member 9B (TBC1D9B) 1 896 384 ++ ++ -
15 B-R Leucine rich repeat containing 59 (LRRC59) 1 173 624 ++++ +++ +
16 B-R TRAF3 interacting protein 2 (TRAF3IP2) 1 887 651 ++ + -
17 B-R Zinc finger protein 45 (ZNF45) 1 1698 489 ++++ +++ +
18 S-R Zinc finger protein 234 (ZNF234) 1 1512 255 + + -
19 B-R Zinc finger protein 362 (FLJ25476) 1 825 261 ++ + -
20 S-R Zinc finger protein 652 (ZNF652) 1 1626 255 ++++ +++ ++
21 S-R Agrin (AGRN) 1 3399 363 ++ - -
22 B-R Staufen, RNA binding protein, homolog 1
(STAU1) 1 577 609 ++ ++ -
23 S-R H19, imprinted maternally expressed transcript (non-protein coding) (H19)
- 50 114 +++ ++++ ++
Of the 23 identified in frame clones, five have already been previously reported as either
directly interacting with TG2, or as belonging to a family of proteins, a member of which
has been identified as interacting with TG2 (Table 2.2., clones marked in purple).
Three clones were not derived from the correct frame (Table 2.3.). One of them, Heat
shock 70 kDa protein 1A (HSPA1A), is a member of the heat shock protein family, from
which HSP 60, 70, 90 kDa have been identified as TG2 substrates by proteomic approach
[255].
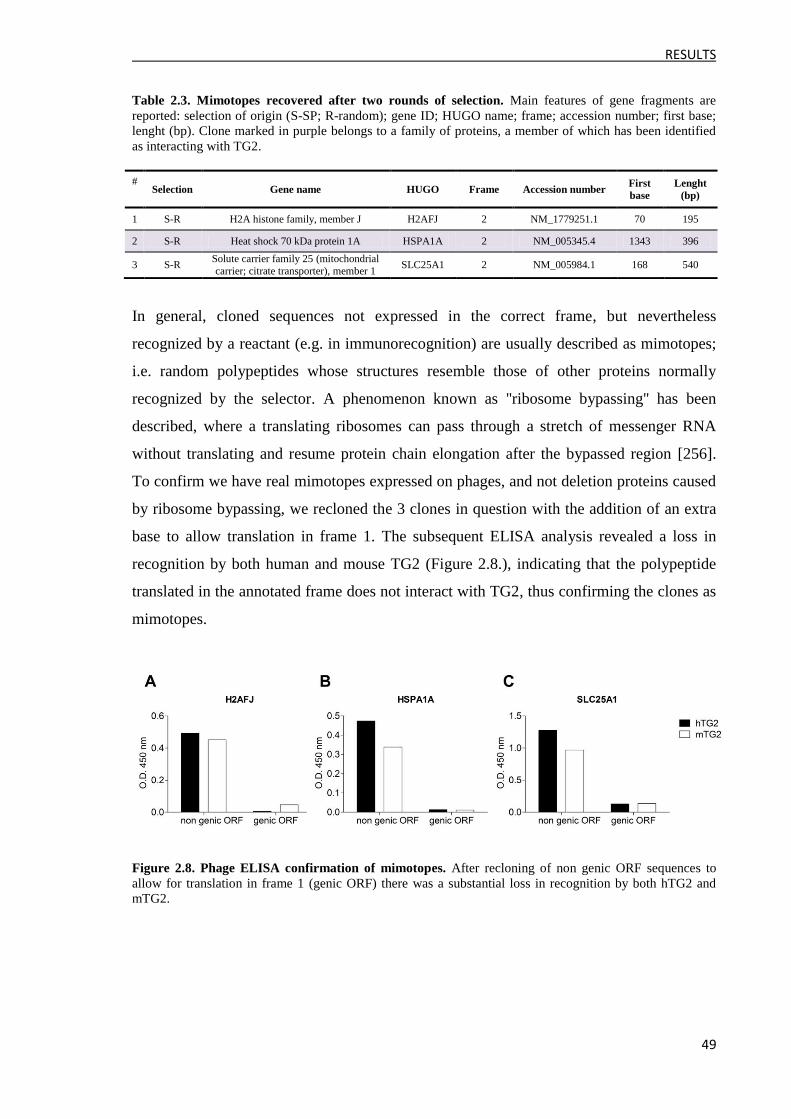
RESULTS
49
Table 2.3. Mimotopes recovered after two rounds of selection. Main features of gene fragments are
reported: selection of origin (S-SP; R-random); gene ID; HUGO name; frame; accession number; first base;
lenght (bp). Clone marked in purple belongs to a family of proteins, a member of which has been identified
as interacting with TG2.
# Selection Gene name HUGO Frame Accession number
First
base
Lenght
(bp)
1 S-R H2A histone family, member J H2AFJ 2 NM_1779251.1 70 195
2 S-R Heat shock 70 kDa protein 1A HSPA1A 2 NM_005345.4 1343 396
3 S-R Solute carrier family 25 (mitochondrial
carrier; citrate transporter), member 1 SLC25A1 2 NM_005984.1 168 540
In general, cloned sequences not expressed in the correct frame, but nevertheless
recognized by a reactant (e.g. in immunorecognition) are usually described as mimotopes;
i.e. random polypeptides whose structures resemble those of other proteins normally
recognized by the selector. A phenomenon known as ''ribosome bypassing'' has been
described, where a translating ribosomes can pass through a stretch of messenger RNA
without translating and resume protein chain elongation after the bypassed region [256].
To confirm we have real mimotopes expressed on phages, and not deletion proteins caused
by ribosome bypassing, we recloned the 3 clones in question with the addition of an extra
base to allow translation in frame 1. The subsequent ELISA analysis revealed a loss in
recognition by both human and mouse TG2 (Figure 2.8.), indicating that the polypeptide
translated in the annotated frame does not interact with TG2, thus confirming the clones as
mimotopes.
Figure 2.8. Phage ELISA confirmation of mimotopes. After recloning of non genic ORF sequences to
allow for translation in frame 1 (genic ORF) there was a substantial loss in recognition by both hTG2 and
mTG2.
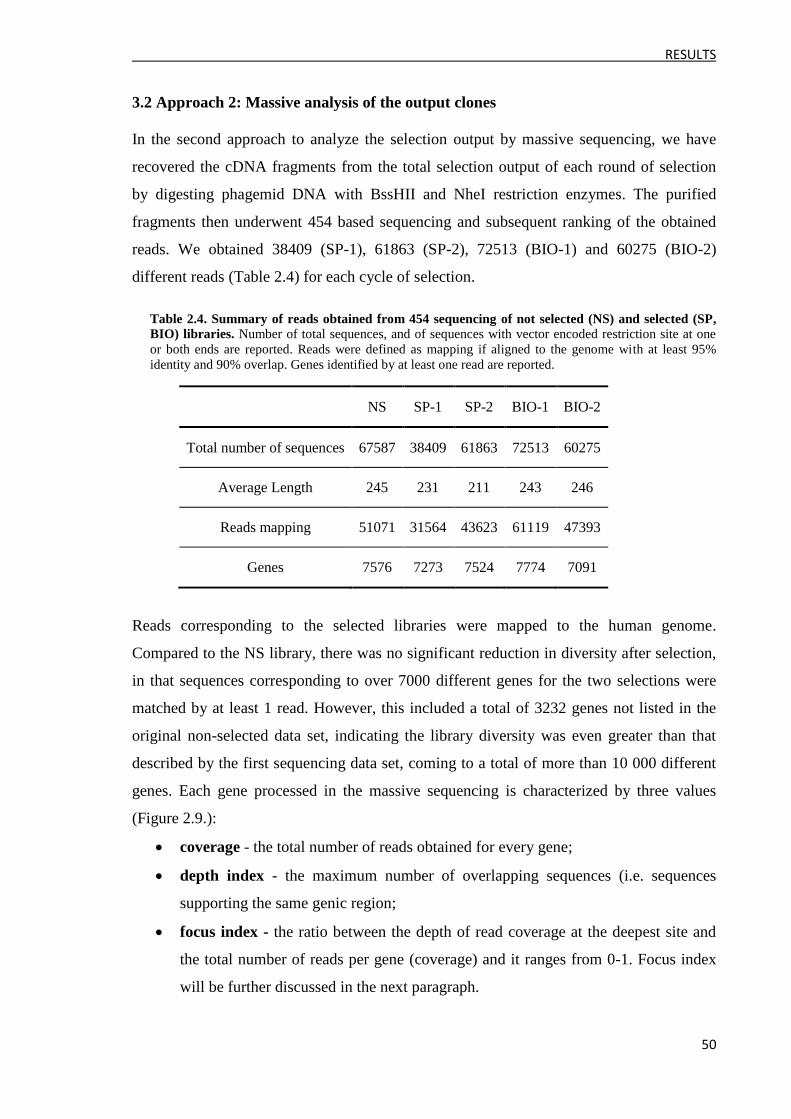
RESULTS
50
3.2 Approach 2: Massive analysis of the output clones
In the second approach to analyze the selection output by massive sequencing, we have
recovered the cDNA fragments from the total selection output of each round of selection
by digesting phagemid DNA with BssHII and NheI restriction enzymes. The purified
fragments then underwent 454 based sequencing and subsequent ranking of the obtained
reads. We obtained 38409 (SP-1), 61863 (SP-2), 72513 (BIO-1) and 60275 (BIO-2)
different reads (Table 2.4) for each cycle of selection.
Table 2.4. Summary of reads obtained from 454 sequencing of not selected (NS) and selected (SP,
BIO) libraries. Number of total sequences, and of sequences with vector encoded restriction site at one
or both ends are reported. Reads were defined as mapping if aligned to the genome with at least 95%
identity and 90% overlap. Genes identified by at least one read are reported.
NS SP-1 SP-2 BIO-1 BIO-2
Total number of sequences 67587 38409 61863 72513 60275
Average Length 245 231 211 243 246
Reads mapping 51071 31564 43623 61119 47393
Genes 7576 7273 7524 7774 7091
Reads corresponding to the selected libraries were mapped to the human genome.
Compared to the NS library, there was no significant reduction in diversity after selection,
in that sequences corresponding to over 7000 different genes for the two selections were
matched by at least 1 read. However, this included a total of 3232 genes not listed in the
original non-selected data set, indicating the library diversity was even greater than that
described by the first sequencing data set, coming to a total of more than 10 000 different
genes. Each gene processed in the massive sequencing is characterized by three values
(Figure 2.9.):
coverage - the total number of reads obtained for every gene;
depth index - the maximum number of overlapping sequences (i.e. sequences
supporting the same genic region;
focus index - the ratio between the depth of read coverage at the deepest site and
the total number of reads per gene (coverage) and it ranges from 0-1. Focus index
will be further discussed in the next paragraph.
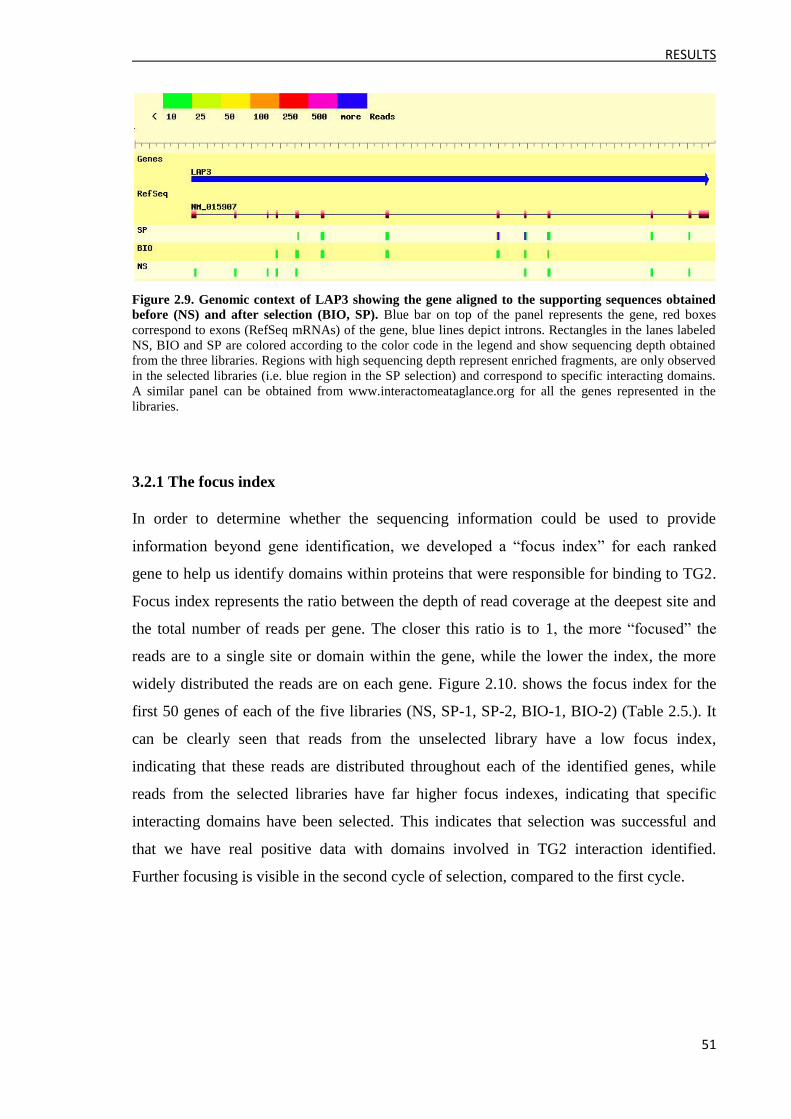
RESULTS
51
Figure 2.9. Genomic context of LAP3 showing the gene aligned to the supporting sequences obtained
before (NS) and after selection (BIO, SP). Blue bar on top of the panel represents the gene, red boxes
correspond to exons (RefSeq mRNAs) of the gene, blue lines depict introns. Rectangles in the lanes labeled
NS, BIO and SP are colored according to the color code in the legend and show sequencing depth obtained
from the three libraries. Regions with high sequencing depth represent enriched fragments, are only observed
in the selected libraries (i.e. blue region in the SP selection) and correspond to specific interacting domains.
A similar panel can be obtained from www.interactomeataglance.org for all the genes represented in the
libraries.
3.2.1 The focus index
In order to determine whether the sequencing information could be used to provide
information beyond gene identification, we developed a “focus index” for each ranked
gene to help us identify domains within proteins that were responsible for binding to TG2.
Focus index represents the ratio between the depth of read coverage at the deepest site and
the total number of reads per gene. The closer this ratio is to 1, the more “focused” the
reads are to a single site or domain within the gene, while the lower the index, the more
widely distributed the reads are on each gene. Figure 2.10. shows the focus index for the
first 50 genes of each of the five libraries (NS, SP-1, SP-2, BIO-1, BIO-2) (Table 2.5.). It
can be clearly seen that reads from the unselected library have a low focus index,
indicating that these reads are distributed throughout each of the identified genes, while
reads from the selected libraries have far higher focus indexes, indicating that specific
interacting domains have been selected. This indicates that selection was successful and
that we have real positive data with domains involved in TG2 interaction identified.
Further focusing is visible in the second cycle of selection, compared to the first cycle.
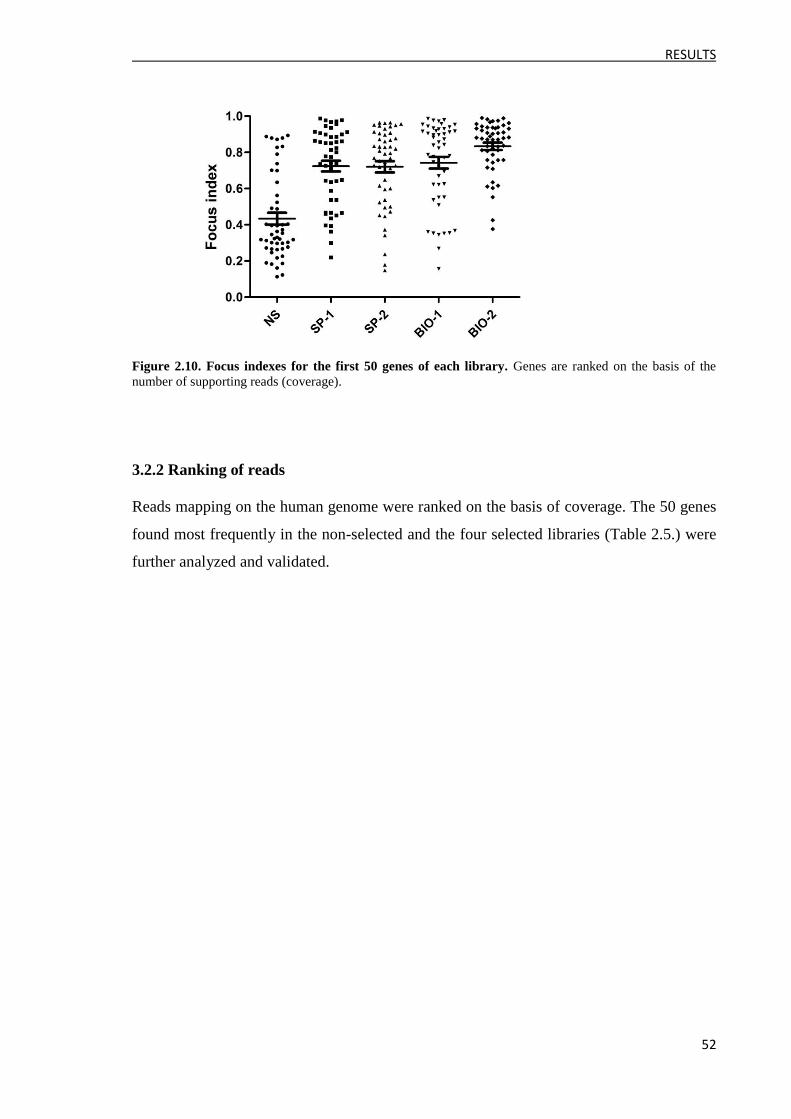
RESULTS
52
Figure 2.10. Focus indexes for the first 50 genes of each library. Genes are ranked on the basis of the
number of supporting reads (coverage).
3.2.2 Ranking of reads
Reads mapping on the human genome were ranked on the basis of coverage. The 50 genes
found most frequently in the non-selected and the four selected libraries (Table 2.5.) were
further analyzed and validated.
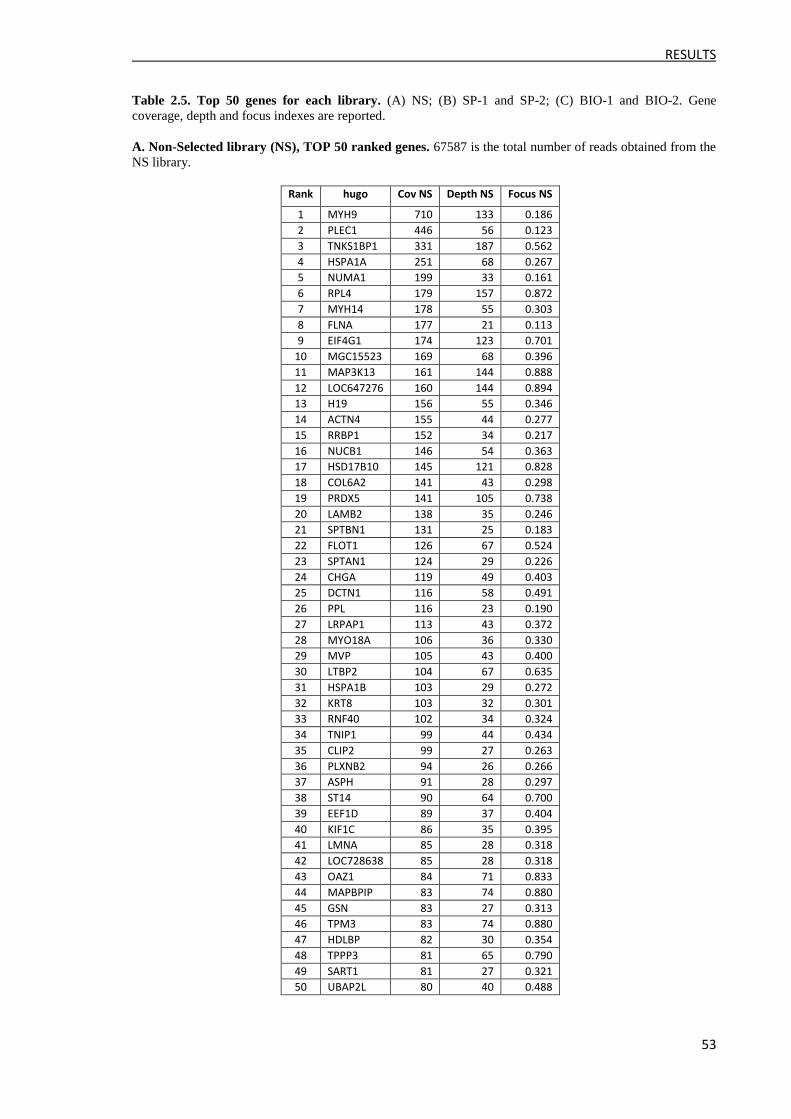
RESULTS
53
Table 2.5. Top 50 genes for each library. (A) NS; (B) SP-1 and SP-2; (C) BIO-1 and BIO-2. Gene
coverage, depth and focus indexes are reported.
A. Non-Selected library (NS), TOP 50 ranked genes. 67587 is the total number of reads obtained from the
NS library.
Rank hugo Cov NS Depth NS Focus NS
1 MYH9 710 133 0.186
2 PLEC1 446 56 0.123
3 TNKS1BP1 331 187 0.562
4 HSPA1A 251 68 0.267
5 NUMA1 199 33 0.161
6 RPL4 179 157 0.872
7 MYH14 178 55 0.303
8 FLNA 177 21 0.113
9 EIF4G1 174 123 0.701
10 MGC15523 169 68 0.396
11 MAP3K13 161 144 0.888
12 LOC647276 160 144 0.894
13 H19 156 55 0.346
14 ACTN4 155 44 0.277
15 RRBP1 152 34 0.217
16 NUCB1 146 54 0.363
17 HSD17B10 145 121 0.828
18 COL6A2 141 43 0.298
19 PRDX5 141 105 0.738
20 LAMB2 138 35 0.246
21 SPTBN1 131 25 0.183
22 FLOT1 126 67 0.524
23 SPTAN1 124 29 0.226
24 CHGA 119 49 0.403
25 DCTN1 116 58 0.491
26 PPL 116 23 0.190
27 LRPAP1 113 43 0.372
28 MYO18A 106 36 0.330
29 MVP 105 43 0.400
30 LTBP2 104 67 0.635
31 HSPA1B 103 29 0.272
32 KRT8 103 32 0.301
33 RNF40 102 34 0.324
34 TNIP1 99 44 0.434
35 CLIP2 99 27 0.263
36 PLXNB2 94 26 0.266
37 ASPH 91 28 0.297
38 ST14 90 64 0.700
39 EEF1D 89 37 0.404
40 KIF1C 86 35 0.395
41 LMNA 85 28 0.318
42 LOC728638 85 28 0.318
43 OAZ1 84 71 0.833
44 MAPBPIP 83 74 0.880
45 GSN 83 27 0.313
46 TPM3 83 74 0.880
47 HDLBP 82 30 0.354
48 TPPP3 81 65 0.790
49 SART1 81 27 0.321
50 UBAP2L 80 40 0.488
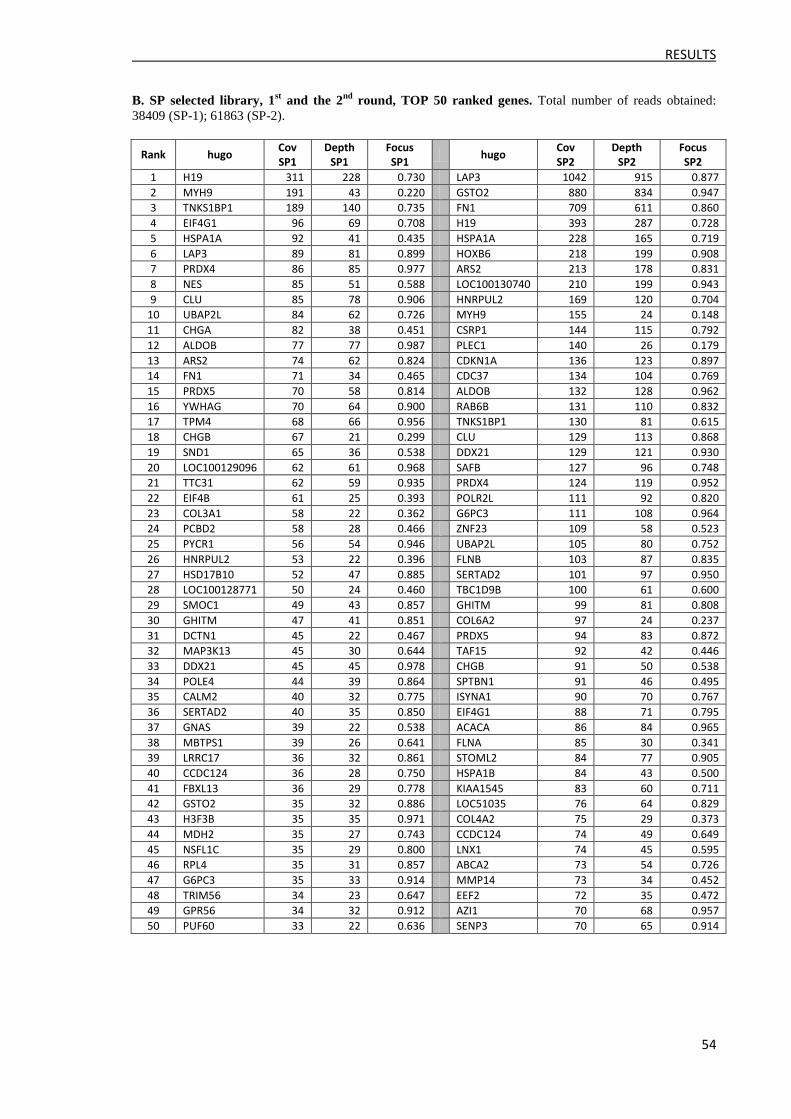
RESULTS
54
B. SP selected library, 1st and the 2
nd round, TOP 50 ranked genes. Total number of reads obtained:
38409 (SP-1); 61863 (SP-2).
Rank hugo Cov SP1
Depth SP1
Focus SP1
hugo Cov SP2
Depth SP2
Focus SP2
1 H19 311 228 0.730 LAP3 1042 915 0.877
2 MYH9 191 43 0.220 GSTO2 880 834 0.947
3 TNKS1BP1 189 140 0.735 FN1 709 611 0.860
4 EIF4G1 96 69 0.708 H19 393 287 0.728
5 HSPA1A 92 41 0.435 HSPA1A 228 165 0.719
6 LAP3 89 81 0.899 HOXB6 218 199 0.908
7 PRDX4 86 85 0.977 ARS2 213 178 0.831
8 NES 85 51 0.588 LOC100130740 210 199 0.943
9 CLU 85 78 0.906 HNRPUL2 169 120 0.704
10 UBAP2L 84 62 0.726 MYH9 155 24 0.148
11 CHGA 82 38 0.451 CSRP1 144 115 0.792
12 ALDOB 77 77 0.987 PLEC1 140 26 0.179
13 ARS2 74 62 0.824 CDKN1A 136 123 0.897
14 FN1 71 34 0.465 CDC37 134 104 0.769
15 PRDX5 70 58 0.814 ALDOB 132 128 0.962
16 YWHAG 70 64 0.900 RAB6B 131 110 0.832
17 TPM4 68 66 0.956 TNKS1BP1 130 81 0.615
18 CHGB 67 21 0.299 CLU 129 113 0.868
19 SND1 65 36 0.538 DDX21 129 121 0.930
20 LOC100129096 62 61 0.968 SAFB 127 96 0.748
21 TTC31 62 59 0.935 PRDX4 124 119 0.952
22 EIF4B 61 25 0.393 POLR2L 111 92 0.820
23 COL3A1 58 22 0.362 G6PC3 111 108 0.964
24 PCBD2 58 28 0.466 ZNF23 109 58 0.523
25 PYCR1 56 54 0.946 UBAP2L 105 80 0.752
26 HNRPUL2 53 22 0.396 FLNB 103 87 0.835
27 HSD17B10 52 47 0.885 SERTAD2 101 97 0.950
28 LOC100128771 50 24 0.460 TBC1D9B 100 61 0.600
29 SMOC1 49 43 0.857 GHITM 99 81 0.808
30 GHITM 47 41 0.851 COL6A2 97 24 0.237
31 DCTN1 45 22 0.467 PRDX5 94 83 0.872
32 MAP3K13 45 30 0.644 TAF15 92 42 0.446
33 DDX21 45 45 0.978 CHGB 91 50 0.538
34 POLE4 44 39 0.864 SPTBN1 91 46 0.495
35 CALM2 40 32 0.775 ISYNA1 90 70 0.767
36 SERTAD2 40 35 0.850 EIF4G1 88 71 0.795
37 GNAS 39 22 0.538 ACACA 86 84 0.965
38 MBTPS1 39 26 0.641 FLNA 85 30 0.341
39 LRRC17 36 32 0.861 STOML2 84 77 0.905
40 CCDC124 36 28 0.750 HSPA1B 84 43 0.500
41 FBXL13 36 29 0.778 KIAA1545 83 60 0.711
42 GSTO2 35 32 0.886 LOC51035 76 64 0.829
43 H3F3B 35 35 0.971 COL4A2 75 29 0.373
44 MDH2 35 27 0.743 CCDC124 74 49 0.649
45 NSFL1C 35 29 0.800 LNX1 74 45 0.595
46 RPL4 35 31 0.857 ABCA2 73 54 0.726
47 G6PC3 35 33 0.914 MMP14 73 34 0.452
48 TRIM56 34 23 0.647 EEF2 72 35 0.472
49 GPR56 34 32 0.912 AZI1 70 68 0.957
50 PUF60 33 22 0.636 SENP3 70 65 0.914
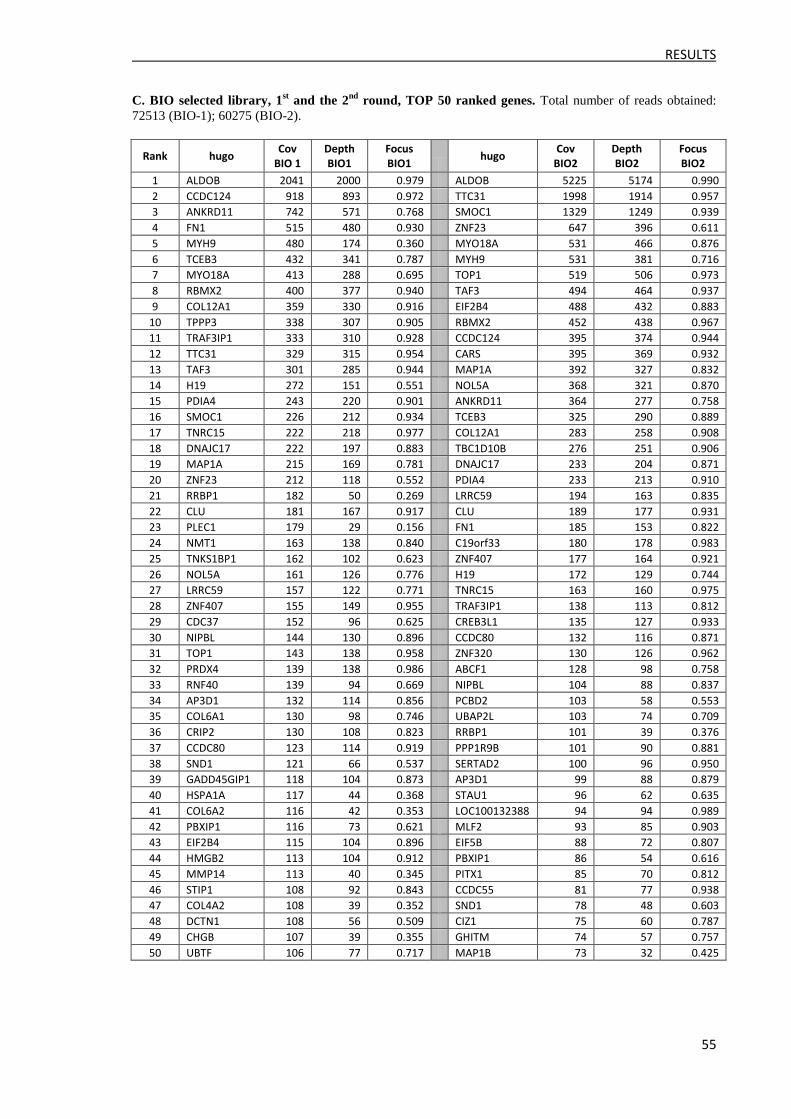
RESULTS
55
C. BIO selected library, 1st and the 2
nd round, TOP 50 ranked genes. Total number of reads obtained:
72513 (BIO-1); 60275 (BIO-2).
Rank hugo Cov
BIO 1 Depth BIO1
Focus BIO1
hugo Cov
BIO2 Depth BIO2
Focus BIO2
1 ALDOB 2041 2000 0.979 ALDOB 5225 5174 0.990
2 CCDC124 918 893 0.972 TTC31 1998 1914 0.957
3 ANKRD11 742 571 0.768 SMOC1 1329 1249 0.939
4 FN1 515 480 0.930 ZNF23 647 396 0.611
5 MYH9 480 174 0.360 MYO18A 531 466 0.876
6 TCEB3 432 341 0.787 MYH9 531 381 0.716
7 MYO18A 413 288 0.695 TOP1 519 506 0.973
8 RBMX2 400 377 0.940 TAF3 494 464 0.937
9 COL12A1 359 330 0.916 EIF2B4 488 432 0.883
10 TPPP3 338 307 0.905 RBMX2 452 438 0.967
11 TRAF3IP1 333 310 0.928 CCDC124 395 374 0.944
12 TTC31 329 315 0.954 CARS 395 369 0.932
13 TAF3 301 285 0.944 MAP1A 392 327 0.832
14 H19 272 151 0.551 NOL5A 368 321 0.870
15 PDIA4 243 220 0.901 ANKRD11 364 277 0.758
16 SMOC1 226 212 0.934 TCEB3 325 290 0.889
17 TNRC15 222 218 0.977 COL12A1 283 258 0.908
18 DNAJC17 222 197 0.883 TBC1D10B 276 251 0.906
19 MAP1A 215 169 0.781 DNAJC17 233 204 0.871
20 ZNF23 212 118 0.552 PDIA4 233 213 0.910
21 RRBP1 182 50 0.269 LRRC59 194 163 0.835
22 CLU 181 167 0.917 CLU 189 177 0.931
23 PLEC1 179 29 0.156 FN1 185 153 0.822
24 NMT1 163 138 0.840 C19orf33 180 178 0.983
25 TNKS1BP1 162 102 0.623 ZNF407 177 164 0.921
26 NOL5A 161 126 0.776 H19 172 129 0.744
27 LRRC59 157 122 0.771 TNRC15 163 160 0.975
28 ZNF407 155 149 0.955 TRAF3IP1 138 113 0.812
29 CDC37 152 96 0.625 CREB3L1 135 127 0.933
30 NIPBL 144 130 0.896 CCDC80 132 116 0.871
31 TOP1 143 138 0.958 ZNF320 130 126 0.962
32 PRDX4 139 138 0.986 ABCF1 128 98 0.758
33 RNF40 139 94 0.669 NIPBL 104 88 0.837
34 AP3D1 132 114 0.856 PCBD2 103 58 0.553
35 COL6A1 130 98 0.746 UBAP2L 103 74 0.709
36 CRIP2 130 108 0.823 RRBP1 101 39 0.376
37 CCDC80 123 114 0.919 PPP1R9B 101 90 0.881
38 SND1 121 66 0.537 SERTAD2 100 96 0.950
39 GADD45GIP1 118 104 0.873 AP3D1 99 88 0.879
40 HSPA1A 117 44 0.368 STAU1 96 62 0.635
41 COL6A2 116 42 0.353 LOC100132388 94 94 0.989
42 PBXIP1 116 73 0.621 MLF2 93 85 0.903
43 EIF2B4 115 104 0.896 EIF5B 88 72 0.807
44 HMGB2 113 104 0.912 PBXIP1 86 54 0.616
45 MMP14 113 40 0.345 PITX1 85 70 0.812
46 STIP1 108 92 0.843 CCDC55 81 77 0.938
47 COL4A2 108 39 0.352 SND1 78 48 0.603
48 DCTN1 108 56 0.509 CIZ1 75 60 0.787
49 CHGB 107 39 0.355 GHITM 74 57 0.757
50 UBTF 106 77 0.717 MAP1B 73 32 0.425
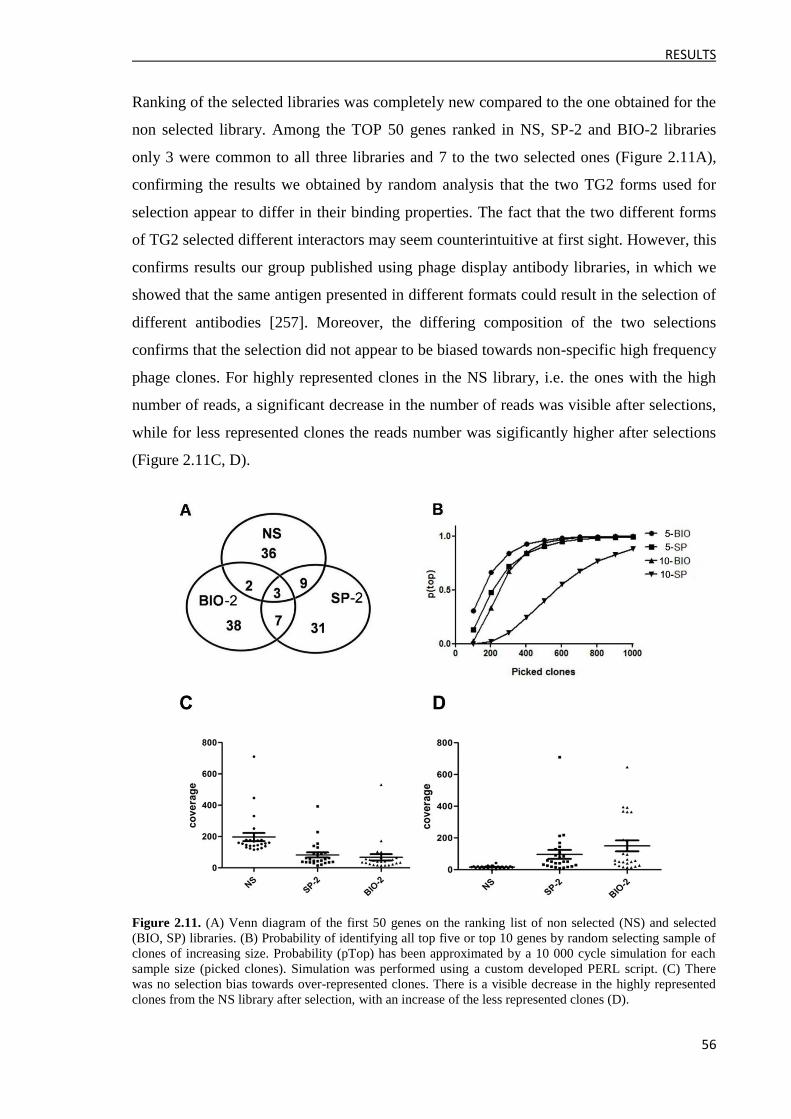
RESULTS
56
Ranking of the selected libraries was completely new compared to the one obtained for the
non selected library. Among the TOP 50 genes ranked in NS, SP-2 and BIO-2 libraries
only 3 were common to all three libraries and 7 to the two selected ones (Figure 2.11A),
confirming the results we obtained by random analysis that the two TG2 forms used for
selection appear to differ in their binding properties. The fact that the two different forms
of TG2 selected different interactors may seem counterintuitive at first sight. However, this
confirms results our group published using phage display antibody libraries, in which we
showed that the same antigen presented in different formats could result in the selection of
different antibodies [257]. Moreover, the differing composition of the two selections
confirms that the selection did not appear to be biased towards non-specific high frequency
phage clones. For highly represented clones in the NS library, i.e. the ones with the high
number of reads, a significant decrease in the number of reads was visible after selections,
while for less represented clones the reads number was sigificantly higher after selections
(Figure 2.11C, D).
Figure 2.11. (A) Venn diagram of the first 50 genes on the ranking list of non selected (NS) and selected
(BIO, SP) libraries. (B) Probability of identifying all top five or top 10 genes by random selecting sample of
clones of increasing size. Probability (pTop) has been approximated by a 10 000 cycle simulation for each
sample size (picked clones). Simulation was performed using a custom developed PERL script. (C) There
was no selection bias towards over-represented clones. There is a visible decrease in the highly represented
clones from the NS library after selection, with an increase of the less represented clones (D).
RESULTS
57
Interestingly, the top five genes for the SP-2 selection comprised only 4.9 % of the total
number of reads, while for the BIO-2, the top five genes comprised 15.4% of reads,
indicating that if 96 clones were picked at random for sequencing and/or ELISA, according
to standard techniques, the likelihood of identifying all ten of these clones would be very
low. This is represented in Figure 2.11B where the theoretical chance (p(top)) of
identifying the top 5 (or top 10) clones identified using massive sequencing is plotted
versus the number of random picked clones that would have to be assayed in order to
identify the same top ranking genes in a traditional system: to identify the top 5 genes with
95% certainty, over 500 random clones would have to be picked for each selection. This
was confirmed by our data obtained from random analyses. If polyreactive and out-of-
frame clones were considered, from around 300 randomly picked clones from SP selection,
we were able to identify only 12% of the SP-2 TOP 50 and 100% of TOP 5 clones. For
BIO selection, we identified 14% of BIO-2 TOP 50, and only 40% of TOP 5 clones.
3.2.3 Clone identification and ELISA validation
To get the total ranking for the first and the second selection cycle combined, we took the
TOP 50 selected genes from the first and the second round for each selection method, SP
and BIO, (Table 2.5.B and C) and assigned to them a score dependent on their ranking
position, with the highest ranking gene getting the highest score. By adding the score each
gene obtained in the first and the second selection cycle we calculated a new TOP 15
ranking genes for each selection (SP or BIO) based on the total score for each gene. For
example, LAP3 was found 6th
in the SP-1 cycle giving it a score of 45, while it ranked 1st
in the SP-2 cycle giving it a score of 50, obtaining a total score of 95 (Table 2.6.).
TOP 15 genes with the highest score from both cycles had only 3 genes incommon, giving
us a total of 27 different clones. Nine of these clones have already been identified by
random analysis. The remaining 18 were recovered from the corresponding selected library
by inverse PCR [258]. Sequences for each gene were acquired from the massive
sequencing data. Overlapping reads were aligned identifying the minimal epitope. Specific
primers for reverse PCR were designed mapping on that epitope, allowing us to obtain a
number of different overlapping reads for each gene (Figure 2.12.). After cloning, one to
three different sequences were recovered for each of the 18 clones.
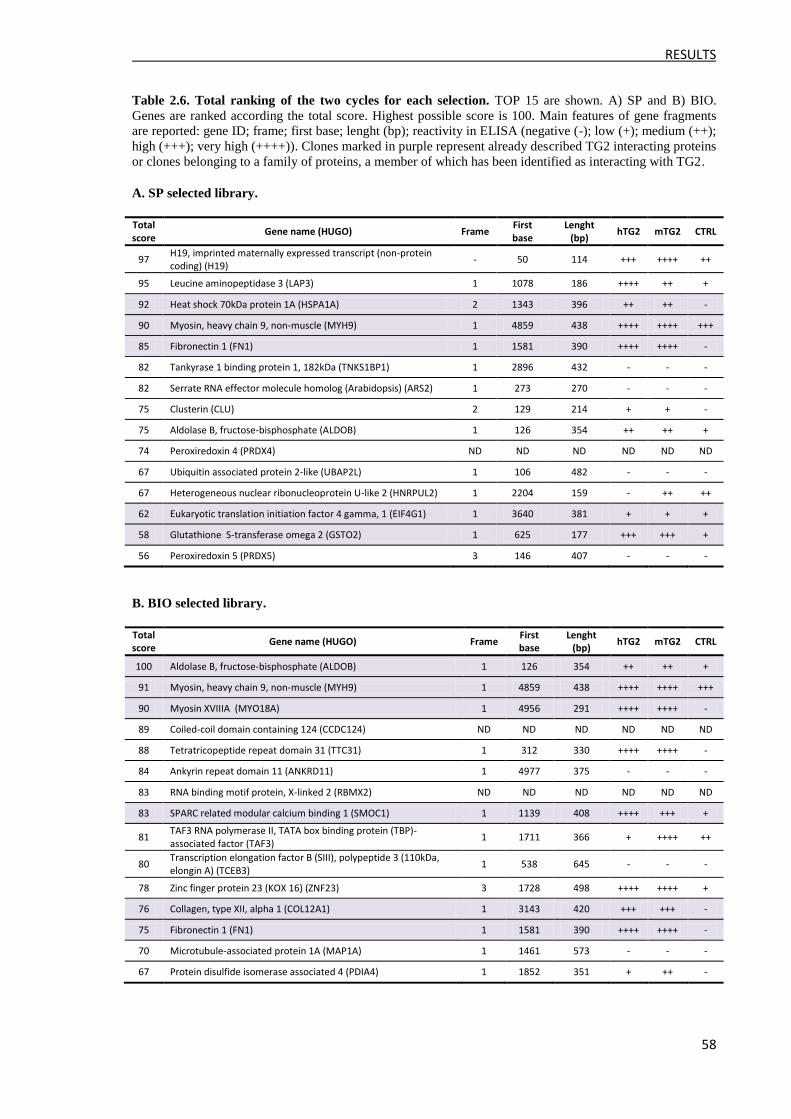
RESULTS
58
Table 2.6. Total ranking of the two cycles for each selection. TOP 15 are shown. A) SP and B) BIO.
Genes are ranked according the total score. Highest possible score is 100. Main features of gene fragments
are reported: gene ID; frame; first base; lenght (bp); reactivity in ELISA (negative (-); low (+); medium (++);
high (+++); very high (++++)). Clones marked in purple represent already described TG2 interacting proteins
or clones belonging to a family of proteins, a member of which has been identified as interacting with TG2.
A. SP selected library.
Total score
Gene name (HUGO) Frame First base
Lenght (bp)
hTG2 mTG2 CTRL
97 H19, imprinted maternally expressed transcript (non-protein coding) (H19)
- 50 114 +++ ++++ ++
95 Leucine aminopeptidase 3 (LAP3) 1 1078 186 ++++ ++ +
92 Heat shock 70kDa protein 1A (HSPA1A) 2 1343 396 ++ ++ -
90 Myosin, heavy chain 9, non-muscle (MYH9) 1 4859 438 ++++ ++++ +++
85 Fibronectin 1 (FN1) 1 1581 390 ++++ ++++ -
82 Tankyrase 1 binding protein 1, 182kDa (TNKS1BP1) 1 2896 432 - - -
82 Serrate RNA effector molecule homolog (Arabidopsis) (ARS2) 1 273 270 - - -
75 Clusterin (CLU) 2 129 214 + + -
75 Aldolase B, fructose-bisphosphate (ALDOB) 1 126 354 ++ ++ +
74 Peroxiredoxin 4 (PRDX4) ND ND ND ND ND ND
67 Ubiquitin associated protein 2-like (UBAP2L) 1 106 482 - - -
67 Heterogeneous nuclear ribonucleoprotein U-like 2 (HNRPUL2) 1 2204 159 - ++ ++
62 Eukaryotic translation initiation factor 4 gamma, 1 (EIF4G1) 1 3640 381 + + +
58 Glutathione S-transferase omega 2 (GSTO2) 1 625 177 +++ +++ +
56 Peroxiredoxin 5 (PRDX5) 3 146 407 - - -
B. BIO selected library.
Total score
Gene name (HUGO) Frame First base
Lenght (bp)
hTG2 mTG2 CTRL
100 Aldolase B, fructose-bisphosphate (ALDOB) 1 126 354 ++ ++ +
91 Myosin, heavy chain 9, non-muscle (MYH9) 1 4859 438 ++++ ++++ +++
90 Myosin XVIIIA (MYO18A) 1 4956 291 ++++ ++++ -
89 Coiled-coil domain containing 124 (CCDC124) ND ND ND ND ND ND
88 Tetratricopeptide repeat domain 31 (TTC31) 1 312 330 ++++ ++++ -
84 Ankyrin repeat domain 11 (ANKRD11) 1 4977 375 - - -
83 RNA binding motif protein, X-linked 2 (RBMX2) ND ND ND ND ND ND
83 SPARC related modular calcium binding 1 (SMOC1) 1 1139 408 ++++ +++ +
81 TAF3 RNA polymerase II, TATA box binding protein (TBP)-associated factor (TAF3)
1 1711 366 + ++++ ++
80 Transcription elongation factor B (SIII), polypeptide 3 (110kDa, elongin A) (TCEB3)
1 538 645 - - -
78 Zinc finger protein 23 (KOX 16) (ZNF23) 3 1728 498 ++++ ++++ +
76 Collagen, type XII, alpha 1 (COL12A1) 1 3143 420 +++ +++ -
75 Fibronectin 1 (FN1) 1 1581 390 ++++ ++++ -
70 Microtubule-associated protein 1A (MAP1A) 1 1461 573 - - -
67 Protein disulfide isomerase associated 4 (PDIA4) 1 1852 351 + ++ -

RESULTS
59
Figure 2.12. Rescue of cDNA clones by reverse PCR. Aligning of the overlapping reads of the same gene
identified the minimal epitope. Specific primers for reverse PCR were designed mapping on that epitope.
Sense – sense primer; anti – antisense primer.
After validation by sequencing, 14 clones were found to be in the correct reading frame
and one clone for each interacting protein was selected for analysis by phage ELISA to
validate the interaction to human and mouse TG2 and an unrelated control protein (BSA)
(Table 2.6.; Figure 2.13.). Interaction with TG2 was further validated by two independent
methods.
Figure 2.13. Reactivity to TG2 in phage ELISA for 10 selected clones recovered by massive analysis.
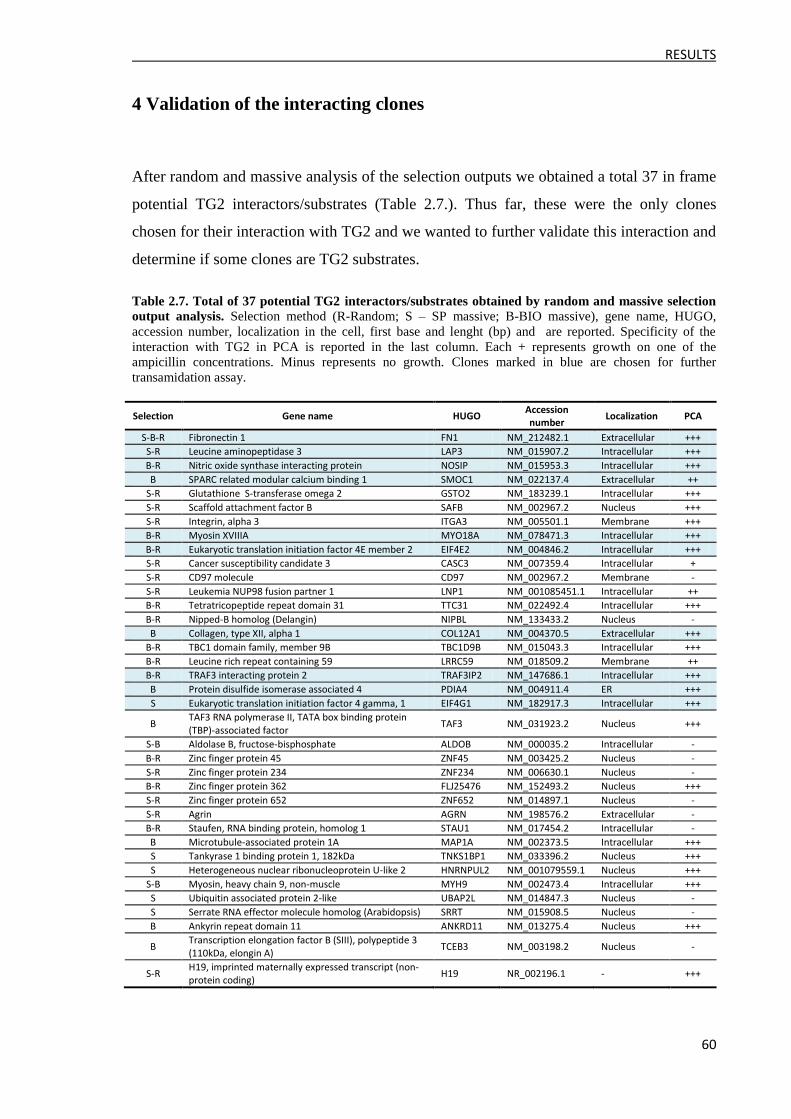
RESULTS
60
4 Validation of the interacting clones
After random and massive analysis of the selection outputs we obtained a total 37 in frame
potential TG2 interactors/substrates (Table 2.7.). Thus far, these were the only clones
chosen for their interaction with TG2 and we wanted to further validate this interaction and
determine if some clones are TG2 substrates.
Table 2.7. Total of 37 potential TG2 interactors/substrates obtained by random and massive selection
output analysis. Selection method (R-Random; S – SP massive; B-BIO massive), gene name, HUGO,
accession number, localization in the cell, first base and lenght (bp) and are reported. Specificity of the
interaction with TG2 in PCA is reported in the last column. Each + represents growth on one of the
ampicillin concentrations. Minus represents no growth. Clones marked in blue are chosen for further
transamidation assay.
Selection Gene name HUGO Accession number
Localization PCA
S-B-R Fibronectin 1 FN1 NM_212482.1 Extracellular +++
S-R Leucine aminopeptidase 3 LAP3 NM_015907.2 Intracellular +++
B-R Nitric oxide synthase interacting protein NOSIP NM_015953.3 Intracellular +++
B SPARC related modular calcium binding 1 SMOC1 NM_022137.4 Extracellular ++
S-R Glutathione S-transferase omega 2 GSTO2 NM_183239.1 Intracellular +++
S-R Scaffold attachment factor B SAFB NM_002967.2 Nucleus +++
S-R Integrin, alpha 3 ITGA3 NM_005501.1 Membrane +++
B-R Myosin XVIIIA MYO18A NM_078471.3 Intracellular +++
B-R Eukaryotic translation initiation factor 4E member 2 EIF4E2 NM_004846.2 Intracellular +++
S-R Cancer susceptibility candidate 3 CASC3 NM_007359.4 Intracellular +
S-R CD97 molecule CD97 NM_002967.2 Membrane -
S-R Leukemia NUP98 fusion partner 1 LNP1 NM_001085451.1 Intracellular ++
B-R Tetratricopeptide repeat domain 31 TTC31 NM_022492.4 Intracellular +++
B-R Nipped-B homolog (Delangin) NIPBL NM_133433.2 Nucleus -
B Collagen, type XII, alpha 1 COL12A1 NM_004370.5 Extracellular +++
B-R TBC1 domain family, member 9B TBC1D9B NM_015043.3 Intracellular +++
B-R Leucine rich repeat containing 59 LRRC59 NM_018509.2 Membrane ++
B-R TRAF3 interacting protein 2 TRAF3IP2 NM_147686.1 Intracellular +++
B Protein disulfide isomerase associated 4 PDIA4 NM_004911.4 ER +++
S Eukaryotic translation initiation factor 4 gamma, 1 EIF4G1 NM_182917.3 Intracellular +++
B TAF3 RNA polymerase II, TATA box binding protein (TBP)-associated factor
TAF3 NM_031923.2 Nucleus +++
S-B Aldolase B, fructose-bisphosphate ALDOB NM_000035.2 Intracellular -
B-R Zinc finger protein 45 ZNF45 NM_003425.2 Nucleus -
S-R Zinc finger protein 234 ZNF234 NM_006630.1 Nucleus -
B-R Zinc finger protein 362 FLJ25476 NM_152493.2 Nucleus +++
S-R Zinc finger protein 652 ZNF652 NM_014897.1 Nucleus -
S-R Agrin AGRN NM_198576.2 Extracellular -
B-R Staufen, RNA binding protein, homolog 1 STAU1 NM_017454.2 Intracellular -
B Microtubule-associated protein 1A MAP1A NM_002373.5 Intracellular +++
S Tankyrase 1 binding protein 1, 182kDa TNKS1BP1 NM_033396.2 Nucleus +++
S Heterogeneous nuclear ribonucleoprotein U-like 2 HNRNPUL2 NM_001079559.1 Nucleus +++
S-B Myosin, heavy chain 9, non-muscle MYH9 NM_002473.4 Intracellular +++
S Ubiquitin associated protein 2-like UBAP2L NM_014847.3 Nucleus -
S Serrate RNA effector molecule homolog (Arabidopsis) SRRT NM_015908.5 Nucleus -
B Ankyrin repeat domain 11 ANKRD11 NM_013275.4 Nucleus +++
B Transcription elongation factor B (SIII), polypeptide 3 (110kDa, elongin A)
TCEB3 NM_003198.2 Nucleus -
S-R H19, imprinted maternally expressed transcript (non-protein coding)
H19 NR_002196.1 - +++

RESULTS
61
In order to confirm the results obtained with phage ELISA we used the protein
complementation assay (PCA) (7). TG2 substrate preference was assessed by incorporation
of biotinylated pentylamine in TG2 reaction.
4.1 Validation by the protein complementation assay
Phage display of polypeptides is a reliable method for the identification of antigens and
binding structures. Although it is considered to be highly specific, it generally requires
confirmation of the binding using alternative methods. In this case, we used the protein
complementation assay, a method previously used in our laboratory [259].
All 37 selected interactors were cloned into the chloramphenicol resistant p vector in
frame with the C-terminal fragment (aa 196-286) of TEM-1 β-lactamase. hTG2 gene was
fused to the N-terminal fragment (aa 1-195) in kanamycin resistant pα vector (Figure
2.14.). A stable E. coli bacterial clone expressing TG2 in the pα was transformed with
individual p vectors expressing selected interactors.
Figure 2.14. Protein complementation assay. hTG2 gene was fused to the N-terminal fragment of TEM-1
β-lactamase (pα vector). Selected interactors are cloned to he C-terminal fragment (p vector). When TG2
interacts with the selected peptide β-lactamase activity is reconstituted and the clone gains resistance to
ampicillin. IP – interacting protein.
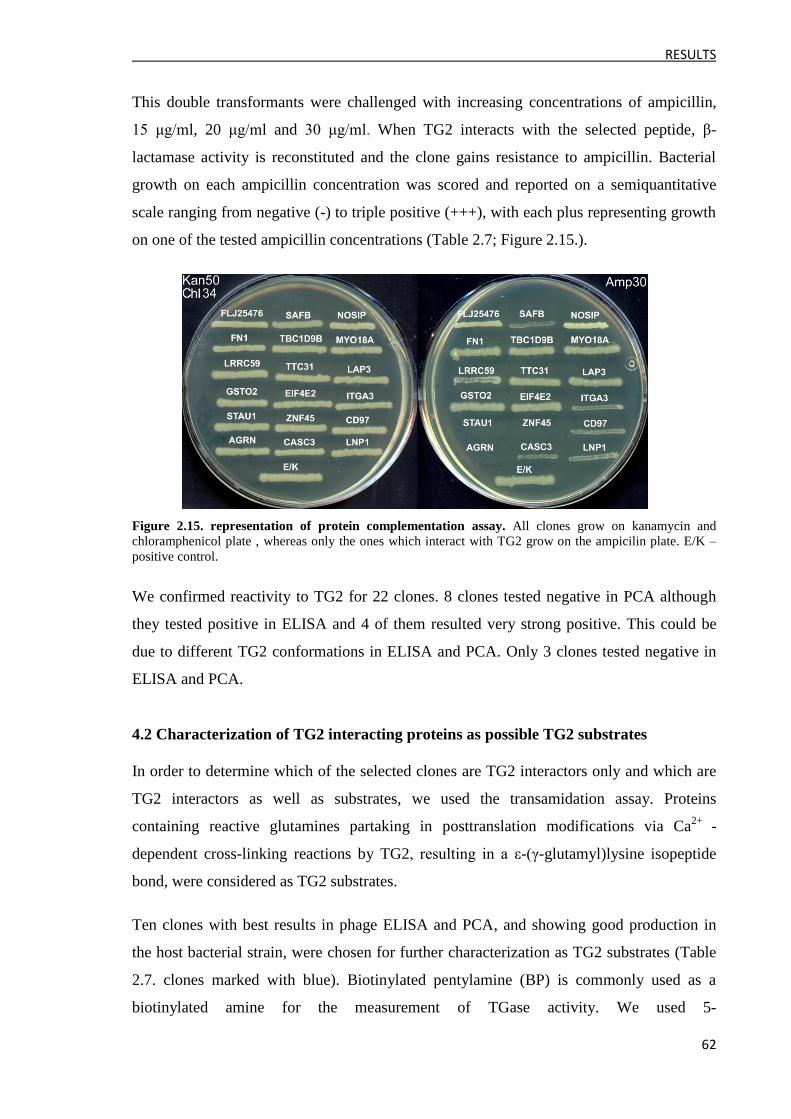
RESULTS
62
This double transformants were challenged with increasing concentrations of ampicillin,
15 μg/ml, 20 μg/ml and 30 μg/ml. When TG2 interacts with the selected peptide, β-
lactamase activity is reconstituted and the clone gains resistance to ampicillin. Bacterial
growth on each ampicillin concentration was scored and reported on a semiquantitative
scale ranging from negative (-) to triple positive (+++), with each plus representing growth
on one of the tested ampicillin concentrations (Table 2.7; Figure 2.15.).
Figure 2.15. representation of protein complementation assay. All clones grow on kanamycin and
chloramphenicol plate , whereas only the ones which interact with TG2 grow on the ampicilin plate. E/K –
positive control.
We confirmed reactivity to TG2 for 22 clones. 8 clones tested negative in PCA although
they tested positive in ELISA and 4 of them resulted very strong positive. This could be
due to different TG2 conformations in ELISA and PCA. Only 3 clones tested negative in
ELISA and PCA.
4.2 Characterization of TG2 interacting proteins as possible TG2 substrates
In order to determine which of the selected clones are TG2 interactors only and which are
TG2 interactors as well as substrates, we used the transamidation assay. Proteins
containing reactive glutamines partaking in posttranslation modifications via Ca2+
-
dependent cross-linking reactions by TG2, resulting in a ε-(γ-glutamyl)lysine isopeptide
bond, were considered as TG2 substrates.
Ten clones with best results in phage ELISA and PCA, and showing good production in
the host bacterial strain, were chosen for further characterization as TG2 substrates (Table
2.7. clones marked with blue). Biotinylated pentylamine (BP) is commonly used as a
biotinylated amine for the measurement of TGase activity. We used 5-
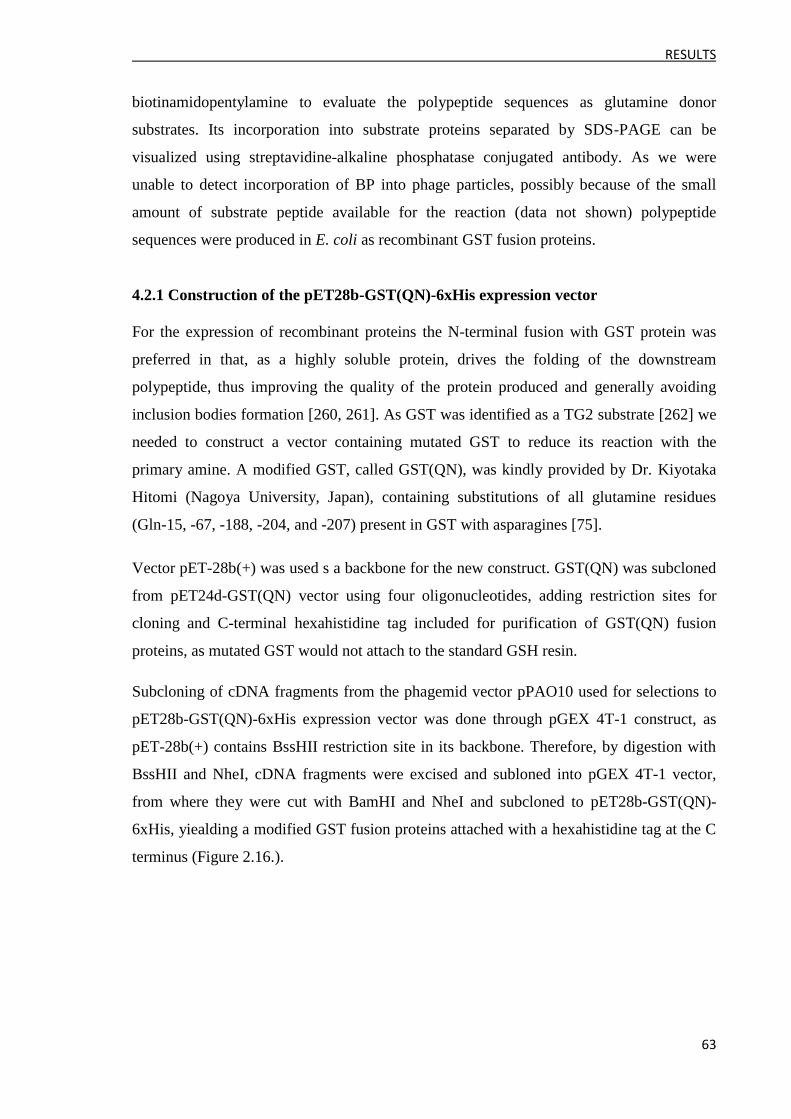
RESULTS
63
biotinamidopentylamine to evaluate the polypeptide sequences as glutamine donor
substrates. Its incorporation into substrate proteins separated by SDS-PAGE can be
visualized using streptavidine-alkaline phosphatase conjugated antibody. As we were
unable to detect incorporation of BP into phage particles, possibly because of the small
amount of substrate peptide available for the reaction (data not shown) polypeptide
sequences were produced in E. coli as recombinant GST fusion proteins.
4.2.1 Construction of the pET28b-GST(QN)-6xHis expression vector
For the expression of recombinant proteins the N-terminal fusion with GST protein was
preferred in that, as a highly soluble protein, drives the folding of the downstream
polypeptide, thus improving the quality of the protein produced and generally avoiding
inclusion bodies formation [260, 261]. As GST was identified as a TG2 substrate [262] we
needed to construct a vector containing mutated GST to reduce its reaction with the
primary amine. A modified GST, called GST(QN), was kindly provided by Dr. Kiyotaka
Hitomi (Nagoya University, Japan), containing substitutions of all glutamine residues
(Gln-15, -67, -188, -204, and -207) present in GST with asparagines [75].
Vector pET-28b(+) was used s a backbone for the new construct. GST(QN) was subcloned
from pET24d-GST(QN) vector using four oligonucleotides, adding restriction sites for
cloning and C-terminal hexahistidine tag included for purification of GST(QN) fusion
proteins, as mutated GST would not attach to the standard GSH resin.
Subcloning of cDNA fragments from the phagemid vector pPAO10 used for selections to
pET28b-GST(QN)-6xHis expression vector was done through pGEX 4T-1 construct, as
pET-28b(+) contains BssHII restriction site in its backbone. Therefore, by digestion with
BssHII and NheI, cDNA fragments were excised and subloned into pGEX 4T-1 vector,
from where they were cut with BamHI and NheI and subcloned to pET28b-GST(QN)-
6xHis, yiealding a modified GST fusion proteins attached with a hexahistidine tag at the C
terminus (Figure 2.16.).
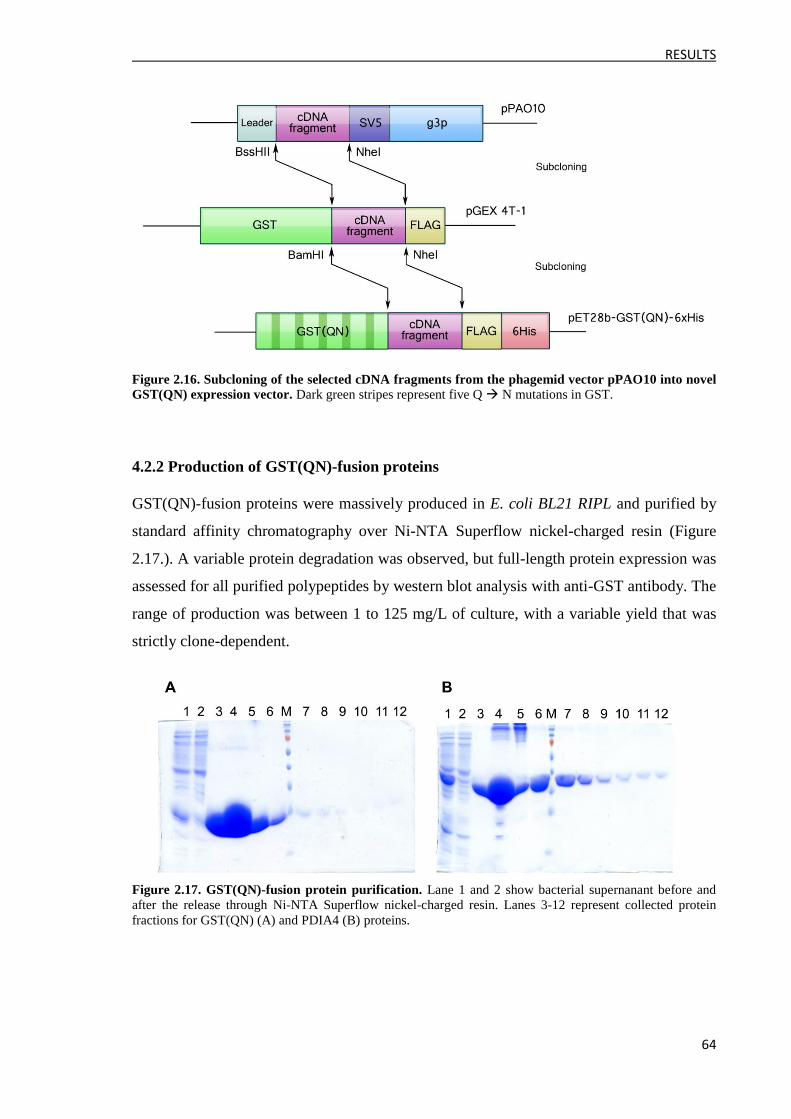
RESULTS
64
Figure 2.16. Subcloning of the selected cDNA fragments from the phagemid vector pPAO10 into novel
GST(QN) expression vector. Dark green stripes represent five Q N mutations in GST.
4.2.2 Production of GST(QN)-fusion proteins
GST(QN)-fusion proteins were massively produced in E. coli BL21 RIPL and purified by
standard affinity chromatography over Ni-NTA Superflow nickel-charged resin (Figure
2.17.). A variable protein degradation was observed, but full-length protein expression was
assessed for all purified polypeptides by western blot analysis with anti-GST antibody. The
range of production was between 1 to 125 mg/L of culture, with a variable yield that was
strictly clone-dependent.
Figure 2.17. GST(QN)-fusion protein purification. Lane 1 and 2 show bacterial supernanant before and
after the release through Ni-NTA Superflow nickel-charged resin. Lanes 3-12 represent collected protein
fractions for GST(QN) (A) and PDIA4 (B) proteins.
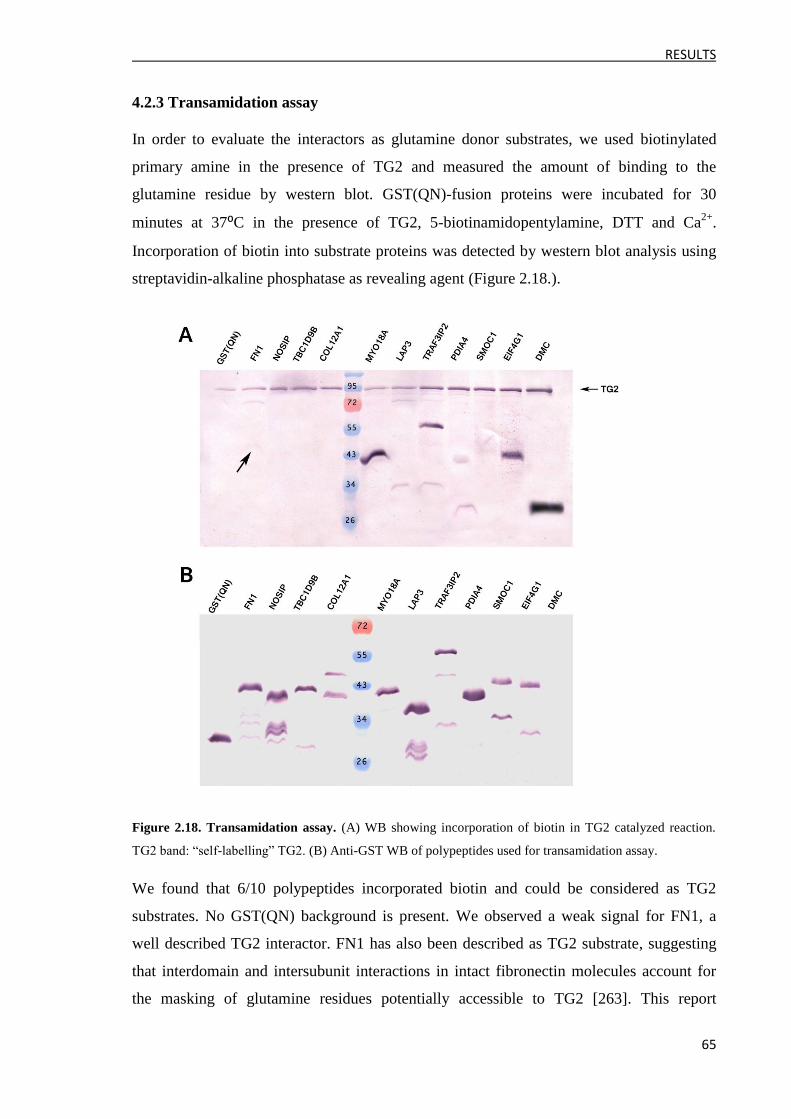
RESULTS
65
4.2.3 Transamidation assay
In order to evaluate the interactors as glutamine donor substrates, we used biotinylated
primary amine in the presence of TG2 and measured the amount of binding to the
glutamine residue by western blot. GST(QN)-fusion proteins were incubated for 30
minutes at 37⁰C in the presence of TG2, 5-biotinamidopentylamine, DTT and Ca2+
.
Incorporation of biotin into substrate proteins was detected by western blot analysis using
streptavidin-alkaline phosphatase as revealing agent (Figure 2.18.).
Figure 2.18. Transamidation assay. (A) WB showing incorporation of biotin in TG2 catalyzed reaction.
TG2 band: “self-labelling” TG2. (B) Anti-GST WB of polypeptides used for transamidation assay.
We found that 6/10 polypeptides incorporated biotin and could be considered as TG2
substrates. No GST(QN) background is present. We observed a weak signal for FN1, a
well described TG2 interactor. FN1 has also been described as TG2 substrate, suggesting
that interdomain and intersubunit interactions in intact fibronectin molecules account for
the masking of glutamine residues potentially accessible to TG2 [263]. This report
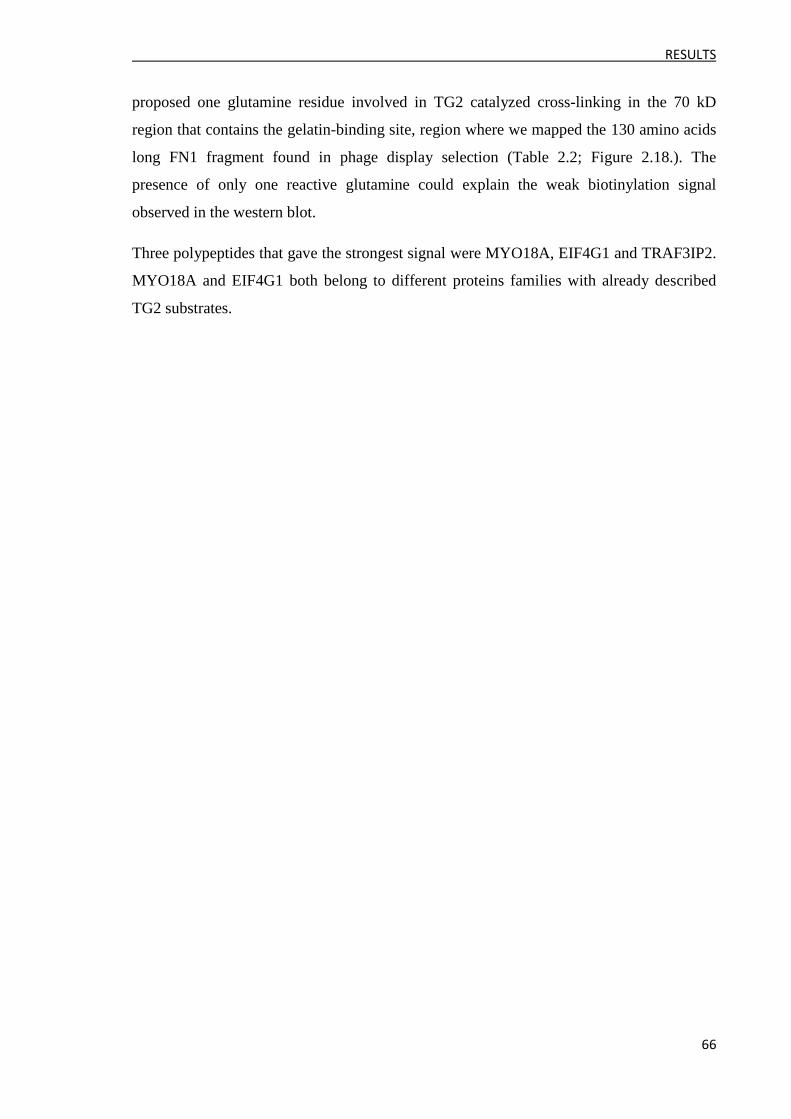
RESULTS
66
proposed one glutamine residue involved in TG2 catalyzed cross-linking in the 70 kD
region that contains the gelatin-binding site, region where we mapped the 130 amino acids
long FN1 fragment found in phage display selection (Table 2.2; Figure 2.18.). The
presence of only one reactive glutamine could explain the weak biotinylation signal
observed in the western blot.
Three polypeptides that gave the strongest signal were MYO18A, EIF4G1 and TRAF3IP2.
MYO18A and EIF4G1 both belong to different proteins families with already described
TG2 substrates.
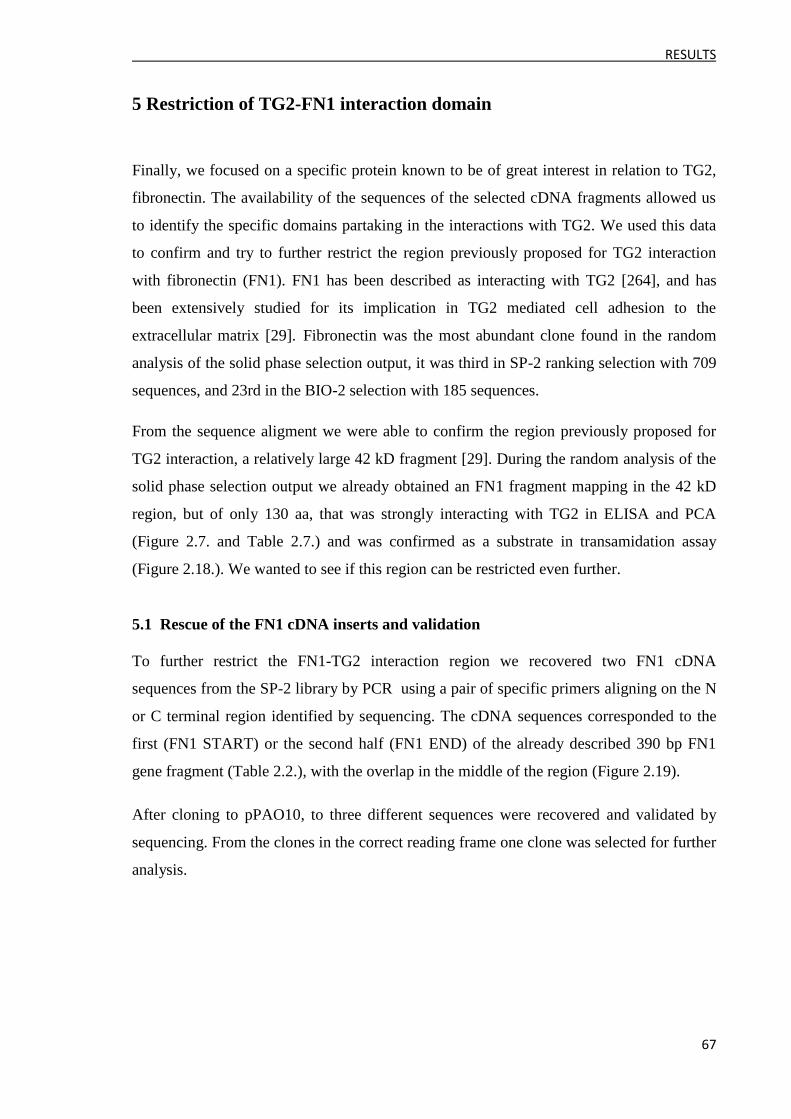
RESULTS
67
5 Restriction of TG2-FN1 interaction domain
Finally, we focused on a specific protein known to be of great interest in relation to TG2,
fibronectin. The availability of the sequences of the selected cDNA fragments allowed us
to identify the specific domains partaking in the interactions with TG2. We used this data
to confirm and try to further restrict the region previously proposed for TG2 interaction
with fibronectin (FN1). FN1 has been described as interacting with TG2 [264], and has
been extensively studied for its implication in TG2 mediated cell adhesion to the
extracellular matrix [29]. Fibronectin was the most abundant clone found in the random
analysis of the solid phase selection output, it was third in SP-2 ranking selection with 709
sequences, and 23rd in the BIO-2 selection with 185 sequences.
From the sequence aligment we were able to confirm the region previously proposed for
TG2 interaction, a relatively large 42 kD fragment [29]. During the random analysis of the
solid phase selection output we already obtained an FN1 fragment mapping in the 42 kD
region, but of only 130 aa, that was strongly interacting with TG2 in ELISA and PCA
(Figure 2.7. and Table 2.7.) and was confirmed as a substrate in transamidation assay
(Figure 2.18.). We wanted to see if this region can be restricted even further.
5.1 Rescue of the FN1 cDNA inserts and validation
To further restrict the FN1-TG2 interaction region we recovered two FN1 cDNA
sequences from the SP-2 library by PCR using a pair of specific primers aligning on the N
or C terminal region identified by sequencing. The cDNA sequences corresponded to the
first (FN1 START) or the second half (FN1 END) of the already described 390 bp FN1
gene fragment (Table 2.2.), with the overlap in the middle of the region (Figure 2.19).
After cloning to pPAO10, to three different sequences were recovered and validated by
sequencing. From the clones in the correct reading frame one clone was selected for further
analysis.
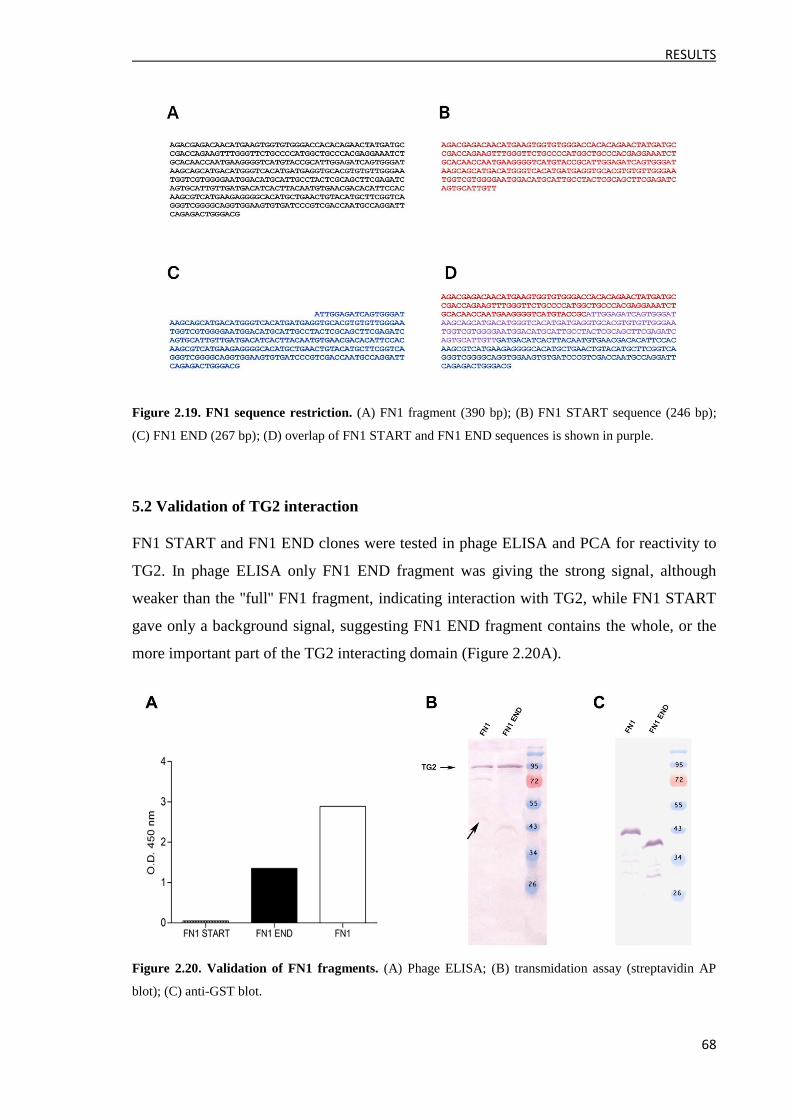
RESULTS
68
Figure 2.19. FN1 sequence restriction. (A) FN1 fragment (390 bp); (B) FN1 START sequence (246 bp);
(C) FN1 END (267 bp); (D) overlap of FN1 START and FN1 END sequences is shown in purple.
5.2 Validation of TG2 interaction
FN1 START and FN1 END clones were tested in phage ELISA and PCA for reactivity to
TG2. In phage ELISA only FN1 END fragment was giving the strong signal, although
weaker than the ''full'' FN1 fragment, indicating interaction with TG2, while FN1 START
gave only a background signal, suggesting FN1 END fragment contains the whole, or the
more important part of the TG2 interacting domain (Figure 2.20A).
Figure 2.20. Validation of FN1 fragments. (A) Phage ELISA; (B) transmidation assay (streptavidin AP
blot); (C) anti-GST blot.
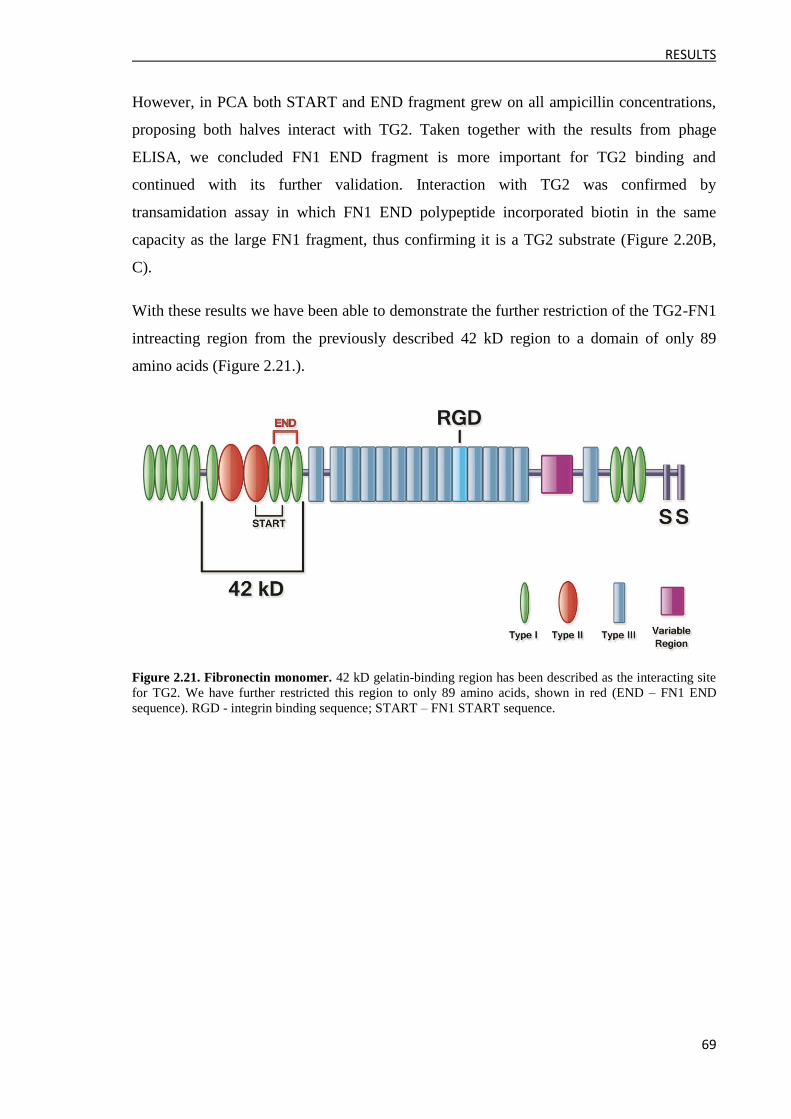
RESULTS
69
However, in PCA both START and END fragment grew on all ampicillin concentrations,
proposing both halves interact with TG2. Taken together with the results from phage
ELISA, we concluded FN1 END fragment is more important for TG2 binding and
continued with its further validation. Interaction with TG2 was confirmed by
transamidation assay in which FN1 END polypeptide incorporated biotin in the same
capacity as the large FN1 fragment, thus confirming it is a TG2 substrate (Figure 2.20B,
C).
With these results we have been able to demonstrate the further restriction of the TG2-FN1
intreacting region from the previously described 42 kD region to a domain of only 89
amino acids (Figure 2.21.).
Figure 2.21. Fibronectin monomer. 42 kD gelatin-binding region has been described as the interacting site
for TG2. We have further restricted this region to only 89 amino acids, shown in red (END – FN1 END
sequence). RGD - integrin binding sequence; START – FN1 START sequence.
DISCUSSION
70
DISCUSSION
Background
After the completion of the Human Genome Project, the research focus has shifted to the
''proteome'', the entire set of proteins expressed by the genome. Proteins regulate the vast
majority of cellular processes by their ability to communicate with each other and to
assemble into larger functional units. However, proteome is not a constant entity, it differs
from cell to cell, and constantly changes through biochemical interactions with the genome
and the environment. Protein-protein interactions are central to any cellular process. Many
of them are transient, and others occur only in certain cellular contexts or at particular
times in development. Therefore, the systematic analysis of these interactions, or the so
called ''interactome'', is fundamental for the understanding of protein function and the
functional organization of the cell as a whole. Moreover, identifying the interactome is
particularly important in linking proteins to disease pathways and the identification of
novel drug targets. For comprehension of this complex and dynamic network, sensitive
proteomic tools with high multiplexed capacity are required.
The aim of this study was the development of a proteomic methodology allowing the
simultaneous analysis of a high number of molecules, thus providing large sets of data in a
sensitive and reproducible manner, and applying this methodology to deciphering a
complex interaction network of a multifunctional protein tissuse transglutaminase (TG2).
TG2 is an ubiqiutous enzyme whose biological significance and a vast variety of biological
functions are still far from being completely elucidated. TG2 has been identifed as an
important player in many cellular functions as cell attachement and migration, wound
healing, angiogenesis, apoptosis and cell and transmembrane signaling. As a consequence
of this diverse set of functions, TG2 has also been implicated in numerous pathological
states, including a great number of neurodegenerative disorders where its activity is found
to be upregulated in selectively vulnerable brain regions. Different proteins forming the
inclusion bodies characteristic of the diseases are good TG2 good substates, modified by
the enzyme. While a substantial number TG2 substrates have been described, only a
DISCUSSION
71
limited number of TG2 interactors has been identified. It is therefore clear that an approach
attempting to systematically identify TG2 protein binding partners is very much needed,
and this study provides a first step in this direction.
In proteomics, access to DNA fragments encoding open reading frames (ORFs) is required
for large scale functional analysis of gene products. This can be obtained by direct or
random approach. In direct approach specific primers for each gene are used, while in
random approach numerous random open reading frame fragments from each gene are
created. This large collections of ORFs can be obtained by the phage display technique,
with subsequent selection of the corresponding polypeptides for a desired characteristic,
generally the ability to bind a ligand, and a direct link of the selected polypeptide with its
gene.
Performing successive rounds of selection leads to strong enrichment of specific proteins
in a background of millions of aspecific clones. For a complex protein, like TG2, this could
mean the selection of hundreds of reactive peptides, each with a specific function. For this
reason, systems allowing the analysis of all the components are required.
In this study we developed a novel approach in which the number of screened clones could
be increased by several orders of magnitude, representing a major advance in the field.
Creation of a large and functional cDNA library
The problem in cDNA library creation is the presence of the large number of non-
functional clones. The intrinsic presence of stop codons in cDNA fragments, and the fact
that display systems need the fusion proteins to maintain the link between genotype and
phenotype, implies that only cDNA encoding ORF fragments can give polypeptides which
are correctly exposed on the phage surface. Cloning of random fragments in the phagemid
vector will end in 1:18 ratio between displaying and non displaying phages. In the case of
displaying the proteins encoded by eukaryotic cDNA, this problems is even worsened by
the presence of 5‟ and 3‟ untranslated regions that may unknowingly contain open reading
frames, as well as unspliced introns. Selective advantage in growth and production of such
non-functional clones can rapidly overtake a selection introducing a strong bias in the
management of the libraries that could invalidate its usefulness.
DISCUSSION
72
This problem was addressed by the development of the pPAO display system [245] that
enables the selection of in frame clones within a phage display context, in such a way that
they are amenable to subsequent selection or screening. Massive sequencing of the filtered
cDNA library demonstrated good diversity of the library, containing over 10 000 different
genes, effective normalization (Figure 2.2.) and filtering, with over 91% of clones having
3N sequences that could be correctly expressed on the phage surface. Not only did this data
confirm pPAO10 as a vector with a strong bias for open reading frames corresponding to
real genes rather than ORFs of no biological significance, indicating that the β-lactamase
gene is able to function as a folding reporter [265], but it also confirmed the value of the
cDNA library used in this work as a very powerful tool for interactome screening.
Selection of reactive clones
The primary aim of this study was the identification of novel putative substrates and
interactors of TG2. The selection and enrichment techniques provided by the phage display
system have been extensively used for this purpose, and several strategies have been
developed to improve and apply these systems to the analysis of the complex TG2
inreactome.
Specifically, two main methodologies have been designed, developed and optimized: (i)
the selection step with magnetic beads functionalized with biotinylated TG2, and used to
isolate reactive phage clones; (ii) deep DNA sequencing strategy, enabling us to follow the
progress of the selection and analyze the whole output in a comprehensive manner, as well
as identify the domains responsible for the interactions directly in a first screen.
Selection on two different forms of TG2 has proven to be successful in terms of selecting
different sets of putative interactor and substrates, which confirmed the previous
observations we published using phage display antibody libraries where we showed that
the same antigen presented in different formats could result in the selection of different
antibodies [257]. The advantage of using phage display is that the selection of binding
polypeptides leads at the same time to the isolation of the corresponding gene, allowing its
manipulation and engineering and all downstream applications described in this work.
DISCUSSION
73
Although the main focus of this study was the TG2 interactome, this methodologies are relevant for
any study requiring the analysis of complex processes, involving high numbers of samples
and analytes, either immoblized on a solid surface or used in solution.
Multiplexed analysis by massive sequencing
Massive 454 deep sequencing is a novel approach for a large scale characterization of
cDNA phage display libraries and analysis of protein-protein interactions. Next generation
sequencing is an emerging technology. When it officially appeared in 2005 the aim was to
facilitate genome sequencing through its dramatic increase in throughput, but over time a
broad range of applications with novel uses, beyond its original purpose, have been
developed. Recent advances in 454-technology reduced the bias related to fragments
length, thus making the massive approach proposed within this work the elective tool for a
deep and informative screening of phage display selected libraries.
We applied massive sequencing first to characterize the cDNA phage display library, and
subsequently to identify the proteins interacting with TG2. The purpose was to follow the
progress of the selection and analyze the whole output in a comprehensive manner, rather
than performing random clone picking and ELISA. Among the available deep sequencing
systems, 454 pyrosequencing [266] is the only one that is suitable for this approach due to
the long reads that can be achieved: up to 450 bp per sequence and a total of over 1 million
reads per run with the recently introduced Titanium system.
The main advantages given by massive sequencing are: (i) analysis of the whole output of
selection cycles, instead of limiting the analysis to a few hundred clones (requireing time-
consuming procedures); (ii) observing the progressive enrichment of clones in selections,
thus allowing to evaluate the quality of the procedure; (iii) identification of selected
proteins, or even epitopes, and simple rescue by inverse PCR.
Identification of novel putative TG2 interacting proteins
A total of 37 in frame clones have been identified and characterized, while a more detailed
analysis of many of the other selected gene fragments will likely identify many other TG2
binding partners. A certain number of non genic ORFs has also been selected (Table 2.3.;
DISCUSSION
74
Figure 2.8.). These clones, termed mimotopes, are structures mimicking linear or
conformational epitopes and they could have biological roles [267].
Some of the isolated proteins have already been described as either directly interacting
with TG2, or as belonging to a family of proteins, a member of which has been identified
as interacting with TG2, thus confirming the efficacy of the approach. Glutathione S-
transferase omega 2 (GSTO2) is a part of a family of enzymes that play an important role
in detoxification by catalyzing the conjugation of many hydrophobic and electrophilic
compounds with reduced glutathione. Glutathione S-transferase P was identified as a TG2
binding partner in immunoprecipitation experiments [262]. It has been reported that
transglutaminase cross-links myosin heads to actin. We have identified two members of
the myosin superfamily, ATP-dependent motor proteins. One already reported, myosin
heavy polypeptide 9 (MYH9), that has been recently described as a novel class of signal
transducer, mediating the activation of TG2/PLC-δ1 pathway [268], and the other a novel
TG2 substrate, myosin XVIIIA (MYO18A).
Several eukaryotic translation initiation factors have been identified in the selection,
implaying an important role of TG2 in protein synthesis. It was previously reported that
EIF5A, a cellular partner of HIV Rev protein, which is essential for HIV replication in
immune-competent cells [269], is a TG2 binding partner, and we have confirmed that
EIF4G1 is a novel TG2 substrate (Figure 2.18A). Secreted modular calcium-binding 1
(SMOC1), recently found to be an important positive regulator of osteoblast differentiation
[270], can be considered as a novel TG2 interactor. SMOC1, a member of the BM-
40/SPARC family of matricellular proteins thought to influence the growth factor
signaling, migration, proliferation, and angiogenesis [271], is found in a wide variety of
tissues and is often associated with all layers of the basement membrane. Another member
of the same family, SPARC, has been reported as cross-linked by TG2 in differentiating
cartilage, thus stabilizing the matrix [272].
Considering the important role TG2 has in stabilizing ECM, and a key role in cell
attachment and spreading, another three previously described ECM TG2 binding proteins
have been identified in our study. First is fibronectin (FN1), well described TG2 interactor
and substrate, as is confirmed by our research (Figure 2.18A). High affinity binding site of
TG2 for fibronectin has been localized to the first seven N-terminal amino acids [273],
with this binding being independent of the enzyme's cross-linking activity. Deletion od this
DISCUSSION
75
N-terminal β sandwich domain abolishes binding of TG2 to FN1 and prevents its cell-
surface localization, suggesting that the fibronectin-binding site is not only required for
association of the enzyme with the cell surface, but it also constitutes a discriminatory
signal for efficient export of the enzyme into the extracellular environment [34]. In a
parallel study we have confirmed the loss of TG2-FN1 interaction in phage ELISA when
TG2 N-terminal deletion mutant was used (data not shown). TG2 binds in vitro with high
afinity to 42 kD gelatin binding region of FN1 [274]. We were able to confirm and further
restrict the size of that region to only 89 amino acids (Figures 2.20, 2.21.), confirming the
value of obtaining multiple sequences for each interacting protein [229]. TG2 is
functioning as an integrin-associated adhesion coreceptor for fibronectin promoting cell
adhesion and spreading [29] and integrin (ITGA3) is the another ECM protein we
identified, with the last one being collagen (COL12A1), the most abundant ECM protein.
On this basis, the other proteins may be considered to belong to a novel class of putative
TG2 binding partners that could be added to the fast-growing TG2 TRANSDAB database
[66]. One of these proteins is nitric oxide synthase interacting protein (NOSIP), a novel
type of modulator of endothelial nitric oxide synthases (eNOS) and a novel TG2 interactor
(Figure 2.18A). Nitric oxide (NO) is an important regulator in the immune, cardiovascular
and nervous systems that has been implicated in numerous pathophysiologic states [275].
NO is synthesized in mammalian cells by a family of three NO synthases (NOS) isoforms:
neuronal NOS (nNOS, NOS1) is expressed mainly in neuronal tissues and skeletal muscle,
inducible NOS (iNOS, NOS2) is present in many cell types and endothelial NOS (eNOS,
NOS3) present, among others, in vascular endothelial cells, cardiac myocytes, blood
platelets and hippocampus [275]. NOSIP specifically binds to the carboxylterminal region
of eNOS oxygenase domain. Overexpression of NOSIP leads to inhibition of NO synthase
activity and redistribution of eNOS between cellular compartments [276]. Recently it has
been shown that NOSIP also interacts with nNOS in rat brain in vivo, by binding to its N-
terminal region and regulating NO production in the nervous system by modulating the
localization and activity of nNOS [277]. In parallel experiments we identified NOSIP as a
possible autoantigen in celiac disease (CD).
Another putative TG2 interactor/substrate possibly involved in CD is scaffold attachment
factor B (SAFB) (Table 2.2., 2.7.) a DNA-binding protein that binds to ZO-2, Zonula
occludens protein (or tight junction protein 2) involved in the organization of epithelial and
endothelial intercellular junctions. Zonulin expression is upregulated in CD leading to a
DISCUSSION
76
sustained increase in intestinal permeability to macromolecules, including gliadin, from the
lumen to the lamina propria [278]. SAFB is also observed as a possible tumor suppressor
[279, 280]. Yet another newly identified TG2 substrate is involved in tumor development.
Leucine aminopeptidase 3 (LAP3) belongs to a familiy of leucine aminopeptidases (LAPs),
widely distributed zinc-containing cytosolic exopeptidases that catalyze the hydrolysis of
N-terminal peptide bond of polypeptide chains, most effectively of leucyl substrates [281].
Their altered activity has been observed in a number of diseases such as cancer, eye lens
ageing, cataract and early events of HIV infection [282].
It has been shown TG2 expression is upregulated in several drug-resistant and metastatic
cancer cells and cell lines [111, 112] yielding an anti-apoptotic response by activation of
the nuclear factor- κB (NF-κB) pathway [42, 43]. Rel/NF-κB proteins promote the survival
of cells following DNA damage and play a role in neoplastic transformation by inhibiting
p53 gene expression [283]. Under normal circumstances, NF-κB is present in the cell in an
inactive form and associates itself by noncovalent association with an inhibitor protein,
IκBα [284]. In response to various stimuli, such as inflammatory cytokines, growth factors,
DNA-damaging agents, bacterial components and viral proteins, IκBα dissociates and
transiently activates NF-κB that can then transactivate a large number of target genes
involved in cell growth, apoptosis inhibition, cell adhesion, and cell migration [285]. TG2
constitutively activates NF-κB by cross-linking IκBα. This leads to its polymerization and
displacement out of the complex with NF-κB [42, 43]. A novel TG2 substrate we have
identified, TRAF3 interacting protein 2 (TRAF3IP2), interacts with TRAF proteins and
IκB to activate NF-κB [286] and could possibly play a role in TG2 apoptotic response.
As discussed in Chapter 2, TG2 protein disulphide isomerase (PDI) activity has been
proposed TG2 [52]. Novel TG2 substrate protein disulfide isomerase associated 4 (PDIA4)
belongs to the family of protein disulfide isomerases (PDIs) which catalyse disulfide bond
formation, reduction or isomerization of newly synthesized proteins in the ER lumen. They
also function as molecular chaperones that are critical elements in a quality-control system
for the correct protein folding in response to ER stress such as disruption of Ca2+
homoeostasis and inhibition of protein glycosylation [53-55]. Although most of PDIA4
resides in the ER, as a part of a complex of chaperones [287], part of it was detected at the
plasma membrane and co-localized with a transmembrane protein Nox1 [288], a protein
belonging to NADPH oxidase family involved in generation of reactive oxygen species
(ROS), notably superoxide anion and H2O2, generated in response to a variety of
DISCUSSION
77
extracellular stimuli including cytokines, peptide growth factors and hormones. ROS play
roles as signalling molecules in physiological processes such as host defence, regulation of
vascularization, oxygen sensing, apoptosis and cell transformation [289].
Conclusions
Combining cDNA fragment phage display library with massive 454 deep sequencing we
have shown the power that the application of massive 454 deep sequencing can bring to
library analysis, and in particular, when it relates to the analysis of protein-protein
interactions. Comparison of the standard random output analysis with the massive 454
deep sequencing performed in this study (Figure 2.11B), together with clone specificity
confirmation performed by ELISA, PCA and transamidation assay, may allow the
replacement of protein expression and ELISA testing for protein-protein interactions with
massive deep sequencing. However, given the great analytical potential of this method, it
may be possible to carry out analysis after a single selection round, comparing the net
enrichment of clones by direct comparison to the unselected library. This is likely to
identify significantly more potential interacting partners than could ever be analyzed using
the traditional approach. Although the costs of 454 sequencing are relatively high at the
moment, greater availability is likely to lead to a reduction in price, and as barcoding
becomes more sophisticated, multiplexed analysis will become more straightforward,
allowing broader screening, and the profiling of the interactomes of several players
involved in a biological process simultaneously.
Finally, by virtue of the extremely deep sequencing that is carried out, in addition to
providing information on interacting proteins, this method also identifies the domains
responsible for the interactions directly in a first screen. Such detailed information on the
interaction domains would not be possible using traditional methods, where little more
than the identification of the interacting gene would be expected to be obtained, and
following such identification, new libraries would have to be created for each protein in
order to identify the responsible interacting domain.
By means of this novel approach we have identified a set of novel TG2 substrates and
interactors that could offer a better understanding of the functional role of TG2 in the cell,
as well as give a new insight in its role in disease. The new TG2 protein binding partners
we described here could have a role, among others, in cancer, neurodegenerative
DISCUSSION
78
pathologies, celiac disease and HIV, thus offering possible new therapeutic targets and
TG2 inhibitors.
We expect that this approach to library and selection analysis can also be extended to other
methods traditionally used to study protein-protein interactions (i.e. PCA and Y2H) as well
as to the study of the selection of peptides and antibodies by phage display. Furthermore,
beyond the identification of proteins involved in interactions, the use of libraries of
fragmented genes, as described here, also localizes the regions of interactions to domains,
making the information even more useful.
MATERIALS AND METHODS
79
MATERIALS AND METHODS
Abbreviations
AP, alkaline phosphatase
APS, ammonium persulfate
BCIP, 5-bromo-4-chloro-3-indolyl-beta-D-galactopyranoside
BSA, bovine serum albumine
DMSO, dimetilsulfoxide
DNase, deoxyribonuclease
dNTPs, deoxynucleotides
DTT, dithiothreitol
GST, glutathione S-transferase
HRP, horseradish peroxidase
IPTG, isopropyl β-D-1-thiogalactopyranoside
MW, molecluar wheights
NBT, nitro-blue tetrazolium
O/N, over night
PEG, polietilenglicole
RT, room temperature
SDS-PAGE, sodium dodecyl sulphate - polyacrylamide gel electrophoresis
TMB, tetrametilbenzidine
TG2, tissue transglutaminase
TSS, transformation and storage solution
MATERIALS AND METHODS
80
Solutions and buffers
• Phosphate buffered saline (PBS)
8 g NaCl, 0.2 g KCl, 1.44 g Na2HPO4, 0.24 g KH2PO4 in 1000 ml H2O, final pH 7.4.
• Phosphate buffered saline Tween 0.1% (PBST)
PBS added with 0.1% Tween 20
• Milk Phosphate buffered saline (MPBS)
PBS added with 2% non-fat milk powder.
• 2xTY liquid broth for bacteria
6.4g Bacto-tryptone, 4g Extract Yeast, 2g NaCl, H2O in 400 ml H2O. If required
ampicillin 0.1 mg/mL, kanamycin 0.05 mg/mL, 0.034 mg/mL chloramphenicol.
• 2xTY Agar plates
6.4g Bacto-tryptone, 4g Extract Yeast, 2g NaCl, 6g Bacto-Agar in 400 ml H2O. If
required ampicillin 0.1 mg/mL, kanamycin 0.05 mg/mL, 0.034 mg/mL chloramphenicol.
• Tris-acetate-EDTA (TAE) buffer for DNA electrophoresis on agarose gels
0.04 M Tris-acetate, 0.001 M EDTA.
• Loading buffer 6x for DNA samples (agarose gel)
40% glicerol, 60% H2O, 0.10% (w/v) bromophenol blue.
• SDS Running Buffer for protein electrophoresis on acrylamide gels
25 mM Tris, 250 mM glicin, 0.1% SDS pH 8.3.
• Loading buffer 2 for protein samples
100mM Tris pH 6.8, 4% SDS, 0.2% bromophenol blu, 2% β-mercaptoethanol, 20%
glycerol
• Running gel for SDS-polyacrylamide gel
12% polyacrylamide mix (29% acrylamide, 1% bisacrylamide), 0.375M Tris pH 8.8,
0.1% SDS, 0.1% APS, 2 μl TEMED (N,N,N',N'-Tetramethylethylenediamine), H2O to
10 ml.
MATERIALS AND METHODS
81
• Stacking gel for SDS-polyacrylamide gel
5% polyacrylamide mix (29% acrylamide, 1% bisacrylamide), 0.125M Tris pH 6.8, 0.1%
SDS, 0.1% APS, 1 μl TEMED (N,N,N',N'-Tetramethylethylenediamine), H2O to 4 ml.
• Loading buffer 2x for protein samples (acrylamide gels)
100 mM Tris pH 6.8, 4% SDS, 0.2% bromophenol blue, 2% β-mercaptoethanol, 20%
glycerol.
• Alkaline phosphatase (AP) buffer
Tris 1M pH9,5, NaCl 100mM, MgCl2 5mM
• Lysis buffer
20 mM Tris pH 8, 500 mM NaCl, 0.1% Triton X100, 5 mM imidazole, 1 mg/g/bacteria
lysozyme
• Solution A
20 mM Tris pH 8, 500 mM NaCl, 5 mM imidazole
• Solution B
20 mM Tris pH 8, 500 mM NaCl, 0.1% Triton X100, 125 mM imidazole
• Elution buffer
20 mM Tris pH 8, 500 mM NaCl, 300 mM imidazole
• TSS for preparation of competent E. coli cells
85% 2xTY, 10% PEG mw 8000, 5% DMSO, 50 mM MgC12. Filtration with 0.2 μm filter
Bacterial strains
The bacterial strains used in this study were:
- Escherichia coli DH5αF‟ (Gibco BRL), F‟/endA1 hsd17 (rK-mK+) supE44 thi-1 recA1
gyrA (Nalr) relA1 _(lacZYA-argF) U169 deoR (F80dlacD-(lacZ)M15);
- Escherichia coli BL21-CodonPlus(DE3)-RIPL strain B F– ompT hsdS(rB– mB–) dcm+
Tetr gal λ(DE3) endA Hte [argU proL/Camr] [argU ileY leuW Strep/Specr]
Oligonucleotides
All primers were purchased from biomers.net.
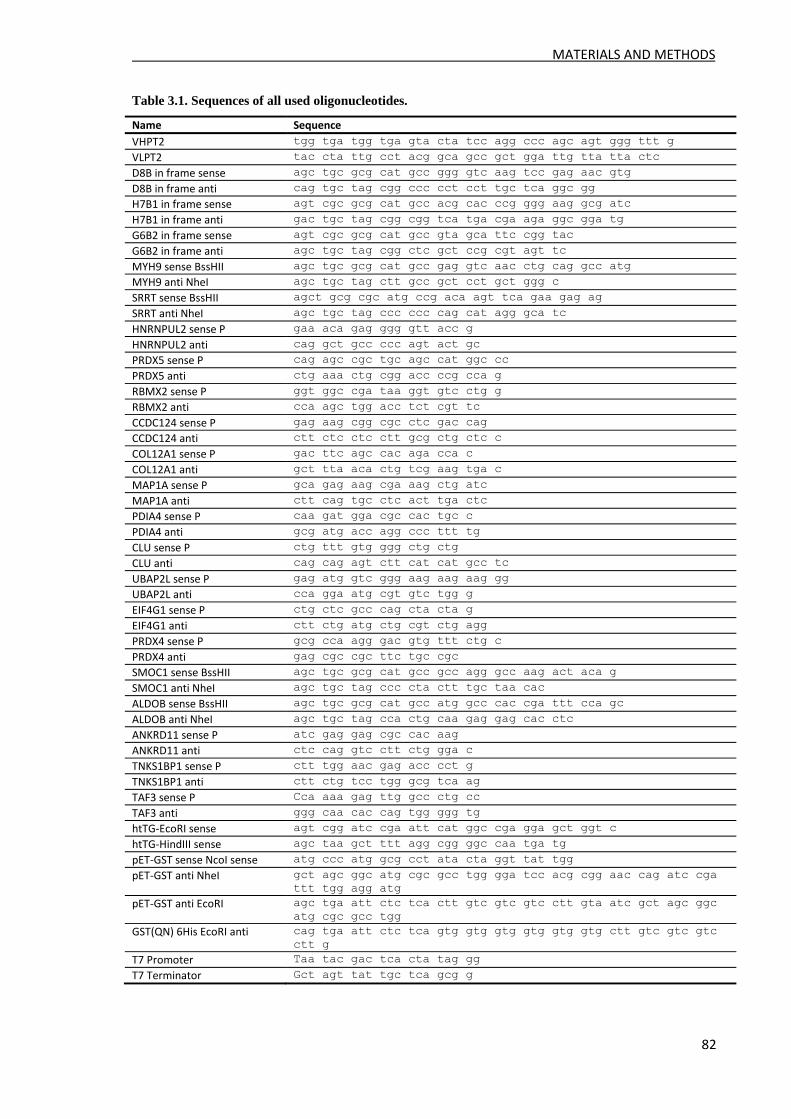
MATERIALS AND METHODS
82
Table 3.1. Sequences of all used oligonucleotides.
Name Sequence
VHPT2 tgg tga tgg tga gta cta tcc agg ccc agc agt ggg ttt g
VLPT2 tac cta ttg cct acg gca gcc gct gga ttg tta tta ctc
D8B in frame sense agc tgc gcg cat gcc ggg gtc aag tcc gag aac gtg
D8B in frame anti cag tgc tag cgg ccc cct cct tgc tca ggc gg
H7B1 in frame sense agt cgc gcg cat gcc acg cac ccg ggg aag gcg atc
H7B1 in frame anti gac tgc tag cgg cgg tca tga cga aga ggc gga tg
G6B2 in frame sense agt cgc gcg cat gcc gta gca ttc cgg tac
G6B2 in frame anti agc tgc tag cgg ctc gct ccg cgt agt tc
MYH9 sense BssHII agc tgc gcg cat gcc gag gtc aac ctg cag gcc atg
MYH9 anti NheI agc tgc tag ctt gcc gct cct gct ggg c
SRRT sense BssHII agct gcg cgc atg ccg aca agt tca gaa gag ag
SRRT anti NheI agc tgc tag ccc ccc cag cat agg gca tc
HNRNPUL2 sense P gaa aca gag ggg gtt acc g
HNRNPUL2 anti cag gct gcc ccc agt act gc
PRDX5 sense P cag agc cgc tgc agc cat ggc cc
PRDX5 anti ctg aaa ctg cgg acc ccg cca g
RBMX2 sense P ggt ggc cga taa ggt gtc ctg g
RBMX2 anti cca agc tgg acc tct cgt tc
CCDC124 sense P gag aag cgg cgc ctc gac cag
CCDC124 anti ctt ctc ctc ctt gcg ctg ctc c
COL12A1 sense P gac ttc agc cac aga cca c
COL12A1 anti gct tta aca ctg tcg aag tga c
MAP1A sense P gca gag aag cga aag ctg atc
MAP1A anti ctt cag tgc ctc act tga ctc
PDIA4 sense P caa gat gga cgc cac tgc c
PDIA4 anti gcg atg acc agg ccc ttt tg
CLU sense P ctg ttt gtg ggg ctg ctg
CLU anti cag cag agt ctt cat cat gcc tc
UBAP2L sense P gag atg gtc ggg aag aag aag gg
UBAP2L anti cca gga atg cgt gtc tgg g
EIF4G1 sense P ctg ctc gcc cag cta cta g
EIF4G1 anti ctt ctg atg ctg cgt ctg agg
PRDX4 sense P gcg cca agg gac gtg ttt ctg c
PRDX4 anti gag cgc cgc ttc tgc cgc
SMOC1 sense BssHII agc tgc gcg cat gcc gcc agg gcc aag act aca g
SMOC1 anti NheI agc tgc tag ccc cta ctt tgc taa cac
ALDOB sense BssHII agc tgc gcg cat gcc atg gcc cac cga ttt cca gc
ALDOB anti NheI agc tgc tag cca ctg caa gag gag cac ctc
ANKRD11 sense P atc gag gag cgc cac aag
ANKRD11 anti ctc cag gtc ctt ctg gga c
TNKS1BP1 sense P ctt tgg aac gag acc cct g
TNKS1BP1 anti ctt ctg tcc tgg gcg tca ag
TAF3 sense P Cca aaa gag ttg gcc ctg cc
TAF3 anti ggg caa cac cag tgg ggg tg
htTG-EcoRI sense agt cgg atc cga att cat ggc cga gga gct ggt c
htTG-HindIII sense agc taa gct ttt agg cgg ggc caa tga tg
pET-GST sense NcoI sense atg ccc atg gcg cct ata cta ggt tat tgg
pET-GST anti NheI gct agc ggc atg cgc gcc tgg gga tcc acg cgg aac cag atc cga
ttt tgg agg atg
pET-GST anti EcoRI agc tga att ctc tca ctt gtc gtc gtc ctt gta atc gct agc ggc
atg cgc gcc tgg
GST(QN) 6His EcoRI anti cag tga att ctc tca gtg gtg gtg gtg gtg gtg ctt gtc gtc gtc
ctt g
T7 Promoter Taa tac gac tca cta tag gg
T7 Terminator Gct agt tat tgc tca gcg g
MATERIALS AND METHODS
83
Results, Chapter 2.
Production and PEG-precipitation of phages
Small aliquots of the bacterial stock of the library was grown in 10 ml of 2xTY added with
chloramphenicol and 1% glucose, at 37°C to OD600
0.5. Under these conditions, bacteria
express the pilus necessary for phage infection. Bacteria were infected with a wild-type
helper phage, carrying all the genes necessary for phage replication, at a MOI (multiplicity
of infection, that is the ratio viral particles/bacterial cells) of 100. This step was performed
at 37°C for 45‟, without agitation.
Bacteria were then centrifuged at 4000 rpm for 10‟, the supernatant discarded and the
pellet resuspended in 40 ml of 2xTY broth added with chloramphenicol (phagemid
resistance) and kanamycin (helper phage resistance), to select bacteria carrying the
phagemid and the phage genome. Bacteria were allowed to grow O/N to produce
recombinant phages.
For collection of recombinant phages, bacteria were centrifuged at 7,000 rpm for 20‟. The
supernatant, containing soluble phages, was collected.
Precipitation of phages was performed by adding a solution of PEG 20% / NaCl 2.5 M. 1/5
volume of PEG/NaCl was added to the phage-containing supernatant. The solution was
incubated on ice for 45‟ to allow precipitation, and then centrifuged at 7,000 rpm for 20‟ to
pellet phages. The supernatant was discarded and the white pellet resuspended in 1 ml of
PBS.
Selection of cDNA phage library on TG2 immoblized on a solid surface
Nunc Immunotubes were coated O/N at 4°C with human recombinant TG2 (10µg/ml).
Selection was performed as follows:
• Wash immunotube with PBS and saturate it with 4 ml of 2% MPBS for 1h (RT).
• Saturate the PEG-precipitated phages 4% MPBS 1h (RT) to remove non-specific
phages.
• Wash the immunotube 2x with PBS.
• Transfer 1 mL of the phage-mix to the immunotube and incubate for 30‟ in rotation
followed by 90‟ of static incubation (RT).
• Wash immunotube 10 and 15 times with PBST and PBS for the first and second
round of selection, respectively, to remove unbound phages.
MATERIALS AND METHODS
84
• For elution of bound phages, 1ml of E. coli DH5α strain, grown at OD600 0.5 were
added and incubated for 45‟ at 37°C .
• Bacteria were plated on 2xTY agar plates added with chloramphenicol and
incubated O/N at 30°C to select only bacteria that have been infected by selected
phages.
Selection of cDNA phage library on soluble biotinylated TG2
• PEG-precipitated phages were mixed with 2% BSA in PBS and incubate for 1h at
RT to preblock the library.
• 10 µg of biotinylated hTG2 was added to phage-BSA mix and incubated 30‟ in
rotation followed by 30‟ of static incubation, all at RT.
• Streptavidin paramagnetic beads were prepared for selection following
manufacturer‟s instructions.
• 50 µl of washed beads (1x10⁹
beads) were added to phage-hTG2 mix and incubated
in rotation for 45‟ at RT.
• Beads were washed 8 and 12 times with PBST and PBS for the first and second
round of selection, respectively, to remove unbound phages. Washing was
performed with a magnet. Streptavidin paramagnetic beads were resuspended in the
tube that is then put on a magnet and beads allowed to be collected on the side of
the tube facing the magnet for 2-3 minutes. With a pipette, all the solution in the
tube is gently removed, without touching the beads and after the removal of the
tube from the magnet, 1 mL of PBST or PBS is added and tube is gently shaked
until the beads are resuspended again in the liquid phase.
• In the last washing step with PBS transfer solution to a new eppendorf tube.
• For elution of bound phages, 1ml of E. coli DH5α strain, grown at OD 0.5600 were
added and incubated for 45‟ at 37°C .
• Bacteria were plated on 2xTY agar plates added with chloramphenicol and
incubated O/N at 30°C to select only bacteria that have been infected by selected
phages.
MATERIALS AND METHODS
85
PCR (Polymerase Chain Reaction)
Thermus termophilus DNA polymerase (Biotools) was used to validate the cloning steps.
Reaction mixture:
• Template DNA 0.01-1 ng (plasmidic DNA)
• Sense primer 0.5 pmol/μl
• Antisense primer 0.5 pmol/μl
• Biotools Buffer 10x
• dNTPs (Sigma) 0.25 mM
• MgCl2 2 mM
• Polymerase 0.025 units/μl
• H20 to 20 μl
The following cycles were performed:
• Denaturation step, 5‟ at 94°C.
• 31 cycles of: denaturation, 45‟‟ at 94°C; annealing, 45‟‟ at 60°C; elongation, 1‟
every 1000bp at 72°C.
• Final elongation step: 10‟ at 72°C.
DNA electrophoresis on agarose gel
Agarose (Sigma) gels with a concentration of 2-1,5% in TAE buffer were used to separate
PCR products; 0,8% agarose gels were used to separate plasmidic DNA preparations. 1μl
of ethidium bromide (Sigma) was added to 30 ml of solution. 100 and 1000 base-pairs
molecular weights were purchased from Fermentas.
Results, Chapter 3.
Phage ELISA
Single clones were grown in 1 mL of 2xTY added with chloramphenicol and 1% glucose,
at 37°C to OD600
0.5 when they were infected with a wild-type helper phage at 37°C for
45‟, without agitation.
MATERIALS AND METHODS
86
Bacteria were then centrifuged at 4000 rpm for 10‟, the supernatant discarded and the
pellet resuspended in 2 ml of 2xTY broth added with chloramphenicol and kanamycin and
grown O/N at 30°C. The phage ELISA assays of single clones were performed as follows:
• Costar ELISA strips were coated with hTG2, mTG2 or BSA as a control protein at
10 μg/ml, O/N at 4°C;
• Wells were blocked with either 2% MPBS at RT for 1 hour;
• Bacteria were centrifuged for 5' at 10000 rpm and supernatant with phages of
individual clones were added to the wells in 1:1 ratio with 4% MPBS and incubated
for 1 hour at 37°C;
• extensive washes with PBST and PBS;
• Wells were added with mouse anti-M13 HRP conjugated antibody (Amersham,
Pharmacia) diluted 1:2000 in 2% MPBS and and incubated for 1 hour at 37°C;
• extensive washes with PBST and PBS;
• Immunocomplexes were revealed with the chromogenic substrate TMB (Sigma),
and the plate read at OD450.
DNA Sequencing
PCR products were purified with Eppendorf Perfectprep Gel Cleanup kit following
manufacturer instructions. Reaction mixture for sequencing was composed as follows:
50-100ng of purified PCR product
1 μl primer (3.2 pmol/μl)
2 μl Terminator Mix (Applied Biosystems, BigDye Terminator v1.1 Cycle
Sequencing Kit)
2 μl buffer 5x
H2O to 10 μl
and the sequencing program was:
1‟ at 96°
25 cycles: 15‟‟ at 96°; 5‟‟ at 50°; 4‟ at 60°
Reactions were afterwards purified with CENTRI SEP Spin Columns, following
manufacturer instructions. 5 μl of purified sequences were loaded on sequencing plates
with 10 μl of formamide, denaturated for 2‟ at 96° and analyzed with 3100 Genetic
Analyzer sequencer (ABI PRISM-HITACHI).
MATERIALS AND METHODS
87
DNA purification
The GenElute Gel Extraction Kit and GenElute PCR Clean-up kit (Sigma) were used for
purification of DNA agarose gel and reaction mixtures respectively, following the
instruction of the manufacturer.
The NucleoTraP CR (Machery-Nagel) was used for purification of mixtures of libraries
ligations.
DNA digestion with restriction endonucleases
All restrictions endonucleases (BssHII, NheI, NcoI, EcoRI, BamHI) were purchased from
New England Biolabs.
Reaction mixture:
• DNA;
• NEB buffer 10x;
• BSA 100x (if necessary);
• Restriction endonuclease, 1unit/ug of DNA;
• H2O to 50 μl.
The incubation was performed at the temperature required by the specific enzyme.
DNA Ligation
Plasmidic vector DNA and insert DNA were mixed at a 1:3 ratio (number of molecules).
T4 ligase was purchased from New England Biolabs (NEB).
Reaction Mixture:
• DNA (around 100 ng)
• T4 ligase buffer (NEB) 10x;
• T4 ligase (NEB), 1 unit;
• H2O to 15 ul;
• Incubation O/N at 16°C.
Preparation of competent E. coli cells
50 ml of E.coli cells were grown at 37°C in 2XTY liquid broth to OD600 0.5. The bacteria
were immediately chilled in ice for at least 20‟, then centrifuged at 4°C for 5‟ at 1200 rpm.
MATERIALS AND METHODS
88
The supernatant was discarded and the bacterial pellet resuspended in 5 ml of sterile TSS.
The cells were immediately used or stocked at -80°C for two months.
Bacterial transformation
A 100 μl vial of competent cells was incubated for 20‟ with 5 μl of ligation reaction
mixture. Heat shock was applied at 42°C foe 1‟15‟‟; after 2‟ in ice, the bacteria were
resuspended in 1 ml of liquid 2XTY and allowed to grow for 1 hour. No antibiotic was
added. Bacteria were then plated on antibiotic-containing agar plates and grown O/N at 28-
30°C.
Preparation of bacteria for -80°C stock
The bacteria were collected and resuspended with a solution of 80% 2XTY and 20%
glycerol.
Plasmidic DNA extraction
The GenElute Plasmid Miniprep (Sigma) was used for plasmidic DNA mini-preparations,
starting from 1-5 ml of bacteria culture, and following the instruction of the manufacturer.
454 deep sequencing of cDNA inserts
200 ng of cDNA fragments cut with BssHII and NheI from the library were purified by
MinElute columns (Qiagen, Valencia CA) in order to remove shorter fragments. Ligation
of the purified samples to specific adaptors and preparation of the single strand libraries
(sstDNA) were performed following the manufacturer's instruction (Roche, Basel,
Switzerland). The sstDNA libraries were quantitated by RiboGreen RNA Quantitation Kit
(Invitrogen) and checked for quality by capillary electrophoresis (Agilent Bioanalyzer
2100 with the RNA Pico 6000 LabChip kit; Agilent Technologies). The sstDNA libraries
were then amplified in emulsion as required by the 454 sequencing protocol. The reactions
were recovered by isopropanol emulsion breaking and enriched for positive reaction beads.
Each enriched sample was separately loaded onto one-eighth of the PicoTiterPlate (PTP)
and was sequenced according to the 454 GS-FLX Titanium protocol.
MATERIALS AND METHODS
89
Bioinformatic analysis
Sequences were processed with a custom analysis workflow procedure mainly based on
PERL scripts. Both raw and analyzed data were stored in a relational database. Briefly,
sequences were mapped onto the human genome (NCBI build 36) using gmap software
and matching sequences were compared to annotated genes. Each gene was then ranked
according to the number of supporting sequences. The “depth index” for each gene was
defined as the maximum number of overlapping sequences (i.e. sequences supporting the
same genic region). The “focus index” - defined as (depth-1)/rank – ranges between 0
(indicating a broad distribution of sequences over the gene) and 1 (indicating that all
sequences are “focused” on the same region). Data are accessible through a web based
interface (available at http://www.interactomeataglance.org/ ) implemented in php and
java.
Cloning of selected cDNA fragments
After each selection, plasmid DNA was isolated from colonies rescued from the plates. 0.1
ng of each preparation was used as a template for the inverse PCR reaction. A pair of
specific primers was designed for each of the top ranking genes, centering on the epitope
region identified by the overlapping reads. The forward primer was synthesized with
phosphorylated 5‟-end in order to allow ligation of blunt ends and PCR was performed
with a Phusion High-Fidelity DNA Polymerase (Finnzymes) according to the supplier‟s
protocol. After gel purification, the PCR product was ligated by T4 DNA ligase O/N at
16˚C, and the ligation reaction transformed into DH5αF‟ competent cells. Colonies
obtained on chloramphenicol plates were sequenced to assess the successful cloning of
specific gene fragments.
PCR (Polymerase Chain Reaction)
The proof-reading Phusion Pyrococcus-like DNA polymerase (Finnzymes) was used for
inverse PCR.
Reaction mixture:
• Template DNA 0.01-1 ng (plasmidic DNA)
• Sense primer 0.5 pmol/μl
• Antisense primer 0.5 pmol/μl
• Phusion HF Buffer 5x
• dNTPs (Sigma) 0.25 mM
MATERIALS AND METHODS
90
• Polymerase 0.025 units/μl
• H20 to 50 μl
The following cycles were performed:
• Denaturation step, 30‟ at 98°C.
• 31 cycles of: denaturation, 15‟‟ at 98°C; annealing, 15‟‟ at 60°C; elongation, 30‟‟
every 1000bp at 72°C.
• Final elongation step: 10‟ at 72°C.
Results, Chapter 4.
Cloning of interactors for Protein Complementation Assay
The DNA fragments of interactors were cut from pPAO10 with BssHII and NheI
restriction enzymes, and ligated into the pω vector. Human TG2 was PCR amplified from
pTrcHis-htTG [290] with the forward primer htTG-EcoRI and the reverse primer htTG-
HindIII. The TG2 gene was digested with EcoRI and HindIII, and ligated into the pα
vector. As positive control, co-transformed bacteria pα-RON2/pω-sc7 were used according
to Secco et al. [259]. pω-ΔG2 was used as negative control for the interaction with TG2.
ΔG2 is a scFv recognizing a portion of the Cholera toxin (DG).
PCA-validation of interactors
The DH5αF‟ were co-transformed with both pα-TG2 and pω-interactor vectors. After
incubation for 1 hour at 37°C without selective pressure, the co-transformed cells were
plated onto 2xTY agar plates, supplemented with 50 μg/ml kanamycin and 34 μg/ml
chloramphenicol, and incubated O/N at 30°C.
A single clone of each co-transformed bacteria was grown in 2xTY broth, supplemented
with 50 μg/ml kanamycin and 34 μg/ml chloramphenicol, at 37°C to OD600 0.5. Bacteria
were plated either onto an agar plate supplemented with 50 μg/ml kanamycin and 34 μg/ml
chloramphenicol for titering, or onto plates supplemented with increasing ampicillin
concentration (15-20-30 μg/ml) and 1 mM IPTG The plates were incubated at 28°C for
48 hours and growth was scored from negative (-) to highly positive (+++).
MATERIALS AND METHODS
91
Construction of expression vector and cloning of GST(QN) fusion proteins
Mutated GST (GST(QN)) was amplified by PCR from pET24d-GST(QN) vector, kindly
provided by dr.sc. Kiyotaka Hitomi (Nagoya University, Japan). GST(QN) was obtained
by point mutations (glutamine to asparagine) in GST amplified from pGEX 4T1, vector
normaly used for expression of fusion proteins. Point mutations were from CAA (Gln-15,
Gln-188) and CAG (Gln-67, Gln-204, Gln-207) to AAC (38). Vector pET-28b(+)
(Novagen) was used as a base for the new construct using restriction sites NcoI and EcoRI.
Amplification of GST(QN) was performed using four oligonucleotides, forward primer
pET-GST sense NcoI and reverse primers pET-GST anti NheI, pET-GST anti EcoRI and
GST(QN) 6His EcoRI anti. GST(QN) with 6xHis tag was digested with NcoI and EcoRI and
ligated into pET-28b(+) vector giving pET28b-GST(QN)-6xHis vector. The DNA
fragments of interactors were cut from pPAO10 with BssHII and NheI restriction enzymes
and ligated into pGEX 4T1. From there they were cut with BamHI and NheI restriction
enzymes and ligated into pET28b-GST(QN)-6xHis vector. Correct cloning of the inserts
was determined by PCR with T7 promoter and T7 terminator primers.
Production and purification of human recombinant TG2 and GST(QN) fusion
proteins
E.coli BL21 RIPL was transformed with each GST(QN) fusion protein expression vector.
A single colony, from a fresh agar plate added with 50 μg/ml kanamycin, was inoculated in
2 mL of 2xTY liquid broth, added with 50 μg/ml kanamycin and 1% glucose, and grown
O/N at 30°C. Next day bacterial coulture was diluted 1:100 in the same medium, but
without glucose and grown at 37°C to OD600 0.6. The expression of the recombinant
protein was induced by adding 0.2 mM IPTG, and grown O/N at 25°C. The next day,
periplasmic fractions containing the recombinant proteins were extracted as follows:
• the bacterial culture was centrifuged for 10‟ at 7000 rpm (4°C), the supernatant
discarded and the pellet resuspended with 10 ml of lysis buffer/gram of bacteria;
• the mixture was incubated in ice, in gentle shaking, for 30‟, until the solution
became very viscous;
• DNAse (20-50 g/mL of lysate), was added to lysate and incubated in ice, in gentle
agitation for 20‟, unitl the solution became liquid again:
• After centrifugation for 30‟ at 7000 rpm, the supernatant was collected and filtered
through 0.45 μm filter.
MATERIALS AND METHODS
92
To purify recombinant proteins, nickel-charged Ni-NTA Superflow resin (Qiagen) were
used to perform affinity chromatografy as follows:
• 1 ml of Ni-NTA Superflow resin was packed in a purification column and washed
with 10 ml of Solution A;
• Filtered superntant was slowely applied to the column twice;
• Resins were washed with 10 mL of Solution A, followed by 15 mL of Solution B
and another 10 mL of Solution A;
• Proteins were eluted from the column with Elution buffer containing 300mM
imidazole (0,5 mL each elution).
Fractions were check for quantity on 10% (TG2) or 12% (GST(QN) fusion proteins) SDS-
PAGE and pooled fractions were centrifuged at 14000 rpm (4°C) for 30' to precipitate
micro aggregates and dialyzed O/N against PBS. The next day proteins were again
centrifuged at 14000 rpm (4°C) for 30'. Protein degradation and concentration were then
checked by SDS-PAGE.
Protein electrophoresis on polyacrylamide gel and western blot
Protein samples, diluted 1:1 in loading buffer 2x for proteins, were loaded on 12%
polyacrylamide gel, composed by a stacking and running gel. The proteins were separated
at 18-20 mA.
Coomassie staining
The SDS-polyacrylamide gel was removed from the glass and stained with Coomassie
solution, under gentle shacking for 1 hour at 37°C. Then, Coomassie solution must be
removed (it can be reused many times) and the gel rinsed with destaining solution on a
slow shaker for 6-12 hours.
Transamidation assay
Protocol was modified from Sugimura et al. [75]. Mix of 10 mM DTT (Invitrogen), 5 mM
CaCl2, 5 mM 5-biotinamidopentylamine (Pierce), 0,02 mg/mL TG2 in TBS buffer was
added with 3 μg of the purified GST(QN) fusion protein and incubated for 30 min at 37⁰C.
The reaction was stopped by the addition of 20 mM EDTA. Reaction was loaded onto a
12% SDS-PAGE and subsequent WB was performed. Level of biotin incorporatin was
MATERIALS AND METHODS
93
detected by streptavidin AP antibody. The presence of GST(QN) fusion proteins in the
reaction was confirmed anti-GST antibody.
Western blot
Proteins were separated by SDS-PAGE and transferred onto nitrocellulose membrane
(Schleicher-Schuell) by semidry blotting using the Trans-Blot SD Transfer Cell (Biorad).
The membrane was treated as follows:
• blocked with MPBS 1 hour at RT (20°C);
• primary antibody: mouse anti-GST 1:2000 (Sigma) (1mg/ml), O/N at 4⁰C;
• extensive washes with PBST and PBS;
• secondary antibody: goat anti-mouse AP conjugated (Jackson Immunoresearch);
streptavidin AP conjugated (Pierce), 1 hour at RT;
• extensive washes with PBST and PBS;
• immunocomplexes were revealed by adding the chromogenic substrate NBT-BCIP
(Sigma), resulting in an insoluble precipitate at positive bands.

94
This work was funded by EU Commission as a part of EC Marie Curie Research Training
Network [contract n. MRTN-CT-2006-036032].
BIBLIOGRAPHY
95
BIBLIOGRAPHY
1. Pisano, J.J., J.S. Finlayson, and M.P. Peyton, [Cross-link in fibrin polymerized by
factor 13: epsilon-(gamma-glutamyl)lysine]. Science, 1968. 160(830): p. 892-3.
2. Clarke, D.D., Mycek, M. J., Neidle, A. and Waelsch, H. , The incorporation of
amines into proteins. Arch Biochem Biophys, 1957. 79: p. 338-54.
3. Kanaji, T., Ozaki, H., Takao, T., Kawajiri, H., Ide, H., Motok, M. and Shimonishi,
Y., Primary structure of microbial transglutaminase from Streptoverticilium sp.
strain S-8112. J Biol Chem, 1993. 268: p. 11565-72.
4. Della Mea, M., et al., AtPng1p. The first plant transglutaminase. Plant Physiol,
2004. 135(4): p. 2046-54.
5. Singh, R.N. and K. Mehta, Purification and characterization of a novel
transglutaminase from filarial nematode Brugia malayi. Eur J Biochem, 1994.
225(2): p. 625-34.
6. Dubbink, H.J., et al., The human prostate-specific transglutaminase gene (TGM4):
genomic organization, tissue-specific expression, and promoter characterization.
Genomics, 1998. 51(3): p. 434-44.
7. Aeschlimann, D., et al., Isolation of a cDNA encoding a novel member of the
transglutaminase gene family from human keratinocytes. Detection and
identification of transglutaminase gene products based on reverse transcription-
polymerase chain reaction with degenerate primers. J Biol Chem, 1998. 273(6): p.
3452-60.
8. Hadjivassiliou, M., et al., Autoantibodies in gluten ataxia recognize a novel
neuronal transglutaminase. Ann Neurol, 2008. 64(3): p. 332-43.
9. Spina, A.M., et al., GTPase and transglutaminase are associated in the secretion of
the rat anterior prostate. Biochem Biophys Res Commun, 1999. 260(2): p. 351-6.
10. Candi, E., et al., Transglutaminase 5 is regulated by guanine-adenine nucleotides.
Biochem J, 2004. 381(Pt 1): p. 313-9.
11. Hitomi, K., et al., Characterization of recombinant mouse epidermal-type
transglutaminase (TGase 3): regulation of its activity by proteolysis and guanine
nucleotides. J Biochem, 1999. 125(6): p. 1048-54.
12. Fesus, L. and M. Piacentini, Transglutaminase 2: an enigmatic enzyme with diverse
functions. Trends Biochem Sci, 2002. 27(10): p. 534-9.
BIBLIOGRAPHY
96
13. Thomazy, V. and L. Fesus, Differential expression of tissue transglutaminase in
human cells. An immunohistochemical study. Cell Tissue Res, 1989. 255(1): p. 215-
24.
14. Lorand, L. and R.M. Graham, Transglutaminases: crosslinking enzymes with
pleiotropic functions. Nat Rev Mol Cell Biol, 2003. 4(2): p. 140-56.
15. Murthy, S.N., et al., Conserved tryptophan in the core domain of transglutaminase
is essential for catalytic activity. Proc Natl Acad Sci U S A, 2002. 99(5): p. 2738-
42.
16. Hwang, K.C., et al., Interaction site of GTP binding Gh (transglutaminase II) with
phospholipase C. J Biol Chem, 1995. 270(45): p. 27058-62.
17. Zhang, J., et al., Modulation of the in situ activity of tissue transglutaminase by
calcium and GTP. J Biol Chem, 1998. 273(4): p. 2288-95.
18. Pinkas, D.M., et al., Transglutaminase 2 undergoes a large conformational change
upon activation. PLoS Biol, 2007. 5(12): p. e327.
19. Nicholas, B., et al., Cross-linking of cellular proteins by tissue transglutaminase
during necrotic cell death: a mechanism for maintaining tissue integrity. Biochem
J, 2003. 371(Pt 2): p. 413-22.
20. Jeon, J.H., et al., GTP is required to stabilize and display transamidation activity of
transglutaminase 2. Biochem Biophys Res Commun, 2002. 294(4): p. 818-22.
21. Lai, T.S., et al., Calcium regulates S-nitrosylation, denitrosylation, and activity of
tissue transglutaminase. Biochemistry, 2001. 40(16): p. 4904-10.
22. Lai, T.S., et al., Sphingosylphosphocholine reduces the calcium ion requirement for
activating tissue transglutaminase. J Biol Chem, 1997. 272(26): p. 16295-300.
23. Liu, S., R.A. Cerione, and J. Clardy, Structural basis for the guanine nucleotide-
binding activity of tissue transglutaminase and its regulation of transamidation
activity. Proc Natl Acad Sci U S A, 2002. 99(5): p. 2743-7.
24. Aeschlimann, D. and M. Paulsson, Cross-linking of laminin-nidogen complexes by
tissue transglutaminase. A novel mechanism for basement membrane stabilization.
J Biol Chem, 1991. 266(23): p. 15308-17.
25. Barsigian, C., A.M. Stern, and J. Martinez, Tissue (type II) transglutaminase
covalently incorporates itself, fibrinogen, or fibronectin into high molecular weight
complexes on the extracellular surface of isolated hepatocytes. Use of 2-[(2-
oxopropyl)thio] imidazolium derivatives as cellular transglutaminase inactivators.
J Biol Chem, 1991. 266(33): p. 22501-9.
26. Aeschlimann, D., et al., Expression of tissue transglutaminase in skeletal tissues
correlates with events of terminal differentiation of chondrocytes. J Cell Biol, 1993.
120(6): p. 1461-70.
BIBLIOGRAPHY
97
27. Kaartinen, M.T., et al., Transglutaminase-catalyzed cross-linking of osteopontin is
inhibited by osteocalcin. J Biol Chem, 1997. 272(36): p. 22736-41.
28. Hunter, I., et al., The cell adhesion molecule C-CAM is a substrate for tissue
transglutaminase. FEBS Lett, 1998. 425(1): p. 141-4.
29. Akimov, S.S., et al., Tissue transglutaminase is an integrin-binding adhesion
coreceptor for fibronectin. J Cell Biol, 2000. 148(4): p. 825-38.
30. Telci, D., et al., Fibronectin-tissue transglutaminase matrix rescues RGD-impaired
cell adhesion through syndecan-4 and beta1 integrin co-signaling. J Biol Chem,
2008. 283(30): p. 20937-47.
31. Haroon, Z.A., et al., Tissue transglutaminase is expressed, active, and directly
involved in rat dermal wound healing and angiogenesis. Faseb J, 1999. 13(13): p.
1787-95.
32. Haroon, Z.A., et al., Tissue transglutaminase is expressed as a host response to
tumor invasion and inhibits tumor growth. Lab Invest, 1999. 79(12): p. 1679-86.
33. Jones, R.A., et al., Matrix changes induced by transglutaminase 2 lead to inhibition
of angiogenesis and tumor growth. Cell Death Differ, 2006. 13(9): p. 1442-53.
34. Gaudry, C.A., et al., Cell surface localization of tissue transglutaminase is
dependent on a fibronectin-binding site in its N-terminal beta-sandwich domain. J
Biol Chem, 1999. 274(43): p. 30707-14.
35. Balklava, Z., et al., Analysis of tissue transglutaminase function in the migration of
Swiss 3T3 fibroblasts: the active-state conformation of the enzyme does not affect
cell motility but is important for its secretion. J Biol Chem, 2002. 277(19): p.
16567-75.
36. Zemskov, E.A., et al., Cell-surface transglutaminase undergoes internalization and
lysosomal degradation: an essential role for LRP1. J Cell Sci, 2007. 120(Pt 18): p.
3188-99.
37. Fesus, L., V. Thomazy, and A. Falus, Induction and activation of tissue
transglutaminase during programmed cell death. FEBS Lett, 1987. 224(1): p. 104-
8.
38. Oliverio, S., et al., Inhibition of "tissue" transglutaminase increases cell survival by
preventing apoptosis. J Biol Chem, 1999. 274(48): p. 34123-8.
39. Piredda, L., et al., Lack of 'tissue' transglutaminase protein cross-linking leads to
leakage of macromolecules from dying cells: relationship to development of
autoimmunity in MRLIpr/Ipr mice. Cell Death Differ, 1997. 4(6): p. 463-72.
BIBLIOGRAPHY
98
40. Boehm, J.E., et al., Tissue transglutaminase protects against apoptosis by
modifying the tumor suppressor protein p110 Rb. J Biol Chem, 2002. 277(23): p.
20127-30.
41. Tucholski, J. and G.V. Johnson, Tissue transglutaminase differentially modulates
apoptosis in a stimuli-dependent manner. J Neurochem, 2002. 81(4): p. 780-91.
42. Mann, A.P., et al., Overexpression of tissue transglutaminase leads to constitutive
activation of nuclear factor-kappaB in cancer cells: delineation of a novel pathway.
Cancer Res, 2006. 66(17): p. 8788-95.
43. Cao, L., et al., Tissue transglutaminase protects epithelial ovarian cancer cells
from cisplatin-induced apoptosis by promoting cell survival signaling.
Carcinogenesis, 2008. 29(10): p. 1893-900.
44. Liu, S., R.A. Cerione, and J. Clardy, Structural basis for the guanine nucleotide-
binding activity of tissue transglutaminase and its regulation of transamidation
activity. Proc Natl Acad Sci U S A, 2002. 99(5): p. 2743-7.
45. Achyuthan, K.E. and C.S. Greenberg, Identification of a guanosine triphosphate-
binding site on guinea pig liver transglutaminase. Role of GTP and calcium ions in
modulating activity. J Biol Chem, 1987. 262(4): p. 1901-6.
46. Mian, S., et al., The importance of the GTP-binding protein tissue transglutaminase
in the regulation of cell cycle progression. FEBS Lett, 1995. 370(1-2): p. 27-31.
47. Singh, U.S., J.W. Erickson, and R.A. Cerione, Identification and biochemical
characterization of an 80 kilodalton GTP-binding/transglutaminase from rabbit
liver nuclei. Biochemistry, 1995. 34(48): p. 15863-71.
48. Feng, J.F., S.G. Rhee, and M.J. Im, Evidence that phospholipase delta1 is the
effector in the Gh (transglutaminase II)-mediated signaling. J Biol Chem, 1996.
271(28): p. 16451-4.
49. Murthy, S.N., et al., Interactions of G(h)/transglutaminase with phospholipase
Cdelta1 and with GTP. Proc Natl Acad Sci U S A, 1999. 96(21): p. 11815-9.
50. Di Venere, A., et al., Opposite effects of Ca(2+) and GTP binding on tissue
transglutaminase tertiary structure. J Biol Chem, 2000. 275(6): p. 3915-21.
51. Lai, T.S., et al., Regulation of human tissue transglutaminase function by
magnesium-nucleotide complexes. Identification of distinct binding sites for Mg-
GTP and Mg-ATP. J Biol Chem, 1998. 273(3): p. 1776-81.
52. Hasegawa, G., et al., A novel function of tissue-type transglutaminase: protein
disulphide isomerase. Biochem J, 2003. 373(Pt 3): p. 793-803.
53. Noiva, R. and W.J. Lennarz, Protein disulfide isomerase. A multifunctional protein
resident in the lumen of the endoplasmic reticulum. J Biol Chem, 1992. 267(6): p.
3553-6.
BIBLIOGRAPHY
99
54. Freedman, R.B., T.R. Hirst, and M.F. Tuite, Protein disulphide isomerase: building
bridges in protein folding. Trends Biochem Sci, 1994. 19(8): p. 331-6.
55. Ferrari, D.M. and H.D. Soling, The protein disulphide-isomerase family:
unravelling a string of folds. Biochem J, 1999. 339 ( Pt 1): p. 1-10.
56. Turano, C., et al., Proteins of the PDI family: unpredicted non-ER locations and
functions. J Cell Physiol, 2002. 193(2): p. 154-63.
57. Malorni, W., et al., The adenine nucleotide translocator 1 acts as a type 2
transglutaminase substrate: implications for mitochondrial-dependent apoptosis.
Cell Death Differ, 2009. 16(11): p. 1480-92.
58. Mishra, S. and L.J. Murphy, Tissue transglutaminase has intrinsic kinase activity:
identification of transglutaminase 2 as an insulin-like growth factor-binding
protein-3 kinase. J Biol Chem, 2004. 279(23): p. 23863-8.
59. Mishra, S., G. Melino, and L.J. Murphy, Transglutaminase 2 kinase activity
facilitates protein kinase A-induced phosphorylation of retinoblastoma protein. J
Biol Chem, 2007. 282(25): p. 18108-15.
60. Nanda, N., et al., Targeted inactivation of Gh/tissue transglutaminase II. J Biol
Chem, 2001. 276(23): p. 20673-8.
61. De Laurenzi, V. and G. Melino, Gene disruption of tissue transglutaminase. Mol
Cell Biol, 2001. 21(1): p. 148-55.
62. Szondy, Z., et al., Transglutaminase 2-/- mice reveal a phagocytosis-associated
crosstalk between macrophages and apoptotic cells. Proc Natl Acad Sci U S A,
2003. 100(13): p. 7812-7.
63. Falasca, L., et al., Transglutaminase type II is a key element in the regulation of the
anti-inflammatory response elicited by apoptotic cell engulfment. J Immunol, 2005.
174(11): p. 7330-40.
64. Bernassola, F., et al., Role of transglutaminase 2 in glucose tolerance: knockout
mice studies and a putative mutation in a MODY patient. Faseb J, 2002. 16(11): p.
1371-8.
65. Szondy, Z., et al., Tissue transglutaminase (TG2) protects cardiomyocytes against
ischemia/reperfusion injury by regulating ATP synthesis. Cell Death Differ, 2006.
13(10): p. 1827-9.
66. Csosz, E., B. Mesko, and L. Fesus, Transdab wiki: the interactive transglutaminase
substrate database on web 2.0 surface. Amino Acids, 2009. 36(4): p. 615-7.
67. Pastor, M.T., et al., Addressing substrate glutamine requirements for tissue
transglutaminase using substance P analogues. FEBS Lett, 1999. 451(3): p. 231-4.
BIBLIOGRAPHY
100
68. Coussons, P.J., et al., Factors that govern the specificity of transglutaminase-
catalysed modification of proteins and peptides. Biochem J, 1992. 282 ( Pt 3): p.
929-30.
69. Hohenadl, C., et al., Two adjacent N-terminal glutamines of BM-40 (osteonectin,
SPARC) act as amine acceptor sites in transglutaminaseC-catalyzed modification. J
Biol Chem, 1995. 270(40): p. 23415-20.
70. Ferrandiz, C., et al., Gln5 selectively monodansylated substance P as a sensitive
tool for interaction studies with membranes. Biochem Biophys Res Commun,
1994. 203(1): p. 359-65.
71. Aeschlimann, D., M. Paulsson, and K. Mann, Identification of Gln726 in nidogen
as the amine acceptor in transglutaminase-catalyzed cross-linking of laminin-
nidogen complexes. J Biol Chem, 1992. 267(16): p. 11316-21.
72. Fontana, A., et al., Site-specific modification and PEGylation of pharmaceutical
proteins mediated by transglutaminase. Adv Drug Deliv Rev, 2008. 60(1): p. 13-
28.
73. Esposito, C. and I. Caputo, Mammalian transglutaminases. Identification of
substrates as a key to physiological function and physiopathological relevance.
Febs J, 2005. 272(3): p. 615-31.
74. Keresztessy, Z., et al., Phage display selection of efficient glutamine-donor
substrate peptides for transglutaminase 2. Protein Sci, 2006. 15(11): p. 2466-80.
75. Sugimura, Y., et al., Screening for the preferred substrate sequence of
transglutaminase using a phage-displayed peptide library: identification of peptide
substrates for TGASE 2 and Factor XIIIA. J Biol Chem, 2006. 281(26): p. 17699-
706.
76. Ruoppolo, M., et al., Analysis of transglutaminase protein substrates by functional
proteomics. Protein Sci, 2003. 12(6): p. 1290-7.
77. Kang, S.K., et al., Alpha1B-adrenoceptor signaling and cell motility: GTPase
function of Gh/transglutaminase 2 inhibits cell migration through interaction with
cytoplasmic tail of integrin alpha subunits. J Biol Chem, 2004. 279(35): p. 36593-
600.
78. Peng, X., et al., Interaction of tissue transglutaminase with nuclear transport
protein importin-alpha3. FEBS Lett, 1999. 446(1): p. 35-9.
79. Hang, J., et al., Identification of a novel recognition sequence for fibronectin within
the NH2-terminal beta-sandwich domain of tissue transglutaminase. J Biol Chem,
2005. 280(25): p. 23675-83.
80. Siegel, M. and C. Khosla, Transglutaminase 2 inhibitors and their therapeutic role
in disease states. Pharmacol Ther, 2007. 115(2): p. 232-45.
BIBLIOGRAPHY
101
81. Wilhelmus, M.M., A.M. van Dam, and B. Drukarch, Tissue transglutaminase: a
novel pharmacological target in preventing toxic protein aggregation in
neurodegenerative diseases. Eur J Pharmacol, 2008. 585(2-3): p. 464-72.
82. Dieterich, W., et al., Identification of tissue transglutaminase as the autoantigen of
celiac disease. Nat Med, 1997. 3(7): p. 797-801.
83. Karpuj, M.V., et al., Transglutaminase aggregates huntingtin into
nonamyloidogenic polymers, and its enzymatic activity increases in Huntington's
disease brain nuclei. Proc Natl Acad Sci U S A, 1999. 96(13): p. 7388-93.
84. Selkoe, D.J., C. Abraham, and Y. Ihara, Brain transglutaminase: in vitro
crosslinking of human neurofilament proteins into insoluble polymers. Proc Natl
Acad Sci U S A, 1982. 79(19): p. 6070-4.
85. Junn, E., et al., Tissue transglutaminase-induced aggregation of alpha-synuclein:
Implications for Lewy body formation in Parkinson's disease and dementia with
Lewy bodies. Proc Natl Acad Sci U S A, 2003. 100(4): p. 2047-52.
86. Zemaitaitis, M.O., et al., Transglutaminase-induced cross-linking of tau proteins in
progressive supranuclear palsy. J Neuropathol Exp Neurol, 2000. 59(11): p. 983-9.
87. Kotsakis, P. and M. Griffin, Tissue transglutaminase in tumour progression: friend
or foe? Amino Acids, 2007. 33(2): p. 373-84.
88. Molberg, O., S.N. McAdam, and L.M. Sollid, Role of tissue transglutaminase in
celiac disease. J Pediatr Gastroenterol Nutr, 2000. 30(3): p. 232-40.
89. Kagnoff, M.F., Celiac disease: pathogenesis of a model immunogenetic disease. J
Clin Invest, 2007. 117(1): p. 41-9.
90. Shan, L., et al., Structural basis for gluten intolerance in celiac sprue. Science,
2002. 297(5590): p. 2275-9.
91. Sollid, L.M., Coeliac disease: dissecting a complex inflammatory disorder. Nat
Rev Immunol, 2002. 2(9): p. 647-55.
92. Sollid, L.M., Molecular basis of celiac disease. Annu Rev Immunol, 2000. 18: p.
53-81.
93. Molberg, O., et al., Tissue transglutaminase selectively modifies gliadin peptides
that are recognized by gut-derived T cells in celiac disease. Nat Med, 1998. 4(6): p.
713-7.
94. Sollid, L.M., et al., Autoantibodies in coeliac disease: tissue transglutaminase--
guilt by association? Gut, 1997. 41(6): p. 851-2.
95. Tommasini, A., et al., Mass screening for coeliac disease using antihuman
transglutaminase antibody assay. Arch Dis Child, 2004. 89(6): p. 512-5.
BIBLIOGRAPHY
102
96. Verderio, E.A., T. Johnson, and M. Griffin, Tissue transglutaminase in normal and
abnormal wound healing: review article. Amino Acids, 2004. 26(4): p. 387-404.
97. George, M.D., et al., Regulation of transglutaminase type II by transforming
growth factor-beta 1 in normal and transformed human epidermal keratinocytes. J
Biol Chem, 1990. 265(19): p. 11098-104.
98. Quan, G., et al., TGF-beta1 up-regulates transglutaminase two and fibronectin in
dermal fibroblasts: a possible mechanism for the stabilization of tissue
inflammation. Arch Dermatol Res, 2005: p. 1-7.
99. Ritter, S.J. and P.J. Davies, Identification of a transforming growth factor-
beta1/bone morphogenetic protein 4 (TGF-beta1/BMP4) response element within
the mouse tissue transglutaminase gene promoter. J Biol Chem, 1998. 273(21): p.
12798-806.
100. Kuncio, G.S., et al., TNF-alpha modulates expression of the tissue
transglutaminase gene in liver cells. Am J Physiol, 1998. 274(2 Pt 1): p. G240-5.
101. Mirza, A., et al., A role for tissue transglutaminase in hepatic injury and
fibrogenesis, and its regulation by NF-kappaB. Am J Physiol, 1997. 272(2 Pt 1): p.
G281-8.
102. Johnson, K., et al., Interleukin-1 induces pro-mineralizing activity of cartilage
tissue transglutaminase and factor XIIIa. Am J Pathol, 2001. 159(1): p. 149-63.
103. Suto, N., K. Ikura, and R. Sasaki, Expression induced by interleukin-6 of tissue-
type transglutaminase in human hepatoblastoma HepG2 cells. J Biol Chem, 1993.
268(10): p. 7469-73.
104. Toth, B., et al., Transglutaminase 2 is needed for the formation of an efficient
phagocyte portal in macrophages engulfing apoptotic cells. J Immunol, 2009.
182(4): p. 2084-92.
105. Verma, A., et al., Increased expression of tissue transglutaminase in pancreatic
ductal adenocarcinoma and its implications in drug resistance and metastasis.
Cancer Res, 2006. 66(21): p. 10525-33.
106. Mehta, K., et al., Prognostic significance of tissue transglutaminase in drug
resistant and metastatic breast cancer. Clin Cancer Res, 2004. 10(23): p. 8068-76.
107. Fok, J.Y., S. Ekmekcioglu, and K. Mehta, Implications of tissue transglutaminase
expression in malignant melanoma. Mol Cancer Ther, 2006. 5(6): p. 1493-503.
108. Yuan, L., et al., Transglutaminase 2 inhibitor, KCC009, disrupts fibronectin
assembly in the extracellular matrix and sensitizes orthotopic glioblastomas to
chemotherapy. Oncogene, 2007. 26(18): p. 2563-73.
109. Verma, A. and K. Mehta, Tissue transglutaminase-mediated chemoresistance in
cancer cells. Drug Resist Updat, 2007. 10(4-5): p. 144-51.

BIBLIOGRAPHY
103
110. Mangala, L.S., et al., Tissue transglutaminase expression promotes cell attachment,
invasion and survival in breast cancer cells. Oncogene, 2007. 26(17): p. 2459-70.
111. Antonyak, M.A., et al., Augmentation of tissue transglutaminase expression and
activation by epidermal growth factor inhibit doxorubicin-induced apoptosis in
human breast cancer cells. J Biol Chem, 2004. 279(40): p. 41461-7.
112. Jiang, D., et al., Identification of metastasis-associated proteins by proteomic
analysis and functional exploration of interleukin-18 in metastasis. Proteomics,
2003. 3(5): p. 724-37.
113. Ai, L., et al., The transglutaminase 2 gene (TGM2), a potential molecular marker
for chemotherapeutic drug sensitivity, is epigenetically silenced in breast cancer.
Carcinogenesis, 2008. 29(3): p. 510-8.
114. Kumar, A., et al., Tissue transglutaminase promotes drug resistance and invasion
by inducing mesenchymal transition in mammary epithelial cells. PLoS One. 5(10):
p. e13390.
115. Dyer, L.M., et al., The transglutaminase 2 gene is aberrantly hypermethylated in
glioma. J Neurooncol. 101(3): p. 429-40.
116. Nguyen, D.X., P.D. Bos, and J. Massague, Metastasis: from dissemination to
organ-specific colonization. Nat Rev Cancer, 2009. 9(4): p. 274-84.
117. Chen, G., et al., Proteomic analysis of lung adenocarcinoma: identification of a
highly expressed set of proteins in tumors. Clin Cancer Res, 2002. 8(7): p. 2298-
305.
118. Johnson, T.S., et al., Transfection of tissue transglutaminase into a highly
malignant hamster fibrosarcoma leads to a reduced incidence of primary tumour
growth. Oncogene, 1994. 9(10): p. 2935-42.
119. Xu, L., et al., GPR56, an atypical G protein-coupled receptor, binds tissue
transglutaminase, TG2, and inhibits melanoma tumor growth and metastasis. Proc
Natl Acad Sci U S A, 2006. 103(24): p. 9023-8.
120. Xu, L. and R.O. Hynes, GPR56 and TG2: possible roles in suppression of tumor
growth by the microenvironment. Cell Cycle, 2007. 6(2): p. 160-5.
121. Johnson, T.S., et al., Transglutaminase transcription and antigen translocation in
experimental renal scarring. J Am Soc Nephrol, 1999. 10(10): p. 2146-57.
122. Folkman, J., What is the evidence that tumors are angiogenesis dependent? J Natl
Cancer Inst, 1990. 82(1): p. 4-6.
123. Mehta, K., High levels of transglutaminase expression in doxorubicin-resistant
human breast carcinoma cells. Int J Cancer, 1994. 58(3): p. 400-6.
BIBLIOGRAPHY
104
124. Russell, D.H. and J.R. Womble, Transglutaminase may mediate certain
physiological effects of endogenous amines and of amine-containing therapeutical
agents. Life Sci, 1982. 30(18): p. 1499-508.
125. Tucholski, J., TG2 protects neuroblastoma cells against DNA-damage-induced
stress, suppresses p53 activation. Amino Acids. 39(2): p. 523-32.
126. Kim, S.Y., et al., Differential expression of multiple transglutaminases in human
brain. Increased expression and cross-linking by transglutaminases 1 and 2 in
Alzheimer's disease. J Biol Chem, 1999. 274(43): p. 30715-21.
127. Ashton, A.C., et al., Tetanus toxin inhibits neuroexocytosis even when its Zn(2+)-
dependent protease activity is removed. J Biol Chem, 1995. 270(52): p. 31386-90.
128. Pastuszko, A., D.F. Wilson, and M. Erecinska, A role for transglutaminase in
neurotransmitter release by rat brain synaptosomes. J Neurochem, 1986. 46(2): p.
499-508.
129. Krasnikov, B.F., et al., Transglutaminase activity is present in highly purified
nonsynaptosomal mouse brain and liver mitochondria. Biochemistry, 2005. 44(21):
p. 7830-43.
130. Lesort, M., et al., Distinct nuclear localization and activity of tissue
transglutaminase. J Biol Chem, 1998. 273(20): p. 11991-4.
131. Fleminger, S., et al., Head injury as a risk factor for Alzheimer's disease: the
evidence 10 years on; a partial replication. J Neurol Neurosurg Psychiatry, 2003.
74(7): p. 857-62.
132. Swaab, D.F., et al., Brain aging and Alzheimer's disease; use it or lose it. Prog
Brain Res, 2002. 138: p. 343-73.
133. Sastre, M., T. Klockgether, and M.T. Heneka, Contribution of inflammatory
processes to Alzheimer's disease: molecular mechanisms. Int J Dev Neurosci, 2006.
24(2-3): p. 167-76.
134. Koistinaho, M. and J. Koistinaho, Interactions between Alzheimer's disease and
cerebral ischemia--focus on inflammation. Brain Res Brain Res Rev, 2005. 48(2):
p. 240-50.
135. Butterfield, D.A., et al., Amyloid beta-peptide and amyloid pathology are central to
the oxidative stress and inflammatory cascades under which Alzheimer's disease
brain exists. J Alzheimers Dis, 2002. 4(3): p. 193-201.
136. Selkoe, D.J., The molecular pathology of Alzheimer's disease. Neuron, 1991. 6(4):
p. 487-98.
137. Lee, V.M., et al., A68: a major subunit of paired helical filaments and derivatized
forms of normal Tau. Science, 1991. 251(4994): p. 675-8.
BIBLIOGRAPHY
105
138. Glenner, G.G. and C.W. Wong, Alzheimer's disease: initial report of the
purification and characterization of a novel cerebrovascular amyloid protein.
Biochem Biophys Res Commun, 1984. 120(3): p. 885-90.
139. Walsh, D.M., et al., Amyloid beta-protein fibrillogenesis. Structure and biological
activity of protofibrillar intermediates. J Biol Chem, 1999. 274(36): p. 25945-52.
140. Gamblin, T.C., R.W. Berry, and L.I. Binder, Modeling tau polymerization in vitro:
a review and synthesis. Biochemistry, 2003. 42(51): p. 15009-17.
141. Selkoe, D.J., The origins of Alzheimer disease: a is for amyloid. Jama, 2000.
283(12): p. 1615-7.
142. Jarrett, J.T., E.P. Berger, and P.T. Lansbury, Jr., The carboxy terminus of the beta
amyloid protein is critical for the seeding of amyloid formation: implications for
the pathogenesis of Alzheimer's disease. Biochemistry, 1993. 32(18): p. 4693-7.
143. Ikura, K., K. Takahata, and R. Sasaki, Cross-linking of a synthetic partial-length
(1-28) peptide of the Alzheimer beta/A4 amyloid protein by transglutaminase.
FEBS Lett, 1993. 326(1-3): p. 109-11.
144. Dudek, S.M. and G.V. Johnson, Transglutaminase facilitates the formation of
polymers of the beta- amyloid peptide. Brain Res, 1994. 651(1-2): p. 129-33.
145. Ho, G.J., et al., Cross-linking of beta-amyloid protein precursor catalyzed by tissue
transglutaminase. FEBS Lett, 1994. 349(1): p. 151-4.
146. Harper, J.D. and P.T. Lansbury, Jr., Models of amyloid seeding in Alzheimer's
disease and scrapie: mechanistic truths and physiological consequences of the
time-dependent solubility of amyloid proteins. Annu Rev Biochem, 1997. 66: p.
385-407.
147. Nitsch, R.M., et al., Cerebrospinal fluid levels of amyloid beta-protein in
Alzheimer's disease: inverse correlation with severity of dementia and effect of
apolipoprotein E genotype. Ann Neurol, 1995. 37(4): p. 512-8.
148. Hartley, D.M., et al., Transglutaminase induces protofibril-like amyloid beta-
protein assemblies that are protease-resistant and inhibit long-term potentiation. J
Biol Chem, 2008. 283(24): p. 16790-800.
149. Dudek, S.M. and G.V. Johnson, Transglutaminase catalyzes the formation of
sodium dodecyl sulfate- insoluble, Alz-50-reactive polymers of tau. J Neurochem,
1993. 61(3): p. 1159-62.
150. Johnson, G.V., et al., Transglutaminase activity is increased in Alzheimer's disease
brain. Brain Res, 1997. 751(2): p. 323-9.
151. Citron, B.A., et al., Intron-exon swapping of transglutaminase mRNA and neuronal
Tau aggregation in Alzheimer's disease. J Biol Chem, 2001. 276(5): p. 3295-301.
BIBLIOGRAPHY
106
152. Halverson, R.A., et al., Tau protein is cross-linked by transglutaminase in P301L
tau transgenic mice. J Neurosci, 2005. 25(5): p. 1226-33.
153. Citron, B.A., et al., Protein crosslinking, tissue transglutaminase, alternative
splicing and neurodegeneration. Neurochem Int, 2002. 40(1): p. 69-78.
154. Antonyak, M.A., et al., Two isoforms of tissue transglutaminase mediate opposing
cellular fates. Proc Natl Acad Sci U S A, 2006. 103(49): p. 18609-14.
155. Green, H., Human genetic diseases due to codon reiteration: relationship to an
evolutionary mechanism. Cell, 1993. 74(6): p. 955-6.
156. Kahlem, P., et al., Peptides containing glutamine repeats as substrates for
transglutaminase-catalyzed cross-linking: relevance to diseases of the nervous
system. Proc Natl Acad Sci U S A, 1996. 93(25): p. 14580-5.
157. Kahlem, P., H. Green, and P. Djian, Transglutaminase action imitates Huntington's
disease: selective polymerization of Huntingtin containing expanded
polyglutamine. Mol Cell, 1998. 1(4): p. 595-601.
158. Lesort, M., et al., Tissue transglutaminase is increased in Huntington's disease
brain. J Neurochem, 1999. 73(5): p. 2018-27.
159. Jeitner, T.M., et al., Increased levels of gamma-glutamylamines in Huntington
disease CSF. J Neurochem, 2008. 106(1): p. 37-44.
160. Chun, W., et al., Tissue transglutaminase does not contribute to the formation of
mutant huntingtin aggregates. J Cell Biol, 2001. 153(1): p. 25-34.
161. Bailey, C.D. and G.V. Johnson, Tissue transglutaminase contributes to disease
progression in the R6/2 Huntington's disease mouse model via aggregate-
independent mechanisms. J Neurochem, 2005. 92(1): p. 83-92.
162. Nussbaum, R.L. and M.H. Polymeropoulos, Genetics of Parkinson's disease. Hum
Mol Genet, 1997. 6(10): p. 1687-91.
163. Katzman, R., et al., Genetic evidence that the Lewy body variant is indeed a
phenotypic variant of Alzheimer's disease. Brain Cogn, 1995. 28(3): p. 259-65.
164. Spillantini, M.G., et al., Alpha-synuclein in Lewy bodies. Nature, 1997. 388(6645):
p. 839-40.
165. Weinreb, P.H., et al., NACP, a protein implicated in Alzheimer's disease and
learning, is natively unfolded. Biochemistry, 1996. 35(43): p. 13709-15.
166. Masliah, E., et al., Dopaminergic loss and inclusion body formation in alpha-
synuclein mice: implications for neurodegenerative disorders. Science, 2000.
287(5456): p. 1265-9.
BIBLIOGRAPHY
107
167. Vermes, I., et al., Elevated concentration of cerebrospinal fluid tissue
transglutaminase in Parkinson's disease indicating apoptosis. Mov Disord, 2004.
19(10): p. 1252-4.
168. Segers-Nolten, I.M., et al., Tissue transglutaminase modulates alpha-synuclein
oligomerization. Protein Sci, 2008. 17(8): p. 1395-402.
169. Schmid, A.W., et al., Dissecting the mechanisms of tissue transglutaminase-
induced cross-linking of alpha-synuclein: implications for the pathogenesis of
Parkinson disease. J Biol Chem, 2009. 284(19): p. 13128-42.
170. Bonelli, R.M., et al., Cerebrospinal fluid tissue transglutaminase as a biochemical
marker for Alzheimer's disease. Neurobiol Dis, 2002. 11(1): p. 106-10.
171. Andringa, G., et al., Tissue transglutaminase catalyzes the formation of alpha-
synuclein crosslinks in Parkinson's disease. Faseb J, 2004. 18(7): p. 932-4.
172. Park, S.C., et al., Aging process is accompanied by increase of transglutaminase C.
J Gerontol A Biol Sci Med Sci, 1999. 54(2): p. B78-83.
173. Karpuj, M.V., et al., Prolonged survival and decreased abnormal movements in
transgenic model of Huntington disease, with administration of the
transglutaminase inhibitor cystamine. Nat Med, 2002. 8(2): p. 143-9.
174. Lorand, L. and S.M. Conrad, Transglutaminases. Mol Cell Biochem, 1984. 58(1-
2): p. 9-35.
175. Lai, T.S., et al., Regulation of human tissue transglutaminase function by
magnesium- nucleotide complexes. Identification of distinct binding sites for Mg-
GTP and Mg-ATP. J Biol Chem, 1998. 273(3): p. 1776-81.
176. Aeschlimann, D. and M. Paulsson, Transglutaminases: protein cross-linking
enzymes in tissues and body fluids. Thromb Haemost, 1994. 71(4): p. 402-15.
177. Folk, J.E. and P.W. Cole, Identification of a functional cysteine essential for the
activity of guinea pig liver transglutaminase. J Biol Chem, 1966. 241(13): p. 3238-
40.
178. Choi, K., et al., Chemistry and biology of dihydroisoxazole derivatives: selective
inhibitors of human transglutaminase 2. Chem Biol, 2005. 12(4): p. 469-75.
179. Hausch, F., et al., Design, synthesis, and evaluation of gluten Peptide analogs as
selective inhibitors of human tissue transglutaminase. Chem Biol, 2003. 10(3): p.
225-31.
180. Molberg, O., et al., T cells from celiac disease lesions recognize gliadin epitopes
deamidated in situ by endogenous tissue transglutaminase. Eur J Immunol, 2001.
31(5): p. 1317-23.
BIBLIOGRAPHY
108
181. Maiuri, L., et al., Unexpected role of surface transglutaminase type II in celiac
disease. Gastroenterology, 2005. 129(5): p. 1400-13.
182. de Cristofaro, T., et al., The length of polyglutamine tract, its level of expression,
the rate of degradation, and the transglutaminase activity influence the formation
of intracellular aggregates. Biochem Biophys Res Commun, 1999. 260(1): p. 150-
8.
183. Karpuj, M.V., et al., Prolonged survival and decreased abnormal movements in
transgenic model of Huntington disease, with administration of the
transglutaminase inhibitor cystamine. Nat Med, 2002. 8(2): p. 143-9.
184. Makela, A.R. and C. Oker-Blom, Baculovirus display: a multifunctional technology
for gene delivery and eukaryotic library development. Adv Virus Res, 2006. 68: p.
91-112.
185. Weaver-Feldhaus, J.M., et al., Yeast mating for combinatorial Fab library
generation and surface display. FEBS Lett, 2004. 564(1-2): p. 24-34.
186. Henics, T., et al., Small-fragment genomic libraries for the display of putative
epitopes from clinically significant pathogens. Biotechniques, 2003. 35(1): p. 196-
202, 204, 206 passim.
187. Baneyx, F., Recombinant protein expression in Escherichia coli. Curr Opin
Biotechnol, 1999. 10(5): p. 411-21.
188. Lawn, R.M., et al., The isolation and characterization of linked delta- and beta-
globin genes from a cloned library of human DNA. Cell, 1978. 15(4): p. 1157-74.
189. Dodgson, J.B., J. Strommer, and J.D. Engel, Isolation of the chicken beta-globin
gene and a linked embryonic beta-like globin gene from a chicken DNA
recombinant library. Cell, 1979. 17(4): p. 879-87.
190. Lacy, E., et al., The linkage arrangement of four rabbit beta-like globin genes. Cell,
1979. 18(4): p. 1273-83.
191. Clancy, M.J., et al., Isolation of genes expressed preferentially during sporulation
in the yeast Saccharomyces cerevisiae. Proc Natl Acad Sci U S A, 1983. 80(10): p.
3000-4.
192. Schuler, M.A., et al., Structural sequences are conserved in the genes coding for
the alpha, alpha' and beta-subunits of the soybean 7S seed storage protein. Nucleic
Acids Res, 1982. 10(24): p. 8245-61.
193. Park, J.B. and M. Levine, Cloning, sequencing, and characterization of
alternatively spliced glutaredoxin 1 cDNA and its genomic gene: chromosomal
localization, mrna stability, and origin of pseudogenes. J Biol Chem, 2005.
280(11): p. 10427-34.
BIBLIOGRAPHY
109
194. Barrientos, T., et al., Two novel members of the ABLIM protein family, ABLIM-2
and -3, associate with STARS and directly bind F-actin. J Biol Chem, 2007.
282(11): p. 8393-403.
195. Park, J.H., et al., Molecular cloning, expression, and structural prediction of
deoxyhypusine hydroxylase: a HEAT-repeat-containing metalloenzyme. Proc Natl
Acad Sci U S A, 2006. 103(1): p. 51-6.
196. Zhang, C. and S.H. Kim, Overview of structural genomics: from structure to
function. Curr Opin Chem Biol, 2003. 7(1): p. 28-32.
197. Bussow, K., et al., A method for global protein expression and antibody screening
on high- density filters of an arrayed cDNA library. Nucleic Acids Res, 1998.
26(21): p. 5007-8.
198. Prodromou, C., R. Savva, and P.C. Driscoll, DNA fragmentation-based
combinatorial approaches to soluble protein expression Part I. Generating DNA
fragment libraries. Drug Discov Today, 2007. 12(21-22): p. 931-8.
199. Fields, S. and O. Song, A novel genetic system to detect protein-protein
interactions. Nature, 1989. 340(6230): p. 245-6.
200. Dove, S.L., J.K. Joung, and A. Hochschild, Activation of prokaryotic transcription
through arbitrary protein-protein contacts. Nature, 1997. 386(6625): p. 627-30.
201. Kane, P.M., et al., Protein splicing converts the yeast TFP1 gene product to the 69-
kD subunit of the vacuolar H(+)-adenosine triphosphatase. Science, 1990.
250(4981): p. 651-7.
202. Pelletier, J.N., F.X. Campbell-Valois, and S.W. Michnick, Oligomerization
domain-directed reassembly of active dihydrofolate reductase from rationally
designed fragments. Proc Natl Acad Sci U S A, 1998. 95(21): p. 12141-6.
203. Karimova, G., et al., A bacterial two-hybrid system based on a reconstituted signal
transduction pathway. Proc Natl Acad Sci U S A, 1998. 95(10): p. 5752-6.
204. Galarneau, A., et al., beta-Lactamase protein fragment complementation assays as
in vivo and in vitro sensors of protein protein interactions. Nat. Biotechnol., 2002.
20(6): p. 619-22.
205. Michnick, S.W., Protein fragment complementation strategies for biochemical
network mapping. Curr Opin Biotechnol, 2003. 14(6): p. 610-7.
206. Lipovsek, D. and A. Pluckthun, In-vitro protein evolution by ribosome display and
mRNA display. J Immunol Methods, 2004. 290(1-2): p. 51-67.
207. Mattheakis, L.C., R.R. Bhatt, and W.J. Dower, An in vitro polysome display system
for identifying ligands from very large peptide libraries. Proc. Natl. Acad. Sci.
U.S.A., 1994. 91: p. 9022-9026.
BIBLIOGRAPHY
110
208. Nemoto, N., et al., In vitro virus: bonding of mRNA bearing puromycin at the 3'-
terminal end to the C-terminal end of its encoded protein on the ribosome in vitro.
FEBS Lett, 1997. 414(2): p. 405-8.
209. FitzGerald, K., In vitro display technologies - new tools for drug discovery. Drug
Discov Today, 2000. 5(6): p. 253-258.
210. Wernerus, H. and S. Stahl, Biotechnological applications for surface-engineered
bacteria. Biotechnol Appl Biochem, 2004. 40(Pt 3): p. 209-28.
211. Feldhaus, M.J. and R.W. Siegel, Yeast display of antibody fragments: a discovery
and characterization platform. J Immunol Methods, 2004. 290(1-2): p. 69-80.
212. Ho, M., S. Nagata, and I. Pastan, Isolation of anti-CD22 Fv with high affinity by Fv
display on human cells. Proc Natl Acad Sci U S A, 2006. 103(25): p. 9637-42.
213. Urban, J.H., et al., Selection of functional human antibodies from retroviral display
libraries. Nucleic Acids Res, 2005. 33(4): p. e35.
214. Work, L.M., et al., Vascular bed-targeted in vivo gene delivery using tropism-
modified adeno-associated viruses. Mol Ther, 2006. 13(4): p. 683-93.
215. Oker-Blom, C., K.J. Airenne, and R. Grabherr, Baculovirus display strategies:
Emerging tools for eukaryotic libraries and gene delivery. Brief Funct Genomic
Proteomic, 2003. 2(3): p. 244-53.
216. Smith, G.P., Filamentous fusion phage: novel expression vectors that display
cloned antigens on the virion surface. Science, 1985. 228(4705): p. 1315-7.
217. Houshmand, H., G. Froman, and G. Magnusson, Use of bacteriophage T7
displayed peptides for determination of monoclonal antibody specificity and
biosensor analysis of the binding reaction. Anal Biochem, 1999. 268(2): p. 363-70.
218. Mikawa, Y.G., I.N. Maruyama, and S. Brenner, Surface display of proteins on
bacteriophage lambda heads. J Mol Biol, 1996. 262(1): p. 21-30.
219. Smith, G.P., Filamentous phages as cloning vectors. Biotechnology, 1988. 10: p.
61-83.
220. Scholle, M.D., J.W. Kehoe, and B.K. Kay, Efficient construction of a large
collection of phage-displayed combinatorial peptide libraries. Comb Chem High
Throughput Screen, 2005. 8(6): p. 545-51.
221. Bass, S., R. Greene, and J.A. Wells, Hormone phage: an enrichment method for
variant proteins with altered binding properties. Proteins, 1990. 8: p. 309-314.
222. Barbas, C.F., et al., Assembly of combinatorial antibody libraries on phage
surfaces: The gene III site. Proc. Natl. Acad. Sci. U.S.A., 1991. 88: p. 7978-7982.
BIBLIOGRAPHY
111
223. Di Niro, R., et al., Characterizing monoclonal antibody epitopes by filtered gene
fragment phage display. Biochem J, 2005. 388(Pt 3): p. 889-94.
224. Robben, J., et al., Selection and identification of dense granule antigen GRA3 by
Toxoplasma gondii whole genome phage display. J Biol Chem, 2002. 277(20): p.
17544-7.
225. Cortese, R., et al., Selection of biologically active peptides by phage display of
random peptide libraries. Curr Opin Biotechnol, 1996. 7(6): p. 616-21.
226. Sidhu, S.S., et al., Phage display for selection of novel binding peptides. Methods
Enzymol, 2000. 328: p. 333-63.
227. Kehoe, J.W. and B.K. Kay, Filamentous phage display in the new millennium.
Chem Rev, 2005. 105(11): p. 4056-72.
228. Zanoni, G., et al., In celiac disease, a subset of autoantibodies against
transglutaminase binds toll-like receptor 4 and induces activation of monocytes.
PLoS Med, 2006. 3(9): p. e358.
229. Di Niro, R., et al., Rapid interactome profiling by massive sequencing. Nucleic
Acids Res, 2010.
230. Scanlan, M.J., et al., Characterization of human colon cancer antigens recognized
by autologous antibodies. Int J Cancer, 1998. 76(5): p. 652-8.
231. Scanlan, M.J., et al., Antigens recognized by autologous antibody in patients with
renal-cell carcinoma. Int J Cancer, 1999. 83(4): p. 456-64.
232. Minenkova, O., et al., Identification of tumor-associated antigens by screening
phage-displayed human cDNA libraries with sera from tumor patients. Int J
Cancer, 2003. 106(4): p. 534-44.
233. Alimohammadi, M., et al., Autoimmune polyendocrine syndrome type 1 and
NALP5, a parathyroid autoantigen. N Engl J Med, 2008. 358(10): p. 1018-28.
234. Somers, V., et al., Autoantibody profiling in multiple sclerosis reveals novel
antigenic candidates. J Immunol, 2008. 180(6): p. 3957-63.
235. Hufton, S.E., et al., Phage display of cDNA repertoires: the pVI display system and
its applications for the selection of immunogenic ligands. J Immunol Methods,
1999. 231(1-2): p. 39-51.
236. Jespers, L.S., et al., Surface expression and ligand-based selection of cDNAs fused
to filamentous phage gene VI. Biotechnology (N Y), 1995. 13(4): p. 378-82.
237. Crameri, R., et al., Display of expression products of cDNA libraries on phage
surfaces. A versatile screening system for selective isolation of genes by specific
gene-product/ligand interaction. Eur J Biochem, 1994. 226(1): p. 53-8.
BIBLIOGRAPHY
112
238. McCafferty, J., et al., Phage antibodies: filamentous phage displaying antibody
variable domains. Nature, 1990. 348(6301): p. 552-4.
239. Clackson, T., et al., Making antibody fragments using phage display libraries.
Nature, 1991. 352(6336): p. 624-8.
240. Mueller, M., et al., Identification of Borrelia burgdorferi ribosomal protein L25 by
the phage surface display method and evaluation of the protein's value for
serodiagnosis. J Clin Microbiol, 2006. 44(10): p. 3778-80.
241. Waldo, G.S., et al., Rapid protein-folding assay using green fluorescent protein.
Nat. Biotechnol., 1999. 17(7): p. 691-5.
242. Maxwell, K.L., et al., A simple in vivo assay for increased protein solubility.
Protein Sci., 1999. 8(9): p. 1908-11.
243. Etz, H., et al., Identification of in vivo expressed vaccine candidate antigens from
Staphylococcus aureus. Proc Natl Acad Sci U S A, 2002. 99(10): p. 6573-8.
244. Faix, P.H., et al., Phage display of cDNA libraries: enrichment of cDNA expression
using open reading frame selection. Biotechniques, 2004. 36(6): p. 1018-22, 1024,
1026-9.
245. Zacchi, P., et al., Selecting open reading frames from DNA. Genome Res, 2003.
13(5): p. 980-90.
246. Wigley, W.C., et al., Protein solubility and folding monitored in vivo by structural
complementation of a genetic marker protein. Nat Biotechnol, 2001. 19(2): p. 131-
6.
247. He, M., et al., Detection of protein-protein interactions by ribosome display and
protein in situ immobilisation. N Biotechnol, 2009. 26(6): p. 277-81.
248. Huang, B.C. and R. Liu, Comparison of mRNA-display-based selections using
synthetic peptide and natural protein libraries. Biochemistry, 2007. 46(35): p.
10102-12.
249. Suter, B., S. Kittanakom, and I. Stagljar, Interactive proteomics: what lies ahead?
Biotechniques, 2008. 44(5): p. 681-91.
250. Mortazavi, A., et al., Mapping and quantifying mammalian transcriptomes by RNA-
Seq. Nat Methods, 2008. 5(7): p. 621-8.
251. Einat, P., D. Zevin-Sonkin, and S. Gilad, Methods for Cloning Nucleic Acids in a
Desired Orientation in PCT Patent Publication No. WO 2004/111182. 2004.
252. Carninci, P., et al., Normalization and subtraction of cap-trapper-selected cDNAs
to prepare full-length cDNA libraries for rapid discovery of new genes. Genome
Res, 2000. 10(10): p. 1617-30.
BIBLIOGRAPHY
113
253. Mariani, P., et al., Ligand-induced conformational changes in tissue
transglutaminase: Monte Carlo analysis of small-angle scattering data. Biophys J,
2000. 78(6): p. 3240-51.
254. Lou, J., et al., Antibodies in haystacks: how selection strategy influences the
outcome of selection from molecular diversity libraries. J Immunol Methods, 2001.
253(1-2): p. 233-42.
255. Orru, S., et al., Proteomics identification of acyl-acceptor and acyl-donor
substrates for transglutaminase in a human intestinal epithelial cell line.
Implications for celiac disease. J Biol Chem, 2003. 278(34): p. 31766-73.
256. Lindsley, D., et al., Spontaneous ribosome bypassing in growing cells. J Mol Biol,
2005. 349(2): p. 261-72.
257. Lou, J., et al., Antibodies in haystacks: how selection strategy influences the
outcome of selection from molecular diversity libraries. J. Immunol. Methods,
2001. 253(1-2): p. 233-42.
258. Hoskins, R.A., et al., Rapid and efficient cDNA library screening by self-ligation of
inverse PCR products (SLIP). Nucleic Acids Res, 2005. 33(21): p. e185.
259. Secco, P., et al., Antibody library selection by the {beta}-lactamase protein
fragment complementation assay. Protein Eng Des Sel, 2009. 22(3): p. 149-58.
260. Thapa, A., et al., Purification of inclusion body-forming peptides and proteins in
soluble form by fusion to Escherichia coli thermostable proteins. Biotechniques,
2008. 44(6): p. 787-96.
261. Esposito, D. and D.K. Chatterjee, Enhancement of soluble protein expression
through the use of fusion tags. Curr Opin Biotechnol, 2006. 17(4): p. 353-8.
262. Piredda, L., et al., Identification of 'tissue' transglutaminase binding proteins in
neural cells committed to apoptosis. Faseb J, 1999. 13(2): p. 355-64.
263. Fesus, L., et al., Transglutaminase-sensitive glutamine residues of human plasma
fibronectin revealed by studying its proteolytic fragments. Eur J Biochem, 1986.
154(2): p. 371-4.
264. Jones, R.A., et al., Reduced expression of tissue transglutaminase in a human
endothelial cell line leads to changes in cell spreading, cell adhesion and reduced
polymerisation of fibronectin. J Cell Sci, 1997. 110(Pt 19): p. 2461-72.
265. Waldo, G.S., Genetic screens and directed evolution for protein solubility. Curr
Opin Chem Biol, 2003. 7(1): p. 33-8.
266. Margulies, M., et al., Genome sequencing in microfabricated high-density picolitre
reactors. Nature, 2005. 437(7057): p. 376-80.
BIBLIOGRAPHY
114
267. Pendergraft, W.F., 3rd, et al., Autoimmunity is triggered by cPR-3(105-201), a
protein complementary to human autoantigen proteinase-3. Nat Med, 2004. 10(1):
p. 72-9.
268. Lin, Y.F., et al., Nonmuscle myosin IIA (myosin heavy polypeptide 9): a novel class
of signal transducer mediating the activation of G alpha h/phospholipase C-delta 1
pathway. Endocrinology. 151(3): p. 876-85.
269. Ruhl, M., et al., Eukaryotic initiation factor 5A is a cellular target of the human
immunodeficiency virus type 1 Rev activation domain mediating trans-activation. J
Cell Biol, 1993. 123(6 Pt 1): p. 1309-20.
270. Choi, Y.A., et al., Secretome analysis of human BMSCs and identification of
SMOC1 as an important ECM protein in osteoblast differentiation. J Proteome Res.
9(6): p. 2946-56.
271. Podhajcer, O.L., et al., The role of the matricellular protein SPARC in the dynamic
interaction between the tumor and the host. Cancer Metastasis Rev, 2008. 27(3): p.
523-37.
272. Aeschlimann, D., O. Kaupp, and M. Paulsson, Transglutaminase-catalyzed matrix
cross-linking in differentiating cartilage: identification of osteonectin as a major
glutaminyl substrate. J Cell Biol, 1995. 129(3): p. 881-92.
273. Jeong, J.M., et al., The fibronectin-binding domain of transglutaminase. J Biol
Chem, 1995. 270(10): p. 5654-8.
274. Radek, J.T., et al., Affinity of human erythrocyte transglutaminase for a 42-kDa
gelatin- binding fragment of human plasma fibronectin. Proc Natl Acad Sci U S A,
1993. 90(8): p. 3152-6.
275. Bredt, D.S. and S.H. Snyder, Nitric oxide: a physiologic messenger molecule. Annu
Rev Biochem, 1994. 63: p. 175-95.
276. Dedio, J., et al., NOSIP, a novel modulator of endothelial nitric oxide synthase
activity. Faseb J, 2001. 15(1): p. 79-89.
277. Dreyer, J., et al., Nitric oxide synthase (NOS)-interacting protein interacts with
neuronal NOS and regulates its distribution and activity. J Neurosci, 2004. 24(46):
p. 10454-65.
278. Fasano, A., et al., Zonulin, a newly discovered modulator of intestinal permeability,
and its expression in coeliac disease. Lancet, 2000. 355(9214): p. 1518-9.
279. Oesterreich, S., et al., High rates of loss of heterozygosity on chromosome 19p13 in
human breast cancer. Br J Cancer, 2001. 84(4): p. 493-8.
280. Hammerich-Hille, S., et al., Low SAFB levels are associated with worse outcome in
breast cancer patients. Breast Cancer Res Treat. 121(2): p. 503-9.
BIBLIOGRAPHY
115
281. Burley, S.K., et al., Molecular structure of leucine aminopeptidase at 2.7-A
resolution. Proc Natl Acad Sci U S A, 1990. 87(17): p. 6878-82.
282. Grembecka, J. and P. Kafarski, Leucine aminopeptidase as a target for inhibitor
design. Mini Rev Med Chem, 2001. 1(2): p. 133-44.
283. Pahl, H.L., Activators and target genes of Rel/NF-kappaB transcription factors.
Oncogene, 1999. 18(49): p. 6853-66.
284. Baeuerle, P.A. and D. Baltimore, I kappa B: a specific inhibitor of the NF-kappa B
transcription factor. Science, 1988. 242(4878): p. 540-6.
285. Nakanishi, C. and M. Toi, Nuclear factor-kappaB inhibitors as sensitizers to
anticancer drugs. Nat Rev Cancer, 2005. 5(4): p. 297-309.
286. Leonardi, A., et al., CIKS, a connection to Ikappa B kinase and stress-activated
protein kinase. Proc Natl Acad Sci U S A, 2000. 97(19): p. 10494-9.
287. Meunier, L., et al., A subset of chaperones and folding enzymes form multiprotein
complexes in endoplasmic reticulum to bind nascent proteins. Mol Biol Cell, 2002.
13(12): p. 4456-69.
288. Chen, W., et al., A possible biochemical link between NADPH oxidase (Nox) 1
redox-signalling and ERp72. Biochem J, 2008. 416(1): p. 55-63.
289. Finkel, T. and N.J. Holbrook, Oxidants, oxidative stress and the biology of ageing.
Nature, 2000. 408(6809): p. 239-47.
290. Marzari, R., et al., Molecular dissection of the tissue transglutaminase
autoantibody response in celiac disease. J Immunol, 2001. 166(6): p. 4170-6.