university of macedonia department of balkan, slavic … · department of balkan, slavic and...
TRANSCRIPT

1
University of Macedonia
Department of Balkan, Slavic and Oriental Studies
MA in Politics and Economics of Contemporary Eastern and South-Eastern Europe
Evaluation of the Level of Corruption in Greece and
the Impact on Quality of Government and Public Debt
Rodney Jetton
Department of Balkan, Slavic and Oriental Studies, University of Macedonia, 156 Egnatia str, 540 06
Thessaloniki, Greece, + 30 (0) 2310 891377
http://mabsos.uom.gr/

2
ABSTRACT This essay offers a helpful overview on both the definition of and main methods for measuring
corruption along with a concise but comprehensive survey of best recent scholarship concerning the
destructive cycle of corruption in Greece. Included is a detailed analysis of four reliable indices of
corruption and of empirical studies of its association with high tax burdens, government spending,
and quality of government (QoG). Taken together, this material makes clear the ways in which
corruption is impacting governance in the Hellenic Republic and what it is costing the Greek
people. Also presented here are 35 suggestions for reforms that can help to reduce corruption and
increase tax revenue by as much as €28 billion annually, thereby allowing for rapid repayment of
Greece’s €320 billion public debt. Resulting in a higher QoG, improved public trust and increased
revenues that would permit lowering tax rates.
Keywords
corruption, shadow economy, non-perception methods, perception methods, corruption perception
index, tax reform
3
Table of Contents ABSTRACT ........................................................................................................................................................... 2
Table of Contents ............................................................................................................................................... 3
Figures ................................................................................................................................................................ 4
INTRODUCTION .................................................................................................................................................. 5
SECTION 1. DEFINING & MEASURING CORRUPTION ......................................................................................... 7
1.1. NON-PERCEPTION BASED METHODS ...................................................................................................... 7
1.2. PERCEPTION BASED METHODS ............................................................................................................... 8
1.3. LITERATURE REIVIEW ............................................................................................................................ 10
SECTION 2. MEASURING CORRUPTION IN GREECE .......................................................................................... 21
2.1. GREECE & THE CORRUPTION PERCEPTIONS INDEX .............................................................................. 22
2.2. GREECE & THE GLOBAL CORRUPTION BAROMETER ............................................................................. 25
2.3. GREECE & GLOBAL COMPETITIVE INDEX .............................................................................................. 26
2.4. GREECE & SUSTAINABLE GOVERNANCE INDICATORS........................................................................... 27
2.5. ECONOMETRICAL APPROACHES ........................................................................................................... 30
2.5.1. THE IMPACT OF CPI ON TAX BURDEN: REGRESSION ANALYSIS ..................................................... 30
2.5.2. CPI & GDP BASIC CORRELATION ..................................................................................................... 31
2.5.3. QoG & GOVT. SPENDING AS % OF GDP BASIC CORRELATION ....................................................... 32
2.5.4. THE IMPACT OF GOVT. SPENDING ON QoG: REGRESSION ANALYSIS ............................................ 33
SECTION 3. COST OF GREEK CORRUPTION....................................................................................................... 35
3.1. FINANCIAL COST .................................................................................................................................... 35
3.2. INEQALITY & POVERTY .......................................................................................................................... 38
3.3. POPULATION DECLINE ........................................................................................................................... 41
SECTION 4. ANTI-CORRUPTION REFORMS ....................................................................................................... 44
CONCLUSION .................................................................................................................................................... 54
REFERENCES ..................................................................................................................................................... 58

4
Figures Figure 1: CPI Country coverage and sources ................................................................................................... 10
Figure 2: National Integrity Systems Assessment – Greece ............................................................................ 11
Figure 3: Shadow Economy estimates -Greece ................................................................................................ 13
Figure 4: Greek shadow economy 1999- 2015 ................................................................................................ 14
Figure 5: Greek Undeclared Work …………………………………………………………………………...14
Figure 6: Greek Uncollected Tax Debt ............................................................................................................ 15
Figure 7: Currency Circulation and Card Usage .............................................................................................. 16
Figure 8: VAT Revenue - Greece .................................................................................................................... 17
Figure 9: Tax Law Changes in Greece ............................................................................................................. 18
Figure 10: Total Tax Revenue - Greece ........................................................................................................... 18
Figure 11: Estimate of Shadow Economy Costs .............................................................................................. 19
Figure 12: Eurobarometer on Corruption 2014 ................................................................................................ 21
Figure 13: Eurobarometer on Corruption 2009 ................................................................................................ 22
Figure 14: CPI - Greece 1995 - 2017 ............................................................................................................... 23
Figure 15: CPI - Selected Countries 2008 – 2017 ............................................................................................ 24
Figure 16: CPI - EU, BS-10, BAL-13 2008 - 2017 .......................................................................................... 24
Figure 17: GCB - Institution Scores 2013 ........................................................................................................ 25
Figure 18:GCB Institution Scores 2013 ........................................................................................................... 25
Figure 19: GCI -Greece 2002/03-2017/18 ....................................................................................................... 26
Figure 20: GCI -1st Pillar 2006/07-2017/18 .................................................................................................... 27
Figure 21: Stiftung Sustainable Governance Indicators -Greece ..................................................................... 28
Figure 22: Stiftung Sustainable Governance Indicators -selected countries .................................................... 29
Figure 23:Regression Model - CPI and Tax Burden ........................................................................................ 30
Figure 24: Dummy Variable Model ................................................................................................................. 31
Figure 25: CPI & GDP Basic Correlation ........................................................................................................ 31
Figure 26: OoG -Greece 1998-2016 & Spending on Govt. as % of GDP 2000-2015 ..................................... 32
Figure 27: Regression Model – QoG and Government Spending .................................................................... 33
Figure 28: Scatter Diagram - QoG and Government Spending ....................................................................... 34
Figure 29: Summary of Academic Tax Cost Estimates of Corruption in Greece ............................................ 36
Figure 30: New Revenue Estimates from Reducing Corruption ...................................................................... 37
Figure 31: Greece's Debt Due .......................................................................................................................... 38
Figure 32: Europe Poverty Risk 2008 vs. 2014 ............................................................................................... 39
Figure 33: Percentage of Deprivation in Greece 2003-2014 ............................................................................ 40
Figure 34: Percentage of Greeks in Poverty ..................................................................................................... 41
Figure 35: EU Population Change 2015 .......................................................................................................... 42
Figure 36: Greece Population Change ............................................................................................................. 43
Figure 37: Tax Administration Anti-Corruption Reforms ............................................................................... 49
Figure 38: Overall Anti-Corruption Reforms ................................................................................................... 52
Figure 39: Greece's CPI Score Compared to Others ........................................................................................ 55

5
INTRODUCTION “There are several good protections against temptations, but the surest is cowardice.”
Mark Twain, Following the Equator, 1897
The 2010 sovereign debt crisis in Greece both exposed the economic imbalances within the
eurozone and highlighted the vulnerability of the euro, bringing intense global scrutiny on both
Greece’s government and economy. Since then, considerable research has been conducted in an
effort to determine how the Hellenic Republic accrued so much debt and why it continues to
languish in an ongoing recession nearly a decade later. These studies almost invariably speak of
corruption, bribery, embezzlement, patronage, tax evasion, and/or the ever-growing shadow
economy.1
The austerity measures imposed on Greece by the European Union in response to the crisis
have raised taxes and lowered incomes, thereby increasing the temptation for public servants to
abuse their power and leaving average citizens scrambling for ways to survive. This toxic
environment has had devastating consequences for a country with weak institutions and low quality
of government (QoG). Thus, from 2009 to 2014, nominal GDP fell by €55 billion or 24.7%,
unemployment increased to 16.9% as one million workers lost their jobs, and income from wages
dropped by 27.4%. At the same time, Greek deficits added €42 billion to the public debt and the
Troika2 loans to Greece totaled €230 billion (Giannitsis & Zografakis, 2015). Greeks have
moreover seen their property values drop by 70% and investments by 40% as economic growth has
ground to a standstill, leaving the national debt at €320 billion, roughly 180% of annual GDP
(Danopoulos, 2014).
This essay offers an evaluation of corruption in Greece, a topic that today is inseparable from
the effects that the fiscal crisis has had on the country’s citizens. Thus, while the Corruption
Perception Index (CPI) produced by Transparency International (TI) indicates that corruption was
already rampant in Greece before the crisis, it has manifestly made a dire situation worse. So also
the 2012 National Integrity Systems Assessment of the Hellenic Republic by TI Greece (TI-G), a
comprehensive, 197-page evaluation of the country’s civil society, put the cost of corruption, tax
evasion, and other illegal activities at over €70 billion annually (TI-G, 2012). Other studies have
corroborated this finding, including one that estimated the resulting loss of tax revenue at €28
billion, a sum equivalent to nearly 10% of Greece’s public debt (Dellas et al., 2017).
This discussion is organized as follows. Section 1 defines and explores briefly methods for
measuring corruption, including both perception and non-perception approaches. Particular
attention is paid to formal empirical academic studies of the relationship between corruption and the
shadow economy and between public trust and QoG. The next section provides an in-depth look at
Greece’s historical performance on the CPI in comparison with the European Union (EU), United
States (US), and Black Sea and other Balkan countries. Also presented here is a review of Greece’s
rankings on other reputable indices and an econometric approach that involves two simple linear
1 Shadow economy is a broad term; synonyms include informal, black, grey, or underground economy. Here notion is
understood in terms of the framework of Schneider and Enste, which takes into account goods and services that are
produced legally but deliberately concealed from the government in order to evade taxes or fees or to meet set standards
(Schneider & Enste, 2000, p. 79). 2 The Troika consists of the European Commission, European Central Bank, and International Monetary Fund.

6
regression models comparing the CPI and Greece’s tax burden as a percentage of GDP and the
negative relationship between government spending and QoG. The correlation between Gross
Domestic Product (GDP) and corruption is further observed. Section 3 explores the ongoing costs
of corruption in Greece, estimated to be as high as €28 billion annually, as well as two non-financial
costs, namely inequality and population decline. Section 4 assesses some 35 possible reforms that
have been advanced by the EU Commission, TI, and other organizations seeking to reduce
corruption in Greece. The discussion concludes with an overall assessment of how this cycle of
corruption emerged in Greece, its costs, and the reforms necessary to break it, closing with a
personal reflection from the author.

7
SECTION 1. DEFINING & MEASURING CORRUPTION
Corruption is costly. Thus the World Bank estimates the total value of bribes paid annually
worldwide at around $1 trillion, and the World Economic Form pegs overall corruption costs at 5%
of global GDP or $2.6 trillion (Heywood & Rose, 2014). These monetary costs are mind-boggling,
and the human costs are tragic. Corruption disrupts social equilibrium, reduces confidence in the
government, and, most dangerous of all, erodes trust among individuals (Azariadis & Ioannides,
2015; Kaplanoglou & Rapanos, 2012). It increases inequality, reduces economic growth, and
discourages foreign direct investment in a country (Chene, 2014). It allows those with money and
connections to pick winners and losers while fostering uncertainty and waste, usually at a high cost
to the public. Like an unhealthy contagion, it spreads unscrupulousness and demoralizes honesty
(Shacklock et al., 2006).
Corruption has proved difficult to define, as it encompasses a wide range of activities,
including bribery, embezzlement, fraud, patronage, extortion, theft, nepotism, conflicts of interest,
and tax evasion. Most researchers also distinguish grand from petty corruption. The former
involves high-government officials who make significant policy or procurement decisions,3 while
the latter involves low-level bureaucratic officials and small amounts of money relating to, for
example, traffic tickets or building permits (Rohwer, 2009). One definition that embraces both
grand and petty corruption is “behavior that deviates from the formal duties because of private
gains” (Papaconstantinou, 2013, p. 3). Such behavior occurs most often when public power exerts
control or authority over private wealth without accountability or established, enforceable rules. TI
accordingly uses Lambsdorff’s definition for corruption as “the abuse of entrusted power for private
gain” (Lambsdorff, 1999, p. 5). This essay relies on an expanded definition that takes into account
the widespread problem of tax evasion in Greece that involves both corrupt tax officials and high-
level politicians.
1.1 . NON-PERCEPTION BASED METHODS
The lack of agreement regarding the definition of corruption is paralleled by the healthy
debate regarding how best to measure it. Perception-based methods rely on reports, surveys,
interviews, anecdotes, and structural evaluations to determine levels of corruption, providing a
glimpse into its various different forms. Some scholars, however, argue such methods are
subjective and unreliable and recommend instead non-perception-based methods, which are less
concerned with individuals’ subjective experiences, as more quantitative, and therefore more
objective and quantifiable, though reliable data are often difficult to obtain in this manner as well
(Miller, 2006). All methods of course involve making precise distinctions regarding various types
of corruption, units to be measured, and transaction points in order to account for the variety of
factors impacting and impacted by corruption (Heywood & Rose, 2014).
Non-perception measurements fall into three broad categories based on whether they are
made at the macro, sectoral, or micro levels. Macro measurements include such national statistics
3 Grand corruption is also called political corruption because it typically involves the exercise of undue influence over
politicians in major policy matters (Dahlstrom, 2012).

8
as GDP, unemployment, and tax revenues; sectoral measurements include statistics relating to
healthcare, military, and education; and micro measurements involve the data of companies, non-
government organizations (NGOs), and individuals. The path that a researcher takes naturally
depends greatly on the topic of study and the available data. Data can be obtained directly through
basic research, surveys, or auditing records. Also effective are approaches that identify
discrepancies in such variables as spending and reported incomes and labor market participation.
Econometricians use this kind of data to conduct model-based testing in an effort to identify
corruption in a scientific and objective manner (Duncan, 2006).
Researchers tend to encounter three main problems when using model based-approaches.
First, because corruption is clandestine, first-hand experiences typically cannot supply sufficient
data to be accurate. Second, models must be able to account for the many complex interactions and
variables that create and sustain corruption. Third, in many countries, especially undeveloped ones,
only sectoral and micro measurements are available owing to the paucity of reliable national data
(Duncan, 2006).
1.2. PERCEPTION BASED METHODS
The issues with the data just described are one reason that perception-based measurements
have proved so helpful in assessing levels of corruption worldwide. Such methods can be well
understood by reviewing the history and methodology of one of the most respected corruption
indices, the Corruption Perception Index put out by TI (Dreher & Herzfeld, 2005).
Corruption has been endemic in societies since antiquity. The World Bank has identified it as
“the single biggest obstacle to economic and social development” (Papaconstantinou, 2013). For
this reason, governments, lenders, and aid agencies, including the International Monetary Fund
(IMF), World Bank, EU, UN, US, and various NGOs, have sought high-quality analysis regarding
the levels of corruption in countries in which they operate (Dreher & Herzfeld, 2005; Heywood &
Rose, 2014). In the past, researchers had very little reliable data of this sort, but numerous indices
that track and document corruption have become available since the mid-1990s, in particular
Business International (BI), World Development Report (WDR), International Country Risk Guide
(ICRG), and the Institute for Management Development (IMD). Also important as overall
institutional indicators are the World Bank’s Governance Indicators and Ease of Doing Business
Index (EDB), the Heritage Foundation’s Index of Economic Freedom (IEF), Bertelsmann Stiftung’s
Sustainable Governance Indicators (SGI), and the World Economic Forum’s Global Competitive
Index (GCI). TI is the most-recognized anti-corruption organization; thus its Global Corruption
Barometer (GCB), Bribes Payers Index (BPI), and the “poll of polls” known as the Corruption
Perception Index (CPI) that debuted in 1995 are regularly cited in the media and used by scholars
(Dreher & Herzfeld, 2005). Regrettably, Greece consistently scores near the bottom among EU
countries on such indices.
This essay relies on the CPI for Greece, which has a robust track record for measuring and
comparing the Hellenic Republic with neighboring countries.4 The reliability of the CPI has
4 The CPI index has been used in countless studies of corruption, and its results are extensively reported by leading
news outlets around the globe when they are announced every year. Its influence is considerable; in 1996, the CPI

9
naturally been called into question, Frederik Galtung’s study titled “Measuring the Immeasurable:
Boundaries and Functions of (Macro) Corruption Indices” being one such critique; but even he
credited the CPI with “catapulting” corruption into the national discourse and referred to 1995 as a
“watershed” moment for the anti-corruption movement (Galtung, 2006). Similarly, Johann
Lambsdorff admitted in his defense of the CPI, titled Measuring Corruption—The Validity and
Precision of Subjective Indicators (CPI), that “no single source or polling method has yet been
developed that combines a perfect sampling frame, a satisfactory country coverage and a fully
convincing methodology to produce comparative assessments”; it is for this reason, according to
him, that a composite index like the CPI represents a better measure (Lambsdorff, 2006, p. 81). It is
important to keep in mind the perception-based nature of the CPI, specifically its focus on the
perceptions of public officials, as it aggregates corruption-related data that have been gathered by
professionals in business and academia from around the world with expertise in the various
countries included in the index. Over the years, the CPI has relied on annual sets of some 12 to 18
distinct sources representing some 8 to 17 independent institutions; Greece has been represented by
anywhere from 6 to 9 such sources (see Figure 1). The sources rank the various nations surveyed
and measure overall levels of corruption in a manner that allows for consistent comparisons among
countries (TI, 2016; Rohwer, 2009).
The questions posed in these surveys concern the use of public office for private gain,
covering such topics as bribery of public officials, kickbacks in the context of procurement projects,
and embezzlement of public property as well as anti-corruption efforts and institutional efficiency.
Each year, the effort is made to improve the methodologies and results. Thus, for example, in the
period from 1995 to 2012, countries were ranked on a 0 to 10 scale proceeding from high levels of
corruption to high levels of transparency, but beginning in 2013 a 100-point scale was substituted.
In terms of the process of creating the index, TI, once it has received the scores, standardizes the
data and calculates the averages and the measures of uncertainty. In order to smooth the data, the
CPI includes statistics from the past two years’ surveys in each annual report, though this manner of
presentation complicates year-to-year comparisons (TI, 2016; Rohwer, 2009).
ranking of Pakistan as the second most corrupt nation (behind Nigeria) led to the removal of that country’s prime
minister, and the 1997 Bolivian presidential race was impacted by release of the CPI results just before voting took
place (Galtung, 2006).

10
Figure 1: CPI Country coverage and sources
CPI 1995-2016 Country Coverage & Sources
Year Number of
Countries
Included
Greek
Sources
Number of
Sources
Number of
Independent
Institutions 1995 41 - 7 3
1996 54 - 10 6
1997 52 - 7 6
1998 85 9 12 7
1999 99 9 17 10
2000 90 8 16 8
2001 91 8 14 7
2002 102 9 15 10
2003 133 9 17 13
2004 146 9 18 12
2005 159 9 16 10
2006 163 7 12 9
2007 180 6 14 12
2008 180 6 13 11
2009 180 6 13 10
2010 178 6 13 10
2011 182 8 13 17
2012 178 7 13 12
2013 175 7 13 12
2014 174 7 12 11
2015 167 7 12 11
2016 177 7 13 12 Source: Annual reports available on TI’s website.
1.3. LITERATURE REIVIEW Having defined corruption and distinguished non-perception-based and perception-based
approaches to measuring it, it is now possible to appreciate fully the literature on corruption in
Greece. Since the 2010 debt crisis, research on the topic has proliferated as scholars have sought to
assess the extent of corruption in the country, its relationship to the ongoing recession,5 its cost,
effective measures to control it, and the willingness of the Greek people to tolerate it (Azariadis &
Ioannides, 2015). The following survey of this material begins with overall assessments of Greek
corruption and then explores in turn econometric models for tax evasion, which is one of Greece’s
most pressing issues, before turning briefly to the unintended and surprising reaction to the Greek
government’s 2015 capital controls introducing electronic payments. Next and perhaps most
importantly, the discussion will focus on two papers that explore the links among QoG, public trust,
and corruption. Lastly, a brief account is provided of the manner in which taxes are paid in Greece
and the points in the process at which corruption is most likely to occur.
5 Given the recession’s duration and depth, it can now be classified as a depression by economists and researchers
(Economides et al., 2017).

11
TI-G’s 2012 National Integrity Systems Assessment, mentioned in the introduction, is one of
the most comprehensive studies undertaken since the crisis, being based on two years of qualitative
research involving in-depth interviews and field tests. The focus was on 4 foundational areas and 12
institutions (also referred to as “pillars”), assessing capacity, governance, and roles in anti-
corruption efforts.6 The overall scores for each pillar were not encouraging (Figure 2), indicating
that, while Greece’s legal framework was sufficient to fight corruption, the state tolerated failure to
comply with the law and, in some instances, even encouraged corruption. The assessment offered
numerous suggestions for improvements—covered below in Section 4—and its last line was
particularly sobering: “Therefore, it is made clear that the problem of corruption in Greece is mainly
the result of a crisis of values” (TI-G, 2012, p. 177).
Another detailed
report worthy of mention in
this context is the Greek
Annex to the EU Anti-
Corruption Report for 2014,
which originated in a 2012
agreement between Greek
officials and the European
Commission Task Force on a
national action plan for
fighting corruption in
Greece. This report called
for the appointment of a
national anti-corruption
coordinator to oversee
execution of the plan and
emphasized that only one of
the 27 recommendations by
the Council of Europe’s
Group of States against
Corruption (GRECO) had
been fully implemented.
The report was critical of
Greece’s “piecemeal” and
“complex” approach to
fighting corruption as well as
the short statute of
limitations and special
immunity that high government officials enjoyed in the performance of their duties, all of which
have impeded the prosecution of corrupt officials. In addition, the report drew attention to flaws in
Greece’s taxation system and public procurement processes and the financing of its political parties
6 It should be noted that the media pillar ranked near the bottom in the assessment, though the media are often
mentioned in studies of corruption in Greece. Thus the TI-G pointed out that at the time a mere six businessmen owned
a sizable percentage of the Greek media market, even as licensing and tax policies have been keeping media outlets
dependent on the government and thereby setting up a possible quid pro quo situation.
Figure 2: National Integrity Systems Assessment – Greece

12
that created opportunities for corruption along with its rating as “partially free” on the 2013
Freedom of the Press Index (EU Commission, 2014).
One study that deserves particular attention in this context is a recent working paper titled
“Thinking about Corruption in Greece” by Costas Azariadis and Yannis Ioannides, who strove to
answer the question of “why Greek society tolerates so much corruption” (p. 2). They reviewed the
so-called “growth” theory and ways in which bribes, embezzlement, and tax evasion limit economic
growth and increase the tax burden on compliant taxpayers. Drawing attention to Greece’s
continued failure to fulfill its obligations under the OECD Anti-Bribery Convention—which
requires lobbyists to register with the government and to disclose all contacts with public officials—
the authors also described the cozy relationship between the government and the media with respect
to the renewal of licensing agreements, one result being a lack of media exposure for corruption
cases in Greece. From this perspective, corruption and tax evasion are related, since the state
permits the latter through the bribery of both revenue officials on the front lines and high-ranking
politicians with the power to intervene on behalf of supporters. Such antisocial behavior, according
to Azariadis and Ioannides, can be changed, but doing so in Greece would require an improvement
in the quality of public services so as to win back the trust of the populace. Thus, there is no sense
of shame on the part of Greek citizens or public officials when it comes to corruption—this being an
indication that social equilibria are amiss. Polling indicates that the lack of trust serves as
justification for corruption; thus in answer to a question on a survey administered in 2000 asking
whether it was “justifiable to get benefits from the state that one is not entitled to,” while more than
60% of respondents in most countries answered in the negative, a whopping 80% of those in Greece
answered in the affirmative (p. 18). The various links among corruption, tax evasion, and Greece’s
fiscal crisis thus contributed to a sorrowful assessment that depicts the country as trapped in a
vicious circle of low quality of government, lack of trust, tax evasion, corruption, and economic
recession. Among the policy recommendations made by these researchers are measures for the
protection of whistleblowers, full disclosure of lobbying activities, elimination of the statute of
limitations on crimes by high-ranking government officials, empowering the Supreme Audit
Council in procurement actions, and enacting 12-year term limits for members of parliament. They
even go as far as to call for an EU supranational institution empowered to audit and investigate
corruption independently (Azariadis & Ioannides, 2015).
The first interdisciplinary review of tax evasion and the size and nature of Greece’s shadow
economy in relation to corruption was undertaken in 2016 by Aristidis Bitzenis, Vasileios Vlachos,
and Friedrich Schneider. They set out to identify policy changes that could transfer this economic
activity to the official sector based on a comparison of studies from before and after the crisis, and
their analysis demonstrated that Greece was experiencing elevated levels of corruption in
connection with a large shadow economy even before 2010 (Figure 3). Using CPI scores and a
multiple-indicators-multiple-causes (MIMIC) approach to evaluate 28 EU nations and 8 non-EU
nations, they were able to estimate the size of the shadow economy as a percentage of GDP. The
levels of direct and indirect taxes, social security contributions, business freedom, the quality of
state institutions, unemployment rates, tax morale, and GDP growth were all found to have
contributed, over time, to the development of the shadow economy. Factors such as participation in
the labor force, local currency per-capita, and GDP per capital were identified as indicators of the
relationship between the shadow and official economies. The Greek shadow economy was thus

13
revealed as one of the most extensive among the Organisation for Economic Co-operation and
Development (OECD) countries, but it was argued that a sizable portion of it could be transferred to
the official economy were the reforms implemented. The authors further pointed out that
clientelism and rent-seeking impair public administration, decreasing trust and tax morale and
increasing the stress on the official Greek economy caused by high unemployment, tax burdens, and
levels of self-employment and by low GDP growth—all of which affects the size of the shadow
economy. Recommendations accordingly included lowering the tax burden, improving tax
enforcement, and shifting tax burdens from labor to consumption. (Bitzenis et al., 2016)
Figure 3: Shadow Economy estimates -Greece
Mai Hassan and Friedrich Schneider have conducted similar research on shadow economies
as a percentage of GDP in 157 countries using a MIMIC model. Analyzing data from 1999 to 2013,
they found that higher taxes and excessive regulation encouraged the growth of shadow economies
and that countries characterized by high levels of self-employment and high unemployment rates
experienced particularly intense shadow economic activity. Of particular interest for the present
discussion are the results for Greece, in which the increase in the shadow economy since the crisis

14
(to over 40%) has been much larger than that for other countries hard hit by the economic crisis. A
comparison of Greece with Bulgaria, Portugal, Cyprus, and the US is presented in Figure 4.
Figure 4: Greek shadow economy 1999- 2015
Percentage Size of the Shadow Economy 1999-2013
Country 99 00 01 02 03 04 05 06 07 08 09 10 11 12 13 Avg. World
Rank
Greece 28.5 28.1 27.6 30 28.8 28.2 29.4 28.5 29.9 30.7 35.7 37.6 42.3 43.7 39.4 32.56 77 Bulgaria 36 42.5 37.6 31.6 31.9 31.7 32.5 33.2 33.1 34.4 36 37.3 34 33.6 35.6 34.7 85
Cyprus 29.2 28.6 27.8 26.6 33.1 33.2 34.3 34.4 36.4 37.3 29.3 29.7 30.6 32.6 33.8 32 75 Portugal 23 23.3 24 25.5 26 25.7 26.5 25.4 24.1 25.3 26 26.9 27.3 26 26.4 25.4 45
USA 8,8 8.9 9 9.4 9 8.5 8.4 8.7 9.4 10.5 10.6 10.5 9 8.6 8.3 9.1 2 Source: Hassan & Schneider (2016)
Moreover, other empirical research using both direct and indirect approaches to measure
corruption, tax evasion, and the size of the Greek shadow economy (e.g., Matsaganis &
Flevotomou, 2010; Katsios, 2006; Litina & Palivos, 2011; Dellas et al., 2017; Artavanis et al.,
2015) has confirmed its status as an ongoing problem in Greece over the past two decades that has
worsened since the crisis. Among the themes that recur in these studies are polling showing that
large numbers of Greeks believe cheating on taxes to be justifiable, the erosion of trust caused by
the corruption of political officials as a justification for tax evasion, the contribution of low QoG
and poor public institutional performance to tax evasion, the over-complexity of the Greek tax code,
the need to lower tax rates, the role that tax evasion plays in inequality by shifting the tax burden
from higher to middle and lower incomes,7 the ineffectiveness of tax enforcement efforts owing to
the rarity of audits and the low penalties involved, and the loss of income to the shadow economy as
a cause of budget deficits and growing public debt.
Across these studies, the significant impact of revenue from a growing shadow economy on
Greece’s public debt problem is clear. Additionally, the study using a dual economy model (Dellas
et al., 2017) indicated that the Troika’s projections of tax increases and spending reductions were
inaccurate because they failed to account for Greece’s shadow economy.
7 The chief income tax-evaders were found to be doctors, lawyers, engineers, educators, and members of the media; that
is, the professional, higher-income earners were cheating the most, causing lower salaried labors and pensioners to pay
a larger proportion of the tax burden (Artavanis et al., 2015).

15
Paradoxically, the 2013 and 2017 International Monetary Fund (IMF) country reports on the
Hellenic Republic somewhat contradicted the austerity measures that the fund had forced on Greek
citizens in the Memorandums of Understanding (MoU) as part of the Troika. Use of a dynamic
stochastic general equilibrium (DSGE)
model confirmed the structural problems
in the Greek economy regarding
production and labor inefficiencies, and
the country report also examined Greece’s
revenue administration, pointing out many
of the same flaws identified in the above
studies but with a focus on where revenue
was being lost. The report showed that a
third of Greek workers were not registered,
suggesting that a large share of work being
done is undeclared (Figure 5).
Additionally, social security assessments
were €20 billion behind and Greece has a
major issue with unpaid back taxes, with
€115 billion still owed in 2016, by
4,146,483 citizens of which 839,056 have
had enforcement measures imposed on
them (Figure 6) (Symeon Mavridis, 2018).
The report points out that the cost of
avoiding taxes in general is much less
than the cost of paying them because of
the low probability of detection, weak
penalties, and frequent amnesty programs.
Furthermore, Greek citizens were found to
justify not paying taxes for three main
reasons: because they felt the tax system
to unfair; because they were dissatisfied
with the quality of government services;
and because the recession had placed
severe strain on their resources. The IMF
report accordingly recommended
simplifying tax policies, targeting staff
resources where cheating is greatest,
replacing older, entrenched staff with new
professional accountants, and,
unexpectedly, lowering tax rates as an
incentive for voluntary tax compliance (Eble et al., 2013; Bergthaler et al., 2017). This last point
was surprising because the MoU’s requirement that Greece raise taxes is one of the reasons for their
current high levels.
Figure 5: Greek Uncollected Tax Debt
Figure 6: Greek Undeclared Work

16
The capital controls put into effect in late 2015 resulted in increased VAT tax revenues, as
has been documented in three recent studies. This outcome that has created intense curiosity among
researchers because it provided a rare and fascinating glimpse into the vast scope of Greece’s
shadow economy. Thus, as talk of “Grexit”—Greece’s potential exit from the EU—heated up in
2015, Greeks feared either being left with a new worthless currency or losing their savings to
confiscation and began withdrawing their funds from Greek banks. To avoid a run on these
undercapitalized institutions, government officials placed capital controls on all banks that limited
the number of accounts that a citizen could have and, more importantly, limited withdrawals by
individuals to €60 a day (Priftis & Rousakis, 2017). Before June of 2015, Greeks had used cash for
95% of all retail transactions, by far the largest percentage of any EU country, but, after the capital
controls were put in place, electronic payments skyrocketed (Antoniadis et al., 2017) because the
€60-limit did not
apply to purchases
with debit or credit
cards. Before the
controls were put
into place, payment
cards were used
sparingly,
accounting for only
2.2% of private
consumption in
2002, 5.4% in 2007,
and 4.4% from 2010
to 2014. After the
controls were
enacted in 2015,
though, the
percentage more
than doubled, to 9.5%, and increased again in 2016, to 11.2%. There was an immediate impact on
VAT revenue in the last quarter of 2015 and the first two quarters of 2016, with increases of 8.5%,
18%, and 15.9%, respectively, even though the overall tax base shrunk by 0.3%, 2.9% and 1.1%
year-on-year for these same three quarters (Hondroyoannis & Papaoikonomou, 2017). However,
the Greek GDP only fell by 0.3% in 2015, even after capital controls had been imposed; for private
consumption actually increased by 1.7% in Q1 and 1.6% in Q2 before the controls were imposed
(Priftis & Rousakis, 2017). Surprisingly, consumption held strong in Q3 (1.4%) and Q4 (1.6%),
meaning that 28% (a very high number) of the Greek GDP was circulating in cash8 (as represented
in Figure 7, left panel). Predictably, immediately after the controls took effect, the number of cards
issued climbed considerably, by 11.29%, as did the value of transactions, by 12%, and transactions
per card, by 33.3% (Figure 7, right panel).
8 The cash average for the eurozone is 10% of GDP in circulation (Priftis & Rousakis, 2017).
Figure 7: Currency Circulation and Card Usage
17
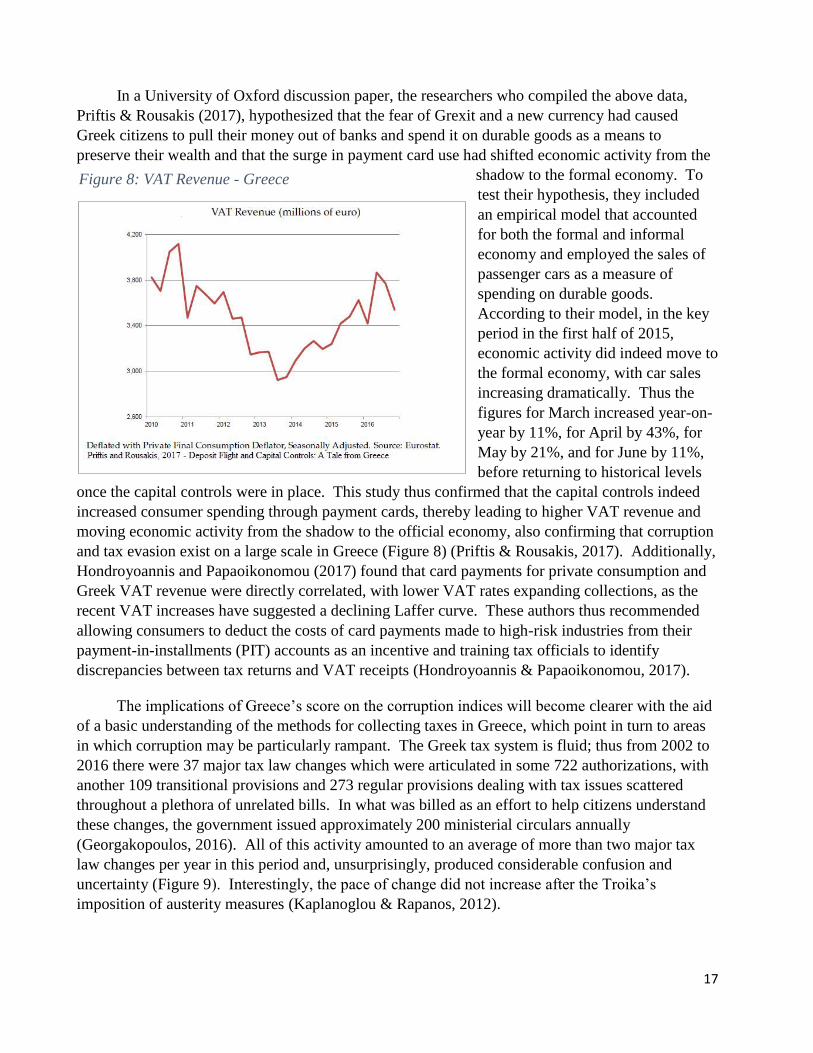
In a University of Oxford discussion paper, the researchers who compiled the above data,
Priftis & Rousakis (2017), hypothesized that the fear of Grexit and a new currency had caused
Greek citizens to pull their money out of banks and spend it on durable goods as a means to
preserve their wealth and that the surge in payment card use had shifted economic activity from the
shadow to the formal economy. To
test their hypothesis, they included
an empirical model that accounted
for both the formal and informal
economy and employed the sales of
passenger cars as a measure of
spending on durable goods.
According to their model, in the key
period in the first half of 2015,
economic activity did indeed move to
the formal economy, with car sales
increasing dramatically. Thus the
figures for March increased year-on-
year by 11%, for April by 43%, for
May by 21%, and for June by 11%,
before returning to historical levels
once the capital controls were in place. This study thus confirmed that the capital controls indeed
increased consumer spending through payment cards, thereby leading to higher VAT revenue and
moving economic activity from the shadow to the official economy, also confirming that corruption
and tax evasion exist on a large scale in Greece (Figure 8) (Priftis & Rousakis, 2017). Additionally,
Hondroyoannis and Papaoikonomou (2017) found that card payments for private consumption and
Greek VAT revenue were directly correlated, with lower VAT rates expanding collections, as the
recent VAT increases have suggested a declining Laffer curve. These authors thus recommended
allowing consumers to deduct the costs of card payments made to high-risk industries from their
payment-in-installments (PIT) accounts as an incentive and training tax officials to identify
discrepancies between tax returns and VAT receipts (Hondroyoannis & Papaoikonomou, 2017).
The implications of Greece’s score on the corruption indices will become clearer with the aid
of a basic understanding of the methods for collecting taxes in Greece, which point in turn to areas
in which corruption may be particularly rampant. The Greek tax system is fluid; thus from 2002 to
2016 there were 37 major tax law changes which were articulated in some 722 authorizations, with
another 109 transitional provisions and 273 regular provisions dealing with tax issues scattered
throughout a plethora of unrelated bills. In what was billed as an effort to help citizens understand
these changes, the government issued approximately 200 ministerial circulars annually
(Georgakopoulos, 2016). All of this activity amounted to an average of more than two major tax
law changes per year in this period and, unsurprisingly, produced considerable confusion and
uncertainty (Figure 9). Interestingly, the pace of change did not increase after the Troika’s
imposition of austerity measures (Kaplanoglou & Rapanos, 2012).
Figure 8: VAT Revenue - Greece

18
Figure 9: Tax Law Changes in Greece
TAX LAW CHANGES IN GREECE
Year Major
Law
Authorization Transitional
Provisions
Regular
Provisions
2002 2 30 4 14
2003 1 17 2 7
2004 3 52 7 4
2005 3 44 13 1
2006 3 35 7 3
2007 3 44 10 11
2008 2 40 3 1
2009 3 79 0 20
2010 6 87 30 16
2011 1 92 0 16
2012 0 0 0 22
2013 6 177 32 64
2014 0 0 0 45
2015 3 17 0 14
2016 1 8 1 35
Total 37 722 109 273 Source: Georgakopoulos (2016)
In another study of tax evasion in Greece, Thodoris Georgakopoulos (2016) has demonstrated
that tax revenues have been decreasing since 2010 despite numerous tax increases over that same
time period (PwC,
2016) (Figure 10).
To do so, he joined
forces with the
professional services
firm Ernst & Young to
analyze all of the
available tax data and
the estimates of other
experts regarding how
and where Greece has
been losing economic
activity to the shadow
economy. The results
are revealing (Figure
11).
Figure 10: Total Tax Revenue - Greece

19
Figure 11: Estimate of Shadow Economy Costs
ESTIMATE OF SHADOW ECONOMY COSTS
TYPE TAX % of GDP RANGE ESTIMATE COST RANGE
Personal Income Tax 1.9% to 4.7% 3 to 8 billion
VAT tax 3.5% 6 billion
Alcohol, tobacco, fuel .05% .9 billion
Legal Entities Income Tax .15% 2 billion
Total 6% to 9% €11 to €16 Billion Source: Georgakopoulos (2016)
Similarly revealing is a 2013 International Labor Organization (ILO) report showing
undeclared work to be a major contributor to Greece’s shadow economy. According to this study,
individuals at all levels of Greek society avoid declaring work and skip payroll taxes, with the lower
classes and those hit hardest by the crisis being the most likely to do so. High unemployment in
combination with a disproportionate number of small enterprises has fostered undeclared work, with
self-employed individuals comprising 32% of companies in Greece (contrasted with 14% in the EU)
and firms with fewer than nine employees making up an overwhelming 96% of all Greek
enterprises. As many of the other studies have insinuated, these small and self-employed businesses
find it easier to avoid, not only declaring work, but also paying income taxes and VAT taxes (ILO,
2016; Eble et al., 2013; Bitzenis et al., 2016; Hassan & Schneider, 2016). Undeclared work also
reduces income taxes, thereby keeping significant amounts of economic activity in the shadow
economy. The ILO report further pointed out that labor inspection results and academic studies
estimate the amount of undeclared work in Greece at anywhere between 46.7% and 14.6%, with
typical findings of 25-35%, and it identified lack of trust in government as a core reason for such
high levels, stressing again that undeclared work has been one of the key factors in Greece’s large
shadow economy (ILO, 2016).
A theme that recurs in such evaluations has recently been discussed by Christos
Paraskevopoulos in a 2017 paper entitled “Varieties of Capitalism, Quality of Government and
Policy Conditionality in Southern Europe: Greece and Portugal in Comparative Perspective.”
Paraskevopoulos sought to explain why Greece has remained mired in recession while the other
southern European countries hard hit by the crisis seem to have recovered. Thus, though Greece
and Portugal both suffered—both being small, formerly authoritarian states with mixed market
economies (MMEs)—Portugal has recovered while Greece has not; and QoG appears to be the
main variable accounting for the difference. The 2017 paper expanded on an earlier work by
Paraskevopoulos (2012) titled “Corruption, Inequality and Trust: the Greek vicious circle from
incremental adjustment to “critical juncture?” in which he showed that increasing levels of grand
and petty corruption have undermined trust in public institutions in a “vicious circle” that is
primarily a recent phenomenon fueled by growing but weak public institutions financed by cheap
credit and dominated by rent-seeking special interests; this state of affairs resists reform and has
eroded public trust. These conclusions, which echo many of those regarding QoG and public trust
made in the studies just discussed, make clear that these two critical variables must be accounted for
when considering anti-corruption reforms for Greece (Kaplanoglou & Rapanos, 2012; ILO, 2016;
Azariadis & Ioannides, 2015).

20
While this review has been able to present only a small portion of the massive amount of
research into corruption in Greece, the studies discussed here are among the most comprehensive
and current assessments of the phenomenon. The literature makes clear that corruption in the
Hellenic Republic is a massive problem affecting all aspects of civil society. Most studies have
stressed that it was a problem before the crisis and has continued to be afterward and have also
argued that a piecemeal approach to fighting it characterized by numerous loop holes and light
penalties perpetuates the cycle of corruption in Greece. Other factors contributing to the persistence
of Greece’s shadow economy include weak institutions, a complicated tax code, insufficient audit
and enforcement procedures, high tax rates, and of course bribery and special favors by public
servants. The result has been a wholesale erosion of public trust. Many of these studies have
shared similar arguments regarding the causes of and remedies for corruption in Greece, with
Paraskevopoulos’s writings on trust and QoG (2012; 2017) getting to the heart of the matter
(Kaplanoglou & Rapanos, 2012; ILO, 2016; Azariadis & Ioannides, 2015; TI-G, 2012; Dellas et al.,
2017; Katsios, 2006).

21
SECTION 2. MEASURING CORRUPTION IN GREECE With the Greek sovereign debt crisis weakening the euro and threatening the future of the EU,
there has been a desperate rush to measure and combat the country’s corruption problem (Tsoukalis,
2014; Stiglitz, 2016). Long before the Greek crisis in 1995 when serious scholars were actually
questioning if the phenomena of corruption was harmful to economies, TI decided to launch the
Corruption Perception Index, which totally
changed the debate about corruption and
helped bring an unsightly problem out into the
open (Galtung, 2006). The CPI’s consistent
indication that Greece has been suffering from
a significant corruption problem came as no
surprise to Greek citizens. Thus, in the
European Commission’s 2014 Eurobarometer
survey, 99% of Greek citizens agreed that
corruption was a “widespread” problem in their
country (as can be seen on the far left in Figure
12). While this result might appear to represent
some measure of progress—by indicating that
the Greek people now realize how problematic
corruption is—a Eurobarometer poll conducted
five years earlier had yielded essentially the
same result, with 98% of Greeks at that time
answering the same question in the same way
(Figure 13). In either case, compared with
other EU countries, Greece had the highest
number of respondents identifying corruption
as a significant national issue (Eurobarometer,
2009, 2014).
Figure 12: Eurobarometer on Corruption 2014

22
Figure 13: Eurobarometer on Corruption 2009
2.1. GREECE & THE CORRUPTION PERCEPTIONS INDEX A review of Greece’s CPI scores since 1995, only confirms what Greek citizens have told
pollsters before, during, and after the crisis. The score peaked in 1997 at 5.35 but since has not
exceeded 5.00—or 50 using the new scale introduced in 2012. The next peak came before the crisis
in 2008, with a score of 4.7 and a ranking of 57th of 180 countries (TI, 1995-2017); but even at this
point Greece was the lowest of any EU country and behind most Balkan and Black Sea countries.
The toxic combination of shrinking incomes and increasing taxes in the period following the crisis
created powerful temptations for both government officials and private citizens to use illegal
methods to increase or save money, at times including bribes, embezzlement, fraud and, especially,
tax evasion (Giannitsis & Zografakis, 2015). Predictably, Greece’s lowest score (on the old scale)
of 3.4 came in 2011, during the height of the crisis, when it was ranked 80th of 182 countries
(Figure 14).

23
Figure 14: CPI - Greece 1995 - 2017
Greece- Corruption Perception Index (CPI) 1995-2017 1995 1996 1997 1998 1999 2000 2001 2002 2003 2004 2005 2006
Score 4.04 5.01 5.35 4.9 4.9 4.9 4.2 4.2 4.3 4.3 4.3 4.4
Rank 30 28 25 36 36 35 42 44 50 49 47 54
Countries 41 54 52 85 99 90 91 102 133 146 159 180
2007 2008 2009 2010 2011 2012 2013 2014 2015 2016 2017 ─
Score 4.6 4.7 3.8 3.5 3.4 36* 40* 43* 46* 44* 48* ─
Rank 56 57 71 78 80 94 80 69 58 69 59 ─
Countries 180 180 180 178 182 178 175 174 167 177 180 ─ Source: TI (1995-2017) Note: The CPI Index scores and ranks countries based on how a country's public sector is perceived to be. Until 2011 the CPI index ranged from 0 (highly corrupt) to 10 (highly transparent). * Since 2012 the CPI index ranged from 0 (highly corrupt) to 100 (highly transparent).
By way of comparison,9 the EU-28 average in 2011 reached a high 6.2 and the US received
an even higher score, 7.1. Then, in 2012, while experiencing the full effects of the Troika’s harsh
MoU measures, Greece received a score of 36 on the newly-introduced scale and dropped to 94th of
178 countries in the worldwide rankings. In 2016, the EU-28 and US averages increased to 64.6
and 74, respectively. Over the past five years, Greece has improved 14 points, with a score of 46 in
2015 and a world ranking of 58th of 167 countries, though in 2016 it dropped 2 points, with a score
of 44, and slipped back to 69th worldwide before encouragingly improving by 4 points in 2017 to a
world rank of 59th. What makes these lackluster results disheartening is that, during this same five-
year period, the government passed a large number of laws intended to fight corruption.
While the crisis has, as discussed, fostered corruption in Greece despite such reform efforts,
other southern EU countries as well as many of Greece’s Balkan and Black Sea neighbors have
experienced improvement. As can be seen in Figure 15, Greece’s ranking has worsened since 2008,
from 57th to as high as 94th but falling to 69th in 2016. In the meanwhile, the impressive ratings of
the US and Portugal improved slightly, and Georgia experienced massive improvement, falling
from 67th in 2008 (10 positions worse than Greece) to 44th in 2016 (25 positions better than
Greece). The pattern for Bulgaria has resembled that of Greece, while Cyprus has enjoyed a
consistently strong ranking despite a slip in 2016 (TI, 1995-2017).
9 The comparisons with Greece discussed here include the 13 Balkan states, 10 Black Sea states, the EU, and the US in
most of the measurement indices, and in particular Bulgaria, Cyprus, and Portugal whenever possible. These latter three
states are particularly comparable because, in turn, Bulgaria is Greece’s neighbor and business competitor, Cyprus
shares a similar cultural history with Greece, and Portugal like Greece was hit hard by the crisis and had to deal with the
MoUs.

24
Figure 15: CPI - Selected Countries 2008 – 2017
Corruption Perception Index (CPI) rankings, Selected Countries, 2008-2017
Country 2008 2009 2010 2011 2012 2013 2014 2015 2016 2017
Greece 57 71 78 80 94 80 69 58 69 59
Bulgaria 72 71 73 86 75 77 69 69 75 71
Cyprus 31 27 28 30 29 31 31 32 47 42
Georgia 67 66 68 64 51 55 50 48 44 46
Portugal 32 35 32 32 33 33 31 28 29 29
USA 18 19 22 24 19 19 17 16 18 16
Countries 180 180 178 182 178 175 174 167 177 180 Source: TI (1995-2017)
Also instructive are comparisons of Greece with the Black Sea and Balkan states (Figure 16).
In terms of definitions, the 13 Balkan Region countries (BAL-13) are Albania, Bosnia-Herzegovina,
Bulgaria, Croatia, FYROM, Greece, Kosovo, Moldova, Montenegro, Romania, Serbia, Slovenia,
and Turkey, while the 10 Black Sea States (BS-10) are Armenia, Azerbaijan, Bulgaria, Georgia,
Greece, Moldova, Romania, Russia, Turkey, and Ukraine. Many of these states are, unlike Greece,
former communist countries—though Greece did go through a period of military rule from 1967 to
1974—but like Greece they have reputations for corruption, with similar CPI scores. Furthermore,
while the Hellenic Republic has been a member of the EU since 1981 and is considered to have a
modern economy, it has consistently fallen 2 to 3 points—or 20 or more points using the new
scale—behind the EU average (TI, 1995-2017).
Figure 16: CPI - EU, BS-10, BAL-13 2008 - 2017
Corruption Perception Index (CPI) scores, Greece, EU-28, BAL-13, BS-10, 2008-2017
Country 2008 2009 2010 2011 2012 2013 2014 2015 2016 2017
Greece 4.7 3.8 3.5 3.4 36* 40* 43* 46* 44* 48*
EU-28 avg. 6.4 6.3 6.2 6.2 63* 63.6* 64.2* 65.4* 64.6* 64.6*
BAL-13 avg. 4.0 3.9 3.8 3.7 41.9* 42.3* 42.2* 42.5* 42.5* 42.8*
BS- 10 avg. 3.3 3.3 3.1 3.1 36.3* 37.5* 38* 38* 38.2* 39.1* Source: TI (1995-2017) Note: The CPI Index scores and ranks countries based on how a country's public sector is perceived to be. Until 2011 the CPI index ranged from 0 (highly corrupt) to 10 (highly transparent). * Since 2012 the CPI index ranged from 0 (highly corrupt) to 100 (highly transparent).

25
2.2. GREECE & THE GLOBAL CORRUPTION BAROMETER
In 2003, TI launched its Global Corruption Barometer (GCB), the largest such worldwide
survey of public opinion, covering both the public and private sectors. The CGB evaluates 12
institutions in each country, which respondents rank on a scale from 1 (highly transparent) to 5
(highly corrupt). In the 2013 evaluation, 1,001 Greek citizens were asked the 12 questions about
their country as well as whether they had ever paid a bribe for government services. As can be seen
in Figure 18, of the 19 eurozone countries, Greece was the worst performer in regard to seven of the
institutions, namely political parties, parliament, media, business/private sector, educational system,
medical/health, and public officials and civil servants, while faring much better in regard to the
military, NGOs, religious bodies, the judiciary, and the police (TI, 2013). Moreover, 22% of
respondents reported having paid a bribe to receive services, up from 18% in 2010. The one
positive statistic was the answer to the question, “To what extent do you agree that ordinary people
can make a difference in the fight against corruption?” with an encouraging 82% agreeing, 37%
strongly. Overall, then, Greek citizens perceive the level of corruption in their country to be higher
than those in other countries in the region, as can be seen in Figure 17.
Figure 18:GCB Institution Scores 2013
Perception of Corruption by Institution, GCB scores, 2013
political
parties
Parliament
legislature
military NGO’s media religious
bodies
Business
/private
sector
education
system
judiciary medical/health police public
officials/ civil
servants
Greece 4.6 4.3 2.9 3.1 4.4 3.4 3.8 3.3 3.9 4.1 3.6 3.9
Bulgaria 4.2 4.0 2.9 3.2 3.5 3.5 3.8 3.4 4.4 4.2 3.9 3.9
Cyprus 4.4 4.0 3.6 2.6 3.9 3.3 3.2 2.9 3.1 3.6 4.1 3.7
Portugal 4.1 3.9 3.9 3.2 3.2 3.0 3.5 3.1 3.9 3.0 3.2 3.4
USA 4.1 3.7 2.9 3.0 3.7 3.1 3.6 3.1 3.3 3.3 3.3 3.6
EU-28 avg. 4.0 3.7 2.7 2.7 3.3 2.9 3.5 2.8 3.3 3.2 3.2 3.5
BAL-13 avg. 4.2 3.9 2.7 2.9 3.4 2.8 3.5 3.4 4.0 3.9 3.6 3.7
BS- 10 avg. 3.8 3.8 2.9 2.9 3.3 2.8 3.5 3.3 3.9 3.7 3.6 3.7 Source: Transparency International, Global Corruption Barometer GCB (2013).
Note: The GCB index ranges from 1 (highly transparent) to 5 (highly corrupt). Highlighted scores indicate worst performer in each institution.
Figure 17: GCB - Institution Scores 2013

26
2.3. GREECE & GLOBAL COMPETITIVE INDEX
Another useful index when evaluating corruption is the World Economic Forum’s Global
Competitive Index (GCI), which assesses countries with respect to 12 institutions or pillars. In most
respects, the GCI evaluation is not relevant to the present discussion, the exception being its first
pillar, which takes into account 21 distinct aspects of institutions, including diversion of public
funds, public trust in politicians, irregular payments and bribes, favoritism by government officials,
and transparency in government policymaking. Additionally, respondents are asked to rank the
greatest obstacles to doing business in a given country, one option being corruption. Data are
obtained from the Executive Opinion Survey, which is distributed to business leaders around the
globe; in 2017, it tabulated the responses of 12,775 executives to 150 questions on which they
ranked their countries’ performance on a scale ranging from least competitive (1) to most
competitive (7) (GCI, 2003-2017). The following overview focuses on the first pillar outcomes and
specifically the ranking of corruption in the multiple-choice question. The results for Greece on this
index track to some extent with the CPI results. The country’s score began at 4.32 in 2002/3,
experienced a downward trend before the crisis with a low point of 3.86 in 2012/13, and has
recovered partially with a 4.2 for 2017/18 (Figure 19) (GCI, 2003-2017). By way of comparison, in
the 2017/18 report, Bulgaria ranked 49th with a score of 4.5, Cyprus 64th with a 4.3, Portugal 42nd
with a 4.6, and the US 2nd with a 5.9; the EU-28 average was 4.8, the BAL-12 4.2, and the BS-10
4.3. These results show that Greece is once again lagging behind, though the main concern here
regarding this index is the insight that it offers into the quality of Greek institutions.
Figure 19: GCI -Greece 2002/03-2017/18
Greece- Global Competitive Index (GCI) 2003-2017 02/03 03/04 04/05 05/06 06/07 07/08 08/09 09/10
Score 4.32 4.58 4.56 4.26 4.33 4.08 4.11 4.04
Rank 38 35 37 46 47 65 67 71
Countries 80 102 104 117 125 131 134 133
10/11 11/12 12/13 13/14 14/15 15/16 16/17 17/18
Score 3.99 3.92 3.86 3.93 4.0 4.02 4.0 4.2
Rank 83 90 96 91 81 81 86 87
Countries 139 142 144 148 144 140 138 137 Source: GCI (2003-2017) Note: Countries are ranked on a scale of 1 (least competitive) to 7 (most competitive).
The first pillar focuses on Greece’s institutions and, as mentioned, includes several questions
dealing with their quality and the role of corruption in them. As Greek institutions were repeatedly
identified as a weakness by scholars, these results will be helpful in evaluating corruption’s overall
impact in Greece. Again, Greece’s best scores came in long before the crisis and then dropped to a
low of 3.4 in 2012/13, mirroring the pattern in the other indices. In this case, Bulgaria in 2017/18
ranked 98th with a score of 3.5 on the first pillar, Cyprus 51st with a 4.2, Portugal 43rd with a 4.4,
and the US 20th with a 5.3; the EU-28 average was 4.5, the BAL-12 3.6, and the BS-10 3.8 (see

27
rows 1 and 2 in Figure 20) (GCI, 2003-2017). Additionally, respondents were asked to rank the
following 16 factors that make it difficult to do business in Greece:
• inefficient government bureaucracy
• limited access to financing
• policy instability
• unclear tax regulations
• corruption
• high tax rates
• restrictive labor regulations
• government instability
• inadequate infrastructure
• poor work ethic of the labor force
• inadequately educated labor force
• insufficient capacity to innovate
• crime and theft
• Inflation
• foreign currency regulations
• poor public health
A review of each year’s results reveals inefficient government bureaucracy, limited access to
financing, policy instability, high tax rates, and corruption to be the major impediments to business
in Greece. During the crisis, corruption ranked as high as second biggest problem, but over the last
few years tax rates, tax regulations, and political stability moved to the top, with corruption
dropping to eighth place. Rows three and four in Figure 20 display the percentage of respondents
who chose corruption and its rank among the 16 factors (GCI, 2003-2017).
Figure 20: GCI -1st Pillar 2006/07-2017/18
Global Competitive Index (GCI) 1st Pillar 2006-2018 06/07 07/08 08/09 09/10 10/11 11/12 12/13 13/14 14/15 15/16 16/17 17/18
1 Score* 4.4 - 4.1 3.8 3.7 3.5 3.4 3.5 3.6 3.7 3.8 3.7
2 Rank 41 - 58 70 84 96 111 103 85 81 81 87
3 Percentage 6.5% - 12% 14% 14% 13% 11.6% 6.9 4.3 5.4 3.6 5.5
4 Rank 5 - 4 3 2 3 5 6 6 6 8 7
5 Countries 125 131 134 133 139 142 144 148 144 140 138 137 Source: GCI (2003-2017) *Note: Countries are ranked on a scale of 1 (least competitive) to 7 (most competitive).
2.4. GREECE & SUSTAINABLE GOVERNANCE INDICATORS
Another important index is the set of Bertelsmann Stiftung Sustainable Governance Indicators
(SGIs)—again, QoG was repeatedly identified as a key deficiency in the scholarly studies reviewed
earlier and as major cause of corruption in Greece. Like the GCI, this index covers a broad range of
issues, only a few of which touch on governance and specifically the quality of a national

28
government. It ranks 41 nations which include all the OECD and EU countries; Greece belongs to
the OECD and EU. For the 2017 SGIs, individuals with expertise in the various countries were
asked 67 questions pertaining to three aspects of government, namely policy performance,
democracy, and governance. In the present context, the survey is important for the light that it
sheds on Greece’s poor QoG, for the governance section includes 36 questions dealing specifically
with executive accountability and capacity scored on a scale from worst (1) to best (10). Though
Greece ranked a healthy 26th in terms of democracy,10 the ongoing economic depression
contributed to a last place (41st) ranking for policy performance, and governance was also a weak
area for Greece, with rankings of 27th and 39th on executive accountability and capacity,
respectively (Figure 21) (SGI, 2017). The lack of governance capacity could of course cause
Greeks to lose trust in public institutions.
Figure 21: Stiftung Sustainable Governance Indicators -Greece
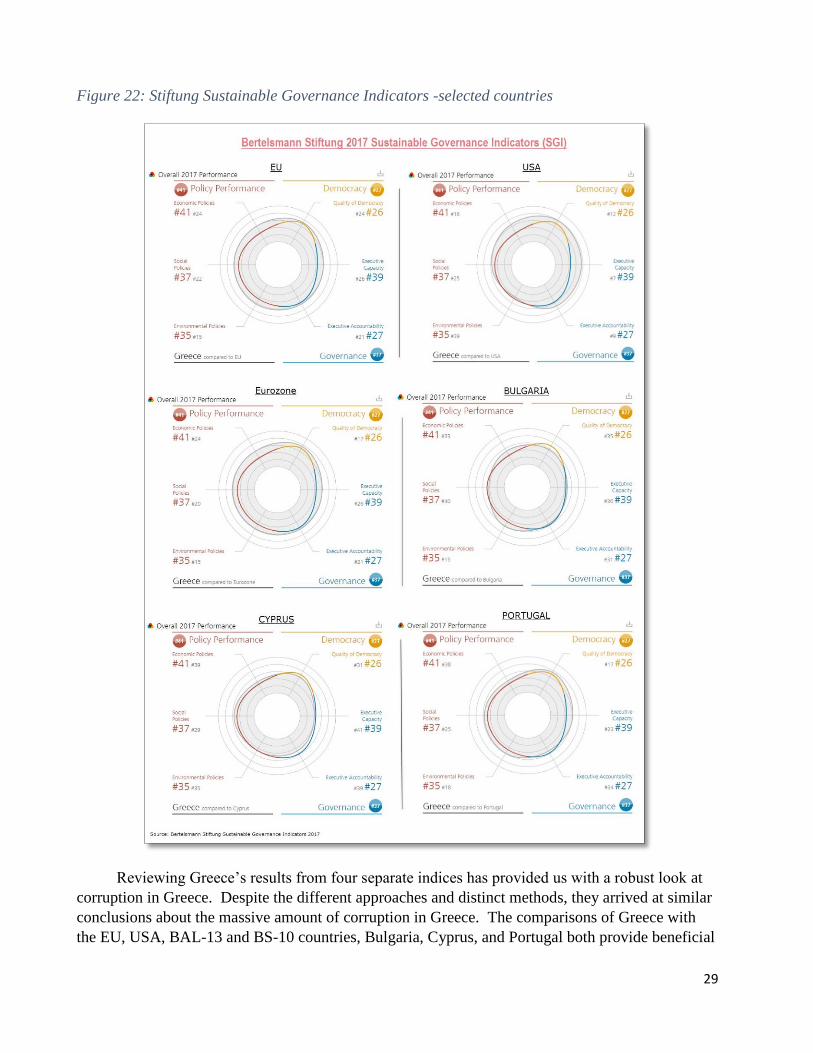
It is once more instructive to compare the Hellenic Republic with other countries, specifically
the EU, USA, eurozone, Bulgaria, Cyprus, and Portugal (Figure 22), as was done with the CGI.
Greece again lags far behind the US and ranks near the bottom of the EU and eurozone. The
governance rankings of Bulgaria and Greece are quite similar, and Greece is just ahead of Cyprus
and leads Portugal in accountability, though the latter is far ahead in governance capacity, a finding
that may partly explain why it has emerged from the crisis faster than Greece (Paraskevopoulos,
2017). The 2017 SGI thus seems to corroborate the findings of other indies that Greece suffers
from institutional weakness (SGI, 2017).
10 This report did reference efforts by the Syriza-ANEL government to regulate the media through licensing and fees,
which can be viewed as an attempt to control the knowledge of average citizens about governmental activities.
29
Figure 22: Stiftung Sustainable Governance Indicators -selected countries
Reviewing Greece’s results from four separate indices has provided us with a robust look at
corruption in Greece. Despite the different approaches and distinct methods, they arrived at similar
conclusions about the massive amount of corruption in Greece. The comparisons of Greece with
the EU, USA, BAL-13 and BS-10 countries, Bulgaria, Cyprus, and Portugal both provide beneficial
30
context for the situation in Greece and confirm the reliability of the overall results, which again
remain consistent across the indices. In light of these statistics, it is apparent that Greece’s
corruption problem began well before the crisis but was exacerbated by it. It is in this context
important to recall that many of the anti-corruption reforms implemented after the crisis seem to
have been ineffective. The data from these indices demonstrate the importance of public
institutions for the successful implementation of reforms. The weakness of Greek institutions
reported in the literature is thus confirmed by Greece’s low scores on indices relating to governance
and public institutions and is the most likely cause of Greek citizens’ lack of trust in Greek
government, as discussed in Section 1.1.
2.5. ECONOMETRICAL APPROACHES
The above literature review identified numerous variables that correlate with corruption.
Thus the ILO report found that high unemployment led to increases in undeclared work, while
Azariadis and Ioannides reported that low QoG and lack of trust increased corruption and Priftis and
Rousakis that card payments promoted compliance with VAT collections; several other studies have
demonstrated that tax evasion increases when tax rates rise. Likewise, studies from around the
globe have correlated high corruption with low growth (Papaconstantinou, 2013; Dreher &
Herzfeld, 2005; Knack & Keefer, 1995). The following subsections accordingly explore further the
possible correlation among corruption, growth, tax burdens, and QoG.
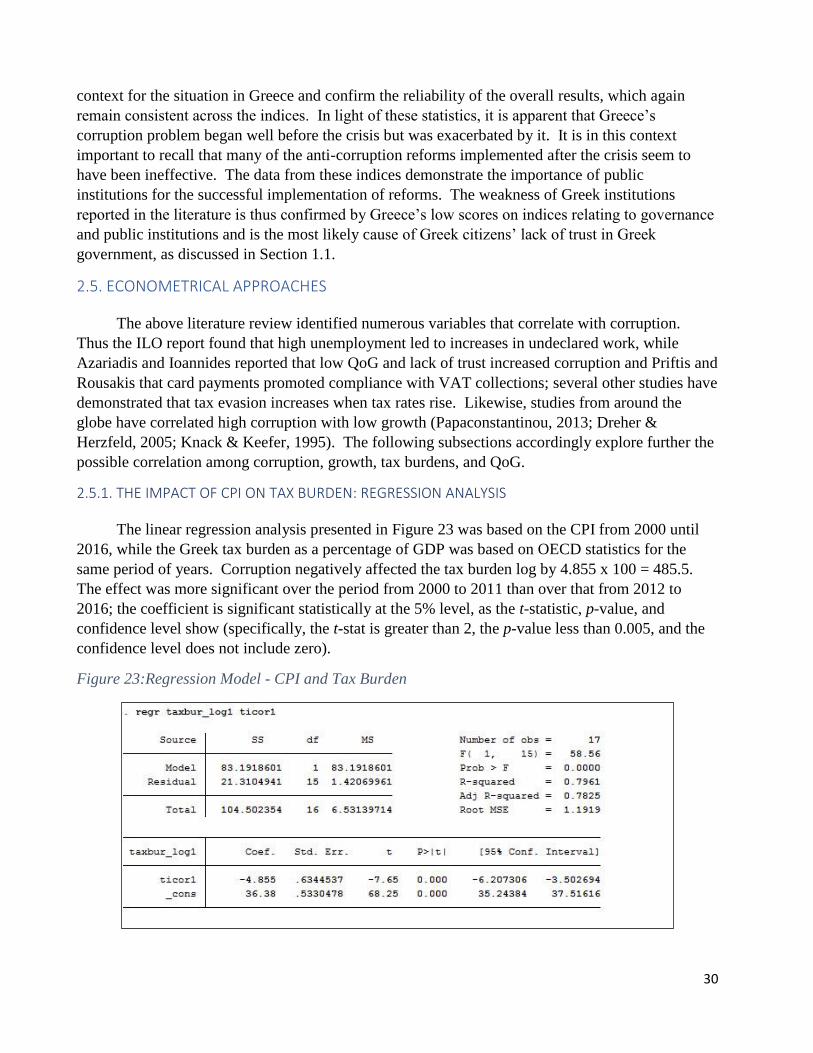
2.5.1. THE IMPACT OF CPI ON TAX BURDEN: REGRESSION ANALYSIS
The linear regression analysis presented in Figure 23 was based on the CPI from 2000 until
2016, while the Greek tax burden as a percentage of GDP was based on OECD statistics for the
same period of years. Corruption negatively affected the tax burden log by 4.855 x 100 = 485.5.
The effect was more significant over the period from 2000 to 2011 than over that from 2012 to
2016; the coefficient is significant statistically at the 5% level, as the t-statistic, p-value, and
confidence level show (specifically, the t-stat is greater than 2, the p-value less than 0.005, and the
confidence level does not include zero).
Figure 23:Regression Model - CPI and Tax Burden

31
When the dummy variable has a value of 0, the tax burden log is equal to 36.38, and when it has a
value of 1, the tax burden log is equal to both or 31.525, meaning that the tax burden log in the
second period of 2012-2016 was 4.855 units below the 2000-2011 period (Figure 24).
Figure 24: Dummy Variable Model
2.5.2. CPI & GDP BASIC CORRELATION
Numerous studies of numerous countries have found a negative correlation between
corruption and economic growth, and this appears to be the case in Greece as well (Chene, 2014).
The separate CPI data for the periods from 2000 to 2011 and from 2012 to 2016 appear to show
Figure 25: CPI & GDP Basic Correlation
32
such a correlation as well. Thus, from 2000 to 2007 (left panel in Figure 25), the CPI and GDP
mostly tracked together with the exception of 2005; then from 2008 to 2011 when GDP dropped
dramatically downward after the crisis the CPI also fell significantly. For the years from 2012 to
2016 (right panel in Figure 25), the variables are distinct but move in a parallel direction. Although
the drastic drop in GDP from 2008 to 2011 is attributable to the crisis, the CPI also shows
corruption to have grown at a significant rate during the same period. Once growth leveled off, the
parallel path of both the CPI and GDP suggest that improved transparency positively effects
economic growth11.
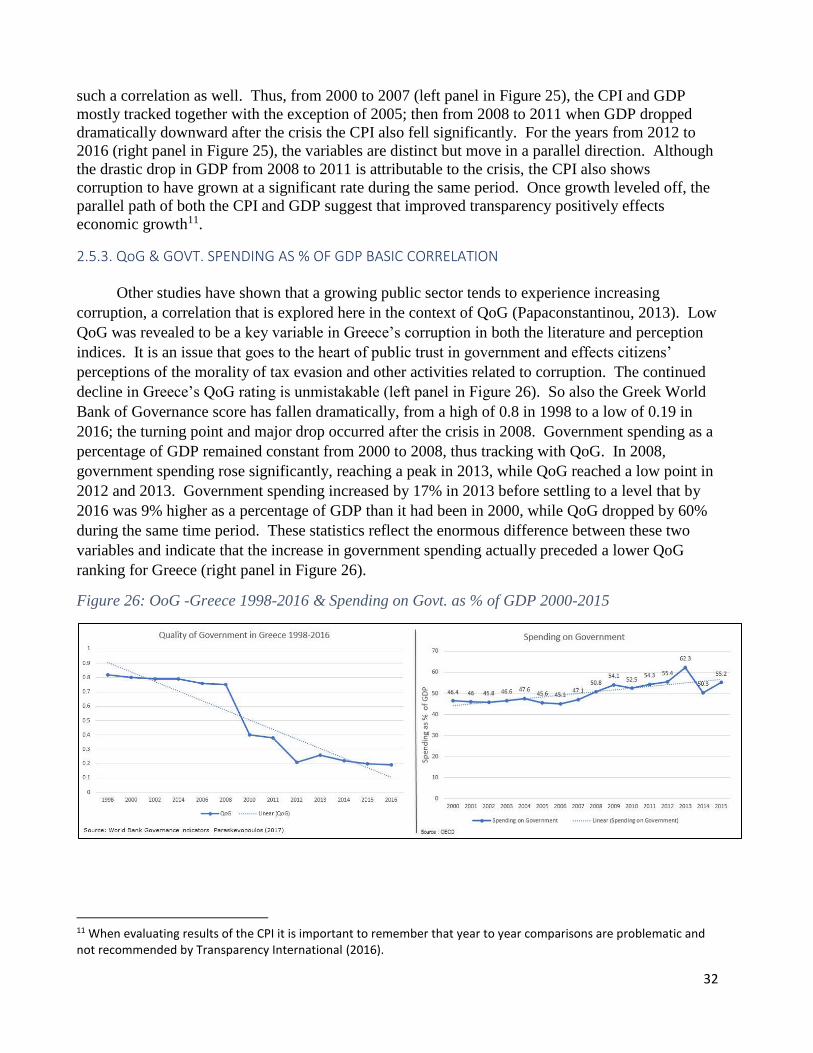
2.5.3. QoG & GOVT. SPENDING AS % OF GDP BASIC CORRELATION
Other studies have shown that a growing public sector tends to experience increasing
corruption, a correlation that is explored here in the context of QoG (Papaconstantinou, 2013). Low
QoG was revealed to be a key variable in Greece’s corruption in both the literature and perception
indices. It is an issue that goes to the heart of public trust in government and effects citizens’
perceptions of the morality of tax evasion and other activities related to corruption. The continued
decline in Greece’s QoG rating is unmistakable (left panel in Figure 26). So also the Greek World
Bank of Governance score has fallen dramatically, from a high of 0.8 in 1998 to a low of 0.19 in
2016; the turning point and major drop occurred after the crisis in 2008. Government spending as a
percentage of GDP remained constant from 2000 to 2008, thus tracking with QoG. In 2008,
government spending rose significantly, reaching a peak in 2013, while QoG reached a low point in
2012 and 2013. Government spending increased by 17% in 2013 before settling to a level that by
2016 was 9% higher as a percentage of GDP than it had been in 2000, while QoG dropped by 60%
during the same time period. These statistics reflect the enormous difference between these two
variables and indicate that the increase in government spending actually preceded a lower QoG
ranking for Greece (right panel in Figure 26).
Figure 26: OoG -Greece 1998-2016 & Spending on Govt. as % of GDP 2000-2015
11 When evaluating results of the CPI it is important to remember that year to year comparisons are problematic and not recommended by Transparency International (2016).
33
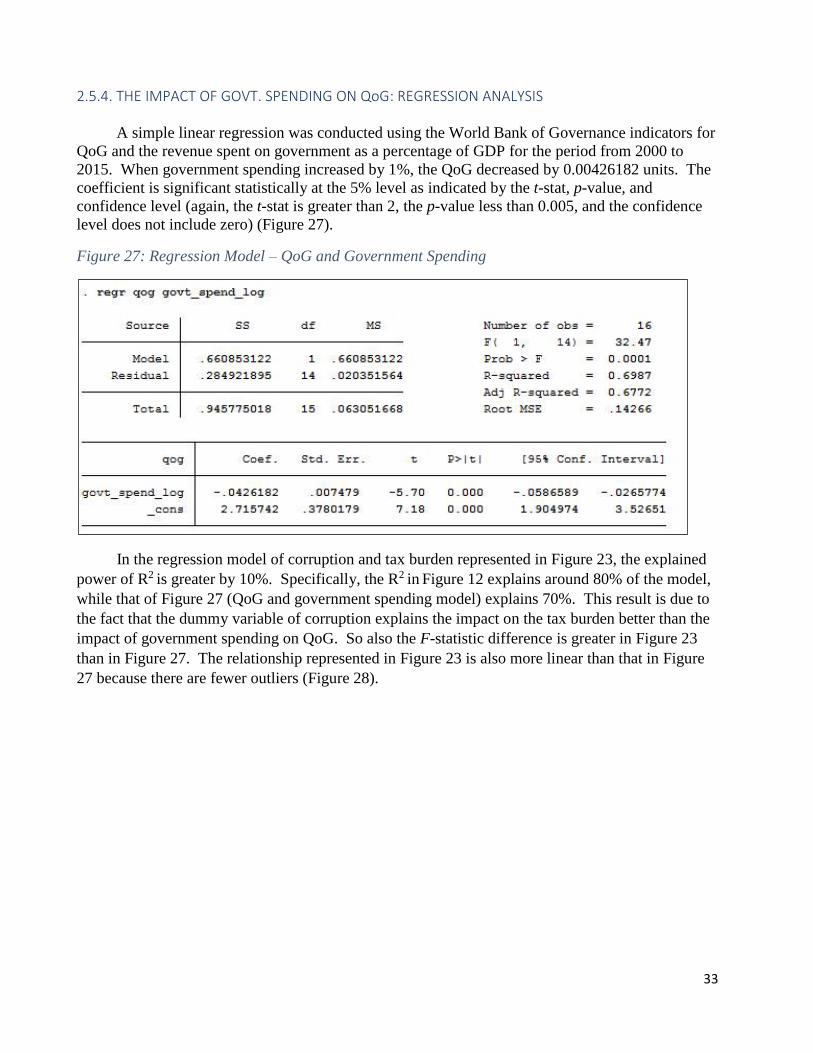
2.5.4. THE IMPACT OF GOVT. SPENDING ON QoG: REGRESSION ANALYSIS
A simple linear regression was conducted using the World Bank of Governance indicators for
QoG and the revenue spent on government as a percentage of GDP for the period from 2000 to
2015. When government spending increased by 1%, the QoG decreased by 0.00426182 units. The
coefficient is significant statistically at the 5% level as indicated by the t-stat, p-value, and
confidence level (again, the t-stat is greater than 2, the p-value less than 0.005, and the confidence
level does not include zero) (Figure 27).
Figure 27: Regression Model – QoG and Government Spending
In the regression model of corruption and tax burden represented in Figure 23, the explained
power of R2 is greater by 10%. Specifically, the R2 in Figure 12 explains around 80% of the model,
while that of Figure 27 (QoG and government spending model) explains 70%. This result is due to
the fact that the dummy variable of corruption explains the impact on the tax burden better than the
impact of government spending on QoG. So also the F-statistic difference is greater in Figure 23
than in Figure 27. The relationship represented in Figure 23 is also more linear than that in Figure
27 because there are fewer outliers (Figure 28).

34
Figure 28: Scatter Diagram - QoG and Government Spending
All econometric
findings are limited by the
availability of the data, and
the results presented here are
no exception. The fact is that
the crisis has made
quantifying corruption in
Greece particularly tricky
because the unprecedented
drop in economic activity has
impacted all areas of Greek
civil society in a myriad of
ways. The relatively short
span of years, lack of time
series data, and variation in
methodologies employed by
the indices complicate precise
measurements as well, though these outcomes are consistent with the findings of other scholars.
The overall implications are that corruption has been having a negative impact on the Greek
economy and that increased government spending as a percentage of GDP has not improved QoG.

35
SECTION 3. COST OF GREEK CORRUPTION There are three main costs or consequences of corruption in Greece. The first, of course, is
financial: corruption erodes Greek tax revenues and the quality of government. This cost fuels the
other two, inequality and population decline. The following discussion considers each of these
costs in turn.
3.1. FINANCIAL COST
While it is difficult to place an exact value on the various corrupt activities in Greece, the
available research offers some estimates. Empirical modeling done before the crisis estimated the
value of Greece’s shadow economy at anywhere from 11 to 35% of GDP. In 2016, when the GDP
totaled $193 billion, that value would have been somewhere between $21.2 and $67.5 billion; given
the average tax burden of 38.6%, Greece thus lost between $8.1 and $26.5 billion in tax revenue
that year (Bitzenis et al., 2016). The findings of studies conducted after the crises are even more
stark: TI-G (2012) has valued the total economic cost of corruption in Greece at over €70 billion
($83.6 billion12), which would have created $27.2 billion in tax revenue, a number that is close to
the $29.2 projected by Hassan and Schneider (2016).
While the $83.6 billion figure seems incredible, Dellas et al. (2017) showed that the informal
sector grew after the crisis to account for even more shadow economic activity than the TI-G (2012)
report had identified. According to the former’s DSGE model, Greece’s shadow economy grew
from 25% of GDP before the crisis to 35-40% afterward, indicating a loss of $26.5-29.7 billion
annually in tax revenues (Dellas et al., 2017). Furthermore, Artavanis et al. (2015) were able, by
comparing reported income on loan applications with tax return data, to show massive amounts of
underreporting, particularly by professionals in the healthcare, legal, engineering, academic, and
media sectors. Their model used data from 2006-2009, before the crisis, to find that the actual
income of self-employed individuals was 1.75 to 1.84 times greater than their reported income,
indicating that around $35 billion in income had been hidden in the shadow economy, equivalent to
a revenue shortfall of approximately $13.5 billion (Artavanis et al., 2015). Additionally, undeclared
work in Greece has resulted in the failure to collect almost $3.2 billion in payroll taxes annually
(Bergthaler et al., 2017; Eble et al., 2013). Evasion of VAT taxes is also costing Greece revenue:
from 2009 to 2013, the country had a 35% average VAT gap, equivalent to a loss of around $7.7
billion annually (Barbone et al., 2015).
Not even medical care is free from corruption in Greece. Thus TI-G (2012) reported that
bribes to doctors for surgery could cost from $60 to $9,000, and Souliotis’s et al. (2016) study
found that 32.4% of visits to public hospitals involved payment of an under-the-table bribe in order
to receive or improve services. Likewise, 36% of private dentist visits were estimated to include
such shady payments, which invariably go unreported. The study estimated that Greek citizens
spent approximately $1.8 billion in 2012 on such payments, or 28% of household health
expenditures. At the 38.6% tax rate, the likely tax revenue leakage would exceed $600
million (Souliotis et al., 2016). The counterintuitive decline in revenue from tobacco taxes from
12 The values of the costs in this section have been converted to US dollars for the sake of comparison using the
December 2017 exchange rate of 1.20 euro to 1 dollar.

36
$4.68 billion in 2011 to $3 billion in 2013 despite significant increases in tax rates on tobacco
products has been attributed to illegal activities; thus conservative estimates put the loss from
cigarette smuggling at $716 million annually (Chionis & Chalkia, 2016). Even more troubling are
losses from fuel smuggling, which cost Greece perhaps $3 billion a year (Mitrakos et al.,
2014). Similarly rife with corruption are the benefit and pension systems, though it has again
proved difficult to quantify the exact costs. Zacharakis et al. (2017) provided four case studies of
fraud at Disability Certificate Centers, the Social Insurance Institute (IKA), and welfare offices that
had been investigated by Greek anti-corruption officials; the individuals involved included public
servants, doctors, insurance employees, and others who had fraudulently set up hundreds of
accounts and collected over $4 million. The study provided no precise estimate of the cost of this
kind of fraud, but it did suggest that it may be widespread. Figure 29 summarizes the main tax cost
estimates for Greece along with the method used to calculate corruption.
Figure 29: Summary of Academic Tax Cost Estimates of Corruption in Greece
The overall estimates of $29 billion by Hassan and Schneider (2016), $28 billion by Dellas et
al. (2017), and $27 billion by TI-G (2012) provide a good starting point for calculating annual
revenue losses from corruption in Greece. These figures are corroborated by tallying up the yearly
losses of $13.5 billion estimated by Artavanis et al., (2015) for income tax, the VAT leakage of $7.7
billion estimated by (Barbone et al. (2015), and the $3.2 billion in undeclared work estimated by
Bergthaler et al. (2017) and Eble et al. (2013); figuring in excise tax smuggling and healthcare
bribery, this total comes to $28.7 billion. This a shocking amount is almost double calculations in
SOURCE METHOD TYPE of CORRUPTION
TAX REVENUE LOST
Transparency International -Greece (2012) an overall assesment of Greek corruption
Interviews & surveys Total Economy $27.2 billion
Hassan & Schneider (2016) estimate size of shadow economy
MIMIC Total Economy $29.3 billion
Dellas et al. (2017) provides estimate for size of shadow economy
DSGE model Total Economy $26.5 to $29.7 billion
Artavanis et al. (2015) provides estimate for self-employed tax evasion
Comparison of loan applications and tax returns
Income Tax Evasion $13.5 billion
Bergthaler et al. (2017) & Eble et al. (2013) estimates undeclared work
Researched Labor
Inspectorate (SEPE), (IKA)
and (OAED) records
Payroll Tax Evasion $3.2 billion
Barbone et al. (2015) provides estimate of VAT tax
OECD data VAT Tax Gap $7.7 billion
Souliotis et al. (2016) estimate under-the-table healthcare payments
surveys Bribes $600 million
Chionis & Chalkia (2016) estimate cigertte excise tax
Industry studies Excise Taxes $716 million
Mitrakos et al. (2014) estimate fuel excise tax
Idustry reports Fule Excise Tax $3 billion

37
earlier studies of $11-16 billion, but appears to be more accurate, since the more recent research has
used empirical methods to analyze bank records, tax returns, labor rates, payroll taxes, and
electronic card payments. The disturbing picture of just how pervasive corruption has become in
Greece is in line with Schneider’s (2000) calculation that the shadow economy in most developing
countries averages about 39% of GDP. It bears repeating in this context that, while the Greek
economy is considered modern, it has in the aftermath of the crisis been exhibiting many
characteristics of the economies of developing countries (Schneider & Enste, 2000).
Figure 29 presents well-founded estimates by serious researchers of the cost of corruption in
Greece, but these figures cannot capture the full extent of Greek corruption. As noted earlier, the
clandestine nature of the phenomenon makes a complete accounting of it impossible. Hospitals, tax
authorities, the Social Insurance Foundation (IKA), the Public Electricity Corporation, the Workers
Housing Organization (OEK), and the Ministry of Health were identified as the most corrupt public
institutions in Greece on the 2010 National Survey of Corruption in Greece poll, which also
reported that bribes to obtain permits, receive accreditations, avoid taxes, and even secure medical
care ranged from $60 to $18,000 (TI-G, 2012). Given that the exact economic cost of kickbacks,
patronage, bribes, embezzlement, nepotism, and fraud are incalculable, the enormous figures cited
in this section may in fact underestimate the scope of the problem (Matsaganis & Flevotomou,
2010).
Figure 30: New Revenue Estimates from Reducing Corruption
It would of course be impossible to put an end to all corruption and capture 100% of the lost
revenue; even in a highly transparent country like the US, the shadow economy is still valued at 9%
of GDP (Hassan & Schneider, 2016). If, however, Greece were only to reduce its shadow economy
to 18%, the EU average—which for Greece would mean $34.7 billion in economic activity and
$13.4 billion in tax revenue—enormous sums would be transferred into the formal
sector (Schneider, 2015). Subtracting the $13.4 billion from the low estimate of $28.1 billion leaves
Greece with an additional $14.7 billion in revenue and when using the top-end estimate of $28.7

38
billion, yields a massive $15.3 billion13 in potential additional income for the Hellenic Republic
(Figure 30). Controlling corruption to this extent would allow Greece easily to keep up with its
annual debt payments (Figure 31) (Forelle et al., 2018) and even to start paying down the
principal. It is maddening to consider that so basic a problem as corruption became serious enough
to precipitate Greece’s sovereign debt crisis and indeed threaten the survival of the euro and even
the EU (Tsoukalis, 2014; Stiglitz, 2016). All of the bickering, fighting, and hand-wringing within
the EU over Greece and the bailouts could have been avoided if, rather than focusing on such
symptoms as tax rates, pension benefits, and deficits, political leaders would have dealt with the
root causes of corruption (Danopoulos, 2014).
Figure 31: Greece's Debt Due
3.2. INEQALITY & POVERTY
One unpleasant consequence of the higher tax rates and cuts to government programs in
Greece has been growth in the portion of the population that belongs to the lower class (TI-G,
2012). As the foregoing discussion makes clear, corruption has slowed Greece’s economic
recovery and contributed to the need both to reduce spending and to increase taxes. A number of
13 These figures do not include the $720 billion that the German magazine Der Spiegel reported in 2011 had deposited
into Swiss banks by wealthy Greek citizens (Palaiologos, 2014). Kostas Vaxevanis, the publisher of a small
independent magazine, was arrested in 2012 for publishing the so-called “Lagarde list,” which contained 2,059 names
of wealthy Greeks who had transferred money into Swiss banks. Also associated with these accusations is the ongoing
inquiry instigated by Hervé Falciani, the HSBC whistleblower who revealed that thousands of individuals from all over
the EU had avoided paying taxes through the use of Swiss banks (Marks, 2018; Palaiologos, 2014). The Tax Justice
Network (TJN) has corroborated the claim that Greeks are hiding money in Swiss bank accounts, estimating the figure
at $24 (Greenland, 2011). The veracity of these accusations has not been determined, nor the exact amounts of money
involved, but they are suggestive of the potential amount of lost revenue in Greece.

39
studies have suggested that the effects of corruption tend to be felt most by those who have the least
(Matsaganis & Flevotomou, 2010; Chene, 2014). The decade-long depression has of course been
hard on everyone in Greece, but Giannitsis and Zografakis (2015) have shown that high
unemployment and tax increases have in particular impacted lower-level earners in Greece,
separating citizens into haves and impoverished have-nots (Figure 32). Their research showed that
younger workers with less experience/training were hard hit by the crisis, as were salaried
employees and pensioners who, unable to “hide” their incomes, bore the brunt of the tax increases
along with others lacking political connections or preferential treatment. Thus, for example, overall
Greek income fell 24.1% from 2009-2013, while in the overlapping period from 2008-2012, prices
of consumer goods increased by 11.2% (owing in part to increases in indirect taxes, primarily excise
and VAT) despite an ongoing recession and an overall inflation rate of only 2.98%. The excise tax
increases included 124.7% on alcohol, 12.3% on tobacco, 91.4% on gasoline, and 1,471.4% on
heating oil. On top of those increases, the VAT tax on the same products was raised 4 %. Taxes
Figure 32: Europe Poverty Risk 2008 vs. 2014
on basic staples obviously hit the poor hardest, and this much is consistent with the study’s overall
finding that the tax/income ratio in the period from 2008 to 2012 increased 440% for the poor,
77.6% for the middle class, and 42.8% for the wealthy. Thus, while the overall costs of declining
incomes and increasing taxes were much greater in total euros for the rich, these costs as a
percentage of income squeezed the poor hardest (Figure 33) (Giannitsis & Zografakis, 2015).

40
Figure 33: Percentage of Deprivation in Greece 2003-2014
Other scholars also have also made the point that indirect taxes are less equitable than the
income tax, which is more progressive (Georgakopoulos, 2016). In Greece, consumption taxes
represent a larger share of overall tax revenue than is the case in other similar-sized economies.
This low direct/indirect tax ratio may be partly explained by the massive amount of tax evasion
involving hidden income; and indeed, studies have shown a direct correlation between reliance on
indirect taxes and corruption in various countries (Liu & Feng, 2015). In 2009, nearly 60% of
Greek tax filers reported earning less than the threshold and were exempted from income taxes,
while overall 90% reported incomes under €28,000. Amazingly, only 1,700 individuals filed taxes
showing incomes greater than €250,000. The ability to hide income depends in part on the manner
in which an individual is paid; thus, since salaried employees and pensioners have more difficulty
hiding their incomes, tax evasion seems to be less of a problem among them (Palaiologos, 2014).
Only 42% of such earners reported income of less than €10,000, but the other occupational groups
are apparently “struggling” as much as pensioners, since 83% reported earning less than €10,000.
Similar dynamics appear to explain the aforementioned large VAT gap and the efforts to which
financially-strapped Greeks go to avoid paying VAT taxes (Kaplanoglou & Rapanos, 2012). A
2016 study likewise found that, of the 5.7 million tax returns that were filed in 2011 , 49% reported
the minimum of €12,000. This group of low earners included 64% of Greece’s self-employed, who
declared an average income of only €4,300. This group of 2.8 million taxpayers paid around €60
million in income taxes, a mere €21.40 apiece on average. Business tax reporting shows similarly
dismal results, with some 220,000 businesses claiming profits of less than €1.2 million and only 901
(less than 5%), reporting larger profits; the latter paid a whopping 61% of all business taxes and the
remaining 220,000 €5,400 each on average. Thus only 8% of the population paid 69% of the
personal income taxes (Georgakopoulos, 2016). Mention should also be made here of the
disproportionate impact that payroll taxes seem to be having on the lower classes as well.
Undeclared and incomplete wage reporting may be reducing employers’ labor costs far more than
they are increasing their employees’ take-home pay, thereby contributing to the unequal distribution
of Greece’s tax burden (Matsaganis & Flevotomou, 2010). These discrepancies in reported income
should be red flags for auditors; in any case, they indicate the particular impact of increased

41
consumption taxes on low-salaried workers and individuals living on fixed incomes
(Georgakopoulos, 2016; Kaplanoglou & Rapanos, 2012).
Figure 34: Percentage of Greeks in Poverty
While taxes have been going up, government spending and benefits have decreased. In 2011
alone, wages in the public sector and state-owned enterprises dropped by 20-30%. Monthly
pensions above €1,000 euros were reduced by 20%, and current retirees under 55 lost 40% of any
pensions over €1,000 (BBC, 2011; Danopoulos, 2014). In 2014, public sector salaries and benefits
were again cut, this time by €5.7 billion, while the monthly checks going to Greece’s 2.7 million
pensioners (about 25% of the population) were supporting 52% of Greek households. Almost half
of these pensioners now have a monthly income below the poverty line. Thus, while 2% of the
Greek population lived in extreme poverty in 2009, over 15% did in 2015 (Henry, 2017). The fiscal
crisis may have hurt all Greek citizens, but the Troika’s call for tax increases and spending cuts
have further widened the gap between the haves and have-nots (TI-G, 2012). As observed earlier,
corruption, while it was not the sole reason for the crisis, has sustained and exacerbated it and has
increased poverty and inequality (Matsaganis & Flevotomou, 2010) (Figure 34).

42
3.3. POPULATION DECLINE Another looming cost for Greece indirectly linked to corruption is population decline. As has
been seen, corruption is one of the major factors responsible for prolonging the country’s
depression, particularly in terms of reducing tax revenues and preventing it from balancing its
budget and paying off an
enormous public debt—
180% of GDP— that is in
turn also perpetuating the
crisis. Ongoing high
unemployment—rates
were at 23.6% overall and
47.4% for younger
workers in 2016—has
contributed to a mass
exodus of Greeks from
their homeland. Thus
from 2011 to 2016, Greece
lost 3% of its population,
and the trend is expected
to continue (Figure 35).
The population is
predicted to decrease to
9.9 million by 2030 and to
only 8.9 million by 2050
(Sievert et al., 2017). At
the peak in 2010, Greece had 11.1 million residents; the current number of 10.7 million is the same
that it was in 1998; the population has not been as low as 9.9 million since 1984 to (Figure 36).
Sievert, Neubecker, and Klingholz (2017), in their study of Europe’s demographic future,
early on state that “In the economy of the 21st century, the most important resources are no longer
large industrial plants, farmland or mineral deposits but rather the knowledge and skills of human
beings. Those countries and regions that succeed in constantly developing the sum of their
inhabitants’ skills—which is often referred to as human capital—can look forward to growing
prosperity. The others can become losers in today’s services and knowledge society” (p. 6). This is
a frightening prospect for Greece; for while corruption keeps many countries from experiencing
“growing prosperity,” in Greece’s case, the inability to curb it and pay off the public debt could
bring ruin (Sievert et al., 2017).
Figure 35: EU Population Change 2015

43
Figure 36: Greece Population Change
Its demographic situation thus threatens to deprive Greece of essential human capital. The
country already has one of the lowest fertility rates in the EU, 1.33 children per woman, and now its
younger workers are emigrating at astonishing rates. The latter problem is particularly critical
because those leaving are some of Greece’s best and brightest. A recent study reported that some
two thirds of the 280,000 to 350,000 Greeks who left the country between 2010 and 2015 had
college degrees and a fourth of those were postgraduate degrees (Labrianidis & Pratsinakis, 2016).
This decline is taking place despite the huge influx of refugees reaching Greek shores. With fewer
babies being born and younger workers leaving, Greece will by 2050 have the lowest worker-to-
retiree ratio in the EU. Today, 21% of Greek citizens are over 65 (the second highest ratio in the
EU); by 2025, that number will increase to 23% and by 2050 to an enormous 30%. The country
currently spends more than any other in the EU on pension benefits, a hefty 17% of GDP (Sievert et
al., 2017)—and this despite the enactment of reforms that have reduced benefits14 and extended the
retirement age. Greece’s retirement system is in fact bankrupt and must be supplemented with
general revenue to meet its obligations each year.15 The pension fund deficit is currently 9-10% of
GDP, nearly €20 billion annually16 (Nektarios et al., 2016). Undeclared work, tax evasion, and
corruption are draining the pension system, even as lower fertility rates and a mass exodus of skilled
workers looking for employment will lead to bankruptcy in the future (Sievert et al., 2017).
14 Pensions have been cut 11 times since the 2010 restructuring (Palaiologos, 2014). 15 In June 2015, Greece became the first developed nation to default on an IMF loan when it was unable to meet all of
its payment obligations on both a $1.7 billion interest payment to the IMF and a $1.5 billion payment to its social
security funds. Frantic efforts to borrow more money having failed, Greece in the end made the social security payment
and let the IMF payment lapse (Myers, 2017). 16 The deficit in Greece’s pension funds is projected to reach €460 billion by 2060 (Myers, 2017).

44
SECTION 4. ANTI-CORRUPTION REFORMS
Nearly everyone seems to have an opinion regarding what Greeks should do to curb
corruption. Websites, newspapers, and magazines are filled with articles and studies by well-
intentioned economists, political scientists, and politicians explaining why Greece is so corrupt,
what sorts of reforms should be adopted, and, especially, why the current reforms are not working.
The EU Commission, IMF, ECB, German bankers, and EU regulators have forced Greece to adopt
stringent reform measures in order to obtain bailouts for its economy, but the solutions seem to have
backfired (Stiglitz, 2016). A crisis that started as a recession has turned into a depression, and the
measurement indices, as well as scholarly research, seem to indicate that corruption has not
improved, and indeed may have worsened, in the aftermath. Several writers have described the
phenomenon as a vicious circle in which spending cuts and higher taxes produce low QoG and a
lack of trust, which in turn feed corruption and tax evasion, leading to higher taxes and even larger
spending cuts, and further diminishing QoG and eroding trust (Paraskevopoulos, 2012; Azariadis &
Ioannides, 2015; Katsios, 2006). The result is mistrust and inequality among citizens, weakening
institutions, increasing taxes, decreasing revenue, and mounting public debt (Tsalas &
Monokroussos, 2017).
In considering how Greece can escape from this vicious circle, native economists Georgia
Kaplanoglou and Vassilis Rapanos (2012) are among scholars who suggest that the best place to
begin is with the country’s inept and corrupt tax administration system (cf. Azariadis & Ioannides,
2015; Eble et al., 2013; Bitzenis et al., 2016; Artavanis et al., 2015; Hondroyoannis &
Papaoikonomou, 2017). Before considering possible reforms, it is necessary to appreciate just how
deeply corruption is ingrained in this institution. Especially instructive in this respect are the efforts
of Diomedes Spinellis, a software engineering professor at the Athens University of Economics and
Business. Spinellis’s story has been well told by Yannis Palaiologos in his revealing 2014 book on
the Greek crisis, The 13th Labor of Hercules. In 2009, the apolitical professor was, surprisingly,
selected on merit through an on-line hiring initiative and placed in charge of the General Secretariat
of Information Systems (GSIS) at the Ministry of Finance. Spinellis had enjoyed a highly
successful academic career and maintained a stellar reputation in the field of IT and computer
engineering and, having studied abroad, chose to return to Greece to demonstrate that it was
possible to succeed in the IT world back at home. Spinellis’s work was frequently published in top
academic journals and presented at prestigious conferences, and his book on computing has been
translated into six languages. At the peak of his academic career, he decided to apply for the
government IT job to see if he could help bring Greece’s bureaucracy into the twenty-first century
(Palaiologos, 2014).
Predictably, Spinellis found the Greek tax administration system to be technologically
challenged, to say the least. He quickly assembled a team of five IT experts and began working to
upgrade his department’s technical capabilities. In many instances, they used open source software
on account of the administrative hurdles to purchasing or developing software, including the
requirement for approval of officials resistant to changes to “their” system. He even found that the
department had purchased a software system with the abilities to track taxpayers’ information and
to compare records in order to identify discrepancies, but it was not being used. Very quickly, these

45
efforts began yielding impressive results. The system swiftly and easily identified small businesses
that were not reporting all their income, and Spinellis generated a list of suspected violators and sent
it off to Greece’s 275 tax offices for follow-up investigation. When little action was taken in those
cases, he developed a program to track and follow up on those discrepancies a second time. Within
a year, the tax offices had recovered €762 million, which sounds like a large sum until it is
compared with the €38.7 billion in unpaid taxes in 2010 and €62.3 billion in 2013.
Spinellis continued to fight these battles with the tax administration bureaucrats before
abruptly resigning toward the end of 2011. He cited personal reasons for his departure, but many
concluded that the decisive issue was the struggle over fuel smuggling.17 The problem was alluded
to earlier; to provide a bit more detail, Greek fuel distributors had to pay a high tax rate when
purchasing fuel but charge a lower tax rate to their retail customers; they were then reimbursed for
the difference very quickly—within 48 hours—by the tax authorities. Spinellis found an easy way
to use this system to collect taxes owed by gas stations: he simply withheld any reimbursement
payments from stations that were in arrears until they settled their accounts. The success of this
procedure naturally upset the petroleum industry and, despite then Prime Minister Papandreou’s
avowed commitment to curb fuel smuggling, a discreet move by the finance minister eliminated the
differential in the taxes and thereby the need for the reimbursements, so the back taxes once more
went unpaid. Spinellis resigned later that same year.
Furthermore, Andreas Drymitis, an adviser to the prime minister on IT issues, observed that,
though the automated system kept uncovering cases that deserved investigation, “to his knowledge,
not a single audit took place” (Palaiologos, 2014, p. 39). The former Greek ambassador to the
OECD, Nikos Tatsos, who had been an adviser to several Greek finance ministers and had taught
Public Finance at Panteion University, reported that he had seen numerous well-intentioned
ministers work to reform the tax administration department only to see their plans ignored and
reforms delayed before exiting with their proverbial tails between their legs. He described the
bureaucratic scheme in military terms by saying, “You cannot go in there using a regular army,
you’ve got sharp-shooters shooting at you left and right. It’s a guerrilla war, and you need to use
irregular methods to succeed” (p. 33).
The experiences of experts like Spinellis and Tatsos are illustrative of the resistance of Greek
institutions to reform and the need to begin the fight against corruption by focusing on the tax
administration. The problem, however, involves not only low-level bureaucrats and high-ranking
politicians but also powerful special interests that exist outside the governmental institutions. In
2017, for example, Greece’s special anti-corruption prosecutor Eleni Raikou18 resigned, asserting
that she had been “targeted” by “unofficial power centers” concerning her investigation of the €28
million Novartis bribery case. In most advanced countries, the resignation of a high-ranking official
under such circumstances would have occasioned significant questions from the legislative or
executive branches of government, but Greek political leaders kept quiet and said nary a word
(Marks, 2018).
17 Again, fuel smuggling is estimated to cost Greece $3 billion in lost tax revenue annually (Mitrakos, et al., 2014). 18 Raikou also successful prosecuted former Defense Minister Akis Tsochatzopoulous, one of the few high-level
officials to be brought to justice in Greece.

46
Too often in Greece reformers and anti-corruption crusaders are being ignored or intimidated
by powerful politicians and special interests, the resistance to change in the Greek tax
administration being the prime example. Antonakas et al. (2014) asked a series of questions of a
number of officials who had been involved with corruption in the tax department and identified
three primary contributing factors, namely the method for selecting tax officers, the procedures for
evaluating and promoting them, and the manner in which corruption cases are adjudicated. The
latter was described as most problematic, specifically the weak penalty system and the failure of
many cases to result in penalties. These researchers provided three examples of the lack of
discipline within the tax administration. One involved an official’s use of a coworker’s computer
and password to issue a certificate indicating that her fiancé owed no tax to the government when he
in fact owed €178,863; her transgression having been identified, the Disciplinary Council
suspended her for three months without pay. Another official, having misappropriated €175,000,
was suspended for six months with no pay. In a third case, the Disciplinary Council ordered no
punishment at all for an official in the License Construction department found to have €465,000 in
his bank account with no valid income to account for such a high balance and the deposits proved to
have been received from individuals with whom he routinely dealt with in his official capacity. The
other honest bureaucrats who follow the rules attribute corruption to the lack of serious
consequences for those caught engaging in it, and cases like these corroborate the conclusions of the
2014 Greek Annex of the EU Anti-Corruption report regarding the disciplining of civil servants
(EU Commission, 2014). Interestingly enough, interviewees for that study rated salary levels as the
least influential of six factors contributing to corruption in the tax department; the main factor
seems to be the combination of high rewards and low likelihood of punishment.
These conditions have given rise to the so-called “4-4-2 system” for paying taxes in Greece,
in which a citizen pays 40% of his or her tax bill as a bribe to a tax official in exchange for a 40%
reduction in liability, so that only 20% of what is owed reaches the government’s coffers. This
practice is so widespread that a former investigator with the anti-fraud unit (i.e., the SDOE)
mentioned it during a panel at a tax evasion forum in 2011 (EU Commission, 2014; Palaiologos,
2014). Unfortunately for those who support reform, this mindset regarding taxation seems to be
shared by the members of parliament, who in 2009 quickly dismissed a bill that would have
mandated audits of professionals who report less than €20,000 in the healthcare, legal, engineering,
academic, and media fields. The demise of this bill communicated to rank-and-file bureaucrats that
stopping tax evasion was not a priority among Greece’s top officials (Artavanis et al., 2015).
This admittedly lengthy preamble to the discussion of reform measures has served to make
clear just how pervasive corruption is within the Greek government in general and within the tax
administration system in particular. Since 2010, Greek politicians and officials have enacted scores
of laws designed to curb corruption and have been consistent in their denunciations of it, but they
have very rarely taken actions that would give force to their words (TI-G, 2012). In short, despite
their insistence that corruption is a serious crime that has to be stopped, Greek leaders, when given
the chance to do anything about it, have invariably failed. Laws turn into loopholes, excuses are
made, and deadlines are missed; in the words of Palaiologos (2014), “it was a novel kind of (crime):
not victimless so much a villain-less” (p. 30).
47
Some progress has been made toward reforming the tax administration, as the number of local
offices has gone from 290 to 120 and the number of employees in the department has shrunk from
10,500 to 9,000 (Guillot, 2015). The ratio of Greek tax administration employees to active
taxpayers has increased from 1:778 to 1:1,270, so that it is now much higher than the average of
848 for other high-income countries. At the same time, the percentage of employees involved in
auditing is only 21.5%, considerably less than the 35% average for OECD countries (Kaplanoglou
& Rapanos, 2012).
Tax administration in Greece, then, is in need of a complete overhaul. The following list
presents some of the more pressing needs for reform (Figure 37).
• In 2012, 150,000 tax dispute cases were pending, and it can take from 7 to 10 years for a
citizen to receive a decision from Greece’s tax courts. According to the TI-Greece (2012)
study, the Greek judicial system had over 400,000 cases pending in 2015. The slow pace of
process frustrates taxpayers and fosters tax evasion, and the dispute-resolution mechanism
requires particular attention (TI-G, 2012; Kaplanoglou & Rapanos, 2012; Artavanis et al.,
2015; Eble et al., 2013).
• One reform mentioned in nearly all studies is simplification of the Greece tax code, the
current complexity of which, as discussed above, impedes enforcement (Azariadis &
Ioannides, 2015; EU Commission, 2014; Eble et al., 2013; Georgakopoulos, 2016;
Kaplanoglou & Rapanos, 2012; Katsios, 2006; PwC, 2016). A complex and constantly
changing tax code has been shown to confuse citizens and to decrease tax morale
(Kaplanoglou & Rapanos, 2012; Liu & Feng, 2015).
• Another reform commonly advocated is a lowering of tax rates. Also as noted, tax revenue
in Greece has declined since 2010 despite dramatic increases in tax rates. Many researchers
have argued that this reform would decrease tax evasion and increase tax revenues (Eble et
al., 2013; Georgakopoulos, 2016; Bitzenis et al., 2016; Dellas et al., 2017; Katsios, 2006).
• The lenient tax payment installment schemes represent a further problem. Nearly $1.2
billion in taxes go unpaid every month in Greece, the total value of which now exceeds 70%
of the country’s GDP. In an effort to recover at least some portion of these funds, the
Parliament has since 2001 offered more than 50 installment plans, the qualifications for
which have become progressively less stringent even as the time allowed for repayment has
been increased and the interest rates decreased. As a consequence, taxpayers defer paying
their taxes in anticipation of more favorable terms allowing for a reduced tax burden.
Additionally, of taxpayers who agree to installment plans, 13% cease making payments
before they have met their obligations (Bergthaler et al., 2017).
• Lowering consumption taxes could promote equality and lower the VAT gap (Kaplanoglou
& Rapanos, 2012; PwC, 2016).
• Third-party information and risk assessment tools could be used to target audits in sectors
where tax evasion is particularly high (EU Commission, 2014; Eble et al., 2013).
• Elimination of cash payments at all tax offices could also make tax evasion more difficult
(EU Commission, 2014).
• Audits should be triggered automatically for any business that does not show a profit for
three consecutive years (author’s recommendation).

48
• In-depth reviews of all employees can serve as a basis for dismissing those who lack the
skills necessary to do their jobs. At the same time, the pay for accountants and auditors
should be increased. A combination of staff reductions and implementation of new
technologies can lower costs and improve productivity (Eble et al., 2013; Antonakas et al.,
2014).
• Tax officials can be motivated by cash bonuses to identify corruption and tax evasion
(author’s recommendation).
• Citizens can be motivated to provide information by offers of rewards, for instance a portion
(perhaps 5-10%) of recovered tax revenues or fines from cases that are successfully
prosecuted (author’s recommendation).
• Increasing penalties and fines imposed on those who violate the laws has been shown to
lower the rates of tax evasion and other types of corruption (Litina & Palivos, 2011). In
Greece, tax cheaters face a low probability of detection and leniency if they are caught, as
local officials reduce penalties sometimes to nothing and interest by as much as 80%, even
though interest rates on penalties are not compounded. Additionally, those convicted of tax
evasion receive either a 5% cash rebate if they pay immediately or can choose an installment
option that allows for a 50% discount on penalties and interest. This process renders the
penalties meaningless since they allow cheaters to pay an interest rate below the market rate
(Eble, et al., 2013).
• Because the tax amnesties that are announced every three to five years promote tax evasion
and in effect punish law-abiding taxpayers all while reducing revenue to the state, their
abolition should be prioritized (Kaplanoglou & Rapanos, 2012; Eble et al., 2013).
• Numerous studies have shown that increasing the frequency of audits increases tax
compliance (Tsalas & Monokroussos, 2017; Kaplanoglou & Rapanos, 2012). A Bank of
Greece working paper (Tagkalakis, 2013) used an audit program designed to combat VAT
evasion that was conducted from July to September in 2012 to determine whether more
audits would increase compliance. In a sample of 5,157 audits, officials identified 2,853 tax
cheats and 34,836 violations of tax law, for an overall 55.2% violation rate. The paper
showed that the number of tax offenders decreases by 4-9% for every 1% increase in the
number of audits, though the enforcement of penalties and collection of fines were identified
as the paramount considerations when it came to the seriousness with which the taxpayers
approached the audits (cf. Litina & Palivos, 2011; Eble et al., 2013). Likewise, a more
recent audit effort focused on wealthy individuals, the self-employed, and VAT abusers,
found that a 10% increase in annual audits yielded an additional €251 million in revenue
(Tagkalakis, 2014).
• Closure of many of the autonomous local tax offices, at which substantial amounts of
corruption take place, would help to centralize control and improve accountability (Eble et
al., 2013).
• The goals of increasing efficiency and of reducing corruption can both be served by moving
more transactions between citizens and public servants online (TI-G, 2012).

49
Figure 37: Tax Administration Anti-Corruption Reforms
These, then, are the major recommendations for improving Greece’s tax administration.
Taking now a more broad perspective, the following list includes more general recommendations
for fighting corruption in other areas of Greek government. It is by no means complete, but it does
address many of the concerns raised earlier (Figure 38).
• Social security benefits should be based in part on each taxpayer’s total contribution rather
than simply on the number of years paying into the system (Eble et al., 2013).
• Greater protection for whistleblowers would encourage those who witness government
abuse to step forward (EU Commission, 2014; Artavanis et al., 2015).
• Whistleblowers could also be encouraged by awarding them a percentage of any savings
earned by the government as a result of their reporting of corrupt practices or crimes
(author’s recommendation).
• Full disclosure of lobbying activities should be mandated, covering all gifts, trips, and meals
provided to elected representatives and civil servants (EU Commission, 2014).
• Full disclosure should also be mandated for all donations and loans to candidates for elective
office and to political parties (EU Commission, 2014).
Area of Govt. Tax Administration Anti-Corruption Reforms
Tax Administration Improving the dispute resolution mechanism and developing alternative dispute-settlement institution utilizing arbitration boards
Tax Administration Simplifying Greece’s complex tax code; lowering Greece’s tax rates; Lowering consumption taxes
Tax Administration Use third party information and risk assessment tools to target audits into sectors where tax evasion is shown to be the highest
Tax Administration Elimination of cash payments in all tax offices
Tax Administration Audits are automatically triggered for any business that does not show a profit for three consecutive years
Tax Administration Purging all those who do not possess the skills necessary to do their jobs; increasing the pay for accountants and auditors
Tax Administration Paying bonus to tax officials for uncovering tax evasion and corruption
Tax Administration Offer any citizen who provides credible information that leads to the successful prosecution of a corruption case 5% to 10% of recovered tax collections or fines
Tax Administration Increasing penalties and fines for tax evaders; meticulous enforcement of penalties and collection of fines
Tax Administration Ending the lenient tax payment installment schemes
Tax Administration Ending tax amnesties
Tax Administration Conducting more audits
Tax Administration Closing many of the autonomous local tax offices; more centralized control and accountability of personnel
Tax Administration Move as many transactions between citizens and public servants to on-line and electronic means

50
• According to Tzogopoulos (2015), the Greek media is far from free, with only five families
controlling a majority of broadcast and print outlets in the country. He further drew
attention to the negative impact of the crisis on media revenues and explained that a
combination of low licensing fees, one-year contract renewals, and a tax exemption on
advertising revenue has fostered favorable coverage of Greek politicians and powerful
special interests. Thus Greek banks have loaned hundreds of millions of euros to media
outlets and are among the largest advertisers, so that a cozy relationship has been maintained
between media outlets and the wealthiest Greeks. Along similar lines, Pavlos Eleftheriadis,
in a 2014 Foreign Affairs article titled “Misrule of the Few: How the Oligarchs Ruined
Greece,” demonstrated that most media outlets are owned by petroleum companies, banks,
shipping concerns, and mining companies and reported on a leaked US diplomatic cable
revealing that, while the media operations consistently lose money, their purpose is
“primarily to exercise political and economic influence.” In other words, their media firms
are in effect loss leaders for large companies seeking favorable treatment in government
regulations or contracts (Eleftheriadis, 2014). Several reforms are accordingly needed to
ensure a free, independent, and functioning press, the first being a limit on the number of
media outlets that can be owned by a single individual or entity. Further, the length of
broadcast rights licenses needs to be extended. Also needed are sunshine laws and laws that
guarantee the freedom of the press in general when reporting on government
corruption19 (SGI, 2017; Eble et al., 2013; EU Commission, 2014).
• Transparency in the procurement process can be improved by empowering the Supreme
Audit Council to oversee government contracts and purchases (Azariadis & Ioannides, 2015;
EU Commission, 2014). Also effective would be a ban from public contracting for three to
five years on firms found to have engaged in corruption or tax evasion (Tsalas &
Monokroussos, 2017).
• Transparency could further be promoted by allowing businesses to make payroll tax
payments electronically and requiring that public works contracts explicitly forbid the use of
undeclared workers by subcontractors; publication of a list of companies that had broken the
rules would hopefully discourage all companies from engaging in corrupt practices. Also
along these lines, inspections should target sectors in which undeclared work is most likely
to occur with increased fines and sanctions (ILO, 2016).
• A 12-year term limit for members of parliament has been proposed as a means of curbing
political corruption (Azariadis & Ioannides, 2015).
• Also useful in this respect would be reductions in the immunity protections extended to
members of parliament and other high-ranking public officials (EU Commission, 2014).
• Abolishing the special statute of limitations for ministers and lengthening the statute of
limitations would provide prosecutors with sufficient time to bring corruption cases to trial
(EU Commission, 2014).
19 As mentioned earlier, in 2012, Kostas Vaxevanis, the publisher of a small independent investigative journalism
magazine, was arrested for publishing the so-called Lagarde list, which contained 2,059 names of wealthy Greek
business persons who had transferred money out of the country and into a Swiss bank (Palaiologos, 2014). While
Vaxevanis was arrested, the investigation into the depositor’s actions has stalled, and the resignation of Greece’s special
anti-corruption prosecutor Eleni Raikou in March 2017 stands to slow the investigation even more (Marks, 2018).

51
• Full transparency would require complete disclosure of the assets held by all ministers,
members of parliament, high-level government officials, and even low-level bureaucrats
involved in decision-making that affects the public—and their spouses. Such measures
would need to include an independent verification mechanism for declaring assets (EU
Commission, 2014).
• A thorough review of all civil servants should be conducted that takes into account their
backgrounds and training in light of current productivity levels in an effort to identify those
who are unqualified for their positions or are not producing the results that their positions
require (TI-G, 2012).
• School textbooks should address the negative aspects of corruption; awareness of these
issues could also be promoted through essay contests for students of all ages focused on the
impact of corruption on families, communities, businesses, and government (author’s
recommendation).
• State workers should be prohibited from participating in political activities, either through
volunteering or contributing to candidates or political parties (author’s recommendation).
• All anti-corruption agencies and positions should be brought under the control of a single
agency (TI-G, 2012).
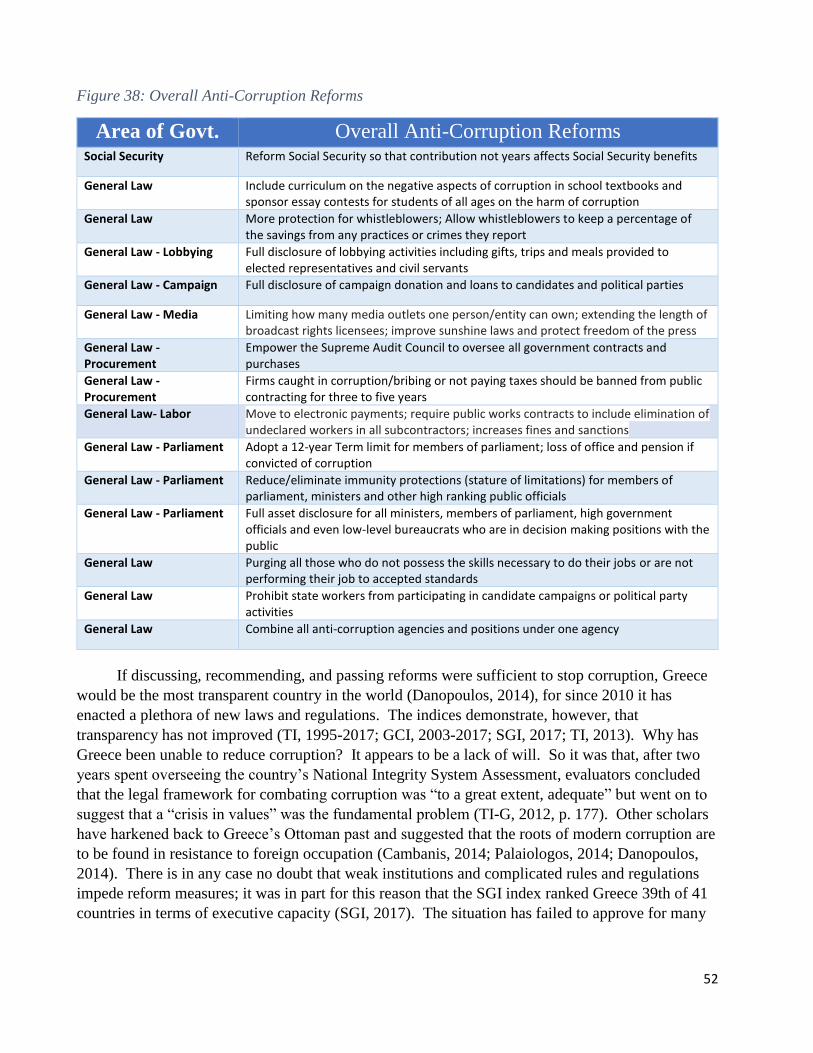
52
Figure 38: Overall Anti-Corruption Reforms
Area of Govt. Overall Anti-Corruption Reforms Social Security Reform Social Security so that contribution not years affects Social Security benefits
General Law Include curriculum on the negative aspects of corruption in school textbooks and sponsor essay contests for students of all ages on the harm of corruption
General Law More protection for whistleblowers; Allow whistleblowers to keep a percentage of the savings from any practices or crimes they report
General Law - Lobbying Full disclosure of lobbying activities including gifts, trips and meals provided to elected representatives and civil servants
General Law - Campaign Full disclosure of campaign donation and loans to candidates and political parties
General Law - Media Limiting how many media outlets one person/entity can own; extending the length of broadcast rights licensees; improve sunshine laws and protect freedom of the press
General Law - Procurement
Empower the Supreme Audit Council to oversee all government contracts and purchases
General Law - Procurement
Firms caught in corruption/bribing or not paying taxes should be banned from public contracting for three to five years
General Law- Labor Move to electronic payments; require public works contracts to include elimination of undeclared workers in all subcontractors; increases fines and sanctions
General Law - Parliament Adopt a 12-year Term limit for members of parliament; loss of office and pension if convicted of corruption
General Law - Parliament Reduce/eliminate immunity protections (stature of limitations) for members of parliament, ministers and other high ranking public officials
General Law - Parliament Full asset disclosure for all ministers, members of parliament, high government officials and even low-level bureaucrats who are in decision making positions with the public
General Law Purging all those who do not possess the skills necessary to do their jobs or are not performing their job to accepted standards
General Law Prohibit state workers from participating in candidate campaigns or political party activities
General Law Combine all anti-corruption agencies and positions under one agency
If discussing, recommending, and passing reforms were sufficient to stop corruption, Greece
would be the most transparent country in the world (Danopoulos, 2014), for since 2010 it has
enacted a plethora of new laws and regulations. The indices demonstrate, however, that
transparency has not improved (TI, 1995-2017; GCI, 2003-2017; SGI, 2017; TI, 2013). Why has
Greece been unable to reduce corruption? It appears to be a lack of will. So it was that, after two
years spent overseeing the country’s National Integrity System Assessment, evaluators concluded
that the legal framework for combating corruption was “to a great extent, adequate” but went on to
suggest that a “crisis in values” was the fundamental problem (TI-G, 2012, p. 177). Other scholars
have harkened back to Greece’s Ottoman past and suggested that the roots of modern corruption are
to be found in resistance to foreign occupation (Cambanis, 2014; Palaiologos, 2014; Danopoulos,
2014). There is in any case no doubt that weak institutions and complicated rules and regulations
impede reform measures; it was in part for this reason that the SGI index ranked Greece 39th of 41
countries in terms of executive capacity (SGI, 2017). The situation has failed to approve for many
53
reasons, but in any case corruption and the prolonged economic depression continue to have a
negative impact on Greek citizens (Danopoulos, 2014).

54
CONCLUSION The Greek sovereign debt crisis and its effects on the eurozone brought the country’s
financial difficulties to the attention of the world. Excessive borrowing and inept administration by
the government were quickly identified as the main causes of these difficulties. The Troika made
any bailout funds for Greece contingent on spending cuts, tax increases, and structural reforms.
With no other options and no one to blame but themselves, the Greeks were forced to accept these
unwelcome austerity measures and the ensuing economic hardships that followed. The crisis that
led to a worldwide recession has grown into a depression for Greece (Economides et al., 2017).
Now, seven years after the crisis, with its economy having shrunk by 25%, Greece continues
to languish in the economic doldrums while its neighbors have for the most part recovered and are
enjoying economic growth and decreases in unemployment. European leaders, along with political
scientists and economists, have long been aware of Greece’s history of significant corruption, but,
before the crisis, few were concerned because only the Greeks themselves seemed to be suffering.
In the current global economy, however, Greek corruption has come to weaken the euro and,
according to some observers, is threatening the very future of the EU (Tsoukalis, 2014; Stiglitz,
2016).
The effort to measure and find an effective cure to combat corruption in Greece has
accordingly been hurried and intense. In 1995, long before the Greek crisis, when serious scholars
were still questioning whether corruption is in fact harmful to economies, Transparency
International launched its Corruption Perception Index, which has consistently shown that Greece
has a significant corruption problem. The literature review on corruption in Greece presented above
corroborates this conclusion and documents significant exacerbation of the problem in the aftermath
of the crisis. Using surveys, interviews, and research into tax records, credit applications, labor
inspections, and audit reports, empirical studies have provided credible estimates of the extent to
which corruption is reducing Greek tax revenues. Earlier studies valued the shadow economy at
between $21.2 and $67.5 billion annually, translating into a loss in revenue of $8.1 to $26.5 billion,
while more recent studies have valued it at almost 40% of GDP or around $83.6 billion, which
translates into a $28 billion loss in tax revenue. Former Prime Minister Papandreou, on the other
hand, suggested a considerably higher loss of $36 billion to tax evasion and missed social security
contributions (Greenland, 2011). Other studies indicated that over a third of Greek work goes
undeclared, and the effects of the capital controls that led to increased electronic payments and
higher VAT collections corroborate estimates of Greece’s VAT gap at some 30-50%. Media and
scholarly estimates of the size of Greece’s shadow economy before the crisis have placed it at
around 20-25% of GDP, and more recent research on the informal sector lends strong support to the
assertion by Dellas et al. (2017) that the Greek shadow economy has grown to 35-40% since the
crisis. Scholars have also pointed to Greece’s low QoG and eroding public trust as explanations for
its corruption problem.

55
The CPI results were confirmed by
the other three indices evaluated above.
These indices painted a similar picture of a
Greece beset by corruption before the crisis,
and each showed an uptick in corruption
afterward and little or no improvement
following the implementation of anti-
corruption reforms. In 2016, Greece was
ranked 69th on the CPI, second to last
among EU countries and behind Cuba,
South Africa, and Rwanda. Of the 12
institutions rated by the GCB, Greece
received the lowest score on seven in
comparison with other EU, BAL-13, and BS-10 countries, though it was still just above the world
average on many of them. The GCI scores followed a similar pattern, with Greece experiencing an
enormous decrease following the crisis and never recovering. Today, the country is ranked 87th in
the world, with a GCI score lower than the EU, BAL-13, and BS-10 averages. On the crucial first
pillar, dealing with government institutions, Greece also ranked 87th, with a mere 3.7 score out of a
possible 7. So also on the SGI, Greece lagged other EU countries, ranking last of 41 in policy
performance and 39th in government capacity, statistics that again help to explain the low QoG and
eroding public trust identified in the literature. The unprecedented drop in economic output made
conclusive results extremely difficult to obtain in the linear regression and basic correlation
analyses presented here. Nevertheless, despite the ongoing depression and changes in the
methodologies used by some of the indices, the regression analysis indicated a positive relationship
between corruption and Greece’s increasing tax burden and no relationship between increased
government spending and QoG. The basic correlation analysis similarly associated decreasing
transparency with reduced GDP. It was further observed that, even as government spending
increased by 9% as a percentage of GDP, Greece’s QoG score dropped by 60%.
Like the author of this paper, readers may have been especially surprised by the staggering
impact of corruption on Greek tax revenues. Even shrinking Greece’s $83.6 billion shadow
economy to the EU average of 18% would reduce the currently estimated $28 billion in tax losses
by $13.4 billion, leaving an additional $15.7 billion for Greece to easily meet its debt obligations
and to provide tax relief that could further shrink the shadow economy, the influence of which has
resulted in the higher taxes that are hitting Greece’s poorest citizens the hardest. This growing
inequality both fuels feelings and mistrust in the government and drives many of Greece’s most
talented young people to go abroad in search of a better life. Since 2011 alone, some 360,000
Greeks, or 3% of the population, have taken this path. Of those who have stayed, more than a third
are living below the poverty line, some of them turning to illicit means to make ends meet. This
vicious cycle will eventually ruin Greece if something is not done to stop it.
The task is a formidable one. Putting an end to corruption in Greece will take more than the
passage of additional reforms, for, in the words of the TI-G (2012) assessment quoted above, “the
current legal framework is, to a great extent adequate” (p. 177). While this paper has highlighted
Figure 39: Greece's CPI Score Compared to Others

56
dozens of specific proposals for increasing transparency, improving the QoG, and restoring the
public trust, none has the power to instill in political leaders, civil servants, or average citizens the
will to act. Only the Greek people can fix their broken system and, though they have elected five
different governments since 2009, these leaders have so far proved unwilling to tackle the culture of
corruption in the Hellenic Republic. Corruption in Greece continues to be sustained by a
combination of average citizens trying to survive in a shattered economy, public servants
compensating for drastic pay cuts, politicians worrying about re-election, and powerful special
interests protecting their wealth and the status quo.
I will close with a personal reflection on the US that can provide some perspective on the
Greek dilemma. Americans are no more honest than Greeks; and conversely the 3 million Greek
nationals living and working in the US are widely regarded as intelligent, hardworking, and honest
citizens. Like Greeks, many Americans have lost trust in government. We too wait in long lines
hoping that a disinterested bureaucrat will help us at the post office, licensing bureau, or social
security branch. We see our veterans being mistreated while big banks obtain multi-billion dollar
bailouts. We know people who receive a monthly disability check but work for cash during the
week and ride horses on the weekends. Young people are frustrated as payroll taxes increase and
they realize that soon there will only be three active workers to support each social security retiree.
Workers offer discounts for home repairs if owners will pay in cash, and used cars are sold by
individuals for cash so that the buyers can lower their sales tax owed from the purchase. American
politicians make promises to get elected and break them once in office. In short, Americans love
their country, but many distrust their government and believe that they are not getting their money’s
worth from the taxes that they pay.
Nevertheless, most Americans pay their taxes, and few resort to bribes. We are far from
perfect, and our estimated 9% shadow economy makes clear that not everyone follows the rules, but
there is one major reason that Americans pay taxes at a higher rate than Greeks: we fear getting
caught. We know that the punishment for those found to have cheated on their taxes is inescapable,
that the fines are high, and that the courts cannot be bought off. In technical terms, Americans may
not have a high tax morale, but they demonstrate a high degree of tax compliance. The Internal
Revenue Service (IRS) is an inflexible government agency that is despised by most Americans, for
when a taxpayer is in arrears, its agents show no mercy, placing liens on all of his or her property
apart from the primary residence. Declaring bankruptcy can protect an American citizen from
creditors, but not from debts owed to the government. IRS agents are empowered to shut
businesses down and sell off assets, and they are not concerned that loss of a business can make it
impossible to pay a tax bill. Unpaid taxes accumulate penalties and interest at considerably more
than the going market rate. There is very little leeway; the collection system is harsh and stringent,
and taxpayers who become entangled in it are known to suffer embarrassment and mental anguish
that has driven some even to suicide. Only 1% of all taxpayers are audited, but the process involves
a detailed account of a taxpayer’s financial life. Tax agents for their part are awarded bonuses and
promotions for finding unpaid taxes and otherwise increasing compliance. The IRS also rewards
anyone who reports a citizen for tax fraud some 15-30% of the funds recovered; thus in 2015 some
87,000 “patriots” informed on their fellow Americans and collected some $103 million in rewards
for their efforts (Orem, 2016).

57
What Greece needs now, is what I suspect it has always needed. It is what the whole world
needs, but unfortunately, is in short supply of namely─leadership. The Greeks need leaders who
will set pride and self-interest aside for the greater good, leaders who will enforce the laws fairly by
making cheaters pay and sticking to the rules. While I was in the US Marine Corps, an old colonel
once told me, “Don’t expect what you don’t inspect.” An aggressive detection effort is needed if
corruption is to be curbed, for it is hard to stop cheating when there is no fear of being caught. The
Marine Corps has another saying that applies to stopping corruption: “Never underestimate the
power of negative reinforcement.” People rarely change their ways voluntarily, and rewards are
seldom enough; change typically involves pain. When others see a rule-breaker punished, it
encourages them to play by the rules; conversely, when rule-breakers face no consequences, it
encourages those who have been following the rules to join the violators so as to enjoy the benefits
of rule-breaking. Corruption is contagious.
While some observers blame the harsh Ottoman occupation—which ended almost 200 years
ago—for instilling in Greece an enduring culture of corruption, what is needed now is not an
assessment of blame but rather to call this problem out for what it is (Danopoulos, 2014). Greeks
engage in corruption because they believe that they are unlikely to be caught and that, even if their
misdeeds are detected, they are unlikely to be punished. Greek corruption is not hereditary; Cypress
shares a Hellenic heritage but is much more transparent than Greece, and as noted earlier Greeks are
respected and admired for their virtue and honor in America and all over the world. For an example
of a country that has broken with its past in this way, one need only look to Georgia, once a highly
corrupt communist state but whose citizens found a way to change their mentality and embark on a
new path of transparency. So also in Greece there are a great many honest people working to
change the culture of corruption, as evidenced by the 82% of respondents to a recent GCB poll of
Greeks who agreed that “average people can make a difference” (TI, 2013). There is, then, hope
that Greeks still believe that this problem can be fixed, even if the status quo has been hard to alter.
Hopefully, those who oppose corruption will have the opportunity to unite behind a leader who is
committed to equitable enforcement of Greece’s laws, who will fight corruption and put fear into
the hearts of lawbreakers. In this light, it is worth repeating the Mark Twain quotation that serves
as the epigram this paper: “There are several good protections against temptations, but the surest is
cowardice.” As this axiom suggests, the key factor in fighting corruption in Greece is enforcement.,

58
REFERENCES Antonakas, N., Konstantopoulos, N. & Seimenis, I., 2014. Human Resource Management's Role
in the Public Sector and the Level of Corruption: The Case of the Greek Tax Administration.
Procedia—Social and Behavioral Sciences, Volume 148, pp. 455-462.
Antoniadis, I., Taousani, K. & Katarachia, A., 2017. Factors Affecting Consumers’ Usage of
Electronic Payments in Greece. s.l.: s.n., pp. 96-103.
Artavanis, N., Morse, A. & Tsoutsoura, M., 2015. Tax Evasion across Industries: Soft Credit
Evidence from Greece. s.l.: National Bureau of Economic Research.
Azariadis, C. & Ioannides, Y., 2015. Thinking About Corruption in Greece. Medford,
Massachusetts: Department of Economics, Tufts University.
Barbone, L., Bonch-Osmolovskiy, M. & Poniatowski, G., 2015. Study to Quantify and Analyse
the VAT Gap in the EU Member States: 2015 Report, Warsaw: Center for Social and Economic
Research.
BBC, 2011. Greek Government Austerity Measures. BBC News, 11 October.
Bergthaler, W., Garrido, J., Razafimahefa, I. & Kangur, A., 2017. Greece Selected Issues: IMF
Country Report No. 17/41, Washington D.C.: IMF.
Bitzenis, A., Schneider, F. & Vlachos, V., 2016. An Exploration of the Greek Shadow
Economy: Can Its Transfer into the Offical Economy Provide Economic Relief Amid the Crisis?
Journal of Economic Issues, March, Volume 50 Number 1, pp. 165-196.
Cambanis, T., 2014. Why Can’t Greece Shake its Corruption Problem? Boston Globe, 22
August.
Chene, M., 2014. The Impact of Corruption on Growth and Equality. s.l.: Transparency
International.
Chionis, D. & Chalkia, A., 2016. Illicit Tobacco Trade in Greece: The Rising Share of Illicit
Consumption During Crisis. Trends in Organized Crime, Volume 19, Numbers 3-4, pp. 236-
253.
Dahlstrom, C., 2012. Bureaucracy and the Different Cures for Grand and Perry Corruption.
s.l.: University of Gothenburg.
Danopoulos, C., 2014. The Cultural Roots of Corruption in Greece. Mediterranean Quarterly, 1
June, Volume 25, Number 2, pp. 105-130.
Dellas, H., Malliaropoulos, D., Papageorgiou, D., and Vourvachaki, E., 2017. Fiscal Policy with
an Informal Sector. Athens: Bank of Greece.
Dreher, A. & Herzfeld, T., 2005. The Economic Costs of Corruption: A Survey and New
Evidence. s.l.: s.n.

59
Duncan, N., 2006. The Non-Perception Based Measurement of Corruption: A Review of Issues
and Methods from a Policy Perspective. In: A. S. C. and C. C. Shacklock, eds. Measuring
Corruption. New York: Routledge, pp. 131-162.
Eble, S., Maliszeweski, W., Shamloo, M. & Petrova, I., 2013. Greece, Selected Issues, IMF
Country Report No. 13/155, Washington, DC: IMF.
Economides, G., Papageorgiou, D. & Philippopoulos, A., 2017. The Greek Great Depression: A
General Equilibrium Study of its Drivers. Athens: Bank of Greece.
Eleftheriadis, P., 2014, November/December. Misrule of the Few: How the Oligarchs Ruined
Greece. Foreign Affairs, Volume 93, Number 6, pp. 139-146.
EU Commission, 2014. Greek Annex to the EU Anti-Corruption Report for 2014. s.l.: EU
Commission.
Eurobarometer, n.d. Eurobarometer Several Years. Brussels: s.n.
Eurostat, 2017 [Online]
Available at:http://ec.europa.eu/eurostat/web/income-and-living-conditions/statistics-illustrated
Forelle, C., Minczeski, P. & Bentley, 2018. Greece’s Debt Due. Wall Street Journal, 18
January.
Galtung, F., 2006. Measuring the Immeasurable: Boundaries and Functions of (Macro)
Corruption Indices. In: A. S. C. and C. C. Shacklock, eds. Measuring Corruption. New York:
Routledge, pp. 101-130.
GCI, 2003-2017. The Global Competitiveness Report. [Online]
Available at: http://reports.weforum.org/global-competitiveness-index-2017-2018/#topic=data
Georgakopoulos, T., 2016, July. Polynomiyia and Kakonomia In Greece—A Survey. Dianeosis
Organization for Research & Analysis.
Georgakopoulos, T., 2016, June. Tax Evasion in Greece—A Study. s.l.: s.n.
Giannitsis, T. & Zografakis, S., 2015. Greece: Solidarity and Adjustment in Times of Crisis.
Athens: Macroeconomic Policy Institute of the Hans-Boeckler-Foundation.
Greenland, C., 2011. Corruption—The Real Cause Of The Greek Crisis. The Gleaner, 27
November.
Guillot, A., 2015. Greece struggles to address its tax evasion problem. The Guardian, 24
February.
Hall, P. A. &. G. D. W., 2009. Varieties of Capitalism and Institutional Complementarities in
Political Economy: An Empirical Analysis. British Journal of Political Science, Volume 39
Issue 3, pp. 449-482.

60
Hassan, M. & Schneider, F., 2016. Size and Development of the Shadow Economies of 157
Countries Worldwide: Updates and New Measures from 1999 to 2013. Bonn: Institute for the
Study of Labor (IZA).
Henry, F., 2017. A Greek Tragedy: How Much Can One Nation Take? The Financial Times, 19
January.
Heywood, P. & Rose, J., 2014. "Close but no Cigar": The Measurement of Corruption. Journal
of Public Policy, Volume 34, Issue 3, pp. 507-529.
Hondroyoannis, G. & Papaoikonomou, D., 2017. The Effect of Card Payments on VAT Revenue
in Greece. Athens: Bank of Greece.
ILO, 2016. Diagnostic Report on Undeclared Work in Greece, s.l.: International Labour
Organization.
Kaplanoglou, G. & Rapanos, V. T., 2012. Tax and Trust: The Fiscal Crisis in Greece. South
European Society and Politics, Volume 18, Number 3, pp. 283-304.
Katsios, S., 2006. The Shadow Economy and Corruption in Greece. South-Eastern Europe
Journal of Economics, Volume 1, pp. 61-80.
Knack, S. & Keefer, P., 1995. Institutions and Economic Performance: Cross-Country Tests
Using Alternative Institutional Measures. Economics and Politics, Volume 7, Number 3, pp.
207-227.
Labrianidis, L. & Pratsinakis,. M., 2016. Greece’s New Emigration at Times of Crisis. s.l.:
Hellenic Observatory Papers on Greece and Southeast Europe.
Lambsdorff, J., 1999. The Transparency International Corruption Index 1999—Framework
Document. s.l.: Transparency International.
Lambsdorff, J., 2006. Measuring Corruption—The Validity and Precision of Subjective
Indicators (CPI). In: A. S. C. and C. C. Shacklock, eds. Measuring Corruption. New York:
Routledge, pp. 81-100.
Litina, A. & Palivos, T., 2011. Explicating Corruption and Tax Evasion: Reflections on Greek
Tragedy. Thessaloniki: s.n.
Liu, Y. & Feng, H., 2015, January. Tax structure and Corruption: Cross-Country Evidence.
Public Choice, Volume162, Numbers 1-2, pp. 57-78.
Marks, S., 2018. Anti-Corruption Prosecutor fights for Greece’s Good Name. Politico, 3
January.
Matsaganis, M. & Flevotomou, M., 2010. Distributional Implications of Tax Evasion in Greece.
Athens: The Hellenic Observatory.
Mavridis, Symeon. 2018. Greece’s Economic and Social Transformation 2008–2017. Soc.
Sci. 7, No. 1: 9.

61
Miller, W. L., 2006. Perceptions, Experience and Lies: What Measures Corruption and What do
Corruption Measures Measure? In: A. S. C. and C. C. Shacklock, eds. Measuring Corruption.
New York: Routledge, pp. 163-187.
Mitrakos, P., Bitzenis, A., Kontakos, P. & Makedos, I., 2014. Tax Morale and Compliance in
Greece: A review of Empirical Evidence. Global Business & Economics Anthology, Volume 2,
pp. 197-204.
Myers, S., 2017. Pensions and Sovereign Default. s.l.: s.n.
Nektarios, M., Tinios, P. & Simeonidis, G., 2016. A Pension System for Uounger Workers in
Greece: A Proposal for Growth. [Online]
Available at: http://blogs.lse.ac.uk/greeceatlse/2017/01/13/a-pension-system-for-younger-
workers-in-greece-a-proposal-for-growth/.
Organisation for Economic Co-operation and Development (OECD). Several Years of Various
Data. [Online] Available at: https://data.oecd.org/greece.htm
Orem, T., 2016. How to Report a Tax Cheat and Get a Reward (It's Not Easy). USA Today, 1
May.
Palaiologos, Y., 2014. The 13th Labor of Hercules: Inside the Greek Crisis. Paperback ed.
London: Portobello Books.
Papaconstantinou, P., 2013. How Bureaucracy and Corruption Affect Economic Growth and
Convergence in the European Union: The Case of Greece. Managerial Finance, Volume 39,
Issue 9, pp. 837-847.
Paraskevopoulos, C. J., 2012. Corruption, Inequality and Trust: the Greek vicious circle from
incremental adjustment to “critical juncture”? Discussion Paper #13. Cambridge,
Massachusetts: Minda de Gunzburg Center for European Studies (CES), Harvard University.
Paraskevopoulos, C. J., 2017. Varieties of Capitalism, Quality of Government and Policy
Conditionality in Southern Europe: Greece and Portugal in Comparative Perspective. GreeSE
Papers, Voume 117. London: London School of Economics and Political Science.
Priftis, R. & Rousakis, M., 2017. Deposit Flight and Capital Controls: A Tale from Greece.
Department of Economics Discussion Paper 822. Oxford: University of Oxford.
PwC, 2016. World Tax Summaries Taxation-Greece, s.l.: Price Waterhouse Coopers.
Rohwer, A., 2009. Measuring Corruption: A Comparison between the Transparency
International's Corruption Perceptions Index and the World Bank's Worldwide Governance
Indicators. CESifo DICE Report, Volume 7, pp. 42-52. s.l.: s.n.
Schneider, F., 2015. Size and Development of the Shadow Economy of 31 European and 5 Other
OECD Countries from 2003 to 2015: Different Developments. s.l.: s.n.
Schneider, F. & Enste, D. H., 2000. Shadow Economies: Size, Causes, and Consequences.
Journal of Economic Literature, Volume 38, Number 1, pp. 77-114.

62
SGI, 2017. Sustainable Governance Indicators. [Online]
Available at: http://www.sgi-network.org/2017/.
Shacklock, A., Sampford, C. & Connors, C., 2006. Measuring Corruption. New York:
Routledge.
Sievert, S., Neubecker, N. & Klingholz, R., 2017. Europeʼs Demographic Future: Where the
Regions are Headed After a Decade of Crises, Berlin: Berlin Institute for Population and
Development.
Souliotis, K., Golna, C., Tountas, Y., Siskou, O., Kaitelidou, D. & Liaropoulos L., 2016, March.
Informal Payments in the Greek health Sector Amid the Financial Crisis: Old Habits Die Last.
The European Journal of Health Economics, Volume 17, Number 2, pp. 159-170.
Stiglitz, J. E., 2016. The Euro: How a Common Currency Threatens the Future of Europe. New
York: W. W. Norton and Company.
Tagkalakis, A., 2013. Audits and Tax Offenders: Recent Evidence from Greece. Athens: Bank of
Greece.
Tagkalakis, A., 2014. Tax Administration Reforms and the Fight Against Tax Evasion: Recent
Evidence from Greece. [Online]
Available at: http://voxeu.org/article/tax-evasion-and-reforms-greece.
TI, 1995-2017. Corruption Perception Index Reports 1995-2016. [Online]
Available at: https://www.transparency.org/research/cpi/overview.
TI, 2013. Bribes Payers Index. [Online]
Available at: https://www.transparency.org/research/bpi/overview
TI, 2013. Global Corruption Barometer 2013, s.l.: Transparency International.
TI, 2016. Corruption Perceptions Index 2016: Short Methodology Note. s.l.: Transparancy
International.
TI-G, 2012. National Integrity System Assessment Greece, s.l.: Transparency International -
Greece.
Tsalas, A. & Monokroussos, P., 2017. Tax Evasion, Tax Morale, and the Case for Growth. In:
D. Thomakos & N. Konstantinos, eds. Taxation in Crisis. Cham: Palgrave Macmillan Studies in
Banking and Financial Institutions. Basingstoke, United Kingdom: Palgrave Macmillan, pp.
205-233.
Tsoukalis, L., 2014. The Unhappy State of the Union: Europe Needs a New Grand Bargain.
London: Policy Network.
Tzogopoulos, G., 2015. Corruption and the Media Sector in Greece. Presentation at Offshore
Alert Conference, November 23, London, United Kingdom.
World Bank (World Governance Indicators- WBGI, several years)

63
Zacharakis, G., Antonopoulou, P., Travlos, A. & Kipreos, G., 2017. Corruption and Illegal
Payments in Greece. Journal of Public Management Research, Volume 3, Number 1, pp. 29-40.