university of groningen late-type spiral galaxies ganda, katia filelate-type spiral galaxies ganda,...
TRANSCRIPT

University of Groningen
Late-type spiral galaxiesGanda, Katia
IMPORTANT NOTE: You are advised to consult the publisher's version (publisher's PDF) if you wish to cite fromit. Please check the document version below.
Document VersionPublisher's PDF, also known as Version of record
Publication date:2007
Link to publication in University of Groningen/UMCG research database
Citation for published version (APA):Ganda, K. (2007). Late-type spiral galaxies: kinematics and stellar populations in their inner regions.Groningen: s.n.
CopyrightOther than for strictly personal use, it is not permitted to download or to forward/distribute the text or part of it without the consent of theauthor(s) and/or copyright holder(s), unless the work is under an open content license (like Creative Commons).
Take-down policyIf you believe that this document breaches copyright please contact us providing details, and we will remove access to the work immediatelyand investigate your claim.
Downloaded from the University of Groningen/UMCG research database (Pure): http://www.rug.nl/research/portal. For technical reasons thenumber of authors shown on this cover page is limited to 10 maximum.
Download date: 27-04-2019

3Absorption line-strengths of 18
late-type spiral galaxies observedwith SAURON
Katia Ganda, Reynier F. Peletier, Richard M. McDermid, Jesus Falcon-Barroso, P.T.de Zeeuw, Roland Bacon, Michele Cappellari, Roger L. Davies, Eric Emsellem, Davor
Krajnovic, Harald Kuntschner, Marc Sarzi, Glenn van de Ven
Based on MNRAS 2007, 380, 506
ABSTRACT — We present absorption line-strength maps for a sample of 18 Sb-Sdgalaxies observed using the integral-field spectrograph SAURON operating at the WilliamHerschel Telescope on La Palma, as part of a project devoted to the investigation of thekinematics and stellar populations of late-type spirals, a relatively unexplored field. TheSAURON spectral range allows the measurement of the Lick/IDS indices Hβ, Fe5015 andMgb, which can be used to estimate the stellar population parameters. We present here thetwo-dimensional line-strength maps for each galaxy. From the maps, we learn that late-type spiral galaxies tend to have high Hβ and low Fe5015 and Mgb values, and that theHβ index has often a positive gradient over the field, while the metal indices peak in thecentral region. We investigate the relations between the central line-strength indices andtheir correlations with morphological type and central velocity dispersion, and comparethe observed behaviour with that for ellipticals, lenticulars and early-type spirals from theSAURON survey. We find that our galaxies lie below the Mg − σ relation determinedfor elliptical galaxies and that the indices show a clear trend with morphological type.From the line-strength maps we calculate age, metallicity and abundance ratio maps viaa comparison with model predictions; we discuss the results from a one-SSP (SingleStellar Population) approach and from a two-SSP approach, considering the galaxy as asuperposition of an old (≈ 13 Gyr) and a younger (age ≤ 5 Gyr) population. We confirmthat late-type galaxies are generally younger and more metal poor than ellipticals andhave abundance ratios closer to solar values. We also explore a continuous star formationscenario, and try to recover the star formation history using the evolutionary models of

52 CHAPTER 3: LINE-STRENGTHS OF LATE-TYPE SPIRALS OBSERVED WITH SAURON
Bruzual & Charlot (2003), assuming constant or exponentially declining star formationrate (SFR). In this last case, fixing the galaxy age to 10 Gyr, we find a correlation betweenthe e-folding time-scale τ of the starburst and the central velocity dispersion, in the sensethat more massive galaxies tend to have shorter τ , suggesting that the star formationhappened long ago and has now basically ended, while for smaller objects with largervalues of τ it is still active now.
3.1 INTRODUCTIONOver the last few decades, stellar population synthesis has become one of the most popu-lar and powerful techniques to study the formation and evolution histories of galaxies toodistant to be resolved into individual stars. In particular, the measurement of absorption line-strengths combined with stellar population models has been used to investigate the luminosity-weighted age, metallicity and abundance ratios in integrated stellar populations. Extensivework has been carried out on stellar populations in early-type galaxies, mainly using long-slit spectra (see for example Carollo, Danziger, & Buson 1993, Davies, Sadler & Peletier1993, Fisher, Franx & Illingworth 1995, Fisher, Franx & Illingworth 1996, Longhetti et al.1998, Jørgensen 1999, Kuntschner 2000, Sanchez–Blazquez et al. 2007) and recently alsointegral-field spectroscopy (Kuntschner et al. 2006, hereafter Paper VI, McDermid et al.2006, hereafter Paper VIII). The main advantage brought by the integral-field observationsis that one can obtain two-dimensional maps and easily identify extended structures. In par-ticular, the two-dimensional coverage gives the possibility to straightforwardly connect thestellar populations with the kinematical structures and therefore represents a powerful tooltowards a comprehensive understanding of the structure of the galaxy.
Some literature is also available on absorption line-strengths in early-type spiral galaxies,mainly S0 and Sa galaxies; (see for example Jablonka, Martin & Arimoto 1996, Idiart, deFreitas Pacheco & Costa 1996, Proctor & Sansom 2002, Afanasiev & Sil’chenko 2005, andPeletier et al. 2007, hereafter Paper XI). In particular, Paper XI presents two-dimensionalabsorption line-strength maps of 24 spiral galaxies, mostly of type Sa, observed with theintegral-field spectrographSAURON (Bacon et al. 2001, hereafter Paper I); these reveal youngpopulations in Sa galaxies, possibly formed in mini-starbursts in structures such as nucleardiscs, circular star forming rings and bars. These mini-starbursts generate a large scatter inindex - index diagrams, larger than observed for elliptical galaxies. As a consequence, thereis a large range in luminosity-weighted ages. Different star formation modes -starbursts orquiescent- are also reflected in the wide range observed in the abundance ratios. All the galax-ies of Paper XI lie on or below the Mgb − σ relation for ellipticals determined by Jørgensen,Franx & Kjærgaard (1996). The authors argue that, if one considers that relation as valid forold galaxies, then the early-type spirals present a scatter in age, with the biggest scatter forthe smallest velocity dispersions.
Spiral galaxies towards the end of the Hubble sequence are, on the other hand, still poorly-studied objects, due to the difficulty of obtaining reliable measurements in these low-surfacebrightness objects, full of dust and star forming regions, whose spectra can be dramaticallycontaminated by emission-lines. In particular, the study of their stellar populations is ex-tremely complicated. An approach based on broad-band colours is basically invalidated bythe huge amount of dust, which is very difficult to take into account, especially when workingwith data from ground-based telescopes. A spectroscopic approach, relying for example onstellar absorption strength indices, has instead to deal with the almost ubiquitous presence of

INTRODUCTION 53
gas with consequent emission, which makes it necessary to accurately remove the emission-lines from the spectra before performing any population analysis. Only in the last decadeseveral HST-based imaging surveys have targeted these late-type galaxies. Particularly rel-evant are the papers by Carollo et al. (1997), Carollo & Stiavelli 1998, Carollo, Stiavelli &Mack 1998, Carollo (1999), Carollo et al. (2002), Boker et al. (2002), Laine et al. (2002),where the authors reveal the presence of a variety of structures in the inner regions, suchas bulges, nuclear star clusters, stellar discs, small bars, double bars and star forming ringswhose formation and evolutionary pattern are not properly understood yet. Carollo et al.(2007) also performed a population analysis on nine late-type spiral galaxies (types betweenSa and Sc) on the basis of HST ACS and NICMOS optical and near-infrared colours. Thehigh spatial resolution of their space-based data allowed them to mask dust features and mea-sure the properties of the stellar populations from the colours; this method, together with thehigh spatial resolution provided by HST, produced results that do not suffer much from theeffects of dust; only a smooth dust distribution would not be detected. From their analysis,they found a large range in the colour properties of bulges in late-type spirals, reflecting alarge range in their stellar population properties. From a comparison with population models,they concluded that in about half of their bulges the bulk of the stellar mass formed at earlyepochs (more than 50 percent of their mass was formed more than 9 Gyr ago), and that in theother half a non-negligible fraction of the stellar mass (up to 25 percent) was formed recently,in the last ≈ 3 Gyr.
Until now, only little spectroscopic counterpart for the quoted imaging was available,due to the mentioned observational difficulties. The published work (Matthews & Gallagher2002, Zaritsky, Kennicutt & Huchra 1994, Boker et al. 2001, Rossa et al. 2003, Walcher et al.2005) mainly refers to the emission-line properties, to the characteristics of the HII regionsor to the nature of the innermost component. In particular, no study has addressed yet ina systematic way the stellar populations of late-type spiral galaxies with a two-dimensionalcoverage. Existing studies on abundances concern topics such as elemental abundances in HIIregions and the distribution of oxygen within discs (Zaritsky at al. 1994), not properties in-ferred from the integrated stellar absorption spectrum. As for the absorption-lines properties,there is ongoing work by MacArthur, Gonzalez & Courteau (2007), who analyse long-slitspectra (Gemini - GMOS) of eight spiral galaxies of type between Sa and Scd on a wide spec-tral range, measuring many absorption indices out to 1-2 disc scale-lengths. Also, Moorthy& Holtzman (2006) presented line-strengths in the bulges and inner discs of 38 galaxies ofmorphological type between S0 and Sc for which they acquired long-slit spectra on a broadspectral range including Balmer lines, Mg and Fe features. They concluded that the centralregions of bulges span a wide range both in SSP metallicity and age, confirming the resultsof Carollo et al. (2007). They also found that luminosity-weighted metallicities and abun-dance ratios are sensitive to the value of the central velocity dispersion and of the maximumdisc rotational velocity, and that red bulges (defined as those with B−K > 4) of all types aresimilar to luminous ellipticals and obey the same scaling relations; for the blue bulges (B−K< 4) they observed instead some differences. They also addressed the radial variations ofthe population parameters; in most cases, they measured negative metallicity gradients withincreasing radius, in the bulge-dominated region; positive gradients in age were found onlyin barred galaxies.
As mentioned, there is still a lack of work on populations in late-type spirals on a full two-dimensional field: we therefore started a project on a sample of 18 late-type spiral galaxies,

54 CHAPTER 3: LINE-STRENGTHS OF LATE-TYPE SPIRALS OBSERVED WITH SAURON
with the purpose of investigating the nature of their inner regions, addressing the bulge anddisc formation and evolution, the interconnection between stellar and gaseous componentsand the star formation history. Given the high complexity in the inner regions of these ob-jects, integral-field spectroscopy has to be preferred with respect to long-slit, providing a fullpicture of the kinematics and populations on a two-dimensional field of view. We observedour 18 late-type spiral galaxies using SAURON, an integral-field spectrograph that was builtfor a representative census of ellipticals, lenticulars and early-type spiral galaxies, to whichin the rest of this chapter we will refer as ‘the SAURON survey’. Our project can be regardedas an extension of the SAURON survey towards later-type objects. First results based on ourdata are presented in the previous chapter (published as Ganda et al. 2006) and focus onthe stellar and gas kinematical maps. The main findings of Chapter 2 are that in many casesthe stellar kinematics suggests the presence of a cold inner region, as visible from a centraldrop in the velocity dispersion, detected in about one third of the sample; that the ionized gasis almost ubiquitous and often presents more irregularities in its kinematics than the stellarcomponent; and that the line ratio [OIII]/Hβ assumes often low values over most of the field,possible indication for wide-spread star formation, in contrast to early-type galaxies.
As a following step in our project, we subtracted the emission-lines from our SAURONspectra, measured as explained in Chapter 2, and on the emission-cleaned spectra derived ab-sorption line-strength indices in the Lick/IDS system (Faber et al. 1985, Gorgas et al. 1993,Worthey et al. 1994), which allows an easier comparison with existing data and with otherclasses of objects. Here we present and analyse the absorption line-strength maps. Thedata and maps presented in this chapter will be made available via the SAURON WEB pagehttp://www.strw.leidenuniv.nl/sauron/.
The chapter is structured as follows. Section 3.2 very briefly describes the sample selec-tion, observations and data reduction. Section 3.3 reviews the analysis methods. In Section3.4 we present the line-strength maps for our sample galaxies. In Section 3.5 we investigatethe correlations between different indices and between indices and other galactic parameters,such as the morphological type and the central velocity dispersion, mainly focusing on thecentral values. In Section 3.6 we present our estimates for the ages and metallicities, ob-tained by comparison of our observed line-strength indices with model predictions; we alsoexplore the star formation history and give estimates for the time-scale τ , in an exponentiallydeclining star formation rate scenario. Section 3.7 summarizes the main results. In Appendix3.A we deal with the radial variations of the indices and the stellar population parameters,presenting azimuthally averaged radial profiles. Appendix 3.B shortly describes the individ-ual galaxies and their peculiarities, giving a brief summary of relevant literature information.For more literature reviews on these objects, we suggest the reader to check Section 2.6.4 (inChapter 2).
3.2 SAMPLE SELECTION, OBSERVATIONS, DATA REDUCTIONThe galaxies were optically selected (BT < 12.5, according to the values given in de Vau-couleurs et al. 1991, hereafter RC3) with HST imaging available from WFPC2 and/or NIC-MOS. Their morphological type ranges between Sb and Sd, following the classification givenin NED (from the RC3). Galaxies in close interaction and Seyferts were discarded. The re-sulting sample contains 18 nearby galaxies, whose main properties are listed and illustratedrespectively in Table 2.1 and Fig. 2.1 (in the previous chapter) . The NGC numbers and

ANALYSIS AND METHODS 55
some characteristics are reported also in the tables in the present chapter. Observations of the18 sample galaxies were carried out during 6 nights in January 2004, using the integral-fieldspectrograph SAURON attached to the 4.2-m WHT.
For an exhaustive description of the instrument and its technical characteristics, and fordetails about the exposures see Paper I and Chapter 2.
Data reduction was carried out using the dedicated software XSAURON developed atCRAL. For details on the data reduction we refer again the reader to Paper I and Chapter2 in this Thesis (or the paper by Ganda et al. 2006). For an explanation of the spectropho-tometric calibration we recommend the reader to study Paper VI, in particular its Section3.1.
3.3 ANALYSIS AND METHODS
The fully reduced and calibrated spectra were first spatially binned using a Voronoi tessella-tion (Cappellari & Copin 2003) in order to reach a minimum signal-to-noise ratio of ≈ 60per spectral resolution element per bin. The kinematics of stars and gas were then extractedfrom the binned spectra via the pixel fitting methods extensively described in Cappellari &Emsellem (2004), Emsellem et al. (2004, hereafter Paper III), and Sarzi et al. (2006, here-after Paper V), that we already applied to calculate the kinematical maps shown in Chapter2. The spectra were fitted using the SSP models from Vazdekis (1999). We selected a libraryof 48 models evenly sampling a wide range in both age and metallicity (0.50 ≤ Age ≤ 17.78Gyr, −1.68 ≤ [Fe/H] ≤ +0.20). We used this SSP library and additional Gaussian templatesreproducing the emission-lines to fit the observed spectra, separating the emission-lines fromthe underlying absorption-line spectrum (see Paper V for details on the procedure). We no-tice that for our objects this separation is crucial if we want to measure absorption strengths,since in spiral galaxies the gas is almost ubiquitous and emission in several cases dominatesthe spectrum, filling in completely the absorption features, as shown for example in the casesof some central aperture spectra in the top row of Fig. 3.1 (black lines, with reference tothe colour version in the Colour Appendix); in the same figure we overplot the best-fit to thespectra obtained with our method (red lines) and the emission-removed spectra (blue lines),illustrating the reliability of the applied gas-cleaning procedure. The bottom row of Fig. 3.1presents similar plots for bins located ≈ 10′′ from the galaxy’s centre, showing that our fitsand emission correction are reliable also outside the central region, given the fact that a min-imum signal-to-noise of 60 is guaranteed by the spatial binning. The reader can find moreexamples of this in Fig. 1 in Paper V, Fig. 2.3 (in Chapter 2), and Fig. 3 in Falcon-Barrosoet al. (2006), hereafter Paper VII.
We also notice that in two cases (namely, NGC 2964 and NGC 4102) we detected regionsof activity (see Chapter 2 for a detailed description), where the spectra are characterised bydouble-peaked emission-lines due to the presence of multiple velocity components in the gas,because of the presence of a jet. In those regions our method of fitting the lines with singleGaussians fails to reproduce accurately the line profile, but since this is limited to only a fewspectra, we did not modify the method. In any case, this does not have any impact on ourfollowing analysis, since the double-peaked emission-lines do not contaminate the spectradefining the central aperture (see Section 3.5) on which most of this study is focused.

56 CHAPTER 3: LINE-STRENGTHS OF LATE-TYPE SPIRALS OBSERVED WITH SAURON
NGC1042 −− centre
4900 5000 5100 5200λ (Å)
0.6
0.7
0.8
0.9
1.0flu
x (1
0−16 e
rg c
m−2
s−1)
NGC2964 −− centre
4900 5000 5100 5200λ (Å)
2.0
2.2
2.4
2.6
2.8
3.0NGC4487 −− centre
4900 5000 5100 5200λ (Å)
0.6
0.7
0.8
0.9
1.0
NGC1042 −− out
4900 5000 5100 5200λ (Å)
0.065
0.070
0.075
0.080
0.085
0.090
flux
(10−1
6 erg
cm
−2 s−1
)
NGC2964 −− out
4900 5000 5100 5200λ (Å)
0.22
0.24
0.26
0.28
0.30NGC4487 −− out
4900 5000 5100 5200λ (Å)
0.15
0.20
0.25
0.30
Figure 3.1: (Colour version in Colour Appendix). Top row: central aperture spectra of some rep-resentative galaxies in our sample: from left to right, we plot NGC 1042, 2964 and 4487. Along thevertical axis, the flux is in units of 10−16 erg cm−2 s−1. The black lines -hardly distinguishable fromthe other ones- represent the observed spectra; the red ones the best-fit and the blue ones the spectra af-ter emission removal. Bottom row: as in the top row, but for bins located ≈ 10′′ away from the galaxy’scentre.
3.3.1 Line-strengths measurement and Fe5015 correction
On the emission-removed spectra we calculated line-strength indices on the Lick/IDS sys-tem. For details on the actual computation of the line-strengths, we refer to Paper VI. Thecalibration to the Lick/IDS system takes into account several effects: the difference in spec-tral resolution between the Lick/IDS system and the SAURON instrumental setup, the internalvelocity broadening of the observed galaxies and small systematic offsets rising from differ-ences in the shape of the continuum, due to the fact that the original Lick/IDS spectra havenot been flux calibrated. In our observing run, we obtained spectra for 21 different stars incommon with the Lick/IDS stellar library (Worthey et al. 1994), for a total of 39 repeated ob-servations. Fig. 3.2 shows the difference between the Lick/IDS measurements and ours (forstars with repeated observations, we considered the average of the different values available).We calculated the mean offsets to the Lick/IDS system and their dispersion using bi-squareweighting in order to minimize the influence of the outliers, after removing from the sampletwo stars of spectral type M6III and M7III, whose measured metal indices differ more than 2A from the Lick measurements. The adopted offsets that we applied to all our measurementsare: −0.06 A (± 0.06 A) for Hβ, +0.32 A (± 0.15 A) for Fe5015 and +0.15 A (± 0.05 A)for Mgb.

ANALYSIS AND METHODS 57
0 2 4 6 8 10Lick Hβ (Å)
−1.0
−0.5
0.0
0.5
1.0LI
CK −
SA
URO
N (
Å)
−10 0 10 20 30 40Lick Fe5015 (Å)
−1
0
1
2
3
4
5
LICK
− S
AU
RON
(Å
)
0 5 10 15 20Lick Mgb (Å)
−1
0
1
2
3
4
5
LICK
− S
AU
RON
(Å
)
Figure 3.2: Differences between the Lick/IDS and our measurements for the 21 stars in common, forthe three indices. For two stars (HD18191 and HD114961, spectral type respectively M6III and M7III)our measurements of the metal indices differ dramatically from the Lick/IDS measurements; thereforewe excluded them from the determination of the offsets and plotted them with a different symbol (opentriangles). The overplotted dotted line shows the adopted offset, derived by a bi-weight estimator. Inthe bottom right corner we place a typical errorbar.
From a visual inspection of our maps of the Fe5015 index, we saw that our measure-ments tend to assume high values in the outer parts, especially in the bottom-right corner,revealing a systematic effect that makes the maps look asymmetric. The most striking man-ifestation of the problem is this ‘high-iron corner’, but there could be as well regions wherethe index is too low. A detailed inspection of the spectra showed that the cause is a wrongshape of the continuum in the Fe5015 spectral region, as proved by the fact that we are unableto fit our twilight spectra using our SSP template library: the Fe5015 region is not matchedby the templates, and the Fe5015 map calculated on the twilight spectra is not flat over thefield, showing a range of about 1.6 A from minimum to maximum value. This continuumproblem could be due to instrumental instabilities, to the high sensitivity of the grism to theincidence angle of the light, to the imperfect extraction of the spectra, to the misalignment ofthe spectra with respect to the columns of the CCD (see Chapter 2). We can exclude, instead,relations with problems in the gas removal, since the Fe5015 measurement is affected also inthe twilight frame, where the spectra are gas-free. In addition to this, continuum problemsshould not influence the gas-cleaning procedure: in the fitting, a polynomial is included inorder to account for differences in the flux calibration between the observed spectra and themodel ones.
Unfortunately, we could not take this effect into account properly at the data reductionstage, and decided to apply a correction to the affected spectra before measuring the Fe5015index. A problem related to the shape of the continuum was experienced also for the early-type spirals of the SAURON survey and affected the Hβ measurements, due to the closenessof the spectral feature to the edge of the spectral range; despite the fact that the problem isdifferent, we worked out a correction similar to the one that was there applied in the case ofHβ and described in Paper VI (Section 3.1.2 in that paper).
For each galaxy, we averaged the spectra within an aperture of 10′′ radius, obtaining a‘global spectrum’ for that galaxy. We then fitted this global spectrum using a linear combi-nation of SSP templates, masking the spectral regions possibly affected by emission-lines.

58 CHAPTER 3: LINE-STRENGTHS OF LATE-TYPE SPIRALS OBSERVED WITH SAURON
In this way we obtained for each galaxy a ‘global optimal template’ that approximates verywell the general spectral features of that galaxy. Then we considered the two-dimensionalgalaxy’s datacube, spatially binned and cleaned from emission as explained in the previoussections; for each bin, we fitted the cleaned spectrum using the ‘global optimal template’together with an 11-th order multiplicative polynomial, over the whole spectral range. Thefit determined the best-fitting polynomial continuum, from which we then removed the linearcomponent (which does not change the line indices); we considered the residuals and calcu-lated their RMS variation over the wavelength range of Fe5015. For bins covering four ormore single-lens spectra and with an RMS greater than 0.01, we used the fitted polynomial asa correction to the spectral shape by dividing it through the emission-cleaned spectrum. Forthese bins, we finally measured the Fe5015 index on the corrected spectrum.
This correction depends critically on the assumption that the optimal template is an accu-rate representation of the true galaxy spectrum. Whilst this is generally true, in the central,sometimes bulge-dominated, regions of our galaxies, non-solar abundance ratios can createa fit residual similar in size to the systematic effect we wish to remove. By correcting onlybins containing four or more lenses, we avoid these central parts, since the data there areunbinned. Correcting large bins is also important because of their larger contribution to thespatial appearance of the maps.
We verified the Fe5015 correction using exposures of the twilight sky. As we mentionedabove, in the twilight maps of Fe5015, a spatial gradient was also visible, as is apparent inthe galaxy data. In the uncorrected twilight, the field centre gave values of Fe5015 close to≈ 4 A, consistent with a typical G2V - G4V sun-like spectrum, showing that the field centreis not significantly affected by the problem. After applying our correction technique∗, thegradient was reduced, and the global level remained around 4 A. We show this in Fig. 3.3(find a colour version of it in Colour Appendix), where we display the Fe5015 map calcu-lated on the twilight frame, before and after applying the correction. Similarly, in Fig. 3.4(find a colour version in Colour Appendix) we show the Fe5015 map for NGC 488 beforeand after correction. White asterisks mark the centroids of the bins that have been corrected.The correction clearly removes most of the asymmetry, proving the usefulness of the methodapplied.
Figure 3.5 presents for each galaxy the map of the RMS deviations of the fitted con-tinuum after removal of a linear slope. We plot in black the bins that do not meet the re-quirements for the correction, for which we have artificially put the RMS to 0 (for plottingpurposes only); in these bins the Fe5015 index is calculated on the original emission-cleanedspectra. The maps are oriented with the horizontal and vertical axis aligned, respectively, tothe long- and to the short- axis of the SAURON field. The extension of the corrected areais mainly related to the signal-to-noise of the data: galaxies with poor signal-to-noise willrequire higher binning and the big bins will undergo the correction.
As for the uncertainties on the measured indices, the most worrying factor is the sepa-ration of emission- and absorption-lines. Simulations presented in Appendix A of Paper Vshow that the accuracy in recovering the emission-line fluxes does not depend on the A/Nratio between the line amplitude and the noise level in the stellar continuum, but only on thesignal-to-noise level in the stellar continuum itself. These simulations were meant to investi-gate the accuracy of emission-line fluxes measurements for ellipticals and lenticulars. In the
∗Applied in this case to all single-lens spectra with an RMS greater than 0.01: given the high signal-to-noise ofthe twilight frame, no spatial binning is necessary.

ANALYSIS AND METHODS 59
Fe 5015 (Å)
3.46
/ 5.
01
Fe 5015 corrected (Å)
3.46
/ 5.
01
Figure 3.3: (Colour version in Colour Appendix). Maps of the Fe5015 index for the twilight frame,before and after correction, in A. The two maps are plotted with the same cuts, indicated on their side,together with the colour bar. In the corrected frame, the spatial gradient is largely removed.
NGC488 Fe5015 (Å)
−20 −10 0 10 20arcsec
−10
0
10
arcs
ec
4.50
/ 6.
46
NGC488 Fe5015 corrected (Å)
−20 −10 0 10 20arcsec
4.50
/ 6.
46
Figure 3.4: (Colour version in Colour Appendix). Maps of the Fe5015 index for NGC 488, beforeand after correction, in A. The white asterisks in the right-hand map mark the position of the centroidsof the bins to which we have applied the correction. Overplotted on the maps are the isophotal contours.The two maps are plotted with the same cuts, indicated on their side, together with the colour bar; theyare oriented with the horizontal and vertical axis aligned, respectively, to the long- and to the short- axisof the SAURON field.

60 CHAPTER 3: LINE-STRENGTHS OF LATE-TYPE SPIRALS OBSERVED WITH SAURON
NGC488
-10
0
10
arcs
ec
0.00
/ 0.
02
NGC628
0.00
/ 0.
02
NGC772
0.00
/ 0.
02
NGC864
-10
0
10
arcs
ec
0.00
/ 0.
02NGC1042
0.00
/ 0.
02
NGC2805
0.00
/ 0.
03
NGC2964
-10
0
10
arcs
ec
0.00
/ 0.
02
NGC3346
0.00
/ 0.
02
NGC3423
0.00
/ 0.
02
NGC3949
-10
0
10
arcs
ec
0.00
/ 0.
02
NGC4030
0.00
/ 0.
01
NGC4102
0.00
/ 0.
02
NGC4254
-10
0
10
arcs
ec
0.00
/ 0.
02
NGC4487
0.00
/ 0.
02
NGC4775
0.00
/ 0.
02
NGC5585
-20 -10 0 10 20arcsec
-10
0
10
arcs
ec
0.00
/ 0.
02
NGC5668
-20 -10 0 10 20arcsec
0.00
/ 0.
02
NGC5678
-10 0 10 20arcsec
0.00
/ 0.
02
Figure 3.5: Galaxy by galaxy maps of the RMS deviations of the fitted polynomial continuum afterremoval of a linear slope, in the correction procedure for the continuum problem affecting the Fe5015measurement; in the bins in the black areas the correction will not be applied. All the maps are plottedwith the same spatial scale and oriented with the horizontal and vertical axis aligned, respectively, tothe long- and to the short- axis of the SAURON field.

LINE-STRENGTH MAPS OF 18 LATE-TYPE GALAXIES 61
case of signal-to-noise = 60, the typical uncertainties in the line fluxes obtained in AppendixA of Paper V translate in errors in the equivalent width of the emission-line of ≈ 0.08 A, andin similar errors in the absorption-line indices. Paper XI presents absorption line-strengths forearly-type spirals observed with SAURON; in some of the galaxies studied there, the emissionlines are stronger by a factor up to 100, relative to the absorption-lines, than in the ellipti-cals or lenticulars of Paper V with the strongest emission-lines. Therefore, for the objectsin Paper XI the situation is much closer to what happens in our spirals. There, the authorsreport results of similar simulations of the reliability of the gas cleaning, exploring a rangein A/N ranging up to 100. The results are such that the errors in the absorption-line indicesdo not vary appreciably with increasing A/N. When coming to the data, one has to considerthat the spectra are packed close together, so that the absorption-lines are affected by neigh-bouring spectra; despite the reduction tries to minimize this contamination, there might besome residual effects, particularly in presence of strong emission-lines. Additional errors canderive from template mismatch in the fitting procedure and from the continuum correctiondescribed above. Therefore, throughout the rest of this chapter we adopt a conservative valueof 0.2 A for the uncertainties in Hβ and Mgb and 0.3 A in Fe5015. The same figures wereused in Paper XI.
3.4 LINE-STRENGTH MAPS OF 18 LATE-TYPE GALAXIES
Figures 3.6a-3.6i (Fig.3.6a below; a colour version of it and of all Figs. 3.6b-3.6i can befound in the Colour Appendix) present the absorption line-strength maps of the 18 galax-ies, ordered by increasing NGC number. For each galaxy, in the first row we show the totalintensity obtained by integrating the full SAURON spectra in the wavelength direction, thegalaxy NGC number (and the UGC also, when available), and the two-dimensional map ofthe characteristic time-scale of star formation τ , in Gyr (see Section 3.6.3). Overplotted inpink (with reference to the colour version of the maps) on the intensity map are the contoursdelimiting the outer limits of the so-called ‘bulge’ and ‘disc regions’, defined in Section 3.5.In the second row we present the two-dimensional maps of Hβ, Fe5015 and Mgb, where themeasured indices have been calibrated to the Lick/IDS system and are expressed in equivalentwidths and measured in A. The maps of Fe5015 have been corrected as explained in Section3.3.1; the corrected bins are marked with a white dot. In the third row, we present the mapsof age (expressed in units of decimal logarithm and measured in Gyr), metallicity (in unitsof decimal logarithm, with the solar metallicity as zero point) and abundance ratios obtainedwith the one-SSP approach (see Section 3.6.1). Overplotted on each map are the isophotalcontours. The maps are all plotted with the same spatial scale, and oriented with the horizon-tal and vertical axis aligned, respectively, to the long- and to the short- axis of the SAURONfield for presentation purposes; the orientation is the same as in the maps in Chapter 2 and asin Figs. 3.4 and 3.5 in this chapter. The relative directions of North and East are indicated bythe arrow above the galaxy’s name. The maximum and minimum of the plotting ranges andthe colour table are given in the tab attached to each map. To make the comparison amongdifferent objects more immediate, we adopted the same plotting ranges for all of the galaxies,but in Appendix 3.B we will enlighten the spatial structures within the single maps, whennoticeable, on the basis of an inspection of the maps plotted on a ‘galaxy-by-galaxy range’.

62 CHAPTER 3: LINE-STRENGTHS OF LATE-TYPE SPIRALS OBSERVED WITH SAURON
-10
0
10
arcs
ec
V-band Flux
NGC488[UGC907]
τ
0.50
/15.
00
-10
0
10
arcs
ec
Hβ
1.00
/4.0
0
Mg b
0.50
/5.0
0
Fe 5015
2.00
/6.5
0
-20 -10 0 10 20arcsec
-10
0
10
arcs
ec
Log(age)
-1.0
0 /1
.12
-20 -10 0 10 20arcsec
Z
-1.3
0 /0
.60
-20 -10 0 10 20arcsec
[Mg/Fe]
-0.2
0 /0
.20
-10
0
10
20
arcs
ec
V-band Flux
NGC628[UGC1149]
τ
0.50
/15.
00-10
0
10
20
arcs
ec
Hβ
1.00
/4.0
0
Mg b
0.50
/5.0
0
Fe 5015
2.00
/6.5
0
-20 -10 0 10 20arcsec
-10
0
10
20
arcs
ec
Log(age)
-1.0
0 /1
.12
-20 -10 0 10 20arcsec
Z
-1.3
0 /0
.60
-20 -10 0 10 20arcsec
[Mg/Fe]-0
.20
/0.2
0
Figure 3.6a: (Colour version in Colour Appendix). Maps for NGC 488 and NGC 628. For each galaxy: firstrow: reconstructed image; NGC and UGC numbers and time-scale τ for star formation in Gyr; second row: maps ofHβ, Fe5015 and Mgb equivalent widths, in A; the white dots on the Fe5015 map mark the bins where the correctiondescribed in Section 3.3.1 has been applied; third row: age (in units of decimal logarithm and measured in Gyr),metallicity and [Mg/Fe] abundance ratio from the one-SSP analysis. For a description of the methods, see Section3.6. Overplotted on each map are the isophotal contours. On the intensity map also the contours defining the outerlimits of the so-called ‘bulge’ and ‘disc’ regions (see Section 3.5) are overplotted, in pink. All the maps are presentedwith the same spatial scale; the arrow above the galaxy’s name gives the direction of North and East. The plottingranges are indicated together with the colour bar at the right side of each map.
CORRELATIONS BETWEEN INDICES AND OTHER PARAMETERS 63
3.5 CORRELATIONS BETWEEN LINE-STRENGTH INDICES ANDOTHER GALACTIC PARAMETERS
In this section we analyse the dependence between the line-strength indices and other galacticparameters; we mainly focus on central properties. For each galaxy we defined three regions:the central circular aperture of 1.′′5 radius (corresponding to the innermost nine single-lensspectra); a so-called ‘bulge region’, defined as the region within which the light due to thefitted exponential disc falls below 50 percent of the total light, with the exclusion of the cen-tral aperture; and a so-called ‘disc region’, a 3′′-thick elliptical annulus external to the ‘bulgeregion’†. We averaged the spectra in these regions before spatial binning, and on the resultingspectrum calculated the line-strength indices, after emission removal‡. The actual numbersfor the definition of the bulge and disc regions (semi-major axis of the ellipses, position anglesand ellipticities) were taken from our own photometric analysis and bulge-disc decomposi-tion based on archival NIR images that will be presented in Chapter 4. There we model thegalaxies as an exponential disc and a Sersic (1968) bulge (which often turns out to be verytiny, with effective radius smaller than ≈ 5′′), obtaining an estimate of the bulge extension(cfr. Noordermeer 2006 for the method and Chapter 4 for the actual analysis of the profiles).For clarity, in the top left map in Figs. 3.6a-3.6i we overplot in pink the elliptical contoursdefining the outer limits of the ‘bulge region’ and of the ‘disc region’. In any case, we wantto warn the reader that the ‘bulge’ and ‘disc’ regions here introduced are mainly a tool forus to investigate radial variations, and do not refer to distinct components, since the so-called‘bulge’ is affected by a huge contamination from the disc, and an accurate decomposition isbeyond the scopes of the present chapter, and will be addressed in detail in Chapter 4.
In Table 3.1 we list the morphological type (from the RC3) and the stellar velocity dis-persion, with its associated error, measured on the central aperture spectra, since we willmake use of these quantities in the following sections and figures; the errors on the velocitydispersion are based on the scatter of the velocity dispersion values that we measure for thesingle-lens spectra within the central aperture, and do not take into account template mis-match. Table 3.2 lists the index values calculated, galaxy by galaxy, on the central apertureand on the bulge and disc regions.
3.5.1 Index - index relationsIn order to derive zero-order estimates on the luminosity weighted ages and metallicities ofour galaxies, we show in Fig. 3.7 an age/metallicity diagnostic diagram. Here we use theabundance ratio insensitive index
[MgFe50] =0.69× Mgb + Fe5015
2(3.1)
(for details on the index definition see Kuntschner et al., in preparation) as metallicity indi-cator and Hβ as age indicator. In Fig. 3.7 we plot the indices calculated on the central 1.′′5
†The inner semi-major axis of the ‘disc region’ corresponds to the outer semi-major axis of the ‘bulge region’plus 2′′. A slightly different definition of the disc region has been adopted in the case of NGC 628, in order to avoidcontamination from a foreground star situated ≈ 13′′ south of the centre.
‡For the aperture measurements, we never applied the continuum correction to the Fe5015 index described inSection 3.3.1: in several cases, even the disc region is affected only partially by the correction; in addition to this,the bulge and disc region measurements are obtained averaging spectra from spatially separated areas, which helpsin minimizing the impact of the continuum problem in the Fe5015 spectral region.

64 CHAPTER 3: LINE-STRENGTHS OF LATE-TYPE SPIRALS OBSERVED WITH SAURON
NGC Type T σ ±∆σ488 SA(r)b 3.0 197 4628 SA(s)c 5.0 52 6772 SA(s)b 3.0 120 4864 SAB(rs)c 5.0 65 20
1042 SAB(rs)cd 6.0 55 132805 SAB(rs)d 7.0 46 182964 SAB(r)bc 4.0 102 113346 SB(rs)cd 6.0 48 233423 SA(s)cd 6.0 48 203949 SA(s)bc 4.0 60 104030 SA(s)bc 4.0 100 24102 SAB(s)b? 3.0 153 84254 SA(s)c 5.0 72 134487 SAB(rs)cd 6.0 51 214775 SA(s)d 7.0 41 215585 SAB(s)d 7.0 37 235668 SA(s)d 7.0 52 225678 SAB(rs)b 3.0 102 9
Table 3.1: Hubble type (RC3 through NED); numerical morphological type (from RC3, indicated as‘T-type’ in some of the following pictures); stellar velocity dispersion (in km s−1) and its associatederror, also in km s−1, measured on the central aperture spectrum, for all galaxies.
NGC Hβcen Hβbul Hβdisc Fe5015cen Fe5015buL Fe5015disc Mgbcen MgbbuL Mgbdisc
488 1.961 1.966 1.961 6.122 5.635 5.615 4.387 4.112 4.042628 2.713 2.604 2.486 5.247 4.556 3.936 2.561 2.424 2.274772 2.316 2.355 2.765 5.495 4.746 4.506 3.285 3.028 2.558864 2.167 2.380 2.404 2.697 3.115 3.686 1.564 1.859 2.378
1042 3.327 2.533 2.172 4.570 4.046 3.767 2.200 2.498 2.3562805 3.324 2.878 3.013 3.975 3.400 3.303 2.343 2.121 2.0582964 3.033 2.957 2.808 3.313 3.476 4.025 1.736 2.049 2.2643346 3.488 3.289 2.838 3.732 3.643 3.915 1.939 2.002 2.2473423 2.846 2.935 3.299 4.334 3.528 3.092 2.137 1.869 1.6923949 3.944 3.846 3.726 3.760 3.623 3.175 1.744 1.772 1.5054030 2.769 3.086 3.343 5.287 4.512 3.886 2.996 2.524 2.1444102 3.283 3.257 3.173 4.083 3.950 3.736 1.904 2.143 2.1214254 2.676 2.955 3.177 4.121 3.954 3.699 2.470 2.149 1.8644487 3.167 3.452 3.275 2.410 2.692 3.175 1.319 1.487 1.6664775 3.560 3.482 3.465 3.071 2.980 2.376 1.609 1.564 1.4125585 3.816 3.490 3.236 2.643 2.453 2.354 1.198 1.201 1.3515668 3.661 3.584 3.825 3.756 3.037 2.546 1.717 1.464 1.2655678 3.015 2.617 2.881 4.566 4.328 4.112 2.367 2.484 2.380
Table 3.2: Line-strength indices calculated on the central apertures and bulge and disc regions, definedas explained in Section 3.5 for the 18 galaxies. The indices are intended as equivalent widths andexpressed in A.

CORRELATIONS BETWEEN INDICES AND OTHER PARAMETERS 65
0 1 2 3 4 5 6[MgFe50] (Å)
0
1
2
3
4
5
6
Hβ
(Å)
0.6
0.8
1
35
71012
15
−2.25
−1.35
−0.330.00
0.35
Figure 3.7: Hβ index against [MgFe50] (in A), for three samples of galaxies observed with SAURON:the filled circles represent the central apertures of our late-type spirals, the asterisks are the E and S0(central aperture of 1.′′335 radius) and the open triangles the Sa galaxies (central aperture). The solidlines represent SSP models from Thomas et al. (2003), limited to models with solar abundance ratios;ages of the models vary from 0.6 to 15 Gyr (top to bottom); metallicity (in decimal logarithm) from−2.25 to +0.35 (left to right). Representative error bars are added at the bottom right corner of thepanel; the larger one on the right refers to both the early- and late-type spirals samples, while the leftone, smaller, refers to the E/S0 galaxies.
aperture of our galaxies (filled circles). We overplot with asterisks the elliptical and lenticulargalaxies from the SAURON survey (based on the data presented in Paper VI), with referenceto measurements within apertures of radius 1.′′335, that the authors of that paper extractedin order to match the Lick aperture (see Paper VI for details); the open triangles representcentral apertures of 1.′′2 radius for the early-type spirals from the same survey (Paper XI).Overplotted in the figure are also the models of Thomas, Maraston & Bender (2003), limitedto the models with [Mg/Fe]=0; they are labelled with the corresponding age and metallicity.As noted in Paper XI, there is a smooth transition between the ellipticals/lenticulars and theearly-type spirals, with most E/S0 populating the region of the old, metal-rich models, and theSa spanning a larger range in age and reaching lower metallicities. Our 18 later-type spiralsoccupy a region of the diagram that has little intersection with the E/S0s, having generallyyounger ages and being clearly more metal poor. We also notice that the parameter region
66 CHAPTER 3: LINE-STRENGTHS OF LATE-TYPE SPIRALS OBSERVED WITH SAURON
centre
0 1 2 3 4 5Mgb (Å)
0
1
2
3
4
5
6
7Fe
5015
(Å
)"bulge"
0 1 2 3 4 5Mgb (Å)
"disc"
0 1 2 3 4 5Mgb (Å)
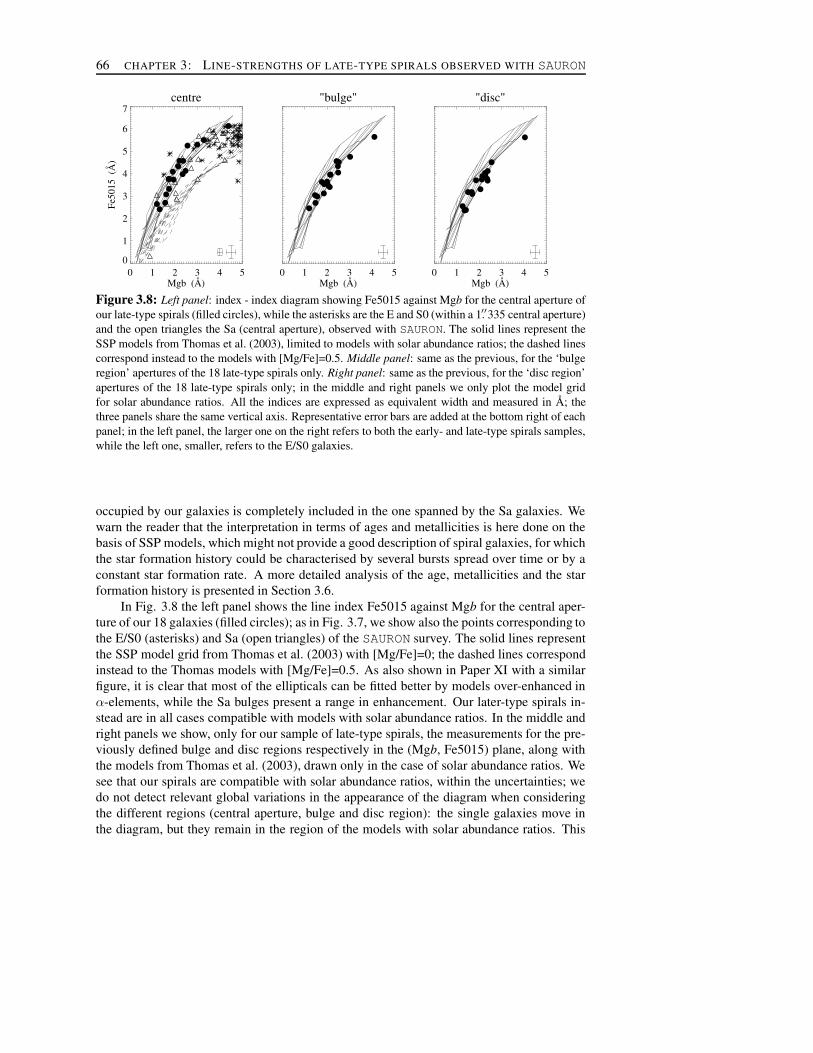
Figure 3.8: Left panel: index - index diagram showing Fe5015 against Mgb for the central aperture ofour late-type spirals (filled circles), while the asterisks are the E and S0 (within a 1.′′335 central aperture)and the open triangles the Sa (central aperture), observed with SAURON. The solid lines represent theSSP models from Thomas et al. (2003), limited to models with solar abundance ratios; the dashed linescorrespond instead to the models with [Mg/Fe]=0.5. Middle panel: same as the previous, for the ‘bulgeregion’ apertures of the 18 late-type spirals only. Right panel: same as the previous, for the ‘disc region’apertures of the 18 late-type spirals only; in the middle and right panels we only plot the model gridfor solar abundance ratios. All the indices are expressed as equivalent width and measured in A; thethree panels share the same vertical axis. Representative error bars are added at the bottom right of eachpanel; in the left panel, the larger one on the right refers to both the early- and late-type spirals samples,while the left one, smaller, refers to the E/S0 galaxies.
occupied by our galaxies is completely included in the one spanned by the Sa galaxies. Wewarn the reader that the interpretation in terms of ages and metallicities is here done on thebasis of SSP models, which might not provide a good description of spiral galaxies, for whichthe star formation history could be characterised by several bursts spread over time or by aconstant star formation rate. A more detailed analysis of the age, metallicities and the starformation history is presented in Section 3.6.
In Fig. 3.8 the left panel shows the line index Fe5015 against Mgb for the central aper-ture of our 18 galaxies (filled circles); as in Fig. 3.7, we show also the points corresponding tothe E/S0 (asterisks) and Sa (open triangles) of the SAURON survey. The solid lines representthe SSP model grid from Thomas et al. (2003) with [Mg/Fe]=0; the dashed lines correspondinstead to the Thomas models with [Mg/Fe]=0.5. As also shown in Paper XI with a similarfigure, it is clear that most of the ellipticals can be fitted better by models over-enhanced inα-elements, while the Sa bulges present a range in enhancement. Our later-type spirals in-stead are in all cases compatible with models with solar abundance ratios. In the middle andright panels we show, only for our sample of late-type spirals, the measurements for the pre-viously defined bulge and disc regions respectively in the (Mgb, Fe5015) plane, along withthe models from Thomas et al. (2003), drawn only in the case of solar abundance ratios. Wesee that our spirals are compatible with solar abundance ratios, within the uncertainties; wedo not detect relevant global variations in the appearance of the diagram when consideringthe different regions (central aperture, bulge and disc region): the single galaxies move inthe diagram, but they remain in the region of the models with solar abundance ratios. This

CORRELATIONS BETWEEN INDICES AND OTHER PARAMETERS 67
−6 −4 −2 0 2 4 6 8T−type
0
1
2
3
4
5H
β (Å
)
−6 −4 −2 0 2 4 6 8T−type
01
2
3
4
5
67
Fe50
15 (
Å)
−6 −4 −2 0 2 4 6 8T−type
0
1
2
3
4
5
6
Mgb
(Å
)
Figure 3.9: Line-strength indices (in A) as function of morphological type. Filled circles are oursample galaxies (central aperture), asterisks are the E and S0 (central 1.′′335 aperture) and open trianglesthe Sa galaxies (central aperture) of the SAURON survey. The left panel refers to Hβ, the middle oneto Fe5015 and the right one to Mgb. Representative error bars are added at the bottom right of eachpanel; the larger one on the right refers to both the early- and late-type spirals samples, while the leftone, smaller, refers to the E/S0 galaxies.
differs from what seen in the early-type spirals of the SAURON survey: there, away from thecentre (≈ 10′′ from the centre) the galaxies have generally higher [Mg/Fe] than in the centre.Super-solar abundance ratios are possibly caused by the presence of populations with severalages. An increase of [Mg/Fe] when moving outwards is detected also by Jablonka (2007) andby Moorthy & Holtzman (2006) for samples of galaxies of type varying between S0 and Sc.This might be due to a change from SSP-like stellar populations in the centre to populationswith a large range in age outside. In particular, Jablonka (2007) measures small incrementsin abundance ratio from the central region to the bulge effective radius; these gradients stayrather constant among bulges; Moorthy & Holtzman (2006) find that most of their galaxieshave positive or zero gradient in [Mg/Fe] within the bulge-dominated region; as mentioned inthe Introduction, they divide their sample in red (B−K > 4) and blue bulges, and, accordingto their analysis, the red bulges are overabundant in the centre, while the blue bulges havesolar abundance ratios in the centre, and the disc-dominated regions also have approximatelysolar abundance ratios. Therefore, our results are not necessarily in contradiction with theirs,as we will also see in Appendix 3.A, where we briefly discuss the radial profiles of the indicesand the population parameters.
3.5.2 Index - Hubble type relationsThe three panels in Fig. 3.9 present the relation between the central line indices (respectively,Hβ, Fe5015 and Mgb) and the morphological type (see Table 3.1). Again, we use filledcircles for the 18 late-type spirals under investigation, asterisks for the ellipticals and lentic-ulars and open triangles for the early-type spirals of the SAURON survey. We see an overallincrease of Hβ and a decrease of Fe5015 and Mgb going towards later types. We also seethat for ellipticals the range spanned in equivalent width is in general quite small, it becomeslarger for lenticulars and Sa galaxies and smaller again in the later-type spirals. This resultis illustrated quantitatively in Table 3.3, where we list for each index the range in equiva-

68 CHAPTER 3: LINE-STRENGTHS OF LATE-TYPE SPIRALS OBSERVED WITH SAURON
index E/S0 Sa Sb-SdHβrange 3.78 [1.13-4.90] 3.10 [1.27-4.37] 1.98 [1.96-3.94]Fe5015range 2.50 [3.66-6.15] 5.65 [0.31-5.96] 3.71 [2.41-6.12]Mgbrange 3.75 [1.51-5.26] 4.05 [0.89-4.94] 3.19 [1.20-4.39]〈Hβ〉 ± σ 1.79 ± 0.75 (0.67) 2.39 ± 0.77 (0.57) 3.06 ± 0.56 (0.36)〈Fe5015〉 ± σ 5.45 ± 0.56 (0.41) 4.51 ± 1.40 (1.10) 4.06 ± 1.04 (0.74)〈Mgb〉 ± σ 4.33 ± 0.87 (0.77) 2.99 ± 1.07 (0.87) 2.19 ± 0.77 (0.57)
Table 3.3: Upper part: ranges spanned in equivalent width (A) by the three indices, for the threesamples represented in Fig. 3.9; between brackets are indicated the minimum and maximum values.Lower part: average values of the indices in the three samples, with the relative standard deviations; thenumbers in parenthesis indicate the standard deviation after subtraction of the observational error.
lent width spanned in the three samples, together with the minimum and maximum valuesassumed by the indices: as one can see, the range in Hβ is larger for the E/S0 than for the Sasample, while for the other indices the range is larger for the early-type spirals; in all threeindices, the Sb-Sd galaxies span a narrower range than the Sa. In the same table, we also listthe average value of the indices in the three samples, together with their standard deviationand the standard deviation after subtraction of the observational errors, which indicates theamount of scatter that cannot be explained by the errors.
3.5.3 Index - velocity dispersion relationFigure 3.10 shows the central Mgb and Hβ indices against the central velocity dispersion ofthe stars (see Table 3.1), in the left and right panels respectively. As in the previous figures,the filled circles represent the late-type galaxies, the asterisks the ellipticals and lenticularsand the open triangles the Sa observed with SAURON (central apertures). In these plots weexpress the indices in magnitudes, as it is often done in the literature (Kuntschner 2000),using the definition:
index′ = − 2.5× log
(
1 − index
∆λ
)
, (3.2)
where index and index′ are measured respectively in A and magnitudes and ∆λ is the widthof the index bandpass (cfr. Paper VI for the full index definition).
A tight and well known relation between magnesium indices (Mgb′ or Mg2) and σ holdsfor ellipticals (see for example Terlevich et al. 1981, Burstein et al. 1988, Bender, Burstein &Faber 1993, Jørgensen et al. 1996, Colless et al. 1999, Trager et al. 2000, Falcon-Barroso,Peletier & Balcells 2002, Bernardi et al. 2003, Worthey & Collobert 2003, Denicolo etal. 2005). In Fig. 3.10 (left panel) we overplot with a solid line the relation obtained byJørgensen et al. (1996) for a sample of 207 E and S0 galaxies in 10 clusters:
Mg2 = 0.196× log(σ) − 0.155, (3.3)
after having converted the Mg2 index to Mgb′ using a least-squares fit to all the models fromVazdekis et al. (1996) with Mg2 > 0.10, holding the relation:
Mgb′
= 0.489× Mg2 + 0.014. (3.4)

CORRELATIONS BETWEEN INDICES AND OTHER PARAMETERS 69
1.4 1.6 1.8 2.0 2.2 2.4 2.6log(σ) (km/s)
0.00
0.05
0.10
0.15
0.20M
gb’
(mag
)
1.4 1.6 1.8 2.0 2.2 2.4 2.6log(σ) (km/s)
0.00
0.05
0.10
0.15
0.20
0.25
Hβ’
(mag
)Figure 3.10: Left panel: central Mgb
′
, expressed in magnitudes, against central velocity dispersion, inunits of decimal logarithm. The filled circles represent our own sample (central aperture), the asterisksthe E and S0 and the open triangles the Sa galaxies of the SAURON survey. Right panel: centralHβ
′
, expressed in magnitudes, against central velocity dispersion, in units of decimal logarithm; thecorrespondence between symbols and samples is the same as for the previous case. The solid lineoverplotted in the left panel represents the relation found by Jørgensen et al. (1996) for early-typegalaxies in 10 cluster. The dotted and dash-dotted lines overplotted in both panels are the relationsobtained by Sanchez–Blazquez et al. (2006) for low- and high-density environments, respectively, andthe dashed lines are the relations determined using our own sample; see text in Section 3.5.3 for details.Representative error bars are added at the bottom right of each panel; the larger one on the right refersto both the early- and late-type spirals samples, while the left one, smaller, refers to the E/S0 galaxies.
One could think that this transformation, using models that do not take into account differ-ences in abundance ratios, could be misleading. But in practice the Mgb′− Mg2 relation hasvery little scatter, even for different [Mg/Fe]. In any case, we also compare the position ofour spirals in the (log (σ), Mgb′) plane with the relations determined by Sanchez–Blazquezet al. (2006) in a fully empirical way for a sample of 98 early-type galaxies drawn from differ-ent environments (the field, poor groups, Virgo, Coma and some Abell clusters). The dottedand dash-dotted lines overplotted in Fig. 3.10 represent their fitted Mgb′ − σ relation forlow- and high-density environments, respectively, and lie both very close to the relation ofJørgensen et al. (1996), especially for high velocity dispersions; similarly, in the right panelwe overplot their Hβ − σ relations. The relations of Jørgensen et al. (1996) and Sanchez–Blazquez et al. (2006) are both determined performing a fit down to velocity dispersionsbelow 100 km s−1 (≈ 40 km s−1 in the case of Sanchez–Blazquez et al. 2006), thereforeexploring the range of velocity dispersions that we test with our late-type spirals. The smalldifferences between these relations might be due to the different statistics and to the differ-ent environments: Jørgensen et al. (1996) themselves noticed that the relation differs slightlyfrom cluster to cluster, in the sense that galaxies in clusters with lower σ have systematicallylower Mg2. We also performed a linear fit to our own data: the dashed line overplotted inboth panels represents the corresponding relation.
In Table 3.4 we list the coefficients defining the relations taken from the literature, to-

70 CHAPTER 3: LINE-STRENGTHS OF LATE-TYPE SPIRALS OBSERVED WITH SAURON
REF aMgb′ bMgb′ aHβ′ bHβ′
Jor −0.062 0.096 − −SanLD −0.073 0.1 0.130 −0.030SanHD −0.050 0.091 0.087 −0.012KG −0.093 0.092 0.247 −0.068
Table 3.4: Coefficients of the index′
− σ relation, in the form: index′
= aindex′ + bindex′ × log(σ);the first column lists the references (Jor=Jørgensen et al. 1996; SanLD=Sanchez–Blazquez et al. 2006,low-density environment; SanHD=Sanchez–Blazquez et al. 2006, high-density environment; KG= thiswork), the second and third the coefficients for the relation with Mgb′
, the fourth and fifth the coeffi-cients for the relation with Hβ
′
.
gether with the coefficients determined for our own sample, in the form:
index′ = aindex′ + bindex′ × log(σ). (3.5)
As already pointed out by Paper XI for the Sa galaxies of the SAURON survey (blue sym-bols in the figure), it is clear from Fig. 3.10 and from Table 3.4 that the Mgb′ −σ relation forellipticals represents an upper envelope for the spirals; some of the spirals follow the relation(particularly if we consider the Sa), but the majority of them lie below it; in particular, thelinear fit to our own data (green line) runs almost parallel to the line from Jørgensen et al.(1996), but significantly below it. Similarly, in the case of the Hβ ′ −σ relation, the ellipticalsrepresent a lower envelope (Paper XI) and many spirals lie above the relation. Deviationsfrom the relations for early-type galaxies may be driven by stochastic processes like starformation: as argumented by Schweizer et al. (1990) and Schweizer & Seitzer (1992), theline defined by the galaxies of Jørgensen et al. (1996) corresponds to old stellar populations,while the deviations would be due to younger stars. For our objects (filled circles) the effectof young populations as deviation from the line defined by E/S0s galaxies is evident.
3.6 AGE, METALLICITY AND STAR FORMATION HISTORYThe ultimate aim of measuring line-strengths is to understand the distribution of stellar ages,metallicities and abundance ratios, and to get hints on the star formation histories. Usinga combination of line-strength indices, one can constrain stellar population models, whichallow to translate the line-strengths values into measurements of age, metallicity and abun-dance ratio.
Trying to address this issue, we investigated two main approaches: from one side, onecan assume that a galaxy can be viewed as a Single Stellar Populations (SSPs), and com-pare observations with theoretical SSPs in order to determine the best-fitting population; thisis a ‘classical’ approach to stellar population studies. From the other side, one can view agalaxy’s population as the time evolution of an initial SSP; making some assumptions onthe initial metallicity and the metal enrichment history, by comparison of observations andmodels one can retrieve information on the star formation history. Nowadays, this is a topicof greatest interest: recently, several groups have been working on it and developed tools.

AGE, METALLICITY AND STAR FORMATION HISTORY 71
Here we mention noticeable examples such as STECMAP and its extension STECKMAP § andMOPED. STECMAP and STECKMAP have been developed by Ocvirk and collaborators (for adescription, see Ocvirk et al. 2006a, Ocvirk et al. 2006b), and try to recover the star forma-tion history via spectral fitting, without any a priori assumption on the star formation history;the only condition imposed is that the star formation history is a smooth function of time;MOPED, developed by Heavens and collaborators, is a method that allows to analyse hugequantities of spectra using the entire spectral range, and assumes that a galaxy can be viewedas superposition of single bursts (for details see Heavens, Jimenez & Lahav 2000 and Panter,Heavens & Jimenez 2003).
In this section we will follow these two roads (SSP and recovery of star formation his-tory), on the basis of our measured Lick indices.
3.6.1 Single stellar population analysisFollowing the examples of Paper VIII and Paper XI, we used the single-burst stellar popula-tion models of Thomas et al. (2003) to compare with our observations and estimate the ages,metallicities and abundance ratios of our galaxies. To avoid strong discretisation effects onthe derived parameters, we interpolated the original grid of model indices, obtaining a cubeof ≈ 225000 individual models, with −2.25 ≤ Z ≤ +0.67, 0.1 ≤ age ≤ 15 Gyr and −0.2 ≤[Mg/Fe] ≤ 0.5. We then determined the model closest to our observations (the set of threeindices) for each Voronoi bin in our galaxies, via a χ2 minimization technique, consistingin minimizing contemporaneously the distance between all of the observed and the modelindices, weighted with the observational error on the line-strengths (see Section 3.3.1 for theactual figures). We attributed to the galaxy bin the age, metallicity and abundance ratio of theselected model. The third row in Figs. 3.6a-3.6i shows the age, metallicity and abundanceratio maps obtained in this way. We are aware that it is an over-simplification to represent agalaxy’s population using a SSP, however, we want to apply this method as a zero-order esti-mate, before moving to somewhat more sophisticated ones. Fig. 3.11 plots against each otherthe age, metallicity and abundance ratio values calculated over the central aperture spectrum.Our sample galaxies are represented with filled circles. Overplotted with asterisks are theellipticals and lenticular galaxies of the SAURON survey (Kuntschner et al., in preparation),while the open triangles represent the early-type spirals of the SAURON survey (Paper XI).Despite the problems intrinsic to this approach, from this plot we can see that, as expected,our galaxies are on average younger and more metal poor than early-type galaxies, and haveon average a value of [Mg/Fe] closer to zero, ranging from slightly sub-solar to slightly over-abundant. This confirms what we saw in Fig. 3.8, where we noticed that the late-type spiralswere compatible with models with [Mg/Fe]=0.
In order to assess the dependence of our results on the set of models used, we per-formed the following exercise. We took the model spectra from the SSP library of Vazdekis(1999) and calculated the line-strength indices on them, obtaining a grid of 322 model in-dices. Then we determined, galaxy by galaxy, the model that best matched our observations,deriving age and metallicity estimates. Abundance ratios are fixed to solar values in the li-brary of Vazdekis (1999). In Fig. 3.12 we plot against each other the ages and metallicitiesobtained for the central 1.′′5 apertures of our galaxies using the Thomas (horizontal axis) andthe Vazdekis (vertical axis) models. Overplotted with solid lines are the 1:1 relations. We
§http://astro.u-strasbg.fr/Obs/GALAXIES/stecmap eng.html .

72 CHAPTER 3: LINE-STRENGTHS OF LATE-TYPE SPIRALS OBSERVED WITH SAURON
-1.6-1.2-0.8-0.40.0 0.4 0.8central_Z
02468
10121416
cent
ral_
age
(Gyr
)
-1.6-1.2-0.8-0.40.0 0.4 0.8central_Z
-0.2-0.1
0.0
0.1
0.2
0.3
0.40.5
cent
ral_
[Mg/
Fe]
0 2 4 6 8 10121416central_age (Gyr)
-0.2-0.1
0.0
0.1
0.2
0.3
0.40.5
cent
ral_
[Mg/
Fe]
Figure 3.11: Central aperture values of the stellar population parameters from our one-SSP analy-sis. Left panel: central age (in Gyr) against central metallicity (in decimal logarithm, with the solarmetallicity as zero point); middle panel: central abundance ratio against central metallicity; right panel:central abundance ratio against central age. With filled circles we represent our sample galaxies, withasterisks the E and S0 and with open triangles the Sa galaxies observed with SAURON.
0.0 0.2 0.4 0.6 0.8 1.0 1.2log(age Thomas) (Gyr)
0.00.20.40.60.81.01.2
log(
age V
azde
kis) (
Gyr
)
-1.5 -1.0 -0.5 0.0 0.5Z Thomas
-1.5
-1.0
-0.5
0.0
0.5
Z Va
zdek
is
Figure 3.12: Comparison between the ages (left panel, in Gyr) and metallicities (right panel) obtainedfrom our one-SSP approach using the models of Thomas et al. 2003 (horizontal axis, limited to nearly-solar abundance ratios) and Vazdekis 1999 (vertical axis). The solid lines overplotted represent the 1:1relation.
see that there are no dramatic differences between the two sets of measurements, though theVazdekis models tend in several cases to predict slightly older ages and lower metallicitieswith respect to the Thomas ones. The small residual differences do not depend on the fixedabundance ratios of the Vazdekis models: the ages and metallicities on the horizontal axisin Fig. 3.12 are obtained for this test considering only the Thomas models closest to solarabundance ratios. The differences in the metallicity could be instead at least partially due tothe coarseness in Z of the model grid obtained from the Vazdekis models.
As also noticed in Paper XI, in some cases an unconstrained SSP fit cannot providea suitable representation of a galaxy. In the case of a complex star formation history, notapproximable with a single, instantaneous burst, the SSP-equivalent parameters must be in-

AGE, METALLICITY AND STAR FORMATION HISTORY 73
terpreted with caution, as a zero-order estimate, as we already stressed. As an example, weremind the reader the case of the star formation ring in NGC 4321 discussed by Allard et al.(2006). They show that in the ring the line-strength indices suggest the superposition of twocomponents: a young stellar population and an old and metal-rich one. When they force asingle SSP, they obtain low metallicity and old age. But it is known (Zaritsky at al. 1994) thatthe HII regions of this galaxy have super-solar metallicity¶. Therefore, the one-SSP solutionobtained by Allard et al. (2006) represents an inconsistent description. As clearly visible fromthe first panel in Fig. 3.11, some of our galaxies also populate the region of the (metallicity,age) plane characterised by low metallicities (below −1.0) and old ages (above 10 Gyr). Thisis the case for the central aperture of NGC 864, for which our χ2 technique selects a modelwith Z ≈ −1.14 and age ≈ 11 Gyr. The line-strength maps for this object (see Fig. 3.6b)show that in the very center the Fe5015 and Mgb indices assume low values, and so doesHβ, on a large inner region. The low indices drive the metal poor old population, but a SSPdescription might be too unrealistic for this object.
More generally, if for example a galaxy has undergone two separate bursts of star for-mation, the SSP-equivalent age will be biased towards the age of the youngest stars, and theSSP-equivalent metallicity will be biased towards the metallicity of the old population, asstudied and described in detail by Serra & Trager (2007).
In order to put some physically motivated constraints to our one-SSP analysis, we decidedto constrain the metallicity of our objects in a narrow range around the value in the model gridclosest to the one determined from a relation between central stellar velocity dispersion andmetallicity for early-type galaxies. In practice, we aim to apply a scaling relation obtainedfor spheroids (ellipticals and lenticulars). Our late-type galaxies do not host relevant bulgecomponents (Chapter 4), so the regions that we probe with our data do not fall under this cat-egory. Also, unlike for spheroids, the stellar velocity dispersion is not a good mass indicatorin disc galaxies. But in any case, using a ‘σ relation’ for spheroids is a zero-order approachto extrapolate the metal content of the old stars in low-mass galaxies. We investigated severalpossibilities for a metallicity − sigma relation for early-type galaxies. The resulting relationscan differ from each other significantly, particularly at the low-σ end, because of differencesin the methods, in the models used, and in the underlying assumptions.
A possible and common way is to go through stellar population models, estimate the agesand metallicities by comparison of observations and SSP models, and then fit a relation withσ. This approach has been extensively investigated in the literature; we will refer to it as ‘ themodel approach’. As a prototype, we refer to the work of Thomas et al. (2005), who studied124 early-type galaxies in high- and low-density environments and derived their ages, metal-licities and element ratios. For the galaxies in high-density environments, they retrieved thefollowing relation:
Z = 0.55× log(σ) − 1.06. (3.6)See also Kuntschner (2000) for a similar result.
Another possibility, to which we will refer as ‘the index − σ approach’, is to assume aset of index − σ relations for early-type galaxies, extrapolate them to the range of σ underinvestigation, from the measured σ infer the indices and from these, via a comparison withmodels, an estimate for the metallicity. In practice, we used the Hβ ′ − σ, Fe5015′ − σ ,
¶The gas phase has always higher metallicity than the stars, but the expected differences are small, below onedex. Hence the inconsistency in the use of SSP models for NGC 4321: they predict metallicities that are too lowcompared with the gas.
74 CHAPTER 3: LINE-STRENGTHS OF LATE-TYPE SPIRALS OBSERVED WITH SAURON
Mgb′ − σ relations published in Paper VI for the 48 ellipticals and lenticulars of the mainSAURON survey. Using these relations and the measured values for the central aperture ve-locity dispersions of our galaxies, we obtained a set of index values. We then compared themwith the models of Thomas et al. (2003) via the previously described χ2 minimization, butchoosing only among models with solar abundance ratios and age ≈ 12.6 Gyr. In this way wecome to the estimate of the metallicity of an old spheroid at the observed velocity dispersion.We will adopt the estimates obtained in this way to put a constraint on the metallicity.
A third approach, which does not involve any stellar population modeling, relies on em-pirical calibrations and tight observed scaling relations between metal indices and velocitydispersion. Consider the Mg2 −σ relation for elliptical and lenticular galaxies given byJørgensen et al. 1996 (Eq. 3.3). If we combine this relation with the Mg2 − metallicitycalibration from Buzzoni, Gariboldi & Mantegazza (1992)‖:
Mg2 = 0.135× Z + 0.28, (3.7)
we obtain a relation between metallicity and velocity dispersion, holding for early-type galax-ies:∗∗
Z = 1.452× log(σ) − 3.222. (3.8)
We call this last approach ‘the empirical approach’.In Fig. 3.13 we show in the (log (σ), Z) plane the distribution of the elliptical and lentic-
ular galaxies in the SAURON survey (asterisks, from Kuntschner et al., in preparation), theSa galaxies from the same survey (open triangles, from Paper XI), together with our owngalaxies (filled circles). All the values refer to the central apertures, and the metallicities areobtained from the one-SSP analysis. The lines overplotted in the figure represent the variousmetallicity−velocity dispersion relations for E/S0 galaxies described above. The dotted linereproduces Eq. 3.6 (from ‘the model approach’), the dashed line Eq. 3.8 (from ‘the empiricalapproach’) and the solid line connects the points representing our galaxies in the (log (σ), Z)plane according to ‘the index − σ’ approach, the second one we presented.
We re-evaluated our age estimates by imposing a constraint on the metallicity, allowingit to vary only in a narrow range (± 0.1 dex) around the metallicity given, galaxy by galaxy,by the solid line in Fig. 3.13 (‘the index −σ approach’ discussed above). We preferred thisapproach to the other two because it is based on empirical relations, and does not rely exclu-sively on models, unlike ‘the model approach’, and because it uses more than just magnesiumto establish the metallicity of the old population, contrary to ‘the empirical approach’. Fig.3.14 is equivalent to Fig. 3.11, but with the constraints on metallicity. In Fig. 3.15 we plotthe constrained ages against the unconstrained ones: we can notice that for very young agesthe values are close, and differ more and more going to older ages. The fact that in somecases the constrained age differs from the unconstrained might indicate either that the im-posed metallicity is inappropriate or that the one-SSP assumption is wrong, and the galaxy’sstar formation history is not approximable with an instantaneous burst.
‖These authors calibrate the dependence of Mg2 from stellar parameters using an observed stellar library andfind a general relation, that reduces to the one reported here (Eq. 3.7) in the parameter range spanned by ellipticalgalaxies.
∗∗We warn the reader about the fact that the Mg2 index has a slightly different definition in the papers of Jørgensenet al. (1996) and Buzzoni et al. (1992), and that we have not taken this difference into account in deriving Eq. 3.8.Also, we should notice that in the paper of Buzzoni et al. as metallicity it is used [Fe/H], while in the Thomas modelsthe metallicity refers to the total content in elements heavier than helium.

AGE, METALLICITY AND STAR FORMATION HISTORY 75
1.4 1.6 1.8 2.0 2.2 2.4 2.6log(σ) (km/s)
-1.5
-1.0
-0.5
0.0
0.5
1.0Z
Figure 3.13: Relation between central metallicity and central velocity dispersion (in decimal loga-rithm and units of km s−1) for the E and S0 galaxies (Kuntschner et al., in preparation, asterisks) andthe Sa (Paper XI, open triangles) of the SAURON survey and for our late-type spirals (filled circles),from our one-SSP analysis. The overplotted lines represent the relation metallicity − velocity disper-sion obtained in different ways, drawn on the σ range of our data only: the dotted line reproducesEq. 3.6 (‘model approach’), the dashed line Eq. 3.8 (‘empirical approach’) and the solid lines repre-sents a relation based on the assumption of a set of index − σ relations. See text for a more completedescription.
In Table 3.5 we list the population parameters measured, both in the unconstrained and inthe constrained case, on the central aperture of our galaxies.
3.6.2 Two-population analysisA galaxy is most likely characterised by stellar populations that are more complex than SSPs;therefore, in order to try to build a more realistic picture of our galaxies, we investigatedmore sophisticated approaches. As an attempt, we explore a two-SSP scenario, describingthe galaxy as the superposition of an old population and a younger one. In practice, we wantto describe the galaxy population as:
pop tot = (1 − f) × pop old+ f × pop young, (3.9)
where pop old is a ≈ 12.6 Gyr old SSP with metallicity fixed to the value close to the oneobtained from the Z − σ relation (on the basis of what we called ‘the index − σ approach’)

76 CHAPTER 3: LINE-STRENGTHS OF LATE-TYPE SPIRALS OBSERVED WITH SAURON
-1.6-1.2-0.8-0.40.0 0.4 0.8central_Z
02468
10121416
cent
ral_
age
(Gyr
)
-1.6-1.2-0.8-0.40.0 0.4 0.8central_Z
-0.2-0.1
0.0
0.1
0.2
0.3
0.40.5
cent
ral_
[Mg/
Fe]
0 2 4 6 8 10121416central_age (Gyr)
-0.2-0.1
0.0
0.1
0.2
0.3
0.40.5
cent
ral_
[Mg/
Fe]
Figure 3.14: Same plots as in Fig. 3.11, but referring to the case with constrained metallicity (see textin Section 3.6.1 for more details), for our late-type spirals (filled circles); for the E/S0 (asterisks) andthe Sa (open triangles) galaxies no constraint on metallicity is applied.
0 2 4 6 8 10 12age free (Gyr)
0
2
4
6
8
10
12
age c
onst
rain
ed (G
yr)
Figure 3.15: Constrained (y-axis) vs unconstrained (x-axis) age (in Gyr), measured on the centralapertures of our galaxies with the one-SSP approach. The solid line represents the 1:1 relation.

AGE, METALLICITY AND STAR FORMATION HISTORY 77
NGC age agec Z Zc [Mg/Fe] [Mg/Fe]c488 3.162 8.913 0.489 0.187 0.191 0.191628 1.585 7.943 0.207 −0.498 −0.118 0.006772 1.995 4.467 0.267 −0.035 0.068 0.068864 11.220 3.981 −1.142 −0.498 −0.015 −0.118
1042 1.259 2.239 0.086 −0.458 −0.076 0.0682805 1.413 2.512 −0.095 −0.558 0.191 0.3352964 2.818 1.585 −0.639 −0.256 0.068 0.0263346 1.259 1.778 −0.256 −0.518 0.109 0.1713423 1.778 3.548 −0.115 −0.518 −0.035 0.0473949 1.000 1.122 −0.136 −0.377 0.006 0.1094030 1.585 3.162 0.247 −0.095 0.047 0.0884102 1.413 1.413 − 0.176 −0.095 −0.015 −0.0564254 2.512 2.818 −0.236 −0.276 0.171 0.2124487 4.467 1.995 −1.122 −0.659 0.047 0.0064775 1.778 1.778 −0.639 −0.639 0.129 0.1295585 1.778 1.778 −0.881 −0.860 − 0.076 −0.0765668 1.122 1.413 −0.236 −0.498 −0.015 0.0475678 1.585 1.778 0.026 −0.095 −0.015 0.026
Table 3.5: Population parameters from our one-SSP analysis. The subscript ‘c’ refers to the quantitiesobtained in the case where we constrain the metallicity within a narrow range (± 0.1 dex) around themetallicity given by the Z − σ relation. Age is in Gyr and metallicity in decimal logarithm, with solarmetallicity as zero point.
and pop young is a SSP with age below 5 Gyr and free metallicity; the limit of 5 Gyr waschosen in order to have a population younger than the old component, but at the same timenot limited to very young ages; f is the mass fraction of the young component and variesbetween 0 and 1. To do this, we take the model spectra from Vazdekis (1999) and select,galaxy by galaxy, the 12.6 Gyr old model with the metallicity closest to the one given bythe solid line in Fig. 3.13, among those available in the model grid, and combine it with allthe other SSP models in the library, with varying mass fractions. In this way we obtain foreach galaxy a set of 6762 ‘composite model spectra’, with varying age and metallicity of theyoung component and relative mass fraction. On these spectra we compute the line-strengthindices, obtaining for each galaxy a grid of ‘composite model indices’. Since we use themodel library of Vazdekis (1999), the abundance ratio is fixed to solar values, which for ourobjects is a quite fair approximation, as we saw in the previous section. We then use thesame χ2 technique as for the one-SSP analysis and determine, spectrum by spectrum, thecomposite model closest to our observed line-strengths. This gives us an estimate for the ageand metallicity of the young component and its mass fraction.
Figure 3.16 plots against each other the parameters fitted on the spectrum averaged ina central aperture of 1.′′5 radius. We see that the young component spans a range in agefrom below 1 to ≈ 4.5 Gyr, a range in Z from −1.38 to +0.2 and that its mass contributionto the global galaxy population f varies from ≈ 10 percent (NGC 2805) to ≈ 95 percent(NGC 1042, 2964, 3949, 4487).
The main problem of this approach is the degeneracy of the parameter space, which

78 CHAPTER 3: LINE-STRENGTHS OF LATE-TYPE SPIRALS OBSERVED WITH SAURON
-1.6 -1.2 -0.8 -0.4 0.0 0.4central_Z
0
1
2
3
4
5ce
ntra
l_ag
e (G
yr)
-1.6 -1.2 -0.8 -0.4 0.0 0.4central_Z
0.00.10.20.30.40.50.60.70.80.91.0
cent
ral_
f
0 1 2 3 4 5central_age (Gyr)
0.00.10.20.30.40.50.60.70.80.91.0
cent
ral_
f
Figure 3.16: Fitted parameters from our two-SSP analysis, measured on the central apertures. Inthe left panel we have the age (in Gyr) against the metallicity (in decimal logarithm, with the solarmetallicity as zero point) of the young component pop young; in the middle its mass fraction againstits metallicity; in the right panel, the mass fraction of the young component against its age.
must act as a warning for the reader against the robustness of the ages and mass fractionestimates for the young component presented in Fig. 3.16. This degeneracy is illustrated inFigs. 3.17 and 3.18. In Fig. 3.17 (find a colour version in the Colour appendix) we plot, fordifferent choices of the metallicity of the old component and solar metallicity for the youngone, the points representing the models in the ([MgFe50], Hβ) diagram. Different colours(with reference to the version of the picture in the Appendix) represent different weights ofthe young component in the composite models, from 0.1 (black) to 0.9 (gold). From theseplots it is evident that it is not possible to significantly discriminate the effects of age andmass fraction of the young component. Fig. 3.18 shows the projection of the ∆χ2 space(metallicity, age and mass fraction of the young component) on the (age, fraction) plane andthe contours representing the 1,2,3-σ confidence level, based on the ∆χ2 for two degree offreedom, for the central aperture of some of the galaxies. We see that very large regions of theparameter space are equivalent in terms of χ2, and that even in cases where the age is ratherwell constrained (see NGC 2805), the mass fraction is badly determined. Therefore, we seethat we cannot extract solid conclusions from this method, despite its interesting principle,and we decided not to push it further and not to present the two-dimensional maps of theinferred parameters. The existence of degeneracies between age and mass fraction of theyounger component when modeling a galaxy as the superposition of two SSPs is known fromother studies also, see for example the paper of Serra & Trager (2007).
3.6.3 Continuous star formation‘The star formation history of galaxies is imprinted in their integrated light’, state Bruzual& Charlot in a paper where they present a new model for the spectral evolution of stellarpopulations at ages between 1 × 10⁴ and 2 × 10¹⁰ yr for a range of metallicities (Bruzual& Charlot 2003). In practice, they use the isochrone synthesis technique to compute thespectral evolution of stellar populations. This technique relies on the fact that any stellar
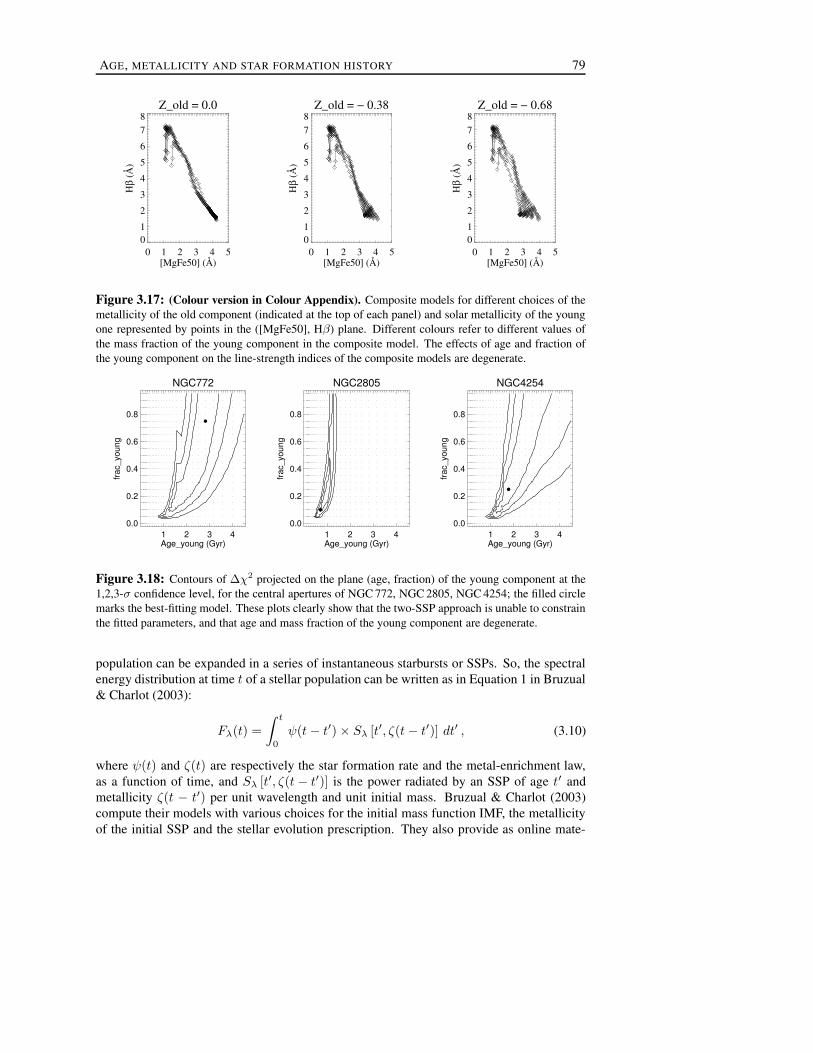
AGE, METALLICITY AND STAR FORMATION HISTORY 79
Z_old = 0.0
0 1 2 3 4 5[MgFe50] (Å)
012345678
Hβ
(Å)
Z_old = − 0.38
0 1 2 3 4 5[MgFe50] (Å)
012345678
Hβ
(Å)
Z_old = − 0.68
0 1 2 3 4 5[MgFe50] (Å)
012345678
Hβ
(Å)
Figure 3.17: (Colour version in Colour Appendix). Composite models for different choices of themetallicity of the old component (indicated at the top of each panel) and solar metallicity of the youngone represented by points in the ([MgFe50], Hβ) plane. Different colours refer to different values ofthe mass fraction of the young component in the composite model. The effects of age and fraction ofthe young component on the line-strength indices of the composite models are degenerate.
1 2 3 4Age_young (Gyr)
0.0
0.2
0.4
0.6
0.8
frac_
youn
g
NGC772
1 2 3 4Age_young (Gyr)
0.0
0.2
0.4
0.6
0.8
frac_
youn
g
NGC2805
1 2 3 4Age_young (Gyr)
0.0
0.2
0.4
0.6
0.8
frac_
youn
g
NGC4254
Figure 3.18: Contours of ∆χ2 projected on the plane (age, fraction) of the young component at the1,2,3-σ confidence level, for the central apertures of NGC 772, NGC 2805, NGC 4254; the filled circlemarks the best-fitting model. These plots clearly show that the two-SSP approach is unable to constrainthe fitted parameters, and that age and mass fraction of the young component are degenerate.
population can be expanded in a series of instantaneous starbursts or SSPs. So, the spectralenergy distribution at time t of a stellar population can be written as in Equation 1 in Bruzual& Charlot (2003):
Fλ(t) =
∫ t
0
ψ(t− t′) × Sλ [t′, ζ(t− t′)] dt′ , (3.10)
where ψ(t) and ζ(t) are respectively the star formation rate and the metal-enrichment law,as a function of time, and Sλ [t′, ζ(t− t′)] is the power radiated by an SSP of age t′ andmetallicity ζ(t − t′) per unit wavelength and unit initial mass. Bruzual & Charlot (2003)compute their models with various choices for the initial mass function IMF, the metallicityof the initial SSP and the stellar evolution prescription. They also provide as online mate-

80 CHAPTER 3: LINE-STRENGTHS OF LATE-TYPE SPIRALS OBSERVED WITH SAURON
rial some tools that allow the user to compute the spectral evolution -in time- of a SSP fordifferent star formation history scenarios††. We chose to use these tools in order to applyan evolutionary analysis to our data. Starting from the SSP models from Bruzual & Charlot(2003) obtained using the Chabrier (2003) IMF, for different choices of the initial metallicity(namely, Z = −1.69, −0.69, −0.39, 0.0, 0.39), we computed the time evolution with con-stant and with exponentially declining star formation rate: respectively, ψ(t) = const andψ(t) = [1M� + εMPG(t)] τ−1exp(−t/τ), where τ is the e-folding time-scale and MPG(t)is the mass of gas processed into stars and re-ejected into the interstellar medium at the timet; the parameter ε sets the fraction of the ejected gas that is re-used in new star formationepisodes; we only explored the cases ε = 0 (no recycling) and ε = 1 (all of the ejecta go intonew stars). In any case, the actual value of ε does not change our results significantly. Theseare both plausible scenarios: the constant star formation history has long been consideredas a suitable scenario for spirals: ‘star formation has proceeded at relatively constant rateover the lifetimes of most late-type spiral galaxies’ (Kennicutt 1983), while the exponentiallydeclining star formation describes the situation of a starburst of duration τ ; we notice thatthe case τ → ∞ approximates the constant star formation scenario, while the case τ → 0reproduces an instantaneous burst or SSP. We computed the spectral evolution for the chosenmetallicities, for both cases ε = 0 and ε = 1 and for several choices of τ : τ = 0.5, 1.0, 3.0,5.0, 7.0, 10.0, 12.0 and 15.0 Gyr. The tools provided by Bruzual & Charlot also include anoption for computing the effect of attenuation by dust, but we decided not to use this possi-bility, in order not to further increase the number of parameters at play.
For all of the selected cases we calculated the time evolution of the Lick indices usingthe programs from Bruzual & Charlot and focused on the situation at t = 10 Gyr, buildinga model grid of Lick indices for different metallicities, τ and ε (0 or 1) and age fixed at 10Gyr and then compared them with the line-strength indices of the SAURON spectra, via theχ2 minimization technique used also in the previous sections. In this way, we came to anestimate for the time-scale τ , ε and the metallicity. Fixing the age to 10 Gyr is equivalent toassume that the galaxy existed for 10 Gyr, and to try to describe how stars were formed overthat time. We tested that the fitted parameters (τ and metallicity) had negligible variationswhen fixing the value of ε, therefore we repeated our estimates allowing only models withε = 1 and will refer to this case from now on.
In Figs. 3.6a-3.6i the top right panel shows, galaxy by galaxy, the two-dimensional mapsof τ , obtained for the exponentially declining SFR, for age fixed to 10 Gyr and ε = 1. Inter-esting features of the individual τ maps, whenever present, are highlighted in Appendix 3.B.As for the metallicity maps, obtained in the χ2 minimization and not shown in this chapter,we can state that in the majority of cases they resemble in their structure the metallicity mapsobtained in the one-SSP approach; the actual numbers are different, since the models used inthe two approaches are different and also the metallicity ranges and values explored by themodel grids differ, but the spatial structure is generally similar.
If we focus on the values obtained for the central apertures, we find a correlation betweenthe best-fitting τ and the central velocity dispersion, as shown in Fig. 3.19 where we plotlog(τ ) against log(σ). We see that higher σ galaxies, which are larger and more massive,tend to have shorter star formation time-scales, more consistent with an instantaneous burstscenario, while at the low-σ end the smaller galaxies tend to have larger τ , indicating a star
††The programs we used are available from the web page http://www.cida.ve/∼bruzual/bc2003 .

AGE, METALLICITY AND STAR FORMATION HISTORY 81
1.4 1.6 1.8 2.0 2.2 2.4 2.6log(σ) (km/s)
-0.5
0.0
0.5
1.0
1.5lo
g(τ)
(Gyr
)
Figure 3.19: Central aperture values for the e-folding time-scale τ against central velocity dispersionσ (both in units of decimal logarithm), in an exponentially declining star formation scenario; the τvalues are obtained selecting among models with age = 10 Gyr and ε = 1; the error bars come froma rough estimate on the basis of the 1-σ contour plots of the projection of ∆χ2 on the (τ -metallicity)plane.
formation history spread over time. Therefore, the time-scale τ represents a physically mean-ingful parameter, parametrizing a smooth transition from SSP-like to constant SFR.
Figure 3.20 shows that rather tight correlations exist also between the central τ andthe central line-strength indices. These plots tell us that old, metal-rich galaxies (low Hβ,high Fe5015 and Mgb values) have shorter star formation time-scales, while young and moremetal poor galaxies (higher Hβ, lower Fe5015 and Mgb) have a star formation history moreextended in time: we find again a smooth transition between a SSP-like and constant starformation. The central aperture values of τ used in Figs. 3.19 and 3.20 are listed in Table 3.6.
We also investigated the constant star formation history scenario, by selecting the corre-sponding option when using the programs from Bruzual & Charlot, building a grid with themodel indices for the exponentially declining star formation rate and adding those for con-stant star formation rate, for the various metallicity values selected and for ε = 1 and age fixedto 10 Gyr. When applying our χ2 minimization procedure, we found that the constant starformation was preferred in the regions where the fit with the exponential star formation onlyhad selected the highest values allowed for the time-scale τ . This confirms our interpretationof τ as a parameter describing a continuous transition from constant SFR to SSP.
We then repeated the analysis for different values of the fixed age of the evolved models,spanning the range 1-18 Gyr and found that the τ values depend on the fixed age, given the
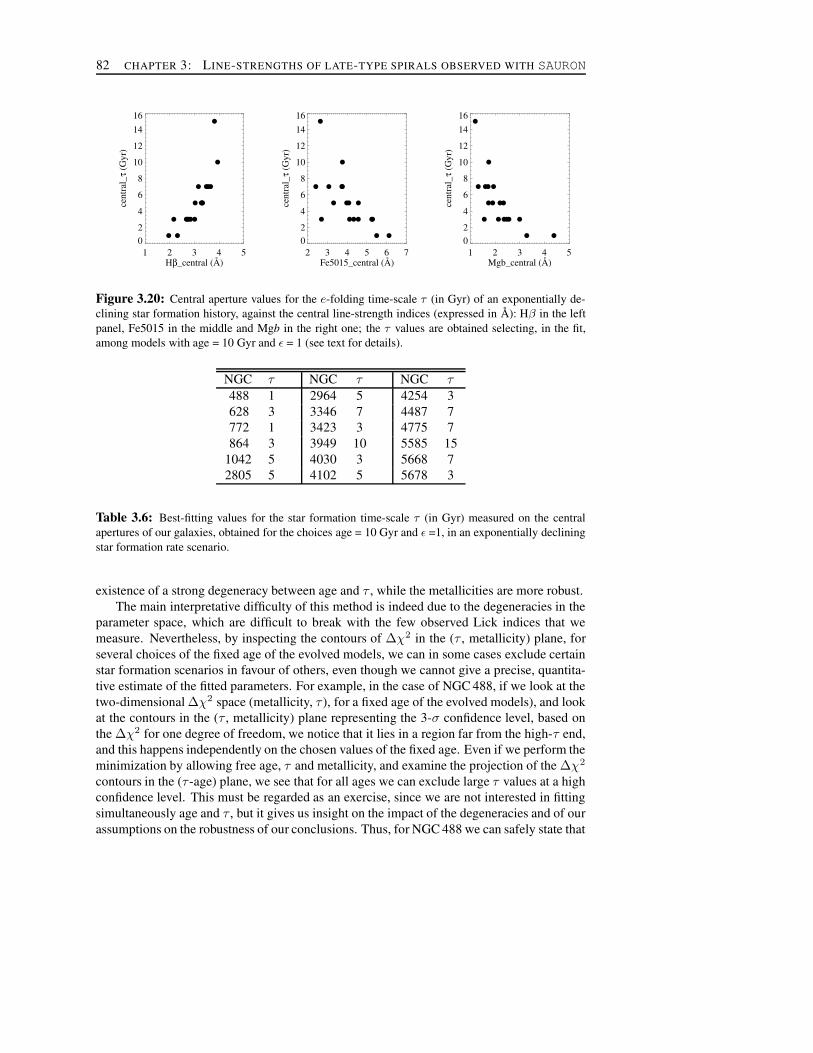
82 CHAPTER 3: LINE-STRENGTHS OF LATE-TYPE SPIRALS OBSERVED WITH SAURON
1 2 3 4 5Hβ_central (Å)
02
4
6
8
10
12
1416
cent
ral_
τ (G
yr)
2 3 4 5 6 7Fe5015_central (Å)
02
4
6
8
10
12
1416
cent
ral_
τ (G
yr)
1 2 3 4 5Mgb_central (Å)
02
4
6
8
10
12
1416
cent
ral_
τ (G
yr)
Figure 3.20: Central aperture values for the e-folding time-scale τ (in Gyr) of an exponentially de-clining star formation history, against the central line-strength indices (expressed in A): Hβ in the leftpanel, Fe5015 in the middle and Mgb in the right one; the τ values are obtained selecting, in the fit,among models with age = 10 Gyr and ε = 1 (see text for details).
NGC τ NGC τ NGC τ488 1 2964 5 4254 3628 3 3346 7 4487 7772 1 3423 3 4775 7864 3 3949 10 5585 15
1042 5 4030 3 5668 72805 5 4102 5 5678 3
Table 3.6: Best-fitting values for the star formation time-scale τ (in Gyr) measured on the centralapertures of our galaxies, obtained for the choices age = 10 Gyr and ε =1, in an exponentially decliningstar formation rate scenario.
existence of a strong degeneracy between age and τ , while the metallicities are more robust.The main interpretative difficulty of this method is indeed due to the degeneracies in the
parameter space, which are difficult to break with the few observed Lick indices that wemeasure. Nevertheless, by inspecting the contours of ∆χ2 in the (τ , metallicity) plane, forseveral choices of the fixed age of the evolved models, we can in some cases exclude certainstar formation scenarios in favour of others, even though we cannot give a precise, quantita-tive estimate of the fitted parameters. For example, in the case of NGC 488, if we look at thetwo-dimensional ∆χ2 space (metallicity, τ ), for a fixed age of the evolved models), and lookat the contours in the (τ , metallicity) plane representing the 3-σ confidence level, based onthe ∆χ2 for one degree of freedom, we notice that it lies in a region far from the high-τ end,and this happens independently on the chosen values of the fixed age. Even if we perform theminimization by allowing free age, τ and metallicity, and examine the projection of the ∆χ2
contours in the (τ -age) plane, we see that for all ages we can exclude large τ values at a highconfidence level. This must be regarded as an exercise, since we are not interested in fittingsimultaneously age and τ , but it gives us insight on the impact of the degeneracies and of ourassumptions on the robustness of our conclusions. Thus, for NGC 488 we can safely state that

SUMMARY AND CONCLUSIONS 83
we can exclude a constant star formation scenario in favour of an exponentially declining starformation rate, with a short time-scale τ (closer to an instantaneous burst than to a constantSFR). This is illustrated in the first column in Fig. 3.21a. Similar hints for the star formationhistory of other galaxies will be given, whenever possible, in Appendix 3.B, dedicated to thedescription of the single galaxies individually. For all galaxies, the ∆χ2 contours for the fitat different fixed ages and with free age are presented in Figs. 3.21a-3.21c.
3.7 SUMMARY AND CONCLUSIONSIn this chapter we presented the first integral-field measurements of line-strength indices andstellar population parameters for a sample of late-type spiral galaxies. This work is basedon data of 18 spirals spanning a range in type between Sb and Sd, observed with SAURON,which provides measurements of the Lick indices Hβ, Fe5015 and Mgb over a field of viewcovering the nuclear region of our objects.
Here we summarize the main achievements of the chapter:
• We presented the two-dimensional maps of the line-strength indices and analysed thevalues extracted on a central aperture of 1.′′5 radius.
• We looked at the relations with morphological type: we found that late-type spirals dodiffer from earlier-type galaxies in terms of their populations, having globally higherHβ values and lower metal indices than ellipticals, lenticulars and early-type spirals.This suggests younger ages and lower metallicities.
• We investigated the relations between indices and central velocity dispersion: late-typespirals do not obey the index − σ relations found for early-type galaxies: our galaxieslie above the Hβ − σ and below the Mgb − σ relations determined for the ellipticalgalaxies, that correspond to old populations.
• We determined SSP-equivalent ages, metallicities and abundance ratios by comparisonof our observed indices with models: ages are mainly young, metallicities low andabundance ratios close to solar; the range spanned in the parameters is narrower thanfor early-type spirals.
• We investigated the possibility of recovering the star formation history: we assumedthat the galaxies formed 10 Gyr ago, and that they experienced an exponentially de-clining or constant star formation rate since then, and compared our indices with theevolved models of Bruzual & Charlot (2003); the fit returned an estimate for the e-folding time-scale for star formation τ , which parametrizes a smooth transition froma SSP-like star formation history to a constant SFR: small τ approximate an instanta-neous burst and very large τ reproduce a constant SFR; for the central apertures of ourgalaxies, we found a large range in τ values, from 1 to 15 Gyr, covering basically thewhole parameter interval that we explored.
• Interestingly, we found a trend between the fitted τ and the central velocity dispersion,in the sense that galaxies with large σ tend to have small τ and galaxies with low σtend to have large τ .

84 CHAPTER 3: LINE-STRENGTHS OF LATE-TYPE SPIRALS OBSERVED WITH SAURON
Our observations and results nicely fit in the scenario summarized by Kennicutt (1998): thereare two modes of star formation; one takes place in the extended discs of spiral and irregulargalaxies, the other in compact gas discs in the nuclear regions of galaxies. The first has beendetected mainly via Hα surveys and it is strongly dependent on the morphological type: thestar formation rate increases by a factor of ≈ 20 going from Sa to Sc galaxies. Similar in-formation is derived from observations of the UV continuum and broadband visible colours.The second mode of star formation can be found in the circumnuclear regions; the physicalconditions in these regions are in many cases distinct from the more extended star formingdiscs. The circumnuclear star formation is characterised by the absolute range in SFR, muchhigher spatial concentration of gas and stars and its burst-like nature (Kennicutt 1998). Cir-cumnuclear star formation is largely decoupled from Hubble type. Studies on the dependenceof nuclear Hα emission in star forming nuclei as a function of galaxy type (Stauffer 1982,Keel 1983, Ho, Filippenko, & Sargent 1997b) showed that the detection frequency of HIIregion nuclei is a monotonic function of type, increasing from 0 percent in elliptical galaxiesto 8 percent in S0, 22 percent in Sa, 51 percent in Sb, and 80 percent in Sc - Im galaxies.Among the galaxies with nuclear star formation, the Hα luminosities show the opposite trend;the average extinction-corrected luminosity of HII region nuclei in S0 - Sbc galaxies is ninetimes higher than in Sc galaxies. The conclusion of these studies, as summarized by Kenni-cutt (1998), is that the bulk of the total nuclear star formation in galaxies is weighted towardsthe earlier Hubble types, even though the frequency of occurrence is higher in the late types.According to Kormendy & Kennicutt (2004), the central star formation accounts for 10 - 100percent of the total SFR of spiral galaxies. The highest fractions occur in early-type spiralgalaxies, which typically have low SFRs in their outer discs (Kennicutt & Kent 1983).
The work presented in this chapter supports this picture: if we put together the infor-mation gathered from the sample of E/S0s of Paper VI, the sample of Sa galaxies of PaperXI and our own sample, and look at the behaviour along the Hubble sequence, we find thatearly-type spirals show a larger range in age than both E/S0s and late-type spirals; this isconsistent with a scenario where the star formation in elliptical and lenticular galaxies is notvery important, in early-type spirals it is dominated by short bursts and in late-type galaxiesit is more quiescent. This is also supported by our finding that big spirals tend to have anSSP-like star formation history, while for smaller ones the star formation history is betterapproximated by a constant over time.
The following steps in the analysis of the SAURON data here presented and discussedwill be a full investigation of the spatial information, with a more detailed study of the radialprofiles (here quickly shown in Appendix 3.A) and the gradients, and an interpretation of theconnection between features in the line-strengths maps and in the morphological appearance.The interdependencies between the populations and the kinematical structures will also beexamined in future papers.
The main limitation of our work is the degeneracy in the parameter space in the differentapproaches we investigated. Our analysis relies on three data-points only (the line-strengthindices within the SAURON spectral range), which are too few to break the degeneracies andconstrain the fitted parameters. Therefore, it is urgent to complement the data presentedhere with spectra with a broader spectral coverage. Observations at other wavelengths -bothshorter and longer- would help building a complete picture: both the UV and the NIR spec-tral regions can provide population indicators much less affected by the model degeneraciesfound in the optical. In addition, different sub-populations contribute to the integrated light in

SUMMARY AND CONCLUSIONS 85
different spectral ranges, therefore a multi-wavelength study would be a step forward towardsa full understanding of the formation and evolution of our objects.
AcknowledgmentsWe kindly acknowledge Isabel Perez for very useful discussion and comment. We thankthe referee of the published paper for interesting comments that improved it. The SAURON- related projects are made possible through grants 614.13.003 and 781.74.203 from AS-TRON/NWO and financial contributions from the Institut National des Sciences de l’Univers,the Universite Claude Bernard Lyon I, the universities of Durham, Leiden, Groningen andOxford, the British Council, PPARC grant ‘Extragalactic Astronomy & Cosmology at Durham1998–2002’, and the Netherlands Research School for Astronomy NOVA. KG acknowledgessupport for the Ubbo Emmius PhD program of the University of Groningen. MC acknowl-edges support from a PPARC Advanced Fellowship (PP/D005574/1). GvdV acknowledgessupport provided by NASA through Hubble Fellowship grant HST-HF-01202.01-A awardedby the Space Telescope Science Institute, which is operated by the Association of Universi-ties for Research in Astronomy, Inc., for NASA, under contract NAS 5-26555. This projectmade use of the HyperLeda and NED databases.

86 CHAPTER 3: LINE-STRENGTHS OF LATE-TYPE SPIRALS OBSERVED WITH SAURON
5 10 15τ (Gyr)
-1.6
-1.2
-0.8
-0.4
0.0
Z
NGC488
age = 5 Gyr
5 10 15τ (Gyr)
-1.6
-1.2
-0.8
-0.4
0.0
Z
NGC628
age = 5 Gyr
5 10 15τ (Gyr)
-1.6
-1.2
-0.8
-0.4
0.0
Z
NGC772
age = 5 Gyr
5 10 15τ (Gyr)
-1.6
-1.2
-0.8
-0.4
0.0
Z
NGC864
age = 5 Gyr
5 10 15τ (Gyr)
-1.6
-1.2
-0.8
-0.4
0.0
Z
NGC1042
age = 5 Gyr
5 10 15τ (Gyr)
-1.6
-1.2
-0.8
-0.4
0.0
Z
NGC2805
age = 5 Gyr
5 10 15τ (Gyr)
-1.6
-1.2
-0.8
-0.4
0.0
Z
NGC488
age = 10 Gyr
5 10 15τ (Gyr)
-1.6
-1.2
-0.8
-0.4
0.0
Z
NGC628
age = 10 Gyr
5 10 15τ (Gyr)
-1.6
-1.2
-0.8
-0.4
0.0
ZNGC772
age = 10 Gyr
5 10 15τ (Gyr)
-1.6
-1.2
-0.8
-0.4
0.0
Z
NGC864
age = 10 Gyr
5 10 15τ (Gyr)
-1.6
-1.2
-0.8
-0.4
0.0
Z
NGC1042
age = 10 Gyr
5 10 15τ (Gyr)
-1.6
-1.2
-0.8
-0.4
0.0
Z
NGC2805
age = 10 Gyr
5 10 15τ (Gyr)
-1.6
-1.2
-0.8
-0.4
0.0
Z
NGC488
age = 18 Gyr
5 10 15τ (Gyr)
-1.6
-1.2
-0.8
-0.4
0.0
Z
NGC628
age = 18 Gyr
5 10 15τ (Gyr)
-1.6
-1.2
-0.8
-0.4
0.0
Z
NGC772
age = 18 Gyr
5 10 15τ (Gyr)
-1.6
-1.2
-0.8
-0.4
0.0
Z
NGC864
age = 18 Gyr
5 10 15τ (Gyr)
-1.6
-1.2
-0.8
-0.4
0.0
ZNGC1042
age = 18 Gyr
5 10 15τ (Gyr)
-1.6
-1.2
-0.8
-0.4
0.0
Z
NGC2805
age = 18 Gyr
5 10 15τ (Gyr)
5
10
15
age
(Gyr
)
NGC488
5 10 15τ (Gyr)
5
10
15
age
(Gyr
)
NGC628
5 10 15τ (Gyr)
5
10
15
age
(Gyr
)
NGC772
5 10 15τ (Gyr)
5
10
15
age
(Gyr
)
NGC864
5 10 15τ (Gyr)
5
10
15
age
(Gyr
)
NGC1042
5 10 15τ (Gyr)
5
10
15
age
(Gyr
)
NGC2805
Figure 3.21a: ∆χ2 contours. First column: projections of the 1-, 2- and 3-σ ∆χ2 contours on the (τ -metallicity)plane for the central aperture of NGC 488, for different fixed ages in the fit (5 Gyr, first row, 10 Gyr, second row,18 Gyr, third row); projections of the 1-, 2- and 3-σ ∆χ2 contours on the (τ -age) plane for the central aperture ofNGC 488, for the fit performed with free age, τ and metallicity, fourth row; second to fifth column: as in the firstcolumn, for NGC 628, 772, 864, 1042 and 2805; in all plots, the filled circle indicates the best-fitting model. Theseplots demonstrate that for NGC 488, 628 and 772 we can exclude at a high confidence level a constant star formationscenario, while, for example, for NGC 2805 high values of τ are not highly unlikely at all ages.

SUMMARY AND CONCLUSIONS 87
5 10 15τ (Gyr)
-1.6
-1.2
-0.8
-0.4
0.0
Z
NGC2964
age = 5 Gyr
5 10 15τ (Gyr)
-1.6
-1.2
-0.8
-0.4
0.0
Z
NGC3346
age = 5 Gyr
5 10 15τ (Gyr)
-1.6
-1.2
-0.8
-0.4
0.0
Z
NGC3423
age = 5 Gyr
5 10 15τ (Gyr)
-1.6
-1.2
-0.8
-0.4
0.0
Z
NGC3949
age = 5 Gyr
5 10 15τ (Gyr)
-1.6
-1.2
-0.8
-0.4
0.0
Z
NGC4030
age = 5 Gyr
5 10 15τ (Gyr)
-1.6
-1.2
-0.8
-0.4
0.0
Z
NGC4102
age = 5 Gyr
5 10 15τ (Gyr)
-1.6
-1.2
-0.8
-0.4
0.0
Z
NGC2964
age = 10 Gyr
5 10 15τ (Gyr)
-1.6
-1.2
-0.8
-0.4
0.0
Z
NGC3346
age = 10 Gyr
5 10 15τ (Gyr)
-1.6
-1.2
-0.8
-0.4
0.0
Z
NGC3423
age = 10 Gyr
5 10 15τ (Gyr)
-1.6
-1.2
-0.8
-0.4
0.0
Z
NGC3949
age = 10 Gyr
5 10 15τ (Gyr)
-1.6
-1.2
-0.8
-0.4
0.0
Z
NGC4030
age = 10 Gyr
5 10 15τ (Gyr)
-1.6
-1.2
-0.8
-0.4
0.0
Z
NGC4102
age = 10 Gyr
5 10 15τ (Gyr)
-1.6
-1.2
-0.8
-0.4
0.0
Z
NGC2964
age = 18 Gyr
5 10 15τ (Gyr)
-1.6
-1.2
-0.8
-0.4
0.0
Z
NGC3346
age = 18 Gyr
5 10 15τ (Gyr)
-1.6
-1.2
-0.8
-0.4
0.0
Z
NGC3423
age = 18 Gyr
5 10 15τ (Gyr)
-1.6
-1.2
-0.8
-0.4
0.0
Z
NGC3949
age = 18 Gyr
5 10 15τ (Gyr)
-1.6
-1.2
-0.8
-0.4
0.0
Z
NGC4030
age = 18 Gyr
5 10 15τ (Gyr)
-1.6
-1.2
-0.8
-0.4
0.0Z
NGC4102
age = 18 Gyr
5 10 15τ (Gyr)
5
10
15
age
(Gyr
)
NGC2964
5 10 15τ (Gyr)
5
10
15
age
(Gyr
)
NGC3346
5 10 15τ (Gyr)
5
10
15
age
(Gyr
)
NGC3423
5 10 15τ (Gyr)
5
10
15
age
(Gyr
)
NGC3949
5 10 15τ (Gyr)
5
10
15
age
(Gyr
)
NGC4030
5 10 15τ (Gyr)
5
10
15
age
(Gyr
)
NGC4102
Figure 3.21b: As in Fig. 3.21a, for NGC 2964, 3346, 3423, 3949, 4030 and 4102.

88 CHAPTER 3: LINE-STRENGTHS OF LATE-TYPE SPIRALS OBSERVED WITH SAURON
5 10 15τ (Gyr)
-1.6
-1.2
-0.8
-0.4
0.0
Z
NGC4254
age = 5 Gyr
5 10 15τ (Gyr)
-1.6
-1.2
-0.8
-0.4
0.0
Z
NGC4487
age = 5 Gyr
5 10 15τ (Gyr)
-1.6
-1.2
-0.8
-0.4
0.0
Z
NGC4775
age = 5 Gyr
5 10 15τ (Gyr)
-1.6
-1.2
-0.8
-0.4
0.0
Z
NGC5585
age = 5 Gyr
5 10 15τ (Gyr)
-1.6
-1.2
-0.8
-0.4
0.0
Z
NGC5668
age = 5 Gyr
5 10 15τ (Gyr)
-1.6
-1.2
-0.8
-0.4
0.0
Z
NGC5678
age = 5 Gyr
5 10 15τ (Gyr)
-1.6
-1.2
-0.8
-0.4
0.0
Z
NGC4254
age = 10 Gyr
5 10 15τ (Gyr)
-1.6
-1.2
-0.8
-0.4
0.0
Z
NGC4487
age = 10 Gyr
5 10 15τ (Gyr)
-1.6
-1.2
-0.8
-0.4
0.0
Z
NGC4775
age = 10 Gyr
5 10 15τ (Gyr)
-1.6
-1.2
-0.8
-0.4
0.0
Z
NGC5585
age = 10 Gyr
5 10 15τ (Gyr)
-1.6
-1.2
-0.8
-0.4
0.0
Z
NGC5668
age = 10 Gyr
5 10 15τ (Gyr)
-1.6
-1.2
-0.8
-0.4
0.0
Z
NGC5678
age = 10 Gyr
5 10 15τ (Gyr)
-1.6
-1.2
-0.8
-0.4
0.0
Z
NGC4254
age = 18 Gyr
5 10 15τ (Gyr)
-1.6
-1.2
-0.8
-0.4
0.0
Z
NGC4487
age = 18 Gyr
5 10 15τ (Gyr)
-1.6
-1.2
-0.8
-0.4
0.0
Z
NGC4775
age = 18 Gyr
5 10 15τ (Gyr)
-1.6
-1.2
-0.8
-0.4
0.0
Z
NGC5585
age = 18 Gyr
5 10 15τ (Gyr)
-1.6
-1.2
-0.8
-0.4
0.0
Z
NGC5668
age = 18 Gyr
5 10 15τ (Gyr)
-1.6
-1.2
-0.8
-0.4
0.0Z
NGC5678
age = 18 Gyr
5 10 15τ (Gyr)
5
10
15
age
(Gyr
)
NGC4254
5 10 15τ (Gyr)
5
10
15
age
(Gyr
)
NGC4487
5 10 15τ (Gyr)
5
10
15
age
(Gyr
)
NGC4775
5 10 15τ (Gyr)
5
10
15
age
(Gyr
)
NGC5585
5 10 15τ (Gyr)
5
10
15
age
(Gyr
)
NGC5668
5 10 15τ (Gyr)
5
10
15
age
(Gyr
)
NGC5678
Figure 3.21c: As in Fig. 3.21a, for NGC 4254, 4487, 4775, 5585, 5668 and 5678.

RADIAL BEHAVIOUR 89
NGC488
0 5 10 15 20 25r (arcsec)
1.41.61.82.02.2
Hβ
(Å)
NGC488
0 5 10 15 20 25r (arcsec)
5.05.25.45.65.86.06.26.4
Fe50
15 (Å
)
NGC488
0 5 10 15 20 25r (arcsec)
3.84.04.24.44.64.8
Mgb
(Å)
NGC488
0 5 10 15 20 25r (arcsec)
2468
1012
age
(Gyr
)
NGC488
0 5 10 15 20 25r (arcsec)
−0.20.00.20.40.6
Z
NGC488
0 5 10 15 20 25r (arcsec)
0.00.10.20.30.4
[Mg/
Fe]
NGC628
0 5 10 15 20 25r (arcsec)
2.02.22.42.62.83.0
Hβ
(Å)
NGC628
0 5 10 15 20 25r (arcsec)
3.54.04.55.05.5
Fe50
15 (Å
)
NGC628
0 5 10 15 20 25r (arcsec)
2.02.22.42.62.8
Mgb
(Å)
NGC628
0 5 10 15 20 25r (arcsec)
02468
1012
age
(Gyr
)
NGC628
0 5 10 15 20 25r (arcsec)
−0.6−0.4−0.2
0.00.20.4
Z
NGC628
0 5 10 15 20 25r (arcsec)
−0.3−0.2−0.1
0.00.10.20.3
[Mg/
Fe]
NGC772
0 5 10 15 20 25r (arcsec)
2.02.5
3.0
3.5
Hβ
(Å)
NGC772
0 5 10 15 20 25r (arcsec)
4.04.55.05.56.0
Fe50
15 (Å
)
NGC772
0 5 10 15 20 25r (arcsec)
2.42.62.83.03.23.43.6
Mgb
(Å)
NGC772
0 5 10 15 20 25r (arcsec)
12345
age
(Gyr
)
NGC772
0 5 10 15 20 25r (arcsec)
−0.4−0.2
0.00.20.4
Z
NGC772
0 5 10 15 20 25r (arcsec)
−0.2−0.10.00.10.20.30.4
[Mg/
Fe]
NGC864
0 5 10 15 20 25r (arcsec)
2.02.53.03.54.0
Hβ
(Å)
NGC864
0 5 10 15 20 25r (arcsec)
2.53.03.54.04.5
Fe50
15 (Å
)
NGC864
0 5 10 15 20 25r (arcsec)
1.41.61.82.02.22.42.6
Mgb
(Å)
NGC864
0 5 10 15 20 25r (arcsec)
02468
1012
age
(Gyr
)
NGC864
0 5 10 15 20 25r (arcsec)
−1.4−1.2−1.0−0.8−0.6−0.4−0.20.0
Z
NGC864
0 5 10 15 20 25r (arcsec)
−0.20.00.20.40.6
[Mg/
Fe]
NGC1042
0 5 10 15 20r (arcsec)
1.52.02.53.03.54.0
Hβ
(Å)
NGC1042
0 5 10 15 20r (arcsec)
3.63.84.04.24.44.64.85.0
Fe50
15 (Å
)
NGC1042
0 5 10 15 20r (arcsec)
1.82.02.22.42.62.83.0
Mgb
(Å)
NGC1042
0 5 10 15 20r (arcsec)
02468
10
age
(Gyr
)
NGC1042
0 5 10 15 20r (arcsec)
−0.8−0.6−0.4−0.2
0.00.20.4
Z
NGC1042
0 5 10 15 20r (arcsec)
−0.4−0.2
0.00.20.40.6
[Mg/
Fe]
NGC2805
0 5 10 15 20r (arcsec)
2.62.83.03.23.4
Hβ
(Å)
NGC2805
0 5 10 15 20r (arcsec)
2.83.03.23.43.63.84.04.2
Fe50
15 (Å
)
NGC2805
0 5 10 15 20r (arcsec)
1.61.82.02.22.4
Mgb
(Å)
NGC2805
0 5 10 15 20r (arcsec)
123456
age
(Gyr
)
NGC2805
0 5 10 15 20r (arcsec)
−1.0−0.8−0.6−0.4−0.2
0.0
Z
NGC2805
0 5 10 15 20r (arcsec)
−0.20.00.20.40.6
[Mg/
Fe]
Figure 3.Aa: Azimuthally averaged radial profiles of the line-strength indices Hβ, Fe5015, Mgb,(expressed as equivalent widths and measured in A) and of the one-SSP analysis parameters age (inGyr), metallicity and abundance ratio against galactocentric distance (expressed in arcsec); every rowpresents a different galaxy. See text in Appendix 3.A for a more detailed description. Here we showNGC 488, NGC 628, NGC 772, NGC 864, NGC 1042 and NGC 2805.
3.A RADIAL BEHAVIOURWe briefly investigated the radial variations of the line-strength indices and age, metallicityand abundance ratios. From the corresponding maps, we calculated radial profiles of Hβ,Fe5015, Mgb and age, Z and [Mg/Fe] from the one-SSP approach, by averaging the mapson concentric annuli of 0.′′8 width. We present these profiles in Figs. 3.Aa-3.Ac. Theseplots show that there is a wide variety of radial behaviours among late-type spirals: the line-strength indices can be roughly constant in radius (Hβ profile for NGC 488), rising outwards(even very steeply, see for example the Hβ profile for NGC 5678), rising inwards (manyFe5015 and Mgb profiles). In some cases there are also complicated structures, with ‘oscil-lating’ profiles: see for example the Fe5015 profile for NGC 864 or NGC 2805 and severalothers. Some of the ‘oscillating’ profiles might just reflect the noisy nature of the data forsome low-surface brightness objects (for example: the Fe5015 profile for NGC 2805), butothers are probably related to real variations of the indices within the galaxy. Despite allthis variety, we conclude that in most cases the Hβ absorption strength increases with radius,while Fe5015 and Mgb decrease. The fact that the metal lines show most often negativegradients was already known for early-type galaxies, while in the case of Hβ for elliptical

90 CHAPTER 3: LINE-STRENGTHS OF LATE-TYPE SPIRALS OBSERVED WITH SAURON
NGC2964
0 5 10 15 20 25r (arcsec)
2.53.03.54.04.5
Hβ
(Å)
NGC2964
0 5 10 15 20 25r (arcsec)
3.03.23.43.63.84.04.2
Fe50
15 (Å
)
NGC2964
0 5 10 15 20 25r (arcsec)
1.41.61.82.02.22.42.6
Mgb
(Å)
NGC2964
0 5 10 15 20 25r (arcsec)
012345
age
(Gyr
)
NGC2964
0 5 10 15 20 25r (arcsec)
−1.0−0.8−0.6−0.4−0.2
0.0
Z
NGC2964
0 5 10 15 20 25r (arcsec)
−0.2−0.10.00.10.20.30.40.5
[Mg/
Fe]
NGC3346
0 5 10 15 20 25r (arcsec)
2.02.53.03.54.0
Hβ
(Å)
NGC3346
0 5 10 15 20 25r (arcsec)
3.23.43.63.84.04.2
Fe50
15 (Å
)
NGC3346
0 5 10 15 20 25r (arcsec)
1.41.61.82.02.22.42.6
Mgb
(Å)
NGC3346
0 5 10 15 20 25r (arcsec)
012345
age
(Gyr
)
NGC3346
0 5 10 15 20 25r (arcsec)
−1.0−0.8−0.6−0.4−0.2
0.0
Z
NGC3346
0 5 10 15 20 25r (arcsec)
−0.10.00.10.20.30.40.5
[Mg/
Fe]
NGC3423
0 5 10 15 20 25r (arcsec)
2.53.03.54.04.5
Hβ
(Å)
NGC3423
0 5 10 15 20 25r (arcsec)
3.03.54.04.55.0
Fe50
15 (Å
)
NGC3423
0 5 10 15 20 25r (arcsec)
1.21.41.61.82.02.22.4
Mgb
(Å)
NGC3423
0 5 10 15 20 25r (arcsec)
1.01.52.02.53.03.5
age
(Gyr
)
NGC3423
0 5 10 15 20 25r (arcsec)
−0.8−0.6−0.4−0.2
0.0
Z
NGC3423
0 5 10 15 20 25r (arcsec)
−0.2−0.10.00.10.20.30.4
[Mg/
Fe]
NGC3949
0 5 10 15 20 25r (arcsec)
3.63.84.04.24.44.64.8
Hβ
(Å)
NGC3949
0 5 10 15 20 25r (arcsec)
1.52.02.53.03.54.0
Fe50
15 (Å
)
NGC3949
0 5 10 15 20 25r (arcsec)
0.81.01.21.41.61.82.0
Mgb
(Å)
NGC3949
0 5 10 15 20 25r (arcsec)
0.51.01.52.02.53.0
age
(Gyr
)
NGC3949
0 5 10 15 20 25r (arcsec)
−1.2−1.0−0.8−0.6−0.4−0.2
0.0
Z
NGC3949
0 5 10 15 20 25r (arcsec)
−0.10.00.10.20.30.4
[Mg/
Fe]
NGC4030
0 5 10 15 20 25r (arcsec)
2.62.83.03.23.43.6
Hβ
(Å)
NGC4030
0 5 10 15 20 25r (arcsec)
3.54.04.55.05.5
Fe50
15 (Å
)
NGC4030
0 5 10 15 20 25r (arcsec)
1.82.02.22.42.62.83.03.2
Mgb
(Å)
NGC4030
0 5 10 15 20 25r (arcsec)
1.21.41.61.82.0
age
(Gyr
)
NGC4030
0 5 10 15 20 25r (arcsec)
−0.4−0.2
0.00.20.4
Z
NGC4030
0 5 10 15 20 25r (arcsec)
−0.2−0.1
0.00.10.20.3
[Mg/
Fe]
NGC4102
0 5 10 15 20 25r (arcsec)
2.62.83.03.23.43.6
Hβ
(Å)
NGC4102
0 5 10 15 20 25r (arcsec)
3.43.63.84.04.2
Fe50
15 (Å
)
NGC4102
0 5 10 15 20 25r (arcsec)
1.61.82.02.22.42.6
Mgb
(Å)
NGC4102
0 5 10 15 20 25r (arcsec)
1.01.52.02.53.03.5
age
(Gyr
)
NGC4102
0 5 10 15 20 25r (arcsec)
−0.5−0.4−0.3−0.2−0.1
0.00.1
Z
NGC4102
0 5 10 15 20 25r (arcsec)
−0.20.00.20.40.6
[Mg/
Fe]
Figure 3.Ab: Same as Fig. 3.Aa for NGC 2964, NGC 3346, NGC 3423, NGC 3949, NGC 4030 andNGC 4102.
galaxies the gradients are consistent with a flat relation with radius, or present a mild positiveoutwards radial gradient (see Paper VI and references therein).
The stellar population parameters show the same heterogeneous behaviours. Roughly,the age shows most often a complex behaviour with radius, reflecting features recognizablein the maps in Figs. 3.6a-3.6i, while the metallicity in many cases is decreasing, in agreementwith Moorthy & Holtzman (2006), who measure mostly negative metallicity gradients for asample of S0-Sc galaxies; in the majority of the galaxies, the metallicity profile resemblesclosely the aspect of the Fe5015 profile. Looking at the abundance ratio profiles in moredetail, we see that the central values are usually very close to solar; many of the profiles stayapproximately constant with radius, after an initial increase in the bulge-dominated region,which can be very tiny (for a quantitative description of the bulges in these galaxies, we referthe reader to Chapter 4). This is also consistent with the findings of Moorthy & Holtzman(2006), that we briefly summarized in Section 3.5.1: they suggest that the bulges have pos-itive or null gradients in abundance ratio with increasing radius, while the discs have solarabundance ratios. In early-type galaxies, instead, the radial profiles of abundance ratios arerather flat, as found by Kuntschner et al. (paper in preparation) for the SAURON E/S0 galaxiesand by Sanchez–Blazquez et al. (2007) for a sample of 11 E/S0 galaxies; the latter authors dofind radial abundance ratio gradients, both positive and negative, but rather shallow.

INDIVIDUAL GALAXIES 91
NGC4254
0 5 10 15 20 25r (arcsec)
2.42.62.83.03.23.43.63.84.0
Hβ
(Å)
NGC4254
0 5 10 15 20 25r (arcsec)
3.23.43.63.84.04.24.44.6
Fe50
15 (Å
)
NGC4254
0 5 10 15 20 25r (arcsec)
1.41.61.82.02.22.42.62.8
Mgb
(Å)
NGC4254
0 5 10 15 20 25r (arcsec)
1.01.21.41.61.82.02.22.4
age
(Gyr
)
NGC4254
0 5 10 15 20 25r (arcsec)
−0.8−0.6−0.4−0.2
0.00.2
Z
NGC4254
0 5 10 15 20 25r (arcsec)
−0.3−0.2−0.1
0.00.10.20.30.4
[Mg/
Fe]
NGC4487
0 5 10 15 20r (arcsec)
3.03.23.43.63.84.04.24.4
Hβ
(Å)
NGC4487
0 5 10 15 20r (arcsec)
2.22.42.62.83.03.23.4
Fe50
15 (Å
)
NGC4487
0 5 10 15 20r (arcsec)
1.21.41.61.82.02.2
Mgb
(Å)
NGC4487
0 5 10 15 20r (arcsec)
012345
age
(Gyr
)
NGC4487
0 5 10 15 20r (arcsec)
−1.4−1.2−1.0−0.8−0.6−0.4−0.20.0
Z
NGC4487
0 5 10 15 20r (arcsec)
−0.20.00.20.40.6
[Mg/
Fe]
NGC4775
0 5 10 15 20 25r (arcsec)
3.23.43.63.84.04.2
Hβ
(Å)
NGC4775
0 5 10 15 20 25r (arcsec)
2.02.22.42.62.83.03.23.4
Fe50
15 (Å
)
NGC4775
0 5 10 15 20 25r (arcsec)
1.01.21.41.61.82.0
Mgb
(Å)
NGC4775
0 5 10 15 20 25r (arcsec)
1.01.52.02.53.03.54.0
age
(Gyr
)
NGC4775
0 5 10 15 20 25r (arcsec)
−1.2−1.0−0.8−0.6−0.4
Z
NGC4775
0 5 10 15 20 25r (arcsec)
−0.20.00.20.40.6
[Mg/
Fe]
NGC5585
0 5 10 15 20r (arcsec)
3.03.23.43.63.84.04.2
Hβ
(Å)
NGC5585
0 5 10 15 20r (arcsec)
1.82.02.22.42.62.83.03.2
Fe50
15 (Å
)
NGC5585
0 5 10 15 20r (arcsec)
0.81.01.21.41.61.8
Mgb
(Å)
NGC5585
0 5 10 15 20r (arcsec)
1234567
age
(Gyr
)
NGC5585
0 5 10 15 20r (arcsec)
−1.6−1.4−1.2−1.0−0.8−0.6−0.4−0.2
Z
NGC5585
0 5 10 15 20r (arcsec)
−0.4−0.2
0.00.20.40.6
[Mg/
Fe]
NGC5668
0 5 10 15 20 25r (arcsec)
3.43.63.84.04.24.44.6
Hβ
(Å)
NGC5668
0 5 10 15 20 25r (arcsec)
2.02.53.03.54.0
Fe50
15 (Å
)
NGC5668
0 5 10 15 20 25r (arcsec)
0.81.01.21.41.61.82.0
Mgb
(Å)
NGC5668
0 5 10 15 20 25r (arcsec)
0.51.01.52.02.5
age
(Gyr
)
NGC5668
0 5 10 15 20 25r (arcsec)
−1.2−1.0−0.8−0.6−0.4−0.2
0.0
Z
NGC5668
0 5 10 15 20 25r (arcsec)
−0.4−0.2
0.00.20.40.6
[Mg/
Fe]
NGC5678
0 5 10 15 20 25r (arcsec)
2.02.53.03.54.04.5
Hβ
(Å)
NGC5678
0 5 10 15 20 25r (arcsec)
3.03.54.04.55.0
Fe50
15 (Å
)
NGC5678
0 5 10 15 20 25r (arcsec)
1.41.61.82.02.22.42.62.8
Mgb
(Å)
NGC5678
0 5 10 15 20 25r (arcsec)
0.51.01.52.02.53.0
age
(Gyr
)
NGC5678
0 5 10 15 20 25r (arcsec)
−0.8−0.6−0.4−0.2
0.00.2
Z
NGC5678
0 5 10 15 20 25r (arcsec)
−0.2−0.10.00.10.20.30.4
[Mg/
Fe]
Figure 3.Ac: Same as Fig. 3.Aa for NGC 4254, NGC 4487, NGC 4775, NGC 5585, NGC 5668 andNGC 5678.
3.B INDIVIDUAL GALAXIESNGC 488NGC 488 is an unbarred Sb galaxy and it is the most elliptical-like (featureless) object withinour sample. NGC 488 has regular stellar and gaseous kinematics, with regular rotation and ve-locity dispersion smoothly decreasing outwards (Chapter 2). The line-strength maps presenthigh values for Fe5015 and Mgb and low values for Hβ over the central regions. As one cannotice from the values reported in Table 3.2, this galaxy has the highest Fe5015 and Mgb inthe sample, and the lowest Hβ. The ages are mainly old and the metallicities high. This isindeed the most metal-rich galaxy in the sample (the central metallicity from the one-SSPapproach is ≈ 0.49, then it decreases outwards). This galaxy is well described by a one-SSP:as shown in Fig. 3.21a (first column) on the basis of our continuous star formation analy-sis, NGC 488 is very unlikely to have experienced a constant star formation over time; theobserved indices are instead reproduced by a short starburst, approximating a SSP. The time-scale of star formation τ is short over the whole field. From the profiles in Fig. 3.Aa we cansee that the [Mg/Fe] profile is approximatively constant around the value ≈ 0.2: abundanceratios are slightly super-solar, confirming the fact that this galaxy resembles an elliptical morethan the later objects in our sample. Other suggestions in this sense come from the positionit occupies in the diagrams in Figs. 3.7, 3.8, 3.11, where it lies in the region occupied by theellipticals.

92 CHAPTER 3: LINE-STRENGTHS OF LATE-TYPE SPIRALS OBSERVED WITH SAURON
NGC 628
NGC 628, known also as M74, is a grand-design Sc galaxy. Cornett et al. (1994) concludedthat the star formation history of NGC 628 varies with galactocentric distance; Natali, Pedi-chini & Righini (1992) suggested that the galaxy could be seen as an inner and an outer disccharacterised by different stellar populations; according to them, the transition between thetwo regions is located at ≈ 8-10 kpc from the centre. Our observations of NGC 628 are dis-turbed by the presence of a foreground star which falls close to the centre (≈ 13′′ southern).The stellar kinematics is characterised by slow projected rotation, and velocity dispersion de-creasing in the central zones, indicating a cold central region, maybe an inner disc (Chapter2). This galaxy is part of the ‘control sample’ of non-active objects studied by Cid-Fernandeset al. (2004), Gonzalez Delgado et al. (2004), Cid-Fernandes et al. (2005), who analyse thenuclear spectrum, describing it as a mixture of 108-109 yr-old and older stars.
As can be seen from the profiles reported in Fig. 3.Aa, NGC 628 has ages (one-SSPapproach) below 3 Gyr out to ≈ 15′′, and becomes older at larger radius; the features areroughly in agreement with the above mentioned findings of Cid-Fernandes and collaborators;the same trend in age is observed, on the common radial range, also by MacArthur et al.(2007), on the basis of GMOS data independently analysed. The metallicity decreases out-wards. The ‘bumps’ recognizable in the Fe5015, Mgb and (but less pronounced) metallicityprofiles at ≈ 13′′ from the centre are due to the foreground star. From our continuous starformation analysis, as shown in Fig. 3.21a (second column), we can state that this galaxy isnot described by a constant star formation scenario.
NGC 772
NGC 772, also called Arp78, is an Sb galaxy characterised by a particularly strong spiralarm; it forms a pair at 3.′3 with the E3 galaxy NGC 770. From the kinematical point ofview, NGC 772 is characterised by a clear drop of the stellar velocity dispersion in the centralzones, possibly corresponding to an inner disc, as suggested also by the anticorrelation be-tween velocity and the Gauss-Hermite moment h3 (Chapter 2). In the line-strength maps wecan clearly see an extended central region with high Fe5015 and Mgb and low Hβ; indeed,from the central aperture values reported in Table 3.2 we can see that this galaxy is one ofthose with the highest metal indices, surpassed only by NGC 488. In the Hβ map it is pos-sible to see, surrounding the central depression, regions with higher values corresponding tothe spiral arms. A similar behaviour can be seen in the [OIII]/Hβ map presented in Chapter2 (and in the Colour Appendix to the Thesis), which shows a structure resembling the spiralpattern. Estimating ages and metallicity by comparison with SSP models, we infer that agesare mainly young-intermediate and the central metallicity is among the highest in our sam-ple. The age and abundance ratio maps display the spiral arms structure as well, like the indexmaps. Fig. 3.21a (third column) demonstrates that for this galaxy constant star formation canbe ruled out at a high confidence level: high τ values are never likely. The τ map shown inFig. 3.6b (for age fixed to 10 Gyr in the fitting procedure) presents a spatial structure thatpartially resembles the Hβ map and the spiral arms pattern. NGC 772 is part of the samplestudied in the series of papers by Cid Fernandes et al. (Cid-Fernandes et al. 2004, GonzalezDelgado et al. 2004, Cid-Fernandes et al. 2005), who are engaged in a project to examinethe stellar populations of low-luminosity active galactic nuclei. They classify this object as‘young-TO’, i.e. a transition object between a LINER and an HII nucleus, with weak [O I]
INDIVIDUAL GALAXIES 93
λ6300 emission; they find that the nuclear spectrum is dominated by 108-109 yr-old stellarpopulations, with a contribution up to ≈ 32 percent from populations younger than 107 yrand a similar contribution also from older stellar populations (≥ 109 yr). Their data probedistances up to several hundred parsecs from the nucleus; they measure in NGC 772 signif-icant radial variations of the stellar populations, with absorption line-strengths increasing inthe inner 3′′ indicating a younger population in the very centre, especially referring to theCa II K line; the Mg I absorption strength presents instead less prominent variations over thespatial range of their data. Our data cover a different spectral range and a different spatial ex-tension, but we also concluded that the populations in the inner parts have intermediate ages,and that the age (from the one-SSP analysis) increases in the inner ≈ 5′′ (see Fig. 3.Aa).
NGC 864
This is a barred Sc galaxy where a nuclear radio source with the linear size of ≈ 300 pc hasbeen detected (Ulvestad & Ho 2002); according to Espada et al. (2005) its HI profile is sym-metric in velocity but asymmetric in intensity; they also measure large-scale asymmetries inthe two-dimensional kinematics, such as a warp. The mentioned asymmetries occur in theouter parts, well beyond the extent of the SAURON field. The asymmetries could have beeninduced by a past encounter with a companion, passing outside the optical disc but withinthe HI disc; the companion would have dispersed its stars and dark matter after the merging,consistent with the fact that NGC 864 appears to be remarkably isolated.
Our line-strength maps show a very sharp central dip in both Fe5015 and Mgb; in theregion surrounding the dip, the Fe5015 and Mgb values rise. The Hβ absorption also takeson low values over an extended central region; as seen also in Table 3.2, the indices measuredon the central aperture of this galaxy are among the lowest in the sample. From the one-SSPanalysis, given the structure of the line-strength maps, we derive very low metallicity and old(≈ 11.22 Gyr) ages for the central aperture.
The analysis of the ∆χ2 contours, in the continuous star formation approach, shows thatthis galaxy is unlikely to have experienced a constant star formation over time (see Fig. 3.21a,fourth column).
NGC 1042
NGC 1042 is an Scd galaxy forming a pair with NGC 1035 at a separation of 22′ (corre-sponding to 177 kpc). It has a bright, small nucleus and otherwise low surface brightness.Our line-strength maps are quite patchy, due to poor S/N in the data and consequent heavybinning of the spectra. The Mgb index takes on low values in the very centre, and higherones around it. Hβ is high in the centre and low outside it, being flat over most of the map;as can be seen also from the line-strength profiles in Fig. 3.Aa, the line-strength indices stayapproximately constant over most of the field, outside a central zone of radius ≈ 3′′. The ageof the stellar populations (one-SSP analysis) reaches a minimum in the centre. The metallic-ity is everywhere low, and peaks in the centre.
The analysis of the ∆χ2 contours for the central aperture, in the continuous star forma-tion approach, shows that this galaxy is not well described by an SSP (see Fig. 3.21a, fifthcolumn). The τ map for age fixed to 10 Gyr (see Fig. 3.6c) shows a peak in the very centre,corresponding to the peak in the Hβ and to the minimum in the Mgb maps.

94 CHAPTER 3: LINE-STRENGTHS OF LATE-TYPE SPIRALS OBSERVED WITH SAURON
NGC 2805NGC 2805 is an Sd galaxy seen nearly face-on and it is the brightest member of a multipleinteracting system containing also NGC 2814 (Sb), NGC 2820 (Sc) at 13′ and IC2458 (I0).HI has been detected (Reakes 1979, Bosma et al. 1980) and there are claims that the outer HIlayers are warped (see for example Bosma et al. 1980). The galaxy seems to be also opticallydisturbed, since the spiral arms appear to be broken up into straight segments.
The line-strength maps are rather patchy, displaying though a central peak in all threelines. By comparison of our measured indices with SSP models, we can state that the agesare young-intermediate over most of the field; that the metallicity peaks in the centre and thatabundance ratios are super-solar.
The analysis of the ∆χ2 contours, in the continuous star formation approach, shows thatthis galaxy is not very well described by an SSP, and that even a constant star formation ratecannot be excluded at all ages (see Fig. 3.21a, sixth column).
NGC 2964NGC 2964, classified as Sbc, forms a non-interacting pair with the I0 galaxy NGC 2968 at5.′8. As discussed in Chapter 2, the SAURON data reveal that this barred Sbc galaxy hostsan active galactic nucleus. When we measure the line-strengths, we find that the Mgb indexassumes low values in an elongated central region, higher values around it, and low valuesagain towards the edges of the field; the Fe5015 index presents a very similar behaviour; theHβ map has instead an opposite appearance, with an extended inner region with low indexvalues and a surrounding area with higher values; in the very centre a shallow peak mightbe recognized. These features are recognizable also in the profiles in Fig. 3.Ab. We noticealso that the central region with low Fe5015 and Mgb corresponds to the central depressionin the emission-line [OIII]/Hβ map (see Fig. 2.5.g in Chapter 2/Colour Appendix), possiblyindicating ongoing star formation. Converting the line-strength maps to age and metallicityvia our comparison with the SSP models, we find young-intermediate ages over most of thefield, with a peak in the central region, and low metallicity everywhere, with a minimum inthe central region, a positive gradient out to ≈ 5′′, and then a rather constant behaviour out to≈ 15′′. From the continuous star formation approach, we cannot exclude at all ages the caseof constant star formation, but the τ map for age fixed to 10 Gyr (in the fitting procedure)presents a large central region with low values, possibly suggesting a ≈ 5 Gyr long starburst.
NGC 3346This Scd galaxy is very poorly studied in the literature. Ages of the stellar populations (one-SSP approach) are young-intermediate and metallicity low over most of the field. From thecontinuous star formation approach, we cannot exclude at all ages the case of constant starformation (see Fig. 3.21b, second column).
NGC 3423This Sbc galaxy is also poorly known. Both the Fe5015 and Mgb indices peak in an extendedcentral region and decrease towards the edge of the field; the Hβ map presents opposite be-haviour. The τ map (for age fixed to 10 Gyr in the fitting procedure) displays low values overa large central area, possibly indicating a region where the bulk of star formation happenedin a quite short starburst.

INDIVIDUAL GALAXIES 95
NGC 3949
NGC 3949 is an Sc galaxy belonging to the Ursa Major cluster. NGC 3949 presents quiteregular Fe5015 and Mgb line-strength maps, peaking in an extended central region and de-creasing rather smoothly moving outwards. The Hβ index is low in the central region andhigher in the surroundings; interestingly, it reaches a minimum in a zone south of the centrewhere the emission-line ratio [OIII]/Hβ is particularly depressed (see relative figure in Chap-ter 2/Colour Appendix). The values measured for the Hβ index are the highest in the sample,as one can see from Table 3.2 and from Fig. 3.Ab. Ages (from the one-SSP approach) areyoung (≈ 1.0 Gyr) in the central region, somewhat higher around it and decreasing againtowards the edge of the field. The metallicity is everywhere low, and decreasing outwards.
Constant star formation cannot be ruled out; it is likely to characterise the star formationmode over most of the field (see the τ map for age fixed to 10 Gyr in Fig. 3.6e: τ assumeshigh values). Actually, when performing the fit allowing the code to choose among exponen-tially declining and constant star formation, constant is selected over most of the field.
NGC 4030
This Sbc galaxy is characterised by very regular kinematics for both the stellar and gaseouscomponents (Chapter 2). The line-strength maps also have a smooth appearance, with Fe5015and Mgb decreasing at larger radius and Hβ increasing. The Hβ map seems to be asymmet-ric with respect to the centre, since the western side displays higher values than the easternone. The stellar populations are young over the whole field and the metallicity, among thehighest in our sample (the third after NGC 488 and 772), decreases moving outwards; theabundance ratio is approximatively solar. The τ map for age fixed to 10 Gyr in Fig. 3.6fshows a large central depression. The analysis of the ∆χ2 contours, in the continuous starformation approach, shows that this galaxy is probably not very well described by an SSP,nor by a constant star formation rate.
NGC 4102
NGC 4102 is an Sb galaxy, classified as a LINER in the NED database; it is known to be apowerful far-infrared galaxy (Young et al. 1989) and also to have a strong nuclear radio source(Condon et al. 1982). Devereux (1989) classified it as one of the most powerful nearby star-burst galaxies. The signs of activity are detectable also in the SAURON data: as noted inChapter 2, the [OIII] maps trace the outflowing gas, with a region of very high gas velocitydispersion corresponding also to high values in the [OIII]/Hβ line ratio map, as expected foran active object. In that same region, we observe double-peaked line profiles for the [OIII]emission-lines, pointing towards the presence of different components in the emitting mate-rial. As for the line-strength indices, Mgb is low in an inner region, increases around it, anddecreases again in the outer parts. The Fe5015 map is instead more centrally concentrated.The map of Hβ absorption looks more complex and not symmetric. Ages (from our one-SSPanalysis) are young all over the field and metallicity is low. Neither in the line-strength nor inthe age and metallicity map is there a clear connection with the mentioned region of activity.On the basis of our continuous star formation analysis, this galaxy is probably not very welldescribed by an SSP.

96 CHAPTER 3: LINE-STRENGTHS OF LATE-TYPE SPIRALS OBSERVED WITH SAURON
NGC 4254Also known as M99, NGC 4254 is a bright Sc galaxy located on the periphery of the Virgocluster, at a projected distance of 3.7◦ (≈ 1 Mpc) from the centre of the cluster. Its opticalappearance is dominated by a peculiar one-arm structure: the arms to the northwest are muchless defined than the southern arm. This kind of spiral structure could be related to an exter-nal driving mechanism, but for NGC 4254 there are no close companions. Phookun, Vogel &Mundy (1993) carried out deep HI observations of NGC 4254, detecting non-disc HI clouds,with velocities not following the disc velocity pattern and an extended low surface density tailnorthwest of the galaxy; they interpreted these observational results as infall of a disintegrat-ing gas cloud. They also noticed that there is an hole in the HI emission at the centre of thegalaxy, with a diameter of ≈ 3 kpc. Vollmer, Huchtmeier & van Driel (2005) propose insteada scenario where NGC 4254 had a close and rapid encounter with another massive galaxywhen entering the Virgo cluster: the tidal interaction caused the one-arm structure and the HIdistribution and kinematics is due to ram pressure stripping. Recently, Soria & Wong 2006studied the X-ray properties of M99, noticing that a phenomenon often associated with tidalinteractions and active star formation -both documented- is the presence of ultraluminous X-ray sources (ULXs). The X-ray emission appears approximatively uniformly diffused acrossthe inner ≈ 5 kpc from the nucleus. They do find a ULX, amongst the brightest observed,located at ≈ 8 kpc southeast of the nucleus, close to the position where a large HI cloudseems to join the gas disc. From observations of the radial velocities, they suggest that thecloud is falling onto the galactic disc and try to build a link between this collisional event andthe formation of the bright ULX. Our data cover a much smaller spatial extent than the men-tioned observations, therefore a comparison is not possible; within our field, both the Fe5015and Mgb maps show a regular structure with a central concentration; at the northern edge ofthe field, both Fe5015 and Mgb seem to increase again; the Hβ map has opposite behaviour,presenting a central depression. The ages (from our one-SSP approach) are generally youngand the metallicity, quite low everywhere, decreases slightly moving outwards and shows thesame enhancement at the northern edge of the field that we noticed for the Fe5015 and Mgbline-strength. The τ map (see Fig. 3.6g) shows a central depression. The analysis of the ∆χ2
contours, in the continuous star formation approach, shows that NGC 4254 is probably notvery well described by an SSP, nor by a constant star formation rate.
NGC 4487This Scd galaxy forms a pair with the Scd galaxy NGC 4504, at a separation of 35′ (corre-sponding to ≈ 165 kpc). The Fe5015 and Mgb maps seem to be low in the very centre andhigher outside it; from the profiles in Fig. 3.Ac one can see that outside the inner circle of≈ 3′′ radius, the line-strengths keep an approximately constant value, out to ≈ 13′′. Ages(one-SSP approach) are intermediate-young and metallicities very low, with respectively amaximum and a minimum in the centre. Constant star formation cannot be ruled out.
NGC 4775NGC 4775 is an Sd galaxy, for which very little is known from previous studies. The metallines (Fe5015 and Mgb) seem to be centrally concentrated, while Hβ is low over an extendedcentral area, and higher in the surrounding region. The maps are not symmetric with respectto the centre. The galaxy is young in the nucleus and has older ages in an annular (extended)

INDIVIDUAL GALAXIES 97
region around the centre; the metal content is everywhere low, and peaks in the centre. Con-stant star formation cannot be ruled out, and is selected over a large part of the field whenallowing to choose among constant and exponentially declining star formation.
NGC 5585NGC 5585 is a barred Sd galaxy; together with NGC 5204 (Sm), NGC 5474 (Scd), NGC 5477(Sm) , HoIV (Im) and M101 (Scd) it forms the M101 group. The Fe5015 and Mgb indicesassume values among the lowest in the sample; Hβ has instead a value among the highestones (see Table 3.2). The metallicity retrieved from the one-SSP analysis is everywhere verylow. In the continuous star formation approach, constant star formation cannot be ruled out;indeed, when allowing to choose among exponentially declining and constant star formation,in the χ2 minimization, for age fixed to 10 Gyr the constant star formation is selected (for thecentral aperture).
NGC 5668NGC 5668 is another Sd galaxy, which has a high rate of star formation, as indicated by itslarge far-infrared and Hα luminosities (Schulman et al. 1996, and references therein). Themetal lines (Fe5015 and Mgb) appear to be centrally concentrated, while Hβ has a morecomplex appearance. The stellar populations are young and metal poor all over the field; theage rises out to ≈ 8′′ and then decreases (see Fig. 3.6i for a full view of the spatial structureof the age map and Fig. 3.Ac for the azimuthally averaged profiles). Constant star formationcannot be ruled out at all ages, and is selected over a large part of the field when allowing tochoose among constant and exponentially declining star formation.
NGC 5678This is a barred and very dusty Sb galaxy. Fe5015 and Mgb have a quite regular and centrallyconcentrated appearance; Hβ is depressed in the inner region and increases in a annulus-like structure around it. In the very centre Hβ has a local maximum, as shown also in theazimuthally-averaged profile in Fig. 3.Ac. Ages (one-SSP approach) are young over mostof the field and the metallicity, rather low everywhere, decreases moving outwards. The τmap at age fixed to 10 Gyr (see Fig. 3.6i) shows a large central depression. The analysis ofthe ∆χ2 contours shows that NGC 5678 is probably not very well described by an SSP, norby a constant star formation rate. Like NGC 628 and 772, this galaxy is part of the samplestudied in the Cid Fernandes et al papers (Cid-Fernandes et al. 2004, Gonzalez Delgado etal. 2004, Cid-Fernandes et al. 2005); following their classification, it is a ‘young-TO’ galaxy,with weak emission in the [O I] λ6300 line; according to those authors, the nuclear spectrumis heavily dominated by 108-109 yr old stellar populations, with negligible contribution fromstars younger than 107 yr. They detect radial variations of the absorption indices, particularlyin the Ca II K line, but less clearly evident than in the case of NGC 772.

98