university of groningen imaging of the right ventricle in ... · imaging of the right ventricle in...
TRANSCRIPT

University of Groningen
Imaging of the right ventricle in congenital heart diseaseFreling, Hendrik Gerardus
IMPORTANT NOTE: You are advised to consult the publisher's version (publisher's PDF) if you wish to cite fromit. Please check the document version below.
Document VersionPublisher's PDF, also known as Version of record
Publication date:2014
Link to publication in University of Groningen/UMCG research database
Citation for published version (APA):Freling, H. G. (2014). Imaging of the right ventricle in congenital heart disease. Groningen: s.n.
CopyrightOther than for strictly personal use, it is not permitted to download or to forward/distribute the text or part of it without the consent of theauthor(s) and/or copyright holder(s), unless the work is under an open content license (like Creative Commons).
Take-down policyIf you believe that this document breaches copyright please contact us providing details, and we will remove access to the work immediatelyand investigate your claim.
Downloaded from the University of Groningen/UMCG research database (Pure): http://www.rug.nl/research/portal. For technical reasons thenumber of authors shown on this cover page is limited to 10 maximum.
Download date: 05-08-2019

Imaging of the right ventricle in congenital heart disease
Hendrik G. Freling

Freling, H.G.
Imaging of the right ventricle in congenital heart disease
ISBN: 978-90-367-6705-7
ISBN: electronic version 978-90-367-6706-4
Copyright 2013 – Hendrik Gerardus Freling
All rights are reserved. No part of this publication may be reproduced, stored in a retrieval system, or
transmitted in any form or by any means, mechanically, by photocopying, recording otherwise, without the
written permission of the author.
Cover & layout: H.G. Freling
Printed by: Gildeprint Drukkerijen, Enschede

Imaging of the right ventricle in congenital
heart disease
Proefschrift
ter verkrijging van de graad van doctor aan de
Rijksuniversiteit Groningen
op gezag van de
rector magnificus, prof. dr. E. Sterken
en volgens besluit van het College voor Promoties.
De openbare verdediging zal plaatsvinden op
woensdag 22 januari 2014 om 12.45 uur
door
Hendrik Gerardus Freling
geboren op 24 februari 1985
te IJsselstein

Promotor:
Prof. dr. D.J. van Veldhuisen
Copromotores:
Dr. T.P. Wilems
Dr. P.G. Pieper
Beoordelingscommissie:
Prof. dr. T. Ebels
Prof. dr. R.M.F. Berger
Prof. dr. A. de Roos

Financial support by the Dutch Heart Foundation for the publication of this thesis is
gratefully acknowledged. The research described in this thesis was supported by a
grant of the Dutch Heart Foundation (DHF-2013P129)
Further financial support is kindly provided by Fonds Radiologie, GUIDE, Medis
medical imaging systems bv, Rijksuniversiteit Groningen, St Jude Medical, and
Tafelronde 125 Zuid-Oost Drenthe (Matthijs Bakker, Hugo Bauerhuit, Marcel de Boer,
Thijs Boersma, Hidde de Bruin, Harm Bruning, Marcel Brust, Arjen van Ess, Robin
Mink, Roderick van Nie, Jeroen Schippers, Roderik Seubers, Simon van der Weerd,
Friso Ypma)


Contents
Chapter 1 General introduction and outline of the thesis
Chapter 2 Improved cardiac MRI volume measurements in
patients with tetralogy of Fallot by independent end-
systolic and end-diastolic phase selection
Chapter 3 Improving the reproducibility of MR-derived left
ventricular volume and function measurements with
a semi-automatic threshold-based segmentation
algorithm
Chapter 4 Impact of right ventricular endocardial trabeculae on
volumes and function assessed by CMR in patients
with tetralogy of Fallot
Chapter 5 Pressure overloaded right ventricles: a multicenter
study on the importance of trabeculae in right
ventricular function measured by CMR
Chapter 6 Effect of right ventricular outflow tract obstruction
on right ventricular volumes and exercise capacity in
patients with repaired tetralogy of Fallot
Chapter 7 Measurements of right ventricular volumes and
function in the PROSTAVA study
Chapter 8 Summary
Chapter 9 Nederlandse samenvatting
Chapter 10 Dankwoord
About the author
List of publications
8
22
38
56
72
92
110
126
132
140
142
143

8

General introduction and
outline of the thesis

10
"The philosophies of one age have become the absurdities of the next,
and the foolishness of yesterday has become the wisdom of tomorrow."
Sir William Osler

11
Historical perspective
The discovery of the anatomy and function of the right ventricle cannot be
attributed to a single person nor to a single era. Over the centuries many
erroneous ideas have been replaced with other, not necessarily correct, ideas.
Religion and superstition dominated daily life for millennia and greatly influenced
the perspective on the function of the heart and vessels. Moreover, many
physicians were above all things theologians.
Ancient Greece
The first thorough description of right ventricular anatomy can be found in the
Hippocratic Corpus, over 70 books written by Hippocrates (460-375 B.C.) and
followers [1]. “The heart is an exceedingly strong muscle, ‘muscle’ in the sense not
of ‘tendon’ but of a compressed mass of flesh. It contains in one circumference
two separate cavities, one here, the other there. These cavities are quite
dissimilar: the one on the right side lies face downwards, fitting closely against the
other. By ‘right’ I mean of course the right of the left side, since it is on the left side
that the whole heart has its seat. Furthermore this chamber is very spacious, and
much more hollow than the other. It does not extend to the extremity of the
heart, but leaves the apex solid, being as it were stitched on outside. The inside
surface of both chambers is rough, as though slightly corroded; the left more so
than the right”
The doctrine of Galen
Galen (131-201 A.D.), a brilliant physician, proved arteries contained blood and
made a coherent concept of human physiology based on dissecting animals. He
connected and integrated the vital functions of nutrition and respiration with the
function of blood and the nervous system. As he was not aware of the presence of
the circulation as we know it now, his description of the heart and vessel
comprised two open-ended systems which provided one-time distribution of
nutrients to the tissues. Absorbed food was made into blood containing ‘nutritive
spirits’ by the liver. Veins, which all had their origin in the liver, distributed these
‘nutritive spirits’ throughout the entire body. He imagined the blood in the veins
moved back and forth like tides of the sea. Part of the ‘nutritive spirits’ passed
through invisible pores in the interventricular septum from the right to the left
ventricle where it was mixed with air to form ‘vital spirits’. ‘Vital spirits’, necessary
for sustaining life and heat, were distributed by arteries. None of the blood
entering the pulmonary artery arrived in the left side of the heart, but was
Ch
ap
ter 1
G
en
era
l intro
du
ction
an
d o
utlin
e o
f the
the
sis

12
absorbed as nutrition by the lungs. So there was no separate systemic and
pulmonary circulation in which arteries and veins were connected. Galen’s theory
on human physiology dominated Western medicine for fourteen centuries as he
was seen as a divine man, the father of physicians. Furthermore, his theory was
coherent and represented churchly doctrine.
Discovery of the circulation
At the end of the Middle Ages dissection of humans to study human anatomy and
physiology was started once more and some physicians started questioning the
authority of Galen. Michael Servatus (1511-1553) is considered the first to
describe and publish the concept of the pulmonary circulation [2]. In fact he was
the first European physician as three centuries before the pulmonary circulation
was described by the Arab physician Ibn-an-Nafas [3]. His view on the pulmonary
circulation was neglected and forgotten probably due to its heretical and original
character. Michael Servatus described the pulmonary circulation in De
Christianismi Restitutio. This was originally a theology work which intention was to
prove the existence of the soul inside the blood [2]. “It (vital spirit) is a subtle
spirit, generated by the power of heat, of yellow color and possessor of the power
of the fire, so as to become a sort of lucid vapor of the purified blood, enclosing
the elements of the water, the air and the fire. It is instantly produced inside the
lungs by a mixture of inhaled air and subtle blood, while it is elaborated and
communicated from the heart’s right ventricle to the left one. This communication
is not mediated via the median septum of the heart, as it is habitually thought; on
the contrary, the subtle blood is transferred from the right ventricle, in a brilliant
way, by following a long circuit through the lungs, which submits it into a
transformation, in order for the blood to come out colored yellow: the arterial vein
[pulmonary artery] transports it into the venous artery [pulmonary vein]. From
that moment on, the blood is mixed in that very same venous artery with the
inhaled air in order to become re-purified from all fuliginous materials, during this
expiration. In this way, the entirety of this mixture is finally attracted by the left
ventricle of the heart, during the diastole, to serve as a base for the vital spirit.” De
Christianismi Restitutio was the reason for condemning him to be burned at the
stakes because it also preached nontrinitarianism and anti-infant baptism. Even in
his last words he defied the inquisitor: “Oh Jesus, son of eternal God, have pity on
me” [2].
Finally, William Harvey (1578-1657) explained the circulation and presented
the determinant proofs in his thesis, De Motu Cordis, which established the
foundation for the understanding of the systemic and pulmonary circulation [4].

13
He described the importance of right ventricular function: “Thus the right ventricle
may be said to be made for the sake of transmitting blood through the lungs, not
for nourishing them.” He knew his message would be controversial: “What
remains to be said on the quantity and source of this transferred blood, is, even if
carefully reflected upon, so strange and undreamed of, that not only do I fear
danger to myself from the malice of a few, but I dread lest I have all men as
enemies, so much does habit or doctrine (referring to Galen’s doctrine) once
absorbed, driving deeply its roots, become second nature, and so much does
reverence for antiquity influence all men. But now the die is cast, my hope is in the
love of truth and in the integrity of intelligence.” The discovery of the circulation
was received with great interest and accepted almost at once in his home country,
England. On the mainland of Europe it won favor more slowly, however, before his
death his concept was acknowledged by the medical profession [5].
Harvey’s followers have progressively completed the knowledge of
cardiovascular physiology. However, up to the first half of the twentieth century
there was almost no interest in the right ventricle. The main reason was the right
ventricle was considered little more than a conduit for blood flow between the
venous circulation and the pulmonary circulation [6]. Furthermore, how were they
to investigate the right ventricle when there were almost no non-invasive tools to
measure right ventricular function and volumes? This all changed with the
emergence of cardiac surgery and new imaging modalities.
Ch
ap
ter 1
G
en
era
l intro
du
ction
an
d o
utlin
e o
f the
the
sis

14
Anatomy and physiology
Septa divide the heart in a right- and left-sided compartment. The anulus fibrosus,
a structure of dense connective tissue, subdivides each half of the heart into two
cavities, the upper part being called atrium, the lower part ventricle. The
morphology and structure of the right and left ventricle is substantially different as
a result of the difference in origin of myocardial precursor cells and the vascular
resistance of the pulmonary and systemic circulation [7,8]. Compared to the
systemic circulation, the lungs are close to the heart and the pulmonary arteries
and veins are relatively short and broad. This results in a low vascular resistance
which can be easily overcome with a small increase in right ventricular pressure.
Compared to the left ventricle, the right ventricle has a complex geometry,
with a triangular shape in the sagittal plane and a crescent shape in the coronal
plane. The shape of a normal right ventricle can be imagined as a thin pouch that is
wrapped around the thick ellipsoid left ventricle. Right ventricular mass is only one
sixth of left ventricular mass. Functionally, the right ventricle can be divided into
an inlet, outlet and apical coarsely trabeculated component. The inlet component
consists of the tricuspid valve which is connected to its subvalvular apparatus. The
subvalvular apparatus, comprising chordae tendineae and papillary muscles,
prevents valve leaflets prolapsing into the atrium during ventricular contraction.
The smooth walled muscular outlet, is separated from the inlet by a thick muscle,
the crista supraventricularis, which arches from the anterolateral wall over the
anterior leaflet of the tricuspid valve to the septal wall. At the lower septal
segment of the crista supraventricularis, the septomarginal band originates and
becomes continuous with the moderator band, which attaches to the lateral free
wall and apex of the right ventricle [7].
Although the right ventricle is normally located on the right side of the heart
and connected with the pulmonary circulation, this is not always the case in
complex congenital heart disease. Several anatomic structures are distinctive
features of the morphological right ventricle which can help differentiate the right
from the left ventricle when imaging the heart. The right-sided atrioventricular
valve has a trileaflet configuration with septal chordal and papillary insertions and
a more apical hinge line of the septal leaflet relative to the anterior leaflet of the
left-sided atrioventricular (mitral) valve. The right ventricular outflow tract is
muscular and has no fibrous continuity with the atrioventricular valve. The apical
trabeculae are much more coarsely than that of the left ventricle and the right
ventricle has a moderator band [7].

15
Congenital heart disease
The emergence of cardiac surgery and advances in pediatric care dramatically
increased the number of patients with complex congenital heart disease that
survived into adulthood. Currently, the number of adults with complex congenital
heart disease outnumber that of children [9]. In many patients with ‘corrected’
congenital heart disease the right ventricle has to perform under abnormal
circumstances such as pressure or volume overload. The importance of the right
ventricle became apparent after many of these patients developed short- and
long- term complications. The normal healthy right ventricle performs under low
pressures and is very compliant. The longitudinal orientation of most muscle fibers
in the right ventricle results in a peristaltic contraction pattern that works as a
bellows by pumping the blood against the interventricular septum towards the
pulmonary artery. Although this mechanism generates low pressures, it is very
efficient and can handle large changes in blood volume [7,8]. As the right and left
ventricle share multiple muscle fibres, have a common interventricular septum
and are constrained in the pericardial sac, both ventricles interact. In the normal
heart, left ventricular contraction substantially contributes to rise in right
ventricular pressure. Remodeling of the right ventricle in response to longstanding
volume or pressure overload helps maintaining normal levels of cardiac output for
a long period of time. Remodeling of the right ventricle involves a change in
geometry of both ventricles with a progressively reduced diastolic left ventricular
volume due to septal displacement and paradoxical systolic septal movement. This
remodeling is detrimental for left ventricular output, especially during exercise
[7,8]. Furthermore, in adulthood complications such as overt failure of the right
ventricle, arrhythmias and sudden death often occur. Therefore, improving care in
adult patients with congenital heart disease has in recent years focused on
prevention of complications. Imaging of the right ventricle is indispensable in this
setting. For example, most patients with ‘repaired’ tetralogy of Fallot have a
volume overloaded right ventricle due to longstanding pulmonary regurgitation.
This has been related to right ventricular dilation, right ventricular dysfunction,
reduced left ventricular volumes, symptomatic heart failure, ventricular
arrhythmia and sudden death [10-12]. Measurements of right and left ventricular
volumes can guide timing of pulmonary valve replacement to relieve the volume
overload and prevent these complications [13-17].
Ch
ap
ter 1
G
en
era
l intro
du
ction
an
d o
utlin
e o
f the
the
sis
16
Cardiac imaging
Evaluation of right ventricular volumes and function is considered one of the
cornerstones in the management of patients with ‘repaired’ congenital heart
disease [10,11]. The right ventricle can be imaged with chest radiography, contrast
angiography, radionuclide studies, computed tomography, echocardiography and
cardiac magnetic resonance imaging. Preferably, imaging of right ventricular
anatomy, volume and function is cheap, readily available, safe, accurate and
reproducible. For serial measurements of the right ventricle during follow-up,
imaging modalities that are invasive or use radiation are considered inappropriate.
Therefore, echocardiography and cardiac magnetic resonance imaging are most
frequently used in clinical practice [11].
The first modality to image the heart without radiation exposure was
ultrasound. Although the existence of ultrasound was already recognized in bats in
the 18th
century, the development of cardiac ultrasound had to wait till the
development of piezo-electric quartz crystals. In the 1950s, the first cardiac
ultrasound was performed [18]. In the 1960s, progress was made in real-time two-
dimensional echocardiography and now even three-dimensional ultrasound is
available. Currently, two-dimensional echocardiography is the most frequently
used modality to study the right ventricle as it is relatively cheap and readily
available [19]. It excels in real-time visualization of small and mobile structures like
valves. Since the heart is located in an angle with respect to the longitudinal axis of
the body and is rotated slightly to the left, the ventral part of the heart consists
mainly of right atrium and right ventricle. Although cardiac morphology can be
visualized, this retrosternal position of the right ventricle limits echocardiographic
visualization. Furthermore, the complex geometry of the right ventricle hampers
reliable translation from two-dimensional diameters to volumes resulting in
inaccurate measurements of right ventricular volume and function [20].
In 1946, the phenomenon of magnetic resonance was discovered which led to
the development of nuclear magnetic resonance imaging [21,22]. Attenuation of
tissues depends on the behavior of tissues when placed in an external magnetic
field and exposed to radiofrequency radiation. In 1977, the first horizontal image
through the human thorax was made, however, the acquisition time was to long to
generate a qualitative good image of the heart [23]. With the introduction of ECG
gating derived from nuclear radiology the first good quality cardiac images of the
heart were generated in 1983. Nowadays, cardiac magnetic resonance is
considered the gold standard for evaluation of cardiac volumes and function [24].
It is a cross-sectional technique that has the advantage of unrestricted fields of

17
view. Furthermore, with the newest sequences contrast between blood and
muscle is outstanding. Measurements of right ventricular volumes and function do
not rely on assumptions of geometry but uses slice summation to calculate
volumes, which are highly accurate and reproducible. However, gold standard is
not a synonym for perfect. The complex anatomy and morphology of the right
ventricle result in less accurate and reproducible measurements compared to left
ventricular measurements. Analyzing cardiac magnetic resonance derived images
of the heart requires post-processing with extensive manual contouring, which is
operator-dependent. Furthermore, part of the differences in right ventricular
volumes and function reported in literature are the result of a difference in
methodology and patient characteristics [24-26]. Therefore, interpretation and
application of literature in clinical practice requires information to what extent
results are influenced by methodology and patient characteristics.
Ch
ap
ter 1
G
en
era
l intro
du
ction
an
d o
utlin
e o
f the
the
sis

18
Outline of the thesis
This thesis discusses imaging of the right ventricle in patients with congenital heart
disease.
In many centers the right ventricular end-systolic and end-diastolic frame is
selected independently from the left ventricular end-systolic and end-diastolic
frame. Others state that independent selection of the right ventricular frame is
unnecessary as the magnitude of the misrepresentation of right ventricular
volumes and function is too small to be of clinical importance. In Chapter 2 the
magnitude of this misrepresentation is assessed.
An issue in post-processing is whether to consider trabeculae and papillary
muscles part of measured right ventricular volumes or mass. Including
trabeculations in the right ventricular blood volume makes analysis faster and
more reproducible compared to excluding these trabeculations manually,
however, right ventricular volumes will be overestimated. In Chapters 3, 4 and 5
this issue is addressed. Chapter 3 validates a novel segmentation algorithm which
semi-automatically excludes trabeculations and papillary muscles. Chapter 4
studies the impact of right ventricular trabeculations and papillary muscles on
measured right ventricular volumes and function in patients with repaired
tetralogy of Fallot. Chapter 5 shows the impact of right ventricular trabeculations
and papillary muscles on measured volumes and function in patients with pressure
overloaded right ventricles.
Chapter 6 evaluates the effects of right ventricular outflow tract obstruction
on exercise capacity, right ventricular volumes, function and mass in adult patients
with tetralogy of Fallot and volume overload due to pulmonary regurgitation.
Recent studies demonstrated that patients with tetralogy of Fallot and combined
pulmonary regurgitation and right ventricular outflow tract obstruction have
smaller right ventricular volumes and higher ejection fraction compared to
patients with isolated pulmonary regurgitation, however, the effect on exercise
capacity is unknown.
Chapter 7 describes the study design and rationale of the ‘Functional outcome
and quality of life in adult patients with congenital heart disease and prosthetic
valves (PROSTAVA) study’. Purpose of this prospective study is to describe the
relation between prosthetic valve characteristics in adult patients with congenital
heart disease on one hand and functional outcome, quality of life, the prevalence
and predictors of prosthesis-related complications on the other hand. An
addendum was added on measurements of right ventricular volumes and function
in the PROSTAVA study.

19
References
[1] Cheng TO, (2001) Hippocrates and cardiology. Am Heart J 141:173-83.
[2] Stefanadis C, Karamanou M, Androutsos G, (2009) Michael Servetus (1511-
1553) and the discovery of pulmonary circulation. Hellenic J Cardiol 50:373-8.
[3] Haddad SI, Khairallah AA, (1936) A Forgotten Chapter in the History of the
Circulation of the Blood. Ann Surg 104:1-8.
[4] Thomas CT, (1928) Exercitatio Anatomica de Motu Cordis et Sanguinis in
Animalibus by William Harvey with an English Translation and Annoatations
by Chauncey D. Leake.
[5] Lindeboom GA, (2000) Inleiding tot de geschiedenis der geneeskunde.
Erasmus Publishing.
[6] Dhainaut JF, Ghannad E, Dall'ava-Santucci J, (1988) The Obscure Right
Ventricle - A Historical Review. In: Vincent J, editor. Update 1988. Springer
Berlin Heidelberg.
[7] Haddad F, Hunt SA, Rosenthal DN, et al., (2008) Right ventricular function in
cardiovascular disease, part I: Anatomy, physiology, aging, and functional
assessment of the right ventricle. Circulation 117:1436-48.
[8] Haddad F, Doyle R, Murphy DJ, et al., (2008) Right ventricular function in
cardiovascular disease, part II: pathophysiology, clinical importance, and
management of right ventricular failure. Circulation 117:1717-31.
[9] Marelli AJ, Mackie AS, Ionescu-Ittu R, et al., (2007) Congenital heart disease in
the general population: changing prevalence and age distribution. Circulation
115:163-72.
[10] Warnes CA, Williams RG, Bashore TM, et al., (2008) ACC/AHA 2008 Guidelines
for the Management of Adults with Congenital Heart Disease: a report of the
American College of Cardiology/American Heart Association Task Force on
Practice Guidelines (writing committee to develop guidelines on the
management of adults with congenital heart disease). Circulation 118:e714-
833.
[11] Baumgartner H, Bonhoeffer P, De Groot NM, et al., (2010) ESC Guidelines for
the management of grown-up congenital heart disease (new version 2010).
Eur Heart J 31:2915-57.
Ch
ap
ter 1
G
en
era
l intro
du
ction
an
d o
utlin
e o
f the
the
sis

20
[12] Gatzoulis MA, Balaji S, Webber SA, et al., (2000) Risk factors for arrhythmia
and sudden cardiac death late after repair of tetralogy of Fallot: a multicentre
study. Lancet 356:975-81.
[13] Therrien J, Provost Y, Merchant N, et al., (2005) Optimal timing for pulmonary
valve replacement in adults after tetralogy of Fallot repair. Am J Cardiol
95:779-82.
[14] Buechel ER, Dave HH, Kellenberger CJ, et al., (2005) Remodelling of the right
ventricle after early pulmonary valve replacement in children with repaired
tetralogy of Fallot: assessment by cardiovascular magnetic resonance. Eur
Heart J 26:2721-7.
[15] Oosterhof T, van Straten A, Vliegen HW, et al., (2007) Preoperative thresholds
for pulmonary valve replacement in patients with corrected tetralogy of Fallot
using cardiovascular magnetic resonance. Circulation 116:545-51.
[16] Frigiola A, Tsang V, Bull C, et al., (2008) Biventricular response after
pulmonary valve replacement for right ventricular outflow tract dysfunction:
is age a predictor of outcome? Circulation 118:S182-90.
[17] Geva T, (2011) Repaired tetralogy of Fallot: the roles of cardiovascular
magnetic resonance in evaluating pathophysiology and for pulmonary valve
replacement decision support. J Cardiovasc Magn Reson 13:9.
[18] Edler I, Hertz CH, (1954) Use of ultrasonic reflectoscope for continuous
recording of movements of heart walls. Kurgl Fysiogr Sallad i Lund Forhandl
24.
[19] Rudski LG, Lai WW, Afilalo J, et al., (2010) Guidelines for the
echocardiographic assessment of the right heart in adults: a report from the
American Society of Echocardiography endorsed by the European Association
of Echocardiography, a registered branch of the European Society of
Cardiology, and the Canadian Society of Echocardiography. J Am Soc
Echocardiogr 23:685,713; quiz 786-8.
[20] Kilner PJ, (2011) Imaging congenital heart disease in adults. Br J Radiol 84
Spec No 3:S258-68.
[21] Bloch F, Hansen WW, Packard M, (1946) Nuclear Induction. Phys.Rev. 69:127.
[22] Purcell EM, Torrey HC, Pound RV, (1946) Resonance Absorption by Nuclear
Magnetic Moments in a Solid. Phys.Rev. 69:37-8.

21
[23] Damadian R, Goldsmith M, Minkoff L, (1977) NMR in cancer: XVI. FONAR
image of the live human body. Physiol Chem Phys 9:97,100, 108.
[24] Kilner PJ, Geva T, Kaemmerer H, et al., (2010) Recommendations for
cardiovascular magnetic resonance in adults with congenital heart disease
from the respective working groups of the European Society of Cardiology.
Eur Heart J 31:794-805.
[25] Fratz S, Schuhbaeck A, Buchner C, et al., (2009) Comparison of accuracy of
axial slices versus short-axis slices for measuring ventricular volumes by
cardiac magnetic resonance in patients with corrected tetralogy of fallot. Am J
Cardiol 103:1764-9.
[26] Winter MM, Bernink FJ, Groenink M, et al., (2008) Evaluating the systemic
right ventricle by CMR: the importance of consistent and reproducible
delineation of the cavity. J Cardiovasc Magn Reson 10:40.
Ch
ap
ter 1
G
en
era
l intro
du
ction
an
d o
utlin
e o
f the
the
sis

22
23
Improved cardiac MRI volume measurements
in patients with tetralogy of Fallot by
independent end-systolic and end-diastolic
phase selection
Hendrik G. Freling
Petronella G. Pieper
Karin M. Vermeulen
Jeroen M. van Swieten
Paul E. Sijens
Dirk J. van Veldhuisen

24
Abstract
Objectives: To investigate to what extent cardiovascular MRI derived
measurements of right ventricular (RV) volumes using the left ventricular (LV) end-
systolic and end-diastolic frame misrepresent RV end-systolic and end-diastolic
volumes in patients with tetralogy of Fallot (ToF) and a right bundle branch block.
Methods: Sixty-five cardiac MRI scans of patients with ToF and a right bundle
branch block, and 50 cardiac MRI scans of control subjects were analyzed. RV
volumes and function using the end-systolic and end-diastolic frame of the RV
were compared to using the end-systolic and end-diastolic frame of the LV.
Results: Timing of the RV end-systolic frame was delayed compared to the LV end-
systolic frame in 94% of patients with ToF and in 50% of control subjects. RV end-
systolic volume using the RV end-systolic instead of LV end-systolic frame was
smaller in ToF (median -3.3 ml/m2, interquartile range -1.9 to -5.6 ml/m
2; p <
0.001) and close to unchanged in control subjects. Using the RV end-systolic and
end-diastolic frame hardly affected RV end-diastolic volumes, while increasing the
ejection fraction from 45 ± 7% to 48 ± 7% for patients with ToF (p < 0.001) rather
than control subjects (54 ± 4%, both methods). QRS duration correlated positively
with the changes in the RV end-systolic volume (p < 0.001) and RV ejection fraction
obtained in ToF patients when using the RV instead of the LV end-systolic and end-
diastolic frame (p = 0.004).
Conclusion: For clinical decision making in ToF patients RV volumes derived from
cardiac MRI should be measured in the end-systolic frame of the RV instead of the
LV.
PLoS One. 2013;8(1):e55462

25
Introduction
Evaluation of right ventricular (RV) volumes and function is crucial in the
management of patients with congenital heart disease [1,2]. RV dysfunction is
particularly a problem in patients with tetralogy of Fallot (ToF) due to longstanding
massive pulmonary regurgitation. Irreversible RV dysfunction can be prevented by
pulmonary valve replacement before a certain threshold value for RV end-systolic
and end-diastolic volume is reached [3-7]. Cardiac magnetic resonance (CMR)
imaging is the golden standard in the evaluation of RV volume and function, and
plays an important role in the decision for pulmonary valve replacement in
patients with ToF and pulmonary regurgitation [1-7].
To acquire accurate CMR derived volume measurements, correct selection of
the RV end-systolic and end-diastolic frame may be important. In normal hearts,
contraction of the RV lags slightly behind that of the left ventricle (LV) [8]. Most
patients with ToF have a right bundle branch block (RBBB) which leads to intra-
and interventricular dyssynchrony. This dyssynchrony significantly extends
duration of RV contraction and delays timing of RV end-systole compared to the LV
[7,9,10]. Additionally, timing of RV ejection and end-diastole may be delayed in
patients with ToF [11,12]. In many centers the RV end-systolic and end-diastolic
frame is selected independently from the LV end-systolic and end-diastolic frame
[13,14]. However, the magnitude of the overestimation of RV end-systolic volume
and underestimation of RV end-diastolic volume and ejection fraction is unknown.
Therefore, others state that independent selection of the RV frame is unnecessary
as the magnitude of the misrepresentation of RV volumes and function is too small
to be of clinical importance.
The present study is the first to quantitatively document the influence of
independent selection of the end-systolic and end-diastolic frame for the RV and
LV, on RV volume measurements in a large group of patients with ToF and control
subjects.
Ch
ap
ter 2
In
de
pe
nd
en
t ph
ase
sele
ction

26
Materials and methods
Study population
Our institution’s CMR database was searched to collect 65 of the most recent CMR
scans of patients with ToF and 50 normal CMR scans performed in patients
suspected for myocardial infarction (control subjects). Normal CMR scans were
defined as normal anatomy, normal LV and RV contraction, normal LV and RV
volumes and ejection fraction with no signs of infarction, and no valvular
dysfunction [15]. Ischemia was ruled out by stress testing. In all patients
electrocardiograms performed within 6 months to the CMR date were collected to
evaluate rhythm and conductance disturbances. A RBBB was present when the
longest manually measured QRS duration ≥ 100 ms in combination with a terminal
R wave in lead V1 and V2, wide S wave in I and V6 on the electrocardiogram [16].
RBBB is defined as complete when the QRS duration ≥ 120 ms and defined as
incomplete when the QRS duration is ≥100 ms and <120 ms [16]. CMR scans of
patients with ToF were included when RBBB was the only conductance delay and
no additional conductance delays were present. CMR scans of control subjects
were excluded when conductance delays were present on the electrocardiogram
[16].
This retrospective study was approved by the University Medical Center
Groningen review board. Informed consent was not required according to the
Dutch Medical Research Involving Human Subjects act.
Cardiac magnetic resonance imaging:
All subjects were examined on a 1.5-Tesla MRI system (Siemens Magnetom
Sonata, Erlangen, Germany or Siemens Magnetom Avanto, Erlangen, Germany)
using a 2 x 6 channel body-coil. After single-shot localizer images, for function
analysis short axis cine loop images with breath holding in expiration were
acquired using a retrospectively gated balanced steady state free precession
sequence. Short axis slices were planned in end-diastole from two slices above the
mitral valve plane to the apex. The following parameters were used: TR 2.7 ms, TE
1.1 ms, flip angle 80o, field of view 320 mm, matrix 192 x 192 mm, 25 frames per
cycle, slice thickness 6 mm, interslice gap 4 mm, voxel size 1.7 x 1.7 x 6 mm.
Image analysis was performed using commercially available software (QMass
version 7.2., Medis, Leiden, The Netherlands). The end-systolic and end-diastolic
frame was defined as the frame with the smallest and largest volume,
respectively.These frames were selected by visual assessment independently for

27
the LV and RV. LV and RV contours were drawn manually by tracing the
endocardial borders in every slice in the end-systolic and end-diastolic frame of
the LV. Contour tracing was aided by reviewing the multiple phase scans in the
movie mode. The papillary muscle and trabeculae were considered part of the
cavum. Additionally, RV contours were drawn in the end-systolic and end-diastolic
frame of the RV.
The basal slice was selected with aid of long-axis cine view images. The basal
slice of the LV was defined as the most basal slice surrounded for at least 50% by
the LV myocardium. When the pulmonary valve was visible in the RV basal slice,
only the portion of the right ventricular outflow tract below the level of the
pulmonary valve was included. For the inflow part of the RV, the blood volume
was included when the ventricle wall was trabeculated and thick compared to the
right atrium wall [15].
Stroke volume was defined as end-diastolic volume minus end-systolic
volume. Ejection fraction was defined as stroke volume divided by end-diastolic
volume.
Reproducibility
RV contours were first drawn in the visually selected end-systolic and end-diastolic
frame of the RV. To minimize intraobserver variability, RV contours drawn in the
end-systolic and end-diastolic frame of the RV were copied to the LV end-systolic
and end-diastolic frame and then adjusted to this frame.
To obtain intra- and interobserver reproducibility, contours were drawn
independently twice by the first observer and once by the second observer in 25
scans of patients with ToF and 25 scans of control subjects. The end-systolic and
end-diastolic frame was selected independently twice by the first observer and
once by the second observer. There were at least two weeks between repeated
contour drawing by the first observer. Both observers had more than 2 years
experience with RV contour drawing.
Statistical analyses
Descriptive statistics were calculated for all measurements as mean and standard
deviation for normally distributed continuous variables, median with interquartile
range (IQR) for skewed continuous variables and absolute numbers and
percentages for dichotomous variables. Reproducibility was evaluated with the
intraclass correlation coefficient (ICC). For normally distributed continuous
variables a paired-samples Student’s t-test and for skewed continuous variables a
Wilcoxon test was used to compare RV volumes measured in the LV end-systolic
Ch
ap
ter 2
In
de
pe
nd
en
t ph
ase
sele
ction

28
and end-diastolic frame with RV volumes measured in the RV end-systolic and end-
diastolic frame. For normally distributed continuous variables an independent
Student’s T-test and for skewed continuous variables a Mann-Whitney test was
used to compare the difference in RV volumes between normal scans and scans of
patients with ToF when measuring RV volumes in the end-systolic and end-
diastolic frame of the RV instead of the LV. The relation between QRS duration and
change in RV volume and function when using the end-systolic and end-diastolic
frame of the RV instead of the LV was analyzed using linear regression. The
Statistical Package for the Social Sciences version 16.0 (SPSS Inc, Chicago, IL) was
used for all statistical analyses. All statistical tests are two-sided and a P-value of
less than 0.05 was considered statistically significant.

29
Results
Study population
Between January 2008 and January 2011, 65 CMR scans of patients with ToF (50
with complete RBBB, 15 with incomplete RBBB) and 50 normal CMR scans of
control subjects were collected. Patients with ToF (37 male, 28 female; median age
28 years, IQR 21 to 37 years) were younger than control subjects (33 male, 17
female; median age 56 years, IQR 41 to 65 years), p < 0.001. QRS duration was
longer in patients with ToF (145 ± 25 ms) than in control subjects (93 ± 9 ms), p <
0.001. Heart rate during the CMR scan was similar in patients with ToF (70 ± 12
bpm) and control subjects (73 ± 15 bpm), p = NS.
Timing of end-systole and end-diastole
The difference in frame selection of end-systole and end-diastole between the RV
and LV is shown in table 1.
Table 1. End-systolic and end-diastolic frame selection of the RV compared to the LV.
RV – LV frame End-systole End-diastole
ToF Control ToF Control
RV 3 frames earlier 0 (0) 0 (0) 2 (3) 0 (0)
RV 2 frames earlier 0 (0) 0 (0) 2 (3) 2 (4)
RV 1 frame earlier 0 (0) 0 (0) 14 (22) 14 (28)
No difference 4 (6) 25 (50) 38 (58) 34 (64)
RV 1 frame later 26 (40) 25 (50) 8 (12) 0 (0)
RV 2 frames later 28 (43) 0 (0) 0 (0) 0 (0)
RV 3 frames later 7 (11) 0 (0) 1 (2) 0 (0)
Data are expressed as number of patients (%). LV = left ventricle, RV = right ventricle, ToF =
tetralogy of Fallot
Figure 1 shows the time-volume curve of the RV and LV of a patient with ToF and a
complete RBBB. In almost all patients with ToF and half of control subjects the
end-systolic frame of the RV was delayed compared to the LV. The resulting
median difference in timing between the end-systolic frame of the RV and LV was
larger in patients with ToF (median -53 ms, IQR -73 to -37 ms) than in control
subjects (median -11 ms, IQR -32 to 0 ms), p < 0.001. Timing of the end-diastolic
frame was not different between the RV and LV in most patients with ToF and
control subjects. Also, the resulting median difference in timing between the ED
Ch
ap
ter 2
In
de
pe
nd
en
t ph
ase
sele
ction

30
frame of the RV and LV frame was similar in patients with ToF (median 0 ms, IQR 0
to 36 ms) and control subjects (median 0 ms, IQR 0 to 32 ms), p = NS.
Figure 1. Example of the LV and RV end-
systolic frame and the corresponding
time-volume curve. Two short axis
images of the end-systolic frame of the
LV (upper left) and RV (upper right), and
the corresponding time-volume curve
(below) in a patient with ToF and a
complete RBBB. Timing of the RV end-
systolic frame is 106 ms (3 frames)
delayed compared to LV end-systolic
frame. Measuring the RV end-systolic
volume in the LV instead of the RV end-
systolic frame results in a difference of 9
ml/m2. This is visible in the short-axis
image of the RV end-systolic frame
(upper right) in which the larger blue
contour corresponds to the RV contour
of the LV end-systolic frame (upper left)
and the yellow contour to the RV contour
of the RV end-systolic frame. Timing of
the end-diastolic frame is the same for
the RV and LV.
Change in RV volume and function
Table 2 shows RV volumes and function measured in the end-systolic and end-
diastolic frame of the LV and RV. Using the RV end-systolic instead of LV end-
systolic frame in patients with ToF, mean RV end-systolic volume was reduced
from 78 to 74 ml/m2 (p < 0.001) while ejection fraction and stroke volume grew
from 45 to 48% (p < 0.001) and from 62 to 66 ml/m2, respectively (p < 0.001). ToF
patient’s changes in RV end-diastolic volume and the changes in any of these four
parameters in the controls were very small, though still significant in paired data
analysis. Figure 2 shows the difference in volumes and function when using the
end-systolic and end-diastolic frame of the RV instead of the LV. The decrease in
RV end-systolic volume was incremental when going from controls to patients with
ToF and an incomplete RBBB to patients with ToF and a complete RBBB (p<0.001).
In patients with ToF linear regression showed a significant association between
QRS duration and change in RV end-systolic volume (B 3.37, CI 1.62 – 5.13, R2 =

31
0.190, p < 0.001), and RV ejection fraction (B 4.25, CI 1.40 – 7.10, R2 = 0.124, p =
0.004) when using the end-systolic and end-diastolic frame of the RV instead of
the LV.
Table 2. RV volumes measured in the end-systolic and end-diastolic frame of the LV and RV.
LV frame RV frame RV frame – LV frame P
ToF
RV ESV (ml/m2) 77.8 ± 24.1 73.6 ± 23.0 -3.3 (-5.6 to -1.9) <.001
RV EDV (ml/m2) 139.6 ± 35.0 140.0 ± 35.0 0.0 (0.0 to 0.9) <.001
RV EF (%) 44.8 ± 7.4 48.0 ± 6.9 2.8 (1.8 to 4.6) <.001
RV SV (ml/m2) 61.8 ± 16.4 66.4 ± 16.7 4.1 (2.6 to 5.8) <.001
Control subjects
RV ESV (ml/m2) 35.1 ± 7.6 34.9 ± 7.6 0.0 (-0.4 to 0.0) .003
RV EDV (ml/m2) 75.2 ± 12.4 75.4 ± 12.3 0.0 (0.0 to 0.1) .002
RV EF (%) 53.6 ± 4.1 54.0 ± 4.0 0.2 (0.0 to 0.7) <.001
RV SV (ml/m2) 40.1 ± 6.1 40.5 ± 6.1 0.2 (0.0 to 0.6) <.001
Data are expressed as mean ± SD or median (IQR). EDV = end-diastolic volume, EF = ejection
fraction, ESV = end-systolic volume, IQR = interquartile range LV = left ventricle, RV = right
ventricle, SD = standard deviation, SV = stroke volume, ToF = tetralogy of Fallot
The increase of RV ejection fraction is mainly the result of decrease in end-systolic
volume when using the end-systolic frame of the RV instead of the LV. Using the
end-systolic frame of the RV instead of the LV resulted in a relative increase in
ejection fraction of 7%, from 45 ± 7% to 48 ± 7%, in patients with ToF and of 1%,
from 54 ± 4% to 54 ± 4%, in control subjects. The relative increase in ejection
fraction and stroke volume by using the end-diastolic frame of the RV instead of
the LV was <1% in both patients with ToF and control subjects.
In 17 (26%) patients with ToF the absolute increase of ejection fraction exceeded
5% (range 5-8%), figure 2C. In 39 (60%) patients with ToF ejection fraction fell
short of the limit of 47% indicating abnormal RV function according to reference
values [15]. When using the end-systolic frame of the RV instead of the LV frame,
RV function changed to normal in 5 (13%) of these patients. None of the patients
with an incomplete RBBB and an abnormal RV function showed improvement to
normal values.
Reproducibility
Ch
ap
ter 2
In
de
pe
nd
en
t ph
ase
sele
ction

3232
A
B
C
Intra
ejection fraction was .98, .91, .87 and .98, .97, .95 in patients with ToF and .94, .93,
.88 and .95, .97 and .89 in control subjects, respectively.
A
B
C
Intra-
ejection fraction was .98, .91, .87 and .98, .97, .95 in patients with ToF and .94, .93,
.88 and .95, .97 and .89 in control subjects, respectively.
and interobserver ICC for RV end
ejection fraction was .98, .91, .87 and .98, .97, .95 in patients with ToF and .94, .93,
.88 and .95, .97 and .89 in control subjects, respectively.
and interobserver ICC for RV end
ejection fraction was .98, .91, .87 and .98, .97, .95 in patients with ToF and .94, .93,
.88 and .95, .97 and .89 in control subjects, respectively.
and interobserver ICC for RV end
ejection fraction was .98, .91, .87 and .98, .97, .95 in patients with ToF and .94, .93,
.88 and .95, .97 and .89 in control subjects, respectively.
and interobserver ICC for RV end
ejection fraction was .98, .91, .87 and .98, .97, .95 in patients with ToF and .94, .93,
.88 and .95, .97 and .89 in control subjects, respectively.
and interobserver ICC for RV end
ejection fraction was .98, .91, .87 and .98, .97, .95 in patients with ToF and .94, .93,
.88 and .95, .97 and .89 in control subjects, respectively.
and interobserver ICC for RV end
ejection fraction was .98, .91, .87 and .98, .97, .95 in patients with ToF and .94, .93,
.88 and .95, .97 and .89 in control subjects, respectively.
and interobserver ICC for RV end
ejection fraction was .98, .91, .87 and .98, .97, .95 in patients with ToF and .94, .93,
.88 and .95, .97 and .89 in control subjects, respectively.
and interobserver ICC for RV end
ejection fraction was .98, .91, .87 and .98, .97, .95 in patients with ToF and .94, .93,
.88 and .95, .97 and .89 in control subjects, respectively.
and interobserver ICC for RV end
ejection fraction was .98, .91, .87 and .98, .97, .95 in patients with ToF and .94, .93,
.88 and .95, .97 and .89 in control subjects, respectively.
and interobserver ICC for RV end-systolic volume, end
ejection fraction was .98, .91, .87 and .98, .97, .95 in patients with ToF and .94, .93,
.88 and .95, .97 and .89 in control subjects, respectively.
systolic volume, end
ejection fraction was .98, .91, .87 and .98, .97, .95 in patients with ToF and .94, .93,
.88 and .95, .97 and .89 in control subjects, respectively.
systolic volume, end
ejection fraction was .98, .91, .87 and .98, .97, .95 in patients with ToF and .94, .93,
.88 and .95, .97 and .89 in control subjects, respectively.
systolic volume, end
ejection fraction was .98, .91, .87 and .98, .97, .95 in patients with ToF and .94, .93,
.88 and .95, .97 and .89 in control subjects, respectively.
systolic volume, end
ejection fraction was .98, .91, .87 and .98, .97, .95 in patients with ToF and .94, .93,
.88 and .95, .97 and .89 in control subjects, respectively.
systolic volume, end
ejection fraction was .98, .91, .87 and .98, .97, .95 in patients with ToF and .94, .93,
.88 and .95, .97 and .89 in control subjects, respectively.
Figure 2.
ventricular volumes and
function. Scatterplots
change in RV end
volume (A), end
volume (B) and ejection
fraction (C) when using the
end
diastolic frame of the RV
instead of the LV. EDV =
end
ejection fraction, ESV = end
systolic volume,
ventricular, RBBB = right
bundle branch block, RV =
right ventricular, ToF =
tetralogy of Fallot
systolic volume, end-diastolic volume and
ejection fraction was .98, .91, .87 and .98, .97, .95 in patients with ToF and .94, .93,
Figure 2.
ventricular volumes and
function. Scatterplots
change in RV end
volume (A), end
volume (B) and ejection
fraction (C) when using the
end-systolic and end
diastolic frame of the RV
instead of the LV. EDV =
end-diastolic volume, EF =
ejection fraction, ESV = end
systolic volume,
ventricular, RBBB = right
bundle branch block, RV =
right ventricular, ToF =
tetralogy of Fallot
diastolic volume and
ejection fraction was .98, .91, .87 and .98, .97, .95 in patients with ToF and .94, .93,
Figure 2.
ventricular volumes and
function. Scatterplots
change in RV end
volume (A), end
volume (B) and ejection
fraction (C) when using the
systolic and end
diastolic frame of the RV
instead of the LV. EDV =
diastolic volume, EF =
ejection fraction, ESV = end
systolic volume,
ventricular, RBBB = right
bundle branch block, RV =
right ventricular, ToF =
tetralogy of Fallot
diastolic volume and
ejection fraction was .98, .91, .87 and .98, .97, .95 in patients with ToF and .94, .93,
Figure 2. Change in right
ventricular volumes and
function. Scatterplots
change in RV end
volume (A), end
volume (B) and ejection
fraction (C) when using the
systolic and end
diastolic frame of the RV
instead of the LV. EDV =
diastolic volume, EF =
ejection fraction, ESV = end
systolic volume,
ventricular, RBBB = right
bundle branch block, RV =
right ventricular, ToF =
tetralogy of Fallot
diastolic volume and
ejection fraction was .98, .91, .87 and .98, .97, .95 in patients with ToF and .94, .93,
Change in right
ventricular volumes and
function. Scatterplots
change in RV end-systolic
volume (A), end-diastolic
volume (B) and ejection
fraction (C) when using the
systolic and end
diastolic frame of the RV
instead of the LV. EDV =
diastolic volume, EF =
ejection fraction, ESV = end
LV = left
ventricular, RBBB = right
bundle branch block, RV =
right ventricular, ToF =
tetralogy of Fallot
diastolic volume and
ejection fraction was .98, .91, .87 and .98, .97, .95 in patients with ToF and .94, .93,
Change in right
ventricular volumes and
of the
systolic
diastolic
volume (B) and ejection
fraction (C) when using the
systolic and end
diastolic frame of the RV
instead of the LV. EDV =
diastolic volume, EF =
ejection fraction, ESV = end
LV = left
ventricular, RBBB = right
bundle branch block, RV =
right ventricular, ToF =
diastolic volume and
ejection fraction was .98, .91, .87 and .98, .97, .95 in patients with ToF and .94, .93,
Change in right
ventricular volumes and
of the
systolic
diastolic
volume (B) and ejection
fraction (C) when using the
systolic and end-
diastolic frame of the RV
instead of the LV. EDV =
diastolic volume, EF =
ejection fraction, ESV = end-
LV = left
ventricular, RBBB = right
bundle branch block, RV =
right ventricular, ToF =

33
Discussion
Our study is the first to quantitatively demonstrate the difference in RV volumes
and function between using the RV and LV end-systolic and end-diastolic frame.
Performing cardiovascular MRI derived measurements of RV volumes using the LV
end-systolic and end-diastolic frame, misrepresent RV end-systolic and end-
diastolic volumes in many patients with ToF, especially in the frequent case of a
complete RBBB. These findings can be of clinical importance in the evaluation of
the RV in patients with ToF.
Previous echocardiographic and cardiovascular MRI studies reported on the
electromechanical delay of the RV compared to the LV in patients with congenital
heart disease and normal subjects [8-10,17,18]. The main focus of the
echocardiographic studies was to assess intra- and interventricular dyssynchrony
and their predictors. They showed that in patients with ToF RV free wall
contraction lags behind LV free wall and interventricular septum contraction.
Although they did not report on timing of end-systole, it can be expected that end-
systole is also delayed. We showed that in most scans of patients with ToF, end-
systole of the RV was more than one frame delayed compared to the LV. This was
probably largely due to the longer QRS duration in patients with ToF and a
complete RBBB. In control subjects the normal physiologically electromechanical
delay of the RV could not be detected in every case as the delay was smaller than
the time (mean 34 ± 7 ms) between two frames. Therefore, the end-systolic frame
of the RV was in the same or one frame later than the end-systolic frame of the LV.
In contrast to end-systole, timing of end-diastole of the RV and LV was similar in
patients with ToF and control subjects.
One small (N=12) cardiovascular MRI study indicated that measuring RV
volumes in the two frames preceding RV end-systole causes no clinically significant
volume changes despite the observation that end-systole of RV and LV occur in
different frames [19]. Our study has made clear that in end-systole the two
previous frames have a larger volume. When there is a difference in timing of end-
systole of the RV and LV with two or more frames, as is the case in most patients
with ToF, this leads to a significant change in volume. When there is a difference in
end-systole of the RV and LV in control subjects, this leads to a very small volume
change only. QRS duration, unfortunately not documented in the above study [19],
appears to be an important parameter as evidenced by the statistically significant
correlation with the difference in end-systolic volume when using the end-systolic
frame of the RV instead of the LV in patients with ToF obtained in this study. The
correlation is weak, however, probably because of our inclusion of a group of
Ch
ap
ter 2
In
de
pe
nd
en
t ph
ase
sele
ction

34
patients who are rather homogeneous in terms of QRS duration. In contrast to
end-systole, in end-diastole the adjacent frames had a similar volume.
According to the guidelines of the ESC and ACC/AHA, indication for
replacement of the pulmonary valve in patients with ToF and moderate/severe
pulmonary regurgitation is based on several parameters including RV function
[1,2]. It is important in this context that in 13% of the patients with ToF who were
considered to have abnormal function (ejection fraction <47%) [15], ejection
fraction increased to normal when using the end-systolic frame of the RV instead
of the LV. The change in RV function was mainly due to the decrease in RV end-
systolic volume when using the RV frame instead of the LV frame. Studies
comparing RV volumes and function before and after pulmonary valve
replacement have identified pre-operative threshold values for RV volumes after
which volumes can return to normal [3-6]. None of these studies describe whether
they selected the end-systolic and end-diastolic frame of the RV separately from
the LV. The reported threshold for RV end-systolic volume above which RV volume
does not return to normal after PVR varies between approximately 80 and 90
ml/m2
[3-6]. When using a threshold for RV end-systolic volume of > 85 ml/m2
[3],
in our study 25 (39%) patients had volumes above this threshold when measuring
RV volumes in the end-systolic frame of the LV. When using the end-systolic frame
of the RV instead of the LV, the end-systolic volume dropped below this threshold
in 7 (28%) patients. In some of these cases CMR measurements of RV volumes and
function may prove to be decisive when considering reoperation. Therefore, RV
volumes should be measured in end-systolic of the RV and not of the LV.
Limitations
Identifying tricuspid valve opening and closing in a 4-chamber or RV 2-chamber
view may allow for more accurate selection of the end-systolic frame. However, in
the 4-chamber view the opening and closing of the tricuspid valve was not always
clearly visible and RV 2-chamber views were not acquired.
There are possible confounders for the difference in timing of end-systole
between the studied groups, such as the difference in age, pulmonary stenosis and
regurgitation, RV end-systolic and end-diastolic volume and underlying disease.
However, it is unlikely that the difference in age will have influenced our results as
age does not affect timing of contraction of the right and left ventricle [8].
Possibly, a stronger correlation would have been found between QRS duration and
the difference in ejection fraction and end-systolic volume when using the end-
systolic and end-diastolic frame of the RV instead of the LV when also patients
with ToF and normal QRS duration had been included in this study. To investigate

35
the influence of QRS duration and RBBB more thoroughly, an additional group of
patients with ToF and no conduction delays would be useful. However, these
patients are rare and in our institution there are only three CMR scans of these
patients available over the last three years [1].
Although we have shown that end-systolic volume of the RV in patients with
ToF should be measured in the end-systolic frame of the RV instead of the LV, it is
uncertain whether this applies to all patients with congenital heart diseases
involving the right ventricle and a RBBB.
Conclusions
Independent selection of the end-systolic and end-diastolic LV and RV frame
instead of using the LV end-systolic and end-diastolic frame for RV determinations,
results in more accurate end-systolic RV volumes in patients with ToF and a RBBB.
The differences are significant and correlate with QRS duration. For clinical
decision making in patients with ToF and a RBBB, RV volumes should be measured
in the end-systolic frame of the RV instead of the LV.
Ch
ap
ter 2
In
de
pe
nd
en
t ph
ase
sele
ction
36
References
[1] Baumgartner H, Bonhoeffer P, De Groot NM, et al., (2010) ESC Guidelines for
the management of grown-up congenital heart disease (new version 2010).
Eur Heart J 31:2915-57.
[2] Warnes CA, Williams RG, Bashore TM, et al., (2008) ACC/AHA 2008 Guidelines
for the Management of Adults with Congenital Heart Disease: a report of the
American College of Cardiology/American Heart Association Task Force on
Practice Guidelines (writing committee to develop guidelines on the
management of adults with congenital heart disease). Circulation 118:e714-
833.
[3] Therrien J, Provost Y, Merchant N, et al., (2005) Optimal timing for pulmonary
valve replacement in adults after tetralogy of Fallot repair. Am J Cardiol
95:779-82.
[4] Buechel ER, Dave HH, Kellenberger CJ, et al., (2005) Remodelling of the right
ventricle after early pulmonary valve replacement in children with repaired
tetralogy of Fallot: assessment by cardiovascular magnetic resonance. Eur
Heart J 26:2721-7.
[5] Oosterhof T, van Straten A, Vliegen HW, et al., (2007) Preoperative thresholds
for pulmonary valve replacement in patients with corrected tetralogy of Fallot
using cardiovascular magnetic resonance. Circulation 116:545-51.
[6] Frigiola A, Tsang V, Bull C, et al., (2008) Biventricular response after
pulmonary valve replacement for right ventricular outflow tract dysfunction:
is age a predictor of outcome? Circulation 118:S182-90.
[7] Geva T, (2011) Repaired tetralogy of Fallot: the roles of cardiovascular
magnetic resonance in evaluating pathophysiology and for pulmonary valve
replacement decision support. J Cardiovasc Magn Reson 13:9.
[8] Yu CM, Lin H, Ho PC, et al., (2003) Assessment of left and right ventricular
systolic and diastolic synchronicity in normal subjects by tissue Doppler
echocardiography and the effects of age and heart rate. Echocardiography
20:19-27.
[9] D'Andrea A, Caso P, Sarubbi B, et al., (2004) Right ventricular myocardial
activation delay in adult patients with right bundle branch block late after
repair of Tetralogy of Fallot. Eur J Echocardiogr 5:123-31.

37
[10] Mueller M, Rentzsch A, Hoetzer K, et al. (2010) Assessment of interventricular
and right-intraventricular dyssynchrony in patients with surgically repaired
tetralogy of Fallot by two-dimensional speckle tracking. Eur J Echocardiogr
11:786-92.
[11] Cullen S, Shore D, Redington A, (1995) Characterization of right ventricular
diastolic performance after complete repair of tetralogy of Fallot. Restrictive
physiology predicts slow postoperative recovery. Circulation 91:1782-9.
[12] van den Berg J, Wielopolski PA, Meijboom FJ, et al., (2007) Diastolic function
in repaired tetralogy of Fallot at rest and during stress: assessment with MR
imaging. Radiology 243:212-9.
[13] Maceira AM, Prasad SK, Khan M, et al., (2006) Reference right ventricular
systolic and diastolic function normalized to age, gender and body surface
area from steady-state free precession cardiovascular magnetic resonance.
Eur Heart J 27:2879-88.
[14] Clarke CJ, Gurka MJ, Norton PT, et al., (2012) Assessment of the accuracy and
reproducibility of RV volume measurements by CMR in congenital heart
disease. JACC Cardiovasc Imaging 5:28-37.
[15] Alfakih K, Plein S, Thiele H, et al., (2003) Normal human left and right
ventricular dimensions for MRI as assessed by turbo gradient echo and
steady-state free precession imaging sequences. J Magn Reson Imaging
17:323-9.
[16] Mirvis DM, Goldberger AL, Electrocardiography. In: Bonow RO, Mann DL,
Zipes DP, Libby P, Braunwald E, editors. Braunwald's Heart Disease. Saunders
Elsevier, 2011.
[17] Frigiola A, Redington AN, Cullen S, et al., (2004) Pulmonary regurgitation is an
important determinant of right ventricular contractile dysfunction in patients
with surgically repaired tetralogy of Fallot. Circulation 110:II153-7.
[18] Sun AM, AlHabshan F, Cheung M, et al., (2011) Delayed onset of tricuspid
valve flow in repaired tetralogy of Fallot: an additional mechanism of diastolic
dysfunction and interventricular dyssynchrony. J Cardiovasc Magn Reson
13:43.
[19] Edwards R, Shurman A, Sahn DJ, et al., (2009) Determination of right
ventricular end systole by cardiovascular magnetic resonance imaging: a
standard method of selection. Int J Cardiovasc Imaging 25:791-6.
Ch
ap
ter 2
In
de
pe
nd
en
t ph
ase
sele
ction
C
ha
pte
r 2
Ind
ep
en
de
nt p
ha
se se
lectio
n

38

39
Improving the reproducibility of MR-derived
left ventricular volume and function
measurements with a semi-automatic
threshold-based segmentation algorithm
Karolien Jaspers
Hendrik G. Freling
Kees van Wijk
Elisabeth I. Romijn
Marcel J.W. Greuter
Tineke P. Willems
40
Abstract
Purpose: To validate a novel semi-automatic segmentation algorithm for MR-
derived volume and function measurements by comparing it with the standard
method of manual contour tracing.
Methods: The new algorithms excludes papillary muscles and trabeculae from the
blood pool, while the manual approach includes these objects in the blood pool.
An epicardial contour served as input for both methods. Multiphase 2D steady-
state free precession short axis images were acquired in 12 subjects with normal
heart function and in a dynamic anthropomorphic heart phantom on a 1.5T MR
system. In the heart phantom, manually and semi-automatically measured cardiac
parameters were compared to the true end-diastolic volume (EDV), end-systolic
volume (ESV) and ejection fraction (EF). In the subjects, the semi-automatic
method was compared to manual contouring in terms of difference in measured
EDV, ESV, EF and myocardial volume (MV). For all measures, intra- and inter-
observer agreement was determined.
Results: In the heart phantom, EDV and ESV were underestimated for both the
semi-automatic . As the papillary muscles were excluded from the blood pool with
the semi-automatic method, EDV and ESV were approximately 20 ml lower in the
patients, whereas EF was approximately 16 % higher. Intra- and inter-observer
agreement was overall improved with the semi-automatic method compared to
the manual method. Correlation between manual and semi-automatic
measurements was high (EDV: R = 0.99, ESV: R = 0.96; EF: R = 0.80, MV: R = 0.99).
Conclusion: The semi-automatic method could exclude endoluminal muscular
structures from the blood volume with significantly improved intra- and inter-
observer variabilities in cardiac function measurements compared to the
conventional, manual method, which includes endoluminal structures in the blood
volume.
Int J Cardiovasc Imaging. 2013 Mar;29(3):617-23
41
Introduction
Quantification of left ventricular (LV) volumes and mass is important for the
diagnostic and prognostic assessment in a variety of cardiovascular diseases [1,2].
The golden standard for assessment of these quantities is cardiovascular magnetic
resonance (CMR) imaging, due to its high reproducibility and accuracy [3,4]. The
current clinical practice is to manually draw epicardial and endocardial contours in
the end-diastolic and end-systolic phase of the cardiac cycle. The inclusion of the
papillary muscles in the blood volume introduces a considerable bias in the
measured volumes and ejection fraction [5]. This bias is generally accepted, as
manually excluding the papillary muscles by drawing non-convex endocardial
contours is even more time consuming and has demonstrated a higher intra- and
inter-observer variability [6].
However, reliable determination of trabecular volumes can be clinically
relevant in patients with left ventricular hypertrophy [7] or in patients with
noncompaction cardiomyopathy [8-10]. In these cases, automated segmentation
of blood and muscle could not only provide faster and more objective analysis, but
may also yield more accurate estimations of cardiac volumes and function than the
manual method. Several automated segmentation techniques have been
proposed, ranging from semi-automatic to fully automated [11-16]. They were,
however, not designed to separately assess trabecular and papillary muscle
volumes.
The purpose of our study was to validate a novel semi-automatic
segmentation algorithm by comparing it with the standard method of manual
contour tracing. In an anthropomorphic heart phantom, the accuracy of volume
and function measurement was assessed. In twelve subjects with normal cardiac
function, the effect of including papillary muscles and trabeculae in the myocardial
volume was investigated, and intra- and inter-observer agreement was assessed.
Ch
ap
ter 3
V
alid
atio
n o
f sem
i-au
tom
atic se
gm
en
tatio
n so
ftwa
re

42
Materials and methods
Heart phantom
A dynamic anthropomorphic heart phantom (Shelley Medical Imaging
Technologies, London, Ontario, Canada) was used to compare the semi-automatic
and manual method in terms of accuracy.
The heart phantom was made of a hydrogel filled with water, placed in a
water-filled tank. The phantom was connected to a mechanical pump that mimics
the cyclic filling and emptying of the heart. The ejection fraction (EF) was set at
61% (end-diastolic volume (EDV): 69 ml, end-systolic volume (ESV): 27 ml). During
acquisition, the heart rate was 44 beats per minute. The phantom has distinct
boundaries between the cavities and the wall, and does not include any
trabeculations nor papillary muscles.
Subjects
Analysis was performed on normal CMR scans obtained from twelve subjects
suspected of myocardial infarction. Normal CMR scans were defined as normal
anatomy, normal contractibility, normal volumes and function with no signs of
infarction. This retrospective study was approved by the University Medical Center
Groningen review board and informed consent was not required according to the
Dutch Medical Research Involving Human Subjects act.
Image acquisition
Heart phantom
Imaging was performed on a clinical 1.5 tesla scanner (Sonata, Siemens
Healthcare, Erlangen, Germany) equipped with a body array coil. A 2D steady-state
free precession (SSFP) sequence was used to acquire a series of multiphase short
axis images of the heart. The number of cardiac phases was 25, and 12 slices with
slice thickness 6 mm and interslice gap of 4 mm were acquired. Total TR was 40
ms, TE 1.2 ms and the flip angle was 80°. Matrix size was 144 × 192, and pixel size
1.7 × 1.7 mm.
Subjects
The subjects were positioned in a supine position in a 1.5T scanner (Avanto,
Siemens Healthcare, Erlangen, Germany) with a 6-element body matrix coil. The
protocol included multiple single-slice SSFP series with 25 cardiac phases. The
single slice images were positioned along the short axis of the left ventricle. To
cover the entire heart, 15 images with slice thickness 6 mm and interslice gap of 4

43
mm were acquired. Total TR was 45 ms, TE 1.3 ms and the flip angle was 80°.
Matrix size depended on subject size, and pixel size was 1.8 × 1.8 mm2.
Image analysis
Image analysis was performed manually by using QMass MR (version 7.2, Medis,
Leiden, The Netherlands) and semi-automatically by using QMass MR research
edition (Medis, Leiden, The Netherlands).
Slice selection: The end-systolic and end-diastolic frames were selected by
visual assessment. The basal slice was selected with the aid of long-axis cine view
images. The basal slice of the LV was defined as the most basal slice surrounded
for at least 50% by the LV myocardium. Slices at the apex were included when
blood was clearly visible. Contours were drawn manually by tracing the
endocardial and epicardial borders in every slice in end-systole and end-diastole.
Contour tracing was aided by reviewing the multiple phase scans in the movie
mode.
Manual method: For the manual method, the EDV and ESV were defined as
the total volume of voxels within the endocardial contour in the end-diastolic and
end-systolic phase, respectively. The myocardial volume (MV) was defined as the
total volume of voxels between the epicardial and epicardial contours in the end-
diastolic phase. The manual method included papillary muscles and trabeculae in
the endocardial contour and therefore the blood volume (see Figure 1a and c).
Figure 1. Segmentation
according to the manual
(panels a and c) and semi-
automatic method (panels b
and d) for the end-diastolic and
end-systolic phase (ED and ES,
respectively). For the manual
method, epi- and endocardial
contours (green and red lines,
respectively) are drawn. For
the semi-automatic method,
within the epicardial contour
voxels are classified as either
muscle (red) or blood (grey).
manual semi-automatic
E
S
E
D
Ch
ap
ter 3
V
alid
atio
n o
f sem
i-au
tom
atic se
gm
en
tatio
n so
ftwa
re

44
Semi-automatic method: The epicardial contour served as input for the semi-
automatic method. As the semi-automatic threshold-based segmentation
algorithm was an integral part of QMass, both methods used the same epicardial
contour. Within the epicardial contour, voxels were classified as either blood or
muscle based on their signal intensity. A detailed description of the segmentation
procedure can be found in Appendix I. The EDV and ESV were defined as the total
volume of voxels classified as blood within the epicardial contour. The MV was
defined as the total volume of voxels classified as muscle within the epicardial
contour in the end-diastolic phase. With the semi-automatic method, the papillary
muscles and trabeculae were excluded from the blood volume. For both methods,
the ejection fraction (EF) was defined as:
EF = EDV - ESV
EDV ∙ 100% (1)
Heart phantom: The deviation from the ground truth of both methods was
evaluated by comparing the EDV, ESV and EF with the predefined parameters of
the heart phantom. Contours were drawn by five observers, who were blinded for
each others results.
Subjects: To assess inter-observer agreement, contours were drawn by two
observers, who both repeated their measurements for intra-observer agreement
evaluation. Observer 1 had several years of experience and Observer 2 was
inexperienced. The observers were blinded for the outcomes of the other observer
and their previous measurements. The observers drew in the same amount of
slices, such that the comparison would be purely between methods and not on
how many slices each observer chose to include.
Statistical analysis
Statistical analysis was performed in SPSS (SPSS 18, Chicago IL, USA) For the heart
phantom study, a paired Wilcoxon signed rank test was used to assess the
difference in EDV, ESV and EF between the manual and semi-automatic method.
To see whether there was a significant difference between the ground truth and
measured values, a one-sample Wilcoxon signed rank test was applied.
For the subject study, the difference in measured EDV, ESV, MV and EF between
the manual and semi-automatic method was tested with a paired Wilcoxon signed
rank test, using the average of the four observations for each subject. The
correlation between both methods was assessed with the Pearson’s correlation
coefficient.

45
The intra-observer agreement coefficient (ACintra) between paired
observations was calculated for each observer:
ACintra = 100 ∙ �1 − 2 ∙ |Obs1 − Obs2|Obs1 + Obs2
� (2)
For each observer, the median ACintra was computed. Similarly, the inter-observer
agreement coefficient ACinter was computed. For each observer, the average of the
two paired observations was used. The difference in median AC between the
manual and semi-automatic method was tested with a paired Wilcoxon signed
rank test. Effects were considered significant for p < 0.05.
Ch
ap
ter 3
V
alid
atio
n o
f sem
i-au
tom
atic se
gm
en
tatio
n so
ftwa
re

46
Results
Heart phantom
Compared to the ground truth (ESVgt = 27 ml), the ESV was underestimated with
both the manual (median: 21.7; range: 18.4 – 22.6 ml; p = 0.04) and semi-
automatic method (median: 22.7 ml; range: 21.1 – 25.1 ml; p = 0.04). For the EDV
(EDVgt: 69 ml), a significant underestimation between measured volume and
ground truth was found for the manual method (median: 65.1 ml; range: 61.6 –
66.0 ml; p = 0.04), but not for the semi-automatic method (median: 67.8 ml; range:
66.0 – 69.4 ml; p = 0.09).
Underestimation of the EDV and ESV resulted in an overestimation of EF
(ground truth: 61 %) for both the manual (median: 67.2 %; range: 65.3 – 70.1 %; p
= 0.04) and semi-automatic method (median: 66.8 %; range: 63.9 – 68.0 %; p =
0.04).
Subjects
The correlation between the semi-automatic and manual method was high for all
parameters (EDV: R = 0.993, ESV: R = 0.958; EF: R = 0.800, MV: R = 0.991, see
Figure 2).
Figure 2 Correlation between the semi-automatic and manual method for (panel a) the end-
diastolic and end-systolic volumes (ESV (open squares) and EDV (black diamonds), respectively)
and myocardial volume (MV, crosses), as well as (panel b) the ejection fraction.
With the semi-automatic method, the EDV and ESV were lower compared to the
manual method (p < 0.01). The median difference between semi-automatic and
manual method, which reflected the volume of trabeculae and papillary muscles,

47
was 20 ml (range: 9 – 29 ml) for the EDV and 23 ml (range: 14 – 34 ml) for the ESV.
The difference in end-diastolic MV between the semi-automatic and manual
method was equal to the difference in EDV. With the semi-automatic method, the
estimated ejection fraction was approximately 16% higher (p < 0.01) compared to
the manual method (range: 8 – 24 %).
Overall, observer agreement was higher for the semi-automatic method
compared to the manual method (Figure 3). For the inexperienced observer 2, the
semi-automatic method gave a significantly higher intra-obsever agreement
coefficient for both the EDV (p = 0.03) and ESV (p < 0.05). In contrast, for the
experienced observer no difference in ACintra was found for the EDV (p = 0.53) or
ESV (p = 0.08). ACinter of the semi-automatic method was significantly improved for
the semi-automatic method compared to the manual method for the ESV (p =
0.04), but not for the EDV (p = 0.24).
For the ejection fraction, the semi-automatic method yielded a higher ACinter
(p = 0.03) and ACintra (p < 0.01 for observer 1 and p = 0.01 for observer 2)
compared to the manual method. The intra-observer agreement for the
myocardial volume determined with the semi-automatic method was significantly
improved for the inexperienced observer (p = 0.01), but not for the experienced
observer (p = 0.17). ACinter for MV was higher for the semi-automatic method
compared to the manual method (p < 0.01).
Ch
ap
ter 3
V
alid
atio
n o
f sem
i-au
tom
atic se
gm
en
tatio
n so
ftwa
re

48
Figure 3. Intra- and inter-observer coefficients of agreement for the manual (grey) and semi-
automatic method (white) for the end-diastolic (EDV, panel a ), end-systolic (ESV, panel b),
ejection fraction (EF, panel c) and myocardial volumes (panel d) . Observer 2 is the inexperienced
observer. * indicate a significant difference between the manual and semi-automatic method (p
< 0.05)

49
Discussion
In this study, a semi-automatic segmentation algorithm has been presented which
segments blood and muscle within a user-provided epicardial contour. The
algorithm was tested on CMR data of a dynamic heart phantom with known
volumes, and in subjects with normal heart function.
An important feature of the semi-automatic segmentation procedure was that
the papillary muscles and trabeculae were included in the myocardial volume
rather than in the blood volume. In the subject study, this led to notably lower
EDVs and ESVs with the semi-automatic method compared to the manual method.
It also has a pronounced effect on the ejection fractions, which were considerably
higher for the semi-automatic method. In this study, all ejection fractions found
with either method were within the normal range, and the recorded difference
would not be relevant for clinical decision-making. However, other studies have
demonstrated that including the papillary muscles and trabeculae in the
myocardial volume can have consequences for patient management [17],
especially in patients with myocardial hypertrophy [7]. Further research is needed
to indicate which measure is clinically most relevant.
Variations in drawing the contours was the main source of intra- and inter-
observer variations in both the semi-automatic and manual method. However, for
the semi-automatic method only the epicardial contour was required. Compared
to the endocardial contour, the epicardial contour is generally less user-
dependent, because the contrast between myocardium and surrounding tissues is
usually higher. Moreover, delineation of the endocardial contour was in most
subjects complicated by the presence of papillary muscles and trabeculae. This
was especially true for the ESV, where the endoluminal muscular structures lied
against the myocardial border. As a result, observer agreement was significantly
improved for the semi-automatic method compared to the manual method.
For the phantom, both the manual and semi-automatic method
underestimated the volumes. The discrepancy between true and measured
volumes may be caused by the exclusion of the most basal slice from the total
volume. Due to partial volume effects, no pure blood was present in this slice.
Inclusion would have led to overestimation of the blood volumes. Moreover,
because the delineation of the endocardial contour was less pronounced, it might
have increased the inter-observer variation for both the manual and semi-
automatic method.
In the phantom study, the semi-automatic method gave slightly larger blood
volumes than the manual method. This may indicate that the threshold value of 70
Ch
ap
ter 3
V
alid
atio
n o
f sem
i-au
tom
atic se
gm
en
tatio
n so
ftwa
re

50
% is too high for this situation. Whether this is only true for the heart phantom,
which in this experiment had a higher blood-myocardium contrast than a real
heart remains to be investigated.
Conclusion
With the semi-automatic method, endoluminal muscular structures could be
excluded from the blood volume with significantly improved intra- and inter-
observer agreement in cardiac function measurements compared to the
conventional, manual method.
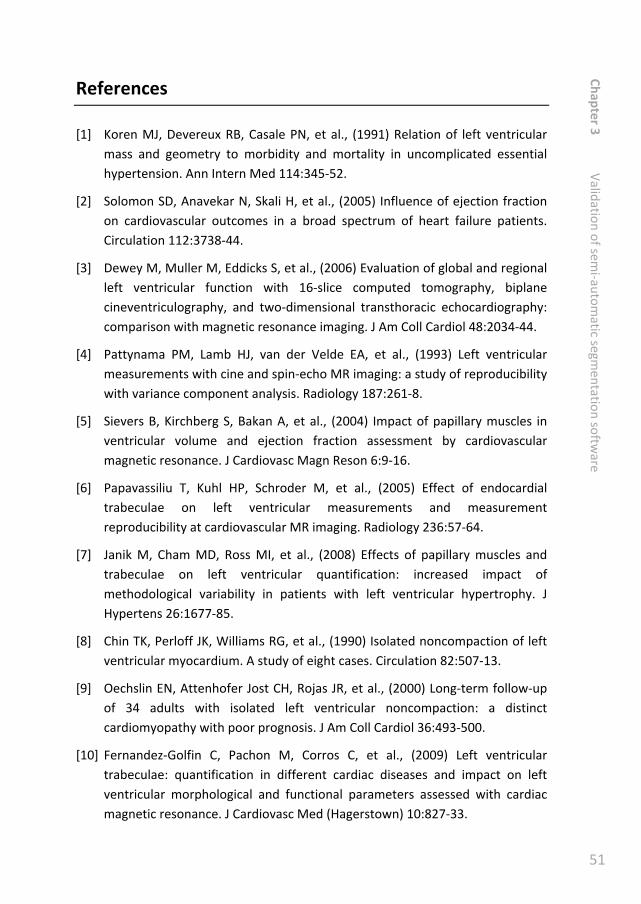
51
References
[1] Koren MJ, Devereux RB, Casale PN, et al., (1991) Relation of left ventricular
mass and geometry to morbidity and mortality in uncomplicated essential
hypertension. Ann Intern Med 114:345-52.
[2] Solomon SD, Anavekar N, Skali H, et al., (2005) Influence of ejection fraction
on cardiovascular outcomes in a broad spectrum of heart failure patients.
Circulation 112:3738-44.
[3] Dewey M, Muller M, Eddicks S, et al., (2006) Evaluation of global and regional
left ventricular function with 16-slice computed tomography, biplane
cineventriculography, and two-dimensional transthoracic echocardiography:
comparison with magnetic resonance imaging. J Am Coll Cardiol 48:2034-44.
[4] Pattynama PM, Lamb HJ, van der Velde EA, et al., (1993) Left ventricular
measurements with cine and spin-echo MR imaging: a study of reproducibility
with variance component analysis. Radiology 187:261-8.
[5] Sievers B, Kirchberg S, Bakan A, et al., (2004) Impact of papillary muscles in
ventricular volume and ejection fraction assessment by cardiovascular
magnetic resonance. J Cardiovasc Magn Reson 6:9-16.
[6] Papavassiliu T, Kuhl HP, Schroder M, et al., (2005) Effect of endocardial
trabeculae on left ventricular measurements and measurement
reproducibility at cardiovascular MR imaging. Radiology 236:57-64.
[7] Janik M, Cham MD, Ross MI, et al., (2008) Effects of papillary muscles and
trabeculae on left ventricular quantification: increased impact of
methodological variability in patients with left ventricular hypertrophy. J
Hypertens 26:1677-85.
[8] Chin TK, Perloff JK, Williams RG, et al., (1990) Isolated noncompaction of left
ventricular myocardium. A study of eight cases. Circulation 82:507-13.
[9] Oechslin EN, Attenhofer Jost CH, Rojas JR, et al., (2000) Long-term follow-up
of 34 adults with isolated left ventricular noncompaction: a distinct
cardiomyopathy with poor prognosis. J Am Coll Cardiol 36:493-500.
[10] Fernandez-Golfin C, Pachon M, Corros C, et al., (2009) Left ventricular
trabeculae: quantification in different cardiac diseases and impact on left
ventricular morphological and functional parameters assessed with cardiac
magnetic resonance. J Cardiovasc Med (Hagerstown) 10:827-33.
Ch
ap
ter 3
V
alid
atio
n o
f sem
i-au
tom
atic se
gm
en
tatio
n so
ftwa
re

52
[11] Codella NC, Weinsaft JW, Cham MD, et al., (2008) Left ventricle: automated
segmentation by using myocardial effusion threshold reduction and
intravoxel computation at MR imaging. Radiology 248:1004-12.
[12] Furber A, Balzer P, Cavaro-Menard C, et al., (1998) Experimental validation of
an automated edge-detection method for a simultaneous determination of
the endocardial and epicardial borders in short-axis cardiac MR images:
application in normal volunteers. J Magn Reson Imaging 8:1006-14.
[13] Graves MJ, Berry E, Eng AA, et al., (2000) A multicenter validation of an active
contour-based left ventricular analysis technique. J Magn Reson Imaging
12:232-9.
[14] Lynch M, Ghita O, Whelan PF, (2006) Automatic segmentation of the left
ventricle cavity and myocardium in MRI data. Comput Biol Med 36:389-407.
[15] van Geuns RJ, Baks T, Gronenschild EH, et al., (2006) Automatic quantitative
left ventricular analysis of cine MR images by using three-dimensional
information for contour detection. Radiology 240:215-21.
[16] van der Geest RJ, Lelieveldt BP, Angelie E, et al., (2004) Evaluation of a new
method for automated detection of left ventricular boundaries in time series
of magnetic resonance images using an Active Appearance Motion Model. J
Cardiovasc Magn Reson 6:609-17.
[17] Weinsaft JW, Cham MD, Janik M, et al., (2008) Left ventricular papillary
muscles and trabeculae are significant determinants of cardiac MRI
volumetric measurements: effects on clinical standards in patients with
advanced systolic dysfunction. Int J Cardiol 126:359-65.
[18] Farnebäck G, (2002) Polynomial Expansion for Orientation and Motion
Estimation.
[19] Otsu N, (1979) A Threshold Selection Method from Gray-Level Histograms.
Systems, Man and Cybernetics, IEEE Transactions on 9:62-6.
[20] Spreeuwers LJ, Bangma SJ, Meerwaldt RJHW, et al. (2005), Detection of
Trabeculae and Papillary Muscles in Cardiac MR Images. 2005:415-8.
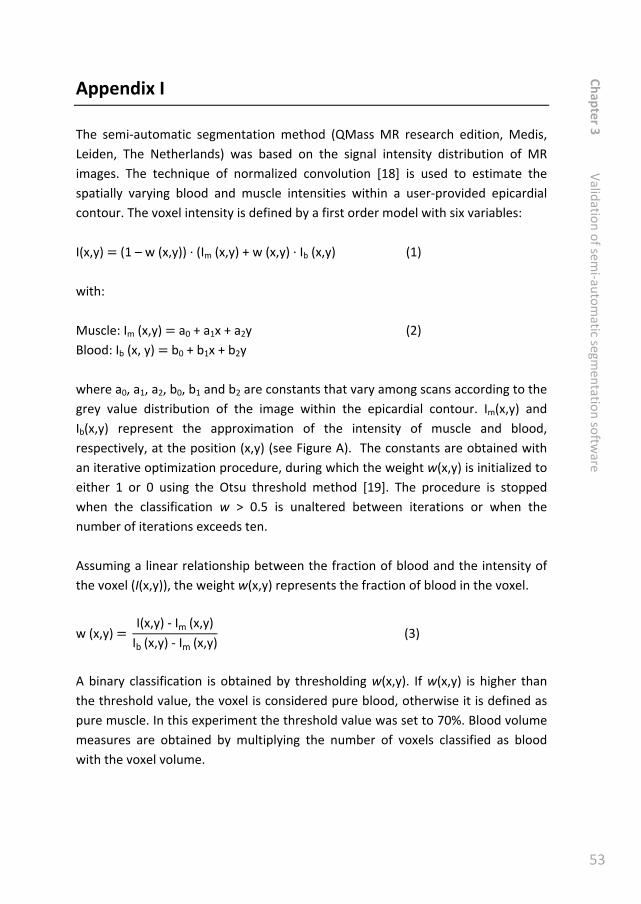
53
Appendix I
The semi-automatic segmentation method (QMass MR research edition, Medis,
Leiden, The Netherlands) was based on the signal intensity distribution of MR
images. The technique of normalized convolution [18] is used to estimate the
spatially varying blood and muscle intensities within a user-provided epicardial
contour. The voxel intensity is defined by a first order model with six variables:
I(x,y) = (1 – w (x,y)) ∙ (Im (x,y) + w (x,y) ∙ Ib (x,y) (1)
with:
Muscle: Im (x,y) = a0 + a1x + a2y (2)
Blood: Ib (x, y) = b0 + b1x + b2y
where a0, a1, a2, b0, b1 and b2 are constants that vary among scans according to the
grey value distribution of the image within the epicardial contour. Im(x,y) and
Ib(x,y) represent the approximation of the intensity of muscle and blood,
respectively, at the position (x,y) (see Figure A). The constants are obtained with
an iterative optimization procedure, during which the weight w(x,y) is initialized to
either 1 or 0 using the Otsu threshold method [19]. The procedure is stopped
when the classification w > 0.5 is unaltered between iterations or when the
number of iterations exceeds ten.
Assuming a linear relationship between the fraction of blood and the intensity of
the voxel (I(x,y)), the weight w(x,y) represents the fraction of blood in the voxel.
w (x,y) = I(x,y) - Im(x,y)
Ib(x,y) - Im(x,y)(3)
A binary classification is obtained by thresholding w(x,y). If w(x,y) is higher than
the threshold value, the voxel is considered pure blood, otherwise it is defined as
pure muscle. In this experiment the threshold value was set to 70%. Blood volume
measures are obtained by multiplying the number of voxels classified as blood
with the voxel volume.
Ch
ap
ter 3
V
alid
atio
n o
f sem
i-au
tom
atic se
gm
en
tatio
n so
ftwa
re

54
Note that this method does not distinct trabeculations from papillary muscle and
as such stands out from methods that do specifically target the papillary muscles
(See e.g. [20].
Figure A Segmentation procedure. Panel a shows a short axis view of the heart. The signal
intensities along the red line in panel a are represented in panel b. The algorithm fits two planes
(represented by the solid black lines) through the highest (blood) and lowest (muscle) signal
intensities within the epicardium. A threshold plane was defined at 70 % between the two
intensity planes. Voxels with signal intensities above this threshold are considered pure blood,
and voxels with signal intensities below this threshold are considered to be pure muscle.

55
Ch
ap
ter 3
V
alid
atio
n o
f sem
i-au
tom
atic se
gm
en
tatio
n so
ftwa
re

56

57
Impact of right ventricular endocardial
trabeculae on volumes and function assessed
by CMR in patients with tetralogy of Fallot
Hendrik G. Freling
Kees van Wijk
Karolien Jaspers
Petronella G. Pieper
Karin M. Vermeulen
Jeroen M. van Swieten
Tineke P. Willems

58
Abstract
Purpose: To assess the impact of right ventricular (RV) trabeculae and papillary
muscles on measured volumes and function assessed by cardiovascular magnetic
resonance imaging in patients with repaired tetralogy of Fallot.
Methods: Sixty-five patients with repaired tetralogy of Fallot underwent routine
cardiovascular magnetic resonance imaging. Endocardial and epicardial contours
were drawn manually and included trabeculae and papillary muscles in the blood
volume. Semi-automatic threshold-based segmentation software excluded these
structures. Both methods were compared in terms of end-diastolic, end-systolic
and stroke volume, ejection fraction and mass. Observer agreement was
determined for all measures.
Results: Exclusion of trabeculae and papillary muscle in the RV blood volume
decreased measured RV end-diastolic volume by 15% (from 140 ± 35 ml/m2 to 120
± 32 ml/m2) compared to inclusion, end-systolic volume by 21% (from 74 ± 23
ml/m2 to 59 ± 20 ml/m
2), stroke volume by 9% (from 66 ± 16 ml/m
2 to 60 ± 16
ml/m2) and relatively increased ejection fraction by 7% (from 48 ± 7% to 51 ± 8%)
and end-diastolic mass by 79% (from 28 ± 7 g/m2 to 51 ± 10 g/m
2), p<.01.
Excluding trabeculae and papillary muscle resulted in an improved interobserver
agreement compared to including these structures (coefficient of agreement of
87% vs 78%, p < .01)
Conclusions: Trabeculae and papillary muscle significantly affect measured RV
volumes, function and mass. Semi-automatic threshold-based segmentation
software can reliably exclude trabeculae and papillary muscles from the RV blood
volume.
Int J Cardiovasc Imaging. 2013 Mar;29(3):625-31

59
Introduction
Tetralogy of Fallot (ToF) is the most common congenital heart disease involving
the right ventricle (RV). Important complications during follow-up after repair for
ToF are RV volume overload. Longstanding volume overload can result in
irreversible RV dilation and dysfunction which can be prevented by timely
replacing the pulmonary valve [1-5]. Furthermore, many patients have some
amount of pressure overload caused by residual outflow tract obstruction,
stenosis of a pulmonary artery branch or stenosis of a valve prosthesis. Therefore,
evaluation of the RV is essential in the follow-up of patients with ToF [6,7].
Guidelines advise cardiac magnetic resonance imaging (CMR) as the primary
imaging modality for evaluation of RV volumes and function [6,7]. Consensus is
lacking on whether to consider trabeculae and papillary muscles as part of
measured RV volumes [8-10]. Including trabeculae and papillary muscles in RV
volumes results in larger measured volumes compared to measurements with
exclusion of these structures. In healthy subjects and patients without congenital
heart disease, the influence of trabeculae and papillary muscle on RV volumes is
too small to be of clinical importance [9]. The increase in papillary muscle and
trabeculae can be large in patients with a systemic right ventricle [10]. However,
no studies have addressed the influence of papillary muscle and trabeculae on
measured RV volumes in patients with repaired ToF. Studies in patients with ToF
including trabeculae and papillary muscles in the RV blood volume report larger RV
volumes and lower RV mass than studies excluding these structures [11-14].
Therefore, knowledge of the quantity of trabeculae and papillary muscles and the
possibility to estimate this amount could be of clinical importance in patients with
ToF.
The primary objective of our study was to determine the trabecular volume of
the RV and the reliability by which it can be measured in patients with repaired
ToF. The second objective was to create a mathematical model that describes the
relation between the RV volumes with and without inclusion of trabeculae and
papillary muscle in the RV blood volume.
Ch
ap
ter 4
R
V tra
be
cula
e a
nd
pa
pilla
ry m
uscle
s in te
tralo
gy o
f Fa
llot
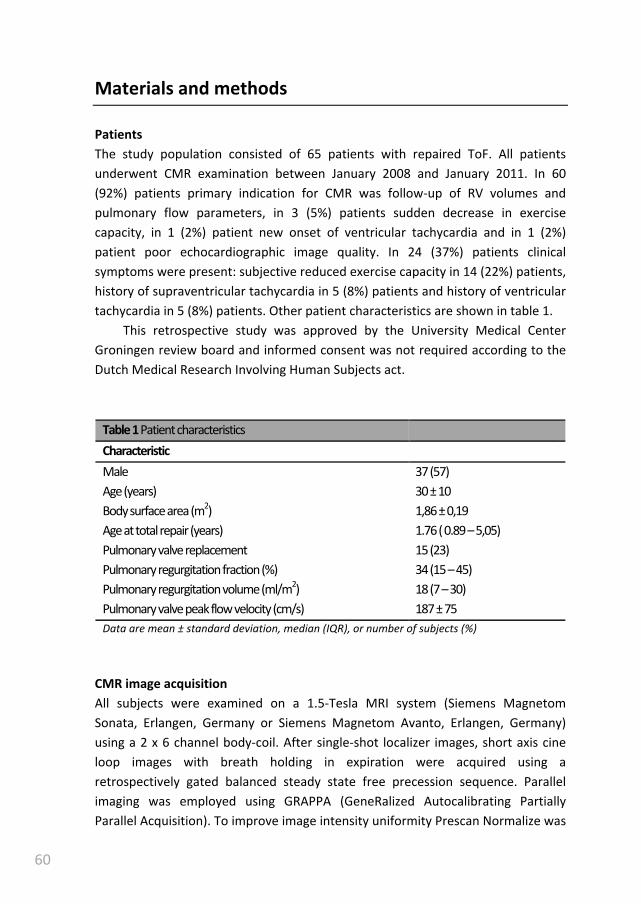
60
Materials and methods
Patients
The study population consisted of 65 patients with repaired ToF. All patients
underwent CMR examination between January 2008 and January 2011. In 60
(92%) patients primary indication for CMR was follow-up of RV volumes and
pulmonary flow parameters, in 3 (5%) patients sudden decrease in exercise
capacity, in 1 (2%) patient new onset of ventricular tachycardia and in 1 (2%)
patient poor echocardiographic image quality. In 24 (37%) patients clinical
symptoms were present: subjective reduced exercise capacity in 14 (22%) patients,
history of supraventricular tachycardia in 5 (8%) patients and history of ventricular
tachycardia in 5 (8%) patients. Other patient characteristics are shown in table 1.
This retrospective study was approved by the University Medical Center
Groningen review board and informed consent was not required according to the
Dutch Medical Research Involving Human Subjects act.
Table 1 Patient characteristics
Characteristic
Male 37 (57)
Age (years) 30 ± 10
Body surface area (m2) 1,86 ± 0,19
Age at total repair (years) 1.76 ( 0.89 – 5,05)
Pulmonary valve replacement 15 (23)
Pulmonary regurgitation fraction (%) 34 (15 – 45)
Pulmonary regurgitation volume (ml/m2) 18 (7 – 30)
Pulmonary valve peak flow velocity (cm/s) 187 ± 75
Data are mean ± standard deviation, median (IQR), or number of subjects (%)
CMR image acquisition
All subjects were examined on a 1.5-Tesla MRI system (Siemens Magnetom
Sonata, Erlangen, Germany or Siemens Magnetom Avanto, Erlangen, Germany)
using a 2 x 6 channel body-coil. After single-shot localizer images, short axis cine
loop images with breath holding in expiration were acquired using a
retrospectively gated balanced steady state free precession sequence. Parallel
imaging was employed using GRAPPA (GeneRalized Autocalibrating Partially
Parallel Acquisition). To improve image intensity uniformity Prescan Normalize was
61
used. Short axis slices were planned in end-diastole from two slices above the
mitral valve plane to the apex. The following parameters were used: TR 2.7 ms, TE
1.1 ms, flip angle 80o, matrix 192 x 192 mm, 25 frames per cycle, slice thickness 6
mm, interslice gap 4 mm, voxel size 1.7 x 1.7 x 6 mm.
Two-dimensional velocity encoded MRI flow measurements perpendicular
and directly cranial to the pulmonary valve was performed to quantify flow
velocity and volumes. Encoded velocity was 200 cm/s which was increased in steps
of 50 cm/s in case of aliasing.
CMR image analysis
Image analysis was performed manually by using QMass MR (version 7.2, Medis,
Leiden, The Netherlands) and semi-automatically by using QMass MR research
edition (Medis, Leiden, The Netherlands).
The end-systolic and end-diastolic frames of the RV were selected by visual
assessment. The basal slice was selected with aid of long-axis cine view images.
When the pulmonary valve was visible in the RV basal slice, only the portion of the
right ventricular outflow tract below the level of the pulmonary valve was
included. The inflow part of the RV was included in the RV volume. The RV inflow
part was distinguished from the right atrium by recognizing the trabeculated and
thick right ventricular wall compared to the thin right atrial wall [15]. RV contours
were drawn manually by tracing the endocardial and epicardial borders in every
slice in end-systole and end-diastole. Contour tracing was aided by reviewing the
multiple phase scans in the movie mode.
Two methods were used to measure RV volumes, function and mass (see
figure 1). Method 1 excluded papillary muscle and trabeculae from the RV blood
volume by using semi-automatic threshold-based segmentation software. Method
2 included these structures in the endocardial contour and therefore the blood
volume. The semi-automatic threshold-based segmentation software was based
on the signal intensity distribution of MR images. The voxels within the epicardial
contour were classified as either blood or muscle according to their signal
intensity, taking into account spatial variations in signal intensity. Based on their
signal intensity, trabeculae and pappilary muscles were included in the myocardial
volume. Users had the possibility to manually change the threshold level of signal
intensities above which voxels are depicted as blood for every slice. Selecting and
deselecting individual voxels was possible, for example in case of artefacts due to
mechanical pulmonary valve prosthesis. As the semi-automatic threshold-based
segmentation software was an integral part of QMass, both methods used the
Ch
ap
ter 4
R
V tra
be
cula
e a
nd
pa
pilla
ry m
uscle
s in te
tralo
gy o
f Fa
llot

62
same endocardial and epicardial contours. A more detailed description of the
segmentation procedure can be found in Appendix I of Chapter 3.
Figure 1. Two methods were used to measure RV volumes. In Method 1, trabeculae and papillary
muscle were excluded from the right ventricular volume with use of semi-automatic threshold-
based segmentation software (a). In Method 2, trabeculae and papillary muscle were included in
the right ventricular volume (b).
Stroke volume was defined as end-diastolic volume minus end-systolic
volume. Ejection fraction was defined as stroke volume divided by end-diastolic
volume. Mass is derived from myocardial volume after multiplying by the density
of cardiac muscle, 1.05 g/cm3. All volumes were indexed for Body Mass Index.
To obtain agreement between observers, 25 randomly selected CMR scans
were analysed by a second independent observer. For agreement within one
observer, the same 25 scans were analysed a second time by the first observer
with an interval of at least two weeks between the first and second analysis.
Statistical analyses
The Statistical Package for the Social Sciences version 16.0 (SPSS Inc, Chicago, IL)
was used for all statistical analyses. All statistical tests are two-sided and a P-value
of less than .05 was considered statistically significant.
Descriptive statistics were calculated as mean and standard deviation for
normally distributed continuous variables, median with interquartile range (IQR)
for non-normally distributed continuous variables and absolute numbers and
percentages for dichotomous variables. The manual and semi-automatic methods
were compared in terms of RV volume, mass and function by using the paired-
samples Student’s t-test.
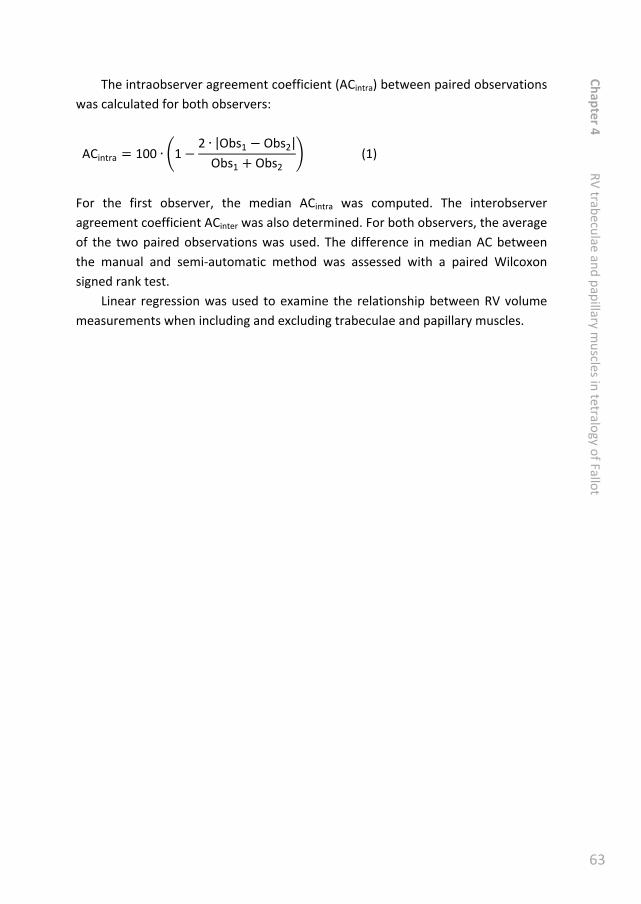
63
The intraobserver agreement coefficient (ACintra) between paired observations
was calculated for both observers:
ACintra = 100 ∙ �1 − 2 ∙ |Obs1 − Obs2|Obs1 + Obs2
� (1)
For the first observer, the median ACintra was computed. The interobserver
agreement coefficient ACinter was also determined. For both observers, the average
of the two paired observations was used. The difference in median AC between
the manual and semi-automatic method was assessed with a paired Wilcoxon
signed rank test.
Linear regression was used to examine the relationship between RV volume
measurements when including and excluding trabeculae and papillary muscles.
Ch
ap
ter 4
R
V tra
be
cula
e a
nd
pa
pilla
ry m
uscle
s in te
tralo
gy o
f Fa
llot

64
Results
RV volumes and function
Exclusion (Method 1) instead of inclusion (Method 2) of trabeculae and papillary
muscle in the RV blood volume resulted in a significant change in measured RV
volumes and function. When Method 1 was compared to Method 2, end-diastolic
volumes were 15 ± 4% (from 140 ± 35 ml/m2 to 120 ± 32 ml/m
2), end-systolic
volumes 21 ± 5% (from 74 ± 23 ml/m2 to 59 ± 20 ml/m
2) and stroke volumes 9 ±
5% (from 66 ± 16 ml/m2 to 60 ± 16 ml/m
2) smaller (p < .01). Ejection fractions were
7 ± 4% (from 48 ± 7% to 51 ± 8%) and the end-diastolic masses were 79 ± 21%
(from 28 ± 7 g/m2 to 51 ± 10 g/m
2) larger (p < .01). The difference in RV end-
diastolic volumes, RV end-systolic volumes, RV ejection fraction and RV end-
diastolic mass between Method 1 and Method 2 increased as volumes, ejection
fraction and mass became larger (see figure 2). Exclusion of trabeculae and
papillary muscle took an average of 67 ± 16 seconds extra time compared to
inclusion of these structures.
Observer agreement
The intra- and interobserver reproducibility data are shown in table 2. Observer
agreement was high in all measurements with exception of RV mass. Method 1
resulted in a significantly higher ACintra and ACinter for RV mass (p < .01). The ACintra
for RV end-diastolic volume was significantly higher for Method 2 (p = .02).
Model
The amount of trabeculae increased with increasing end-diastolic and end-systolic
volumes. Based on this relationship the following model was created:
RVexcl = a ∙ RVincl + b (2)
RVexcl and RVincl were RV volumes in which the trabeculae and papillary muscles
were excluded and included, respectively. For end-diastolic volumes the constant
a and b from equation 2 were .90 (95% CI .87 to .94) and -7.04 ml/m2 (95% CI -2.29
to -11.79 ml/m2), respectively. For end-systolic volumes, a was .87 (95% CI .84 to
.90) and b -5.30 ml/m2 (95% CI -2.64 to -7.96 ml/m
2).

65
Figure 2. Bland-Altman plots visualizing the differences between Method 1 and Method 2 for
measurements of (a) right ventricular end-diastolic volume, (b) right ventricular end-systolic
volume, (c) right ventricular stroke volume, (d) right ventricular ejection fraction and (e) right
ventricular end-diastolic mass. The X-axis depicts the mean value of Method 1 and Method 2 for
each parameter. The Y-axis depicts the difference in measurements between Method 1 and
Method 2. The continuous line represents the mean difference between Method 1 and Method 2
for each measurement and the dotted line represents the mean difference ± 1.96 standard
deviations between Method 1 and Method 2. RVED mass = right ventricular end-diastolic mass,
RVEDV = right ventricular end-diastolic volume, RVEF = right ventricular ejection fraction, RVESV
= right ventricular end-systolic volume, RVSV = right ventricular stroke volume.
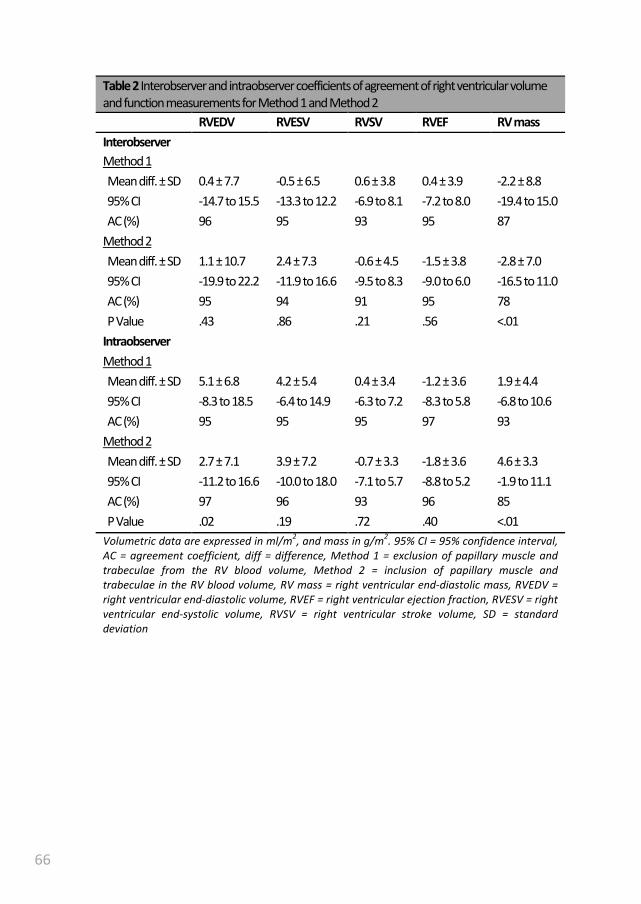
66
Table 2 Interobserver and intraobserver coefficients of agreement of right ventricular volume
and function measurements for Method 1 and Method 2
RVEDV RVESV RVSV RVEF RV mass
Interobserver
Method 1
Mean diff. ± SD 0.4 ± 7.7 -0.5 ± 6.5 0.6 ± 3.8 0.4 ± 3.9 -2.2 ± 8.8
95% CI -14.7 to 15.5 -13.3 to 12.2 -6.9 to 8.1 -7.2 to 8.0 -19.4 to 15.0
AC (%) 96 95 93 95 87
Method 2
Mean diff. ± SD 1.1 ± 10.7 2.4 ± 7.3 -0.6 ± 4.5 -1.5 ± 3.8 -2.8 ± 7.0
95% CI -19.9 to 22.2 -11.9 to 16.6 -9.5 to 8.3 -9.0 to 6.0 -16.5 to 11.0
AC (%) 95 94 91 95 78
P Value .43 .86 .21 .56 <.01
Intraobserver
Method 1
Mean diff. ± SD 5.1 ± 6.8 4.2 ± 5.4 0.4 ± 3.4 -1.2 ± 3.6 1.9 ± 4.4
95% CI -8.3 to 18.5 -6.4 to 14.9 -6.3 to 7.2 -8.3 to 5.8 -6.8 to 10.6
AC (%) 95 95 95 97 93
Method 2
Mean diff. ± SD 2.7 ± 7.1 3.9 ± 7.2 -0.7 ± 3.3 -1.8 ± 3.6 4.6 ± 3.3
95% CI -11.2 to 16.6 -10.0 to 18.0 -7.1 to 5.7 -8.8 to 5.2 -1.9 to 11.1
AC (%) 97 96 93 96 85
P Value .02 .19 .72 .40 <.01
Volumetric data are expressed in ml/m2, and mass in g/m
2. 95% CI = 95% confidence interval,
AC = agreement coefficient, diff = difference, Method 1 = exclusion of papillary muscle and
trabeculae from the RV blood volume, Method 2 = inclusion of papillary muscle and
trabeculae in the RV blood volume, RV mass = right ventricular end-diastolic mass, RVEDV =
right ventricular end-diastolic volume, RVEF = right ventricular ejection fraction, RVESV = right
ventricular end-systolic volume, RVSV = right ventricular stroke volume, SD = standard
deviation

67
Discussion
Our study is the first to show the impact of trabeculae and papillary muscle on RV
volume measurements in a large group of patients with repaired tetralogy of
Fallot. Semi-automatic threshold-based segmentation software provided a
reproducible method to differentiate myocardium from blood. Compared to
including papillary muscle and trabeculae from the RV blood volume, exclusion of
the papillary muscle and trabeculae in the RV blood volume resulted in
significantly decreased end-systolic and end-diastolic volumes and increased
ejection fraction and mass. Manually delineating RV trabeculae and papillary
muscles has a low reproducibility in patients with increased trabeculae and is time-
consuming [10]. Therefore, many studies in patients with ToF have included these
structures in the blood volume. Our study showed that with semi-automatic
threshold-based segmentation software it is possible to differentiate myocardium
from blood with a high reproducibility, which is in line with a previous report [11].
This creates the possibility to measure RV blood volume without inclusion of
trabeculae and papillary muscles. Inclusion or exclusion of trabeculae and papillary
muscles can have a profound effect on the measured volumes and mass. Our study
showed a decrease of 21% in end-systolic volume and 15% in end-diastolic volume
when these structures were excluded from the RV blood pool. The change in
measured RV mass was very large with an increase of 79%.
Most patients with repaired ToF are considered to mainly have a volume-
overloaded. We expected the trabeculae to blood volume ratio to be much less in
our patients with ToF than reported in patients with systemic RVs. However,
compared to patients with systemic RVs in a study by Winter et al., the change in
volume was similar in patients with repaired ToF for end-diastolic volume (15% for
both groups) and smaller for the end-systolic volume (21% vs 27%) when
trabeculae and papillary muscle were excluded from the RV blood pool [10]. It is
difficult to compare our results with those from the study by Winter et al. as they
delineated trabeculae and papillary muscles manually to differentiate blood from
muscle, instead of semi-automatic with threshold-based segmentation software.
In our study, no direct comparison was made between these two methods
because of the aforementioned disadvantages of manually delineating trabeculae
and papillary muscles [10].
Although the amount of trabeculae and papillary muscles should be the same
in end-systole and end-diastole, stroke volume was 6 ml/m2 larger when including
compared to excluding these structures. A possible explanation is that the amount
of trabeculae in end-systole was underestimated. Discriminating trabeculae from
Ch
ap
ter 4
R
V tra
be
cula
e a
nd
pa
pilla
ry m
uscle
s in te
tralo
gy o
f Fa
llot

68
RV wall is difficult in end-systole due to compression of the trabeculae against the
RV wall. Therefore, contour tracing was aided by reviewing the multiple phase
scans in the movie mode. Based on movement and position of the trabeculae
during the entire heart cycle, it was possible to interpolate the position of the
endocardial contour. Some of the trabeculae were possibly considered to be RV
wall in end-systole and not in end-diastole. Another explanation is that the
amount of trabeculae was overestimated in end-diastole. Trabeculae can be better
distinguished from the RV wall in end-diastole. However, this will result in more
voxels containing both blood and trabeculae and too much of these voxels were
possibly considered to be trabuculae and not blood.
The existing RV reference values are based on RV volumes including
trabeculae and papillary muscles. When papillary muscles and trabeculae are
excluded from the blood volume, use of these reference values is no longer valid.
Until new reference values are developed in which the trabeculae and papillary
muscles are excluded, it is possible to use the proposed model in patients with ToF
to allow comparison with the old reference values. The same applies to the
application of threshold values. An important threshold is the use of RV end-
diastolic volume for timing pulmonary valve replacement in patients with ToF [1-
5]. The reported thresholds range from 82 to 90 ml/m2 for end-systolic volume and
150 to 170 ml/m2 for end-diastolic volumes. Some of these differences may be
explained by including or excluding trabeculae and papillary muscles in the
measured volumes. Unfortunately, only one of these studies reported whether
they included RV trabeculae and papillary muscles in the measured volumes [2].
Limitations and future perspectives
A gold standard for the amount of endocardial trabeculae of the RV is lacking.
Therefore, a validation in vivo was not possible. However, exclusion of trabeculae
and papillary muscle should be theoretically more accurate as these structures are
part of the myocardium and not blood.
In our study, measurements of RV volumes and function were highly
reproducibility. However, an axial orientation could have resulted in an even
higher reproducibility and also a higher accuracy in patients with a severely dilated
RV [16,17].
Our study was limited to patients with repaired ToF as this is the most
common severe congenital heart disease in adult patients. To determine the
influence of trabeculae in the RV volume in other patient groups, more research is
required. Our study showed that semi-automatic threshold-based segmentation
software is a valuable tool for further research in this area.
69
Conclusion
RV endocardial trabeculae significantly influence measured RV volumes and mass.
Exclusion compared to inclusion of trabeculae and papillary muscle in the RV blood
volume results in a significantly decrease in measured end-systolic and end-
diastolic volume and increase in measured ejection fraction and mass. Semi-
automatic threshold-based segmentation software can exclude trabeculae and
papillary muscles from the RV blood volume in a reproducible manner. Currently
used ranges and thresholds for congenital heart disease patients should be re-
established, as new threshold-based algorithms will become available in clinical
practice.
Ch
ap
ter 4
R
V tra
be
cula
e a
nd
pa
pilla
ry m
uscle
s in te
tralo
gy o
f Fa
llot

70
References
[1] Therrien J, Provost Y, Merchant N, et al., (2005) Optimal timing for pulmonary
valve replacement in adults after tetralogy of Fallot repair. Am J Cardiol
95:779-82.
[2] Buechel ER, Dave HH, Kellenberger CJ, et al., (2005) Remodelling of the right
ventricle after early pulmonary valve replacement in children with repaired
tetralogy of Fallot: assessment by cardiovascular magnetic resonance. Eur
Heart J 26:2721-7.
[3] Oosterhof T, van Straten A, Vliegen HW, et al., (2007) Preoperative thresholds
for pulmonary valve replacement in patients with corrected tetralogy of Fallot
using cardiovascular magnetic resonance. Circulation 116:545-51.
[4] Frigiola A, Tsang V, Bull C, et al., (2008) Biventricular response after
pulmonary valve replacement for right ventricular outflow tract dysfunction:
is age a predictor of outcome? Circulation 118:S182-90.
[5] Geva T, (2011) Repaired tetralogy of Fallot: the roles of cardiovascular
magnetic resonance in evaluating pathophysiology and for pulmonary valve
replacement decision support. J Cardiovasc Magn Reson 13:9.
[6] Baumgartner H, Bonhoeffer P, De Groot NM, et al., (2010) ESC Guidelines for
the management of grown-up congenital heart disease (new version 2010).
Eur Heart J 31:2915-57.
[7] Warnes CA, Williams RG, Bashore TM, et al., (2008) ACC/AHA 2008 Guidelines
for the Management of Adults with Congenital Heart Disease: a report of the
American College of Cardiology/American Heart Association Task Force on
Practice Guidelines (writing committee to develop guidelines on the
management of adults with congenital heart disease). Circulation 118:e714-
833.
[8] Kilner PJ, Geva T, Kaemmerer H, et al., (2010) Recommendations for
cardiovascular magnetic resonance in adults with congenital heart disease
from the respective working groups of the European Society of Cardiology.
Eur Heart J 31:794-805.
[9] Sievers B, Kirchberg S, Bakan A, et al., (2004) Impact of papillary muscles in
ventricular volume and ejection fraction assessment by cardiovascular
magnetic resonance. J Cardiovasc Magn Reson 6:9-16.

71
[10] Winter MM, Bernink FJ, Groenink M, et al., (2008) Evaluating the systemic
right ventricle by CMR: the importance of consistent and reproducible
delineation of the cavity. J Cardiovasc Magn Reson 10:40.
[11] Beerbaum P, Barth P, Kropf S, et al., (2009) Cardiac function by MRI in
congenital heart disease: impact of consensus training on interinstitutional
variance. J Magn Reson Imaging 30:956-66.
[12] Mooij CF, de Wit CJ, Graham DA, et al., (2008) Reproducibility of MRI
measurements of right ventricular size and function in patients with normal
and dilated ventricles. J Magn Reson Imaging 28:67-73.
[13] Samyn MM, Powell AJ, Garg R, Sena L, et al., (2007) Range of ventricular
dimensions and function by steady-state free precession cine MRI in repaired
tetralogy of Fallot: right ventricular outflow tract patch vs. conduit repair. J
Magn Reson Imaging 26:934-40.
[14] Davlouros PA, Kilner PJ, Hornung TS, et al., (2002) Right ventricular function in
adults with repaired tetralogy of Fallot assessed with cardiovascular magnetic
resonance imaging: detrimental role of right ventricular outflow aneurysms or
akinesia and adverse right-to-left ventricular interaction. J Am Coll Cardiol
40:2044-52.
[15] Alfakih K, Plein S, Thiele H, et al., (2003) Normal human left and right
ventricular dimensions for MRI as assessed by turbo gradient echo and
steady-state free precession imaging sequences. J Magn Reson Imaging
17:323-9.
[16] Clarke CJ, Gurka MJ, Norton PT, et al., (2012) Assessment of the accuracy and
reproducibility of RV volume measurements by CMR in congenital heart
disease. JACC Cardiovasc Imaging 5:28-37.
[17] Fratz S, Schuhbaeck A, Buchner C, et al., (2009) Comparison of accuracy of
axial slices versus short-axis slices for measuring ventricular volumes by
cardiac magnetic resonance in patients with corrected tetralogy of fallot. Am J
Cardiol 103:1764-9.
Ch
ap
ter 4
R
V tra
be
cula
e a
nd
pa
pilla
ry m
uscle
s in te
tralo
gy o
f Fa
llot

72

73
Pressure overloaded right ventricles: a
multicenter study on the importance of
trabeculae in right ventricular function
measured by CMR
Mieke M.P. Driessen
Vivan J.M. Baggen
Hendrik G. Freling
Petronella G. Pieper
Arie P. van Dijk
Pieter A. Doevendans
Repke J. Snijder
Marco C. Post
Folkert J. Meijboom
Gertjan Tj. Sieswerda
Tim Leiner
Tineke P. Willems

74
Abstract
Objectives: Cardiac magnetic resonance imaging (CMR) is the preferred method to
measure right ventricular (RV) volumes and ejection fraction (RVEF). This study
aimed to determine the impact of trabeculae and papillary muscles on RV volumes
and function in patients with pressure overloaded RVs and its reproducibility using
semi-automatic software.
Material and methods: Eighty patients with pressure overloaded RVs (pulmonary
hypertension, transposition of the great arteries after arterial switch operation
and after atrial switch procedure and repaired tetralogy of Fallot) and 20 healthy
controls underwent short-axis multislice cine CMR. End-diastolic volume (EDV),
end-systolic volume, RV mass and RVEF were measured using 2 methods and
compared using paired samples T-test. First, manual contour tracing of RV endo-
and epicardial borders was performed. Thereafter, trabeculae were excluded from
the RV blood volume using semi-automatic pixel-intensity based software. Twenty-
five datasets were re-analyzed, to assess intra- and interobserver agreement.
Results: Exclusion of trabeculae resulted in significantly decreased EDV; ranging
from a decrease of -5.7 ± 1.7 ml/m2
in healthy controls to -29.2 ± 6.6 ml/m2 in
patients after atrial switch procedure. RVEF significantly increased in all groups,
ranging from an absolute increase of 3.4 ± 0.8% in healthy controls up to 10.1 ±
2.3% in patients after atrial switch procedure. Observer agreement was high for all
measurements.
Conclusions: In patients with pressure overloaded RVs exclusion of trabeculae
from the blood volume results in a significant change in RV volumes, RVEF and RV
mass and is highly reproducible when semi-automatic pixel-intensity based
software is used.
Accepted in Int J Cardiovasc Imaging
75
Introduction
Both in patients with pulmonary hypertension (PH) and in patients with different
types of congenital heart disease (CHD), the right ventricle (RV) performs under
increased pressure loading. The RV adapts by hypertrophying, however at a certain
point the RV is unable to cope with the increased pressures and RV failure will
ensue. Consequently, RV function is an important determinant of prognosis and of
therapeutic strategy in these patients. For instance, in patients with pulmonary
valvular (PV) stenosis, timing of intervention is partly dependent on RV function
[1]. In patients with PH, deterioration of RV ejection fraction (RVEF), increased RV
end-diastolic volume (RVEDV) and stroke index are associated with poor outcome
[2,3]. Furthermore, for patients with systemic RV after atrial switch operation,
decline in RV function is one of the most important clinical problems. Therefore RV
volumes and function are used frequently in follow-up of these patients, making
accurate and reproducible measurements highly important.
As 2D and also 3D echocardiography of the RV remain less accurate and
reproducible than cardiac magnetic resonance imaging (CMR), the latter is still
considered to be the reference standard for the quantification of RV volumes and
EF [4-7]. Whether trabeculae and papillary muscles should be included or excluded
from the blood volume is subject of debate. Throughout literature both methods
are used [2,8-10]. However, in many studies it is not clearly described whether
trabeculae and papillary muscles were included or excluded from the RV blood
volume [11-14]. The impact of trabeculae is assumed to be small in healthy
individuals, but Winter et al. showed that exclusion of trabeculae from the RV
blood volume resulted in a substantial difference of RVEDV, RV end-systolic
volume (RVESV) and RVEF in patients with a systemic right ventricle[15]. Although
theoretically more accurate, Winter et al. also showed that manual tracing of
trabeculae has low reproducibility and therefore can be considered less favorable
for longitudinal follow-up [5,15].
Freling et al. recently reported that semi-automatic pixel-intensity based
segmentation software is able to exclude trabeculae and papillary muscles from
the RV blood volume with high reproducibility in tetralogy of Fallot (ToF) patients
with volume overloaded RVs. Moreover, this resulted in a substantial difference in
RV volumes and RVEF compared to the standard method which includes these
structures in the RV blood volume [16]. However, impact and reproducibility of
excluding trabeculae and papillary muscles with this semi-automatic software in
patient groups with RV pressure overload has not been investigated.
Ch
ap
ter 5
T
rab
ecu
lae
an
d p
ap
illary
mu
scles in
RV
pre
ssure
ove
rloa
d
76
The purpose of the current study was to determine the impact of trabeculae
and papillary muscles on RV volumes and function as assessed by CMR in different
patient groups with pressure overloaded RVs and to determine the reproducibility
of this methodology when semi-automatic pixel-intensity based software is used.

77
Methods
Study design and population
One hundred patients were included in the analysis (median age 36.2 years, 51%
male). Four groups of 20 adult patients with pressure overloaded RV’s were
analyzed: patients with pre-capillary PH, patients with right ventricular outflow
tract obstruction (RVOTO) after arterial switch operation (ASO) for transposition of
the great arteries (TGA), patients with repaired ToF and patients with TGA and
atrial switch procedure (Mustard or Senning operation). A reference group of 20
healthy controls was also included.
Pre-capillary PH was defined as a mean pulmonary artery pressure of ≥ 25
mmHg and a pulmonary capillary wedge pressure of ≤ 15 mmHg in accordance
with ESC/ESR guidelines [17]. All patients with PH had an established diagnosis of
either chronic thrombo-embolic PH or idiopathic PH. In all patients RV systolic
pressure (RVSP) was measured using Doppler echocardiography on the day of CMR
investigation. RVSP was measured using the peak velocity of tricuspid insufficiency
plus estimated right atrial pressure. Patients with repaired ToF were included if a
RVSP of ≥ 36 mmHg was measured by Doppler echocardiography [18]. Patients
after ASO were included if RVSP measured by Doppler echocardiography was ≥ 36
mmHg or if, using Doppler echocardiography, a mild or moderate RVOTO was
measured, defined as a maximum gradient of ≥ 25 mmHg. For patients with TGA
and atrial switch procedure systolic blood pressure was used to determine RVSP.
Basic patient characteristics for each patient group are illustrated in table 1.
In this retrospective study, MR images from two tertiary referral hospitals
were analyzed. One centre contributed 59 patient CMR datasets and 20 control
subjects. The second centre provided the remaining 21 patient CMR datasets. The
datasets in this study were obtained between May 2008 and July 2012. Prior to
analysis, all patient and control data were encoded to preserve anonymity. All
CMR datasets were acquired in a routine clinical setting and anonymized for
analysis. The medical ethics committees waived the need for informed consent.
CMR imaging protocol
Datasets were obtained using commercially available 1.5 T MR imagers (Ingenia
R4.1.2; Philips Healthcare, Best, The Netherlands [n = 79]; Magnetom Sonata,
Siemens Healthcare; [n = 7] and Magnetom Avanto; Siemens Healthcare, Erlangen,
Germany [n = 14]). For all studies dedicated chest or torso phased array parallel-
imaging capable surface coils were used with 12-28 elements. CMR images were
acquired during repeated end-expiratory breath holds. Cine images were acquired
Ch
ap
ter 5
T
rab
ecu
lae
an
d p
ap
illary
mu
scles in
RV
pre
ssure
ove
rloa
d

78
using a retrospectively gated balanced steady state free precession sequence with
25-30 cardiac phases per cardiac cycle. Slice thickness varied between 6-8 mm
with an interslice gap of 0 - 4 mm. Sequences included multi-slice, multi-phase cine
short-axis, longitudinal four-chamber, vertical two-chamber and RV outflow views.
The multi-slice cine short-axis acquisitions were planned from above the mitral
valve up to and including the cardiac apex. The following ranges of other scan
parameters was used: TR 2.7 - 3.4 ms; TE 1.1 - 1.7 ms; flip angle 80o – 90
o; matrix
171 - 192; voxel size: 1.25 x 1.25 x 8.0 mm and 1.7 x 1.7 x 6.0 mm. Parallel imaging
factors varied between 0 - 3.
Table 1. Patient characteristics
PH
n = 20
ASO
n = 20
ToF
n = 20
Atrial Switch
n = 20
Controls
n = 20
Male gender (n (%)) 7 (35) 11 (55) 11 (55) 12 (60) 10 (50)
Age (year) * 55.0 ± 14.1 24.9 ± 4.0 29.1 ± 7.8 33.0 ± 6.3 36.7 ± 10.1
BSA (m2) * 1.93 ± 0.18 1.88 ± 0.18 1.87 ± 0.19 1.96 ± 0.21 1.88 ± 0.21
RVESP (mmHg) #
54 (37-65)
n = 20
40 (37-53)
n = 15
45 (41-50)
n = 20
120(106-125)
n = 20
-
RVOT (mmHg) # - 35 (29-42)
n = 8
33 (30-40)
n = 15
- 4 (3-8)
n = 20
# Data presented as median (IQR) ,* Data presented as mean ± SD. ASO = arterial switch
operation, BSA = body surface area, PH = pulmonary hypertension, RVESP = right ventricular
esnd-systolic pressure, RVOT = right ventricular outflow tract, ToF = tetralogy of Fallot.
CMR image analysis
Image analysis was performed using Qmass MR Research edition version 7.4.14.0
(Medis, Leiden, the Netherlands) [16]. Segmentation was performed on end-
diastolic and end-systolic phases only. End-diastolic and end-systolic phases were
selected by visual assessment as the phase with the largest and smallest RV cavity
sizes, taking into account the longitudinal four-chamber, vertical two-chamber and
RV outflow tract as reference views. If visual assessment was difficult, multiple
frames were contoured to determine the correct end-diastolic or end-systolic
phase. Using a previously described RV analysis protocol the RV epicardial and
endocardial contours were manually traced from the most apical to the most basal
short-axis slice [19]. Only the portion of the outflow tract below the pulmonary
valve was included in the blood volume in the basal slice in which the pulmonary

79
valve was visible. If more than 50% of the tricuspid annulus or atrium was visible in
a basal slice the valve area was excluded from the blood volume. Epi- and
endocardial contours overlapped at valve borders and septum as the septum was
considered part of the left ventricle. For patients with systemic RV, the septum
was included in the myocardial mass of the RV.
Figure 1. RV contours and semi-automatic selection of trabeculae.Two methods of measuring RV
volumes in a healthy control (A) and patient after atrial switch procedure (B). Method 1: inclusion
trabeculae in the blood volume (A-1 and B-1); Method 2: exclusion of trabeculae from the blood
volume, using identical endocardial contours (A-2 and B-2).
Based on the methodology described above, two methods were used for
determining RV volumes, function and mass. With method 1 trabeculae and
Ch
ap
ter 5
T
rab
ecu
lae
an
d p
ap
illary
mu
scles in
RV
pre
ssure
ove
rloa
d

80
papillary muscles were included in the blood volume. With method 2, trabeculae
and papillary muscles were excluded from the blood volume (Figure 1). Selection
of trabeculae and papillary muscles was done using a semi-automatic threshold-
based segmentation software. The segmentation software is based on the signal
intensity distribution of MR images and has been described in detail by Freling et
al [16]. In brief, voxels within the epicardial contour are classified as either blood
or muscle according to their signal intensity, taking into account spatial variations
in signal intensity. Based on this algorithm, trabeculae and papilary muscles were
excluded from the blood volume and included in the myocardial volume. It is a
possibility to manually change the thresholds for every slice, in order to select the
same trabeculae in end- diastole and end-systole. Observers selected only
trabeculae with signal intensity similar to the intensity of right ventricular
myocardium. Selection and deselection of individual voxels was also possible in
case of artifacts due to nonlaminar flow.
For both methods RV volumetric parameters were calculated by the sums of
the traced contours multiplied by slice thickness in all short-axis slices. For method
1 the volume of trabeculae and papillary muscles were included in the RV blood
volume and for method 2 they were excluded from the blood volume. Stroke
volume (SV) was defined by the difference between end diastolic volume (EDV)
and end systolic volume (ESV). All volumetric data were indexed for body surface
area (BSA), which was calculated using the Dubois-Dubois formula (0.20247 x
Height(m)0.725
x Weight(kg)0.425
). EF was calculated by SV/ EDV * 100%. For
method 1 myocardial volume was defined as epicardial minus the endocardial
contour, for method 2 end-diastolic trabecular volume was added to the
myocardial volume. RV mass was quantified by multiplying the specific density of
myocardium (1.05 g/ml) with the end-diastolic myocardial volume.
Reproducibility
Intraobserver reproducibility of both methods was assessed by re-analyzing 5
randomly selected CMR datasets from every patient group, as well as the healthy
control subjects by the primary observer. In total 25 datasets were reanalyzed. To
determine interobserver variability a second observer re-analyzed the same 25
datasets. Observers were blinded for earlier results and there was an interval of at
least two weeks between the first and second analysis. The observers had equal
experience in RV volumetric analysis and received the same training for Qmass MR
research edition.
Statistical analysis

81
Continuous data were expressed as median and interquartile range (IQR) or mean
value ± standard deviation (SD) as appropriate. Mean differences ± SD between
method 1 and 2 was calculated for RVEDV/m2, RVESV/m2, RVSV/m
2, RVEF and RV
mass/m2, using Paired Student’s T-test. Differences in RVEDV/m
2, RVESV/m
2 and
RVEF found in the patient groups were compared to the healthy control group
using a one-way ANOVA with posthoc Dunnett’s test. For the one-way ANOVA
data underwent logarithmic transformation if necessary (i.e. if homogeneity of
variances was inequal). P-values of <0.05 were considered statistically significant.
Intra- and interobserver agreement were assessed using Bland-Altman plots
and intraclass correlation coefficients (ICC). Paired Student’s T-test was used to
test for significant differences between observer 1 and 2 and between the first and
second measurements of observer 1. Mean differences ± SD for all measurements
were calculated. All data analysis was performed in IBM SPSS statistics version 20.0
(IBM SPSS, Chicago, IL).
Ch
ap
ter 5
T
rab
ecu
lae
an
d p
ap
illary
mu
scles in
RV
pre
ssure
ove
rloa
d
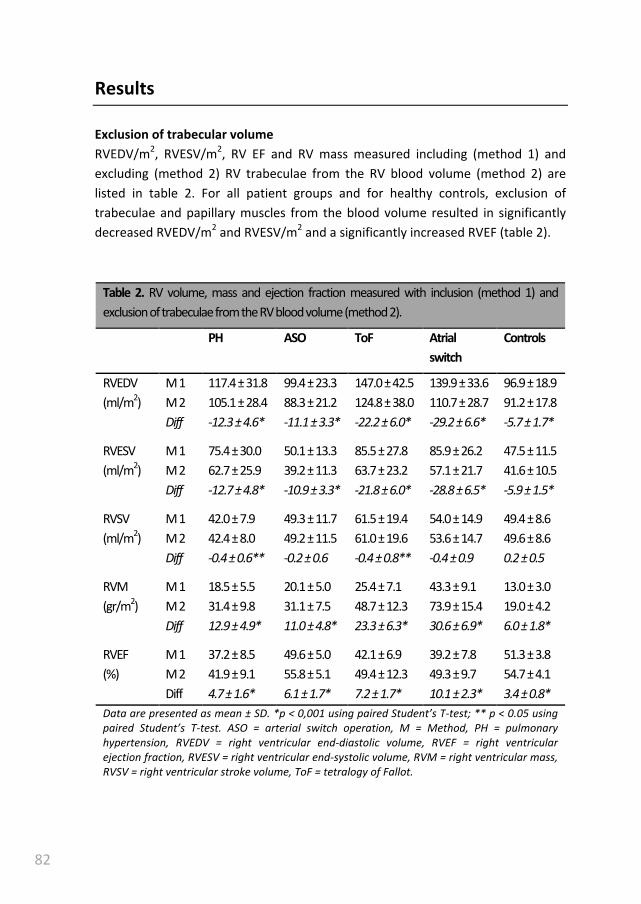
82
Results
Exclusion of trabecular volume
RVEDV/m2, RVESV/m
2, RV EF and RV mass measured including (method 1) and
excluding (method 2) RV trabeculae from the RV blood volume (method 2) are
listed in table 2. For all patient groups and for healthy controls, exclusion of
trabeculae and papillary muscles from the blood volume resulted in significantly
decreased RVEDV/m2 and RVESV/m
2 and a significantly increased RVEF (table 2).
Table 2. RV volume, mass and ejection fraction measured with inclusion (method 1) and
exclusion of trabeculae from the RV blood volume (method 2).
PH ASO ToF Atrial
switch
Controls
RVEDV
(ml/m2)
M 1
M 2
Diff
117.4 ± 31.8
105.1 ± 28.4
-12.3 ± 4.6*
99.4 ± 23.3
88.3 ± 21.2
-11.1 ± 3.3*
147.0 ± 42.5
124.8 ± 38.0
-22.2 ± 6.0*
139.9 ± 33.6
110.7 ± 28.7
-29.2 ± 6.6*
96.9 ± 18.9
91.2 ± 17.8
-5.7 ± 1.7*
RVESV
(ml/m2)
M 1
M 2
Diff
75.4 ± 30.0
62.7 ± 25.9
-12.7 ± 4.8*
50.1 ± 13.3
39.2 ± 11.3
-10.9 ± 3.3*
85.5 ± 27.8
63.7 ± 23.2
-21.8 ± 6.0*
85.9 ± 26.2
57.1 ± 21.7
-28.8 ± 6.5*
47.5 ± 11.5
41.6 ± 10.5
-5.9 ± 1.5*
RVSV
(ml/m2)
M 1
M 2
Diff
42.0 ± 7.9
42.4 ± 8.0
-0.4 ± 0.6**
49.3 ± 11.7
49.2 ± 11.5
-0.2 ± 0.6
61.5 ± 19.4
61.0 ± 19.6
-0.4 ± 0.8**
54.0 ± 14.9
53.6 ± 14.7
-0.4 ± 0.9
49.4 ± 8.6
49.6 ± 8.6
0.2 ± 0.5
RVM
(gr/m2)
M 1
M 2
Diff
18.5 ± 5.5
31.4 ± 9.8
12.9 ± 4.9*
20.1 ± 5.0
31.1 ± 7.5
11.0 ± 4.8*
25.4 ± 7.1
48.7 ± 12.3
23.3 ± 6.3*
43.3 ± 9.1
73.9 ± 15.4
30.6 ± 6.9*
13.0 ± 3.0
19.0 ± 4.2
6.0 ± 1.8*
RVEF
(%)
M 1
M 2
Diff
37.2 ± 8.5
41.9 ± 9.1
4.7 ± 1.6*
49.6 ± 5.0
55.8 ± 5.1
6.1 ± 1.7*
42.1 ± 6.9
49.4 ± 12.3
7.2 ± 1.7*
39.2 ± 7.8
49.3 ± 9.7
10.1 ± 2.3*
51.3 ± 3.8
54.7 ± 4.1
3.4 ± 0.8*
Data are presented as mean ± SD. *p < 0,001 using paired Student’s T-test; ** p < 0.05 using
paired Student’s T-test. ASO = arterial switch operation, M = Method, PH = pulmonary
hypertension, RVEDV = right ventricular end-diastolic volume, RVEF = right ventricular
ejection fraction, RVESV = right ventricular end-systolic volume, RVM = right ventricular mass,
RVSV = right ventricular stroke volume, ToF = tetralogy of Fallot.

83
Also a significant difference in RVSV/m2 was found. However, for all populations
the mean difference in RVSV was very small, <0.5 mL/m2. The differences between
both methods were most pronounced in the patients after atrial switch procedure
and least pronounced in the PH patients, with mean absolute differences in EF of
10.1 ± 2.3% and 4.7±1.6%, respectively. In healthy controls an absolute increase in
RVEF of 3.4 ± 0.8% was measured. By excluding trabeculae volume from the blood
volume, and including them with RV mass, this parameter also significantly
increased in all groups (table 2). Of note, the differences in EDV/m2, EDV/m
2, RVEF
and RV mass were significantly larger in all patients groups compared to the
healthy controls (p<0.01).
Reproducibility
For both methods inter- and intraboserver agreement was high in all
measurements, as illustrated by high ICCs with small limits of agreement (table 3 &
figure 2). For both methods, RVEDV, RVESV and RV mass showed significant
differences between repeated measurements. However, mean differences were
small and considered not clinically relevant. In figure 2, Bland-Altman plots show
interobserver variability for RVESV, RVEDV and RVEF for both methods. For RVEDV,
RVESV and RV mass the limits of agreement were narrower when trabeculae and
papillary muscles were excluded from the RV blood volume (method 2).
Table 3. Inter- and intraobserver agreement
Interobserver (obs 2 – obs 1I) Intraobserver (obs 1
II – obs 1
I)
ICC Mean
diff ± SD
P-
value
ICC Mean
diff ± SD
P-
value
RVEDV (mL/m2) M 1
M 2
0.981
0.987
-2.4 ± 6.7
1.8 ± 4.5
0.089
0.059
0.990
0.985
2.8 ± 5.1
3.0 ± 5.0
0.012
0.006
RVESV (mL/m2) M 1
M 2
0.970
0.974
-2.3 ± 5.2
1.7 ± 3.5
0.039
0.027
0.982
0.969
1.1 ± 4.2
1.0 ± 3.8
0.209
0.194
RVEF (%) M 1
M 2
0.934
0.934
0.9 ± 2.6
-0.5 ± 2.6
0.086
0.354
0.965
0.954
0.4 ± 1.8
0.6 ± 2.2
0.241
0.189
RVM (gr/m2) M 1
M 2
0.965
0.993
5.8 ± 3.5
1.4 ± 2.6
0.000
0.012
0.983
0.990
0.5 ± 2.3
0.3 ± 3.2
0.283
0.694
P-value obtained using paired student T-test. M = Method, Obs 2 = second observer, Obs 1I =
first measurement of primary observer, Obs 1II = second measurement of primary observer,
RVEDV = right ventricular end-diastolic volume, RVEF = right ventricular ejection fraction,
RVESV = right ventricular end-systolic volume, RVM = right ventricular mass
Ch
ap
ter 5
T
rab
ecu
lae
an
d p
ap
illary
mu
scles in
RV
pre
ssure
ove
rloa
d

84
Figure 2. Bland-Altman plots for method 1 and method 2 Bland-Altman plots showing the mean
value of both observers on the x-axis and absolute differences between the observers on the y-
axis for each paired observation. Limits of agreement are defined as ± 2 SD. Obs = observer,
RVEDV = right ventricular end-diastolic volume, RVEF = right ventricular ejection fraction, RVESV
= right ventricular end-systolic volume.
-8
-3
2
7
30 40 50 60
Ob
s 2
-O
bs
1 (
%)
Mean RVEF (%)
RVEF method 1
-8
-3
2
7
35 45 55 65
Ob
s 2
-O
bs
1 (
%)
Mean RVEF (%)
RVEF method 2
-20
-15
-10
-5
0
5
10
15
50 75 100 125 150 175 200 225
Ob
s 2
-O
bs
1 (
ml/
m2)
Mean RVEDV (ml/m2)
RVEDV method 1
-20
-15
-10
-5
0
5
10
15
50 75 100 125 150 175 200
Ob
s 2
-O
bs
1 (
ml/
m2)
Mean RVEDV (ml/m2)
RVEDV method 2
-15
-10
-5
0
5
10
25 50 75 100 125
Ob
s 2
-O
bs
1 (
ml/
m2)
Mean RVESV (ml/m2)
RVESV method 1
-15
-10
-5
0
5
10
25 50 75 100
Ob
s 2
-O
bs
1 (
ml/
m2)
Mean RVESV (ml/m2)
RVESV method 2

85
Discussion
Exclusion of trabeculae and papillary muscles resulted in substantial alterations of
RV volumes, RVEF and RV mass in a wide range of patient populations with
pressure overloaded RVs. Furthermore, we found that these differences in RV
parameters vary widely depending on the exact condition underlying RV overload.
Although prior studies already established this fact in general terms, the major
impediment to widespread adoption of this method in clinical practice was the
lack of a fast and reproducible way to measure the exact amount of RV trabeculae
and papillary muscles. We found that exclusion of RV trabeculae using semi-
automatic pixel-intensity based software resulted in fast and highly reproducible
RV measurements. This is opposed to manual tracing of trabeculae which has
previously been shown to be unreliable [15,20].
Accurate and reproducible measurement of RV volume and function is
mandatory because of the prognostic and therapeutic consequences in patients
with PAH and CHD [1,3,21,22]. The impact of excluding trabeculae from the RV
blood volume was previously illustrated in patients with systemic RVs and ToF with
volume overloaded RVs [15,23]. The current study underscores that exclusion of
trabeculae has a substantial impact on RV volumes, RVEF and RV mass in CHD and
PAH patients with RV pressure overload. Healthy controls also exhibited significant
differences in all RV measurements, but these were significantly smaller compared
to the differences observed in patient groups. Consequently, RV volume and
function in most patients will be closer to the normal range after trabeculae are
excluded from the RV blood volume.
To date the major obstacles to exclude trabeculae and papillary muscles from
the RV blood volume have been the time investment of performing manual tracing
of these structures and the low reproducibility [15,20]. In the current study we
found that using semi-automatic threshold-based segmentation software results in
improved accuracy of RV volumetric measurements with high reproducibility.
Because in- or exclusion of trabeculae from the RV blood volume has a major
impact on RV parameters as measured with CMR, studies using different
methodologies are incomparable. Several major studies in CHD patients differ on
the point of in- or excluding RV trabeculae and papillary muscles from the RV
blood volume [3,4,11,12,20,22,24] or are not clear about which methodology was
used [13,14]. Application of the method described in this study may be a step
forward to achieve uniformity of RV volumetric measurements, which is important
to compare the effect of interventions aimed at preserving or improving RV
function.
Ch
ap
ter 5
T
rab
ecu
lae
an
d p
ap
illary
mu
scles in
RV
pre
ssure
ove
rloa
d

86
When comparing the current study to prior studies investigating the impact of
trabeculae and papillary muscles on RV volume and function, some important
differences can be observed. Winter et al. studied 29 patients with systemic right
ventricles and found an increase in RVEF of 7.4± 3.9 % compared to 10.1 ± 2.3 % in
our report. In contrast to our results, which are based on semi-automated pixel-
intensity based segmentation, manual exclusion of trabeculae was substantially
less reproducible in the study of Winter et al [15]. Moreover, both our study as
well as the study by Freling et al. reported a higher reproducibility for RVEDV,
RVESV and RV mass using this semi-automatic method to exclude trabeculea
compared to only endocardial contour tracing [23]. We attribute this finding to
observer variation in handling of trabeculae adjacent to the endocardial border,
which can result in small differences for endocardial contour tracing, which will be
rectified if all trabeculae are excluded. Sievers et al. studied the effect of
trabeculae on RV volumes in healthy controls and reported a difference in RVEF of
only 1.72% compared to 3.4 ± 0.8% in our study, however baseline RVEDV values
also differed considerably with ours, indicating that these study populations are
not comparable [25]. Freling et al. investigated ToF patients with volume
overloaded RV’s using the same software package as described in the current
study and found a similar increase in RVEF of 7 ± 4 %, versus 7 ± 2% in our study
[23].
The current study only focused on one of the possible sources of error in RV
volumetric assessement with CMR. An important source of error remains basal
slice selection and delineation of the tricuspid valve. A short-axis orientation for
RV volumetric measurement was used in this study as this is standard practice in
our hospitals. Axial orientation, however, might result in higher reproducibility
than short-axis orientation in CHD patients with severely dilated RVs, decreasing
the difficulty of valve delineation in the basal slices [26,27]. To minimize errors at
the tricuspid and pulmonic valve, images were cross linked to RV 2-chamber, 4-
chamber and RV outflow tract views. Furthermore only a small portion of the
patients had severely dilated RVs, therefore it is unlikely that the slice orientation
would have resulted in important differences for the current study. The impact
and reproducibility of the semi-automatic software used in the current study will
likely be similar in axial slice orientation, as the software is not restricted by
geometric assumptions and uses signal intensity to select trabeculae. Finally,
another source of error might be inadequate selection of the RV end-systolic
frame. In daily practice both RV and LV ESV are often assessed in the LV end-
systolic frame. However in patients with CHD, who often have right bundle branch
block, timing of the RV end-systolic frame can be delayed compared to the LV end-

87
systolic frame [28]. We choose RV end-diastolic and end-systolic phase based
solely on RV cavity size.
This study is unable to determine whether in- or excluding trabeculae best
represents true RV volumes, as a gold standard in vivo is lacking. However,
theoretically exclusion of trabeculae is more accurate as they do not contribute to
RVEDV and RVESV.
Conclusion
Exclusion of trabeculae and papillary muscles has a substantial impact on
measured RV volumes, mass and EF. The magnitude of the differences varied
between patient groups and was significantly larger in all patient groups when
compared to healthy controls. Semi-automatic pixel-intensity based software
provides a highly reproducible way to exclude these structures.
Ch
ap
ter 5
T
rab
ecu
lae
an
d p
ap
illary
mu
scles in
RV
pre
ssure
ove
rloa
d

88
References
[1] Baumgartner H, Bonhoeffer P, De Groot NM, et al., (2010) ESC Guidelines for
the management of grown-up congenital heart disease (new version 2010).
Eur Heart J 31:2915-57.
[2] van de Veerdonk MC, Kind T, Marcus JT, et al.(2011) Progressive right
ventricular dysfunction in patients with pulmonary arterial hypertension
responding to therapy. J Am Coll Cardiol 58:2511-9.
[3] van Wolferen SA, Marcus JT, Boonstra A, et al., (2007) Prognostic value of
right ventricular mass, volume, and function in idiopathic pulmonary arterial
hypertension. Eur Heart J 28:1250-7.
[4] Valsangiacomo Buechel ER, Mertens LL, (2012) Imaging the right heart: the
use of integrated multimodality imaging. Eur Heart J 33:949-60.
[5] Kilner PJ, Geva T, Kaemmerer H, et al., (2010) Recommendations for
cardiovascular magnetic resonance in adults with congenital heart disease
from the respective working groups of the European Society of Cardiology.
Eur Heart J 31:794-805.
[6] van der Zwaan HB, Geleijnse ML, McGhie JS, et al., (2011) Right ventricular
quantification in clinical practice: two-dimensional vs. three-dimensional
echocardiography compared with cardiac magnetic resonance imaging. Eur J
Echocardiogr 12:656-64.
[7] Iriart X, Montaudon M, Lafitte S, et al., (2009) Right ventricle three-
dimensional echography in corrected tetralogy of fallot: accuracy and
variability. Eur J Echocardiogr 10:784-92.
[8] Beerbaum P, Barth P, Kropf S, et al., (2009) Cardiac function by MRI in
congenital heart disease: impact of consensus training on interinstitutional
variance. J Magn Reson Imaging 30:956-66.
[9] Rominger MB, Bachmann GF, Pabst W, et al., (1999) Right ventricular volumes
and ejection fraction with fast cine MR imaging in breath-hold technique:
Applicability, normal values from 52 volunteers, and evaluation of 325 adult
cardiac patients. Journal of Magnetic Resonance Imaging 10:908-18.
[10] Lorenz CH, Walker ES, Morgan VL, et al., (1999) Normal human right and left
ventricular mass, systolic function, and gender differences by cine magnetic
resonance imaging. J Cardiovasc Magn Reson 1:7-21.
89
[11] Oosterhof T, van Straten A, Vliegen HW, et al., (2007) Preoperative thresholds
for pulmonary valve replacement in patients with corrected tetralogy of Fallot
using cardiovascular magnetic resonance. Circulation 116:545-51.
[12] Therrien J, Provost Y, Merchant N, et al., (2005) Optimal timing for pulmonary
valve replacement in adults after tetralogy of Fallot repair. Am J Cardiol
95:779-82.
[13] Lidegran M, Odhner L, Jacobsson LA, et al., (2000) Magnetic resonance
imaging and echocardiography in assessment of ventricular function in atrially
corrected transposition of the great arteries. Scand Cardiovasc J 34:384-9.
[14] Lee C, Kim YM, Lee C, et al., (2012) Outcomes of Pulmonary Valve
Replacement in 170 Patients With Chronic Pulmonary Regurgitation After
Relief of Right Ventricular Outflow Tract Obstruction: Implications for Optimal
Timing of Pulmonary Valve Replacement. J Am Coll Cardiol 60:1005.
[15] Winter MM, Bernink FJ, Groenink M, et al., (2008) Evaluating the systemic
right ventricle by CMR: the importance of consistent and reproducible
delineation of the cavity. J Cardiovasc Magn Reson 10:40.
[16] Freling HG, van Wijk K, Jaspers K, et al., (2012) Impact of right ventricular
endocardial trabeculae on volumes and function assessed by CMR in patients
with tetralogy of Fallot. Int J Cardiovasc Imaging.
[17] Galie N, Hoeper MM, Humbert M, et al., (2009) Guidelines for the diagnosis
and treatment of pulmonary hypertension: the Task Force for the Diagnosis
and Treatment of Pulmonary Hypertension of the European Society of
Cardiology (ESC) and the European Respiratory Society (ERS), endorsed by the
International Society of Heart and Lung Transplantation (ISHLT). Eur Heart J
30:2493-537.
[18] Rudski LG, Lai WW, Afilalo J, et al., (2010) Guidelines for the
echocardiographic assessment of the right heart in adults: a report from the
American Society of Echocardiography endorsed by the European Association
of Echocardiography, a registered branch of the European Society of
Cardiology, and the Canadian Society of Echocardiography. J Am Soc
Echocardiogr 23:685,713; quiz 786-8.
[19] Prakken NH, Velthuis BK, Vonken EJJ, et al., (2008) Cardiac MRI: Standardized
Right and Left Ventricular Quantification by Briefly Coaching Inexperienced
Personnel. Open Magn Reson J 1:104-11.
Ch
ap
ter 5
T
rab
ecu
lae
an
d p
ap
illary
mu
scles in
RV
pre
ssure
ove
rloa
d
90
[20] Papavassiliu T, Kuhl HP, Schroder M, et al., (2005) Effect of endocardial
trabeculae on left ventricular measurements and measurement
reproducibility at cardiovascular MR imaging. Radiology 236:57-64.
[21] Warnes CA, (2009) Adult congenital heart disease importance of the right
ventricle. J Am Coll Cardiol 54:1903-10.
[22] Knauth AL, Gauvreau K, Powell AJ,et al., (2008) Ventricular size and function
assessed by cardiac MRI predict major adverse clinical outcomes late after
tetralogy of Fallot repair. Heart 94:211-6.
[23] Freling HG, van Wijk K, Jaspers K, et al., (2013) Impact of right ventricular
endocardial trabeculae on volumes and function assessed by CMR in patients
with tetralogy of Fallot. Int J Cardiovasc Imaging 29:625-31.
[24] Helbing WA, Rebergen SA, Maliepaard C,et al., (1995) Quantification of right
ventricular function with magnetic resonance imaging in children with normal
hearts and with congenital heart disease. Am Heart J 130:828.
[25] Sievers B, Kirchberg S, Bakan A,et al., (2004) Impact of papillary muscles in
ventricular volume and ejection fraction assessment by cardiovascular
magnetic resonance. J Cardiovasc Magn Reson 6:9-16.
[26] Clarke CJ, Gurka MJ, Norton PT, et al., (2012) Assessment of the accuracy and
reproducibility of RV volume measurements by CMR in congenital heart
disease. JACC Cardiovasc Imaging 5:28-37.
[27] Fratz S, Schuhbaeck A, Buchner C, et al., (2009) Comparison of accuracy of
axial slices versus short-axis slices for measuring ventricular volumes by
cardiac magnetic resonance in patients with corrected tetralogy of fallot. Am J
Cardiol 103:1764-9.
[28] Freling HG, Pieper PG, Vermeulen KM, et al., (2013) Improved cardiac MRI
volume measurements in patients with tetralogy of fallot by independent
end-systolic and end-diastolic phase selection. PLoS One 8:e55462.

91
Ch
ap
ter 5
T
rab
ecu
lae
an
d p
ap
illary
mu
scles in
RV
pre
ssure
ove
rloa
d

92
93
Effect of right ventricular outflow tract
obstruction on right ventricular volumes and
exercise capacity in patients with repaired
tetralogy of Fallot
Hendrik G. Freling
Tineke P. Willems
Joost P. van Melle
Ymkje J. van Slooten
Beatrijs Bartelds
Rolf M.F. Berger
Dirk J. van Veldhuisen
Petronella G. Pieper

94
Abstract
Background: Patients with tetralogy of Fallot (ToF) and combined right ventricular
(RV) outflow tract obstruction (RVOTO) and pulmonary regurgitation (PR) have
compared to patients without RVOTO more favorable RV volumes and function.
Unknown is whether RVOTO is also associated with improved exercise capacity.
Methods: Cardiac magnetic resonance imaging, echocardiography and exercise
tests were compared between 12 patients with and 30 patients without RVOTO
(Doppler peak RVOT gradient (RVOT-PG) ≥ 30 mmHg).
Results: Patients with RVOTO had smaller RV end-systolic (50 ± 16 versus 64 ± 18
ml/m2) and end-diastolic volumes (117 ± 24 versus 135 ± 28 ml/m
2) and higher RV
mass (52 ± 14 versus 42 ± 11 ml/m2) than patients without RVOTO, p < .050. RV
ejection fraction did not differ significantly between patients with and without
RVOTO (58% ± 8% versus 53% ± 7%), p = 0.051. Degree of PR, left ventricular
volumes and function were not different between both groups. Patients with
RVOTO had a significant lower peak oxygen uptake (25 ± 3 versus 32 ± 8
ml/kg/min) and percentage of predicted peak oxygen uptake (63% ± 7% versus
79% ± 14%) than patients without RVOTO, p < 0.001. In multivariate analysis
RVOT-PG was the only independent predictor of exercise capacity.
Conclusions: Exercise capacity is lower in patients with compared to patients
without RVOTO despite more favourable RV volumes at rest and comparable
degree of pulmonary regurgitation. Therefore, exercise capacity should be
considered in addition to RV volumes and function in patients with ToF and PR.
Accepted in Am J Cardiol

95
Background
Most adult patients with repaired tetralogy of Fallot (ToF) have longstanding
pulmonary regurgitation (PR). PR results in chronic right ventricular (RV) volume
overload, and has been related to RV dilation, RV dysfunction, symptomatic heart
failure, ventricular arrhythmia and sudden death [1-3].
In addition to PR, many patients have residual RV outflow tract obstruction
(RVOTO) resulting in some amount of pressure overload. Animal studies
demonstrated that RVOTO may limit the negative impact of PR on RV size and
myocardial contractility. Increase in cardiac output during dobutamine infusion
was not different between animals with PR and animals with combined RVOTO
and PR [4,5]. This suggests that despite smaller RV volumes with higher myocardial
contractility, patients with combined RVOTO and PR may not have better exercise
capacity than patients with isolated PR. Indeed, despite smaller RV size in patients
with ToF and combined RVOTO and PR as demonstrated in recent studies, New
York Heart Association functional class did not differ compared to patients with
isolated PR [6,7] However, since functional class is known to be poorly correlated
with objective exercise capacity [8,9], it remains unclear what the effect of RVOTO
is on exercise capacity.
Therefore, we performed a study to evaluate the effects of RVOTO on exercise
capacity, RV volumes and RV function in adult patients with repaired ToF and
volume overload due to PR.
Ch
ap
ter 6
E
ffect o
f RV
OT
O o
n R
V v
olu
me
s an
d e
xercise
cap
acity
96
Methods
Patients
This retrospective study was approved by the University Medical Center Groningen
review board. Informed consent was not required according to the Dutch Medical
Research Involving Human Subjects act.
Our institute’s cardiac magnetic resonance (CMR) imaging database contained
123 patients with repaired ToF without a pulmonary valve replacement. We
included patients in whom adequate echocardiographic examination, exercise
testing and CMR imaging were performed within 6 months of each other (n = 48;
39%) and no clinical relevant event occurred in the meantime. All examinations are
part of routine follow up in our center. Patients with significant regurgitation or
stenosis of other valves than the pulmonary valve and residual intracardiac shunts
were excluded (n = 5). The remaining 42 patients were divided into two groups: 12
patients with combined PR and RVOTO and 30 patients with PR and no RVOTO.
RVOTO was defined as a Doppler peak pressure gradient across the RVOT of > 30
mm Hg.
Cardiac magnetic resonance imaging
All subjects were examined on a 1.5-Tesla MRI system (Siemens Magnetom
Sonata, Erlangen, Germany or Siemens Magnetom Avanto, Erlangen, Germany)
using a 2 x 6 channel body-coil. After single-shot localizer images, short axis cine
loop images with breath holding in expiration were acquired using a
retrospectively gated balanced steady state free precession sequence. The
following parameters were used: TR 2.7 ms, TE 1.1 ms, flip angle 80o, matrix 192 x
192 mm, 25 frames per cycle, slice thickness 6 mm, interslice gap 4 mm, voxel size
1.7 x 1.7 x 6 mm.
Two-dimensional velocity encoded MRI flow measurements perpendicular
and directly cranial to the pulmonary valve was performed to quantify flow
velocity and volumes.
Cardiac magnetic resonance image analysis
Analysis of CMR images has been described previously [10-12]. In summary, image
analysis was performed semi-automatically by using QMass MR research edition
(Medis, Leiden, The Netherlands). LV and RV contours were drawn manually by
tracing the endo- and epicardial borders in every slice in the end-systolic and end-
diastolic frame. The end-systolic phase of the RV was selected independently from
the LV. Papillary muscles and trabeculae were excluded from the RV blood volume

97
and included in the mass. Stroke volume was calculated by subtracting the end-
systolic volume from the end-diastolic volume. Ejection fraction was obtained by
dividing stroke volume by end-diastolic volume.
Analysis of MRI flow measurements was performed using QFlow version 5.2
(Medis, Leiden, The Netherlands. Contours were drawn manually in all 30 phases.
PR was quantified as PR fraction and PR volume. All ventricular volumes were
indexed for body surface area.
Echocardiography
Continuous-wave Doppler was used to determine the maximum velocity across
the RV outflow tract. The RV outflow tract gradient was calculated with use of the
simplified Bernoulli equation. The presence of restrictive physiology was defined
as forward flow across the pulmonary valve during end-diastole. The tricuspid and
left-sided valves were reviewed for significant stenosis or regurgitation. All
patients were screened for the presence of residual intracardiac shunts.
Exercise testing
A treadmill cardiopulmonary exercise test was performed in all patients. Workload
was incremented at regular intervals with a combination of speed and grade.
Because the expected maximum workload was relatively low in most patients, a
modified Bruce protocol was used in which workload starts at a relatively low level
and increases more gradually than in the standard Bruce protocol [13]. At the first
stage speed was 1.7 miles/hour and incline 0%, at the second stage the same
speed and 5% incline, and the third stage corresponded to the first stage of the
Bruce protocol. Cardiopulmonary exercise testing ended when patients reached
their peak oxygen uptake (VO2), could not keep up with the treadmill speed,
breathing reserve dropped and O2 heart rate decreased, or discontinuation was
indicated for safety reasons. Peak VO2 was calculated as the average VO2 for the
two highest measurements at peak exercise and expressed as millilitre per minute
per kilogram and as percentage of predicted maximum VO2. Respiratory exchange
ratio was computed as carbon dioxide production/VO2. Exercise tests were only
included if the patient reached the anaerobic threshold, defined as having a
respiratory exchange ratio > 1.0.
Analysis
Descriptive statistics were calculated for all measurements as mean and standard
deviation for normally distributed continuous variables, median with 25th
and 75th
percentile for skewed continuous variables and absolute numbers and percentages
Ch
ap
ter 6
E
ffect o
f RV
OT
O o
n R
V v
olu
me
s an
d e
xercise
cap
acity

98
for dichotomous variables. Differences in characteristics between patient groups
were analyzed using Student’s T-test for normally distributed continuous variables
and Mann-Whitney U-test for skewed continuous variables. Fisher’s Exact Test was
used for comparison of categorized variables. Univariate linear regression analysis
was performed to determine which variables were significantly related to
percentage of predicted peak VO2. Variables included were patient characteristics
(age at exercise testing, gender), operative characteristics (age at repair, usage of
transannular patch), imaging parameters (CMR measurements of RV volume and
function and left ventricular function, degree of PR, presence of restrictive
physiology and peak pressure gradient across the RVOT) and QRS duration. In
multivariate analysis we evaluated independent predictors of peak VO2. Only
variables statistically significant (p <.050) in univariate analysis were included in
the multivariate analysis (backward stepwise regression method). The Statistical
Package for the Social Sciences version 20.0 (SPSS Inc, Chicago, IL) was used for all
statistical analyses. All statistical tests are two-sided and a P-value of less than .050
was considered statistically significant.

99
Results
Patient characteristics
Patient characteristics were not different between both groups except peak
gradient across the RVOT (Table 1). Twenty-five (60%) patients were male. Mean
age at the study was 32 ± 9 years. Previous palliative shunt was performed in 9
(21%) patients. ToF repair was performed between March 1972 and July 1993 and
median age at repair was 2.7 (25th
– 75th
percentile, 1.3 – 5.7) years. During repair
22 (54%) patients received a transannular patch. All patients were in NYHA class I
at time of evaluation for this study, except one patient with isolated PR who was in
NYHA class II. Mean QRS duration was 136 ± 26 ms and all patients had a right
bundle branch block. Restrictive physiology was present in 14 (37%) patients and
could not be determined due to inadequate Doppler signals in 4 (10%) patients.
Peak pressure gradient across the RVOT on Doppler echocardiography was 24 ± 14
mmHg, and was 42 ± 9 mmHg in patients with combined RVOTO and PR and 16 ± 6
mmHg in patients with isolated PR, p <.001.
Table 1. Patients’ characteristics
Isolated PR
(N=30)
Combined RVOTO + PR
(N=12)
P
Male 15 (50) 10 (83) .081
Age at repair (years) 2.5 (1.3 – 5.5) 3.9 (1.8 – 5.9) .449
Age at study (years) 30 ± 9 34 ± 9 .246
Previous palliative shunt 6 (20) 3 (25) .699
Transannular patch 14 (47) 8 (73)* .173
NYHA class
class I
class II
29 (97)
1 (3)
12 (100)
0 (0)
1.000
Peak gradient RVOT (mmHg) 16 ± 6 42 ± 9 <.001
Restrictive physiology 10 (37)** 4 (36)** 1.000
QRS duration (ms) 137 ± 26 132 ± 30 .579
* Details of the operative procedure could not be retrieved of one patient. ** Presence of
restrictive physiology could not be determined in four patients, one patient with and three
patients without RVOTO. Data are presented as number of patients (%), mean ± standard
deviation or median (25th-75th percentile). NYHA = New York Heart Association, PR =
pulmonary regurgitation, RVOT = right ventricular outflow tract, RVOTO = right ventricular
outflow tract obstruction, ToF = tetralogy of Fallot
Ch
ap
ter 6
E
ffect o
f RV
OT
O o
n R
V v
olu
me
s an
d e
xercise
cap
acity
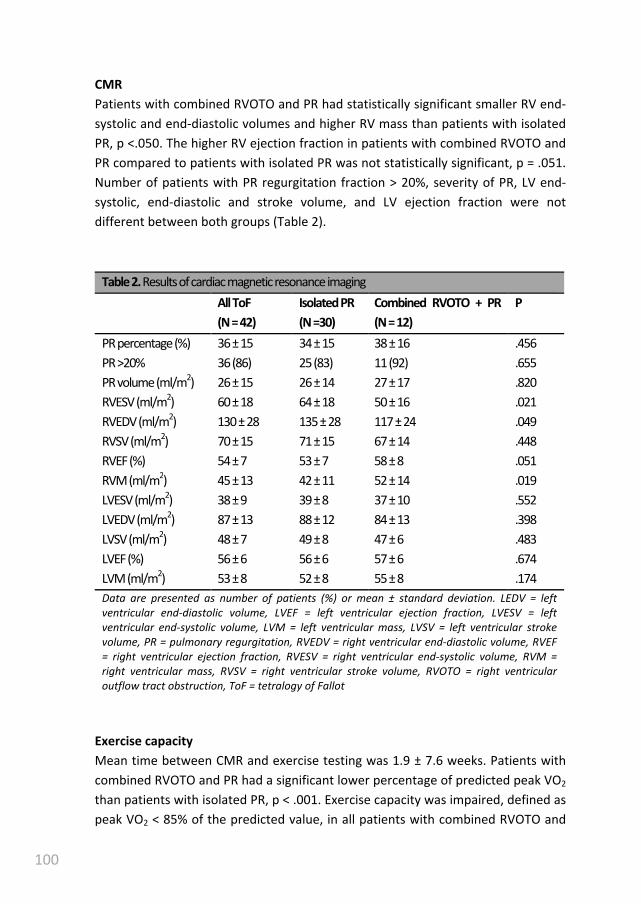
100
CMR
Patients with combined RVOTO and PR had statistically significant smaller RV end-
systolic and end-diastolic volumes and higher RV mass than patients with isolated
PR, p <.050. The higher RV ejection fraction in patients with combined RVOTO and
PR compared to patients with isolated PR was not statistically significant, p = .051.
Number of patients with PR regurgitation fraction > 20%, severity of PR, LV end-
systolic, end-diastolic and stroke volume, and LV ejection fraction were not
different between both groups (Table 2).
Table 2. Results of cardiac magnetic resonance imaging
All ToF
(N = 42)
Isolated PR
(N =30)
Combined RVOTO + PR
(N = 12)
P
PR percentage (%) 36 ± 15 34 ± 15 38 ± 16 .456
PR >20% 36 (86) 25 (83) 11 (92) .655
PR volume (ml/m2) 26 ± 15 26 ± 14 27 ± 17 .820
RVESV (ml/m2) 60 ± 18 64 ± 18 50 ± 16 .021
RVEDV (ml/m2) 130 ± 28 135 ± 28 117 ± 24 .049
RVSV (ml/m2) 70 ± 15 71 ± 15 67 ± 14 .448
RVEF (%) 54 ± 7 53 ± 7 58 ± 8 .051
RVM (ml/m2) 45 ± 13 42 ± 11 52 ± 14 .019
LVESV (ml/m2) 38 ± 9 39 ± 8 37 ± 10 .552
LVEDV (ml/m2) 87 ± 13 88 ± 12 84 ± 13 .398
LVSV (ml/m2) 48 ± 7 49 ± 8 47 ± 6 .483
LVEF (%) 56 ± 6 56 ± 6 57 ± 6 .674
LVM (ml/m2) 53 ± 8 52 ± 8 55 ± 8 .174
Data are presented as number of patients (%) or mean ± standard deviation. LEDV = left
ventricular end-diastolic volume, LVEF = left ventricular ejection fraction, LVESV = left
ventricular end-systolic volume, LVM = left ventricular mass, LVSV = left ventricular stroke
volume, PR = pulmonary regurgitation, RVEDV = right ventricular end-diastolic volume, RVEF
= right ventricular ejection fraction, RVESV = right ventricular end-systolic volume, RVM =
right ventricular mass, RVSV = right ventricular stroke volume, RVOTO = right ventricular
outflow tract obstruction, ToF = tetralogy of Fallot
Exercise capacity
Mean time between CMR and exercise testing was 1.9 ± 7.6 weeks. Patients with
combined RVOTO and PR had a significant lower percentage of predicted peak VO2
than patients with isolated PR, p < .001. Exercise capacity was impaired, defined as
peak VO2 < 85% of the predicted value, in all patients with combined RVOTO and
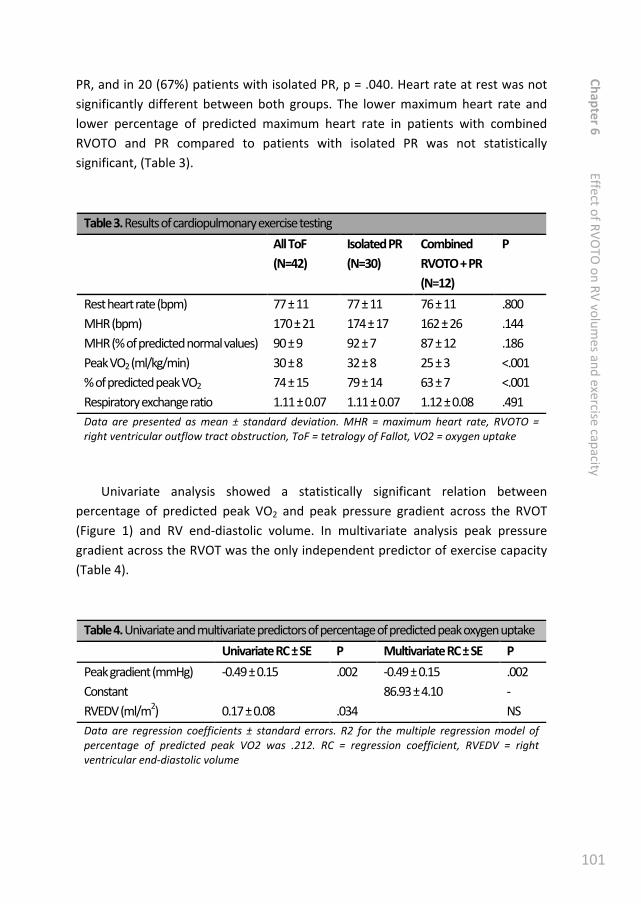
101
PR, and in 20 (67%) patients with isolated PR, p = .040. Heart rate at rest was not
significantly different between both groups. The lower maximum heart rate and
lower percentage of predicted maximum heart rate in patients with combined
RVOTO and PR compared to patients with isolated PR was not statistically
significant, (Table 3).
Table 3. Results of cardiopulmonary exercise testing
All ToF
(N=42)
Isolated PR
(N=30)
Combined
RVOTO + PR
(N=12)
P
Rest heart rate (bpm) 77 ± 11 77 ± 11 76 ± 11 .800
MHR (bpm) 170 ± 21 174 ± 17 162 ± 26 .144
MHR (% of predicted normal values) 90 ± 9 92 ± 7 87 ± 12 .186
Peak VO2 (ml/kg/min) 30 ± 8 32 ± 8 25 ± 3 <.001
% of predicted peak VO2 74 ± 15 79 ± 14 63 ± 7 <.001
Respiratory exchange ratio 1.11 ± 0.07 1.11 ± 0.07 1.12 ± 0.08 .491
Data are presented as mean ± standard deviation. MHR = maximum heart rate, RVOTO =
right ventricular outflow tract obstruction, ToF = tetralogy of Fallot, VO2 = oxygen uptake
Univariate analysis showed a statistically significant relation between
percentage of predicted peak VO2 and peak pressure gradient across the RVOT
(Figure 1) and RV end-diastolic volume. In multivariate analysis peak pressure
gradient across the RVOT was the only independent predictor of exercise capacity
(Table 4).
Table 4. Univariate and multivariate predictors of percentage of predicted peak oxygen uptake
Univariate RC ± SE P Multivariate RC ± SE P
Peak gradient (mmHg) -0.49 ± 0.15 .002 -0.49 ± 0.15 .002
Constant 86.93 ± 4.10 -
RVEDV (ml/m2) 0.17 ± 0.08 .034 NS
Data are regression coefficients ± standard errors. R2 for the multiple regression model of
percentage of predicted peak VO2 was .212. RC = regression coefficient, RVEDV = right
ventricular end-diastolic volume
Ch
ap
ter 6
E
ffect o
f RV
OT
O o
n R
V v
olu
me
s an
d e
xercise
cap
acity
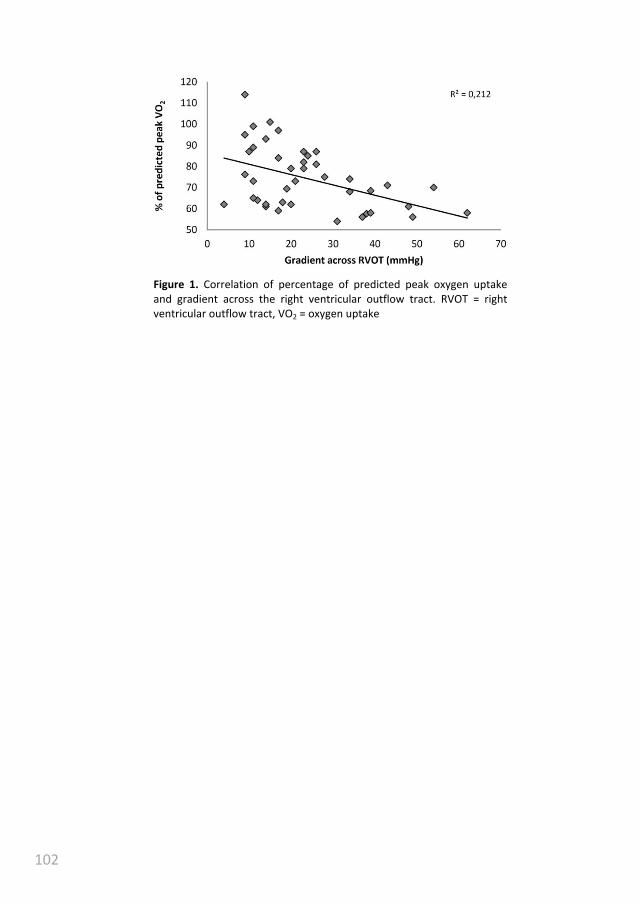
102
Figure 1. Correlation of percentage of predicted peak oxygen uptake
and gradient across the right ventricular outflow tract. RVOT = right
ventricular outflow tract, VO2 = oxygen uptake

103
Discussion
Our study is the first to demonstrate in patients with repaired ToF that combined
RVOTO and PR is associated with reduced exercise capacity despite more
favourable RV volumes at rest. Furthermore, peak pressure gradient across the
RVOT was the only independent predictor of percentage of predicted peak VO2.
Experimental studies in growing swine have demonstrated that combined
RVOTO and PR resulted in more RV hypertrophy, and less dilatation of the RV
compared to isolated PR [4,5]. Our and other studies in patients with repaired ToF
confirmed that patients with combined RVOTO and PR had smaller RV volumes
compared to patients with isolated PR, despite comparable degree of PR [6,7,14].
Some studies proposed that decreased diastolic compliance resulting from RVOTO-
induced hypertrophy prevents severe RV dilatation due to limiting PR [7,14].
However, we and others found no difference in PR between patients with and
without RVOTO [6,7]. The RV hypertrophy and decreased compliance might have
protective properties against RV dilatation, however, the exact mechanism of
protection against RV dilatation remains unknown. Although smaller RV volumes
and higher ejection fraction have been considered markers for better RV
performance in patients with repaired ToF, our results suggest that adaptations of
the RV in response to RVOTO do not result in increase cardiac output during
exercise.
During exercise, cardiac output increases to deliver the required oxygen and
nutrients to the muscles. Increase in cardiac output is mainly a result of changes in
preload, afterload, contractility and heart rate [15]. A healthy untrained person
can increase cardiac output a little over fourfold, and a well-trained athlete can
increase output about sixfold [15]. However, increase in cardiac output during
exercise is decreased in patients with repaired ToF [16]. As the left ventricle and
RV are in series, cardiac output of the left ventricle is most likely limited because of
reduced RV output. Under normal circumstances the RV is an energetic efficient
pump because of the low pressure in the pulmonary circulation [17,18]. In patients
with repaired ToF and PR energetic inefficiency exists due to enlarged stroke
volume which for a large part flows back into the RV. Additionally, often intra- and
interventricular dyssynchrony cause suboptimal coordination of RV contraction
[19]. RV dilatation results in a changed geometry of both ventricles with reduced
diastolic LV volume due to septal displacement and paradoxical systolic septal
movement, which further reduces cardiac output [17,18].
Furthermore, when a patient has additional RVOTO, more kinetic energy is
required to overcome the obstruction. This induces RV hypertrophy and increases
Ch
ap
ter 6
E
ffect o
f RV
OT
O o
n R
V v
olu
me
s an
d e
xercise
cap
acity

104
contractile force allowing the RV to generate higher pressures. The simplified
Bernouilli equation states that pressure gradient = 4 x [flow / area]2. As a result,
the increase in pressure during exercise can be quite high given that gradients are
a square function of flow. The increased contractile force in patients with
combined RVOTO and PR might not be sufficient to adequately increase cardiac
output during strenuous exercise.
Additionally, RV hypertrophy and degenerative myocardial changes after
longstanding pressure overload could be detrimental for RV compliance and
diastolic function. Previous studies have discussed that restrictive physiology,
visible as forward flow during diastole, is associated with smaller RV volumes and
improved exercise performance. Like a previous report, we found no difference in
frequency of restrictive physiology between patients with combined RVOTO and
PR compared to patients with isolated PR [7]. Furthermore, in our study presence
of restrictive physiology was not correlated with measured exercise capacity.
However, this does not rule out that patients with combined RVOTO and PR have
more often or more severe diastolic dysfunction during exercise. Last, in our data
there was a trend towards a lower heart rate response during exercise in patients
with combined RVOTO and PR which further reduces the ability to increase output.
Therefore, poorer RV function during exercise in patients with combined RVOTO
and PR is most likely caused by insufficient systolic function, reduced diastolic
function, reduced heart rate or a combination of those.
When pulmonary valve replacement is performed timely in patients with ToF
and PR, RV volumes will normalize and irreversible RV dysfunction is prevented
[20,21]. Therefore, timing of pulmonary valve replacement is increasingly being
based on CMR derived RV volume measurements [22]. As patients with additional
RVOTO have smaller RV volumes, pulmonary valve replacement will be performed
less frequently in these patients [23]. Whether optimal timing of pulmonary valve
replacement to prevent irreversible RV dysfunction in patients with combined
RVOTO and PR should be guided by RV volumes in the same way as in patients
with isolated PR is unknown. Since volumes remain smaller in patients with
additional RVOTO, while our results suggest that exercise capacity is more
impaired than in patients with isolated PR, it can be postulated that patients with
combined RVOTO and PR should require different criteria to guide the timing of
pulmonary valve replacement. Possibly exercise capacity should be given more
weight while RV volumes may be less important. However, whether more timely
pulmonary valve replacement would have a beneficial effect on exercise capacity
remains unknown.
105
Study limitations
In our study total repair was performed in different decennia. The trend is to
perform total repair at an increasingly younger age. This shortens the period the
patient is subjected to systemic hypoxia and RV pressure overload. Furthermore,
current surgical strategies to relieve pulmonary stenosis during repair of ToF aim
at limiting the amount of future PR and mild residual stenosis is accepted. Because
of the retrospective nature of our study in combination with the long time
between repair of ToF and our study, we have insufficient data concerning the
time of onset of RVOTO. It is unknown whether RVOTO has been present since
repair of ToF or evolved later. We have no CMR or echocardiographic data during
exercise at our disposal, therefore we can only speculate about the cause of the
difference in exercise capacity between patients with and without additional
RVOTO.
The number of patients in our study with combined RVOTO and PR is
relatively small and the degree of RVOTO was only moderate. A larger, preferable
prospective, study should be performed to confirm whether our results can be
extrapolated to patients in which total repair was performed using current surgical
strategies.
Conclusion
Currently, timing of pulmonary valve replacement in patient with ToF and PR is
mainly guided by RV volumes and to a lesser degree exercise capacity. However,
patients with combined RVOTO and PR have reduced exercise capacity despite
more favourable RV volumes at rest compared to patients without RVOTO.
Therefore, exercise testing as well as CMR imaging should be interpreted in
conjunction with the presence of RVOTO. Whether current guidelines on timing of
pulmonary valve replacement need to be revised for patients with combined
RVOTO and PR, giving exercise capacity a more prominent role, should be the
subject of future studies.
Ch
ap
ter 6
E
ffect o
f RV
OT
O o
n R
V v
olu
me
s an
d e
xercise
cap
acity

106
References
[1] Warnes CA, Williams RG, Bashore TM, et al., (2008) ACC/AHA 2008 Guidelines
for the Management of Adults with Congenital Heart Disease: a report of the
American College of Cardiology/American Heart Association Task Force on
Practice Guidelines (writing committee to develop guidelines on the
management of adults with congenital heart disease). Circulation 118:e714-
833.
[2] Baumgartner H, Bonhoeffer P, De Groot NM, et al., (2010) ESC Guidelines for
the management of grown-up congenital heart disease (new version 2010).
Eur Heart J 31:2915-57.
[3] Gatzoulis MA, Balaji S, Webber SA, et al., (2000) Risk factors for arrhythmia
and sudden cardiac death late after repair of tetralogy of Fallot: a multicentre
study. Lancet 356:975-81.
[4] Kuehne T, Gleason BK, Saeed M, et al., (2005) Combined pulmonary stenosis
and insufficiency preserves myocardial contractility in the developing heart of
growing swine at midterm follow-up. J Appl Physiol 99:1422-7.
[5] Kuehne T, Saeed M, Gleason K, et al., (2003) Effects of pulmonary
insufficiency on biventricular function in the developing heart of growing
swine. Circulation 108:2007-13.
[6] Yoo BW, Kim JO, Kim YJ, et al., (2012) Impact of pressure load caused by right
ventricular outflow tract obstruction on right ventricular volume overload in
patients with repaired tetralogy of Fallot. J Thorac Cardiovasc Surg 143:1299-
304.
[7] Spiewak M, Biernacka EK, Malek LA, et al., (2011) Right ventricular outflow
tract obstruction as a confounding factor in the assessment of the impact of
pulmonary regurgitation on the right ventricular size and function in patients
after repair of tetralogy of Fallot. J Magn Reson Imaging 33:1040-6.
[8] Gratz A, Hess J, Hager A, (2009) Self-estimated physical functioning poorly
predicts actual exercise capacity in adolescents and adults with congenital
heart disease. Eur Heart J 30:497-504.
[9] Rogers R, Reybrouck T, Weymans M, et al., (1994) Reliability of subjective
estimates of exercise capacity after total repair of tetralogy of Fallot. Acta
Paediatr 83:866-9.
Ch
ap
ter 6
E
ffect o
f RV
OT
O o
n R
V v
olu
me
s an
d e
xercise
cap
acity
107
[10] Freling HG, Pieper PG, Vermeulen KM, et al., (2013) Improved cardiac MRI
volume measurements in patients with tetralogy of fallot by independent
end-systolic and end-diastolic phase selection. PLoS One 8:e55462.
[11] Freling HG, van Wijk K, Jaspers K, et al., (2013) Impact of right ventricular
endocardial trabeculae on volumes and function assessed by CMR in patients
with tetralogy of Fallot. Int J Cardiovasc Imaging 29:625-31.
[12] Jaspers K, Freling HG, van Wijk K, et al., (2013) Improving the reproducibility
of MR-derived left ventricular volume and function measurements with a
semi-automatic threshold-based segmentation algorithm. Int J Cardiovasc
Imaging 29:617-23.
[13] American Thoracic Society, American College of Chest Physicians, (2003)
ATS/ACCP Statement on cardiopulmonary exercise testing. Am J Respir Crit
Care Med 167:211-77.
[14] Latus H, Gummel K, Rupp S, et al., (2013) Beneficial effects of residual right
ventricular outflow tract obstruction on right ventricular volume and function
in patients after repair of tetralogy of fallot. Pediatr Cardiol 34:424-30.
[15] Hall JE, Guyton and Hall textbook of medical physiology. Saunders, 2010.
[16] Valente AM, Gauvreau K, Assenza GE, et al., (2013) Rationale and design of an
International Multicenter Registry of patients with repaired tetralogy of Fallot
to define risk factors for late adverse outcomes: the INDICATOR cohort.
Pediatr Cardiol 34:95-104.
[17] Haddad F, Hunt SA, Rosenthal DN, et al., (2008) Right ventricular function in
cardiovascular disease, part I: Anatomy, physiology, aging, and functional
assessment of the right ventricle. Circulation 117:1436-48.
[18] Haddad F, Doyle R, Murphy DJ, et al., (2008) Right ventricular function in
cardiovascular disease, part II: pathophysiology, clinical importance, and
management of right ventricular failure. Circulation 117:1717-31.
[19] D'Andrea A, Caso P, Sarubbi B, et al., (2004) Right ventricular myocardial
activation delay in adult patients with right bundle branch block late after
repair of Tetralogy of Fallot. Eur J Echocardiogr 5:123-31.
[20] Cheung EW, Wong WH, Cheung YF, (2010) Meta-analysis of pulmonary valve
replacement after operative repair of tetralogy of Fallot. Am J Cardiol
106:552-7.

108
[21] Oosterhof T, van Straten A, Vliegen HW, et al., (2007) Preoperative thresholds
for pulmonary valve replacement in patients with corrected tetralogy of Fallot
using cardiovascular magnetic resonance. Circulation 116:545-51.
[22] Geva T, (2011) Repaired tetralogy of Fallot: the roles of cardiovascular
magnetic resonance in evaluating pathophysiology and for pulmonary valve
replacement decision support. J Cardiovasc Magn Reson 13:9.
[23] van der Hulst AE, Hylkema MG, Vliegen HW, et al., (2012) Mild residual
pulmonary stenosis in tetralogy of fallot reduces risk of pulmonary valve
replacement. Ann Thorac Surg 94:2077-82.

109
Ch
ap
ter 6
E
ffect o
f RV
OT
O o
n R
V v
olu
me
s an
d e
xercise
cap
acity

110

111
Measurements of right ventricular volumes
and function in the PROSTAVA study
Hendrik G. Freling
Ymkje J. van Slooten
Joost P. van Melle
Barbara J.M. Mulder
Arie P.J. van Dijk
Hans L. Hillege
Marco C. Post
Gertjan Tj. Sieswerda
Monique R.M. Jongbloed
Tineke P. Willems
Petronella G. Pieper

112
Abstract
Background Data on long-term complications in adult patients with congenital
heart disease (ACHD) and a prosthetic valve are scarce. Moreover, the influence of
prosthetic valves on quality of life (QoL) and functional outcome in ACHD patients
with prosthetic valves has not been studied.
Objectives The primary objective of the PROSTAVA study is to investigate the
relation between prosthetic valve characteristics (type, size and location) and
functional outcome as well as QoL in ACHD patients. The secondary objectives are
to investigate the prevalence and predictors of prosthesis-related complications
including prosthesis-patient mismatch.
Methods The PROSTAVA study, a multicentre cross-sectional observational study,
will include approximately 550 ACHD patients with prosthetic valves. Primary
outcome measures are maximum oxygen uptake during cardiopulmonary exercise
testing and quality of life. Secondary outcomes are the prevalence and incidence
of valve-related complications including prosthesis-patient mismatch. Other
evaluations are medical history, physical examination, echocardiography, MRI,
rhythm monitoring and laboratory evaluation (including NT-proBNP).
Implications Identification of the relation between prosthetic valve characteristics
in ACHD patients on one hand and functional outcome, QoL, the prevalence and
predictors of prosthesis-related complications on the other hand may influence
the choice of valve prosthesis, the indication for more extensive surgery and the
indication for re-operation.
* Addendum added to “Prosthetic valves in adult patients with congenital heart
disease: Rationale and design of the Dutch PROSTAVA study”
Neth Heart J. 2012 Oct;20(10):419-24.

113
Background
Due to the improved survival of children with congenital heart disease (CHD), the
number of adults with CHD has increased and adult patients with CHD now
outnumber children [1]. Prosthetic valves, mechanical or biological, are part of the
treatment in many patients with CHD. Mechanical prosthetic valves may
negatively influence quality of life because of the necessity for anticoagulation
therapy, which can hamper the active lifestyle of young adult patients with CHD
and which prevents women from going through untroubled and safe pregnancies
[2]. Biological prosthetic valves are an alternative, but they have their own
disadvantages, the most important of which is their high deterioration rate,
especially in young patients and during pregnancy, inevitably leading to re-
operation [3].
Both types of valves share another complication: prosthesis-patient mismatch
(PPM). PPM is present when the effective orifice area (EOA) of the inserted
prosthetic valve is too small in relation to body size. In adults with acquired heart
disease, PPM is associated with increased morbidity and mortality [4]. The
prevalence of PPM is probably high in adult patients with CHD, both with biological
and with mechanical valves, because of somatic growth of patients after
implantation of a small valve during childhood. A few small series have
investigated mid- and long-term complications of prosthetic valves including PPM
in children [5,6]. However, the prevalence of PPM and its consequences in adult
patients with CHD are unknown.
Adult patients with CHD and a prosthetic valve differ from patients with
acquired valve disease in terms of age, lifestyle and underlying disease.
Additionally, the prevalence of tricuspid and pulmonary prosthetic valves is higher
in adult patients with CHD. These differences may lead to a different outcome in
terms of functional capacity and quality of life as well as to a distinct spectrum of
long-term complications associated with prosthetic valves. However, the influence
of prosthetic valves on quality of life and functional outcome in adult patients with
CHD has not been studied, and data on long-term complications are scarce [7]. We
intend to study these issues in an adult population with CHD and prosthetic valves.
In this article we introduce the study design and describe the rationale of the
‘Functional outcome and quality of life in adult patients with congenital heart
disease and prosthetic valves (PROSTAVA) study’.
Ch
ap
ter 7
T
he
PR
OS
TA
VA
stud
y
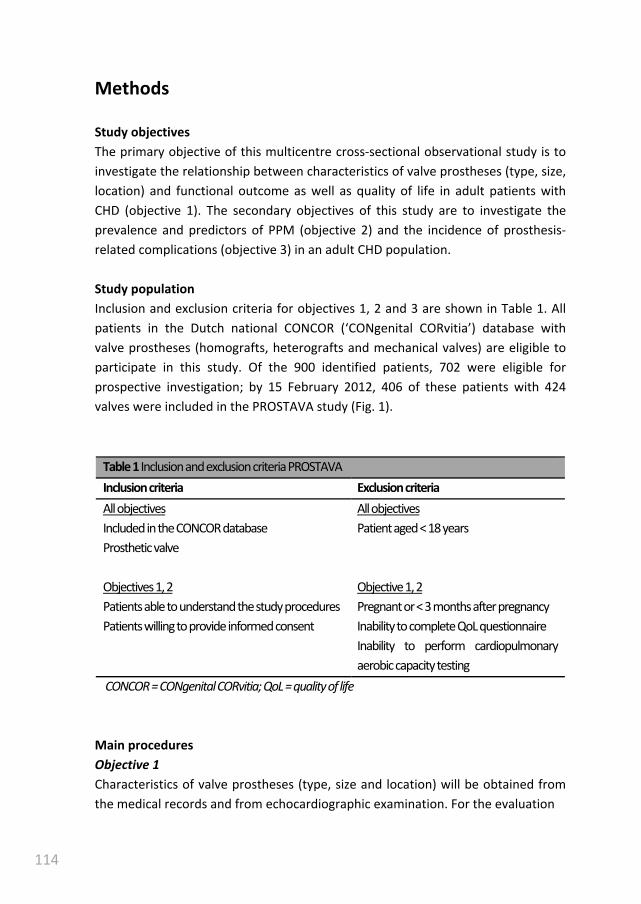
114
Methods
Study objectives
The primary objective of this multicentre cross-sectional observational study is to
investigate the relationship between characteristics of valve prostheses (type, size,
location) and functional outcome as well as quality of life in adult patients with
CHD (objective 1). The secondary objectives of this study are to investigate the
prevalence and predictors of PPM (objective 2) and the incidence of prosthesis-
related complications (objective 3) in an adult CHD population.
Study population
Inclusion and exclusion criteria for objectives 1, 2 and 3 are shown in Table 1. All
patients in the Dutch national CONCOR (‘CONgenital CORvitia’) database with
valve prostheses (homografts, heterografts and mechanical valves) are eligible to
participate in this study. Of the 900 identified patients, 702 were eligible for
prospective investigation; by 15 February 2012, 406 of these patients with 424
valves were included in the PROSTAVA study (Fig. 1).
Table 1 Inclusion and exclusion criteria PROSTAVA
Inclusion criteria Exclusion criteria
All objectives All objectives
Included in the CONCOR database Patient aged < 18 years
Prosthetic valve
Objectives 1, 2 Objective 1, 2
Patients able to understand the study procedures Pregnant or < 3 months after pregnancy
Patients willing to provide informed consent Inability to complete QoL questionnaire
Inability to perform cardiopulmonary
aerobic capacity testing
CONCOR = CONgenital CORvitia; QoL = quality of life
Main procedures
Objective 1
Characteristics of valve prostheses (type, size and location) will be obtained from
the medical records and from echocardiographic examination. For the evaluation

115
Figure 1. Prosthetic valves
included in the
prospective part of the
study by 15 February
2012. AVR = aortic valve
replacement, PVR =
pulmonary valve
replacement, MVR =
mitral valve replacement,
TVR = tricuspid valve
replacement
of functional outcome and quality of life, cardiopulmonary aerobic capacity testing
(CACT), New York Heart Association functional class and the SF-36 quality of life
questionnaire will be used as primary outcome measures. Confounders which may
influence the quality of life and functional outcome, such as ventricular function,
native valve dysfunction and rhythm disorders, will be recorded using
echocardiography, magnetic resonance imaging (MRI) and 24-hour Holter
recording.
Objective 2
To investigate the prevalence and degree of PPM, echocardiography will be used
to measure the EOA and calculate the indexed EOA (iEOA = EOA/Body Surface
Area). Consequences of PPM including the presence and degree of ventricular
hypertrophy, ventricular and atrial volumes, and pulmonary pressures will be
measured with MRI and/or echocardiography. Possible predictors of PPM will be
identified from the medical records, such as underlying heart disease, type of
cardiac surgery, type and size of valve prosthesis and age at implantation.
Objective 3
The inventory of the patient’s past medical history and present medical status
(including current medical history and physical examination) will be used to record
the incidence of prosthesis-related complications. Published guidelines will be
used for the registration of complications [8]. To ensure completeness of data
collection a patient interview will be used to check if any data were missed by
studying the medical files; however, data that can not be verified from medical
files are not qualified for entry in the database.
Ch
ap
ter 7
T
he
PR
OS
TA
VA
stud
y
0
25
50
75
100
125
150
AVR Bentall Ross PVR MVR TVR

116
Laboratory evaluations will be performed to obtain information on heart
failure and haemolysis. To detect rhythm disorders, ventricular hypertrophy and
intraventricular conduction delays, electrocardiogram and 24-hour Holter
monitoring will be used. Ventricular volumes, mass and function and prosthetic
valve function will be assessed using echocardiography and MRI.
Cardiopulmonary aerobic capacity testing
The parameters to be recorded are: expected and achieved VO2max, respiratory
quotient, anaerobic threshold, blood pressure at rest and during exercise, and
heart rate at rest and during exercise.
Quality of life questionnaire
Quality of life will be assessed using the short-form 36 health survey
questionnaire. This questionnaire consists of 36 items to measure health and
quality of life using a multi-item scale for eight different aspects: physical
functioning, role of limitations due to physical problems, role of limitations due to
emotional problems, social functioning, mental health, pain, energy/vitality and
general health. Furthermore, there is a single item on changes in respondents’
health over the past year.
Echocardiography
Two-dimensional echocardiography will be performed according to current
guidelines to assess the function of prosthetic and native valves, to quantify
chamber dimensions and left ventricular mass, and to assess chamber function.
Pulmonary artery systolic pressure will be estimated and disease-specific
evaluation performed. The EOA will be determined by the continuity equation
using continuous and pulsed wave Doppler. For prosthetic valves, moderate PPM
in the aortic and pulmonary valve position is defined as an iEOA of 0.65 – 0.85
cm2/m
2 and severe PPM as iEOA ≤ 0.65 cm
2/m
2. For the mitral and tricuspid
position, we will consider moderate PPM to be present when the iEOA is ≤ 1.25
cm2/m
2 and severe PPM when the iEOA is ≤ 0.95 cm
2/m
2 [9,10].
Magnetic resonance imaging
Systemic and pulmonary ventricular function, volume and mass will be determined
with a steady-state free precession cine sequence in the short-axis plane. Flow
dynamics, including the regurgitation fraction of the aortic and pulmonary valve,
will be assessed by using velocity-encoded MR imaging distal to the prosthetic
117
valve. It is expected that approximately 25% of the patients will have a
contraindication for MRI (i.e. pacemaker).
Statistical and ethical considerations
Sample size Because this is an explorative study in a population where the
prevalence of both valve characteristics (e.g. PPM) and the values for outcome
measures are yet unknown, an appropriate sample calculation is not possible.
However, the populations we expect to include are sufficiently large for all valve
locations; therefore, meaningful outcomes can be expected.
Statistical analysis
Continuous variables will be expressed as mean and standard deviation when
normally distributed or as median with interquartile ranges in case of non-normal
distribution. Categorical variables will be presented as absolute numbers and
percentages.
Groups will be compared by using independent Student’s t-test for normally
distributed continuous variables. Mann-Whitney U test will be used for
comparisons of non-normally distributed continuous variables, and 2 test or
Fisher’s exact test for comparison of categorical variables. Univariate and
multivariate logistic regression analysis will be performed to identify independent
predictors for main outcome measures. All statistical analyses will be performed
using the statistical software package SPSS version 16.0 or higher (SPSS Inc.,
Chicago, IL). All statistical tests are two-tailed and a P-value of <.05 is considered
statistically significant.
Ethical considerations
The PROSTAVA study has been approved by the Medical Ethics Committee of all
the participating hospitals (METc2009/270; NL29965.042.09). The study will be
conducted in accordance with the Helsinki Declaration. Subjects will be asked to
participate and sign a written informed consent form after having received written
as well as oral information about the study.
Ch
ap
ter 7
T
he
PR
OS
TA
VA
stud
y
118
Discussion
In the proposed PROSTAVA study, we will assess the implications of prosthetic
valves in adult patients with CHD. We will have the opportunity to relate
prosthetic valve characteristics to functional outcome and quality of life in a
unique large-scale patient cohort. In addition we will investigate the incidence of
complications related to prosthetic valve type, size and location in this adult
population with CHD.
Valve type: biological or mechanical valve prosthesis
In children and young adults, biological valves are often implanted to avoid the
disadvantages of oral anticoagulation therapy. The rate of structural valve
degeneration is, however, high at young age. Structural valve deterioration results
in progressive prosthesis dysfunction which will impair functional capacity and
which ultimately leads to valve replacement. The influence of the amount and
prospect of re-operations on quality of life in patients with CHD has only been
studied in a relatively small population and seems to be limited [11]. However,
parameters reflecting functional status are associated with satisfaction with life
and perceived health [12]. Therefore we expect that structural valve deterioration
in adult patients with CHD will influence quality of life through its impact on
functional outcome, which we will elucidate in the PROSTAVA study.
Structural valve deterioration and re-operations can be avoided by use of
mechanical prostheses. The risk of thromboembolic complications warrants the
need for anticoagulation therapy resulting in an increased risk of bleeding
complications. The cumulative risk of bleeding complications during life may well
be high in young adults with CHD because of their long life expectancy after valve
replacement. The risk of bleeding complications may be increased by the active
lifestyle of many young adult patients with CHD. Frequent international
normalised ratio (INR) controls are needed with anticoagulant therapy and
patients are prevented from participating in risky sports activities. Poor
compliance with warfarin therapy, which is not uncommon in adolescents, can
increase the risk of thromboembolic complications. Pregnancy in women with
mechanical valves bears the risk of foetal loss and embryopathy when oral
anticoagulants are continued throughout pregnancy, while substitution with
heparin increases the risk of thromboembolic complications [13,14]. Therefore,
the impact of anticoagulation therapy is probably high in this young population.
Our study will provide insight into the incidence and predictors of biological and

119
mechanical prosthesis-related complications in adult patients with CHD as well as
the consequences for quality of life and functional outcome.
Valve size: the impact of PPM
When valve replacement is necessary in childhood, implantation of an adult-sized
prosthetic valve is often not possible. With somatic growth in children, the iEOA
decreases steadily until they reach adulthood. Therefore we expect that in our
study population the prevalence of PPM will be high.
A few small series have investigated PPM in children [15]. However, in adult
patients with CHD the prevalence and consequences of PPM are unknown. In
patients with acquired valve disease, aortic PPM is associated with less
improvement in symptoms and exercise capacity, less regression of left ventricular
hypertrophy, more cardiac events and higher mortality [4,9,16]. Mitral PPM is
associated with recurrence of congestive heart failure, pulmonary hypertension
and decreased survival [10]. We expect that PPM in adult patients with CHD will
further diminish the already compromised ventricular function and exercise
capacity. This reduction in exercise capacity may negatively influence quality of life
by limiting these patients in their daily activities. Our study will provide a
comprehensive database with a long follow-up to present us with useful
information on the incidence, predictors and consequences of PPM in adult CHD
patients.
Valve location: right-sided versus left-sided prostheses
Prevalence of tricuspid and pulmonary prosthetic valves is relatively high in adult
patients with CHD compared with patients with acquired valve disease. In right-
sided mechanical prostheses thromboembolic risk is presumed to be higher
compared with left-sided mechanical prostheses due to lower pressures and flow
velocities in the right heart. Therefore, biological valves are the preferred valve
type in the tricuspid and pulmonary position in most centres. Several recent
studies have reported satisfactory results in pulmonary mechanical prostheses
with aggressive anticoagulation, INR 3.0-4.5 [17,18]. However, data concerning
long-term survival, and thromboembolic and bleeding complications are still
limited. Available studies are small and the only large study with more than 30
patients has a short median follow-up of only 2 years. The proposed study gives
the possibility to compare complications of pulmonary mechanical valves in a
relatively large cohort (54 patients) and a cohort of patients with biological valves,
with a long median follow-up duration of more than 6 years.
Ch
ap
ter 7
T
he
PR
OS
TA
VA
stud
y

120
Limitations
A limitation of our study is the presence of multiple confounding factors such as
the heterogeneity of patients with CHD, multiple types and locations of prosthetic
valves and differences in ventricular function. Regression analysis will partially
overcome this limitation. As patients who are not able to complete the CACT and
quality of life questionnaire will be excluded from the prospective study, the study
population will not entirely representative for adult patients with CHD and a
prosthetic valve.
Another limitation comes with the use of the CONCOR database. This
database started including patients with CHD in 2001. Patients who died before
this date are not included, which will limit the possibility to investigate long-term
mortality.
Conclusion
The PROSTAVA study is the first study to investigate the influence of prosthetic
valve characteristics on functional outcome and quality of life in adult congenital
heart disease patients. Our results may influence the choice of valve prosthesis,
the indication for more extensive surgery and the indication for re-operation in
patients with prosthesis patient mismatch.

121
Addendum
Magnetic resonance imaging
MRI is performed at least 6 months after valve implantation. Systemic and
pulmonary ventricular function, volume and mass are determined with a steady-
state free precession cine sequence in the short-axis plane for the left ventricle.
Flow dynamics, including regurgitation fraction of the aortic and pulmonary valve,
are assessed by using velocity-encoded MR imaging distal to the prosthetic valve.
No contrast agent is given. Function and flow are quantitatively analyzed by the
department of Radiology of the University Medical Center of Groningen using a
commercial software package (QMass version, Medis, Leiden, The Netherlands).
The end-systolic and end-diastolic frames were selected by visual assessment
independently for the left and right ventricle. The basal slice was selected with aid
of long-axis cine view images. The basal slice of the left ventricle was defined as
the most basal slice surrounded for at least 50% by the left ventricular
myocardium. When the pulmonary valve was visible in the right ventricular basal
slice, only the portion of the right ventricular outflow tract below the level of the
pulmonary valve was included. The inflow part of the right ventricle was included
in the right ventricular volume. The right ventricular inflow part was distinguished
from the right atrium by recognizing the trabeculated and thick right ventricular
wall compared to the thin right atrial wall. Contours were drawn manually by
tracing the endocardial and epicardial borders in every slice in end-systole and
end-diastole. Contour tracing was aided by reviewing the multiple phase scans in
the movie mode.
Discussion
We expect PPM to be uncommon in pulmonary prosthetic valves as most of these
patients received relatively large prosthetic valves in their dilated right ventricular
outflow tracts. However, almost all pulmonary and tricuspid valve replacements
are performed using biological prosthetic valves. The main complication of this
valve type is structural valve deterioration resulting in a combination of stenosis
and regurgitation. Mechanical pulmonary valve prostheses show no substantial
increase in gradient and regurgitation with time. Three years after pulmonary
valve replacement, mechanical valve prostheses have a superior hemodynamic
performance compared to homografts. With our study we can investigate whether
patients with mechanical valve prosthesis also benefit in terms of right and left
ventricular volumes and function, exercise capacity and quality of life.
Furthermore, recent studies reported in patients without a pulmonary valve
Ch
ap
ter 7
T
he
PR
OS
TA
VA
stud
y

122
replacement that combined right ventricular outflow tract obstruction and
pulmonary regurgitation results in smaller right ventricular volumes and better
ejection fraction compared to patients with isolated pulmonary regurgitation. We
can investigate whether similar findings are present in patients with biological
pulmonary valve replacements and structural valve deterioration.

123
References
[1] Marelli AJ, Mackie AS, Ionescu-Ittu R, et al., (2007) Congenital heart disease in
the general population: changing prevalence and age distribution. Circulation
115:163-72.
[2] Drenthen W, Boersma E, Balci A, et al., (2010) Predictors of pregnancy
complications in women with congenital heart disease. Eur Heart J 31:2124-
32.
[3] Rahimtoola SH, (2010) Choice of prosthetic heart valve in adults an update. J
Am Coll Cardiol 55:2413-26.
[4] Tasca G, Mhagna Z, Perotti S, et al., (2006) Impact of prosthesis-patient
mismatch on cardiac events and midterm mortality after aortic valve
replacement in patients with pure aortic stenosis. Circulation 113:570-6.
[5] Karamlou T, Jang K, Williams WG, et al., (2005) Outcomes and associated risk
factors for aortic valve replacement in 160 children: a competing-risks
analysis. Circulation 112:3462-9.
[6] Masuda M, Kado H, Ando Y, Shiose A, et al., (2008) Intermediate-term results
after the aortic valve replacement using bileaflet mechanical prosthetic valve
in children. Eur J Cardiothorac Surg 34:42-7.
[7] Oosterhof T, Meijboom FJ, Vliegen HW, et al., (2006) Long-term follow-up of
homograft function after pulmonary valve replacement in patients with
tetralogy of Fallot. Eur Heart J 27:1478-84.
[8] Akins CW, Miller DC, Turina MI, et al., (2008) Guidelines for reporting
mortality and morbidity after cardiac valve interventions. J Thorac Cardiovasc
Surg 135:732-8.
[9] Pibarot P, Dumesnil JG, (2000) Hemodynamic and clinical impact of
prosthesis-patient mismatch in the aortic valve position and its prevention. J
Am Coll Cardiol 36:1131-41.
[10] Pibarot P, Dumesnil JG, (2007) Prosthesis-patient mismatch in the mitral
position: old concept, new evidences. J Thorac Cardiovasc Surg 133:1405-8.
[11] Loup O, von Weissenfluh C, Gahl B, et al., (2009) Quality of life of grown-up
congenital heart disease patients after congenital cardiac surgery. Eur J
Cardiothorac Surg 36:105,11; discussion 111.
Ch
ap
ter 7
T
he
PR
OS
TA
VA
stud
y
124
[12] Moons P, Van Deyk K, De Geest S, et al., (2005) Is the severity of congenital
heart disease associated with the quality of life and perceived health of adult
patients? Heart 91:1193-8.
[13] Pieper PG, Balci A, Van Dijk AP, (2008) Pregnancy in women with prosthetic
heart valves. Neth Heart J 16:406-11.
[14] Pieper PG, (2008) Expected and unexpected cardiac problems during
pregnancy. Neth Heart J 16:403-5.
[15] Masuda M, Kado H, Tatewaki H, et al., (2004) Late results after mitral valve
replacement with bileaflet mechanical prosthesis in children: evaluation of
prosthesis-patient mismatch. Ann Thorac Surg 77:913-7.
[16] Tasca G, Brunelli F, Cirillo M, et al., (2005) Impact of valve prosthesis-patient
mismatch on left ventricular mass regression following aortic valve
replacement. Ann Thorac Surg 79:505-10.
[17] Waterbolk TW, Hoendermis ES, den Hamer IJ, et al., (2006) Pulmonary valve
replacement with a mechanical prosthesis. Promising results of 28 procedures
in patients with congenital heart disease. Eur J Cardiothorac Surg 30:28-32.
[18] Stulak JM, Dearani JA, Burkhart HM, et al., (2010) The increasing use of
mechanical pulmonary valve replacement over a 40-year period. Ann Thorac
Surg 90:2009,14; discussion 2014-5.

125
Ch
ap
ter 7
T
he
PR
OS
TA
VA
stud
y

126

127
Summary

128
The introduction of palliative surgery led to an increased number of patients with
complex congenital heart disease surviving into adulthood. At the same time
sophisticated invasive and non-invasive imaging modalities became available.
However, most patients develop long-term complications involving the right
ventricle. The combination of a large group of patients with a dysfunctional right
ventricle and new imaging modalities boosted our understanding of anatomy,
physiology and pathophysiology of the right heart as well as improved care for
patients with right sided congenital heart disease. Nowadays, imaging is
considered a cornerstone in the follow-up of patients with congenital heart
disease. Cardiac magnetic resonance is considered the gold standard for
evaluation of cardiac volumes and function. Measurements of right ventricular
volumes and function do not rely on assumptions of geometry but uses slice
summation to calculate volumes, which are highly accurate and reproducible.
However, knowledge on the used methodology and patient characteristics is
essential for interpreting right ventricular volume measurements.
In Chapter 1 a general introduction on the right ventricle is provided with a
focus on imaging. Chapter 2 evaluated the influence of independent selection of
the end-systolic and end-diastolic frame for the right and left ventricle on cardiac
magnetic resonance derived right ventricular volume measurements in patients
with tetralogy of Fallot. Dyssynchrony resulting from a right bundle branch block in
these patients significantly extends duration of right ventricular contraction and
delays timing of right ventricular end-systole compared to the left ventricle.
Additionally, timing of right ventricular ejection and end-diastole may be delayed
in patients with tetralogy of Fallot. In some centers all right ventricular volumes
are routinely measured in the left ventricular end-systolic and end-diastolic frame.
We examined to what extent this result in a misrepresentation of right ventricular
volumes. Right ventricular end-systolic volume using the right ventricular end-
systolic instead of left ventricular end-systolic frame was smaller. Using the right
ventricular end-systolic and end-diastolic frame hardly affected right ventricular
end-diastolic volumes, while increasing the ejection fraction. QRS duration
correlated positively with the changes in the right ventricular end-systolic volume
and right ventricular ejection fraction when using the right ventricular instead of
the left ventricular end-systolic and end-diastolic frame. We conclude that for
clinical decision making in patients with tetralogy of Fallot and a right bundle
branch block, right ventricular volumes should be measured in the end-systolic
frame of the right ventricular and not of the left ventricle.
Current clinical practice is to include papillary muscles and trabeculae in the
blood volume which introduces a bias in the measured volumes and ejection

129
fraction. This bias is generally accepted, as manually excluding the papillary
muscles by drawing non-convex endocardial contours is even more time
consuming and has demonstrated a higher intra- and inter-observer variability. An
automated segmentation of blood and muscle could not only provide faster and
more objective analysis, but may also yield more accurate estimations of cardiac
volumes and function than the manual method. In Chapter 3 we validated a novel
semi-automatic threshold-based segmentation algorithm in an anthropomorphic
heart phantom, and the left ventricle of twelve subjects with normal cardiac
function. The semi-automatic threshold-based segmentation software we
developed classified voxels within the epicardial contour as either blood or muscle
according to their signal intensity, taking into account spatial variations in signal
intensity. We showed that this semi-automatic method could exclude left
ventricular endoluminal muscular structures from the blood volume with
significantly improved intra- and inter-observer variabilities in function
measurements compared to the conventional, manual method, which includes
endoluminal structures in the blood volume.
Chapter 3 was limited to the left ventricle. Therefore, we used the same
software in Chapter 4 to measure trabecular volume of the right ventricular in
adult patients with repaired tetralogy of Fallot. The main complication after repair
for tetralogy of Fallot is right ventricular volume overload due to pulmonary
regurgitation. Furthermore, many patients have some amount of pressure
overload caused by residual outflow tract obstruction, stenosis of a pulmonary
artery branch or stenosis of a valve prosthesis. These residual lesions result in right
ventricular dilatation and hypertrophy. Consensus is lacking on whether to
consider trabeculae and papillary muscles as part of measured right ventricular
volumes. In healthy subjects and patients without congenital heart disease, the
influence of trabeculae and papillary muscle on right ventricular volumes is too
small to be of clinical importance. However, in patients with repaired tetralogy of
Fallot the increase in papillary muscles and trabeculae can be large. As timing of
re-operations is guided by right ventricular volumes, the effect of including
papillary muscles and trabeculae in the right ventricular blood volume is of clinical
importance. We showed that the semi-automatic threshold-based segmentation
software provided a reproducible method to differentiate right ventricular
myocardium from blood. Compared to including papillary muscle and trabeculae
from the right ventricular blood volume, exclusion of the papillary muscle and
trabeculae in the right ventricular blood volume resulted in clinical significantly
decreased end-systolic and end-diastolic volumes and increased ejection fraction
and mass.
Ch
ap
ter 8
S
um
ma
ry

130
In Chapter 5 the impact of trabeculae and papillary muscles on right
ventricular volumes and function was assessed in different patient groups with
pressure overloaded right ventricles using the same software as in Chapters 3 and
4. As already shown in Chapter 4, exclusion of trabeculae and papillary muscles
from the right ventricular blood volume result in significant and potentially
clinically relevant differences in right ventricular volumes, right ventricular ejection
fraction and right ventricular mass. Furthermore the impact of trabeculae on right
ventricular volumes and function differed markedly depending on the underlying
etiology of right ventricular pressure overload.
Chapter 6 evaluated the effects of right ventricular outflow tract obstruction
on exercise capacity, right ventricular volumes, function and mass in adult patients
with tetralogy of Fallot and volume overload due to pulmonary regurgitation.
Recent studies demonstrated that patients with tetralogy of Fallot and combined
pulmonary regurgitation and right ventricular outflow tract obstruction have
smaller right ventricular volumes and higher ejection fraction compared to
patients with isolated pulmonary regurgitation. New York Heart Association
functional class was not different between both patient groups. However, since
functional class is known to be poorly correlated with objective exercise capacity,
it remained unclear what the effect of right ventricular outflow tract obstruction is
on exercise capacity. We were the first to show that patients with combined right
ventricular outflow tract obstruction and pulmonary regurgitation have reduced
exercise capacity despite more favourable right ventricular volumes at rest
compared to patients without right ventricular outflow tract obstruction.
Furthermore, peak pressure gradient across the right ventricular outflow tract was
the only independent predictor of percentage of predicted peak oxygen uptake.
Therefore, exercise testing as well as cardiac magnetic resonance imaging should
be interpreted in conjunction with the presence of right ventricular outflow tract
obstruction.
Due to the improved survival of children with congenital heart disease, the
number of adults with congenital heart disease has increased and adult patients
with congenital heart disease now outnumber children. Many of these patients
have prosthetic valves as part of their treatment. The influence of prosthetic
valves on quality of life and functional outcome in adult patients with congenital
heart disease has not been studied, and data on long-term complications are
scarce. Therefore, the multicenter cross-sectional observational study described in
Chapter 7 will assess the implications of prosthetic valves in adult patients with
congenital heart disease.
131
Future directions
Imaging is becoming more and more important in medicine, especially in the care
for grown-ups with congenital heart disease. The main purpose of this thesis on
imaging of the right ventricle is to improve care for patients with congenital heart
disease as decisions to re-operate or initiate medical therapy are increasingly
based on cardiac volumes and function. In the (near) future budgets for research
are more likely to decrease than increase. Therefore, improving care for patients
with congenital heart disease will become more dependent on retrospective
studies. To make these future retrospective studies a success, standardisation in
clinical management is the key. Currently, in many patients echocardiography,
magnetic resonance imaging, exercise testing and biomarkers are not performed
at regular intervals or combined with each other. Therefore, to boost the number
and size of future retrospective studies we should put more effort in developing
protocols for examining patients with congenital heart disease and especially in
the compliance to these protocols.
Important in this setting is also a thorough description of the used
methodology (e.g. inclusion or exclusion of trabeculae) as methods change during
time. We showed that methodology can have a profound impact on the
measurements of right ventricular volumes and function. Interpretation of studies
which used different methodologies is difficult or even impossible when the used
methodology is not clearly described. To guarantee high accuracy and
reproducibility of cardiac volume and function measurements, post-processing
should be easy and uniform. Independent selection of the end-systolic phase can
be implemented in clinical practice with great ease. Furthermore, the semi-
automatic threshold-based software described in this thesis is currently being
implemented in commercial software. Widespread application of this software
may be a step forward in the direction of achieving uniformity of right ventricular
volume measurements, which would be of great importance for research and
cooperation between centers.
Ch
ap
ter 8
S
um
ma
ry

132

133
Nederlandse samenvatting
134
De afgelopen decennia zijn er twee belangrijke ontwikkelen geweest die nog
steeds gaande zijn. Door nieuwe operatietechnieken en verbeterde zorg op de
kinder en volwassen leeftijd is de levensverwachting van patiënten met een
complexe aangeboren hartafwijking sterk toegenomen. Daarnaast zijn er nieuwe
invasieve en non-invasieve methoden ontwikkeld om het hart af te beelden. Bij
patiënten met een aangeboren hartafwijking wordt hier veelvuldig gebruik van
gemaakt aangezien veel patiënten op volwassen leeftijd complicaties krijgen van
de rechter kamer van het hart. De combinatie van een grote groep patiënten met
problemen van de rechter kamer en nieuwe beeldvormende technieken heeft
geleid tot een sterke toename in kennis over anatomie, fysiologie en
pathofysiologie van de rechter kamer alsmede verbeterde zorg voor patiënten met
rechtszijdige aangeboren hartafwijkingen. Tegenwoordig is beeldvorming een van
de hoekstenen in de zorg voor patiënten met een aangeboren hartafwijking. MRI
van het hart wordt hierbij beschouwd als de gouden standaard voor het bepalen
van de hartvolumes en functie. MRI is erg nauwkeurig en reproduceerbaar doordat
er geen aannames worden gedaan over de vorm van de rechterkamer maar
gebruik maakt van ‘slice summation’, dat wil zeggen dat hartvolumes van iedere
gescande plak bij elkaar worden opgeteld. Van belang is hierbij dat men weet hoe
er gemeten is aangezien de meetmethode van grote invloed kan zijn op de
gemeten volumes. Daarnaast is bij de interpretatie van de gevonden volumes
informatie over de patiëntenkarakteristieken onmisbaar.
In Hoofdstuk 1 word een algemene introductie gegeven over de rechter
kamer met een focus op de beeldvorming. In Hoofdstuk 2 hebben we middels MRI
de volumes van de rechter hartkamer gemeten in de eind-systolische en eind-
diastolische fase van zowel de rechter als linker kamer bij volwassen patiënten met
een gecorrigeerde tetralogie van Fallot. Vrijwel al deze patiënten hebben een
rechter bundeltakblok waardoor de rechter kamer langzamer samentrekt en het
moment van de eind-systole later valt vergeleken met de linker kamer. Daarnaast
valt mogelijk ook de eind-diastolische fase later. In sommige ziekenhuizen is het de
gewoonte om alle rechter kamervolumes te meten in de eind-systolische en eind-
diastolische fase van de linker kamer. Wij laten zien dat rechter kamer volumes
gemeten in de eind-systolische en einddiastolische fase van de rechter kamer in
plaats van de linker eind-systolische en eind-diastolische fase resulteerde in
kleinere rechter kamer eind-systolische volumes, hogere ejectie fracties en vrijwel
geen verschil in eind-diastolische volumes. Bij een toename in QRS duur namen
deze verschillen toe voor wat betreft eind-systolisch volume en ejectie fractie. Wij
concluderen dat het klinisch relevant kan zijn om bij patiënten met een tetralogie

135
van Fallot en een rechter bundeltakblok, de rechter kamervolumes te meten in de
eind-systolische fase van de rechter kamer en niet die van de linker kamer.
Vaak worden de papillairspieren en trabeculae tot het bloedvolume gerekend
bij het meten van hartvolumes middels MRI waardoor er te grote bloedvolumes
worden gemeten. Deze meetfout wordt over het algemeen geaccepteerd omdat
handmatig excluderen van alle papillairspieren en trabekels door het tekenen van
extra contouren zeer veel tijd kost en slecht te reproduceren is. Semi-
automatische segmentatie van bloed en spier zou de hartvolumes niet alleen
sneller en objectiever kunnen bepalen, maar ook nog eens accurater kunnen zijn
dan handmatig de volumes te bepalen. In Hoofdstuk 3 valideren we een nieuwe
semi-automatische methode in een hartfantoom en twaalf linker kamers bij
personen met een normale hartfunctie. Het algoritme classificeert voxels binnen
de epicardiale hartcontour als bloed of als spier afhankelijk van de signaal
intensiteit waarbij rekening wordt gehouden met spatiële variaties in de
signaalintensiteit. Wij laten zien dat deze semi-automatische methode trabekels
en papillairspieren uit het bloedvolume kan excluderen met een significant
verbeterde intra- en interobserver reproduceerbaarheid vergeleken met de
conventionele manuele methode waarbij deze structuren tot het bloedvolume
worden gerekend.
Hoofdstuk 3 beperkte zich tot de linker kamer. Daarom hebben we in
Hoofdstuk 4 dezelfde software gebruikt om het volume van trabekels en
papillairspieren te meten in de rechter kamer van volwassen patiënten met een
gecorrigeerde tetralogie van Fallot. De belangrijkste complicatie na correctie van
een tetralogie van Falot is rechter kamer volumeoverbelasting door
pulmonaalklepinsufficiëntie. Daarnaast hebben veel patiënten enige mate van
drukoverbelasting door een resterende uitstroombaan obstructie, stenose van een
pulmonalistak of stenose van een kunstklep. Deze resterende afwijkingen
resulteren in rechter ventrikel dilatatie en hypertrofie. Er is geen consensus bij het
meten van de rechter kamer of de trabekels en papillairspeieren gerekend moeten
worden tot de ventrikel bloedvolumes of spiermassa. Bij gezonde vrijwilligers en
patiënten zonder aangeboren hartafwijking is de invloed van trabekels en
papillairspieren op de gemeten rechter ventrikel volumes te klein om van klinisch
belang te zijn. Echter, bij patiënten met een aangeboren hartafwijking kan de
toename in trabekels en papillairspieren groot zijn. Aangezien het moment van
opereren gedeeltelijk bepaald wordt door de gemeten rechter kamervolumes kan
het van klinisch belang zijn om te weten wat het effect is van papillairspieren en
trabekels te includeren in de gemeten bloedvolumes. Wij laten zien dat de semi-
automatische software een reproduceerbare methode is om spier van bloed te
Ch
ap
ter 9
N
ed
erla
nd
se sa
me
nva
tting

136
scheiden. Exclusie vergeleken met inclusie van papillairspieren en trabekels in het
rechter kamervolume resulteert in significant kleinere eind-systolische en eind-
diastolische volumes en grotere rechter kamer massa en ejectiefractie welke
klinisch significant zouden kunnen zijn.
In Hoofdstuk 5 wordt met behulp van dezelfde software als in Hoofdstuk 3 en
4 de invloed van inclusie of exclusie van trabekels en papillairspieren op rechter
kamer volumes en functie onderzocht bij groepen patiënten met een verschillende
mate van drukoverbelasting van de rechter kamer. Net als bij de patiënten in
hoofdstuk 4, resulteerde exclusie van trabekels en papillairspieren tot significante
en mogelijk klinische relevante verschillen in rechter ventrikel volumes,
ejectiefractie en massa. De invloed van trabekels op de rechter kamer metingen
waren sterk afhankelijk van het onderliggend ziektebeeld.
In Hoofdstuk 6 wordt het effect bekeken van rechter kamer
uitstroombaanobstructie op inspanningsvermogen, rechter kamervolumes, functie
en massa bij volwassen patiënten met een gecorrigeerde tetralogie van Fallot en
volumeoverbelasting door pulmonalisklepinsufficientie. Recente onderzoeken
hebben laten zien dat patiënten met een gecorrigeerde tetralogie van Fallot en
gecombineerde pulmonalisinsufficientie en rechter kamer uitstroombaan
obstructie kleinere rechter kamervolumes en een hogere ejectie fractie hebben
vergeleken met patiënten met geïsoleerde pulmonalisinsufficientie. New York
Heart Association functionele klasse was niet verschillend tussen beide
patiëntengroepen. Van deze functionele klasse is echter bekend dat er een slechte
correlatie is met het objectief gemeten inspanningsvermogen. Daarom is het
onduidelijk wat de invloed is van rechter ventrikel uitstroombaanobstructie op het
inspanningsvermogen. Wij laten zien dat patiënten met een gecombineerde
rechter ventrikel uitstroombaanobstructie en pulmonalisklepinsufficiëntie
vergeleken met patiënten met een geïsoleerde pulmonalisklepinsufficientie een
verminderd objectief bepaald inspanningsvermogen hebben ondanks betere
rechter ventrikel volumes in rust. Daarnaast was de piekdrukgradient over de
rechter uitstroombaan de enige onafhankelijke voorspeller van het percentage van
voorspelde piek zuurstofopname. Daarom zou zowel inspanningsonderzoek als
rechter kamer metingen geïnterpreteerd moeten worden met kennis over de
aanwezigheid van een rechter kamer uitstroombaanobstructie.
Door de verbeterde overleving van kinderen met een aangeboren
hartafwijking is het aantal volwassen patiënten met een aangeboren hartafwijking
sterk toegenomen en is het aantal volwassen patiënten inmiddels groter dan het
aantal kinderen. Veel van deze volwassen patiënten hebben een nieuwe hartklep
gekregen als onderdeel van hun behandeling. De invloed van nieuwe hartkleppen

137
op kwaliteit van leven en inspanningsvermogen bij volwassen patiënten met een
aangeboren hartafwijking is nog niet onderzocht, en gegevens over lange termijn
complicaties zijn schaars. Daarom zal het multicenter cross sectionele
observationele onderzoek beschreven in Hoofdstuk 7 de gevolgen van
kunstkleppen onderzoeken in volwassen patiënten met een aangeboren
hartafwijking. In dit proefschrift wordt de rol van beeldvorming van de rechter
kamer in dit onderzoek uitgelicht.
Toekomst
Beeldvorming wordt steeds belangrijker in de geneeskunde, vooral bij het bepalen
van het beleid bij volwassenen met een aangeboren hartafwijking. Het
belangrijkste doel van dit proefschrift over beeldvorming van de rechter hartkamer
is daarom ook het verbeteren van deze zorg aangezien het besluit te re-opereren
of andere therapie te starten vaak gebaseerd wordt op metingen van het hart
middels MRI. In de (nabije) toekomst is het waarschijnlijk dat financiering van
onderzoek onder druk komt te staan. Daarom zal retrospectief onderzoek steeds
belangrijker worden. Om ervoor te zorgen dat er in de toekomst goede
retrospectieve onderzoeken gedaan kunnen worden is het nu al belangrijk om veel
onderzoeken gestandaardiseerd uit te voeren. In de huidige praktijk is het vaak zo
dat patiënten een echo hart, MRI hart, inspanningsonderzoek en biomarkers niet
met een vaste regelmaat of gecombineerd worden uitgevoerd. Om het aantal en
de grootte van toekomstige retrospectieve onderzoeken te bevorderen zouden we
meer inspanningen moeten leveren om protocollen te ontwikkelen voor patiënten
met een aangeboren hartafwijking en zich ook aan de protocollen te houden.
Belangrijk in deze setting is om de gebruikte methode nauwkeurig te
beschrijven (b.v. inclusie of exclusie van trabekels) aangezien methodes
veranderen gedurende de jaren. Interpretatie van onderzoeken die andere
methodes hebben gebruikt is vaak moeilijk of zelfs onmogelijk wanneer het niet
goed beschreven is. Om een hoge mate van nauwkeurigheid en
reproduceerbaarheid te garanderen moet analyseren van de MRI beelden
makkelijk en uniform zijn uit te voeren. Onafhankelijke selectie van de eind-
systolische plak is makkelijk te implementeren in de klinische praktijk. Daarnaast
wordt de semi-automatische software die gebruikt is in dit proefschrift op moment
van schrijven geïmplementeerd in reeds bestaande commercieel verkrijgbare
software. Wijdverspreid gebruik van deze software kan een eerste stap zijn
richting het uniform meten van rechter hartkamer volumes waardoor makkelijker
samen onderzoek te doen valt met andere medische centra.
Ch
ap
ter 9
N
ed
erla
nd
se sa
me
nva
tting

138

139
Dankwoord
About the author
List of publications

140
Dankwoord
Vader worden, verhuizen, toetreden tot TR125, beginnen met de opleiding tot
radioloog. Dit zijn allemaal gebeurtenissen die grote invloed hebben (gehad) op
mijn leven de afgelopen jaren. Mijn promotietraject is nu ten einde en hoort ook in
dit rijtje thuis. Maar dit proefschrift is niet alleen mijn verdienste. Zonder de
bijdrage van velen was het nooit zover gekomen of waren de afgelopen jaren lang
niet zo gezellig geweest. Een aantal personen wil ik graag in het bijzonder
bedanken.
Allereerst wil ik mijn promotor, Dirk Jan, bedanken. Hoewel mijn proefschrift
uiteindelijk vrijwel geheel gericht is op de radiologische kant van mijn werk de
afgelopen jaren waren jouw suggesties wat betreft de opbouw en boodschap van
artikelen van onschatbare waarde.
Tineke, mijn co-promotor, zonder jou was dit proefschrift zeker niet mogelijk
geweest. Jouw enthousiasme en grote betrokkenheid hebben mij er mede van
overtuigd om toch door te gaan met het onderzoek nadat ik eigenlijk besloten had
te stoppen. Daarnaast zit je altijd barstensvol goede onderzoeksideeen waarvan
we er vele hebben uitgewerkt.
Els, mijn tweede co-promotor, ik ben je dankbaar dat ik samen met Ymkje de
PROSTAVA studie heb mogen uitvoeren. Ik heb heel veel van je geleerd.
Joost, hoewel je niet mijn co-promotor was, was je samen met Els de tweede
begeleider van PROSTAVA. Mede dankzij jouw inzet en gedrevenheid hebben we
een groot aantal patiënten kunnen includeren.
Petra en Martijn, mijn kamergenoten, wil ik graag bedanken voor de gezellige tijd
die we hebben gehad. Petra, zonder jou had ik niet kunnen promoveren. Jij bent
een keiharde werker die mij altijd met raad en daad terzijde stond als ik ergens
niet uit kwam. Daarnaast stel ik jouw oprechtheid en persoonlijke interesse erg op
prijs. Martijn, wat hebben wij een plezier beleefd aan het spelen van Bomberman
in de pauze. Maar het meest heb ik nog genoten van ‘Promoveren in een
gekkenhuis’ dat wij samen gemaakt hebben voor Petra. Daarvan heb ik nog wel
het meest geleerd dat je samen meer bereikt dan in je eentje.

141
Ymkje, mijn PROSTAVA maatje, wil ik graag bedanken voor de vele gezellige en
nuttige momenten. Ik ben blij dat ik samen met jou dit project heb mogen doen.
Iedereen op de researchafdeling van de radiologie bedanken voor de prettige sfeer
en de samenwerking. Karolien wil ik met name bedanken voor de samenwerking
aan de artikelen over semi-automatische software. Martijn van Swieten, bedankt
voor het doen van vele inter-observermetingen. Stella, als researchcoordinator
ben jij onmisbaar voor iedereen die onderzoek doet bij de radiologie. Je kunt goed
luisteren en geeft praktische adviezen wanneer nodig. Hoewel mijn vaste werkplek
op de radiologie was wil ik ook graag de onderzoekers op de cardioresearch
bedanken. Als ik er was, was het altijd gezellig. De secretaresses van de
cardiologie, Alma en Audrey, wil ik graag bedanken voor alle hulp gedurende mijn
promotietraject. Anna en Philemon, de studenten van Ymkje en mij, zonder jullie
was de data nooit op tijd binnen geweest. De segmentatie methode is ontwikkeld
door Medis. Daarom wil ik in het bijzonder Kees bedanken voor het schrijven van
de software. David, ik vond het altijd erg leuk om te zien hoe enthousiast jij bezig
was met het verbeteren van jullie producten en dat ik veel van mijn input ook
terug zag in nieuwe versies. Alle co-auteurs van mijn artikelen wil ik graag
bedanken voor hun bijdrage aan dit proefschrift. Graag wil ik ook alle mensen
bedanken in de centra waar ik vanwege de PROSTAVA studie ben geweest. Mieke
wil ik in het bijzonder bedanken, jij hebt mij veel werk uit handen genomen in
Utrecht.
Graag wil ik ook alle andere die ik nog niet genoemd heb, maar wel op de één of
andere manier betrokken zijn geweest bij dit proefschrift.
Lieve Gienke, bedankt voor je eindeloze liefde, begrip en support. Ik weet niet wat
ik zonder jou zou moeten. Jochem en Stijn, jullie doen mij beseffen wat echt
belangrijk is in het leven.
Ch
ap
ter 1
0
Da
nk
wo
ord
, Ab
ou
t the
au
tho
r, List of p
ub
licatio
ns

142
About the author
Hendrik Freling was born on 24th
of February, 1985 in IJsselstein, the Netherlands.
He grew up in Maastricht and Hoogeveen. He attended high school at the Roelof
van Echten College in Hoogeveen, where he graduated in 2003. In September 2003
he started to study Medicine at the University of Groningen. He went to the
Scheper Ziekenhuis Emmen for his internships. In 2003 he started his senior
internship at the department of Radiology in the University Medical Center
Groningen and at the department of Cardiology in the Isala Clinics Zwolle. He
graduated as Medical Doctor in September 2009.
After his graduation, he started working in a research position at the
department of Radiology at the University Medical Center Groningen. After one
year he also started working for the department of Cardiology on a project of the
Netherlands Heart Foundation. He presented his research topics at various
international congresses, including the Radiological Society of North America,
European Congress of Radiology and the European Society of Cardiac Radiology. In
July 2013, he started his residency in Radiology at the University Medical Center
Groningen.

143
List of publications
[1] Freling HG, van Slooten YJ, van Melle JP, Mulder BJ, van Dijk AP, Hillege HL,
Post MC, Sieswerda GT, Jongbloed MR, Willems TP, Pieper PG; PROSTAVA
investigators. (2012) Prosthetic valves in adult patients with congenital heart
disease: Rationale and design of the Dutch PROSTAVA study. Neth Heart J.
20(10):419-24.
[2] Freling HG, Pieper PG, Vermeulen KM, van Swieten JM, Sijens PE, van
Veldhuisen DJ, Willems TP. (2013) Improved cardiac MRI volume
measurements in patients with tetralogy of Fallot by independent end-
systolic and end-diastolic phase selection. PLoS One.8(1):e55462.
[3] Freling HG, van Wijk K, Jaspers K, Pieper PG, Vermeulen KM, van Swieten JM,
Willems TP. (2013) Impact of right ventricular endocardial trabeculae on
volumes and function assessed by CMR in patients with tetralogy of Fallot. Int
J Cardiovasc Imaging. 29(3):625-31.
[4] Jaspers K, Freling HG, van Wijk K, Romijn EI, Greuter MJ, Willems TP. (2013) I
mproving the reproducibility of MR-derived left ventricular volume and
function measurements with a semi-automatic threshold-based segmentation
algorithm. Int J Cardiovasc Imaging. 29(3):617-23.
[5] van Slooten YJ, Freling HG, van Melle JP, Mulder BJ, Jongbloed MR, Ebels T,
Voors AA, Pieper PG. (2013) Long-term tricuspid valve prosthesis-related
complications in patients with congenital heart disease. Eur J Cardiothorac
Surg. [Epub ahead of print]
[6] Freling HG, Willems TP, van Melle JP, van Slooten YJ, Bartelds B, Berger RFM,
van Veldhuisen DJ, Pieper PG. Effect of right ventricular outflow tract
obstruction on right ventricular volumes and exercise capacity in patients
with repaired tetralogy of Fallot. Accepted in Am J Cardiol
[7] Driessen MMP, Baggen VJM, Freling HG, Pieper PG, van Dijk AP, Doevendans
PA, Snijder RJ, Post MC, Meijboom FJ, Sieswerda GTj, Leiner T, Willems TP.
Pressure overloaded right ventricles: a multicenter study on the importance
of trabeculae in right ventricular function measured by CMR. Accepted in Int J
Cardiovasc Imaging
Ch
ap
ter 1
0
Da
nk
wo
ord
, Ab
ou
t the
au
tho
r, List of p
ub
licatio
ns

144