university of cincinnati - — mechanical and … · graduate period of study at the university of...
TRANSCRIPT
_______________________________
_______________________________
_______________________________
_______________________________
UNIVERSITY OF CINCINNATI
Date:___________________
in:
It is entitled:
Chair: _______________________________
I, _________________________________________________________, hereby submit this work as part of the requirements for the degree of:
This work and its defense approved by:
Reverse logistics issues and methods in a global supply chain
scenario.
A thesis submitted to the Division of
Graduate Studies and Advanced Research
Of the University of Cincinnati
in partial fulfillment of the
requirements for the degree of
MASTER OF SCIENCE
in the Department of Mechanical, Industrial and Nuclear Engineering
of the College of Engineering
2004
by
Vikram Ranade
B.E (Mechanical Engineering)
Rajarambapu Institute of Technology,
Shivaji University, India, 1999.
Thesis Advisor and Committee Chair: Dr. Ernest L. Hall
1
Abstract
Reverse logistics issues and methods in a global supply chain scenario.
By Vikram Ranade
Chairperson of Supervisory Committee: Professor Earnest L. Hall
Department of Industrial Engineering
Conventionally people have been defining logistics as a means of getting
manufactured goods from the manufacturer to the customer. It is often viewed as
a system of delivering goods to the customers but seldom the reverse. Here the
concepts of reverse logistics are discussed and compared to that of forward
logistics.
The field of forward or conventional logistics is well covered. The delivery models
have been studied in detail and well researched. But in reverse logistics these
very models are not established.
This is an opportunity of explore some of the ideas as to when and where
reverse logistics comes into play. We all know the supply chain that flows in the
forward direction, but, what happens when the customers want to return the
goods? What happens when the Government is breathing down your neck to be
environmental friendly? What happens when you fear that the knowledge
intensive parts might end up with you competitors?
That’s when reverse logistics comes into picture. In spite of some very intriguing
questions raised above, many companies are not capable of or are unwilling to
enter the reverse logistics market. Such reluctance appears to be attributed to
lack of knowledge of reverse logistics. [1]
2
Case study of a high profile company like IBM has been selected and studied to
best answer the above questions.
Vehicle routing problems is a very challenging field. An attempt is made using a
Mathematical model to find the shortest route for Simultaneous Pick up and
Delivery. The problem has been solved for optimizing the route using Solver in
MS Excel. Further research needs to be done to take into account the load of the
items to be picked up and the vehicle capacity.
The comparison shows that there is a large scope for further research into
developing various reverse logistics models and with the global economy, cut
throat competition, and tough environmental standards to comply with, the future
of these industries may very well depend on the implementation of the best
supply chain techniques and strategies.
Acknowledgments
3

I would like to thank my advisor Dr. Ernest L. Hall without whose
guidance and support this thesis would not have been possible. His
suggestions and feedback greatly helped me in my thesis. He helped
and encouraged me from all perspectives to complete this work.
I would like to thank Dr. Richard L. Shell and Dr. Ronald L. Huston for
agreeing to serve on the committee. I would also like to thank them
for their suggestions and positive feedbacks.
I would like to thank the Faculty members at the University of
Cincinnati for all the help and support they had given me during my
graduate period of study at the University of Cincinnati. I would like to
thank all my friends and well-wishers who had helped me from time to
time.
Last but not the least; I would like to thank my family for their
encouragement and support in all my endeavors. I owe all my
success to them.
4
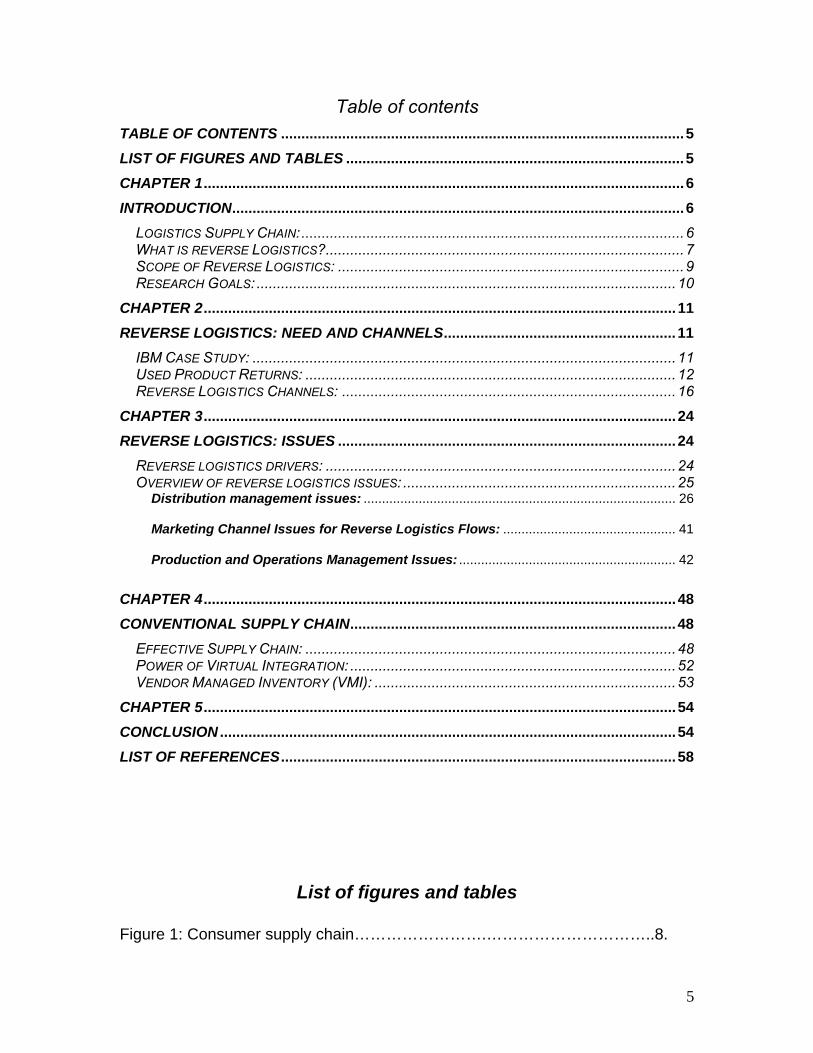
Table of contents TABLE OF CONTENTS ...................................................................................................5 LIST OF FIGURES AND TABLES ...................................................................................5 CHAPTER 1......................................................................................................................6 INTRODUCTION...............................................................................................................6
LOGISTICS SUPPLY CHAIN:..............................................................................................6 WHAT IS REVERSE LOGISTICS?........................................................................................7 SCOPE OF REVERSE LOGISTICS: .....................................................................................9 RESEARCH GOALS: .......................................................................................................10
CHAPTER 2....................................................................................................................11 REVERSE LOGISTICS: NEED AND CHANNELS.........................................................11
IBM CASE STUDY: ........................................................................................................11 USED PRODUCT RETURNS: ...........................................................................................12 REVERSE LOGISTICS CHANNELS: ..................................................................................16
CHAPTER 3....................................................................................................................24 REVERSE LOGISTICS: ISSUES ...................................................................................24
REVERSE LOGISTICS DRIVERS: ......................................................................................24 OVERVIEW OF REVERSE LOGISTICS ISSUES: ...................................................................25
Distribution management issues: ..................................................................................... 26
Marketing Channel Issues for Reverse Logistics Flows: ............................................... 41
Production and Operations Management Issues: ........................................................... 42
CHAPTER 4....................................................................................................................48 CONVENTIONAL SUPPLY CHAIN................................................................................48
EFFECTIVE SUPPLY CHAIN: ...........................................................................................48 POWER OF VIRTUAL INTEGRATION: ................................................................................52 VENDOR MANAGED INVENTORY (VMI): ..........................................................................53
CHAPTER 5....................................................................................................................54 CONCLUSION ................................................................................................................54 LIST OF REFERENCES.................................................................................................58
List of figures and tables Figure 1: Consumer supply chain…………………….…………………………..8.
5
Figure 2: On-site and off-site disposition processes...…………………………16
Figure 3: IBM reverse channel for used machines…………………………….19
Figure 4: Reverse logistics strategic decision-making model………………..22
Figure 5: Quantitative analysis of mathematical model using MS Excel……34
Figure 6: The recovery chain…………………………………………………….36
Figure 7: Product recovery network topology……..…………………………...37
Figure 8: Conventional and Dell’s PC supply chain…………………………...52
Table 1: Reverse logistics terms with definitions……………………………...15
Table 2: Functional product vs. innovative product…………………………...48
Table 3: Physically efficient and Market responsive supply chains………….49
Table 4: Matching products and the supply chains……………………………51
Chapter 1
Introduction
Logistics supply chain:
Logistics is the process of planning, implementing, and controlling the efficient,
effective flow and storage of raw materials, in-process inventory, finished goods,
6
services, and related information from the point of origin to the point of
consumption (including inbound, outbound and external movements) for the
purpose of confirming to customer requirements [2] . The goal of manufacturing
companies is to ship goods through their plants to their customers. This
movement of goods most often means a profit to all involved. These same
companies, however, do not want products to be returned for any reason. They
do not plan for the backward movement or return of goods, known as reverse
logistics, as these returns represent a substantial cost rather than a profit. Some
CEO's even perceive returned goods as a failure of their system.[3, 4] Sometimes
reverse logistics is regarded as a recycling process involving aluminum cans,
papers, plastic and glass.
What is reverse logistics?
Over the last decade, reverse logistics has had a significant economic impact on
industry as well as society. This impact can be seen either as detrimental to a
company, and thus avoided, or as a competitive advantage with potential for
capturing market share.
7
Fig. 1: Consumer supply chain. Source: Lummus et al. [5]
Companies that receive items back from the customer who try to hide from the
significance of reverse logistics miss profit-making opportunities.[6, 7] On the other
hand, companies that use reverse logistics as an opportunity for enhanced
8
business will prosper by maintaining customer support, the ultimate issue for
profitability.
Reverse logistics is actually very involved and can be extremely complex. Many
companies with limited resources outsource their reverse logistics operation
needs to third-party providers. These third-party companies such as FedEx,
ASTRA and GENCO, not only aid the return process of goods by scheduling the
pickup and transportation, they also collect customer information and track the
status of returned items.[8]
Scope of reverse logistics: Reverse logistics is an element of growing diversity of logistics systems.
Traditionally supply chains have been perceived as a unidirectional structure with
a well defined hierarchy. However we currently see logistics systems developing
into general networks of organizations that cannot be ordered in such a way that
all materials flow ‘downstream’. The cases discussed later on illustrate the
growing importance of material flows opposite to the traditional supply chain
direction. While these ‘reverse’ flows should not be segregated from the overall
picture they deserve focused attention and hence a distinct ‘name’, as they bring
about novel business situations and management issues.
Reverse logistics is concerned with secondary goods flows in the sense that it
refers to products of which an original use has been completed or has become
impossible. The objective is to maximize economic value given the resulting
products. This may include disposal or some other form of recovery.
9
The term ‘Reverse Logistics’ very much expresses the perspective of the
receiving party. Hence, reverse logistics is a special form of inbound logistics.
Research goals: In traditional ‘forward’ logistics, quantitative models have proved a powerful tool
for supporting these types of decisions and, more generally, for understanding
the underlying systems. For many decision problems standard operations
research models such as facility location models, routing and scheduling models,
or stochastic inventory models have been developed that are widely recognized.
A mathematical model has been solved for vehicle routing problems. In order to
establish such models there is a need to first understand the theory which gives
rise to the complications normally associated with ‘Reverse Logistics’.
In this vein, the text aims at:
• Generalizing observations from individual reverse logistics cases.
• Implementing a quantitative model for vehicle routing issue.
• Comparing ‘Conventional Logistics’ to ‘Reverse Logistics’.
• Logistics issues arising in the management of ‘Reverse’ goods flow.
10
Chapter 2
Reverse logistics: Need and channels
IBM case study: To highlight the importance of reverse logistics in today’s business environments
and to illustrate emerging issues we discuss an exemplary case in some detail.
For this purpose we consider the reverse logistics activities at IBM, one of the
major players in electronic business.
At the same time, this sector is one of the most prominent in the recent reverse
logistics developments.
Here are some of the reasons that attribute to this:
• High market volumes
• Short product life-cycles
• Technical feasibility of electronic components reuse.
• Environmental concerns with disposing electronic parts.
The electronic components reuse is mainly due to lack of ‘wear and tear’, in
contrast to mechanical components, result in a vast product recovery potential.
IBM’s business activities as a leading manufacturer of IT equipment and services
involve several groups of ‘reverse’ goods flows. As one of the definitions of
reverse logistics goes, it concerns inbound flows of secondary goods from
downstream supply chain parties. In case of IBM this encompasses the following
categories.
• Used Machines
• Lease Returns
11
• Trade- in offers
• Environmental take back
• Unused Machines
• Retailer Stock Rotation
• Cancelled Orders
• Rotable spare parts
The first distinction can be made between returns of entire machines on one
hand and of spare parts on the other. The former can be further divided into used
and unused equipment. More specifically, the different groups can be
summarized as follows.
Used product returns: Used product returns stem from several sources, mainly in the business market.
First of all, the most traditional category concerns returns of leased equipment. In
this case the machines are returned to IBM unless customers eventually buy
them at the end of the lease period that typically amounts to about three years.
IBM may offer to trade in used machines from customers buying new ones.
Commercial considerations and recovery of valuable resources are the major
drivers for this initiative. Moreover in this way knowledge intensive components
can be prevented from leaking to broker markets or competitors.
IBM has established product take back programs in selected countries including
the USA, South Africa, and the most countries in Western Europe, and offers to
12
take back any used equipment customers want to dispose of for free or for a
small fee.
In addition to the above drivers, a ‘green’ company profile and compliance with
the current or expected environmental regulation play a major role in this context.
The latter concerns both the business and the consumer market. For example,
the ‘White and Brown Goods Act’ in the Netherlands obliges manufacturers and
importers of electronic appliances to take back their products after use and
recover certain minimum percentages.
Similar legislation applies in Norway and is currently discussed in several other
European countries as well as on an EU- Level. Similar directions are also taken
in Eastern Asia, including Japan and Taiwan. [9]
On a much smaller scale, IBM also faces returns of unused machines. IBM
grants retailers the right, under specific conditions, to return a specific amount of
unsold stock against refunding. In other words, IBM covers a part of the retailers’
market risk. Similarly a customer might be allowed to cancel the order until a
certain point in the sales process, after the shipment has taken place. Both of
these cases again primarily take concern the business, market.
Finally, another important class of Reverse Logistics at IBM contains rotable
spare parts, which have been key to IBM’s service concept for a long time. To
support its service activities IBM maintains a stock of some 100,000 different
spare parts. Defective parts replaced in a customer’s machine are sent back for
repair and can then be used as spare parts again. In this way keeping the
components in a closed loop as much as possible substantially reduces
13
procurement costs. In addition to defective parts, good parts that were needed
for diagnostic reasons are also returned.[10]
Recognizing the growing strategic impact of reverse logistics flows IBM has
recently set up a new business unit Global Asset Recovery Services (GARS) that
is responsible for managing all goods return world-wide. In particular, assigning
returned goods to appropriate reuse options, i.e. dispositioning, is an important
task of GARS. By centralizing these activities in one organization IBM opts for an
active return management that systematically exploits the resource potential of
‘reverse’ goods flows. In order to recover a maximum of value from the various
sorts of returned equipment IBM considers a hierarchy of reuse options on a
product, part, and material level. In this way, goods return flows account for a
total annual financial benefit of several hundred millions US$.
Here we discuss the reverse logistics channels per goods category and highlight
salient issues. Focus is on the geographical area of Europe, the Middle East and
Africa (EMEA). For America, Asia and the Pacific region similar observations
hold.
14
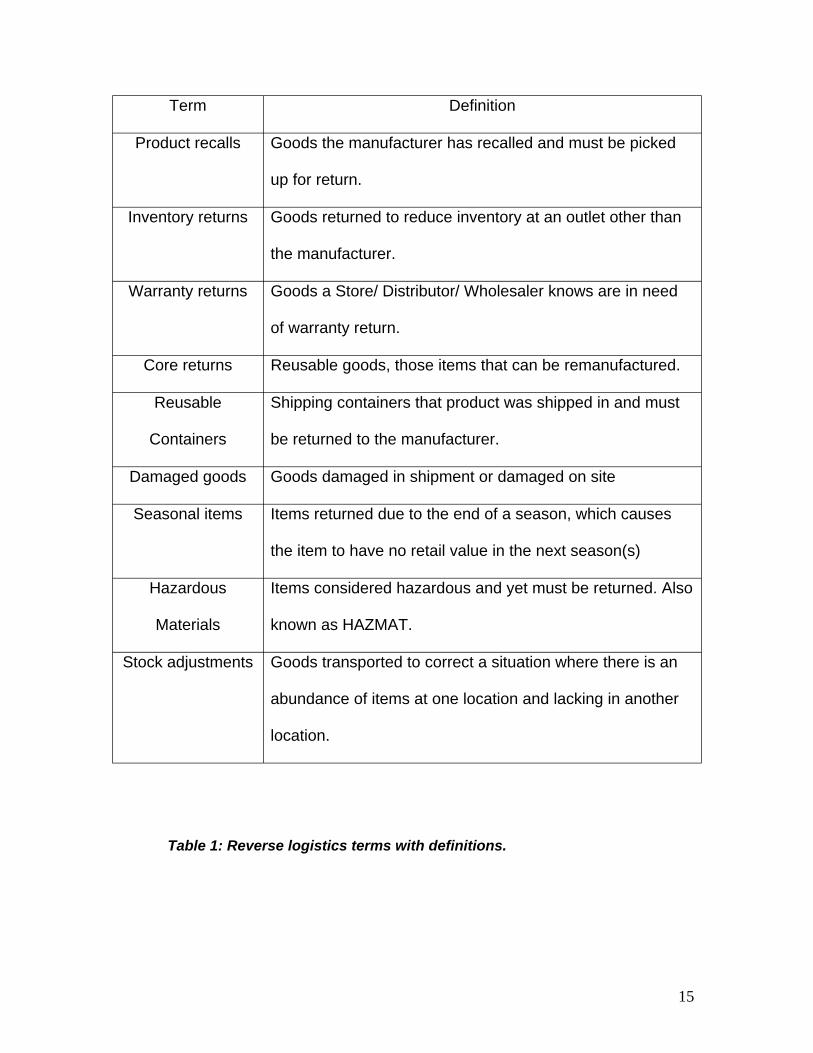
Term Definition
Product recalls Goods the manufacturer has recalled and must be picked
up for return.
Inventory returns Goods returned to reduce inventory at an outlet other than
the manufacturer.
Warranty returns Goods a Store/ Distributor/ Wholesaler knows are in need
of warranty return.
Core returns Reusable goods, those items that can be remanufactured.
Reusable
Containers
Shipping containers that product was shipped in and must
be returned to the manufacturer.
Damaged goods Goods damaged in shipment or damaged on site
Seasonal items Items returned due to the end of a season, which causes
the item to have no retail value in the next season(s)
Hazardous
Materials
Items considered hazardous and yet must be returned. Also
known as HAZMAT.
Stock adjustments Goods transported to correct a situation where there is an
abundance of items at one location and lacking in another
location.
Table 1: Reverse logistics terms with definitions.
15
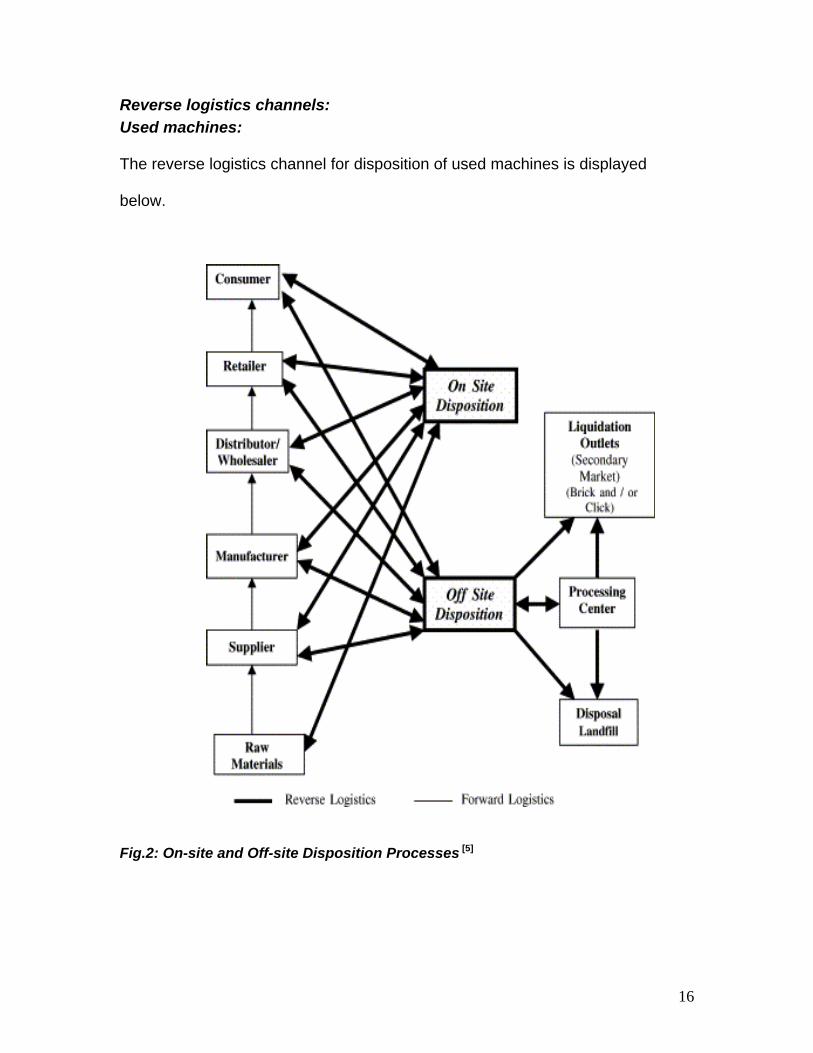
Reverse logistics channels: Used machines:
The reverse logistics channel for disposition of used machines is displayed
below.
Fig.2: On-site and Off-site Disposition Processes [5]
16
Machines from business customers are, in general, returned via one of the
national distribution centers (DC). Subsequently, several recovery options are
considered. If a used machine is deemed remarketable it is assigned to
refurbishment. After testing, replacing worn-out or outdated modules, repair, and
cleaning it may then be re-sold, possibly via internet. Refurbishment is relevant
mainly for lease returns. Presently IBM runs two refurbishment facilities in
Europe for different product ranges, namely in Montpellier, France and in
Niederroden, Germany.
If refurbishment is not viable a used machine may be dismantled in order to
recover valuable parts. Parts are tested and repaired if necessary and may then
enter the spare parts circuit. If not required internally, some of the generic parts
may be sold to external parties, such as brokers. Used machines are a valuable
source for spare parts since the cost for dismantling and subsequent processing
are significantly lower than for buying new parts. Moreover, dismantling
represents an opportunity to avoid maintaining production capacity for spare
parts only, which is relevant since the service period for a given machine type is
typically much longer than its period of production. Dismantling is currently
carried out at three European IBM locations that process equipment from several
EMEA countries namely in Amsterdam, The Netherlands, in Mainz, Germany,
and in Montpellier France.
The remained of the used machines is transferred to recycling subcontractors,
such as MIREC in Netherlands, to recover secondary raw materials. On a global
scale, only a remained of some 5% is land filled or incinerated.
17
Used machines returned from the consumer market follow a different road.
Since individually collecting this equipment, which usually has a low market
value, tends to be inefficient IBM supports branch wide approaches for this
market sector. For example, to comply with recent product take-back legislation
in the Netherlands IBM participates in a system organized by ITC, the Dutch
association of information and communication technology producers. In this
case, used machines from different manufacturers are collected by the
municipalities from where they are shipped to recycling companies subcontracted
by ITC. Costs for transportation and recycling are shared by ITC members,
proportional to the volume share of their brands in the return flow.
The current locations of the above IBM recovery facilities are largely historically
motivated. Re-Designing the corresponding logistics network is considered in
the context of global returns management.
In the solution a number of identical return centers should process all used
machines from the European market. From this centralization one may expect a
substantial increase in efficiency and technical viability of the recovery activities.
However, an international logistics network design faces legislative difficulties in
this context. Both in Europe and in the USA transporting waste across borders is,
in many cases, not allowed. Therefore, one needs to determine a recoverable
resource.
18
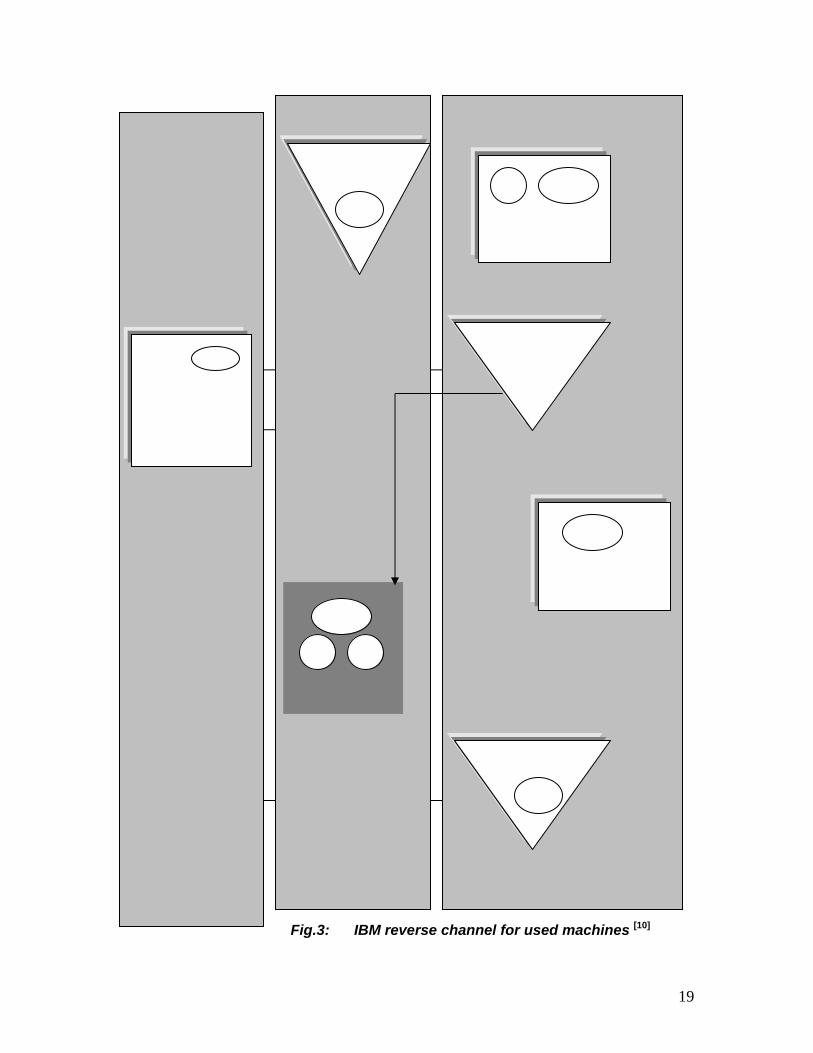
Fig.3: IBM reverse channel for used machines [10]
EU
Dismantling.
NL
FD
Spares Network
NL
Refurbishment
DL F
EU
Customer
NL
EU
Country DC
Recycling Subcontractor
Parts Broker Market
PARTS
MACHINES
Municipal
Disposal Non- Reusable Rest
MATERIALS
19
In addition, the dispositioning strategy is an important issue, the current fixed
hierarchy of options, namely refurbishment before dismantling before recycling
may not always be economically optimal. For example, benefits from parts
dismantling may, in certain cases, outweigh those from refurbishment, especially
since opportunities for actually reselling a refurbished machine are uncertain.
Addressing this issue more systematically raises the question of how to value
returned goods. Leased equipment has, in principal, a meaningful book value.
However, other returned used products are basically obtained ‘for free and do not
have a well determined ‘market value’. This does not only lead to difficulties in
accounting and tax issues but also in financial controlling. Therefore, appropriate
ways need to be found to assign costs and benefits of returned goods to
activities and organizations. Determining inventory costs is one of the related
issues in the logistics context.
Unused machines:
Unused equipment is, in general also returned via the national warehouses.
Given the technically ’new’ condition of these products one seeks to resell them,
in the first place. However, short product life cycles and hence fast depreciation
render this option highly time- critical. Therefore, much effort is put into finding
alternative markets as fast as possible. Alternatively, returning unused equipment
to the manufacturing locations is considered. Machines may be disassembled
and serve again as input to production processes. Finally, returned unused
machines for which no other opportunity has been found join the stream of used
20
machines. Parts dismantling or recycling may then contribute to recovering at
least some fraction of the original product value. In the case of unused
equipment, clear financial responsibilities prove particularly important in order to
maximize the overall result.
Spare parts:
The IBM spare parts network for the EMEA region encompasses a hierarchy of
stock locations that is fed via a central buffer in Amsterdam, The Netherlands. As
discussed above, parts are kept in a closed loop as much as possible. Therefore,
defective parts from a customer’s machine are returned by an IBM service
engineer into the network to be stocked as ‘available for repair’ in national
warehouses. Upon requirement they are then sent to a parts specific central
repair location, which may be owned by IBM or an external party. Repaired parts
are added to the regular stock again.
At the present, the parts return flow largely follows the ‘forward’ network
structure. In order to speed up the return process, and hence to achieve earlier
parts availability, a more dedicated reverse channel design is considered. In
particular, some levels of the ‘forward’ network may be bypassed for more direct
flows.
As Discussed above, dismantling used machines may serve as an alternative
source for spare parts. However, efficiently exploiting this source faces a number
of difficulties. In particular, uncertainty is a major
21
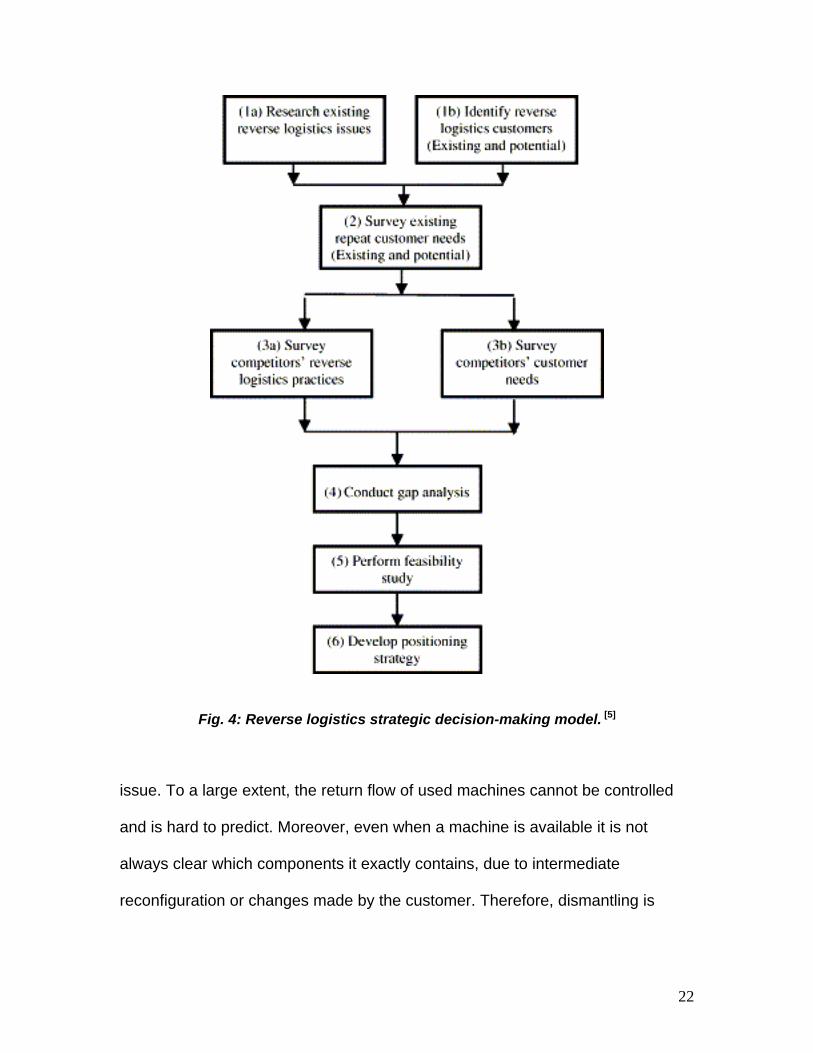
Fig. 4: Reverse logistics strategic decision-making model. [5]
issue. To a large extent, the return flow of used machines cannot be controlled
and is hard to predict. Moreover, even when a machine is available it is not
always clear which components it exactly contains, due to intermediate
reconfiguration or changes made by the customer. Therefore, dismantling is
22
perceived as a cheap yet uncertain supply source. Furthermore, quality is a
major issue in this context.
IBM is careful not to corrupt its quality standards by introducing used equipment
into its spare parts circuit. In principle, a used machine that is traded in by a
customer is not defective. However, certifying its quality may require expensive
inspection and testing. Hence, there is a tradeoff between the cost of the
dismantling channel and the quality guarantee.
23
Chapter 3
Reverse logistics: Issues As seen in the earlier chapter reverse logistics flows are diverse. Examples
range from reusable packages to disposed computer equipment and from returns
of unsold merchandise to rotable spare parts. One may think of many criteria for
a classification. In the sequel we discuss drivers, dispositioning options, actors,
and cycle times as they appear particularly important from a logistics perspective.
Reverse logistics drivers: Economic, marketing and legislative motives are commonly cited as reasons for
companies to engage in reverse logistics. We add asset protection to this list and
briefly discuss each of these drivers below.
First of all, ’reverse ’ inbound flows may be economically attractive since
used or returned products represent cheap resources from which value may be
recovered.
Second, marketing triggers refer to the role of reverse logistics in
improving a company’s market position. On the one hand, growing competition
may force companies to take back and refund excess products from their
customers. On the other hand, used product take-back and recovery is an
important element for building up a ‘green’ profile, which companies are
increasingly paying attention to.
Third, environmental regulation is another reason for reverse logistics that
is of growing importance. As sketched in the introduction, extended producer
24
responsibility has become a key element of public environmental policy in several
countries.
Fourth, we mention asset protection as another motive for companies to
take back their products after use. In this way, companies seek to prevent
sensitive components from leaking to secondary markets or competitors.
In the case of economically driven flows own can expect a more active role of
receiving party and hence a tendency towards a demand-pull situation. In
contrast, legislation and commercial motivations may lead to a supply-push
setting where the receiving party is mainly forced to respond to its customers’
behaviors.
Overview of reverse logistics issues: The authors have considered shift from a linear ‘buy-use-dump’ perception of
economy towards a concept of reconsumption cycles. They highlight emerging
management tasks in the areas of research and development, manufacturing,
and marketing. In particular, adjusting product design, setting up bi-directional
logistics infrastructures, and developing appropriate sales channels are identified
as key issues. More recently, this stream of research has been pursued with by
presenting a detailed comparison between traditional and recoverable
manufacturing environments. [11]
The drivers and constraints determining a company’s reverse logistics activities
have been investigated. Based on the literature study, regulation and customer
preferences have been identified as major stimulating factors.
25
At the same time, inferior quality of input resources and a lack of stakeholder
commitment are found to be major obstacles to successful reverse logistics
programs. [12]
It has been concluded that taking reverse logistics into account as a cost
determinant is becoming increasingly important. [13]
The consequences of a product recovery, from an accounting perspective have
been discussed. The net present value calculation result in significantly better
decisions as to the use of reusable versus disposable packaging than the current
practices of focusing on the pay-back period. [14]
Distribution management issues:
Introduction to reverse distribution:
In cases many transportation costs largely influence economic viability of product
recovery. At the same time, it is the requirement of additional transportation that
is often conflicting with the environmental benefits of product take-back and
recovery. Therefore, careful design and control of adequate transportation
systems is crucial in reverse logistics.
In a broader perspective, the above considerations point at distribution
management issues in reverse logistics. In more traditional contexts distribution
logistics has been structured in many ways, including internal versus, external
and inbound versus outbound transportation. In quantitative literature a
distinction between distribution decisions on a strategic, tactical and operational
level is common. Corresponding decision models include location-allocation
models, vehicle routing, and dynamic routing and scheduling models. [15]
26
Traditionally, quantitative models have been developed to support the physical
logistics network design, defining geographical locations, facilities, and
transportation links. Barros et al [16] report on a case study addressing the design
of a logistics network for recycling sand resulting from the processing of
construction waste in The Netherlands. While one million tons of sand used to be
land filled per year, reuse in large-scale infrastructural projects, e.g. road
construction, is considered a potential alternative in line with environmental
legislation.
Thierry [17] has proposed a conceptual model for evaluating combined
production/distribution and collection /recovery networks. The model addresses
the situation of a manufacturing company collecting used products for recovering
addition to producing and distributing new products. Recovered products are
assumed to be sold under the same conditions as new ones to satisfy a given
market demand. Additionally, disposal sites are given. Disposal is feasible for all
used products and is obligatory for products rejected after testing. In this model
all facility locations are fixed externally. The model objective is to determine cost-
optimal goods flows in the network under the given capacity constraints. Since
facilities are given, no fixed costs are considered in the model. Decision relevant
costs include variable production, handling, inspection, repair, disposal, and
transportation costs. Since only variable costs are considered in the model.
Decision relevant costs include variable production, handling, inspection, repair,
disposal and transportation costs. Since only variable costs are considered the
problem is formulated as a linear program, which can be solved to optimality.
27
A similar situation has been addressed by Berger and Debaillie. [18] They propose
a conceptual model for extending an existing production/ distribution network with
disassembly centers to allow for recovery of used products. Responsibility for
product recovery lies with the original product manufacturer, who incurs all the
costs. The model is illustrated in a fictitious case of a computer manufacturer.
The existing distribution network encompasses plants, distribution centers and
customers. In the extended network used products need to be collected from the
customers. Collected products are to be inspected in a disassembly center
dividing them into three streams: high quality products can be repaired and
shipped to a distribution center for re-sale; products containing reusable parts
may be disassembled and shipped to a plant to be reused in the production
process; and all other products are to be disposed off. Each plant and distribution
center can only use a limited amount of recovered products. While all facilities in
the original network are fixed, the number, locations, and capacities of
disassembly centers are to be determined. In a variant of this model the recovery
network is extended with another level by separating inspection and
disassembly/ repair. After inspection, rejected products are disposed of while
recoverable products are shipped to repair/disassembly center before entering a
distribution center or a plant. The authors propose multi-level capacitated MILPs
to address these problems.
Jayaraman et al [45] have analyzed the logistics network of an electronic
equipment remanufacturing company in USA. The company’s activities
encompass collection of used products (cores) from customers, remanufacturing
28
of collected cores, and distribution of remanufactured products. Customers
delivering cores and those demanding remanufactured products do not
necessarily coincide. Moreover, core supply is limited. In this network the optimal
number of cores collected is sought, considering investment, transportation,
processing, and storage costs.
Vehicle routing issues:
In addition to the strategic decisions considered, reverse logistics also gives rise
to more tactical and operational distribution issues as explained.
While determining vehicle routs and schedules is certainly an important task in
reverse logistics it is not directly clear whether this is essentially different from the
other, more traditional logistics environments. In a recent study in the context of
the Dutch electronics take-back legislation most carriers were found not to
distinguish both cases in their planning. [19]
Yet some slight differences may be observed between collection and distribution,
between inbound and outbound transportation. In particular, it has been pointed
out that time pressure is often lower in the reverse channel. Picking up empty
transportation packages such as reusable containers or pallets is less time-
critical than full delivery shipments. Similarly, taking back disposed electronic
equipment from a municipal collection site is less urgent than delivering new
ones to the retailer, the more so since economic viability of many recycling
systems relies on fixed disposal fees charged to new products rather than on the
market value of the recoverable goods. Jagdev [20] reports on experiences
concerning reverse logistics route planning at Burnham, a major US logistics
29

service provider. He concludes that cost-revenue tradeoffs and vehicle loading
time considerations are important aspects for determining efficient vehicle routes
in a reverse logistics context, rather than relying on purely distance based
planning. Another difference between collection tours and delivery tours
concerns the number of stops. Given the large number of stops per tour, e.g., in
public waste collection arc oriented planning approaches have been proposed in
literature as opposed to traditional node oriented methods. [21]
In general, combined forward and reverse distribution gives rise to vehicle routing
problems with delivery and collection stops. A similar situation has been
addressed in a traditional logistics context for the combination of supply and
delivery, e.g., in the grocery industry. So- called vehicle routing problems with
backhauling have been formulated, for which several solution algorithms have
been proposed. [22] Again the question arises whether this issue is substantially
different for reverse logistics. Beullens et al.[23] [24] argue that reverse logistics
transportation problems are characterized by a relatively large fraction of pick-up
customers as compared to more traditional settings and by a relatively large
fraction of customers with both pick –up and delivery requests (denoted as
exchange customers).
Jan Dethloff [52b] describes the following model for the vehicle routing problem
with simultaneous delivery and pick-up (VRPSDP)
30
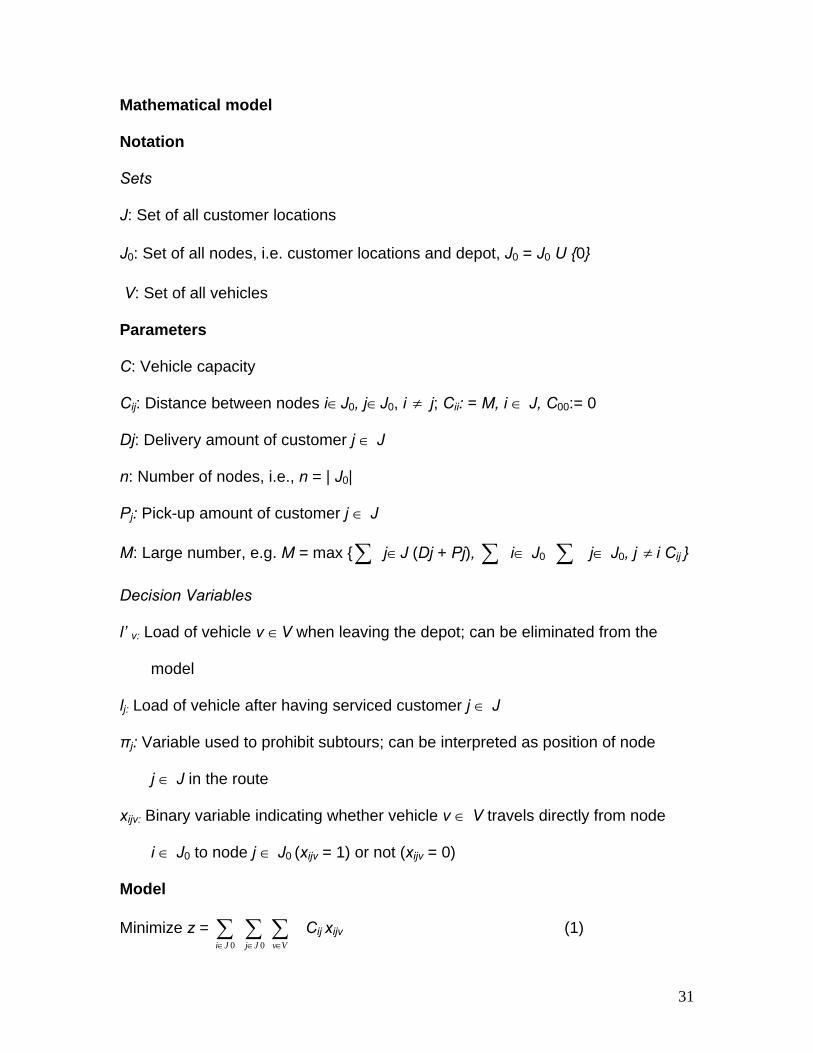
Mathematical model
Notation
Sets
J: Set of all customer locations
J0: Set of all nodes, i.e. customer locations and depot, J0 = J0 U {0}
V: Set of all vehicles
Parameters
C: Vehicle capacity
Cij: Distance between nodes i∈J0, j∈J0, i ≠ j; Cii: = M, i ∈ J, C00:= 0
Dj: Delivery amount of customer j ∈ J
n: Number of nodes, i.e., n = | J0|
Pj: Pick-up amount of customer j ∈ J
M: Large number, e.g. M = max {∑ j∈J (Dj + Pj), ∑ i∈ J0 ∑ j∈ J0, j i C≠ ij }
Decision Variables
l’ v: Load of vehicle v ∈V when leaving the depot; can be eliminated from the
model
lj: Load of vehicle after having serviced customer j ∈ J
πj: Variable used to prohibit subtours; can be interpreted as position of node
j ∈ J in the route
xijv: Binary variable indicating whether vehicle v ∈ V travels directly from node
i ∈ J0 to node j ∈ J0 (xijv = 1) or not (xijv = 0)
Model
Minimize z = C∑∑∑∈∈∈ VvJjJi 00
ij xijv (1)
31
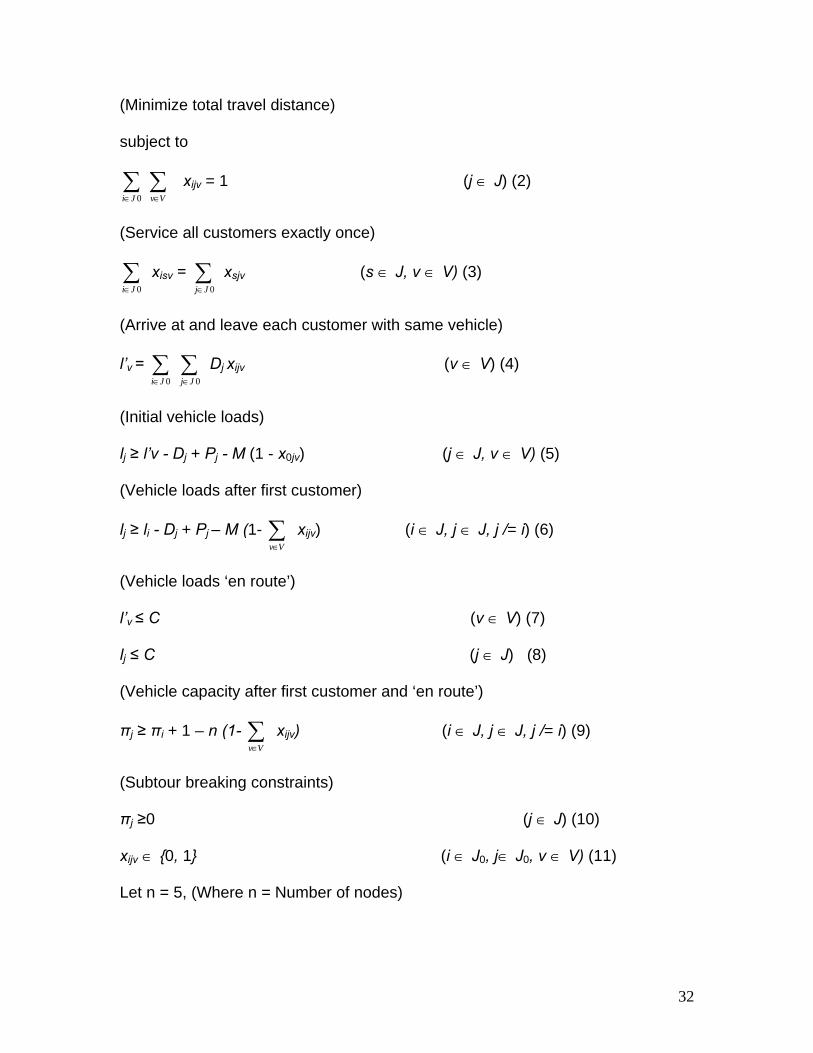
(Minimize total travel distance)
subject to
∑∑∈∈ VvJi 0
xijv = 1 (j ∈ J) (2)
(Service all customers exactly once)
∑∈ 0Ji
xisv = x∑∈ 0Jj
sjv (s ∈ J, v ∈ V) (3)
(Arrive at and leave each customer with same vehicle)
l’v = D∑∑∈∈ 00 JjJi
j xijv (v ∈ V) (4)
(Initial vehicle loads)
lj ≥ l’v - Dj + Pj - M (1 - x0jv) (j ∈ J, v ∈ V) (5)
(Vehicle loads after first customer)
lj ≥ li - Dj + Pj – M (1- x∑∈Vv
ijv) (i ∈ J, j ∈ J, j /= i) (6)
(Vehicle loads ‘en route’)
l’v ≤ C (v ∈ V) (7)
lj ≤ C (j ∈ J) (8)
(Vehicle capacity after first customer and ‘en route’)
πj ≥ πi + 1 – n (1- x∑∈Vv
ijv) (i ∈ J, j ∈ J, j /= i) (9)
(Subtour breaking constraints)
πj ≥0 (j ∈ J) (10)
xijv ∈ {0, 1} (i ∈ J0, j∈ J0, v ∈ V) (11)
Let n = 5, (Where n = Number of nodes)
32
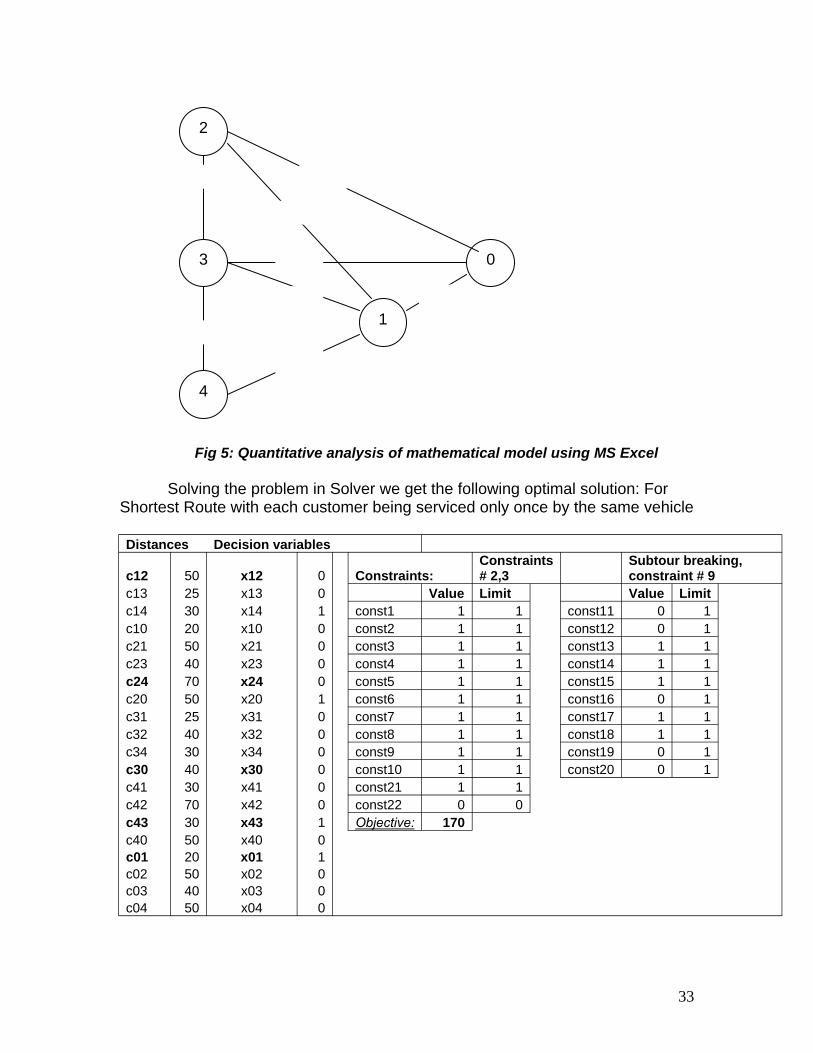
SoShortest R
Distances
c12 5c13 2c14 3c10 2c21 5c23 4c24 7c20 5c31 2c32 4c34 3c30 4c41 3c42 7c43 3c40 5c01 2c02 5c03 4c04 5
2
40
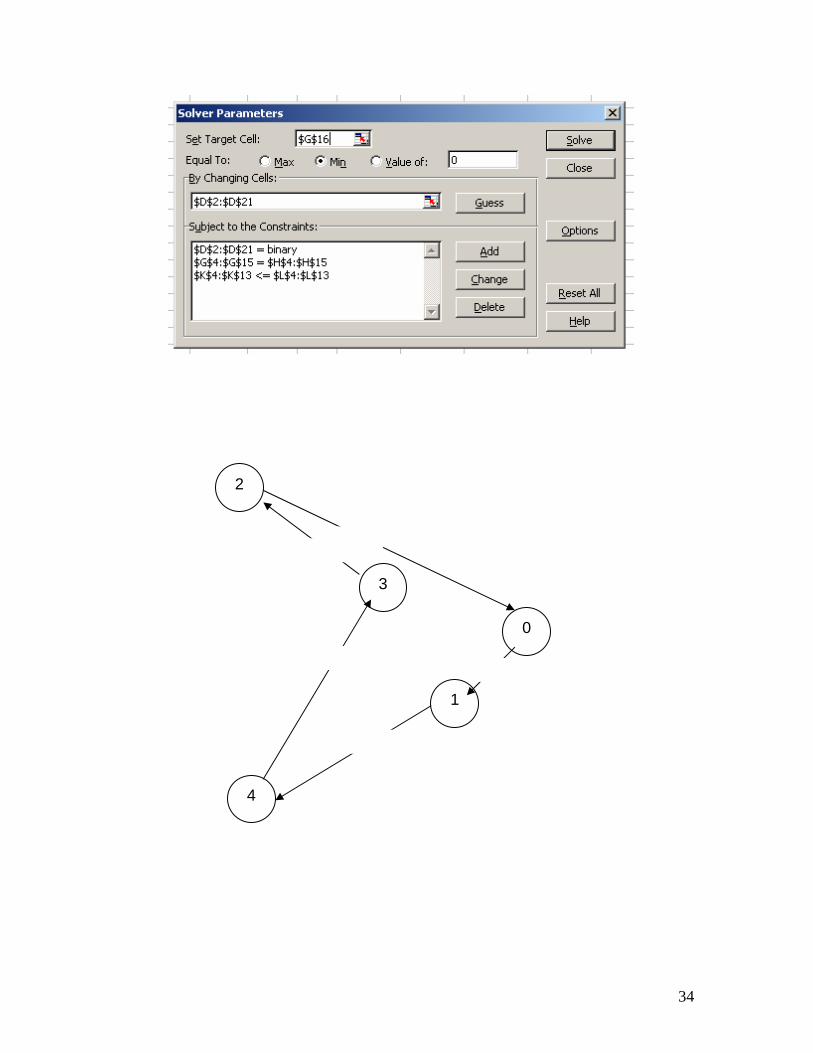
Fig 5: Quanti
lving the proboute with eac
Decision va
0 x12 5 x13 0 x14 0 x10 0 x21 0 x23 0 x24 0 x20 5 x31 0 x32 0 x34 0 x30 0 x41 0 x42 0 x43 0 x40 0 x01 0 x02 0 x03 0 x04
03
4
20
2550
tati
lemh c
riab
30
50
40
1
30ve analysis of mathematical model using MS Excel
in Solver we get the following optimal solution: For ustomer being serviced only once by the same vehicle
les
0 Constraints: Constraints # 2,3
Subtour breaking, constraint # 9
0 Value Limit Value Limit 1 const1 1 1 const11 0 1 0 const2 1 1 const12 0 1 0 const3 1 1 const13 1 1 0 const4 1 1 const14 1 1 0 const5 1 1 const15 1 1 1 const6 1 1 const16 0 1 0 const7 1 1 const17 1 1 0 const8 1 1 const18 1 1 0 const9 1 1 const19 0 1 0 const10 1 1 const20 0 1 0 const21 1 1 0 const22 0 0 1 Objective: 170 0 1 0 0 0
33
4
2
50
3
1
0
30
30
2040
34
Recovery network characteristics:
Specific steps those are important in product recovery networks:
• Collection
• Inspection / Separation
• Re- Processing
• Disposal
• Re- Distribution
Transportation and Storage have not been considered as distinct activities but as
links between the above stages. Each of these steps is briefly described below.
Collection refers to all activities rendering used products available and physically
moving them to some point where further treatment is taken care of. Collection of
take-back of used copiers or computer equipment from customers are typical
examples. In general, collection may include purchasing, transportation, and
storage activities. Recall that collection may be motivated by different drivers,
including economic benefits, marketing considerations, and legal obligations.
Inspection/ Separation denotes all operations determining whether a given
product is in fact reusable and in which way. Thus, inspection and separation
results in splitting the flow of used products according to distinct reuse (and
disposal) options. This applies, e.g., for distinguishing repairable and recyclable
subassemblies of copier sand for inspection of sieved sand on pollution.
Inspection and separation may encompass disassembly, shredding, testing,
sorting, and storage steps.
35
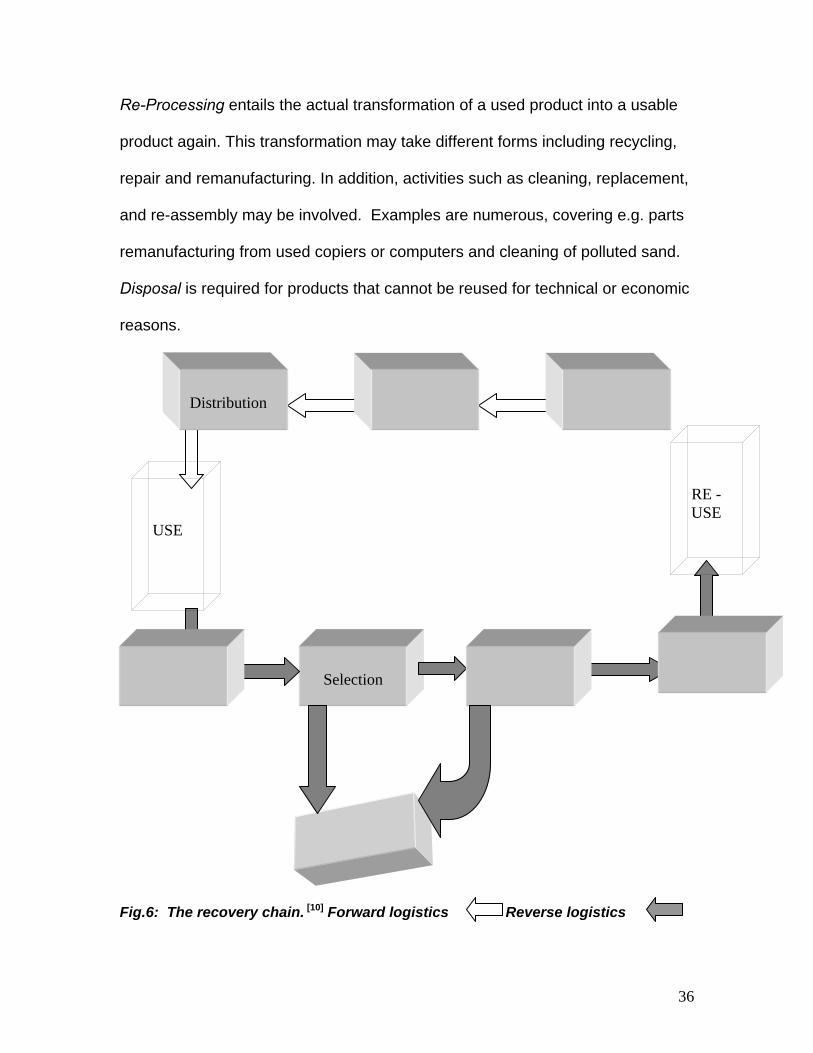
Re-Processing entails the actual transformation of a used product into a usable
product again. This transformation may take different forms including recycling,
repair and remanufacturing. In addition, activities such as cleaning, replacement,
and re-assembly may be involved. Examples are numerous, covering e.g. parts
remanufacturing from used copiers or computers and cleaning of polluted sand.
Disposal is required for products that cannot be reused for technical or economic
reasons.
Fig.6: The recovery chain. [10] Forward logistics Reverse logistics
RE - USE
Re-Distribution Re-
Processing
Selection
Collection
USE
Production
Supply
Distribution
Disposal
36
This applies, e.g. to products rejected at the separation level due to excessive
repair requirements but also to products without satisfactory market potential,
e.g., due to outdating. Disposal may include transportation, land filling, and
incineration steps.
Re-distribution refers to directing reusable products to a potential market and to
physically moving them to future users. This may encompass sales (leasing,
service contracts…), transportation, and storage activities. Sales of recycled
materials and leasing of remanufactured copy machines are among typical
examples.
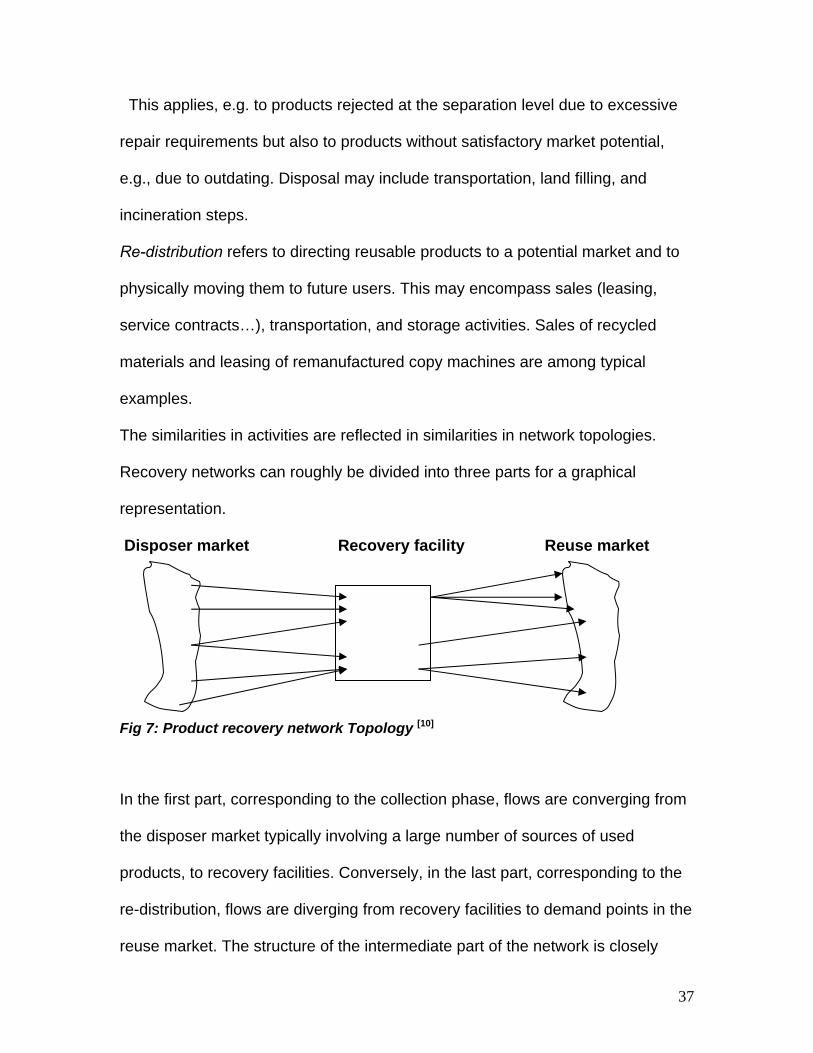
The similarities in activities are reflected in similarities in network topologies.
Recovery networks can roughly be divided into three parts for a graphical
representation.
Disposer market Recovery facility Reuse market
Fig 7: Product recovery network Topology [10]
In the first part, corresponding to the collection phase, flows are converging from
the disposer market typically involving a large number of sources of used
products, to recovery facilities. Conversely, in the last part, corresponding to the
re-distribution, flows are diverging from recovery facilities to demand points in the
reuse market. The structure of the intermediate part of the network is closely
37
linked with specific form of product recovery. In case of a limited set of
processing steps carried out at a single facility, as in the examples of reusable
packages [25] and carpet waste reprocessing, this network part may consist of a
single level, comprising one or more parallel nodes. It should be noted that only
the first part of a product recovery network actually concerns ‘reverse’ goods
flows. In this part flows are directed from users to producers and undo steps to
the original value chain. Subsequently, value is added and products move from a
producer (recoverer) to the user just as in the traditional supply chain. To avoid
misunderstanding, we therefore use the term ’product recovery network’ rather
than ‘reverse logistics network’. In fact, the above cases emphasize again that
reverse logistics should not be addressed in isolation but within the context of
preceding and succeeding ‘forward’ flows.
In accordance with the general reverse logistics perspective as discussed, it is
the party carrying out the recovery process that is concerned with the logistics
network design. Determining the number and location of recovery facilities is a
central task in the network design problems described above. In almost all cases
geographical distribution and volume of both supply and demand are considered
as exogenous variables. This gives product recovery networks a transshipment
character. Sources and sinks are fixed while intermediary nodes are to be
specified. We remark that sources and sinks, i.e. disposer market and reuse
market, may coincide. It has been noted that take back obligations due to
environmental legislation and ‘green’ market pressure often result in the supply
‘push’ situation. That is, availability of used products that needs to be taken care
38
of trigger the sequence of events rather than end product demand. At the same
time, time restrictions tend to be weaker, in general, for collection than for
distribution.
It has often been claimed that a high level of uncertainty is characteristic of
product recovery management. The above case studies support this version with
respect to network design issues. Demand for recovered products and materials
appears to be difficult to forecast in many cases, the more so since reuse market
have only been emerging recently and often are not yet well established. Even
more important, though, the availability of used products on the disposer market
involves major unknown factors. In general, timing and quantity of used products
coming free are determined by the former user rather than by the recoverer’s
requirements. Reliable planning of collection and recovery may therefore be a
difficult task. Furthermore, the form of recovery and the sequence of processing
steps required is often dependent on the quality of input, e.g., pollution, damage,
material mix, which is another unknown factor. We conclude by noting that
uncertainty in the disposer market is particularly relevant in combination with a
supply push, i.e., collection obligations.
Classification of recovery networks:
While a number of general characters of product recovery networks have been
identified, the networks encountered in the various case studies are surely not
identical. Some discriminating such as network complexity and impact of
uncertainty has already been mentioned. Here, distinctions within the class of
39
product recovery networks are discussed in more detail. Main difference
concerning the structure of the logistics networks in the above case studies refer
to the following:
• Degree of centralization
• Number of levels
• Links with closed loops
• Open versus closed loop
• Degree of branch cooperation
Centralization refers to the number of locations at which similar activities are
carried out. In a centralized net work each activity is installed at a few locations
only, whereas in a decentralized network the same operation is carried out at
several different locations in parallel. Centralization may thus be seen as a
measure for a horizontal integration or ‘width’ of a network. Analogously, the
number of levels, referring to the number of facilities a goods flow visits
sequentially, indicates the ‘depth’ or vertical integration of a network. In a single-
level network all activities are integrated in one type of facility while multi-level
network different activities are carried out at different locations. Links with other
networks refers to the degree of integration of a new network with previously
existing networks. A logistics network may be set up independently as an entirely
new structure, or by expanding an existing network. Open verses closed loop
characterizes the relation between the incoming and outgoing flows of a network.
In a closed loop network sources and sinks coincide so that flows ‘cycle’ in the
network. An open loop network, on the other hand, has a ‘one-way’ structure in
40
the sense that flows enter at one point and leave at other. Finally the degree of
branch cooperation relates to the parties responsible for setting up the network.
Initiative may be taken by a single company, possibly involving subcontractors, or
by a joint approach by an industry branch.
Marketing channel issues for reverse logistics flows:
The development of appropriate marketing channels and an efficient assessment
of tasks to the different supply chain parties have been analyzed since the early
days of reverse logistics.
Proposed classification distinguishing four reverse logistics channels:
(i) Channels using traditional middlemen.
(ii) Channels using secondary materials dealers
(iii) Channels based on manufacturing controlled recycling centers.
(iv) Channels including joint-venture resource recovery centers.
A comparison is given that focuses on collection and sorting, storage, and market
communications as main channel functions. Collection volume is found to be a
major critical success factor. [26]
The intermediates play an important role by consolidating small volume flows
from consumers into large volume suppliers to recoverers. [27]
Rather than distinguishing a few channel types they state a set of reverse
channel functions and potential actors, which can be assigned to each other in
manifold ways. In addition to the above mentioned list of activities, transportation,
compactification, and reprocessing are named as typical channel functions.
41

The role of co-operation and a more systematic channel design, including
location analysis, are stated as important research issues. The role of public
policy in providing appropriate conditions for the viability of reverse channels and
the long-term success of product recovery critically depends on partnerships
among governments, businesses, and consumers. [28]
Production and operations management issues:
Overview of the issues:
The role of production and operations management in product recovery has
received substantial attention during the past decade. In particular, much focus
has been on remanufacturing, accounting for a significant industrial sector of its
own right. In his seminal work Lund [29] emphasizes the potential of
remanufacturing for reconciling economic and environmental goals by employing
added manufacturing value incorporated in used products. Guide [30]
characterizes the main operations management issues and reviews state-of-art
research. Based on a survey among US remanufactures he identifies seven
complicating factors, namely
(i) Return uncertainty
(ii) Potential imbalance between supply and demand
(iii) A need for disassembly
(iv) Un certain yields
(v) A need for reverse logistics
(vi) Material matching restrictions
(vii) Uncertainty and variability in the processing steps.
42
The author concluded that formal systems for planning and controlling
remanufacturing operations are underdeveloped and largely absent in current
practice.
Similar conclusion is drawn in a study of the Rochester Institute of Technology [31]
Gungor and Gupta [32] take a somewhat wider perspective addressing product
recovery in the context of environmentally conscious manufacturing. An
extensive literature review is given, including issues in product design, collection,
disassembly, inventory control, and scheduling. Finally it is worth mentioning a
review by Flapper and Jensen [33], which focuses on rework as a specific form of
product recovery and surveys literature on corresponding OR lot sizing and
scheduling models.
A variety of business examples illustrating the above issues can be found, e.g., in
the proceedings of the APICS [34] Remanufacturing Symposia. However, as in the
previous sections, detailed case studies are largely lacking also for the
production and operations management issues in product recovery.
In addition to these general approaches, a number of specific production and
operations management issues in the product recovery has been investigated in
more detail. In particular, disassembly planning, modified MRP- concepts, and
scheduling of remanufacturing operations appear to be areas that have seen
active research efforts. We briefly address each of these areas.
43
Disassembly:
A need for disassembly is one of the most salient aspects distinguishing many
product recovery systems from a traditional manufacturing environment. Brennan
et al. [35] contrast assembly and disassembly operations and point out that they
are not symmetrical to each other. In particular, disassembly planning has to
cope with additional dependencies among multiple items.
Many authors have addressed the optimization of the disassembly depth and
sequence. Most approaches rely on a graph representation of the product
structure. Computational challenges may arise due to large problem sizes. In this
context, Johnson and Wang [36] have presented a network flow model for
maximizing the recovery profit for a given product, balancing component values
and disassembly costs. Similarly, Penev and De Ron [37] consider optimal
‘cannibalization’ sequences realizing a number of preselected components from
a given product.
Meacham et al. [38] extend these approaches to multi- product models involving
fixed costs and common parts.
A column generation algorithm is designed to cope with large problem sizes.
Krikke et al [39] developed a stochastic approach, taking into account uncertainty
in the condition of a product and its components, which may affect the feasibility
of recovery options.
Zeid et al [40] discusses an artificial intelligence approach to implementing
disassembly optimization. Keeping track of previous disassembly results is
suggested as a means for overcoming problems due of a lack of accurate data.
44
Pnueli and Zussman [41] emphasize the link between recovery and product
design. They show how information from a disassembly analysis can be used to
eliminate weak spots in a product design in order to increase its end-of-life value.
In a some what different context, Sodhi et al [42] consider material separation in
bulk recycling processes. Rather than by discrete disassembly operations,
shredded material fractions are separated in centrifugals or special baths, based
in differences in specific weight. The authors develop a scheme for minimizing
the number of processing steps for separating a fixed number of materials from a
given mix. Finally, an application of disassembly planning to the environmentally
conscious dismantling of residential buildings appears to be worth mentioning. [43]
MRP in a product recovery environment:
The use of MRP concepts in a product recovery context is another issue that is
receiving significant attention. Traditional MRP logic faces a number of difficulties
in recovery planning. Specifically, the dependencies between the components
that are simultaneously released by disassembly and the choice between
multiple supply sources (e.g. different returned products) cannot be handled
adequately by a simple level- by- level top down approach as in traditional MRP.
Therefore, several modifications to MRP have recently been proposed. Most of
them rely on a ‘reverse’ bill of materials (BOM), documenting the recoverable
subassemblies of a product and the processing times to release them. As not all
components may be fully recoverable this ‘reverse’ BOM is not necessarily a
symmetric picture of the original BOM.
45
Falpper [44] addresses a situation where components for a final product may be
obtained from the disassembly of used products as an alternative to purchasing
new ones. Predetermined priority lists are used to deal with multiple procurement
options for a required component. Inderfurth and Jensen [33] extend this model
and analyze the issue of uncertain future availability of recoverable components
in more detail. Specifically, reactive and proactive planning approaches are
discussed. The issue of multiple supply alternatives is discussed more explicitly
by Clegg et al [45]. They propose a multi-period linear programming model for
scheduling the disassembly of multiple used products and the reassembly of new
and reusable components. Gupta and Taleb [46] consider a situation with demand
on a component rather than on a product level. They propose an MRP-algorithm
for scheduling disassembly, taking into account dependencies between different
components of the same product. Gupta and Taleb [47] extend this approach to a
multi-product situation with parts commonality.
Scheduling remanufacturing operations:
Given the high level of uncertainty as one of the main characteristics of
remanufacturing, some authors are questioning the appropriateness of a purely
deterministic concept such as MRP for this environment. A number of simulation
studies has been presented that evaluates different scheduling policies for
remanufacturing operations, including first-come-first-serve, due date oriented
approaches, and batching. [48] [49] [50]
The setting is motivated by operations in an overhaul center for military aircraft
engines. The authors conclude that the choice of the disassembly release
46
strategy does not have a significant impact on system performance.
Sophisticated batching or time-phased strategies fail, as a consequence of the
varying processing requirements for each individual product. For the queue
control at the work centers simple due date based priorities rules are proposed.
Guide et al. [51] have extended the above analysis by investigation the impact on
capacity planning. The authors propose modifications to traditional rough cut
capacity planning techniques by introducing discount factors, accounting for
uncertain reusability and repair requirements. As an alternative to MRP, Guide [52]
proposes the scheduling of remanufacturing operations according to a drum-
buffet-rope concept. Following the philosophy of synchronous manufacturing a
continuous work flow is sought by focusing control on production bottlenecks.
47
Chapter 4
Conventional supply chain
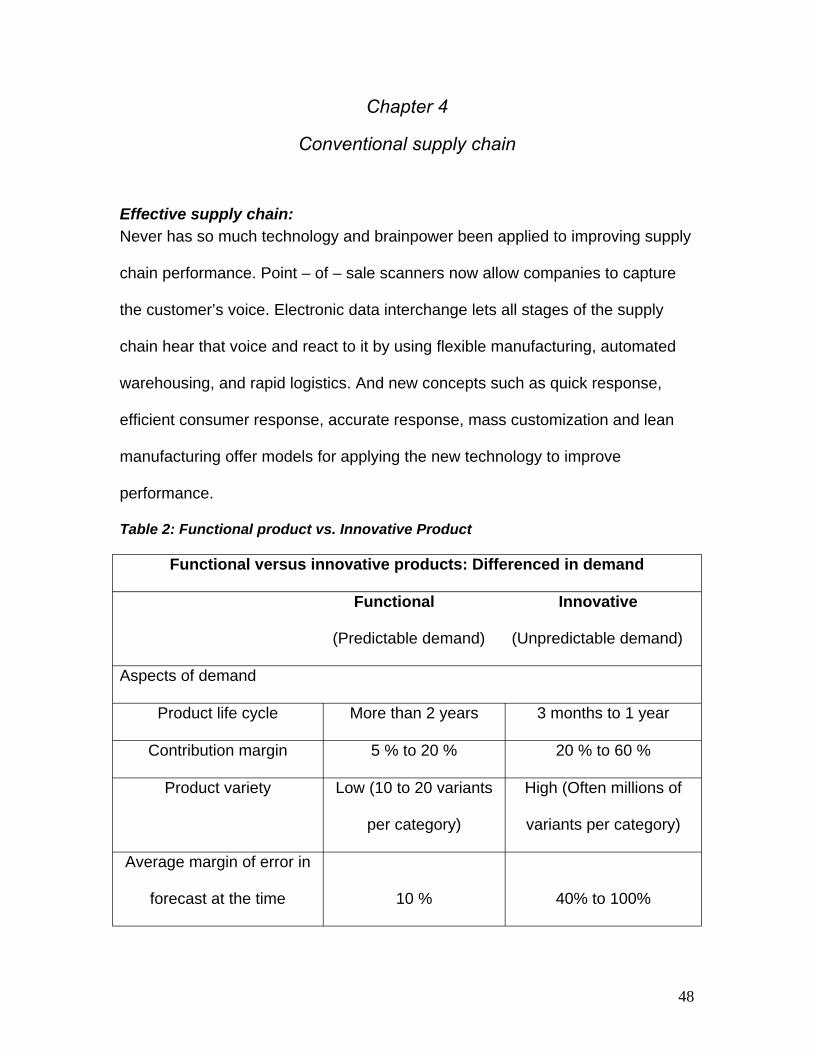
Effective supply chain: Never has so much technology and brainpower been applied to improving supply
chain performance. Point – of – sale scanners now allow companies to capture
the customer’s voice. Electronic data interchange lets all stages of the supply
chain hear that voice and react to it by using flexible manufacturing, automated
warehousing, and rapid logistics. And new concepts such as quick response,
efficient consumer response, accurate response, mass customization and lean
manufacturing offer models for applying the new technology to improve
performance.
Table 2: Functional product vs. Innovative Product
Functional versus innovative products: Differenced in demand
Functional Innovative
(Predictable demand) (Unpredictable demand)
Aspects of demand
Product life cycle More than 2 years 3 months to 1 year
Contribution margin 5 % to 20 % 20 % to 60 %
Product variety Low (10 to 20 variants
per category)
High (Often millions of
variants per category)
Average margin of error in
forecast at the time
10 %
40% to 100%
48
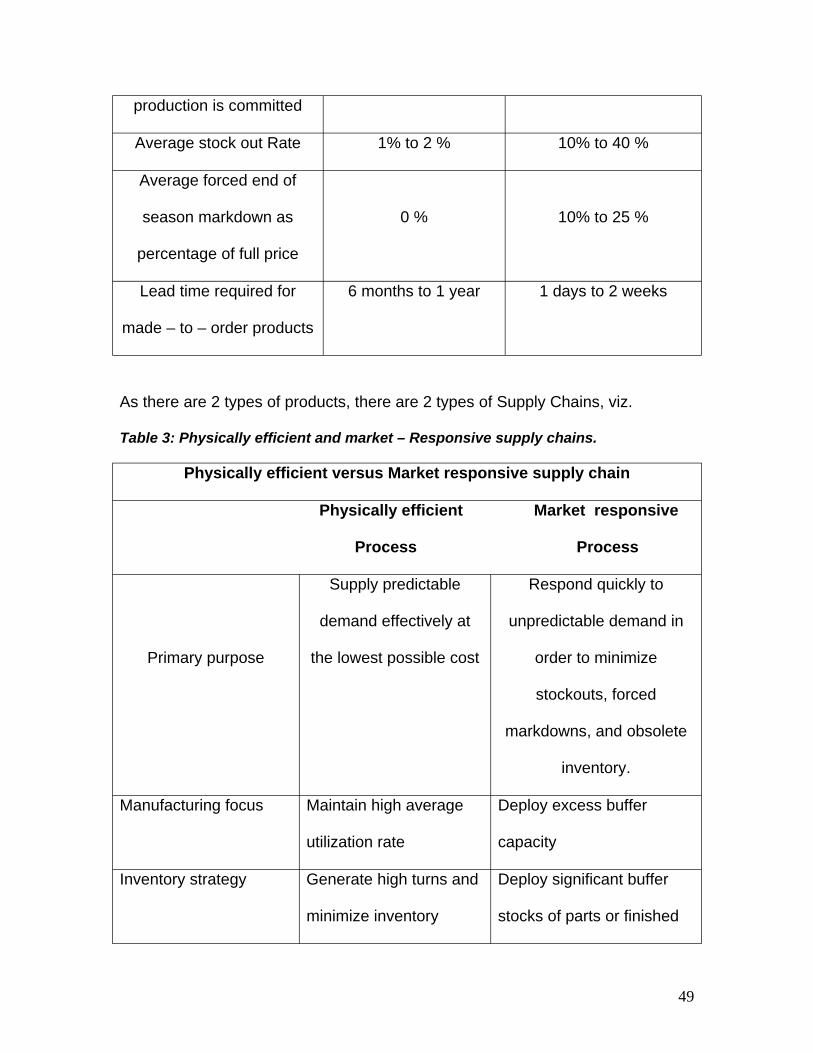
production is committed
Average stock out Rate 1% to 2 % 10% to 40 %
Average forced end of
season markdown as
percentage of full price
0 %
10% to 25 %
Lead time required for
made – to – order products
6 months to 1 year 1 days to 2 weeks
As there are 2 types of products, there are 2 types of Supply Chains, viz.
Table 3: Physically efficient and market – Responsive supply chains.
Physically efficient versus Market responsive supply chain
Physically efficient Market responsive
Process Process
Primary purpose
Supply predictable
demand effectively at
the lowest possible cost
Respond quickly to
unpredictable demand in
order to minimize
stockouts, forced
markdowns, and obsolete
inventory.
Manufacturing focus Maintain high average
utilization rate
Deploy excess buffer
capacity
Inventory strategy Generate high turns and
minimize inventory
Deploy significant buffer
stocks of parts or finished
49
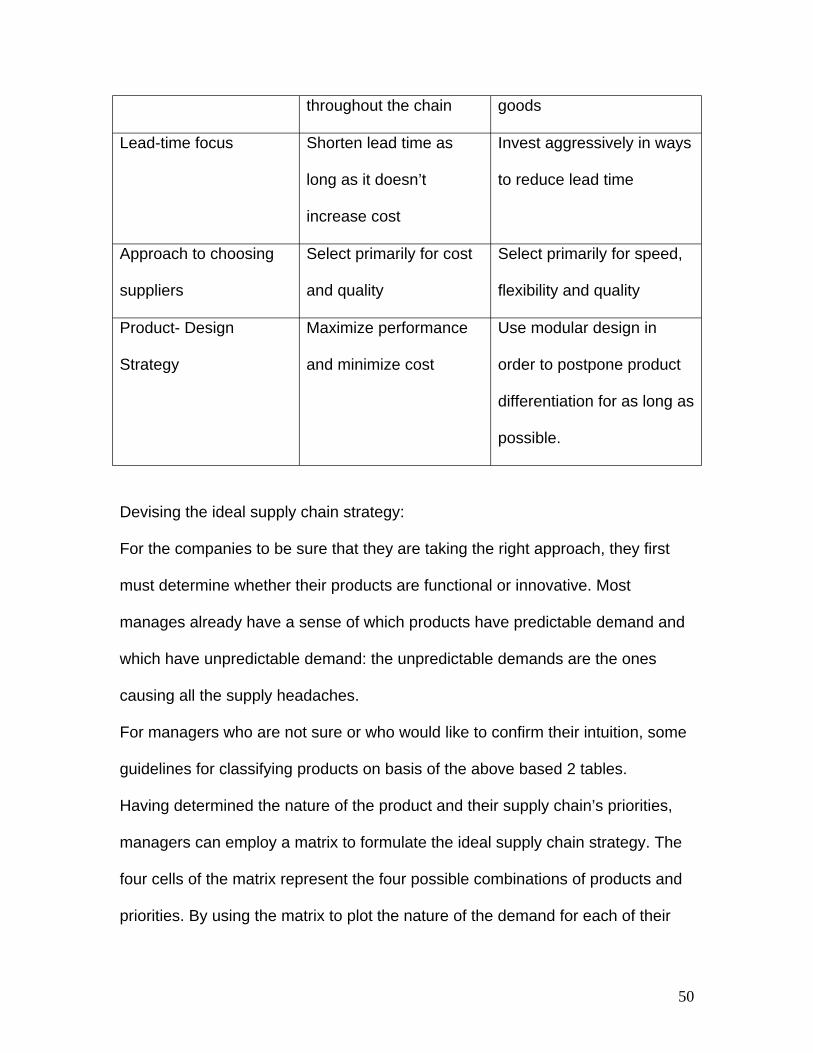
throughout the chain goods
Lead-time focus Shorten lead time as
long as it doesn’t
increase cost
Invest aggressively in ways
to reduce lead time
Approach to choosing
suppliers
Select primarily for cost
and quality
Select primarily for speed,
flexibility and quality
Product- Design
Strategy
Maximize performance
and minimize cost
Use modular design in
order to postpone product
differentiation for as long as
possible.
Devising the ideal supply chain strategy:
For the companies to be sure that they are taking the right approach, they first
must determine whether their products are functional or innovative. Most
manages already have a sense of which products have predictable demand and
which have unpredictable demand: the unpredictable demands are the ones
causing all the supply headaches.
For managers who are not sure or who would like to confirm their intuition, some
guidelines for classifying products on basis of the above based 2 tables.
Having determined the nature of the product and their supply chain’s priorities,
managers can employ a matrix to formulate the ideal supply chain strategy. The
four cells of the matrix represent the four possible combinations of products and
priorities. By using the matrix to plot the nature of the demand for each of their
50
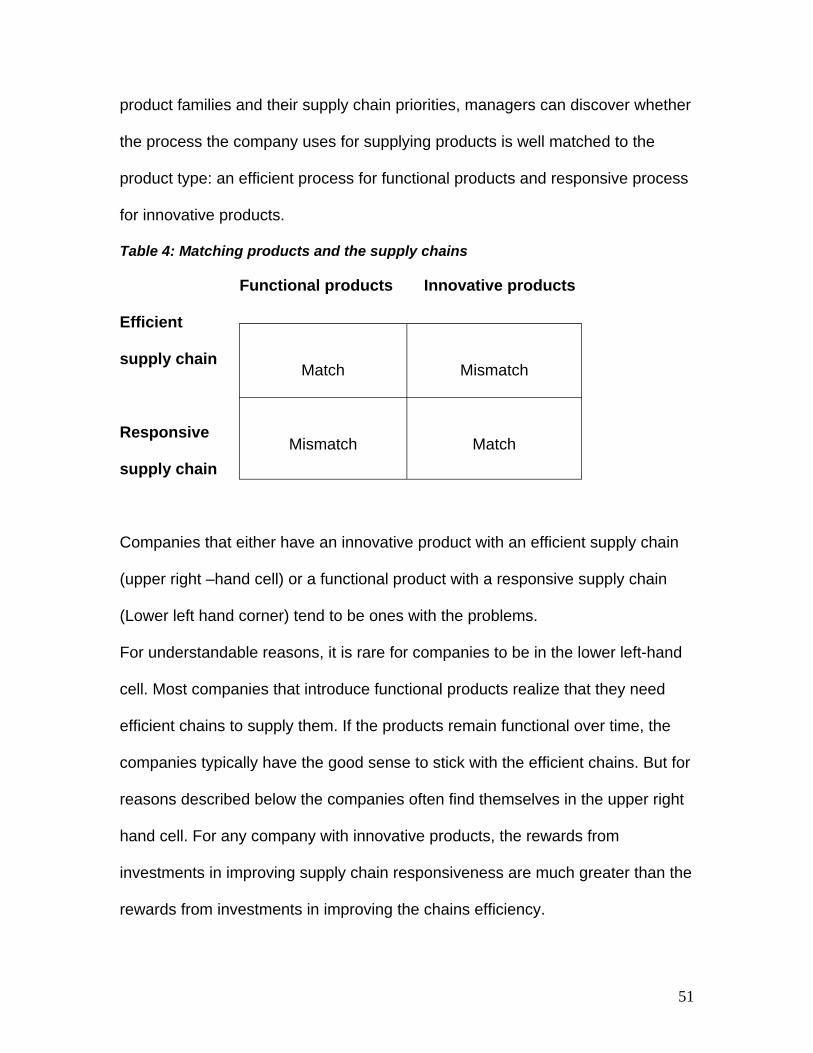
product families and their supply chain priorities, managers can discover whether
the process the company uses for supplying products is well matched to the
product type: an efficient process for functional products and responsive process
for innovative products.
Table 4: Matching products and the supply chains
Match
Mismatch
Mismatch
Match
Functional products Innovative products
Efficient
supply chain
Responsive
supply chain
Companies that either have an innovative product with an efficient supply chain
(upper right –hand cell) or a functional product with a responsive supply chain
(Lower left hand corner) tend to be ones with the problems.
For understandable reasons, it is rare for companies to be in the lower left-hand
cell. Most companies that introduce functional products realize that they need
efficient chains to supply them. If the products remain functional over time, the
companies typically have the good sense to stick with the efficient chains. But for
reasons described below the companies often find themselves in the upper right
hand cell. For any company with innovative products, the rewards from
investments in improving supply chain responsiveness are much greater than the
rewards from investments in improving the chains efficiency.
51
Power of virtual integration:
How do you create a $12 Billion Company in 13 years?
Michael Dell began in 1984 with a simple business insight: he could bypass the
dealer channel through which personal computers were then being sold. Instead,
he would well directly to customers and build products to order. In one swoop,
Dell eliminated the reseller’s markup and the costs and risks associated with
carrying large inventories of finished goods. The formula became known as the
direct business model, and it gave Dell computer corporation a substantial cost
advantage.
The direct model turned out to have another benefits like strong customer
relationship which creates valuable information and helps to leverage
relationships with both suppliers and customers.
Virtual integration as the name suggests means to basically stitch together a
business with partners that are treated as if they are inside the company.
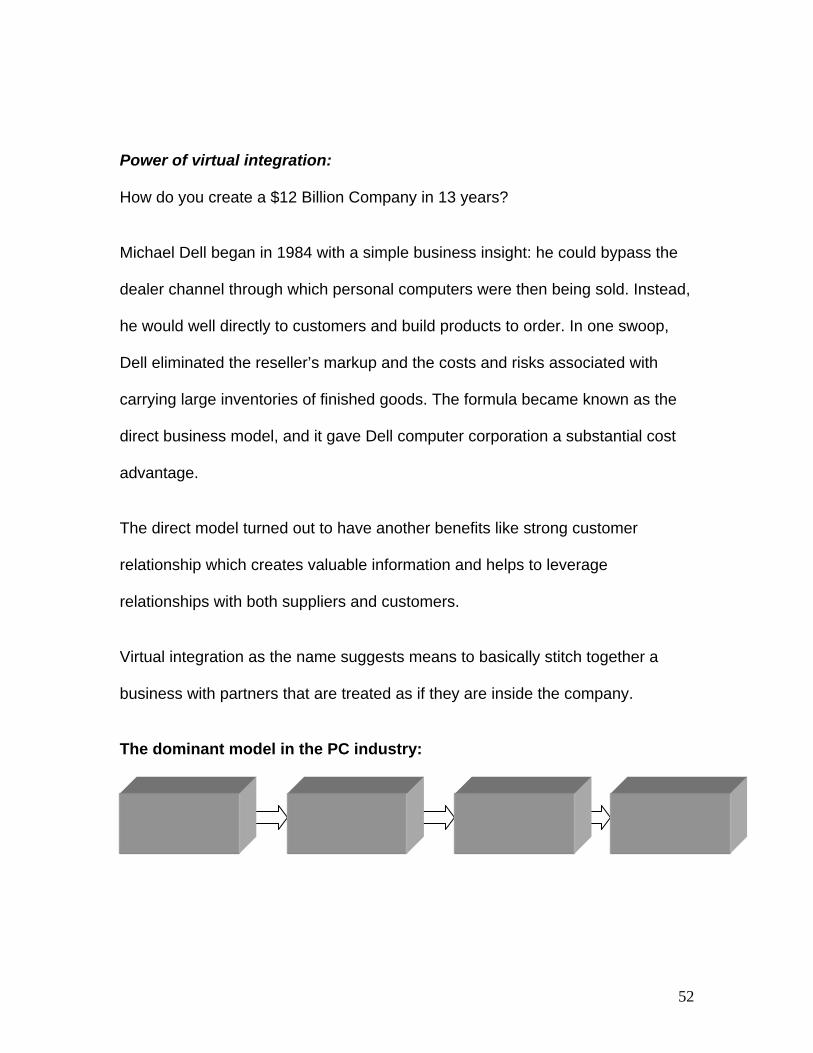
The dominant model in the PC industry:
Manufacturer
Distribution Channels
Customers Sup
pliers
52
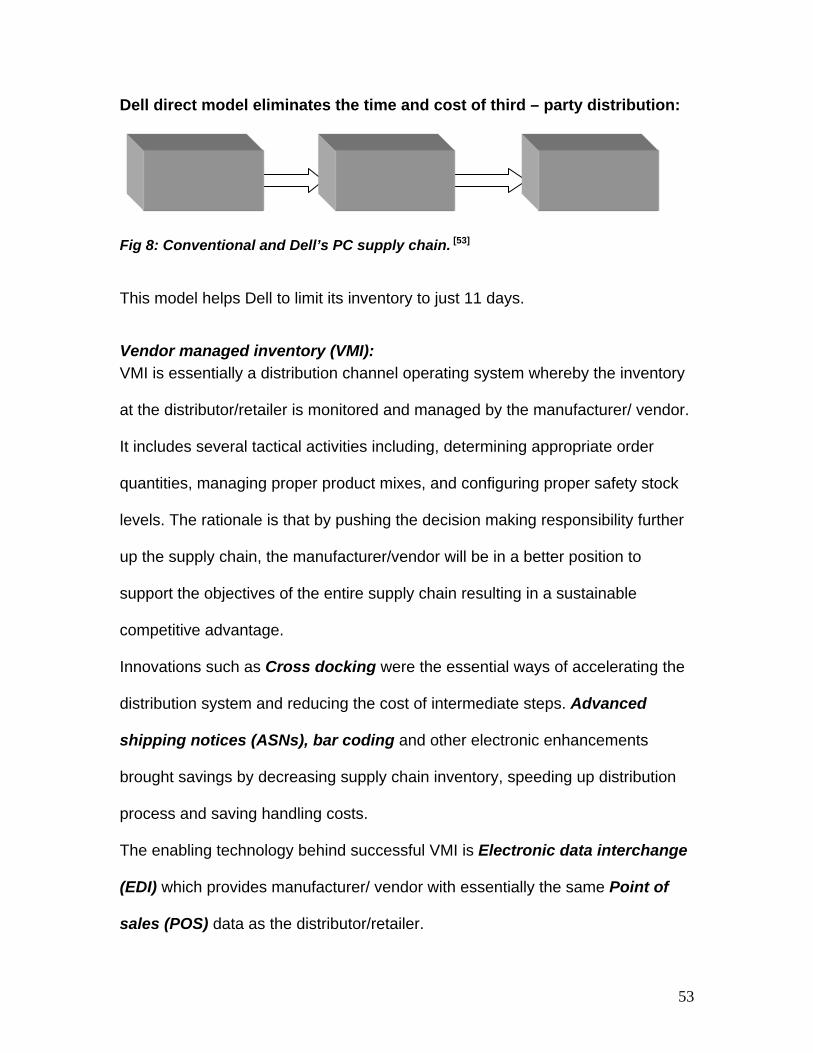
Dell direct model eliminates the time and cost of third – party distribution:
Fig 8: Conventional and Dell’s PC supp
This model helps Dell to limit its inven
Vendor managed inventory (VMI): VMI is essentially a distribution chann
at the distributor/retailer is monitored a
It includes several tactical activities inc
quantities, managing proper product m
levels. The rationale is that by pushing
up the supply chain, the manufacturer
support the objectives of the entire sup
competitive advantage.
Innovations such as Cross docking w
distribution system and reducing the c
shipping notices (ASNs), bar coding
brought savings by decreasing supply
process and saving handling costs.
The enabling technology behind succe
(EDI) which provides manufacturer/ ve
sales (POS) data as the distributor/ret
Suppliers Manu Cus
facturer
ly chain. [53]
tory to just 11 days.
el operating system whereby
nd managed by the manufac
luding, determining appropri
ixes, and configuring proper
the decision making respon
/vendor will be in a better pos
ply chain resulting in a susta
ere the essential ways of acc
ost of intermediate steps. Ad
and other electronic enhanc
chain inventory, speeding up
ssful VMI is Electronic data
ndor with essentially the sam
ailer.
tomers
the inventory
turer/ vendor.
ate order
safety stock
sibility further
ition to
inable
elerating the
vanced
ements
distribution
interchange
e Point of
53
Chapter 5
Conclusion
Reverse logistics has become an important segment in the world economy.
Increasingly, customers are demanding resolution for products that are
considered to be defective. They are returning items more frequently as
companies are driven to loosen return policies due to competition. Many of these
companies having items returned to them will not be able to afford the resources
necessary to effectively handle the processes required for appropriately handling
increasing volumes of returned goods. The need for third-party companies
providing partial or full reverse logistics services for companies receiving
returned goods will increase as policies affecting returned products continues to
favor the customer. Unfortunately, many third-party companies desiring to enter
the reverse logistics service market are not prepared to effectively address these
service needs due to the lack of knowledge of reverse logistics. They are either
not capable or unsure of the process of entering the reverse logistics market. It
can be seen that there is a lot of scope for improving and standardizing reverse
logistics models like the ones being used in conventional supply chain. It is time
to look ahead and to consider open issues that are described below.
From the model solved in excel we get the following results which show the
shortest route to service every customer using the same vehicle. Instead of using
only the ‘once’ servicing constraint we can also use the load carrying capacity as
a constraint as described in the model. But the loads to be picked up being hard
54
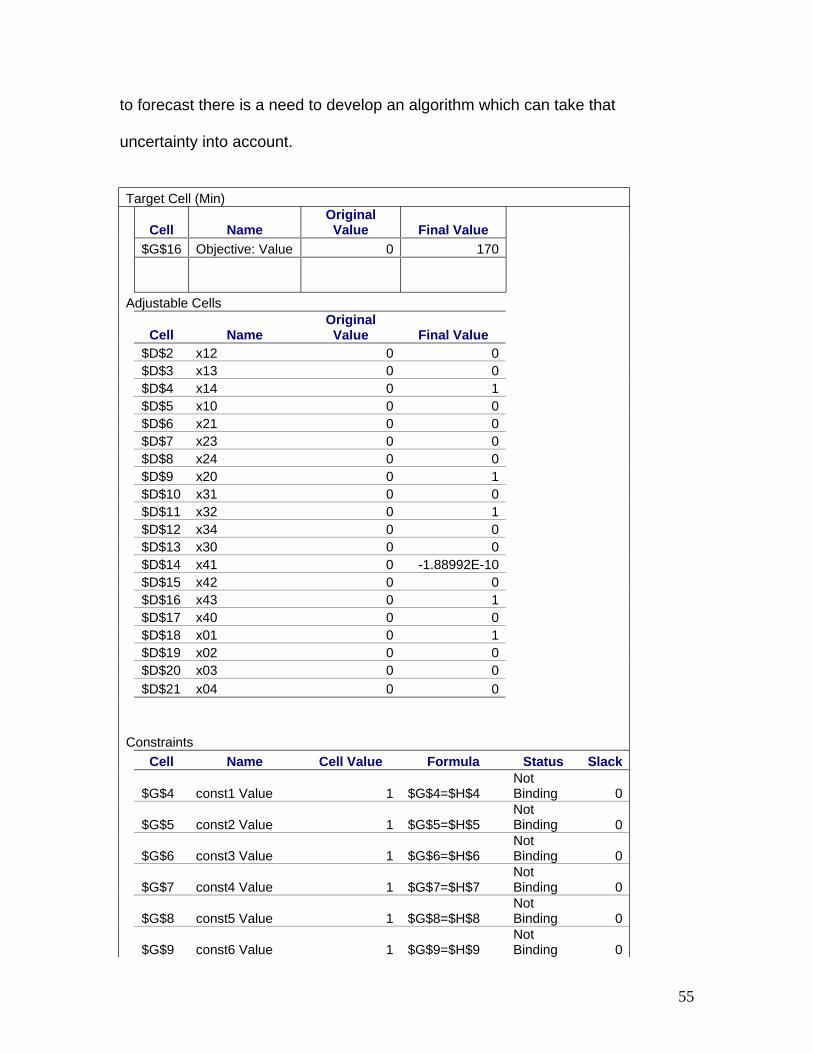
to forecast there is a need to develop an algorithm which can take that
uncertainty into account.
Target Cell (Min)
Cell Name Original Value Final Value
$G$16 Objective: Value 0 170 Adjustable Cells
Cell Name Original Value Final Value
$D$2 x12 0 0 $D$3 x13 0 0 $D$4 x14 0 1 $D$5 x10 0 0 $D$6 x21 0 0 $D$7 x23 0 0 $D$8 x24 0 0 $D$9 x20 0 1 $D$10 x31 0 0 $D$11 x32 0 1 $D$12 x34 0 0 $D$13 x30 0 0 $D$14 x41 0 -1.88992E-10 $D$15 x42 0 0 $D$16 x43 0 1 $D$17 x40 0 0 $D$18 x01 0 1 $D$19 x02 0 0 $D$20 x03 0 0 $D$21 x04 0 0 Constraints Cell Name Cell Value Formula Status Slack
$G$4 const1 Value 1 $G$4=$H$4 Not Binding 0
$G$5 const2 Value 1 $G$5=$H$5 Not Binding 0
$G$6 const3 Value 1 $G$6=$H$6 Not Binding 0
$G$7 const4 Value 1 $G$7=$H$7 Not Binding 0
$G$8 const5 Value 1 $G$8=$H$8 Not Binding 0
$G$9 const6 Value 1 $G$9=$H$9 Not Binding 0
55
$G$10 const7 Value 1 $G$10=$H$10 Not Binding 0
$G$11 const8 Value 1 $G$11=$H$11 Not Binding 0
$G$12 const9 Value 1 $G$12=$H$12 Not Binding 0
$G$13 const10 Value 1 $G$13=$H$13 Not Binding 0
$G$14 const21 Value 1 $G$14=$H$14 Not Binding 0
$G$15 const22 Value 0 $G$15=$H$15 Not Binding 0
$K$4 const11 Value 0 $K$4<=$L$4 Not Binding 1
$K$5 const12 Value 0 $K$5<=$L$5 Not Binding 1
$K$6 const13 Value 1 $K$6<=$L$6 Binding 0 $K$7 const14 Value 1 $K$7<=$L$7 Binding 0 $K$8 const15 Value 1 $K$8<=$L$8 Binding 0
$K$9 const16 Value 0 $K$9<=$L$9 Not Binding 1
$K$10 const17 Value 1 $K$10<=$L$10 Binding 0 $K$11 const18 Value 1 $K$11<=$L$11 Binding 0
$K$12 const19 Value 0 $K$12<=$L$12Not Binding 1
$K$13 const20 Value 0 $K$13<=$L$13Not Binding 1
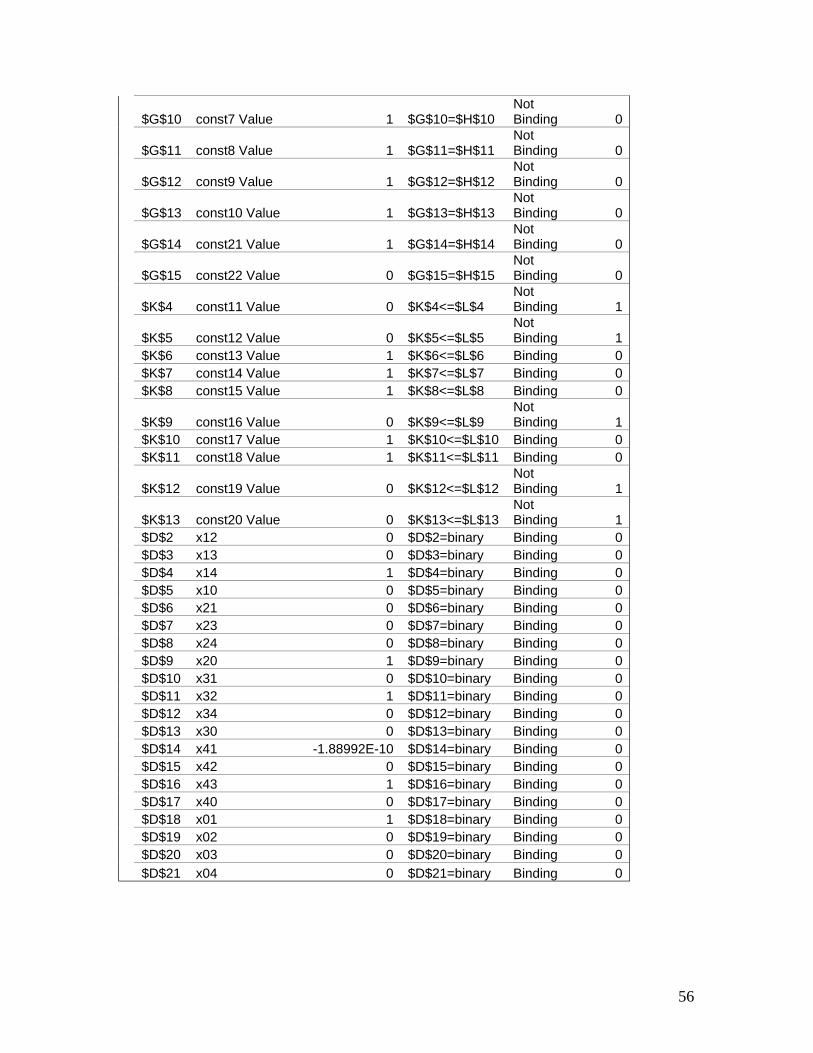
$D$2 x12 0 $D$2=binary Binding 0 $D$3 x13 0 $D$3=binary Binding 0 $D$4 x14 1 $D$4=binary Binding 0 $D$5 x10 0 $D$5=binary Binding 0 $D$6 x21 0 $D$6=binary Binding 0 $D$7 x23 0 $D$7=binary Binding 0 $D$8 x24 0 $D$8=binary Binding 0 $D$9 x20 1 $D$9=binary Binding 0 $D$10 x31 0 $D$10=binary Binding 0 $D$11 x32 1 $D$11=binary Binding 0 $D$12 x34 0 $D$12=binary Binding 0 $D$13 x30 0 $D$13=binary Binding 0 $D$14 x41 -1.88992E-10 $D$14=binary Binding 0 $D$15 x42 0 $D$15=binary Binding 0 $D$16 x43 1 $D$16=binary Binding 0 $D$17 x40 0 $D$17=binary Binding 0 $D$18 x01 1 $D$18=binary Binding 0 $D$19 x02 0 $D$19=binary Binding 0 $D$20 x03 0 $D$20=binary Binding 0 $D$21 x04 0 $D$21=binary Binding 0
56
Also it is easier to solve problems with smaller nodes in Excel, but for larger
nodes advanced mathematical languages have to be used and run on high
powered computers.
• Active return management: This is the most challenging issue concern. It
might be expected that companies look for ways to increase control over inbound
goods flows as secondary resources gain further importance. Another reason for
this development is the altering view on a company’s product. Analyzing the
impact of modern information technology in this context appears to be
worthwhile.
• Return forecasting: This is one of the most complex issues. The relevant
parameters are not directly observable but need to be estimated. A lot of
research needs to be done in this area as developing quantitative models.
• Dispositioning: This is one of the largely neglected concerns. Most reverse
logistics models focus on a single product recovery option. However, many
companies deal with several recovery alternatives, such as product, components,
and material reuse. Extracting an expensive component which can serve as a
spare part may yield larger savings than remanufacturing a complete machine.
• Quantitative reverse logistics models: In traditional ‘forward’ logistics,
quantitative models have proved a powerful tool for supporting these types of
decisions and, more generally, for understanding the underlying systems. For
many decision problems standard operations research models such as facility
location models, routing and scheduling models, or stochastic inventory models
have been developed that are widely recognized. Given the short history of the
57

field, a similar set of standard models in a reverse logistics context has not yet
been established.
58
List of references
[1] D.W.Dennis, W. Krumwiede, and C. Sheu, "A model for reverse logistics entry by third-party providers," Omega, vol. 30, pp. 325 – 333.
[2] "The United States Council of logistics management Logistics - Definition.," System, vol. 45.
[3] S. Dowlatshahi and, "Developing a theory of reverse logistics," Interfaces, vol. 30, pp. 143-155, 2000.
[4] H.Meyer, "Many happy returns," Journal of Business Strategy, vol. 20, pp. 27-31, 1999.
[5] R. R. Lummus, D. W. Krumwiede, and R. J. Vokurka, "The relationship of logistics to supply chain management - developing a common industry definition"," Industrial Management and Data Systems, vol. 101, pp. 426-431, 2001.
[6] T. Andel, "Reverse logistics - a second chance to profit," Transportation and Distribution, vol. 38, pp. 61-63, 1997.
[7] M. Klausner and C. T. Hendrickson, "Reverse-logistics strategy for product take-back," Interfaces, vol. 30, pp. 156-165, 2000.
[8] K. Cottrill, "Return to sender," Traffic World, vol. 262, pp. 17-18, 2000. [9] "VROM," Dutch ministry of housing, spatial planning and the environment.,
2000. [10] M. Fleischmann, "Quantitative Models for Reverse Logistics," Lecture notes in
Economics and Mathematical Systems, vol. 1- 4, 2000. [11] V. D. R. G. JR, R. Srivastava, Jayaraman, and W. C. Benton, "Supply Chain
Management for remanufacturable manufacturing systems," vol. 98/ 101/ OM, 1998.
[12] C. R. Carter and L. M. Ellram, "Reverse Logistics: A review of the literature and framework for future investigation." International journal of Business Logistics, vol. 19 (1), pp. 85-102, 1998.
[13] R. S. T.-. Lembke, "The impact of Reverse Logistics on the total ownership cost." Journal of Marketing: Theory and Practice, pp. 51 - 60, 1999.
[14] W. V. Rosenau, D. Twede, M. A. Mazzeo, and S. P. Singh, "Returnable /reusable logistical packaging. A capital budgeting investment decision framework," International journal of Business Logistics, vol. 17(2), pp. 139 -165, 1996.
[15] T. G. Craininc and G. Laporte, "Planning models for freight transportation," European Journal of operations Research, vol. 97, pp. 409-438, 1997.
[16] A. I. Barros, R. Dekker, and V. Scholten, "A two- level network for recycling sand: A case study." Eurpoean Journal of Operations Research, vol. 110, pp. 199-214, 1998.
[17] M. C. Thierry, "An analysis of the impact of Product Recovery Management on Manufacturing companies," PHD Thesis, Erasmus University Rotterdam, The Netherlands. 1997.
[18] T. Berger and B. Debaillie, “Location of disassembly centers for re-use to extend an existing distribution network." Master's Thesis, 1997.
59
[19] P. M. Romijn, "Return flows of electrical and electronic equipment in the Netherlands," Masterメ s thesis, 1999.
[20] S. Jagdev, "The impact of Reverse Logistics on vehicle routing algorithms," Presentation at INFORMS Conference, Cincinnati, 1999.
[21] H. A. Eiselt, M. Gendreau, and G. Laporte, "Arc routing problems," Operations Research, vol. 43, pp. 399-414, 1995.
[22] P. Toth and D. Vigo, "A heuristic algorithm for symmetric and asymmetric vehicle routing problems." European journal of Operations Research, vol. 113, pp. 528 – 543, 1999.
[23] P. Beuellens, D. V. Oudheusden, and D. Cattrysse, "Bidestination waste collection: Impact of vehicle type and operations on transport costs." Proccedings of Second International Eorking seminar on Reuse, pp. 5-14, 1999.
[24] P. Beuellens, L. N. V. Wassenhove, D. V. Oudheusden, and D. Cattrysse, "An analysis of the combined routing of the collection of used products and the distribution of new products," Reverse Logistics, 1999.
[25] L. Kroon and G. V. (1995), "Returnable containers: An example of reverse Logistics." International journal of physical distribution and Logistics Management, vol. 25 (2), pp. 56 - 68, 1995.
[26] P. M. Ginter and J. M. Starling, "Reverse Distribution channels for recycling," California Management Review, vol. 20 (3), pp. 73 - 82, 1978.
[27] T. L. Pohlen and M. F. II, "Reverse Logistics in plastic recovery," International Journal of Physical Distribution and Logistics Management, vol. 22(7), pp. 35 – 47, 1992.
[28] D. A. Fuller and J. Allen, "A topology of reverse channel systems for post- consumer recyclables." Environment marketing: Strategies, Practice, Theory and Research, pp. 241 - 266, 1995.
[29] R. Lund, "Remanufacturing," Technology Review, vol. 87(2), pp. 19 - 29, 1984. [30] V. G. Jr, " Production planning and control for remanufacturing: Industry practice
and research needs." Journal of Operations Management, vol. 18, pp. 467-483, 2000.
[31] N. Nasr, C. Hughson, E. Varel, and R. Bauer, "State of the art assessment of remanufacturing technology.," Draft document, Rochester Institute of Technology., 1998.
[32] A. Gungor and S. M. Gupta, "Issues in environmentally conscious manufacturing and product recovery: A survey." Computers and Industrial Engineering, vol. 36, pp. 811-853, 1999.
[33] S. P. D. Flapper and T. Jensen, "Logistics Planning and Control of rework." Research report, University of Elindhoven, The Netherlands, 1998.
[34] APICS, "Remanufacturing seminar 1997/8 combined year proceedings." 1998. [35] L. Brennan, S. M. Gupta, and K. N. Taleb, "Operations planning issues in an
assembly/ disassembly environment." International journal of Operations and Production management, vol. 14 (9), pp. 57 - 67, 1994.
[36] M. R. Johnson and M. H. Wang, "Planning product disassembly for material recovery opportunities," International Journal of Production research, vol. 33(11), pp. 3119-3142, 1995.
60
[37] K. D. Penev and A. J. D. Ron, “Determination of a Disassembly strategy," International Journal of Production Research, vol. 34(2), pp. 495-506, 1996.
[38] A. Meacham, R. Uzsoy, and U. Venkattadri, "Optimal Disassembly configurations for single and multiple products," Journal of manufacturing systems, vol. 18(5), pp. 311-322, 1990.
[39] H. R. Krikke, “Recovery strategies and Reverse Logistics Network Design.," 1998.
[40] I. Zeid, S. M. Gupta, and T. Bardasz, "A case- based reasoning approach to planning for disassembly." International Jornal of Intelligent Manufacturing., 1999.
[41] Y. Pnueli and E. Zussman, "Evaluating the end of life value of a product and improving it by redesign," International Journal of Production Research, pp. 921-942, 1997.
[42] M. S. Sodhi, J. Young, and W. A. Knight, "Modeling material separation processes in bulk recycling." International Journal of Production Research., 1998.
[43] T. Spengler and O. Rentz, "Planning models for the dismantling and recycling of complex mixed products," European Jornal of Operations Research, vol. 97, pp. 308-326, 1996.
[44] S. D. P. Flapper, "Matching material requirements and availabilities in the context of recycling: An MRP-I based Heuristic." In Proceedings of the eighth International Working Seminar on Production Economics, pp. 511- 519, 1994.
[45] A. Clegg, D. Williams, and R. Usozy, "Production Planning for companies with remanufacturing capabilities.," In proceedings of the IEEE symposium on Electronics and the Environment, pp. 186-191, 1995.
[46] S. M. Gupta and K. N. Taleb, "Scheduling disassembly," International Journal of Production Research, vol. 32 (8), pp. 1857-1866, 1994.
[47] K. Taleb, S. Gupta, and, "Disassembly of multiple product structures." Computers and Industrial Engineering, vol. 32 (4), pp. 949 - 961, 1997.
[48] V. D. R. G. Jr, R. Srivastava, M. E. Kraus, and, "Product structure complexity and scheduling of operations in recoverable manufacturing." International Journal of production research, vol. 35 (11), pp. 3179 – 3199, 1997.
[49] J. V D R Guide and R. Srivastava, "An evaluation of order release strategies in a remanufacturing environment," Computers and Operations Research, vol. 24(1), pp. 37 – 48, 1997.
[50] J. V D R Guide and R. Srivastava, "The effect of lead time variability on the performance of disassembly release mechanisms." Computers and Industrial Engineering, vol. 36, pp. 759 - 779, 1999.
[51] V. D. R. Guide, R. Srivastava, and M. S. Spencer, "An Evaluation of capacity planning techniques in a remanufacturing environment." International journal of Production Research, vol. 35(1), pp. 67 - 82, 1997.
[52] V. D. R. G. Jr, “Scheduling using drum-buffer-rope in a remanufacturing environment." International journal of Production Research, vol.34 (4), pp. 1081 – 1091, 1996.
[53] M. Fry, "Supply Chain Management and Analysis," 2002.
61

62