university of california santa barbara decision support ... · university of california santa...
TRANSCRIPT

UNIVERSITY OF CALIFORNIA
Santa Barbara
Decision Support for Coral Reef Fisheries Management: Community Input as a Means of Informing Policy in American Samoa
Project Plan for American Samoa’s Department of Marine and Wildlife Resources
A Group Project submitted in partial satisfaction of the requirements for the degree of Master’s in Environmental Science and Management
for the Donald Bren School of Environmental Science & Management
By
Stacey Kilarski Daniel Klaus
Jennifer Lipscomb Kimbrely Matsoukas
Robert Newton Abigail Nugent
Committee in Charge:
Dr. Christopher Costello
April 24, 2006


Decision Support for Coral Reef Fisheries Management: Community Input as a Means of Informing Policy in American Samoa
As authors of this Group Project report, we are proud to archive it on the Bren School’s web site such that the results of our research are available for all to read. Our signatures on the document signify our joint responsibility to fulfill the archiving standards set by the Donald Bren School of Environmental Science & Management. Stacey Kilarski Daniel Klaus Jennifer Lipscomb Kimbrely Matsoukas Robert Newton Abigail Nugent The mission of the Donald Bren School of Environmental Science & Management is to produce professionals with unrivaled training in environmental science and management who will devote their unique skills to the diagnosis, assessment, mitigation, prevention, and remedy of the environmental problems of today and the future. A guiding principal of the School is that the analysis of environmental problems requires quantitative training in more than one discipline and an awareness of the physical, biological, social, political, and economic consequences that arise from scientific or technological decisions. The Group Project is required of all students in the Master’s of Environmental Science and Management (MESM) Program. It is a four-quarter activity in which small groups of students conduct focused, interdisciplinary research on the scientific, management, and policy dimensions of a specific environmental issue. This Final Group Project Report is authored by MESM students and has been reviewed and approved by:
Dr. Chris Costello Dr. Ernst Ulrich von Weizsäcker April 24, 2006


iii
Acknowledgements
We would like to thank the American Samoa Coral Reef Advisory Group for their generosity and assistance in the development of our research, and extend gratitude to the following individuals for their considerable involvement with the project:
Lelei Peau,CRAG Chair, Deputy Director DOC Christianera Tuitele, Education and Outreach Coordinator Virginia Farmer, NOAA Coral Management Fellow Troy Curry, GIS Specialist
We also thank our partners with the American Samoa Department of Marine and Wildlife Resources for their assistance and support with our study:
Mr. Ufagafa Ray Tulafono, Director Dr. Karl Brookins, Chief Fishery Biologist Selaina Vaitautolu, CBFMP Manager Afa, Pora, Tasha, Champ, CBFMP Assistants Leslie Whaylen, Coral Reef Monitoring Coordinator Risa Oram, MPA Coordinator Douglas Fenner, Chief Coral Biologist
We are grateful to the following individuals for providing information vital to our research:
Nancy Daschbach, Fagatele Bay National Marine Sanctuary Manager Allamanda Amituanai, Education Specialist/Advisory Council Coordinator Fagatele Bay National Marine Sanctuary Gerry Davis, Assistant Regional Administrator for Habitat Conservation, NOAA Fisheries Fatima Sauafea, PIRO Coral Reef Ecologist, NOAA Fisheries Dr. Peter Craig, National Park Ecologist
Lastly, we would like to thank our advisors for their extensive guidance and contributions throughout the project:
Oran Young, Professor of International Governance and Co-Director of Bren Program on Governance for Sustainable Development, Bren School of Environmental Science & Management Gail Osherenko, Research Faculty, Bren School of Environmental Science & Management Robert Warner, Marine Ecology Professor, Ecology, Evolution & Marine Biology Bruce Kendall, Associate Professor of Applied Ecology, Bren School of Environmental Science & Management Satie Airame, PISCO Policy Coordinator And a special thanks to our faculty advisor, Chris Costello, Associate Professor of Resource Economics and Renewable Resources, Bren School of Environmental Science & Management.

iv

v
Table of Contents
ACKNOWLEDGEMENTS................................................................................................................III TABLE OF CONTENTS......................................................................................................................V LIST OF FIGURES AND TABLES ................................................................................................ VII ABSTRACT ......................................................................................................................................... IX EXECUTIVE SUMMARY...................................................................................................................X INTRODUCTION................................................................................................................................. 1
OBJECTIVES......................................................................................................................................... 1 BACKGROUND ..................................................................................................................................... 3
Location ......................................................................................................................................... 3 Culture ........................................................................................................................................... 4 Political Structure.......................................................................................................................... 5 Economy ........................................................................................................................................ 5
CORAL REEF ECOSYSTEM ................................................................................................................... 5 Extent ............................................................................................................................................. 5 Habitat ........................................................................................................................................... 6 Fish Assemblage ............................................................................................................................ 6
STATE OF THE FISHERY ....................................................................................................................... 7 Historical Importance of Fishing Near Shore ............................................................................... 7 Declines in the Fishery .................................................................................................................. 7 Current Management Regime........................................................................................................ 8 Coral Reef Advisory Group ........................................................................................................... 9
METHODS .......................................................................................................................................... 10 APPROACH ........................................................................................................................................ 10 SAMPLING DESIGN ............................................................................................................................ 10 SURVEY DESIGN................................................................................................................................ 12
Language ..................................................................................................................................... 13 Survey Methodology .................................................................................................................... 13 Comparison to Census Data ........................................................................................................ 14 Survey Limitations ....................................................................................................................... 16
DATA ANALYSIS AND DEFINITION OF TERMS.................................................................................... 17 COMMUNITY USE, OPINIONS, AND PREFERENCES OF FISHERY RESOURCES ........... 24
COMMUNITY OPINIONS ABOUT FISHERY RESOURCE USE.................................................................. 24 FISH PREFERENCE ............................................................................................................................. 25 USE OF THE FISHERY ......................................................................................................................... 27 TRENDS IN FISHERY USE ................................................................................................................... 31 DISCUSSION....................................................................................................................................... 33
POLICY THEMES ............................................................................................................................. 34 REGULATION..................................................................................................................................... 34
Significance.................................................................................................................................. 34 Policy Theme Analysis ................................................................................................................. 35 Further Analysis .......................................................................................................................... 41 Discussion.................................................................................................................................... 51
EDUCATION....................................................................................................................................... 60

vi
Justification.................................................................................................................................. 60 User Group Summary Statistics ................................................................................................... 63 Regression Analysis ..................................................................................................................... 68 Discussion.................................................................................................................................... 70 Limitations ................................................................................................................................... 72
GEOGRAPHIC MANAGEMENT............................................................................................................. 73 Justification.................................................................................................................................. 73 Current Data................................................................................................................................ 76 Analysis........................................................................................................................................ 91
CONCLUSIONS.................................................................................................................................. 96 USE OF THE RESULTS......................................................................................................................... 98
APPENDICES ................................................................................................................................... 100 APPENDIX A: SUMMARY FISHING REGULATIONS ............................................................................ 100 APPENDIX B: MAP OF MPA LOCATIONS ......................................................................................... 102 APPENDIX C: FEDERAL MPA CHARACTERISTICS ............................................................................ 103 APPENDIX D: TERRITORIAL MPA CHARACTERISTICS ..................................................................... 104 APPENDIX E: COMMUNITY MPA CHARACTERISTICS....................................................................... 105 APPENDIX F: SAMPLE SURVEY ........................................................................................................ 106 APPENDIX G: FISHING FREQUENCY REGRESSION ............................................................................ 110 APPENDIX H: REGULATION REGRESSIONS....................................................................................... 114 APPENDIX I: EDUCATION REGRESSION............................................................................................ 126
LITERATURE CITED..................................................................................................................... 128

vii
List of Figures and Tables
Figure 1: The Islands of American Samoa_____________________________________________ 3 Table 1: Island Characteristics ______________________________________________________ 3 Table 2: American Samoa Coral Reef Advisory Group (CRAG) members __________________ 9 Table 3: Categorization of counties _________________________________________________ 11 Figure 2: Distribution of villages surveyed throughout Tutuila Island and Manu’a. _________ 12 Table 4: Demographic statistics of survey compared to 2000 Census. _____________________ 15 Figure 3: Age distribution of survey compared to 2000 Census. __________________________ 15 Table 5: Number of Respondents in Specified Income Range* ___________________________ 16 Table 6: Importance of Fish Use ____________________________________________________ 25 Figure 4: Fish Type Preference ____________________________________________________ 26 Figure 5: Invertebrate Type Preference______________________________________________ 26 Figure 6: Top 10 most Important Fish and Invertebrates for Subsistence Fishing ___________ 27 Figure 7: Frequency of Subsistence Fishing __________________________________________ 28 Figure 8: Frequency of Recreational Fishing for_______________________________________ 28 Figure 9: Frequency of Using Fish for Cultural Purposes _______________________________ 29 Figure 10: Frequency of Buying Fish ________________________________________________ 30 Figure 11: Frequency of Selling Fish ________________________________________________ 30 Table 7: Final Model for Subsistence Fishing Frequency________________________________ 32 Table 8: Final Model for Recreational Fishing Frequency_______________________________ 33 Figure 12: Perceived Strictness of Regulation _________________________________________ 35 Figure 13: Perceived Strictness of Enforcement._______________________________________ 36 Figure 14: Level of Agreement with Regulation Type __________________________________ 37 Figure 15: Mean Agreement with Regulation Type among Total Respondents______________ 38 Figure 16: Mean Agreement Level with Regulations Among Age Groups* _________________ 39 Figure 17: Mean Agreement Level with Regulations among Groups of Different Citizenship*_ 39 Figure 18: Mean Agreement Level with Regulations among Fishing User Groups* __________ 40 Figure 19: Mean Level of Agreement with Regulations among Respondents with Different Village Curfew Systems* __________________________________________________________ 41 Table 9: Significant Factors in Agreement with Regulation______________________________ 42 Table 10: Significant Factors in Agreement with Regulation Types ______________________ 43 Figure 20: Fishery Management Level Preference as a Percentage of 425 Respondents ______ 48 Figure 21: Fishery Management Level Preference by Percentage among Fishing Group* ____ 49 Figure 22: Fishery Management Level Preference by Percentage among Age Divisions* _____ 50 Table 10: Significant Factors in Spatial Level of Management Preference _________________ 51 Table 11: Frequency of Coral Reef Fishery Education from Various Sources_______________ 61 Figure 23: Average Amount of Fishery Education Received (Days per Year) from Social, School, and Media Education Sources______________________________________________________ 62 Figure 24: Days of Education Received by Different Age Groups_________________________ 63 Figure 25: Days of Education Received by Each Gender ________________________________ 64 Figure 26: Days of Education Received by Fishing User Groups _________________________ 65 Figure 27: Days of Education Received by Gleaners and Non-Gleaners____________________ 66 Figure 28: Education Received by Respondents from Varying Curfew Types_______________ 67 Table 12: Final Model for Social Fishery Education____________________________________ 69 Table 13: Final Model for Workshop Education_______________________________________ 70 Table 14: Z-scores of management concerns by village. _________________________________ 79 Figure 29: Spatial Variation in Habitat Complexity in Surveyed Villages __________________ 80 Figure 30: Spatial Variation in Total Population over 15 years old in Surveyed Villages______ 81 Figure 31: Spatial Variation in Population Density in Surveyed Villages___________________ 82 Figure 32: Spatial Variation in Total Fishing Effort in Surveyed Villages __________________ 83

viii
Figure 33: Spatial Variation in Per Capita Subsistence Fishing Frequency in Surveyed Villages84 Figure 34: Spatial Variation in the Per Capita Recreational Fishing in Surveyed Villages ____ 85 Figure 35: Spatial Variation in the Percentage of People Who Prefer Village Level Fishery Management____________________________________________________________________ 86 Figure 36: Spatial Variation in the Amount of Fishery Education Received from Media Sources in Surveyed Villages _____________________________________________________________ 87 Figure 37: Spatial Variation in the Amount of Fishery Education Received from Social Sources in Surveyed Villages _____________________________________________________________ 88 Figure 38: Spatial Variation in the Amount of Fishery Education Received at Workshops in Surveyed Villages _______________________________________________________________ 89 Figure 39: Spatial Variation in the Average Level of Agreement with Possible Fishery Regulations in Surveyed Villages ___________________________________________________ 90 Figure 40: Conceptual Model for Geographic Prioritizations____________________________ 95

ix
Abstract Fishing in American Samoa has historically been important for cultural and subsistence purposes. Recent studies of the territory, however, showed declines in both subsistence fishing activity and coral reef fish abundance (Coutures 2003, Green 2002). As the agency responsible for managing American Samoa’s fishery resources, the Department of Marine and Wildlife Resources employs several strategies to manage near shore fishing. A comprehensive near shore fishery management plan, however, has never been developed. To assist in developing and implementing new management techniques, this study uses socioeconomic data to examine three policy themes: 1) Regulations; 2) Fishery education; and 3) Geographic prioritization. To incorporate local input about the current usage of the fishery into our analysis, we developed a community survey to answer specific questions within each policy theme. Statistical methods, including regressions, t-tests, and chi squared analyses were used to analyze the survey results and provide managers with baseline data concerning future fishery management. Demographic and environmental characteristics were included to create a thorough representation of what is occurring in the fishery. Our results indicate that an increase in near shore fishery regulations will likely be accepted by the majority of American Samoans. Fishery education from media sources was found to be the most frequently received while also reaching the widest audience. Utilization of baseline information collected along with our developed geographic maps will provide resource managers with the means for developing future fishery management policies throughout the territory.

x
Executive Summary Problem Over the past two decades reef fish and invertebrates have declined in both abundance and size in American Samoa. To address this decline, the Coral Reef Advisory Group (CRAG) was developed, linking territorial agencies to facilitate coral reef management in American Samoa. CRAG identified four areas of concern associated with the fishery decline: overfishing, land-based pollution, overpopulation, and global climate change and designed Local Action Strategies (LAS) to support the management of these problems. The Department of Marine Wildlife and Resources (DMWR) is the lead agency in the development of the overfishing LAS with a mission of “restoring fish stocks and other exploited biota that are commercially, ecologically, and culturally important to the American Samoan way of life (fa’a samoa) and to prevent non-sustainable harvesting methods”. Our study addresses the overfishing LAS by creating a decision support tool based on socioeconomic and geographic data for DMWR. Objectives The intent of our study is to use data and statistics derived from community surveys to support future fishery management decisions of DMWR. In particular, our research focuses on public perceptions and opinions in order to identify management concerns. Incorporation of socioeconomic factors in fishery management decisions is recognized as an important aspect of effective policy development. To focus management strategies, we identified three policy themes: regulation, education and geographic prioritization. Within these policy themes we addressed the following specific research questions:
Regulation
What is the current perception of fishery regulation? With which types of regulations are people most likely to comply? What are the factors that influence people’s agreement level with regulations? Is there a difference between user groups regarding attitudes and opinions towards fishery regulations and management policies? What spatial level of management is most preferred?
Education
Where do American Samoans currently receive most of their coral reef fishery education? Specifically, from which sources and how frequently do user groups receive fishery education?
Geographic Prioritization
How can DMWR incorporate spatial variation in demographic and environmental factors in order to enhance fishery management strategies?

xi
Methods Our analysis incorporates data from community surveys, local knowledge, collaboration with experts, and spatial models to provide local resource mangers with a decision support tool to aid in the implementation of sustainable fishery management strategies. We developed and administered a community survey in collaboration with local managers to address various factors concerning fishery use and management. We asked specific questions about demand for fish, community attitudes towards fishing regulations, and community preferences towards fishery resources. Our objective was to examine general trends in survey responses to draw conclusions based upon our analysis. Over an 8 week period in the summer of 2005 we conducted a survey of a cross section of villages. We used a stratified sampling technique that was aimed at capturing the average community member by representing the varying degrees of urbanization, geographical isolation, and access to coral reef fishing grounds. From this random sampling, 34 villages across the territory were selected to survey. The villages were urban and rural, coastal and inland, and in both remote and well-serviced locations throughout the Territory. With the aid of local Samoan translators, we administered a total of 425 surveys in English or Samoan. We conducted at least 12 surveys in each village. To analyze our data, we used a variety of statistical methods, including summary statistics, analysis of variance tests (ANOVA), chi-squared tests, and multivariate regression analysis. A regression analysis determines the factors which potentially influence a response to a question by evaluating each variable while holding all other factors constant.
Results and Discussion Fishery Use
One of the aims of our survey was to give DMWR basic information about the frequency of different uses of the fishery as well as determine community fish and invertebrate preferences. To support a bottom-up approach, we elicited community opinions about which uses of the fishery respondents perceived as important. The vast majority of survey respondents felt that maintaining a healthy ecosystem and fishing for food were important uses of the fishery. A substantial majority also felt cultural use of the fishery was important, while commercial use of the fishery (buying and selling) and recreational fishing were considered important by significantly less number of respondents. Regulation
To maximize effectiveness of management, stakeholder perceptions, attitudes and experiences regarding regulations should be considered while formulating decisions to fishery management problems. Built into the context of regulatory regimes, identification of user groups and their agreement levels with management strategies can assist in promoting compliance. To evaluate the types of regulations which will have the highest level of compliance in the future, we asked village members to categorize their level of agreement with eight different statements regarding potential regulation types. In general, the response is in favor of each of the eight regulation types, with at least 61% of respondents in agreement with each regulation. Based upon this initial analysis, compliance is estimated to be greatest with the following four regulation types:

xii
“DMWR should regulate what is caught” “DMWR should regulate where people fish”
“DMWR should regulate how people fish” “DMWR should regulate during spawning events”
User group perceptions about current and proposed regulation strategies can also provide valuable insight for managers in the development of a community-driven management framework. For example, within the fishing user group, the above average fishers are least likely to agree with regulation. Therefore, it is important for fishery managers to collaborate with fishers when determining the regulation strategies that will receive the greatest level of compliance. Our initial analysis also examined the perception of current regulations and enforcement strictness. Forty-six percent of the respondents think current regulations are too lenient, while only 8% expressed that they are too strict. Indicating that a future increase in regulations of the near shore fishery will likely be accepted by the majority of American Samoans Education
Well conceived and adaptive public education programs are an integral component in maintaining fishery resources. They can promote sustainable use of the resource base and teach people to become stewards of their surrounding environment. Education and outreach can also be a way to establish a working connection between managers and the community. Based on our survey, the most frequently accessed fishery education sources (those with a frequency of most days) are TV and Radio (with 43% respondents), newspapers (41%), and school (41%). Family, as a source of fishery education, is also a frequently used source, with 37% of the respondents receiving this source most days. In our study we used regressions analysis to determine factors that affect the frequency of fishery education from media, social, and workshop sources. The statistically significant variables in the regression on social education were age, gender, and curfew. These results are notable because the regulation regressions indicate that people with more social education are more likely to disagree with regulations, but people who attend workshops are more likely to agree with regulations. Therefore, if American Samoa chooses to increase regulations and enforcement as a management tool, then the nature of social education will need refining in order for those tools to be more accepted. Further implementation of workshops targeting the sources of social education (heads of families, village leaders, matai) could be an effective means of influencing community opinions towards fishery resources. Both the summary statistics and regressions for this policy theme indicate that media education is not received significantly more by any particular demographic group. Therefore, media sources might be an effective means of disseminating fishery information to the general public. Media sources are also currently the means by which fishery education is received most frequently. However, our research did not address the quality or effectiveness of any of the education sources. Therefore, if media sources of fishery education continue to be used frequently, managers should carefully consider the type of information distributed.

iv
Geographic Prioritization
As a method of prioritizing geographic management areas, we analyzed our data by exploring the variation in each policy theme across villages. We also incorporated some biophysical characteristics into the analysis in order to present ways for managers to integrate the socioeconomic aspects of fisheries management into their decision processes. To show the variations between villages, we used GIS to create maps of American Samoa that show each of the villages surveyed. Each individual map focuses on a possible area of concern for fishery managers and indicates how each surveyed village compares to the average value. Examples of the areas of concern that we mapped are habitat complexity, population density, total fishing effort, and agreement with regulations. In all, 11 maps were made that cover a range of fishery concerns involving fishery resource potential, population related pressures, and sociological information. These categories correspond to the quality of the fishery, the amount of resource exploitation, and the general perceptions of residents regarding different types of management actions. Managers can use results from our model to estimate the effects of future management actions on individual villages, appraise the success of specific policy on specific villages, assess how villages may be affected by the activities of other villages, and predict the effects of territory-wide trends based on the current spatial variability. Additionally, managers can examine either the variability of a specific management concern across all villages, or they can distinguish the interactions of different management actions within villages. Conclusions
Our research provides valuable information regarding socioeconomic aspects of near shore coral reef fisheries management in American Samoa. It highlights current conditions and explains significant influences in fishery use, education, and regulatory perceptions. Moreover, it proposes a spatially explicit model of resource availability, resource use, and sociological concerns. Finally, it presents a conceptual representation of how this information fits into the broader scope of fisheries policy development. By analyzing the sociological component of fisheries in American Samoa, this research provides beneficial decision support for local fisheries managers. While the findings of this report are important, they must be balanced with other available information regarding the coral reef resources in American Samoa. This research should enhance the knowledge of local resource managers and allow them to make more informed decisions toward the fisheries.


1
Introduction
Coral reefs are biologically diverse ecosystems that support nearly 500 million people
worldwide by providing food, coastal protection, cultural items, and tourism income
(Wilkinson 2004). Pressure imposed by over-exploitation, pollution, habitat destruction,
invasive species, disease, bleaching and global climate changes through human activities
have threatened the long-term sustainability of these sensitive environments (CRTF 2000).
The rapid decline of these complex ecosystems in American Samoa nearshore waters has
significant social, economic and environmental impacts on the local communities (Spurgeon
et al. 2004).
Consistent with other Polynesian cultures, coral reef resources have historically been an
important aspect of the culture and livelihood of American Samoa (Dalzell 1996). Over the
past two decades reef fish and invertebrates have declined in both abundance and size in
American Samoa. To address this decline, the Coral Reef Advisory Group (CRAG) was
developed, linking territorial agencies to facilitate coral reef management in American
Samoa. CRAG identified four areas of concern: overfishing, land-based pollution,
overpopulation, and global climate change and designed Local Action Strategies (LAS) to
support the management of these problems. The Department of Marine Wildlife and
Resources (DMWR) is the lead agency in the development of the overfishing LAS with a
mission of “restoring fish stocks and other exploited biota that are commercially,
ecologically, and culturally important to the American Samoan way of life (fa’a samoa) and
to prevent non-sustainable harvesting methods”. Our study addresses the overfishing LAS by
creating a decision support tool for DMWR based on socioeconomic and geographic data.
Objectives
The intent of our study is to use socioeconomic data and statistics derived from community
surveys to support future fishery management decisions. In particular, our research focuses
on public perceptions and opinions in order to identify management concerns. Incorporating
socioeconomic analysis and community input in fishery management decisions is recognized
as an important aspect of effective policy development (Bunce et al. 2000). Using literature

2
review and input from local managers, we focused our research into the three main policy
themes: regulation, education, and geographic prioritization. Within these policy themes we
addressed specific research questions as follows:
Regulation
What is the current perception of fishery regulation?
With which types of regulations are people most likely to comply?
Which factors influence people’s agreement level with regulations?
Is there a difference of opinion between user groups regarding attitudes and
opinions towards fishery regulations and management policies?
At which spatial level of management do villagers want the fishery resources to
be managed in the future?
Education
Where do American Samoans currently receive most of their coral reef fishery
education?
From which sources and how frequently do user groups receive fishery
education?
Geographic Prioritization
How can DMWR incorporate spatial variation in demographic and
environmental factors in order to enhance fishery management strategies?
Our analysis incorporates data from community surveys, local knowledge, collaboration with
experts, and spatial models to provide local resource mangers with a decision support tool.
The baseline data, statistical analysis of survey results and the geographic decision support
tool created will aid and assist in the development creation of sustainable fishery management
policies for the Territory.

3
Background
Location
American Samoa is a U.S. Territory located in the South Pacific, approximately 2,600 miles
southwest of Hawaii. The territory encompasses five volcanic islands and two coral atolls
within the Samoan archipelago (Figure 1). Of the populated islands, Tutuila is the largest and
most populated (Table 1). Aunu’u lies off the south east of Tutuila and the remote islands of
Ofu, Olosega and Ta’u (Manu’a group), lie 63 miles northeast of Tutuila. Swains Island is a
privately owned atoll 220 miles northwest of Tutuila and Rose Atoll lies 65 miles west of the
Manu’a group.
Figure 1: The Islands of American Samoa (Used with permission of the American Samoa GIS Working Group 20051)
Table 1: Island Characteristics (US Census Data 2000)
Island or Atoll Area (km2) Population Population Density (per/km2)
Tutuila 137.4 55,400 403.20 Aunu'u 1.53 476 311.11
Ofu 7.33 289 39.43 Olosega 5.26 216 41.06
Ta'u 45.51 873 19.18 Rose Atoll 0.08 0 0
Swains Atoll 3.57 37 10.36 Total 200.68 57,291 285.48
1 See American Samoa GIS working group website for further details, http://doc.asg.as/Default.htm

4
Culture
As in many other Pacific Islands, family and religion are central aspects of daily life for
Samoans. Maintaining fa’a samoa or “the Samoan way” is considered a fundamental value
within the culture and was recognized by the territorial constitution as a priority. The basic
unit within the social structure is the aiga or extended family (Fitzgerald and Howard 1990).
Each aiga appoints at least one matai (chief) for life, with the title being passed down within
each family. The matai dictates various aspects of the aiga’s daily life including mediating
disputes and punishing misbehavior. It has historically been considered a great honor to
receive a matai title, and matais are highly regarded and respected throughout the territory
(McDade and Worthman 2004).
Villages in American Samoa usually consist of several aiga. The matai from each aiga form
the village council, who decide on social and economic matters within the village, including
resource management. Village councils also elect a pulenu’u, or a village mayor, who has the
final say in village matters (Tuitule 2005 pers. comm.). Communal sharing of land and
resources is practiced within each village and 90% of all land in the territory is owned by aiga
and passed on through generations (Osman 1997). This is a key consideration for resource
managers because this set of values differs greatly from the American approach of ownership
and the protection of private property rights.
Daily customs and routines in American Samoa have developed over time from a
combination of traditional Samoan values and Christianity, the dominant religion of the
territory2. For example, many villages still observe an evening prayer time or curfew, during
which villagers are forbidden from leaving their homes and amuaga, or village policemen, do
not allow cars to pass through the village. Another example is the observation of Sundays as a
day of rest for family and for going to church. On this day, villagers must refrain from most
recreational and commercial activities. Within the church, the faifeau, or minister is as highly
regarded in the community as the village matai (Tuitule 2005 pers. comm.).
2 The local government estimates the percentage of Christians in the territory to be 98%: http://www.asg-gov.net/

5
Political Structure
American Samoa is an unincorporated and unorganized US territory. As an unorganized
territory, American Samoa has not adopted all parts of the US constitution and lacks an
organic act with the US government. Consequently, the governmental structure mirrors that
of the US, while also incorporating important elements of traditional Samoan social structure.
Economy
American Samoa’s economy relies mainly on tuna fishing and processing, as well as grants
from the US government, with 93% of the economy based on these two sectors (DOI State of
Islands Report 1999). The world’s two largest tuna processing plants are located in Pago
Pago Harbor and employ approximately 33% of the territory’s workforce. The other 67% is
more or less equally distributed between the government and the general service industry
(WPFMC 1999).
The territory’s per capita income ($4,357) and median household income ($18,219) are very
low compared to the US mainland (Census 2000), but almost twice the average of all Pacific
Island economies (DOI State of the Islands Report 1999). The government of American
Samoa has sought to diversify its economy over the past two decades, but economic
development in the territory continues to be hindered by its remote location, lack of
infrastructure, and lack of a skilled labor force (Osman 1997). Given these limitations, near
shore fisheries continue to be an important resource for American Samoa.
Coral Reef Ecosystem
Extent
Coral reefs, and the fish populations they support, are quite limited in American Samoa due
to the small size of the islands and their steeply sloping sides that drop quickly in the water
within 2-8 km from the shoreline. According to a 2003 UNESCO report, the total area of
American Samoa’s reef habitat to 100m depth is only 296 km2 compared to 490 km2 in

6
Samoa and 1180 km2 in Hawaii (Whittingham et al. 2003). The majority of the Territory’s
coral reefs are fringing reefs (85%), the remainder being offshore banks (12%) and atolls
(3%) (Craig et al. 2001). This is important because fringing reefs provide a relatively limited
area of shallow water coral habitats, which make fish populations, and the ecosystem as a
whole, vulnerable to natural and anthropogenic disturbances.
Habitat
Despite their limited extent, coral reefs in American Samoa support a high diversity of corals
assemblages (Craig 2004; Craig et al. 2001). High temperatures and environmental stressors
coupled with a myriad of anthropogenic disturbances including coastal development,
sedimentation, and pollution have put corals reefs in peril (Craig et al. 2004). While the
extent of each of these disturbances’ effect on coral reefs has not been fully assessed, there
have been several studies which attempt to find correlations between these factors and the
degradation of the coral reef habitat in American Samoa. In 2005, Houk et al. found that
non-point source pollution and, more specifically, human population density is negatively
correlated with coral density. This current state of the reefs and the associated impacts are
important considerations when developing local management policies, given the fact that
American Samoa’s population has doubled in the past 20 years and is projected to double
again in the next 30 years (Craig et al. 2000).
Fish Assemblage
American Samoa’s coral reef ecosystem supports a high diversity of fish and invertebrates,
consistent with its geographic location (Caley and Schulter 1997). A fish survey documented
in Wass (1984) listed 991 fish representing 113 families, 890 of which are considered reef
dwelling species. The list includes 40 species found only in Samoan waters, bringing the total
number of reef fish species found in American Samoa to 850 (Skelton et al. 2000).

7
State of the Fishery
Historical Importance of Fishing Near Shore
Like other Pacific Island cultures, limited terrestrial resources has led to historical
dependence on coral reef resources for survival throughout Samoan history. As a
consequence, the relationship between man and the marine environment has exerted a strong
influence in the development of Samoan culture and shaped many cultural beliefs and
practices (Johannes 1978). Though systematic data on catches in the near shore before 1950
are not available, anecdotal evidence and the existence of Samoan myths suggest that
Samoans have relied heavily on marine resources throughout their history, though Western
contact has eroded the traditional use of marine resources (Severance et a1. 1989; Bindon
1997). Given this historic importance, assessments of fisheries in American Samoa must also
include the socio-cultural contributions of fishing in addition to its economic and nutritional
benefits (WPFMC 1999).
Declines in the Fishery
While the fisheries have supported American Samoa for thousands of years, two trends of
concern in coral reef fisheries have recently been documented: subsistence fishing activity
has declined over the past two decades (Coutures 2003) and coral reef fish and invertebrates
have declined in abundance and size (Green 2002). Beginning in 1991, near shore catches
have been measured using inshore creel surveys along a 16 km stretch of shoreline on the
south side of the main island of Tutuila (Ponwith 1992). The analyzed creel survey data from
1991 to 1995 shows a steady drop in catch, value of landings, effort and catch per unit effort
(CPUE) (Adams and Dalzell 1995). The use of interpolation techniques to reconstruct coral
reef fisheries catches in Zeller et al. (2005) between 1950 and 2002 found that total catches
throughout the territory decreased by 79% over this time period, though the change in effort
over this same time period was not consistently measured.

8
Current Management Regime
The Department of Marine and Wildlife Resources (DMWR) is the Territorial agency
mandated with the management of all living marine resources in territorial waters (0-3 nm).
As such, they are the sole agency in charge of managing near shore fisheries. Though a
comprehensive near shore fishery management plan has never been developed, several
regulations have been established, consisting mostly of rules on gear restrictions and
regulations targeting specific species (Appendix A). Other mandates include a ban on fishing
at recreational moorings, required record keeping by fisher sellers and buyers, and areas of
limited or closed fishing, such as Fagatele Bay National Marine Sanctuary and Rose Atoll
National Wildlife Refuge.
All regulations listed are enforceable by deputized DMWR officers or American Samoa
Government Public Safety Officers. Individual violations are class B misdemeanors carrying
a punishment of up to $500 or a 15 day to 6 month prison term. Businesses that break these
laws are assessed fines of at least $1,000 per violation. All property used for fishing illegally
or obtained by fishing illegally is confiscated by the government until a civil hearing is
scheduled (ASCA § 20944-20945). Currently DMWR employs 10 enforcement officers, 2
whom patrol near shore areas at randomized schedules throughout the day and night, and
Fagatele Bay National Marine Sanctuary is monitored 2 times a week (pers. comm.). Patrols
are conducted by car and officers note activity occurring on relevant forms. As of July 2005,
8 fishing violations were recorded, none of which were near shore violations (pers. comm.).
Several areas in the near shore have been identified as management districts under different
federal and territorial agencies, each with varying degrees of protection (Oram 2005 (draft);
Appendices B-E). The only completely protected no-take Federal MPA in the territory is
Rose Atoll National Wildlife Refuge, a remote unpopulated atoll under federal jurisdiction. In
the territorial waters surrounding the populated islands, only the regulations at Fagatele Bay
National Marine Sanctuary are codified into territorial law (ASCA § 24.0907). The
establishment of the National Park MPAs came about via an agreement between the National
Park Service in American Samoa and local villagers (Oram 2005(draft)). Territorial MPAs

9
include the Vaoto Territorial Marine Park and 3 areas designated as Special Management
Areas under the Department of Commerce Coastal Zone Management Program (ASCMP)
(Appendix C). Laws regarding management of territorial MPAs are also written into
territorial law and enforceable by deputized officers (ASCA § 18.0214 and ASCA §
26.0221). Eight villages are currently participating in DMWR’s Community Based Fishery
Management Program (CBFMP) (Appendix E). This is a co-management program designed
to “to improve fishing and sustainable development of marine resources in participating
villages as well as the territory” (Saufea and Curren 2000). As such, goals and regulations
vary amongst participating villages and are stated in the aforementioned appendix.
Coral Reef Advisory Group
In light of the ever-increasing anthropogenic impacts on the territory’s coral reef ecosystems,
in 2003 the governor of American Samoa created an interagency task force called the Coral
Reef Advisory Group (CRAG) to act as the working body of the national Coral Reef
Initiative (CRI). In order to facilitate collaboration in research and management between
agencies, CRAG aims to link the 5 main territorial and federal agencies (Table 2) that have a
significant part in coral reef ecosystem management. Projects related to coral reef
management, research and education are proposed to CRAG, voted upon by CRAG member
agency representatives and funded through the CRI annual grant program.
Table 2: American Samoa Coral Reef Advisory Group (CRAG) members Agency Management Jurisdiction
Department of Marine and Wildlife Resources (DMWR) All living resources in territorial waters
Department of Commerce (DOC) Coastal development via the American Samoa
Coastal Management Program; Fagatele Bay National Marine Sanctuary Office
American Samoa EPA (ASEPA) Water quality and land-based pollution
National Park of American Samoa Area designated by National Park Service, including marine resources adjacent to land
American Samoa Community College Sea Grant Extension
Program
Promotion of marine science education and sustainable aquaculture
.

10
Methods
Approach
We developed a community survey in collaboration with local managers to address various
factors concerning fishery use and management. We asked specific questions about demand
for fish, community attitudes towards regulations, and community preferences towards
fishery resources. Our objective was to examine general trends in survey responses to draw
conclusions based upon our analysis.
Sampling Design
Over an 8 week period in the summer of 2005 we conducted a survey of a cross section of
villages in American Samoa. We used a stratified sampling technique that was aimed at
capturing the average community member by representing the varying degrees of
urbanization, geographical isolation, and access to coral reef fishing grounds. From this
random sampling, 34 villages across the territory were selected to survey. The villages were
urban and rural, coastal and inland, and in both remote and well-serviced locations
throughout the Territory.
We obtained a list of local population and demographic information from the Census Data
Report of 2000 (Census 2000). This data indicates that most of the villages are on the large
island of Tutuila, with only a small number of villages on the Manu’a District island chain.
We used the existing geographically divided political level of “county” as our stratum to
conduct the villager survey as this would ensure a wide distribution of samples from across
all districts. We classified the counties into small, medium, and large based upon the number
of villages within each county (Table 3). A county containing fewer than 5 villages we
classified as small, a county with between 5-8 villages we classified as medium, and a county
with more than 8 villages we classified as large. Based upon this technique, we categorized 6
small counties, 3 medium counties, and 2 large counties. This method assured that each
district was sampled and that a representative number of villages were surveyed.

11
Excluding those villages participating in the Community Based Fishery Management Plans
(CBFMP), we randomly selected 1 village from small counties (1*6), 4 villages from medium
counties (4*3), and 6 villages from large counties (6*2) for a total of 30 villages. For the
purposes of our analysis, inclusion of villages with a CBFMP was mandatory to make
reasonable comparisons between villages with a CBFMP and villages without the program.
To eliminate this risk of not having CBFMP villagers represented, we conducted a separate
random sampling of villages in the CBFMP program. At the time of the sampling, there
were 7 CBFMP villages, so 4 villages were randomly chosen. Villages of Ta’u Island were
excluded from the sampling due to visiting limitations and monetary and time constraints.
The new inclusion brought the total to 34 villages across the territory selected to be surveyed.
The villages were urban and rural, coastal and inland, and in both remote and well-serviced
locations throughout the Territory, representing all demographic regions of the territory. We
administered a total of 425 surveys, with at least 12 surveys conducted at each village (except
at Avaio village, where only 11 people could be found).
Table 3: Categorization of counties (small, medium, and large based on number of
villages) with the corresponding villages sampled within each. Stratum County Selected Villages
Ituau Matu’u Vaifauna Onenoa Leasina Aasu Tualati Futiga Ofu* Ofu
SMALL
Olosega Olosega
Ma’oputasi Fagatogo, Leloaloa Atu’u, Utulei
Sa’ole Aunu’u, Utumea East, Amouli. Pagai
Tualauta Mesepa, Faleniu, Malaeimi, Illi’ili
MEDIUM
Community Based Fishery Management Program**
Amaua, Alofau Fagamalo, Auto
Sua Masefau, Avaio, Afono, Aumi, Faga’itua, Sa’ilele LARGE
Lealataua Amanave, Asili, Failolo Leone, Fagali’i, Afao
* Ofu village was randomly chosen, but because of our efforts to reach this separate Island and village, the adjacent village of Olosega was also surveyed. ** CBFMP villages were treated as a separate “medium county”, and 4 villages were randomly selected.

12
Figure 2: Distribution of villages surveyed throughout Tutuila Island and Manu’a.
Those highlighted are the sample villages.
Survey Design
We developed the questionnaire in collaboration with local managers of DMWR, Fagatele
Bay National Marine Sanctuary, American Samoa National Park, and CRAG to integrate
their key issues and considerations. The survey focused on the following socio-economic
factors:
Household demographics
Fishing frequency
Fish type preference and consumption patterns
Perceived strictness of the current regulations
Opinions of future regulations
Sources of fishery education
We designed several questions to identify the distribution of different user groups of the coral
reef fishery across the community. Personal demographic questions (ethnicity, citizenship,
and income) were asked at the end of the survey, as opposed to the beginning, to reduce their
influence on the answers and rejection by the respondents, based upon common survey

13
techniques (Burger et al. 1999; Passfield et al. 2001). Careful consideration was given to
designing the questions in a manner that would obtain useable data from the public, while
also being culturally sensitive. Surveys of this design and methodology have been previously
conducted in American Samoa and Samoa which support our survey design strategy
(Passfield et al. 2001; Sauafea and Curren 2000).
Our survey included mostly closed-ended questions with ordered or categorical choices in
order to gather data capable of quantitative analyses. We designed these types of questions to
facilitate completion by the respondent and to encourage participation. Open-ended
questions were also used to obtain spontaneous answers without bias by forcing the
respondents’ attention on predetermined items (Arlinghaus and Mehner 2003). For instance,
one multi-series question asked respondents to identify important fish and invertebrate
species for five different types of use. This question aimed to capture an inventory of the top
species important to the community at large while not forcing respondents to choose from a
predetermined list. Qualitative techniques of content analysis could then be used to draw
inferences from the responses. For further review, the survey is in Appendix G.
Language
The questionnaire was written first in English, translated into Samoan, and then back
translated to English by a different translator. This method ensured that the Samoan
translations accurately conveyed the English meaning and intent of the question. The survey
was carried out in the language most preferred by the respondent. For Samoan surveys, one
of thirteen local American Samoans conducted the translation with oversight from one of our
group members.
Survey Methodology
We administered a pilot survey prior to entering the field to evaluate the clarity,
comprehensiveness, and acceptability of the questionnaire. Following this pretest, we revised
the questionnaire to incorporate suggestions and clarify ambiguous questions. We held a
debriefing session with several of the translators and survey administers to collaborate on the

14
intentions of the survey and establish a standard set of methods for conducting the survey at
each village and with each survey participant. Also, prior to entering the field, we notified the
Office of Samoan Affairs and attended the Samoan Affairs Meeting. Our presence at the
meeting, at which all village mayors were present, gave us the opportunity to announce our
research goals and objectives. A Samoan translation of our survey plans was presented to the
meeting attendants to request their cooperation and permission to enter their villages. Village
mayors where also contacted on the day of the survey visit to ensure cooperation from the
village members.
Two group members, accompanied by local translators, conducted one-on-one, interview
style surveys with individuals older than fifteen years at arbitrarily selected households.
Gathering locations, such as bus stops, fales (traditional Samoan housing structures) and
markets were also used to meet village members. Interviews were conducted Monday-
Saturday, dawn to dusk, from 21 July until 31 August 2005. Efforts were made to interview
only one person from each household. Due to village, time, and human resource constraints,
this was not always an option in the selected villages (particularly in Ofu and Olosega
villages).
Comparison to Census Data
To corroborate that our survey was a random and representative sample of the population of
American Samoa, we compared the demographic data from our survey to that of the 2000
census data. Table 4 compares the demographic statistics of the survey with the 2000 census
data for language preference, gender, household size, matai status, and citizenship. As can be
observed, the information gathered from survey closely matches the data of the census.
Matai status is not available from the census data, thus no comparison can be made.

15
Table 4: Demographic statistics of survey compared to 2000 Census. Data corresponds to the language in which the survey was conducted and questions 1, 17, 18, and 20.
Demographic Information Survey Statistics Census % Preferred Samoan Language 65.2 68.6*
% Female 48.9 48.8 Average Household Size 7.44 6.05
% Matai 17.0 Unavailable % American Samoan citizens 55.0 57.4
* This percentage was calculated by multiplying the percent of people who spoke a language other than English (97.1%) by the percent of people who preferred to speak that language more than English (78.0%) by the percent of people of those whose other language was Samoan (90.6%).
Figure 3 represents the age distribution from the survey in comparison to the census data. As
noted from the graph, in both our sample and the census data, the 25-34 year old age group
makes up the greatest percentage of the population.
Figure 3: Age distribution of survey compared to 2000 Census. This data only includes individuals older than 15 years. Data corresponds to survey question
1.
25.4%
17.2%13.4%
15.3% 14.4%
3.3% 3.5% 2.4%4.7%
12.8%14.9%
24.8%
21.0%
13.5%
4.2%3.4%
3.8%
1.3%0%
5%
10%
15%
20%
25%
30%
15-19yrs
20-24yrs
25-34yrs
35-44yrs
45-54yrs
55-59yrs
60-64yrs
65-74yrs
75-84yrs
Age Group Percentagesfrom Survey*
Age Group Percentagesfrom Census**
*Percentage of 425 respondents. **Percentage of 8581 respondents.
Table 5 compares the income distribution from our survey with the census data. As can be
observed in the table, the greatest number of people in our sample (30%) fall in the <$7500

16
range, as compared to 17% captured for this range within the census. The income range
>$25000 contains the greatest number of people (36%), and our sample results in 12% of the
respondents. The discrepancy between the income distributions of both the upper and lower
income bracket may be explained by the addition of the no answer responses, assuming that
those in the highest or lowest income bracket were most likely not to respond to the question
in our survey. Alternative reasons for the discrepancies are the time of day that our surveys
were conducted (afternoon when people are at work), or how we divided the Census income
brackets.
Table 5: Number of Respondents in Specified Income Range*
Income Range From Survey Percentage From Census Percentage<$7500 93 30% 1551.5 17%$7500-$14999 98 31% 2327.5 25%$15000-$24999 84 27% 2079 22%>$25000 37 12% 3391 36%Total Respondents 312 9349
* The Census included more categories (under $5000, $5000-$9999, $10000-$14999) than our survey. For comparison purposes, we added all Census data categories under $5000 and divided the counts from the $5000-$9999 and $10000-$149999 in half to match the income brackets used in the survey.
Survey Limitations
Though the survey was designed to be clear and unbiased, there are always inherent flaws
with socio-economic surveys that can lead to imprecise results. Some of these limitations
have to do with the questions themselves. There is no certainty in whether the respondent
fully comprehended the question asked. For example, respondents could have been confused
about the difference between frequency of fishing for food and fishing for fun, where the
distinction being made between subsistence fishing and recreational fishing might not have
been clear. Another vague example was the lack of specificity in the differentiation between
fresh and canned tuna when asking about fish preferences.
An additional concern with surveys is that there is often no incentive for respondent to tell
the truth. In particular, the questions in our survey about regulations, enforcement, and
perceptions of illegal fishing could have misleading results if some respondents answered

17
what they thought would be the best answer as opposed to their actual opinion. For example,
when asked about their perception of illegal fishing in American Samoa, respondents who
fish illegally might have been inclined to say that they do not partake in it or that it does not
occur. Consequently, the results would indicate that illegal fishing is not a problem, when in
reality, there is illegal activity.
Some final limitations to the survey have to do with logistic matters, such as the time, place,
and language of the survey. Most surveys were administered during mid-day hours, thereby
minimizing the number of available respondents who work during normal business hours.
Additionally, due to limitations in accessibility, some villages were not selected for
surveying. The small sample size from each village (12 people) also limits the ability to draw
results specifically between villages. The language difference between English and Samoan
is another limitation to consider. Despite our translation efforts, there is likely to remain
some imprecision in the final conversion from English to Samoan. Finally, there may have
been a bias associated with the survey conductors. It is possible for people conducting the
surveys to unintentionally lead a respondent to a particular answer or suggest a possible
answer. Although we aimed to reduce the chances of all of these limitations and sources of
bias in our survey design and methods, the possibility of their occurrence should be
considered when interpreting results.
Data Analysis and Definition of Terms
To analyze our data, we used a variety of statistical methods, including summary statistics,
analysis of variance tests (ANOVA), chi-squared tests, and multivariate regressions.
Statistical analyses were performed in Excel and JMP 5.1 software. The responses to the
survey questions were first evaluated using summary statistics such as histograms, bar
graphs, and tables. We then defined a series of user groups towards which to focus
management strategies. These user groups were initially analyzed using ANOVA and chi-
squared tests, which compare the mean value of a response, such as level of agreement with a
type of regulation. The user groups and other factors, such as coastline and regulation
agreement, were then further evaluated using regression analysis. Regression analysis
determines the factors which potentially influence a response to a survey question by holding

18
all other factors constant and evaluating each factor separately. The influential factors can
then be used to support management decisions. Significant factors, as identified in the
regressions, were then further evaluated at the village level by comparing mean values
between villages using ANOVA and z-scores. A z-score is the difference between each
value and the mean for all villages, divided by the standard deviation for each variable. The
z-scores were then normalized and visually represented using ArcGIS 9.0. The user groups
and factors used are defined below:
Definition of Terms and User Groups
Frequency of Fishing
Question 5 in the survey asked the respondent to specify the frequency, in units of times per
month, with which they utilized or fished reef fish for a variety of specified reasons. The
following terms define the specific uses we considered in our analysis.
Subsistence Fishing – Refers to the frequency with which the respondent
catches fish and/or shellfish for their family to eat. The average frequency of
subsistence fishing is 2.8 times a month.
Gleaning – The activity of collecting invertebrates and tidal species when the
tide is low is referred to as gleaning. Respondents were grouped into two
user groups based on whether or not they gleaned.
Recreational Fishing – Refers to the frequency with which the respondent
catches fish and/or shellfish for enjoyment. The average frequency of
subsistence fishing is 3 times a month.
Using Fish for Cultural Purposes – Refers to the frequency with which the
respondent eats fish and/or shellfish for cultural purposes.
Fishing Frequency – Refers to the frequency with which the respondent
catches fish and/or shellfish for their family to eat combined with the
frequency with which they catch fish and/or shellfish for enjoyment. The
average fishing frequency for subsistence and recreational purposes is 5.4
times a month.

19
Fishing User Groups
Those who fished for subsistence and recreational purposes were then grouped into fishing
user groups according to the average fishing frequency.
Above Average Fishers – Those who indicated a fishing frequency of 6 or
more times a month for subsistence or recreational purposes.
Below Average Fishers – Those who indicated a fishing frequency of 5 or
less times a month for subsistence or recreational purposes.
Non-Fishers – Those who indicated that they did not fish for either
subsistence or recreational purposes.
Preferred Level of Fishery Management
Preferred level of fishery management refers to survey question number 9, in which the
respondents were asked to indicate how they would like DMWR to formulate the rules for
fishing the coral reefs in the future. Respondents were asked to choose one of the following:
village, district, island, territory wide, or other.
Perception of Illegal Fishing
Perception of illegal fishing refers to survey question number 10, in which the respondent
was asked: “Out of every 100 days coral reef fishing occurs in American Samoa, how many
of those days do you think coral reef fishermen are involved in illegal fishing activity?” For
the summary statistics, we grouped the respondents’ perception of illegal fishing into bins of
no answer, zero, and twelve equal distributions of 1-10, 11-20; to 100 times per 100 days. For
regression analysis, we evaluated this factor in a nominal format, grouping the respondents
into two categories; one group of respondents who gave an estimate for the frequency of
illegal fishing, and the other group of respondents who provided no answer, did not know, or
answered zero.

20
Level of Agreement with Regulations
Questions 12 and 13 in the survey asked the respondent to indicate their level of agreement
with a series of statements regarding the implementation of 8 different regulation types.
These statements are as follows:
DMWR should regulate who is allowed to fish (permits, licenses).
DMWR should regulate what kind of fish and/or shellfish is caught.
DMWR should regulate what is done with the catch after it is caught.
DMWR should regulate when people can fish.
DMWR should regulate where people can fish.
DMWR should regulate how people can fish (gear regulations and boat regulations)
DMWR should regulate fishing during fish and/or invertebrate spawning events.
Fishing regulations should be placed on individuals younger than eighteen.
Respondents were asked to choose among five levels of agreement: agree, somewhat agree,
neutral, somewhat disagree, and disagree. For the regression analysis, the responses for each
regulation type were combined into two groups; agree and disagree. To do so, we grouped the
respondents who answered somewhat agree and agree, discarded the neutral responses (which
did not exceed 4% of total respondents for each regulation type), and grouped the respondents
who answered somewhat disagree and disagree. This yields a division of two agreement
levels to indicate an overall disagreement or an overall agreement with the regulation type.
For a full report of all the responses see Appendix H. For the regression analysis, we
evaluated the responses using nominal logistic regression. We also composed a variable for
agreement level with all regulations, termed overall agreement. This variable was created by
assigning a numerical value for the two groups, agree (1) and disagree (0), and summing the
responses for all 8 regulation types (referred to as a binary sum method). Therefore, the
respondent’s overall agreement with the 8 regulation types, or the total number of regulations
with which the respondent agreed, are indicated on a scale of 0 to 8, from disagree to agree.

21
Sources of Fishery Education
Question 15 in the survey requests the respondent to indicate the frequency with which they
receive fishery education from a series of sources. These sources of fishery education are as
follows:
School
College
Fishery Workshops
Television/Radio
Newspapers
Pamphlets
Family
Other (please specify)
Five different frequencies were provided for the respondent to choose from: most days, once
a week, once a month, once a year, and never. We then assigned numerical values to the
responses as follows:
In all cases, “most days” was assumed to be at least 80% of a year.
For fishery education from School and College, the year was considered 180 days,
which is the typical number of days in a school year. Thus “most days” was 80% of
180, or 144 days; once a week was 36 days; and once a month was 9 days.
For fishery education from Television/Radio, Newspapers, Pamphlets, and Family,
the year was considered 365 days, therefore “most days” was assumed to be at least
80% of 365 days, or at least 292 days.
We divided the fishery education sources into four categories:
Workshop Education –This term refers to the frequency with which respondents had
attended a fishery workshop. The respondents were grouped into two categories,
those who had attended 1 or more fishery workshops, and those who had not attended
a fishery workshop.

22
Fishery Education from Media Sources – This term indicates the sum of the
frequency of fishery education from Television/Radio, Newspapers, and Pamphlets.
This source is also referred to as Media Education.
Fishery Education from School – This term indicates the sum of the frequency of
fishery education from School and College. This source is also referred to as School
Education.
Fishery Education from Social Sources – This term indicates the frequency of fishery
education from family and other social/informal sources. This source is also referred
to as Social Education.
Community Based Fishery Management Program
The community based fishery management program factor refers whether or not a respondent
is from a village with a Community Based Fishery Management Program, also shortened to
CBFM.
Curfew
Local government officials suggested the use of curfew as a proxy for the strength of each
village’s social structure. In American Samoa, curfew refers to the presence or absence of an
evening prayer time in the village. During this prayer time, villagers are prohibited from
leaving their homes and cars are not allowed to pass through the village. We specify three
types of village curfews as variations in the strength of the social structure
Enforced Curfew – This term refers to a village with an enforced prayer time with a
designated amuaga, or village policemen, for enforcement.
Unenforced Curfew – This term refers to a village with a prayer time, but one that is
poorly enforced with no designated amuaga for enforcement.
No Curfew – This term refers to a village without a specified prayer time.

23
Age Division
We divided the respondents into quartiles based upon age. Four age categories were used in
the analysis:
Group A: 15-22 years old
Group B: 23-30 years old
Group C: 31-35 years old
Group D: 46 years old and up
Population Density of Village (in people/m2)
We estimated population density of each village surveyed as the number of people per square
meter of potentially developable land. Developable land is considered to be any land with a
slope area of a grade of thirty percent or less, as determined by Craig et al. (2004) in the
Status of Coral Reefs Report. The developable land area was calculated using Digital
Elevation Model slope data3. These values were converted from degrees to percentage, and
30% was used as the cut-off between developable and undevelopable land. Using the
“tabulate area” tool in GIS, developable and undevelopable land was calculated for each
village. For the regression analyses, we evaluated this factor as continuous data.
Limitations
As in any data analysis, there are limitations concerning the use of data. For many of the
factors affecting the fishery and fishery use, such as fishing effort, water quality, and the
quality and effectiveness of fishing education, there was little to no data available. Additional
data would be useful to DMWR to support management decisions. The incorporation of
several other factors would give managers a thorough understanding of the resources and
stakeholders involved and help to provide a clearer picture of how to manage marine
resources.
3 Accessed from USGS; http://www.usgs.gov

24
An additional gap in our data analysis is a result from respondents failing to answer all the
survey questions. For example, many respondents did not indicate their income level. In
regression analysis, the lack of a data point causes the responses for that individual to be
discarded for all factors, thus altering the effects of other factors. Due to the lack of
consistency with the income data, this factor was not considered in all analyses.
Our division of user groups may also limit the analysis. The user groups defined were based
on literature review and logical differentiation, but are not the only way to distinguish the
users of the fishery and focus management strategies. A final consideration is the low R2
values in the regression analyses. In general, R2 values for statistical analysis of surveys are
low, and it should be noted that the effects postulated are general trends.
Community Use, Opinions, and Preferences of Fishery Resources One of the crucial steps in developing a fishery management plan in a small island setting is
to determine the use of the fishery as well as elicit community input about their preferences
and priorities (Fiske 1992). Therefore one of the aims of our survey was to provide DMWR
basic information about the frequency of different uses of the fishery and the community fish
and invertebrate preferences. To support an approach that is bottom-up, we elicited
community opinions about which uses of the fishery respondents perceived as important.
Community Opinions about Fishery Resource Use
To assist DMWR in prioritizing management strategies, one of our objectives in conducting
this survey was to determine which coral reef fishery uses the community thought were
important. Table 6 shows that the vast majority of survey respondents felt that maintaining a
healthy ecosystem and fishing for food were important uses of the fishery. A substantial
majority also felt cultural use of the fishery was important, while commercial use of the
fishery (buying and selling) and recreational fishing were considered important by
significantly less number of respondents. In contrast, it is also worth noting that both fish for
recreation and fish for the aquarium trade are two uses considered unimportant by a large
percentage of the respondents (32% and 44%, respectively).

25
Table 6: Importance of Fish Use as a Percentage of 425 Respondents. Data corresponds to survey question 11.
For individual representation of each fish use importance, see Appendix F.
Importance of Fish for Food
Importance of Fish to
Buy
Importance of Fish to
Sell
Importance of Fish for Recreation
Importance of Fish for
Cultural Use
Importance of Fish for
Aquarium Trade
Importance of Fish to
Maintain a Healthy
Ecosystem Important 90% 32% 46% 45% 73% 25% 91%Somewhat Important 5% 36% 19% 16% 13% 20% 4%
Neutral 2% 2% 5% 4% 3% 6% 1%Somewhat
Unimportant 1% 5% 3% 3% 1% 4% 1%Unimportant 2% 24% 26% 32% 8% 44% 3%No Answer 0% 0% 1% 1% 1% 1% 0%
Fish Preference
The determination of community preference of fish and invertebrates is another component
which helps DMWR to prioritize fishery management strategies. This information may be
used for species-specific regulations like size limits and seasonal harvest. As seen in Figure 4,
the majority of respondents had no preference towards a particular type of fish. Likewise, the
three specific fish types (reef fish, tuna and bottom fish) display a similar percent preference,
indicating indifference among the types. This type of response is expected, given the multi-
species nature of the coral reef fishery. Similar to the fish type preference results, greater than
half of the respondents (56%) reveal no preference in invertebrate type. Among those
respondents who gave a preference, lobster was the most preferred invertebrate with 22% of
the respondents.
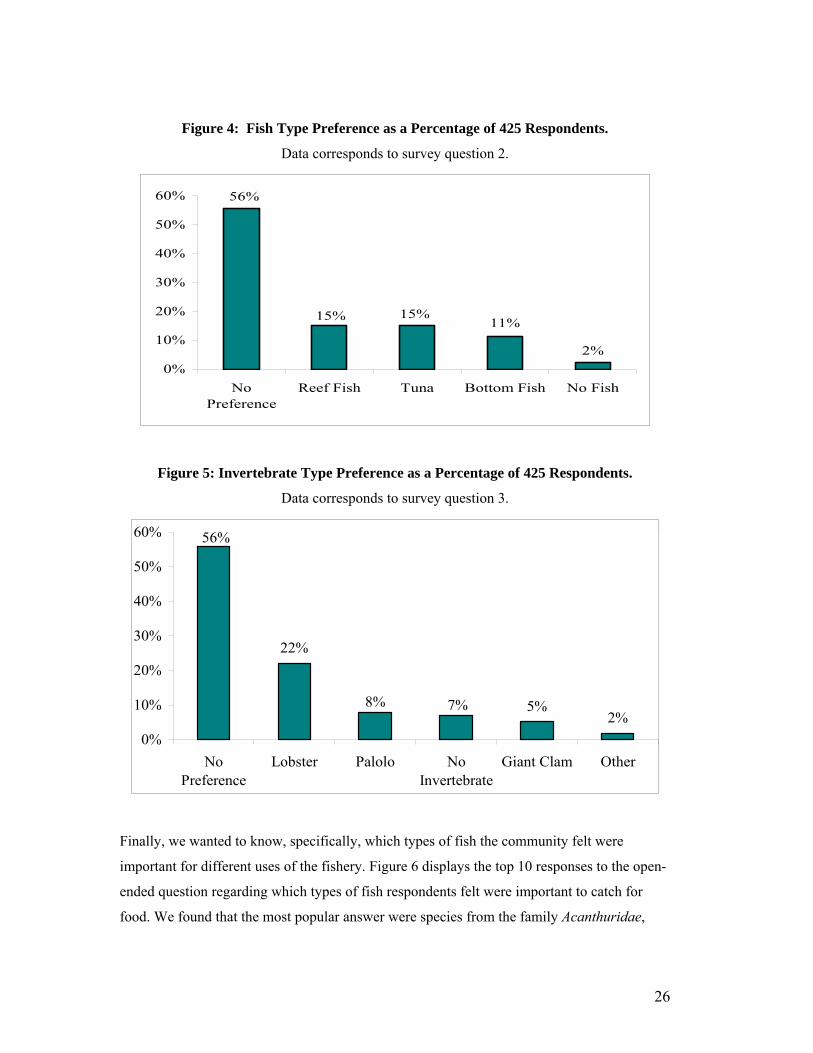
26
Figure 4: Fish Type Preference as a Percentage of 425 Respondents.
Data corresponds to survey question 2.
11%
2%
56%
15% 15%
0%
10%
20%
30%
40%
50%
60%
NoPreference
Reef Fish Tuna Bottom Fish No Fish
Figure 5: Invertebrate Type Preference as a Percentage of 425 Respondents.
Data corresponds to survey question 3.
22%
5%2%
7%8%
56%
0%
10%
20%
30%
40%
50%
60%
NoPreference
Lobster Palolo NoInvertebrate
Giant Clam Other
Finally, we wanted to know, specifically, which types of fish the community felt were
important for different uses of the fishery. Figure 6 displays the top 10 responses to the open-
ended question regarding which types of fish respondents felt were important to catch for
food. We found that the most popular answer were species from the family Acanthuridae,

27
commonly known as surgeonfish. This is consistent with the coral reef monitoring program
results, which found that the top 5 species with the highest sighting frequencies were from the
Acanthuridae family (Whalen and Fenner 2005).
Figure 6: Top 10 most Important Fish and Invertebrates for Subsistence Fishing Data corresponds to survey question 8.
443
176141 134 131
90 86 77 70 69
0
50
100
150
200
250
300
350
400
450
500
Acanth
urida
e
Crustac
eans
Bivalve
s
Serra
nidae
Holoce
ntrida
e
Scari
dae
Scom
brida
e
Mug
ilidae
Carang
idae
Echino
ids
Num
ber
of R
espo
nses
Use of the Fishery
To determine the current use of the fishery, we asked the survey respondents to indicate the
number of times per month they used the fishery for various purposes. Figures 7 through 9
display the frequency of use for subsistence + recreational fishing and cultural purposes.
Although a vast majority of respondents felt subsistence fishing was an important use of the
resource, a significant portion (191 of 425) also responded that they never fished for food
(Fig.7). Of those respondents who did fish for food, the majority fished less than 5
times/month, with most (57 of 234) fishing 2 times/month.. It is important to note that there is
a significant amount of respondents (24) that fish more than 10 times/month. Additionally, it
is important to consider that these results indicate the number of people who fish, but does
not include other members of the household and village who rely on the catch from these
activities.

28
Figure 7: Frequency of Subsistence Fishing for 425 Respondents. Data corresponds to survey question 5.
191
47 5730 35
10 5 3 9 014 24
0
50
100
150
200
250
0 1 2 3 4 5 6 7 8 9 10 >10Times per Month
Num
ber o
f Res
pond
ents
As seen in figure 8 below, the majority of respondents (214 of 425) indicated that they never
fish for recreational purposes. Of those respondents that did recreationally fish, most fished
less than 5 times/month, with most (60 of 206) fishing 1 time/month.
Figure 8: Frequency of Recreational Fishing for 425 Respondents.
Data corresponds to survey question 5.
214
6036 26 27
9 8 5 10 1 722
0255075
100125150175200225
0 1 2 3 4 5 6 7 8 9 10 >10Times per Month
Num
ber o
f Res
pond
ents

29
In contrast to the low recreational use, a substantial number of respondents (244 of 425) used
fish for cultural purposes at least 1 time/month (Figure 9). A small number of respondents
(14) used fish for cultural purposes more than 10 times/month.
Figure 9: Frequency of Using Fish for Cultural Purposes for 423 Respondents. Data corresponds to survey question 5.
179
69 69
31 34
7 10 4 4 0 214
0
20
40
60
80
100
120
140
160
180
200
0 1 2 3 4 5 6 7 8 9 10 >10Times per Month
Num
ber o
f Res
pond
ents
As for commercial use of fish, over half of all respondents answered that they bought fish at
least 5 times/month (Figure 10). However, because reef fish are imported from neighboring
Samoa, this result does not necessarily reflect the use of American Samoa’s fishery resource.
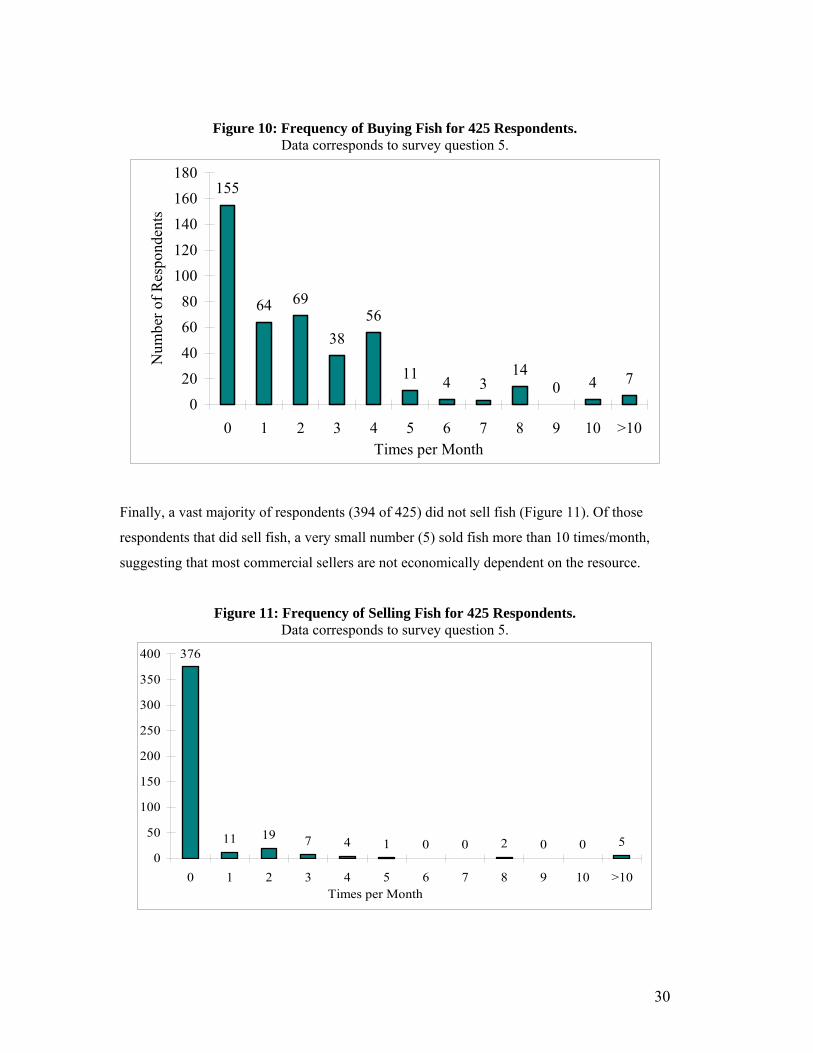
30
Figure 10: Frequency of Buying Fish for 425 Respondents. Data corresponds to survey question 5.
155
64 69
3856
11 4 314
0 4 7
02040
6080
100120
140160180
0 1 2 3 4 5 6 7 8 9 10 >10Times per Month
Num
ber o
f Res
pond
ents
Finally, a vast majority of respondents (394 of 425) did not sell fish (Figure 11). Of those
respondents that did sell fish, a very small number (5) sold fish more than 10 times/month,
suggesting that most commercial sellers are not economically dependent on the resource.
Figure 11: Frequency of Selling Fish for 425 Respondents. Data corresponds to survey question 5.
376
11 19 7 4 1 0 0 2 0 0 50
50
100
150
200
250
300
350
400
0 1 2 3 4 5 6 7 8 9 10 >10Times per Month

31
Trends in Fishery Use
In addition to measuring the current use of the American Samoan community, we also used
regression analysis to determine the environmental and socioeconomic factors that affect their
fishery use. A regression can be a valuable tool when developing long-term fishery
management strategies by helping to determine the factors that influence the way people use
the fishery. This measurement can be utilized to model how fishery use can vary with
changes to natural ecosystem processes of the fishery as well as the socioeconomic context of
fishery use. For example, if household income is determined to be negatively correlated to the
frequency of subsistence fishing activity, managers can infer that as average household
income of possible fishermen increases, the level of subsistence fishing activity will
subsequently decrease by an amount estimated by the model. In this way, meaningful
predictions regarding the levels of fishing activity can be made as updated environmental and
socioeconomic data becomes available. This in turn facilitates the development of long-term
fishery management strategies that are adaptive to constantly changing environmental and
socioeconomic data.
In this analysis, we separated subsistence and recreational fishing because 90% of survey
respondents said that catching fish for food was important, while only 45% said fishing for
fun was important (Table 6). The factors we hypothesized to be significant in both
subsistence and recreational fishing are:
Age Gender Curfew Citizenship Matai Title CBFM Participation Media Education Social Education School Education Workshop Education Habitat Complexity Coastline Population Density Income

32
We used a nominal logistic regression to estimate the probability of being in the above
average subsistence fishing group, leading to the final model:
Probability of being in the above average subsistence fishing groupi = 1/(1+exp(α0 + α
1*(Age) + α2*(Gender) + α3*(Curfew) + α4*(CBFM) + α5*(Coastline) + α6*(Citizenship) +
εi))
Holding all else constant, Table 7 shows the probabilities of individuals falling into each of
the subsistence fishing frequency groups.
Table 7: Final Model for Subsistence Fishing Frequency
Variable User GroupProbability of being a non-fisher
Probability of being a below average fisher
Probabiliaty of being an above average fisher
Effect
15-22 57% 26% 17%23-30 39% 28% 32%31-45 55% 18% 27%
46 and up 56% 22% 22%
Female 67% 20% 13%
Male 35% 25% 40%
No 58% 21% 21%
Enforced 58% 26% 16%
Unenforced 38% 22% 40%
800 meters 59% 21% 21%4000 meters 48% 25% 27%8000 meters 35% 29% 35%
Non-Samoan 62% 20% 17%
Samoan 41% 27% 32%
Age
People between 23-30 have the highest probability of being above average
subsistence fishers. People 15-22 have the highest probability of not
subsistence fishing.Males are more likely to be below
average and above average subsistence fishers. Females are more likely to not
subsistence fish.
People in villages with an unenforced curfew are most likely to be above
average subsistence fishers and the least likely to not subsistence fish.
Gender
Curfew
Coastline
Citizenship
People living in villages with larger coastlines are more likely to subsistence
fish more frequently. Non-Samoans are more likely to not subsistence fish. Samoans are more
likely to be below average and above average subsistence fishers.
The final model for recreational fishing is as follows:
Probability of being in the above average recreational fishing groupi =1/(1+exp(α0 + α
1*(Curfew) + α2*(CBFM) + α3*(Social) + α4*(Coastline) + α5*(Population Density) + εi))

33
Holding all else constant, Table 8 shows the probabilities of individuals falling into each of
the subsistence fishing frequency groups.
Table 8: Final Model for Recreational Fishing Frequency
Variable User GroupProbability of being a non-fisher
Probability of being a below average fisher
Probabiliaty of being an above average fisher
Effect
60 days 41% 29% 30%
120 days 40% 27% 33%
180 days 38% 26% 36%
No 53% 24% 23%Yes 27% 29% 43%No 46% 30% 24%
Enforced 42% 22% 35%
Unenforced 30% 30% 40%
800 meters 40% 29% 31%4000 meters 44% 25% 32%8000 meters 41% 23% 37%0.0005 people/meter^2 41% 28% 31%
0.0015 people/meter^2 39% 27% 34%
0.004 people/meter^2 35% 24% 41%
Population Density
People living in villages with higher population densities are most likely to be above average recreational fishers. People living in villages
with low population densities are more likely to not recreationally fish.
Curfew
People living in a village without a curfew are most likely to not recreationally fish. People
living in villages with an unenforced curfew are most likely to be above average recreational
fishers.
CoastlinePeople living in villages with the most coastline are most likely to be above average recreational
fishers.
Social Education
People who receive the most social education are the most likely to be above average
recreational fishers. People who receive the least amount of social education are most likely not to
fish recreationally. CBFM Participation
People living in CBFM villages are more likely to fish recreationally more frequently.
Discussion
Village curfew is a significant correlative factor for both the frequency of subsistence fishing
and the frequency of recreational fishing. For subsistence fishing, individuals in villages that
have an unenforced curfew are most likely to be above average subsistence fishers and least
likely to be non-fishers. Results for recreational fishing are similar, with people living in
villages with an unenforced curfew as the most likely to be an above average recreational
fishers. For subsistence fishing, respondents living in villages without a curfew are the least
likely to be recreational fishers.
Our analysis also reveals that individuals living in villages participating in the CBFM
program are more likely to fish recreationally more frequently than respondents from villages
not in the CBFM program. A possible explanation for this is that prior to entering the
program, the people in the village fish frequently and therefore find it necessary to manage
their resource. In other words, the regression does not imply that CBFM participation causes

34
individuals in those villages to fish more frequently, but it does indicate the significance of
this program in relation to fishing frequency.
Policy Themes
Regulation
Significance
To maximize effectiveness of management, stakeholder perceptions, attitudes and
experiences regarding regulations should be considered while formulating decisions to
fishery management problems. Built into the context of regulatory regimes, identification of
user groups and their agreement levels with management strategies can assist to ensure
compliance (Pomeroy 1995). User group perceptions about current and proposed regulation
strategies can provide valuable insight for managers in the development of a community-
driven management framework (Rhoads et al. 1999).
To provide current baseline data on opinions and perceptions of several different types of
regulations among user groups of the near shore fishery in American Samoa, we aim to
answer the following policy questions:
What is the current perception of fishery regulation?
With which types of regulations are people most likely to comply?
Which factors influence people’s agreement level with regulations?
Is there a difference of opinion between user groups regarding attitudes and opinions
towards fishery regulations and management policies?
At which spatial level of management do villagers want the fishery resources to be
managed in the future?
Our objective within this policy theme is to provide DMWR with an assessment of user group
perceptions and agreement levels with fishery regulation strategies. Additionally, we define
the socio-economic factors that influence such perceptions and opinions. Identification of

35
these factors allows DMWR to focus future management decisions regarding optimal
regulatory mechanisms.
Policy Theme Analysis
What is the current perception of fishery regulation?
Prior to making decisions about future changes in fishery management, it is important to
understand the current opinions towards the existing regulations and enforcement. To assess
the current perceptions of the strictness of regulations, we asked respondents to categorize
existing enforcement and regulation as one of the following: “too strict”, “about right”, or
“too lenient”. The purpose of this survey question is to tease out whether or not respondents
feel that the fishery is currently being managed in a satisfactory manner. As can be seen in
Figure 12, 46% of the total respondents perceive the current regulation as too lenient. DMWR
can use this finding to support future regulation implementation based on the fact that current
management is perceived as not strict enough. Similarly, fifty percent of the total
respondents perceive the strictness of current enforcement as too lenient, reinforcing the need
for increased fishery management (Figure 13).
Figure 12: Perceived Strictness of Regulation
8%4%
41%
46%
0%
5%
10%
15%
20%
25%
30%
35%
40%
45%
50%
Too Strict About Right Too Lenient Don't know

36
Figure 13: Perceived Strictness of Enforcement.
11%
50%
4%
35%
0%
10%
20%
30%
40%
50%
60%
Too Strict About Right Too Lenient Don't Know
With which regulation types are people most likely to comply?
To evaluate the types of regulations which will have the highest level of compliance in the
future, we asked village members to categorize their level of agreement with eight different
statements regarding potential regulation types. If we assume that people’s acceptance with a
type of regulation is highly correlated with their compliance, then we can effectively derive
the types of regulations with which people are most likely comply.
Our primary results below display an overall agreement level with each regulation type from
the 425 respondents (Figure 14). In general, the response is in favor of these regulation types,
with at least 61% of respondents in agreement with each regulation. Based upon this initial
analysis, compliance is estimated to be greatest with the following four regulation types:
“DMWR should regulate what is caught” (78% agreement).
“DMWR should regulate where people fish” (76% agreement).
“DMWR should regulate how people fish” (75% agreement).
“DMWR should regulate during spawning events” (74% agreement).

37
Figure 14: Level of Agreement with Regulation Type as a Percentage of 425 Respondents.
78%
76%
75%
74%
68%
67%
62%
61% 2%
2%
2%
4%
4%
2%
2%
2% 19%
22%
23%
22%
27%
31%
36%
35%
0% 10% 20% 30% 40% 50% 60% 70% 80% 90% 100%
DMWR should regulatewhat is caught
DMWR should regulatewhere people can fish
DMWR should regulatehow people fish
DMWR should regulateduring spawning events
DMWR should regulatewhat is done with catch
DMWR should regulatewho fishes
Minors should beregulated
DMWR should regulatewhen people can fish
AgreeNeutralDisagree
While our initial analysis considers the difference in percentage agreement between
regulation types, we also ran an ANOVA test to compare the mean agreement levels (on a
scale of 1-5; from agree to disagree) with each regulation type. The mean agreement level for
the four most agreed upon regulation types, as indicated above, are statistically different from
the mean agreement levels of the four other regulation types (Figure 15).

38
Figure 15: Mean Agreement with Regulation Type among Total Respondents*
2.58
2.55
2.35
2.29
2.02
2.02
1.99
1.88
0 0.5 1 1.5 2 2.5 3 3.5 4 4.5 5
DMWR should regulate when people can fish
Minors should be regulated
DMWR should regulate who fishes
DMWR should regulate what is done with catch
DMWR should regulate during spawning events
DMWR should regulate how people fish
DMWR should regulate where people can fish
DMWR should regulate what is caught
Mean Agreement
*ANOVA; p<0.001
What are the factors that influence people’s agreement with regulation?
Is there a difference of opinion between user groups regarding fishery regulations and
management policies?
To identify the factors that influence agreement levels with specific regulation types, we
initially analyzed the differences of opinions within the earlier defined user groups. Using
ANOVA tests, we compared the mean overall agreement between the defined divisions for
each user group. Our intention was to highlight select groups which may necessitate specific
management efforts. Following these evaluations, we then conducted more sophisticated
regression analyses to identify the specific factors that influence agreement.
In terms of agreement with regulations overall, the general response is a high level of
agreement, which is similar across all age groups. However, there is a significant difference
between age group divisions, fishing frequency groups, respondents of different citizenship
(Samoan and non-Samoan), and status of curfew and enforcement in the village. Within the
age group divisions, people over the age of 46 display the greatest level of agreement, (5.96
on a scale from 0-8) while the youngest age group, people ages 15-22, display the least level
of agreement (5.19 on a scale from 0-8) (Figure 16).

39
Figure 16: Mean Agreement Level with Regulations Among Age Groups*
5.60 5.965.685.19
012345678
15-22 23-30 31-35 46 and up
Age Group
Mea
n A
gree
men
t
Agree
Disagree
*ANOVA; p<0.001
To assess whether opinions regarding regulations vary between respondents of differing
citizenship, we compared the mean agreement level of respondents with differing citizenship.
Based upon the groupings we made, there is a statistical difference in agreement with
regulations between Samoan citizens and non-Samoan citizens (Figure 17). Respondents
who are either a Samoan or American Samoan citizen agree with all regulation types more
than citizens from other countries.
Figure 17: Mean Agreement Level with Regulations among Groups of Different
Citizenship*
5.15.7
012345678
Non-Samoan Samoan
Citizenship
Mea
n A
gree
men
t
Agree
Disagree
*ANOVA; p=0.1

40
Based upon the fishing frequency divisions we made for the analysis, there is a statistical
difference in regulation perceptions between the three fishing user groups (Figure 18). It is
interesting to note that respondents with an above average fishing frequency have a lower
mean agreement level (4.95 out of 8) than both the non-fishers and the below average fishers
(6.15 and 5.61 out of 8., respectively). Those individuals who fish more than 5 times a month
agree with the least number of regulation types. In contrast, those respondents who do not
fish display the highest level of agreement with regulations. Therefore, the people who are
active in the fishery reveal an unwillingness to be regulated, while those individuals who do
not take part in the fishery are the most accepting of regulations on fishing activity.
Figure 18: Mean Agreement Level with Regulations among Fishing User Groups*
6.5
4.9
5.6
0
1
2
3
4
5
6
7
8
Non-Fisher Below Average Above AverageFishing User Group
Mea
n A
gree
men
t
Disagree
Agree
*ANOVA; p=0.0001
There is also a significant difference in the mean agreement level with regulations between
the three types of village curfew systems (Figure 19). The villages that have an enforced
curfew display the greatest amount of agreement, with a mean value of 6.09 (on a scale of 0-
8), followed by villages with no curfew, with a mean agreement level of 5.48. Villages that
have a curfew that is not enforced have the lowest agreement level of 4.83.

41
Figure 19: Mean Level of Agreement with Regulations among Respondents with Different Village Curfew Systems*
6.095.48
4.83
0
1
2
3
4
5
6
7
8
Yes No Yes, no enforcement
Agree
Disagree
*Chi-Squared, p<.0001
Further Analysis
While the data gathered by the survey presents current representation of the respondents’
opinions and practices, it does not necessarily provide long-term information about trends in
their opinions and practices. To develop management strategies that are effective in the long-
term, it is fundamental to evaluate the significant factors which influence people’s opinions
about fishery regulations and enforcement. Knowledge of these factors will enable managers
to help shape the attitudes toward regulation and increase compliance. To determine these
factors, we ran regressions on the responses to the 8 different regulation types, as well as the
on the overall agreement level, or the sum of agreement with all regulation types. For all of
the regressions, 11 factors were initially considered as influential variables:
Media Education (Continuous) Social Education (Continuous) Workshop Education (Nominal) Age Division (Nominal) CBFM (Nominal) Citizenship (Nominal) Matai title (Nominal) Curfew (Nominal) Perception of Illegal Fishing (Nominal) Fishing Frequency Group (Nominal) Gender (Nominal)

42
The overall agreement level was evaluated as continuous data with an ordinary least squares
regression analysis. The final model, which only includes factors that are significant, is as
follows:
Overall Agreement with Regulations = α0 + α 1*( Fishing) + α 2*(Social) + α 3*(Workshop) +
α4*( Curfew) + α5*(Age) + α6*( Citizenship) + α7*(Illegal Fishing) + εi
The influencing variables and their predicted effect are listed in Table 9 below. The
difference from the average column describes the variable effect on the identified user group,
holding all other factors constant.
Table 9: Significant Factors in Agreement with Regulation
Variable User groups Difference from Average EffectAbove Average
Fishers -0.521
Below Average Fishers 0.093
Non-Fishers 0.429
Social Education
-0.003
The greater the frequency of fishery education from family and friends, the less likely they are to agree with the
regulation types.
Attendance0.203
Non-Attendance-0.203
Enforced Curfew 0.409
Unenforced Curfew
-0.496
No Curfew0.087
15-22 -0.538
23-30 0.155
31-45 0.122
46 and up0.261
Samoan0.306
Non-Samoan -0.306
No Estimate -0.316
Estimate0.316
The less frequently the respondent fishes, the more likely they are to agree with a
greater number of regulation types.
Fishing Frequency
Overall Agreement
If the respondent has attended a fishery education workshop, they are more likely
to agree with the regulation types.
Workshop Education
Curfew
A respondent in a village with an enforced curfew is more likely to agree
with a greater number of regulation types than a respondent in a village with an
unenforced curfew or no curfew.
A respondent who falls into the youngest age group is more likely to agree with a fewer number of regulations. In contrast, a respondent who falls into the oldest age
group is the most likely to agree with a greater number of regulation types.
Age
A respondent who is a Samoan citizen is more likely to agree with a greater
number of regulation types.
If the respondent did not give an estimate for their perception of illegal fishing,
they are more likely to disagree with the regulation types.
Perception of Illegal Fishing
Citizenship

43
The responses to the 8 different regulation types were evaluated with a nominal logistic
regression, leading to an initial model as follows:
Probability of disagreeing with regulation typei = 1/ (1+ e^( α0 + α 1*(Media) + α2*(Social) +
α3*(Workshop) + α4*(Age) + α5*(CBFM) + α6*(Citizenship) + α7*(Matai) + α8*(Curfew) +
α9*(Illegal Fish) + α10*(Fishing) + α11*(Gender) + εi))
For each regression on the regulation types, the factors determined to be significant vary,
leading to a final model which includes only the significant factors4. The influencing factors
and their predicted effect on the respondent’s opinion are listed in the tables below. The three
factors; Social Education, Curfew, and Fishing Frequency, are consistently significant factors
in the regressions on regulation types. The probability of agreement column describes the
effect the variable has on the likelihood of agreement with the identified user group, holding
all other variables constant. For a detailed account of results, refer to Appendix H.
Table 10: Significant Factors in Agreement with Regulation Types
Variable User groupsProbability of
Agreement EffectAbove Average
Fishers57%
Below Average Fishers
70%
Non-Fishers 69%
80 days 68%
120 days 65%
160 days 63%
Enforced Curfew74%
Unenforced Curfew57%
No Curfew64%
No Estimate59%
Estimate72%
Perception of Illegal Fishing
If the respondent did not give an estimate for their perception of illegal fishing, they are more likely to disagree with this
regulation type.
“DMWR should regulate who fishes”
Curfew
A respondent in a village with an enforced curfew is more likely to
agree with this regulation type than a respondent in a village
with an unenforced curfew or no curfew.
Social Education
The greater the frequency of fishery education from family
and friends, the more likely the respondent is to disagree with
this regulation type.
Fishing Frequency
An above average fisher is the least likely to agree with this
regulation type.
4 A statistically significant influence is determined by a p-value of 0.1 or less.

44
Variable User groups Probability of Agreement
Effect
80 days 74%
120 days 72%160 days 70%
Attendance 76%
Non-Attendance 68%Non - Fisher 79%
Below Average Fisher 75%
Above Average Fisher 61%
No Estimate 66%
Estimate 77%
“DMWR should regulate what is done with catch”
Social Education The greater the frequency of fishery education from family and friends, the less likely they are to agree with the regulation types.
Workshop Education If the respondent has attended a fishery education workshop, they are more likely to agree with the regulation types.
Perception of Illegal Fishing
If the respondent did not give an estimate for their perception of illegal fishing, they are more likely to disagree with the regulation types.
Fishing Frequency Non - fishers are more likely to agree with regulating what is done with catch than below average fishers. Above average fishers are least likely to agree.

45
Variable User groupsProbability of
Agreement EffectAbove Average
Fishers 69%Below Average
Fishers 72%Non-Fishers 82%
80 days 76%
120 days 75%
160 days 73%
Attendance 66%
Non-Attendance 82%
Enforced Curfew 83%Unenforced
Curfew 62%
No Curfew 77%
15-22 59%
23-30 81%
31-45 81%
46 and up 76%
No Estimate 68%
Estimate 81%
“DMWR should regulate what is caught”
Fishing Frequency An above average fisher is the least likely to agree with this regulation type.
Social Education The greater the frequency of fishery education from family and friends, the more likely the respondent is to disagree with this regulation type.
CBFM A respondent in a village with a Community Based Fishery Management Plan is more likelyto disagree with this regulation type.
Curfew A respondent in a village with an enforced curfew is more likely to agree with this regulation type than a respondent in a village with an unenforced curfew or no curfew.
Age A respondent who falls into the youngest age division is least likely to agree with this regulation type.
Perception of Illegal Fishing
If the respondent did not give an estimate for their perception of illegal fishing, they are more likely to disagree with this regulation type.

46
Variable User groups Probability of Agreement
Effect
Above Average Fishers 56%
Below Average Fishers 61%
Non-Fishers 73%
Attendance 70%
Non-Attendance 57%
Enforced Curfew 73%
Unenforced Curfew 55%
No Curfew 62%
“DMWR should regulate when people can fish”
Fishing Frequency Non-fishers are most likely to agree with regulating when people fish. Above average fishers are least likely to agree.
Curfew A respondent in a village with an enforced curfew is more likely to agree with regulating when people fish than a respondent in a village with an unenforced curfew or no curfew.
Workshop Education If the respondent has attended a fishery education workshop, they are more likely to agree with regulating when people fish.
Variable User groups Probability of Agreement
Effect
Above Average Fishers 62%
Below Average Fishers 70%Non-Fishers 81%
80 days 73%
120 days 72%
160 days 70%
Enforced Curfew 81%
Unenforced Curfew 61%
No Curfew 71%
Samoan 78%
Non-Samoan 64%
No Estimate 64%
Estimate 78%
Citizenship A respondent who is a Samoan citizen is more likely to agree with this regulation type.
Perception of Illegal Fishing
If the respondent did not give an estimate for their perception of illegal fishing, they are more likely to disagree with this regulation type.
Curfew A respondent in a village with an enforced curfew is more likely to agree with this regulation type than a respondent in a village with an unenforced curfew or no curfew.
Social Education The greater the frequency of fishery education from family and friends, the more likely the respondent is to disagree with this regulation type.
“DMWR should regulate where people can fish”
Fishing Frequency An above average fisher is the least likely to agree with this regulation type.

47
Variable User Group Probability of Agreement Effect
200 dyas 81%
250 days 80%300 days 79%
Attendance 74%Non Attendance 83%
80 days 81%
120 days 79%
160 days77%
15-22 69%23-30 77%
31-45 82%
46 and up 85%No Estimate 72%
Estimate84%
0 86%Below Average 79%Above Average 70%
Social Education A respondent in a village with an enforced curfew is more likely to agree with this regulation type than a respondent in a village with an unenforced curfew or no curfew.
AgeA respondent who falls into the youngest age division is more likely to disagree with this type of regulation.
"DMWR Should Regulated How People Fish"
Media Education The more fishery education from the mediathat the respondent has received, the more likely they are disagree with this regulation type.
Workshop Education
A respondent who is attended a workshop is less likely to agree with this regulation type.
Perception of Illegal Fishing
If the respondent did not give an estimate for their perception of illegal fishing, they are more likely to disagree with this regulation type.
Fishing Frequency The more frequently a person fishes, the less likely they are to agree with this regulation type.
Variable User Group Probability of Agreement Effect
80 days 73%
120 dyas 71%
160 days 70%
Samoan 64%Non-Samoan 78%
No 73%
Enforced 78%
Unenforced 61%
CurfewA respondent in a village with an enforced curfew is more likely to agree with this regulation type than a
respondent in a village with an unenforced curfew or no curfew.
"DMWR Should Regulated During Spawning Events"
Social Education The greater the frequency of fishery education from family and friends, the more likely the respondent is to
disagree with this regulation type.
Citizenship A respondent who is a Samoan citizen is more likely to agree with this regulation type.

48
Variable User Group Probability of Agreement Effect
80 days 61%120 dyas 58%160 days 54%Samoan 50%
Non-Samoan 65%
"Minors Should Be Regulated"
Social Education
The greater the frequency of fishery education from family and friends, the more likely the respondent is to
Citizenship A respondent who is a Samoan citizen is more likely to agree with
this regulation type.
At which spatial level of management do villagers want the fishery resources to be managed
in the future?
To assess the spatial management level preferred by people for American Samoa in the
future, we asked respondents to specify which level they preferred from a given list:
“district”, “village”, “island”, “territory”, or “other”. This analysis provides the general
preference of the spatial management levels among all respondents. A majority of the total
respondents (56%) show a preference for village level management (Figure 20). Territory-
level management was the second most preferred, with 33% of the respondents’ selection.
Figure 20: Fishery Management Level Preference as a Percentage of 425 Respondents
3%3%5%
33%
56%
0%
10%
20%
30%
40%
50%
60%
District Village Island Territory Other

49
In addition to summary statistics, our initial analysis includes chi-squared analysis of spatial
management level preference among user groups. Of particular interest are the preferences
among the fishing user group divisions and age division because the preferences among these
user groups reveal a statistically significant difference (p=0.01, and p=0.06, respectively).
Within the fishing user groups, village level management is the preferred level by each
division (Figure 21). Fifty-seven percent of the above average fishers and 64% of the below
average fishers show a preference for management at the village level, while only 47% of the
non-fishers prefer the village as the spatial level of management. It is interesting to note that
Territory-level management is the second most preferred method among all fishing user
groups. In particular, the non-fishing group displays a near equal distribution between village
and territory-level management.
Figure 21: Fishery Management Level Preference by Percentage among Fishing Group*
47%
5% 3%
42%
3%
57%
9%2%
29%
3%
64%
4% 4%
28%
1%0%
20%
40%
60%
80%
100%
Village District Island Territory Other
Perc
ent o
f Fis
hing
Fre
quen
cy G
roup
Non-fisherAbove Average FisherBelow Average Fisher
*Chi-squared; p-value = 0.01
Village level management is the most preferred by each of the four age divisions; at least
49% of each age division selected village as their preferred level of management (Figure 22).
The two older age groups, (ages 31-45 and 46 and up), display the greatest preference
towards village level, with 63% of the respondents in each division.

50
Figure 22: Fishery Management Level Preference by Percentage among Age Divisions*
7%1%
40%
4%10%
3%
36%
2%4% 5%
25%
3%2% 4%
31%
1%
49%50%
63% 63%
0%
20%
40%
60%
80%
100%
Village District Island Territory Other
Perc
ent o
f Age
Div
isio
n
15-22
23-30
31-45
46 and up
*Chi-squared; p-value = 0.06
Although our initial analyses offer a description of the current preferences for spatial
management among the user group divisions, a more thorough regression analysis highlights
the factors that are influential in shaping these opinions. Perception of illegal fishing, fishing
frequency and citizenship are the significant factors in this regression analysis. The influential
factors and their predicted effect on the respondent’s opinion are listed in the Table 10. The
final model is as follows:
Probability of preferring village as the level of fishery management = 1/ (1+ e^( α0 + α
1*(Fishing Frequency) + α2*(Age) + εi))

51
Table 10: Significant Factors in Spatial Level of Management Preference
Spatial Level of Management Preference
Variable User Group
Probability Agreement with Village Management
Probability Agreement
with Territory
Management
Effect
Non-Fishers 46% 44% Below
Average Fishers 67% 26%
Fishing Frequency
Above Average Fishers 58% 30%
The more a respondent fishes, the more likely
they are to prefer village level management.
15-22 48% 41%
23-30 47% 39%
31-45 65% 24%
Age
46 and up 65% 29%
The younger the respondent, the more likely they are to have similar preferences for
village and territory management. In
contrast, the older generation displays a significant preference
for village level management.
Discussion
Current perception
Our initial analysis examined the perception of current regulations and enforcement
strictness. Forty-six of the respondents think current regulations are too lenient, while only
8% expressed that they are too strict. One interpretation of this result is that the current
management regime is perceived as inadequate by the community, implying a need for a
more comprehensive management plan for the Territory. Furthermore, as revealed in the
community use, opinions, and preferences of the fishery section, the vast majority of
respondents (90%) feel that reef fish are important for the health of the ecosystem, as well as

52
for their food needs. Therefore, people regard reef organisms as essential components of their
diet and for maintaining the overall health of the ecosystem, but acknowledge that the current
system of protection is not sufficient. Therefore, DMWR may consider this as support from
the community to develop more formalized management strategies for the reef resources.
With which types of regulations are people most likely to comply?
To assess the regulation types with which people are most likely to comply, we made the
assumption that compliance can be derived from the respondent’s level of agreement for each
regulation type. There are four regulation types with which at least 74% of the respondents
agreed. Under our assumption, these are the regulations with which most people are likely to
comply:
DMWR should regulate what is caught; 78% of respondents
DMWR should regulate where people fish; 76% of respondents
DMWR should regulate how people fish; 75% of respondents
DMWR should regulate during spawning events; 74% of respondents
There are several hypothesized reasons why these particular types of regulations received the
greatest level of agreement. It is common for people to agree with concepts and ideas with
which they are most familiar. Therefore, because these regulation types are common
management practices in other areas throughout the region and world, respondents may
associate with them, thereby increasing their agreement levels. In addition to the fact that the
regulation of what is caught is a common method of fishery management worldwide, in
American Samoa, there is currently a set of restrictions on the harvesting of giant clams,
mangrove crabs, coconut crabs, slipper lobsters, and spiny lobsters in the Territory (see
Appendix A). This may help explain the higher agreement level with the regulation on what
is caught.
The regulation of where people fish is also a method of fishery management currently in–use
throughout the Territory. There are four territorial MPAs in place, in addition to the federally
protected Rose Atoll MPA (see appendix for MPA description). Additionally, several of the
community- based fishery management plans in the Territory include regulations on where
people fish by restricting non-village members from fishing. For example, Auto and

53
Fagamalo each have restricted fishing areas in their management plans which exclude people
from outside the village from fishing in their waters. Furthermore, there appears to be a
tension between villagers and ‘outside fishers’, possibly influencing a preference for this
regulation type.
The regulation of how people fish is also a regulation type currently in-use in American
Samoa. There are several fishing gear restrictions in-place, including the ban on dynamite
fishing, poisonous substances, electrical devises, and SCUBA-assisted fishing (see Appendix
A). Due to the fact that these types of regulations are in effect on the island, they may be a
relatively familiar concept to the respondents, subsequently increasing their agreement level
with regulation on how people can fish.
Regulation during a spawning event may also be a popular type of regulation because of the
cultural significance of the spawning of the palolo. The palolo spawn once a year, during
which time they are harvested to be eaten as a cultural delicacy. Due to the importance of this
event, Samoans may want this event to be regulated as a way to prevent the over harvest of
this resource.
Although we identified the top most agreed with regulations, it is important to note that this
analysis does not consider the feasibility, management capacity, distributional effects on user
groups, enforceability, or costs associated with these regulation types. The purpose of
revealing this finding is simply to provide DMWR with the local perceptions and opinions of
regulation types and how they may be included in future management strategies.
It is also important to note that despite the fact that there is an overall agreement with each
regulation type, the existence of at least 19% of the respondents in disagreement with each
regulation should not be overlooked. Although the percentage of individuals in disagreement
with each regulation type is small, this minority could have the potential to exhibit a
disproportionate amount of non-compliance with future management strategies. The small
assemblage in disagreement needs to be taken into consideration when construction future
regulations.

54
Which factors influence people’s agreement with regulation?
Is there a difference of opinion between user groups regarding attitudes and opinions
towards fishery regulations and management policies?
To make effective management decisions DMWR can use the patterns in agreement levels
among identified user groups to facilitate improved compliance with future regulations. Our
intention with this analysis is to provide the data set for DMWR to use as a tool for making
management decisions. We found the following factors to be significant in influencing
people’s overall agreement with regulation: fishing frequency, social education, workshop
education, curfew, age group divisions, citizenship, and perception of illegal fishing 5.
Fishing Frequency
Due to the fact that the fishing user groups associate with the fishery on various levels of
dependency, their preferences are fundamental for establishing cooperative management
systems. We chose to examine differences of opinions and preferences within the fishing
user group divisions since the activities of the people who fish frequently will be most
impacted by any future regulations. Consistent with this concept, fishing frequency is a
significant factor not only in influencing overall agreement with regulations, but is also
influential in shaping the opinion of the specific regulation types (except regulation on
spawning events and regulation of minors). Holding all other factors constant, as the
frequency of fishing increases, the less likely the respondent is to agree with regulations. This
is a valid result, considering that individuals who fish most frequently desire the least amount
of restrictions on their activity. It is logical for those individuals who will be most impacted
by regulations to express the least level of agreement, as indicated by the frequent fisher
division. Because the agreement with regulation decreases with fishing frequency, it is
important to collaborate with fishers to determine the regulation strategies that will receive a
greater level of compliance in the future.
5 Factors with a p-value of less than 0.1

55
Social Education
Social education is inversely related to the level of agreement with the regulations; the greater
the frequency of fishery education from social sources, the more likely the respondent is to
disagree with all the regulation types. This relationship is true for the overall agreement level
and for all of the regulation types, (except for the regulation of when a person can fish). It is
probable that fishery education from social sources is distributed through the fishers
themselves; therefore fishers could be less likely to agree with regulation strategies in order
to maintain their current lifestyle and frequency of fishing. A possible way to increase
agreement with regulation from frequent fishers would be to focus fishery education towards
that specific user group, with the goal of influencing their opinions toward regulations.
Workshop Education
If a respondent had attended a fishery workshop, the likelihood of agreement with regulations
is greater than a respondent who did not attend a workshop. Based on this finding, fishery
workshops would also be an important strategy to increase agreement and compliance with
regulation and improve overall attitudes toward the regulation of the fishery resource.
Curfew
The absence or presence of a curfew is a significant factor in a respondent’s perception of all
types of regulations, (except the regulation of minors, regulation of how people can fish, and
the regulation of what people can fish). For overall regulation and each specific regulation
type in which curfew is significant, a respondent from a village with an enforced curfew is
more likely to agree with the regulation type than one from a village without a curfew or one
with an unenforced curfew. A probable explanation for this relationship is that the
respondents from a village with a strong traditional social structure are more accustomed to a
regulated lifestyle. Therefore, they are likely to be more accepting of regulations. Due to this
relationship, the preservation of a strong traditional structure, by means of an enforced
curfew, for example, is one viable way to encourage agreement with fishery regulations.

56
Age
In addition to the frequently significant factors of fishing frequency, social education, and
curfew, the consideration of each age division and citizenship category is important for
DMWR to appropriately accommodate the needs of fishery users currently and in the future.
Considering the rapid population growth and immigration rates, it is constructive for DMWR
to understand the preferences of management levels across the groups to make necessary
adjustments and plan for long term goals.
Age is a significant factor influencing a respondent’s agreement towards overall regulation as
well as with the specific regulations of what is caught and how people can fish. One possible
explanation for the higher agreement with regulations among the older generation (above 46
years) may be due to the fact that the older generation is familiar with a near shore fishery
that was productive during their lifetime. Consequently, individuals over the age of 46 years
may be more aware of the need for management to help replenish and recover the fish
populations, corresponding to a higher level of agreement with regulations. In contrast, the
youth of American Samoa have not been exposed to abundant fish supplies, and thus fail to
acknowledge a decrease in fish supply from that of previous years. Accordingly, this
younger generation displays a lack of agreement with all regulation types. The adjusted
behavior to scarcity of fishery resources and subsequent low expectations about productive
capability of the reef system has been described as a ‘shifting baseline’ (Pauly 1995;
Sheppard 1995). The shifting baseline syndrome, in which generations set expectations
based on direct experiences that discount experiences of previous age groups, may help to
explain the fact that younger generations agree less with regulations than older generations.
Since the frame of reference of the near shore fishery for the youth of American Samoa is
different from that of the older members, regulations overall may seem unwarranted and may
be a reason for the disagreement. Considering that the 15-22 year old age group holds the
least amount of agreement with regulations, careful enforcement attention may need to be
made toward this group in the future. Since these individuals and the opinions they hold are
the future generation of American Samoa, any potential fishery policies from DMWR may
require enhanced enforcement efforts. It is also important to consider the fact that this age

57
bracket composes roughly 20% of the total population. As such, the amount of compliance or
lack there of, will contribute substantially to the overall compliance.
Citizenship
The influence of citizenship is significant on overall regulations, in addition to regulation on
spawning events, regulation on where people can fish, and regulation of minors. For these
regulation types, a respondent who is of Samoan citizenship is more likely to agree with
regulations than a respondent who is non-Samoan. This finding indicates a general
acceptance among Samoan citizens of the need for more formalized rules and regulations of
the coral reef fishery. This pattern also highlights the fact that Samoan citizens are willing to
accept future regulations of fishing activity. In contrast, those respondents in the non-
Samoan category tend to disagree with regulations, which suggests that DMWR may need to
focus enforcement efforts and support towards visitors and immigrants to the Territory.
One possible explanation for the influence of citizenship on the specific regulation of where
people can fish may be that people of Samoan citizenship are more accustomed to the concept
of reserved fishing grounds than people of other citizenships. This form of regulation is in
place within several locations on the island and may be regarded as a familiar and tolerable
method of regulation among Samoans. As addressed earlier, many villages throughout the
Territory prohibit people from outside the village from fishing in their village waters. A
regulation on where people can fish may have been interpreted as a method of keeping the
“outsiders” out of the village waters, which would correspond to the high agreement among
Samoans and high disagreement among non-Samoans. Therefore, it is logical that people of
non-Samoan citizenship or “outsiders” reveal a disagreement with this regulation type, since
this regulation poses considerable inhibition on the amount of their fishing activity.
Perception of Illegal Fishing
The respondent’s perception of illegal fishing was significant in the overall agreement with
regulation, as well as with the individual regulation types (besides the regulation of when
people fish, spawning, and minors). While the respondent’s perception of illegal fishing

58
cannot be managed, it may reveal a significant relationship. As outlined in Table 10, if the
respondent did not give an estimate for their perception of illegal fishing, they are more likely
to disagree with the regulation type. Although many of the respondents did not give an
estimate because they either did not know or did not think that there was any illegal fishing, a
possible reason for this could also be the respondent’s reluctance to give support evidence for
a need for regulation by stating the occurrence of illegal fishing.
Other Factors
CBFMP
Residence in a village with a Community Based Fishery Management Program decreased the
respondent’s agreement with regulation of what is caught. A possible explanation for this is
related to the fact the Community Based Fishery Management Program does not include the
regulation of which types of fish are caught. Subsequently, the respondent may be less likely
to agree with the addition of this regulation type. Once again, workshop education is also a
significant factor, this time in the respondent’s agreement level with regulation of where
people fish and of how people fish; increasing the respondent’s agreement level with the
regulation.
Matai
Considering that matai members hold an influential role in the Samoan community, we
predicted a matai status to have a significant effect on a person’s agreement with regulation.
It is worth noting that in an ANOVA analysis between matai and non-matai respondents, a
statistical difference in agreement with regulations in general is observed. The respondents
who hold a matai title reveal a mean level of agreement with regulations that is greater than
the mean agreement level of non-matai. However, in our regression analyses matai status is
not a significant variable. This indicates that holding a matai title does not necessarily affect a
respondent’s agreement level with regulations although there is a statistical difference in
agreement between matai and non-matai.

59
Gender
It is interesting to note that gender is not a significant factor influencing agreement levels
among any of the regulation types, despite the fact that males are more likely to be an above
average fisher than females (as indicated by the fishing frequency regression). One possible
reason for this result may be due to the fact that a clear distinction between gender roles is not
discernible. Although men are more likely the fishers in the household, the women in the
family may be responsible for making the food choices for the family. Consequently, there is
no differentiation between males and females in terms of agreement with fishery regulation.
At what level of management do villagers want the fishery resources to be managed in the
future?
The majority of respondents reveal a preference for management of the fishery resources at
the village level. Within each user group this method of management is also the most
preferred, indicating the potential for future community-based management programs
throughout American Samoa.
As recognized previously, the preferences of the fishing user groups are essential for
establishing a successful cooperative management system. Owing to their frequent use of the
resource, a high level of noncompliance within this group would undermine the effectiveness
of the regulatory system. Furthermore, the likeliness of a respondent preferring village based
management increases with the frequency of fishing. Management at the village level, as
preferred by 57% of the above average fishing user group, would allow for a greater level of
interaction between the users of the resource and the managers; ideally leading to a higher
level of compliance.
Additionally, for DMWR to appropriately accommodate and adapt to the management needs
of current and future fishery users, consideration of each age division is important. The
higher percentage of preference for village level management by older generations may be
related to the historical reliance on coral reef resources coupled with the corresponding
relationship with the marine environment, which encouraged responsibility for the resources

60
at the village level. Regardless, an overall preference among all age groups is displayed,
which indicates that villagers want managerial responsibility of the reef resources. Therefore,
DMWR should consider the possibilities of enhancing the community based management
plans based upon these findings.
Education
Justification
Well conceived and adaptive public education programs are an integral component in
maintaining fishery resources (Veitayaki 1996). Public education programs can promote
sustainable use of the resource base and teach people to become stewards of their surrounding
environment. Educating the public on the importance of coral reefs can promote sustainable
use and protection of the reefs to increase the desire to protect and conserve marine
environment.
Management of near shore fisheries resources must be directed largely by the cooperation
between policy makers, managing agencies and villagers (Fiske 1992). Education and
outreach is a way to establish a cooperative alliance between managers and the public.
Previous studies have shown that successful educational activities have a high profile within a
community and maintain compliance in a cost efficient manner (Lemay and Hale 1989). In
addition, education has the potential to increase visitor experiences, reduce negative resource
impacts, gain support for management practices, promote public participation, and reduce
management costs (Alder 1994).
In order to provide insight into the current use of education in fishery management in
American Samoa, survey questions were asked about the sources and amounts of fishery
education received by each respondent. The objective of obtaining this data was to try to
determine how accessible fishery education is, how abundant it is, and if possible, where
there might be gaps in the imparting of fishery education to the public. This data not only
shows the current status of fishery education in American Samoa, but it also serves as a
baseline for future comparisons of the frequency and sources of education in fishery
management.

61
Where do American Samoans currently receive most of their coral reef fishery education?
Table 11 displays eight individual coral reef fishery education sources that were identified in
the survey and the percent of respondents that said they received education from each source
for each frequency category. Based on our survey, the most frequently accessed fishery
education sources (those with a frequency of most days) are TV and Radio (with 43%
respondents), newspapers (41%), and school (41%). Family, as a source of fishery education,
is also a frequently obtained source, with 37% of the respondents receiving this source most
days. The majority of respondents surveyed were not of a school going age, so amounts of
fishery education from college were expectedly low. Responses to the ‘Other’ category
included the internet and off-island information, but this is not a significant source of
education with 70% of the respondents never accessing this type.
Table 11: Frequency of Coral Reef Fishery Education from Various Sources as a Percentage of 425 Respondents.
Data corresponds to survey question 15. For individual representation of frequency of education type, see Appendix F.
School CollegeFishery
WorkshopsTV
Radio Newspapers Pamphlets Family OtherMost Days 41% 16% 6% 43% 41% 11% 37% 6%Once/Wk 12% 5% 6% 21% 16% 8% 12% 3%Once/Mo 12% 7% 11% 17% 13% 11% 14% 4%Once/Yr 8% 4% 15% 6% 4% 6% 9% 3%
Never 27% 67% 62% 13% 25% 63% 26% 70%No Answer 1% 2% 1% 0% 1% 1% 0% 14%
Figure 23 displays the average frequency in days per year of coral reef fishery education for
the broader categories consisting of:
Social Education (Family)
School Education (School and College)
Media Education (TV, Radio, Newspapers, Pamphlets)
Fishery Workshops
As can be seen, media education was received much more than social and school education.
For the category of fishery workshop attendance, responses were categorized as either having

62
attended a workshop or not. Approximately 37% of respondents reported attending at least
one fishery workshop.
Figure 23: Average Amount of Fishery Education Received (Days per Year) from
Social, School, and Media Education Sources
90118
306
0
50
100
150
200
250
300
350
Social EducationSchool EducationMedia Education
Ave
rage
Yea
rly F
requ
ency
From which sources and how frequently do user groups receive fishery education?
Answering this question involved an analysis of how the four education categories above
differed within specific demographic and user groups as defined in our “Definition of Terms”
section. The groups we chose to analyze were:
Age
Gender
Fishing Frequency
Gleaning
Matai Status
Curfew (Strength of Social Structure)
Participation in CBFM
The analysis consists of two parts: 1) simple summary statistics which compare education
amounts within each user group individually and 2) regression analysis which examines the

63
effect of each individual user group on education while considering, but holding constant, all
of the other user group categories.
User Group Summary Statistics
Age
The mean amounts of social and media education received by each age group were not
statistically different (ANOVA, p=0.11 and 0.34, respectively), which indicates that fishery
education from these sources is not directed at any particular age group. School education,
however, was statistically greater for the younger two age groups than the older two
(p=0.0003). This finding is plausible, given that younger individuals are more likely to be in
school and exposed to environmental education. Workshop attendance was also statistically
different between the age groups (Chi-Squared, p=0.07), with the younger groups attending
workshops more often than the older age groups.
Figure 24: Days of Education Received by Different Age Groups
44 4136
335
103116145
118
282
105
326
2864
283
10576
050
100150200250300350400450
Social Education School Education Media Education WorkshopAttendance (%)
Education Source
Day
s of E
duca
tion
15-22 23-30 31-45 46 and up

64
Gender
Of the four education categories, education amounts were statistically different between
males and females in social education and workshop attendance (t-test, p=0.02 and Chi-
Squared, p=0.03, respectively). The average number of days of social education received by
males was approximately 131, whereas females only received an average of 104 days.
Similarly, 42% of males had attended a fishery workshop, as opposed to 32% of females.
The difference in media and school education between males and females was not statistically
significant (t-test, p=0.44 and 0.66, respectively). This is reasonable because both school and
media education are distributed publicly without the opportunity for choice or selection.
Figure 25: Days of Education Received by Each Gender
91
42
89
300
131 104
312
32
0
50
100
150
200
250
300
350
400
Social Education SchoolEducation
MediaEducation
WorkshopAttendance (%)
Education Source
Day
s of E
duca
tion
Males Females
Fishing Frequency
In the fishing frequency division, social education was statistically different between the user
groups (ANOVA, p=0.01). Based upon this analysis, non-fishers received the least amount
of social education, and above average fishers received the most. This supports the concept

65
that fishing is a traditional family activity and that individuals who fish together learn from
one another about fishing and the coral reef environment. School education was also
statistically different among the user groups (ANOVA, p=0.09). However, the analysis
shows that school education is received the most by below average fishers, followed by above
average, and then the non-fishers. This is likely a result of a correlation between age and
fishing frequency rather than a selection for the amount of school education by below average
fishers. Media education and workshop attendance were not statistically different among the
different groups (ANOVA, p=0.59 and Chi-Squared, p=0.43, respectively).
Figure 26: Days of Education Received by Fishing User Groups
121
145
9278 87
103
020406080
100120140160180
Non-Fishers Below Average Above Average
Fishing Frequency
Day
s of E
duca
tion
Social Education School Education
Gleaning
Similar to fishing frequency, social education and school education were both statistically
different between gleaners and non-gleaners (t-test, p=0.04 and 0.02, respectively). As seen
in Figure 27, gleaners reported approximately 132 days of social education compared to 108
for non-gleaners. This result is also consistent with the idea of gleaning being a family
activity or tradition in which knowledge is passed on through the gleaning activity. Gleaners
also reported more school education than non-gleaners. Media education and workshop

66
education were not statistically different (t-test, p=0.74 and Chi-Squared, p=0.82,
respectively).
Figure 27: Days of Education Received by Gleaners and Non-Gleaners
108
132
102
82
0
20
40
60
80
100
120
140
160
Gleaners Non-Gleaners
Day
s of E
duca
tion
Social Education School Education
Matai Status
Our comparison between matai and non-matai shows that the amount of fishery education
from school received by matai is statistically lower than non-matai respondents (t-test,
p=0.02). This is likely due to the fact that most matai are not young enough to be in school.
Workshop attendance by matai, however, was statistically greater than that of non-matai
(Chi-Squared, p<0.0001). Sixty-four percent of the matai reported having been to a fishery
workshop, whereas only 32% of non-matai individuals had attended a workshop. This result
may reflect the matai sense of duty to attend public functions and their responsibility to be
educated on fishery issues. Social education and media education were not statistically
different between matai and non-matai (t-test, p=0.48 and 0.77, respectively).
Curfew

67
The amount of fishery education received from social sources and from workshops was
significantly different between the three curfew groups (p = 0.09 and 0.02, respectively). As
seen in Figure 28, the amount of social education received was highest for respondents from
villages with an unenforced curfew and lowest from villages with an enforced curfew. The
greatest percentage of respondents that had attended at least one workshop was highest for
villages with an enforced curfew and lowest for villages with no curfew at all. School and
media education were not significantly different between the curfew groups (p = 0.63 and
0.98, respectively).
Figure 28: Education Received by Respondents from Varying Curfew Types
141
39
106
42
116
27
0
20
40
60
80
100
120
140
160
Social Education Workshops
Education Source
Day
s of E
duca
tion
0
20
40
60
80
100
120
140
% o
f Res
pond
ents
who
Att
ende
d a
Wor
ksho
p
Yes, No Enforcement Yes, Enforcement No
CBFM Participation
Examining the influence of community based fishery management plans, only fishery
workshop attendance was statistically different between respondents who lived in a village
participating in the CBFM program and those who lived in villages not participating in the
program (p = 0.008). Social, school, and media education were not significant for CBFM
participation (p = 0.38, 0.75, and 0.29). For fishery workshop attendance, 55% of

68
respondents participating in the CBFM program reported attending at least one workshop. Of
those respondents not in the CBFM program, only 35% had attended a workshop.
Regression Analysis
In order to determine what factors affect the amount of fishery education a respondent
receives, we ran regressions for social, media, and workshop education. School education
was excluded from the analysis because not all members of each user group are in school. In
the regression of fishery education from media, none of the independent variables were
significant. This result corresponds with the summary statistics and further indicates that
media education is received more or less equally by members of each different user group.
The independent variables used in the education regressions were:
Age Gender Fishing Frequency Gleaning Matai Status Curfew CBFM Participation
The whole model regressions can be found in Appendix I. By removing the least significant
user groups from these whole models, we developed final models that include only those user
groups whose significance (as indicated by the p-value) was less than 0.1. For social
education, the significant user groups were Age, Gender, and Curfew. The final model is as
follows:
Social Education = a0 + Agei +Genderi + Curfewi;
Table 12 displays the marginal effects for each user group compared to a baseline assigned
arbitrarily to the first user group of each variable. These marginal effect values indicate how
much more or less social education one group receives compared to the other. For example,
people between the ages of 23-30 receive approximately 27 more days of social fishery
education than 15-22 year olds. The 31-45 year old age group receives approximately 15 few
days of fishery education than 15-22 year olds. For gender, women receive approximately 26
fewer days of social education than men.

69
Table 12: Final Model for Social Fishery Education Social Education
Variable p-value User Groups Marginal Effects Effect
15-22 Baseline 23-30 27 31-45 -15
Age 0.088
46 and up -14
People between the ages of 23 and 30 receive the most social education. People between 31
and 45 receive the least.
Male Baseline Gender 0.049 Female -26
Males receive more social fishery education than females.
No Curfew Baseline Un-enforced
Curfew 27
Curfew 0.033
Enforced Curfew -16
People from villages with an un-enforced curfew receive the most
social education. People from villages with enforced curfew receive the least social fishery
education.
For the workshop education regression, the significant user groups were Age, Matai, and
CBFM participation. The final model, in terms of the probability of attending at least one
workshop, is:
Prob(Yes Workshop) = 1 / (1 + exp(a0 + Agei + Mataii + CBFM Participationi ))

70
The probabilities of attending a workshop for each user group are given in Table 13 below.
Table 13: Final Model for Workshop Education
Workshop Education Variable p-value User
Groups Probability of Attending a Workshop
Effect
15-22 58% 23-30 65% 31-45 44%
Age 0.054
46 and up 53%
People between the ages of 23-30 are most likely to attend a fishery workshop. People between the ages of 31-45 are least likely.
Yes
72%
Matai > 0.0001
No
37%
People holding a matai title are more likely to attend fishery workshops than people without a matai title.
Yes 63% CBFM Participation
0.030
No 46%
A person in a village participating in community based management is more likely to attend a fishery workshop than a person in a village not participating in the program.
Discussion
Both the summary statistics and regressions for the education policy area indicate that media
education is not received significantly more by any particular demographic group. Therefore,
media sources might be an efficient means of disseminating fishery information to the general
public. Media sources are also currently the means by which fishery education is received
most frequently. Consequently, if media sources continue to be used to this degree, careful
consideration should go into the type of information distributed through the media.
Information about the current and future use of education as a fishery management tool can
be inferred from both the summary statistics and regression models. First, the survey results
suggest that much of the fishery education in American Samoa is reaching the people who

71
most benefit from it. On average, people who fish and glean are receiving more social and
school education than people who don’t fish or glean. The strong presence of people holding
a matai title at fishery workshops also suggests that the individuals with leadership on the
islands take an interest in the management of fisheries.
The education regressions have some other interesting results that are worth noting. First,
males receive significantly more social and workshop fishery education than females. In a
regression on factors effecting frequency of fishing (see Trends in Fishery Use Section),
males were shown to be more likely to fish than women, which suggest that males might
benefit more from fishery education than females. Despite the fact that males are more likely
to fish, women are often in charge of planning meals and therefore may have a greater say in
what is caught and when the catch is needed and performed (Lambeth et al. 2001).
Therefore, the difference in education received between genders might be an area on which
policy makers need to focus their attention.
The education regressions also show that people between the ages of 31-45 receive the least
social education and are least likely to attend workshops. This age group is composed mostly
of working adults who are less likely to fish (as seen in the Trends in Fishery Use Section)
and therefore not as concerned with or available to obtain fishery education. Alternatively, it
is possible that people in this age group are the heads of their families who pass on their
fishery knowledge to others. This, however, suggests that this age group might be the most in
need of workshop education. Through fishery workshops, attendees can gain knowledge of
both the biological and managerial aspects of the fishery from experts. Directing these
workshops to the 31-45 year old age group might be a way of improving the quality of social
education.
The connection between age, social education, and workshop education becomes particularly
important when considering the results of the regulation regressions (see Regulations
Section), which show that people with more social education are more likely to disagree with
regulations, but people who attend workshops are more likely to agree with regulations. If
American Samoa chooses to increase regulations and enforcement as a management tool,
then the nature of social education will need refining in order for those tools to be more

72
accepted. Workshops targeting the sources of social education (heads of families, village
leaders, and matai) could be a means of influencing social education.
According to the workshop education regression, the presence of a matai title was a
significant factor affecting workshop attendance. Furthermore, 64% of people holding matai
titles reported attending fishery workshops. Therefore, it appears that increasing matai
attendance at workshops may not be a significant issue to encourage village support of
fishery management. The bigger challenge is in empowering the matai and other leaders in
the villages to pass on both accurate and useful fishery knowledge to the rest of their villages
and into families. This may involve not only educating village leaders about the fishery, but
also equipping them with the tools necessary to teach that information. As leaders of their
communities, matai have the ability to positively influence the activities within their villages
and this source of power and respect should be utilized to the fullest.
A final finding from the education regressions is that people participating in the community
based fishery management program are receiving more workshop education than individuals
from villages not in the program. This was expected because the community based
management program was designed to provide participants with greater fishery knowledge
and therefore tries to provide these communities with more fishery workshop opportunities.
The results indicate that people from the CBFMP villages choose to attend the workshops,
suggesting that they take a more active interest in the fishery than people from non-
participating villages. That being said, this might be an indication that more effort needs to be
placed on providing workshops and general fishery education to villages not participating in
the CBFM program.
Limitations
Alhough the above information may be useful in shaping future fishery management in
American Samoa, there are some drawbacks that should be noted. First of all, although the
amount of education received by respondents from four different sources was analyzed, we
made no judgments as to the value of one source of education over another. For example,
even though media is an abundant source of education, we have no means of inferring how

73
much media education is needed to be the equivalent of one fishery workshop. Managers and
educators of American Samoa have the responsibility to evaluate the quality and content of
the education of each source. Similarly, the information presented above does not establish
guidelines on what should be taught. Curriculum, advertisements, or programs that are used
in fishery education will depend largely on the state of the fishery and the choice of tools that
American Samoa utilizes in its management. As such, fishery education will have to be
adaptive and responsive to the needs of the resource users.
Geographic Management
How can DMWR incorporate spatial variation in demographic and environmental factors in
order to inform fishery management strategies?
Justification
In the above sections, we outlined resource use patterns, community perceptions of
regulations, and sources of education across the island. We then used regressions for each of
these policy areas to explain some of the factors that directly influence them. In this section,
we analyze the data at a finer resolution. Specifically, we explore the variation in each policy
area across villages. We also incorporate several biophysical characteristics into the analysis
in order to present ways for managers to integrate the socioeconomic aspects of fisheries
management into their decision processes.
Geographic Information Systems (GIS) can be an extremely useful way to interpret fisheries
related information at different spatial scales. GIS allows managers to visualize the resource
as a whole and compare areas under a variety of site-specific factors. In American Samoa
this is important, as both human and coral fish populations in American Samoa are highly
spatially variable (Census 2000; Spurgeon et al. 2004). In their 2004 economic valuation of
American Samoa’s reefs, the Jacobs Engineering Group found that the benefits from coral
reef systems are distinctly location specific and vary by orders of magnitude (Spurgeon et al.
2004). Since American Samoa currently has insufficient data to create an accurate historical
baseline of the fish populations and use of the resource, we design a geographically-based

74
decision support tool that identifies the current conditions and potential management
concerns.
In this model we consider fishery resource potential, population related pressures, and
sociological information for the 34 surveyed villages. We chose the village as the level of
spatial differentiation since it is an easily identifiable and distinct management unit. This
does not, however, imply the need to manage the fisheries in American Samoa solely at the
village level.
After selecting the spatial management unit, we ran an ANOVA test on the different
socioeconomic factors to determine if there was a significant variation in the mean responses
for each village. We found that all of the variables were significantly different (p < 0.01
except for workshop education, p = 0.025). We then calculated a z-score for each of the
twelve management concerns in order to make comparisons between the values. The z-score
is the difference between each value and the mean for all villages, divided by the standard
deviation for each variable. This z-score transformation normalizes the data with a mean of
zero, to make comparison between the factors easy. That is, the z-score represents the
number of standard deviations above or below the mean value for that variable.
Subsequently, we mapped all of the z-score values using GIS to visually see the distribution
across the villages. Scaling the values in this way does not suggest that each management
concern has an equal weight for management purposes. With this tool, however, resource
managers have the ability to focus on the terms independently (e.g., choosing areas for
protection due to habitat complexity alone) or holistically (e.g., concentrating management
efforts on villages or regions with several values that are significantly different from the
mean).
The map-based model highlights the spatial variation in multiple management concerns by
identifying the areas that have significantly high or low values. The current mean values
become a baseline across the territory to which managers can compare other geographical
areas. Additionally, these values can be tracked through time to determine if there is a general
shift in the baselines. The associated map-based outputs provide visual representations of the
analyses which will potentially aid managers in identifying broader regions of concern.

75
Managers can then use this information when considering the effects of any policies in order
to anticipate the possible effects or responses in different regions. Alternatively, they can
prioritize specific locations and focus their efforts appropriately.
Management Concerns
We divide management concerns into three broad areas of interest: fishery resource potential,
population related pressure, and sociological influence. Within each category we choose
specific variables based on the available data that represent those broader concerns.
Fishery Resource Potential
We measure fishery resource potential using habitat complexity and the length of the
coastline. We select habitat complexity as a proxy for estimating fishery resource potential,
since previous studies have found that increased habitat complexity supports higher fish
diversity and biomass (McClanahan 1994). In 2004, the Jacobs Engineering Group used
habitat complexity as a substitute for calculating fisheries yield because they assumed it
represented feeding opportunities, breeding grounds, and refuge from predation (Spurgeon et
al. 2004). Additionally, habitat complexity was the only source of available information with
sufficient data that corresponds directly with fish stocks. The length of the coastline is an
important factor for each village because it is related to the amount of near shore reef area
under the jurisdiction of that village. Moreover, the marine tenure customs of the Samoan
culture gives a village ownership over the reefs directly adjacent to that village (Zann 1999).
In general, villages with higher values of fishery resource potential can be expected to have
better quality habitat for fisheries or more reef fisheries area.
Population Related Pressure
Population related pressures include both direct fishing and indirect effects of higher
populations such as non-point source pollution on the reefs. Management concerns within
this category include total population, population density, total fishing effort, per capita
subsistence fishing, and per capita recreational fishing. Population and effort are directly

76
related to the amount of harvest and impact that each village has on its adjacent reef area. For
our analysis, total fishing effort is based on average individual fishing frequencies within
each village (See Current Data section). Therefore, higher values of population related
pressures may represent greater exploitation of the reefs and the fisheries they support.
Sociological Influence
Sociological information represents how village residents might respond to different
management actions. This includes the percent of people who prefer village level
management, the average number of days in which residents receive fisheries education from
media and social sources, the percent of individuals who received fisheries workshop
education, and the average agreement with fisheries regulations. The interpretation of these
values varies with the type of management action considered. For example, higher values for
the percent of people who prefer village level management may be important when
considering potential participants in the community based fishery management program or
they may even be of more concern when implementing territory-wide regulations.
Current Data
Calculation of Variables
We derive data from three sources: 2000 DOC Census Data, 2004 NOAA island reef area
maps, and the surveys we conducted in each of the 34 villages. We calculate habitat
complexity of the near shore habitat to 30m depth through the use of GIS. Our procedures
are based on a similar analysis conducted in the Jacobs Engineering Group 2004 coral reef
valuation (Spurgeon et al. 2004). Specifically, we classify American Samoa’s habitat types
into high, medium and low complexity weighting them by a factor of 0.5, 0.35, and 0.15
respectively. This weighting method corresponds to studies of fish yields for each habitat
type (Spurgeon et al. 2004). Aggregated reef, patch reef, individual patch reef, and spur and
groove compose the high complexity habitat type, scattered coral/rock, and artificial reefs
make up the medium habitat, and rock, boulder, pavement, and rubble make up the low
complexity reef category. We calculate the total reef area for each village within a one mile

77
buffer from the shoreline and then sum the weighted values to determine overall habitat
complexity. Thus, habitat quality is correlated with the length of the coastline since the
buffer area is derived from a one mile extension from the shoreline.
The 2000 DOC Census Data provides the basis for population estimates and total fishing
effort. We use total population of people over the age of 15, which corresponds to the
surveyed population. For each individual, we multiply the population of their village by their
frequency of fishing for food. We then sum these individual estimates of fishing effort, and
divide it by the number of respondents for that village to estimate the mean total effort for
each village. Sociological information, agreement with regulations and education sources
defined in the above sections, are also incorporated in this analysis.
We use the values for each village to calculate the z-scores (Table 11) for comparison
purposes. However, one caution is that the z-scores are calculated using the standard
deviation of the available data. The result is that skewed distributions can mask the
difference in values on the other end of the spectrum due to the high variance. This is
especially a problem with the habitat and population data. For example, the large coastlines
of Ofu and Olosega skew the distribution such that the z-scores for them are several
deviations greater than the mean, while z-scores for land-locked villages such as Faleniu are
less than one standard deviation from the mean. The high levels of skewness make it
important to view values below zero with additional discernment. Consequently, we report
skewness for each variable in addition to the z-scores.
Results For all of the variables compared across villages, there are villages at least 2 standard
deviations from the surveyed mean, indicating that each variable is location specific.
However, variance of each variable does differ as mentioned in the previous section.
Several interesting results can be derived from the maps. For example, we found that the
villages where the percentage of people who preferred village level management above the
surveyed mean where located in more remote villages on the east and west ends of the main
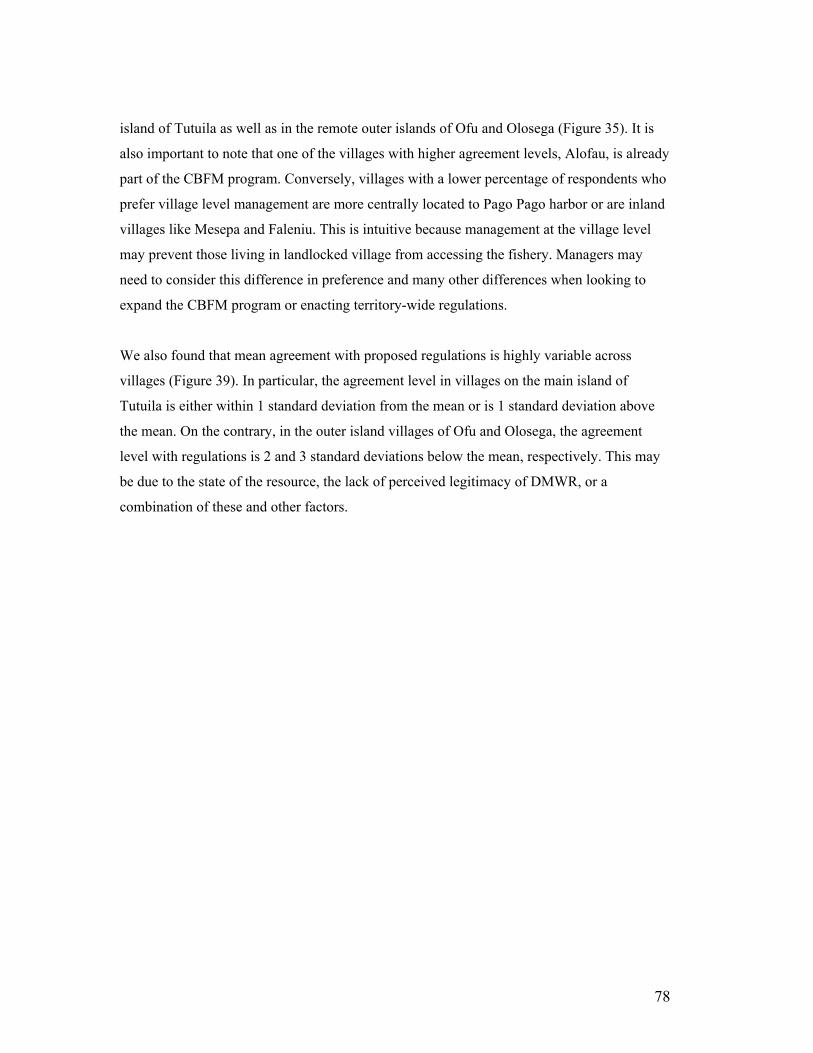
78
island of Tutuila as well as in the remote outer islands of Ofu and Olosega (Figure 35). It is
also important to note that one of the villages with higher agreement levels, Alofau, is already
part of the CBFM program. Conversely, villages with a lower percentage of respondents who
prefer village level management are more centrally located to Pago Pago harbor or are inland
villages like Mesepa and Faleniu. This is intuitive because management at the village level
may prevent those living in landlocked village from accessing the fishery. Managers may
need to consider this difference in preference and many other differences when looking to
expand the CBFM program or enacting territory-wide regulations.
We also found that mean agreement with proposed regulations is highly variable across
villages (Figure 39). In particular, the agreement level in villages on the main island of
Tutuila is either within 1 standard deviation from the mean or is 1 standard deviation above
the mean. On the contrary, in the outer island villages of Ofu and Olosega, the agreement
level with regulations is 2 and 3 standard deviations below the mean, respectively. This may
be due to the state of the resource, the lack of perceived legitimacy of DMWR, or a
combination of these and other factors.

79
Table 14: Z-scores of management concerns by village. The yellow values represent values within one standard deviation from the mean. Dark yellow, orange, red, and plum represent increasing standard deviations, while light green, dark green, and blue values are below the mean.
Village Name
Habitat Complexity
Length of Coastline
Total Population over Age 15
Population Density
Total Effort
Per Capita Fishing for
Food
Per Capita Recreational
Fishing
% of People who Prefer Village M anagement
M edia Education
Social Education
W orkshop Education
Agreement with
RegulationsAasu -0.15 0.80 -0.32 -0.64 0.14 0.48 0.04 -0.76 -0.48 0.56 -2.20 -0.74Afao -0.39 -0.66 -0.53 -0.61 -0.80 -0.41 -0.78 -0.30 -0.29 -0.09 -0.93 0.33
Afono -0.39 0.68 -0.16 -0.60 0.13 -0.25 -0.02 0.74 -0.38 1.22 1.43 -0.06Alofau 0.14 0.12 -0.13 -0.57 -0.35 -0.31 -0.94 1.06 1.85 -1.11 0.75 -0.38
Amanave 0.32 -0.10 -0.41 -0.53 0.49 1.60 0.70 1.51 0.64 -0.82 -0.23 1.05Amaua -0.12 -0.69 -0.63 -0.46 -0.34 1.46 1.93 -0.76 -0.44 0.55 0.26 0.41Amouli 0.04 0.02 -0.09 -0.56 0.85 1.10 -0.53 0.15 0.83 -1.72 0.26 -0.60
Asili -0.27 -0.55 -0.46 -0.54 -0.62 -0.30 -0.50 -0.61 -0.47 0.49 0.75 0.14Atuu -0.57 -0.80 -0.27 2.36 -0.33 -0.75 -0.04 -1.21 -1.83 -1.42 -0.23 0.48Aumi -0.23 -0.40 -0.47 -0.50 0.93 1.75 3.42 2.00 -0.79 1.04 -0.84 0.00
Aunuu 1.98 0.84 -0.17 -0.55 0.53 0.05 0.49 0.60 -0.06 -0.47 1.73 -0.60Auto -0.28 -0.70 -0.43 -0.19 0.01 0.19 0.89 -1.77 -0.47 0.76 0.07 0.53Avaio -0.36 -0.66 -0.69 -0.12 -0.95 -0.86 0.34 0.44 -1.99 -0.08 -0.59 0.88
Fagaitua -0.03 -0.42 -0.14 -0.47 -0.72 -0.88 -0.97 0.32 1.24 -1.12 -0.38 0.99Fagalii -0.35 -0.28 -0.47 -0.51 -0.72 -0.49 -0.65 0.15 -0.27 0.58 0.26 1.12
Fagamalo -0.30 0.92 -0.71 -0.56 -0.89 0.63 0.90 0.15 -0.70 0.41 2.71 -0.45Fagatogo -0.57 -0.10 2.02 -0.39 3.88 -0.42 -0.08 -0.76 -0.93 -0.70 1.24 0.41
Failolo -0.23 -0.48 -0.62 -0.01 -0.56 1.98 -0.59 0.38 0.86 -0.52 -0.36 -0.47Faleniu -0.58 -0.90 1.66 -0.35 1.21 -0.56 -0.90 -2.12 -0.89 -0.24 -0.72 0.26Futiga -0.13 0.94 0.19 -0.58 -0.72 -0.85 -1.23 -0.30 1.33 -1.01 -0.72 0.19
Iliili -0.43 -0.21 2.46 -0.28 0.27 -0.93 -1.10 -1.66 1.24 -0.93 0.75 0.05Leloaloa -0.52 -0.41 -0.12 0.75 -0.17 -0.46 -0.49 0.15 0.10 0.15 -0.23 -0.38
Leone 0.39 0.15 3.78 -0.25 2.43 -0.71 -0.93 -0.10 1.01 -0.36 0.07 0.40M alaeimi -0.57 -0.90 0.54 -0.52 0.19 -0.71 -0.69 -0.76 0.71 0.49 -0.23 -0.74M asefau -0.21 1.44 -0.22 -0.50 0.00 -0.02 -0.28 1.06 0.25 -0.84 1.73 0.84M atuu -0.49 -0.59 -0.26 0.30 -0.50 -0.64 -0.57 -0.30 -0.05 0.04 0.26 0.84M esepa -0.58 -0.90 -0.20 0.10 -0.63 -0.89 -0.69 -1.21 0.16 2.15 0.26 -0.95
Ofu 4.38 3.56 -0.39 -0.57 0.00 0.16 0.53 1.06 0.42 0.87 -0.23 -2.96O losega 2.34 2.63 -0.53 -0.49 0.56 3.26 1.76 1.06 0.57 2.14 -0.72 -3.24O nenoa -0.27 -0.35 -0.54 0.11 -0.53 -0.35 0.58 1.51 1.57 -1.61 -1.22 0.76
Pagai -0.52 -0.72 -0.64 2.51 -0.78 -0.31 0.49 0.60 1.05 -0.29 -1.22 -0.10Sailele -0.17 -0.19 -0.63 0.01 -0.76 -0.61 0.89 0.32 -1.48 1.76 0.52 -0.26Utulei -0.49 -0.44 0.28 1.89 -0.39 -0.96 -0.78 -1.21 -1.88 -0.47 -0.72 1.55
Utumea East -0.36 -0.68 -0.67 3.33 -0.88 0.01 -0.20 0.60 -0.42 0.58 -1.22 0.69Skewness 4.89 2.11 2.53 2.27 2.34 1.68 1.56 -0.23 -0.17 0.43 0.59 -1.64
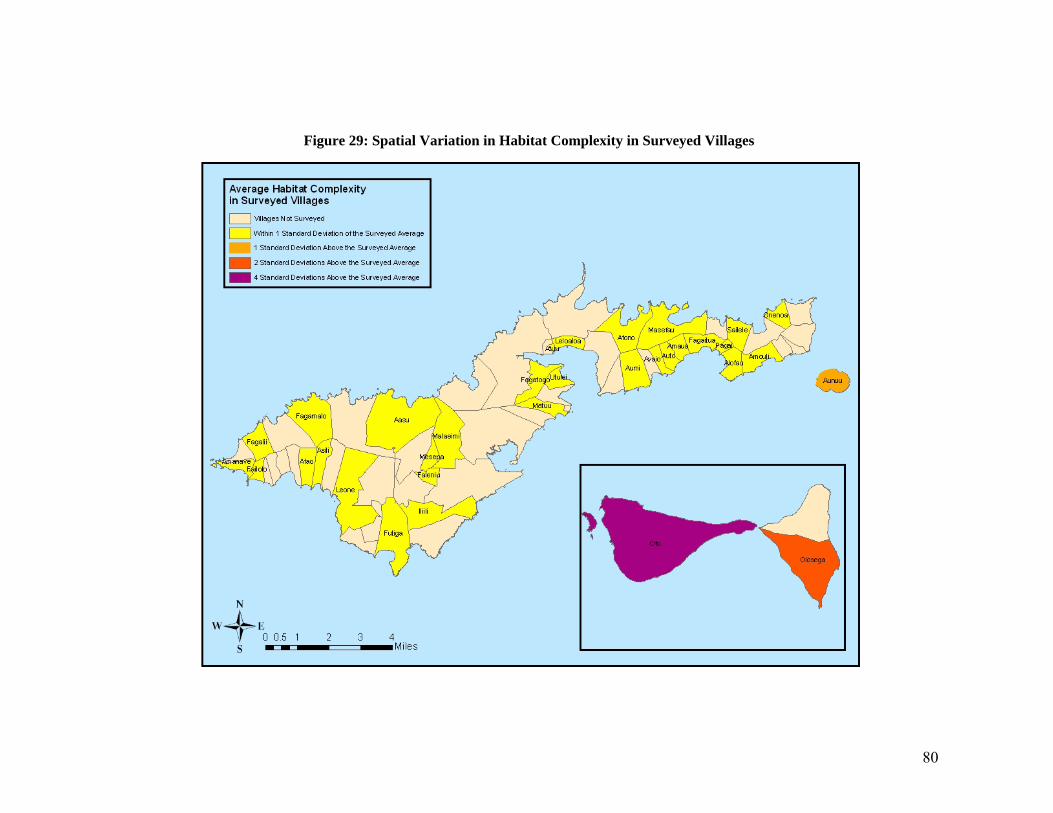
80
Figure 29: Spatial Variation in Habitat Complexity in Surveyed Villages

81
Figure 30: Spatial Variation in Total Population over 15 years old in Surveyed Villages

82
Figure 31: Spatial Variation in Population Density in Surveyed Villages

83
Figure 32: Spatial Variation in Total Fishing Effort in Surveyed Villages

84
Figure 33: Spatial Variation in Per Capita Subsistence Fishing Frequency in Surveyed Villages

85
Figure 34: Spatial Variation in the Per Capita Recreational Fishing in Surveyed Villages

86
Figure 35: Spatial Variation in the Percentage of People Who Prefer Village Level Fishery Management

87
Figure 36: Spatial Variation in the Amount of Fishery Education Received from Media Sources in Surveyed Villages

88
Figure 37: Spatial Variation in the Amount of Fishery Education Received from Social Sources in Surveyed Villages

89
Figure 38: Spatial Variation in the Amount of Fishery Education Received at Workshops in Surveyed Villages

90
Figure 39: Spatial Variation in the Average Level of Agreement with Possible Fishery Regulations in Surveyed Villages

91
Analysis
Interpretations from the model
Our spatial analysis model can provide useful insight into the interaction between fishery users in
each village and their resources. For example, Ofu and Olesega have the highest reef complexity,
greater than average social and media education, and average to above average per capita effort
both for food and recreation. However, their residents have by far the lowest mean agreement
with regulations. One explanation for this is the fact that people living on these more remote
islands depend heavily on their fisheries and do not want them regulated, especially since their
high quality habitat does not imply a current threat of overexploitation. Moreover, high
proportions of the populations prefer village level management, and so due to their remote
location they may prefer to manage their near shore fisheries themselves rather than be subject to
territory-wide regulations.
Adjoining villages, Auto and Amaua share authority of the reefs under the Community Based
Fishery Management Program. Both villages display lower than average percentages of people
who prefer village level management, while only Auto is statistically significant different from
the Territorial mean (Table 14). Additionally, these two villages have lower levels of workshop
education and higher agreement with DMWR regulations than the two other CBFMP villages that
were surveyed (Alofau and Fagamalo). Based on this data, DMWR may want to evaluate the
effectiveness of the community management program in Auto/Amaua.
Faleniu is a land-locked village with a high population density. However, due to its relatively
large population, Faleniu has a high total fishing effort. The high level of effort implies that the
residents must fish in other villages, which may increase the impacts on the fisheries in those
areas. Since residents do not have tenure over their own resource and they do not want to be
excluded from fishing by another village’s restrictions, it is logical that a low proportion of the
community prefers fisheries management at the village level. Moreover, the residents have a
greater than average agreement with regulations, which suggests that they may depend on the
regulations of DMWR to protect their right to fish.

92
All of the villages with greater than average populations (Fagatogo, Faleniu, Iliili, Leone,
Maleimi, and Utulei) display lower than average per capita fishing effort. This could be due to a
shift towards a cash economy and away from subsistence fishing (Coutures 2003). That is, in
villages with larger populations and more commerce, residents may be more likely to buy foods
and make substitutions for fish they have caught. However, due to the high populations, some of
the villages (Leone, Fagatogo and Faleniu) have very high total effort. Managers should consider
these effects of population growth on a village’s fishery harvest.
The above examples demonstrate different ways in which managers can use the spatial analysis
model to examine various components of the near shore fisheries in American Samoa. Managers
can use results developed from the model to estimate the effects of future management actions on
individual villages, appraise the success of specific policy on specific villages, assess how
villages may be affected by the activities of other villages, and predict the effects of territory-
wide trends based on the current spatial variability. Additionally, managers can examine either
the variability of a specific management concern across all villages (columns in Table 14), or they
can distinguish the interactions of different management actions within villages (rows in Table
14).
Limitations of the model
While the spatial analysis model may prove to be a useful tool for DMWR, the lack of historical
trends and available data limit its effectiveness. First, the current model only calculates z-scores
for surveyed villages, as they are the only ones with all of the available data. Additionally, the
model does not place any qualitative value on the current mean conditions. That is, if the total
subsistence fishing effort is high compared to the historical effort or compared to other Pacific
Island nations, it does not take this condition into account. Likewise, the model is also limited in
determining whether or not the current mean effort is too high for the fishery to support.
Managers must, therefore, incorporate the current spatial variation with their knowledge of the
current conditions compared to other regions or time periods. Finally, future additional data
including water quality, fish biomass, fish diversity, reef health, and direct fishing effort by
village can help to better quantify the fishery resource potential and its use.

93
Extensions and future analysis
As shown in the previous section, using basic data about the social and environmental factors and
measurements of the use of the fishery, local managers can determine priority geographical areas
for fishery management policy development. Although a one-time analysis is useful in the short-
term, it does not provide long-term trends about geographically important areas, nor can it be
employed to create a comprehensive model for future geographic policy development. Therefore,
an important component when developing long-term fishery management strategies is
determining how changes in social and environmental factors and fishing frequency will vary
spatially. Meaningful decisions regarding the geographically important areas for fishery
management policy development can be made as new environmental and socioeconomic data
become available. This, in turn, facilitates the development of long-term fishery management
strategies that are spatially adaptive to changing environmental and socioeconomic data.
In the context of the coral reef fisheries in American Samoa, knowledge of how social and
environmental factors influence different geographical areas is especially important given the
rapidly increasing population, the dynamic socioeconomic situation, and the relatively large
subsistence population. A spatial model that adapts to changing socioeconomic trends, cultural
practices, and environmental factors is essential in creating effective long-term management
strategies for coral reef fisheries. With this model, DMWR can use existing data to determine the
areas towards which they should focus long-term policy development.
A fully comprehensive model in which the direction and magnitude of all social and
environmental factors are known is beyond the scope of this study. However, using regression
analysis, we determined several important socioeconomic factors that influenced different types
of fishing frequency as well as people’s opinions of possible fishery regulations. In addition,
several studies have been published regarding how different social and environmental factors
affect coral reef ecosystems (Fiske 1992; McCook 1999).

94
Using our results and evidence from previous studies, we constructed a conceptual model that can
be used to prioritize geographical areas for fishery management policy development in the future
(Figure 40). The model below illustrates socioeconomic and environmental factors we found to
be important in our regression analysis in green along with a corresponding direction of
influence. Factors in aqua are subjective, in that they may be measured differently or may contain
other information not captured in our analysis. For example, environmental factors may also
include land use adjacent to the coral reefs or the amount of pollutants. Those figures in red are
those that we chose to be important but which lack sufficient data to determine the direction of
influence. In other words, they represent gaps in data that are needed for a more complete
analysis of the state of fishery resources in particular geographical areas. In summary, managers
can use this model to visualize some of the complex interactions between social and
environmental factors in order to effectively prioritize management areas of concern.

95
Figure 40: Conceptual Model for Geographic Prioritizations

96
Conclusions This study aims to inform American Samoa’s Department of Marine and Wildlife Resources
about the socio-economic conditions related to their nearshore coral reef fisheries. We conducted
a community survey to collect valuable baseline data related to fishery use, regulations, and
education. We summarized the results in graphs and utilized basic statistical tests to determine
the differences in perceptions of regulations and sources of fishery education among user groups.
We then ran multivariate regressions to determine the factors that explain the user group
differences. Next, we normalized the data and created maps that display the regional distribution
of fishery resource pressures and community opinions. Finally, we developed a conceptual
model of how socio-economic information fits into the design of fishery management strategies.
We found that American Samoan residents value the reef highly for ecosystem health and
subsistence fishing. However, nearly half of the residents never engage in fishing, and only a
small fraction are so dependent on the reef that they fish more than twice a week. Individuals in
their twenties were more likely to fish than other age groups, and males were much more likely to
engage in fishing activities. Other factors that increased the likelihood that an individual fishes
include access to the fishery, residence in a village with an unenforced curfew, and Samoan
citizenship. These findings reveal how much subsistence fishing occurs and which user groups
are most likely to fish, which is important in identifying who is most dependent on the reef and
who is most likely to be affected by regulation.
In general, we discovered that American Samoans favored fishery regulations. Nearly half of the
survey respondents believed that fishery regulations are too lenient. In terms of the types of
regulations with which individuals are in agreement, respondents agreed the most with
regulations on what is caught, where people fish, how people fish, and during spawning events.
Additionally, most people, especially people who fish, matai, and Samoan citizens, stated that
they prefer management at the village level. Despite the fact that the majority of respondents
favored fishery regulations, at least one fifth of the respondents disagreed with the role of DMWR
in regulating the fishery. Overall disagreement with regulations was correlated to residents of
villages without an enforced curfew, individuals without a matai title, above average fishers, and

97
increased social fishery education. These results are valuable because they suggest which
regulations and which user groups might have the highest level of compliance.
In terms of education, media sources reached the most people most frequently, and the media did
not favor any user groups over another. Workshops, however, were more highly attended by
matai and participants in the community based fishery management program. These findings are
important because people who attended workshops were more likely to agree with regulations
than those who did not attend a workshop. Social fishery education, on the other hand, was
received more by males and people who fish. Interestingly, people between the ages of 31-45
received the least social education and were least likely to attend workshops. The understanding
of the distribution of fishery education is important because it assists in planning how to design
future fishery education programs and disseminate information efficiently.
We found that there is significant spatial variation in perceptions and opinions about fishery
management and education. Furthermore, when sociological factors are combined with data of
fishery use and potential, we found that managers could potentially analyze the effectiveness of
fishery management decisions at the regional or village level. For example, we discovered that
the remote villages of Ofu and Olesega have the highest reef complexity and average to above
average per capita effort, but their residents have the lowest mean agreement with DMWR
regulations and higher proportions of the populations prefer village level management.
Additionally, we learned that of the members of the Community Based Fishery Management
Program, Auto and Amaua have lower than average percentage of people who prefer village level
management, lower levels of workshop education, and higher agreement with DMWR regulations
than Alofau and Fagamalo. Regarding fishing effort, we noticed that villages with greater than
average populations display lower than average per capita fishing effort, but many have
significantly higher than average total effort. Additionally, land-locked villages, such as Faleniu
may impact adjacent villages’ fisheries due to additional population pressure. By analyzing
multiple fishery influences and visualizing the data with GIS, DMWR can improve its ability to
identify areas of management concern.

98
Use of the Results
Human activities are the source of many coral reef threats and their activities are ultimately
affected by any policy implementation. Thus, it is important to incorporate community input and
anthropogenic influences into any decision making process. This research provides valuable
information regarding socio-economic aspects of nearshore coral reef fisheries management in
American Samoa. It highlights current conditions and explains significant influences in fishery
use, education, and regulatory perceptions. Moreover, it proposes a spatially explicit model of
resource availability, resource use, and sociological concerns. Finally, it presents a conceptual
representation of how this information fits into the broader scope of fisheries policy development.
By analyzing the sociological component of fisheries in American Samoa, this research provides
beneficial decision support for fisheries managers.
The socio-economic information provided enables coral reef managers to integrate stakeholder
concerns and interests into the process, and to determine the effects of policy decisions on those
stakeholders. Specifically, it identifies the current opinions towards existing regulations and
enforcement, characterizes perceptions of regulations among user groups, determines the
availability and accessibility of fishery education, explores the importance of spatial variation in
management concerns, and demonstrates how this information should be integrated into policy
development to allow resource managers to make more informed decisions towards the fisheries.
Before developing solutions, fisheries managers must first comprehend the problem, which in this
case, requires a thorough measurement of the use of the fishery. After determining the
dependence on the resource, managers must assess the benefits of different management
alternatives. Knowledge concerning perceptions of current and proposed regulation strategies
present managers with an idea of how much opposition they may receive during implementation
and enforcement of regulations. Understanding where different user groups receive fishery
education and how it affects their opinions of the resource is vital to developing an effective
education program that promotes conservation. Additionally, analyzing information spatially
assists managers in identifying regional concerns and targeting specific geographic areas.

99
This document provides a means of support by informing policy makers of the sociological
concerns and makeup of the local residents. While the findings of this report are instructive, they
still must be balanced with other available information regarding the coral reef resources in
American Samoa. The combination of scientific research with local knowledge is critical in
making educated decisions about the best policy for American Samoa. Furthermore, management
must take into account effects that extend beyond direct extractive use. In future management
decisions, socio-economic data can be combined with knowledge of biophysical aspects of the
reef ecosystems in order to create a comprehensive fishery management plan for the territory.

100
Appendices Appendix A: Summary Fishing Regulations
Summary of current near shore fishing regulations in American Samoa (ASCA §24.0902-
24.0945)
Type of Regulation Regulation Ban on Dynamite and Explosives
Ban on poisonous substances Ban on electrical devices Banned Methods
Ban on SCUBA-assisted fishing Restrictions on
Hand nets Hand net or scoop may not be larger than 3 ft. in
diameter Restrictions on
Cast nets Cast or throw nets may not have a stretched mesh
size of less than .75 inches Gill nets may not have a stretched mesh size of less
than 1.5 inches Gill nets may not have a length of more than 700 ft.
(singly or in series) Gill nets may not be deployed with 50 feet of
another gill net or weir Gill nets may not be abandoned or discarded in the
water Gill nets may not be deployed in a way that violates
territorial or Coast Guard regulations or causes a navigation hazard
Ban on drift gill nets Gill nets may not be used below a depth of 60 feet
Restrictions on Gill nets
Gill nets must be checked every 3 hours and cleared of fish and debris
Restrictions on Seines
Seines, surround nets, and drag nets may not have a stretched mesh size of less than 1.5 inches, with the
exception of traditional nets made from natural materials
Restrictions on Fish weirs The use of fish weirs require a permit
Fish and shellfish traps may not exceed 6 feet in any linear dimension
Fish and shellfish traps must be checked and emptied every 24 hours
The deployment of fish or shellfish traps may not pose a navigation hazard
Gear Restrictions
Restrictions on fish and shellfish
traps
Fish and shellfish traps may not be abandoned or discarded in the water

101
A permit is required for commercial use of fish and shellfish traps
Restrictions on habitat
destruction
Ban on willful destruction of corals and other fish habitat
Coral may not be harvested at a depth less than 60 feet Coral
Commercial harvest or coral requires a permit Giant Clams must be at least 7 inches across the
longest part of the shell to harvest Giant Clams that are consumed must have meat still
attached until the fishermen is home to facilitate measurement
Giant Clams that are sold or imported must have meat still attached to facilitate measurement
Giant Clams
Restrictions on giant clam harvesting do not apply to aquaculture clams
Shells Commercial harvest of shells requires a permit Egg-bearing Mangrove crabs may not be possessed
taken, sold, imported or exported Mangrove CrabsMangrove crabs must be at least 6 inches in length
across the longest part of the back to harvest Egg-bearing Coconut crabs may not be possessed
taken, sold, imported or exported Coconut crabs releasing larvae into the water may
not be interfered with Coconut crabs must be at least 3 inches in length
across the longest part of the back to harvest
Coconut Crabs
Regulations apply to marine and terrestrial areas Egg-bearing Slipper Lobsters may not be possessed
taken, sold, imported or exported Slipper Lobsters Spears or snagging devices may not be used for
catching Slipper Lobsters Egg-bearing Spiny Lobsters may not be possessed
taken, sold, imported or exported Spiny Lobsters must be at least 3.125 inches from the leading edge of the carapace to the rear edge of
the carapace top harvest
Species Specific
Restrictions
Spiny Lobsters
Spiny Lobsters taken, imported, or sold must be whole to facilitate measurement
License Commerical Fishing
Any and all commercial fishing activity requires a license

102
Appendix B: Map of MPA Locations Marine Protected Areas in American Samoa (Riolo DMWR 2005)

103
Appendix C: Federal MPA Characteristics Characteristics of Federal Marine Protected Areas (MPAs) in American Samoa
MPA Year Established Fishing Regulations Management Agency
Rose Atoll National Wildlife
Refuge (RANWR)
1973 No fishing activity allowed; visitation requires a permit
Fish and Wildlife Service (FWS)
Fagatele Bay National Marine
Sanctuary (FBNMS)
1986
No fishing activity allowed in Subzone A; no commercial
fishing or use of fishing poles, handlines, or trawls in
Subzone B
National Marine Santucary Program
National Park of American Samoa 1993
Only tradition fishing methods allowed; no commercial fishing
National Park Service (NPS)

104
Appendix D: Territorial MPA Characteristics Characteristics of Territorial Marine Protected Areas (MPAs) in American Samoa (ASCA §
18.0214 and ASCA § 26.0221)
MPA Year Established Fishing Regulations Management Agency
Vaoto Territorial Marine Park 1994
Ban on fishing activity except by residents of the island of
Ofu
Department of Marine and Wildlife Resources
(DMWR)
Pago Pago Harbour Special
Management Area
1980
None; Designation protects habitat from land-based
threats like sedimentation and habitat destruction
Department of Commerce Coastal Management Program (ASCMP)
Leone Pala Special
Management Area
1990
None; Designation protects habitat from land-based
threats like sedimentation and habitat destruction
Department of Commerce Coastal Management Program (ASCMP)
Nu'uuli Pala Special
Management Area
1990
None; Designation protects habitat from land-based
threats like sedimentation and habitat destruction
Department of Commerce Coastal Management Program (ASCMP)

105
Appendix E: Community MPA Characteristics Characteristics of Co-Managed and Self-Managed Marine Protected Areas (MPAs) in American Samoa
(CBFMP village Management Plans 2005)
MPA Year Established Fishing Regulations Management Agency
Alofau Community-based
Reserve 2001
Fisherman from neighboring villages may not be present in
village reef area; violators taken to court and fined
Co-management between village council and DMWR Community Based Fisheries
Management Program (CBFMP)
Aua Community-based Reserve 2002
Village fines for violation of territorial regulations; ban on
fishing by fisherman fromneighboring villages,
punishable by a fine
Co-management between village council and DMWR Community Based Fisheries
Management Program (CBFMP)
Auto and Amaua Community-based
Reserve 2003 No fishing of any kind
Co-management between village council and DMWR Community Based Fisheries
Management Program (CBFMP)
Fagamalo Community-based
Reserve 2003
No fishing activity in near shore area or streams; boats in this area
are seized and violators are fined, their fish is confiscated
and they are required to feed the village; fishing for traditional events requires approval by
village council
Co-management between village council and DMWR Community Based Fisheries
Management Program (CBFMP)
Masuasi Community-based
Reserve 2002 Ban on fishing by fishermen
from neighboring villages
Co-management between village council and DMWR Community Based Fisheries
Management Program (CBFMP)
Poloa Community-based
Reserve 2001 Ban on fishing by fishermen
from neighboring villages
Co-management between village council and DMWR Community Based Fisheries
Management Program (CBFMP)
Vatia Community-based
Reserve 2001
Village fines for violation of territorial regulations; ban on
fishing by fisherman fromneighboring villages,
punishable by a fine
Co-management between village council and DMWR Community Based Fisheries
Management Program (CBFMP)
Alega Reserve N/A Ban on fishing by fishermen from neighboring villages Self-enforced by villagers

106
Appendix F: Sample Survey 1.
Age Gender
2. I prefer to eat the following type of fish. Circle only ONE: fresh tuna bottom fish fish of the reef No preference No fish Other If you chose other, please specify_______________________________ 3. I prefer to eat the following type of figota. Circle only ONE: Lobster Giant Clam Palolo No preference No figota Other If you chose other, please specify_______________________________ 4. How much do you agree with the following statement? Over the next twenty years, I would rather eat reef fish instead of invertebrates: Agree Somewhat Agree Neither Agree nor Disagree Somewhat Disagree Disagree
The remainder of the survey refers strictly fish of the reef 5. How many times a month do you do the following? Catch fish and/or shellfish for my family to eat ____/mo Glean for fish and/or shellfish for my family to eat ____/mo Buy fish and/or shellfish for my family to eat ____/mo Buy fish and/or shellfish to resell to make money ____/mo Sell fish and/or shellfish to make money ____/mo Catch fish and/or shellfish for enjoyment ____/mo Eat fish and/or shellfish for cultural purposes ____/mo 6. How much do you agree with the following statement? Over the next twenty years, I would prefer to eat farmed reef fish and/or shellfish instead of fish and/or shellfish caught on the reef Agree Somewhat Agree Neither Agree nor Disagree Somewhat Disagree Disagree 7. How much do you agree with the following statement? I prefer to eat imported reef fish and/or shellfish instead of fish and/or shellfish caught on the reef of American Samoa? Agree Somewhat Agree Neither Agree nor Disagree Somewhat Disagree Disagree

107
8. Over the next twenty years, which species of fish and/or shellfish will be most important to you for the following uses? (Write "none" if you do not plan to use fish and/or shellfish for the given use).
Use Important Species Of the species listed, which is the most important?
Catch for food
Buy in market
Catch for fun
Ceremonies and traditional
events
Maintaining a healthy
ecosystem
9. In the future how would you like DMWR to formulate the rules for fishing the coral reefs? According to village According to district According to island Territory wide Other If you chose other, please specify:______________________________________________________ 10. Out of every 100 days coral reef fishing occurs in American Samoa, how many of those days do you think coral reef fishermen are involved in illegal fishing activity? 11. How important to you are the following future uses of reef fish and shellfish? Check ONE for each use.
Use Important Somewhat Important Neutral Somewhat
Unimportant Unimportant
To catch for food To purchase from markets and restaurants To sell to markets and restaurants to make money To catch for fun To use for traditional and cultural ceremonies To catch for the aquarium trade To maintain a healthy ecosystem

108
12. DMWR wants to manage the reef fisheries. We would like to find out how the community feels about each of the following regulations. How much do you agree with the following statements? Check ONE for each statement.
Agree Somewhat Agree Neutral Somewhat
Disagree Disagree
DMWR should regulate who is allowed to fish
(permits, licenses)
DMWR should regulate what kind of fish and/or
shellfish is caught
DMWR should regulate what is done with the catch after it is caught
DMWR should regulate when people can fish
DMWR should regulate where people can fish
DMWR should regulate how people can fish (gear
regulations and boat regulations)
13.
Use Agree Somewhat Agree Neutral Somewhat
Disagree Disagree
DMWR should regulate fishing during fish and/or
invertebrate spawning events
Fishing regulations should be placed on
fishing for elders
Fishing regulations should be placed on
individuals younger than eighteen

109
14. DMWR wants to find out how the community feels about current regulations and enforcement efforts. Please complete the following sentences by checking the appropriate box. Check only ONE.
Too Strict
About Right
Too Lenient
Current coral reef fishing regulations are
Current enforcement of coral reef fishing regulations is
15. How often have you received education regarding fishing in coral reefs from the following sources?
Education Type Most Days
Once a week
Once a month
Once a year Never
School College
Fishery Workshops Television/Radio
Newspapers Pamphlets
Family Other (please specify)
16. What is your household income range per year? <$7500 $7500-$14999 $15000-$25000 >$25000 17. How many people live in your household? 18. Do you hold a matai title? If yes, please specify___________________________ 19. Where were you born? 20. What is your citizenship?

110
Appendix G: Fishing Frequency Regression
The effect of various factors on a respondent’s fishing frequency was analyzed using a nominal
logistic regression and an α value of 0.10. Results of this regression show that the variables of
Age, Gender, Curfew, CBFM Participation, Coastline, and Citizenship were statistically
significant. The R2 value for the model equaled 0.11.
Total Fishing Frequency (subsistence and recreation combined)- Whole Model
Table 1: Significance of Hypothesized Variables in Explaining Fishing Frequency
Variable Type of Variable Probablity>Chi Squared Age Nominal 0.1158
Gender Nominal 0.0012 Matai Nominal 0.8367
Curfew Nominal 0.0004 CBFM Participation Nominal 0.0003
School Education Continuous 0.2838 Media Education Continuous 0.4039 Social Education Continuous 0.6777
Workshop Education Nominal 0.2896 Habitat Complexity Continuous 0.7182
Coastline Continuous 0.0526 Population Density Continuous 0.5981
Citizenship Nominal 0.0288 Income Ordinal 0.8598
Total Fishing Frequency (subsistence and recreation combined)- Final Model
Table 2: Parameter Estimates for Final Model of Factors Affecting the Frequency of Fishing
Variable Estimate Probability >Chi Squared
Intercept 0.06133088 0.8373 Age[A] -0.2018115 0.3185 Age[B] -0.7316773 0.0011 Age[C] 0.49385122 0.0236
Gender[Female] 0.31099562 0.0112 Curfew[No] 0.28042923 0.1450 Curfew[Yes] 0.33389167 0.0522
CBFM Participation[0] 0.07576776 0.7306 Coastline -0.0000608 0.1992
Citizenship[0] 0.35508089 0.0625 Intercept -0.1225143 0.6993

111
Variable Estimate Probability >Chi Squared Age[A] -0.5280804 0.0255 Age[B] -0.1106515 0.6044 Age[C] 0.5850785 0.0115
Gender[Female] -0.4161254 0.0022 Curfew[No] 0.11778012 0.5807 Curfew[Yes] -0.5581812 0.0053
CBFM Participation[0] -0.7314486 0.0005 Coastline 0.0000707 0.0644
Citizenship[0] -0.1049679 0.6563 Estimates for log odds of 0/Below Average, Above Average/Below Average
The effect of various factors on a respondent’s subsistence fishing frequency was analyzed using
a nominal logistic regression and an α value of 0.10. Results of this regression show that the
variables of Age, Gender, Curfew, Citizenship, and Coastline were statistically significant. The
R2 value for the model equaled 0.15.
Subsistence Fishing-Whole Model
Table 3: Significance of Hypothesized Variables in Explaining Frequency of Subsistence Fishing
Variable Type of Variable Probability>Chi Squared
Age Nominal 0.1660 Gender Nominal 0.0000 Matai Nominal 0.3901
Curfew Nominal 0.0007 CBFM Participation Nominal 0.4927
School Education Continuous 0.5656 Media Education Continuous 0.8671 Social Education Continuous 0.8418
Workshop Education Nominal 0.9702 Habitat Complexity Continuous 0.0757
Coastline Continuous 0.0282 Population Density Continuous 0.9471
Citizenship Nominal 0.0509 Income Ordinal 0.8715

112
Subsistence Fishing-Final Model
Table 4: Parameter Estimates for Final Model of Factors Affecting Subsistence Fishing
Variable Parameter Estimate Probability>Chi Squared Intercept 1.14188169 <.0001 Age[A] 0.00071754 0.9973 Age[B] -0.4641745 0.0388 Age[C] 0.31863292 0.1785
Gender[Female] 0.45035631 0.0005 Curfew[No] 0.25179765 0.2279 Curfew[Yes] 0.00400197 0.9816
Coastline -0.0001192 0.0110 Citizenship[0] 0.35293756 0.0969
Intercept -0.0481393 0.8766 Age[A] -0.44981 0.0707 Age[B] 0.10799993 0.6330 Age[C] 0.3616139 0.1547
Gender[Female] -0.4423426 0.0027 Curfew[No] -0.0266283 0.9075 Curfew[Yes] -0.5218973 0.0054
Coastline 0.00002397 0.5577 Citizenship[0] -0.1639686 0.5265 Parameter estimates for log odds of 0/Below Average, Above Average/Below Average
The effect of various factors on a respondent’s fishing frequency was analyzed using a nominal
logistic regression and an α value of 0.10. Results of this regression show that the variables of
Curfew, CBFM Participation, Coastline, Social Education, and Population Density were
statistically significant. The R2 value for the model equaled 0.10
Recreational Fishing-Whole Model
Table 5: Significance of Hypothesized Variables in Explaining Frequency of Recreational Fishing
Variable Type of Variable Probability> Chi Squared
Age Nominal 0.1492 Gender Nominal 0.6799 Matai Nominal 0.1065
Curfew Nominal 0.4711 CBFM Participation Nominal 0.0038
School Education Continuous 0.0475

113
Variable Type of Variable Probability> Chi Squared Media Education Continuous 0.5818 Social Education Continuous 0.3195
Workshop Education Nominal 0.1877 Habitat Complexity Continuous 0.5617
Coastline Continuous 0.2963 Population Density Continuous 0.0538
Citizenship Nominal 0.0487 Income Ordinal 0.9896
Recreational Fishing-Final Model
Table 6: Parameter Estimates for Final Model of Factors Affecting Recreational Fishing
Variable Parameter Estimate Probability>Chi Squared Intercept 0.54691858 0.0569
Curfew[No] 0.06407676 0.7474 Curfew[Yes] 0.28238029 0.1189
CBFM Participation[0] 0.44102144 0.0476 Social Education 0.00034072 0.7191
Coastline -0.0000658 0.1394 Population Density -11.611066 0.8692
Intercept -0.4355486 0.1725 Curfew[No] -0.3934154 0.1219 Curfew[Yes] 0.28303461 0.1839
CBFM Participation[0] -0.1913102 0.3956 Social Education 0.00245276 0.0189
Coastline 0.00005535 0.1969 Population Density 128.692649 0.1116
For log odds of 0/Below Average, Above Average/Below Average

114
Appendix H: Regulation Regressions
Part 1: Overall Agreement
The effect of various factors on a respondent’s overall agreement with the regulation types (the
sum of all the regulations with which the respondent agreed) was analyzed with an ordinary least
squares test and an α value of 0.10. Results of this regression show that the variables of Social
Education, Workshop Education, Age, Citizenship, Curfew, Fishing Frequency, and Perceptions
of Illegal Fishing were statistically significant. The R2 value for the model equaled 0.15
Table 1: Significance of Hypothesized Variables Explaining Agreement with Regulations Variable Type of Variable Prob > F Media Education Continuous 0.2428 Social Education Continuous <.0001 Workshop Education Nominal 0.0510 Age Nominal 0.0368 CBFM Nominal 0.9264 Samoan Nominal 0.0798 Matai title Nominal 0.8499 Curfew Nominal 0.0073 Perception of Illegal Fishing Nominal 0.0044 Fishing Frequency Nominal 0.0029 Gender Nominal 0.3572
Table 2: Parameter Estimates for Final Model of Factors Affecting the Agreement with Regulations
Variable Parameter Estimate Prob>|t| Intercept 5.6224312 <.0001 Social Education -0.003374 <.0001 No Workshop Attendance -0.202678 0.0667 Age[A] -0.538105 0.0037 Age[B] 0.155336 0.4081 Age[C] 0.1222577 0.5163 Non-Samoan -0.305558 0.0775 No Curfew 0.0873955 0.5991 Enforced Curfew 0.4088131 0.0043 Perception of Illegal Fishing -0.316085 0.0039 Non-Fisher 0.428502 0.0059 Above Average Fisher -0.5214 0.0012

115
By eliminating the insignificant variables, the final model becomes:
Overall Agreement with Regulations = α0 + α 1*( Fishing) + α 2*(Social) + α 3*(Workshop) + α4*(
Curfew) + α5*(Age) + α6*( Citizenship) + α7*(Illegal Fishing) + εi
Part 2: Specific Regulations
Nominal logistic regressions were also run for each specific question regarding agreement levels
with different regulations. Variables with P values less than or equal to 0.10 for each of these 8
regressions have been determined as significant factors in influencing the opinions towards these
regulations (Table 3).

116
Table 3: Significant Variables for Regulation Agreement Regressions
Variable Media Education
Social Education
Workshop Education Age
Participation in CBFM
Citizenship
Matai Title Curfew
Perception of Illegal Fishing
Fishing Frequency Gender
Overall Agreement X X X X X X X Regulation of Who X X X X Regulate What is Caught X X X X X X
Regulate What is Done w/ Catch X X X X Regulate When X X X Regulate Where X X X X X Regulate How X X X X X X Regulate During Spawning X X X Regulate Minors X X
“DMWR should regulate who fishes”
The effect of various factors on a respondent’s agreement with this regulation was analyzed using
a nominal logistic regression and an α value of 0.10. Results of this regression show that the
variables of Social Education, Curfew, Fishing Frequency, and Perceptions of Illegal Fishing
were statistically significant. The R2 value for the final model equaled 0.07.

117
Table 4: Significance of Hypothesized Variables in Explaining Agreement with Regulation Type
Variable Type of Variable Prob>ChiSq Media Education Continuous 0.9011 Social Education Continuous 0.8991 Workshop Education Nominal 0.0009 Age Nominal 0.3034 CBFM Nominal 0.9558 Samoan Nominal 0.7822 Matai title Nominal 0.6991 Curfew Nominal 0.5946 Perception of Illegal Fishing
Nominal 0.0340
Fishing Frequency Nominal 0.0190 Gender Nominal 0.0899
Table 5: Parameter Estimates for Final Model of Factors Affecting the Agreement with Regulation Type
Variable Estimate Prob>ChiSq Intercept -0.9402503 <.0001 Social Education 0.00257458 0.0015 No Curfew 0.05495943 0.7460 Enforced Curfew -0.4006212 0.0068 Perception of Illegal Fishing 0.28812706 0.0105 Non-Fisher -0.1722711 0.2864 Above Average Fisher 0.36038129 0.0251
Parameter estimates for log odds of disagreeing with regulation type
By eliminating the insignificant variables, the final model becomes:
(Agreement with regulation type) = a0 + a1*(Social Education)+ a2*(Curfew) + a3*(Illegal
Fishing) + a3*(Fishing) + εi
“DMWR should regulate what is caught”
The effect of various factors on a respondent’s agreement with this regulation was analyzed using
a nominal logistic regression and an α value of 0.10. Results of this regression show that the

118
variables of Social Education, Age, CBFM, Curfew, Fishing Frequency, and Perceptions of
Illegal Fishing were statistically significant. The R2 value for the final model equaled 0.10.
Table 6: Significance of Hypothesized Variables in Explaining Agreement with Regulation Type
Variable Type of Variable
Prob>ChiSq
Media Education Continuous 0.2715Social Education Continuous 0.0233Workshop Education Nominal 0.9972Age Nominal 0.0103CBFM Nominal 0.0422Samoan Nominal 0.5748Matai title Nominal 0.5013Curfew Nominal 0.0073Perception of Illegal Fishing
Nominal 0.0327
Fishing Frequency Nominal 0.0781Gender Nominal 0.4420
Table 7: Parameter Estimates for Final Model of Factors Affecting the Agreement with Regulation Type
Variable Parameter Estimate Prob>ChiSq Intercept -1.3429762 <.0001 Social Education 0.00210924 0.0277 Age[A] 0.74343234 0.0006 Age[B] -0.3246365 0.1842 Age[C] -0.3848259 0.1223 CBFM[FALSE] -0.4294474 0.0497 No Curfew -0.1375315 0.5237 Enforced Curfew -0.4735142 0.0220 Perception of Illegal Fishing 0.32428118 0.0165 Non-Fisher -0.4547159 0.0331 Above Average Fisher 0.30123958 0.1258
Parameter estimates for log odds of disagreeing with regulation type
By eliminating the insignificant variables, the final model becomes:
(Agreement with regulation type) = a0 + a1*(Social Education)+ a2*(Age) + a3*(CBFM) +
a3*(Curfew) + a4*(Illegal Fishing) + a5*(Fishing Frequency) + εi

119
“DMWR should regulate what is done with catch”
The effect of various factors on a respondent’s agreement with this regulation was analyzed using
a nominal logistic regression and an α value of 0.10. Results of this regression show that the
variables of Social Education, Workshop Education, Fishing Frequency, and Perceptions of
Illegal Fishing were statistically significant. The R2 value for the final model equaled 0.06.
Table 8: Significance of Hypothesized Variables in Explaining Agreement with Regulation Type
Variable Type of Variable
Prob>ChiSq
Media Education Continuous 0.3525 Social Education Continuous 0.0035 Workshop Education Nominal 0.1851 Age Nominal 0.2237 CBFM Nominal 0.4995 Samoan Nominal 0.9841 Matai title Nominal 0.8824 Curfew Nominal 0.2398 Perception of Illegal Fishing
Nominal 0.0364
Fishing Frequency Nominal 0.0054 Gender Nominal 0.8527
Table 9: Parameter Estimates for Final Model of Factors Affecting the Agreement with Regulation Type
Variable Parameter Estimate Prob>ChiSqIntercept -1.2305121 <.0001Social Education 0.00241981 0.0038No Workshop Attendance 0.21146267 0.08030 Perception of Illegal Fishing 0.26738046 0.0208Non-Fisher -0.3519114 0.0373Above Average Fisher 0.49593472 0.0022
Parameter estimates for log odds of disagreeing with regulation type
By eliminating the insignificant variables, the final model becomes:
(Agreement with regulation type) = a0 + a1*(Social Education)+ a2*(Age) + a3*(CBFM) +
a3*(Curfew) + a4*(Illegal Fishing) + a5*(Fishing Frequency) + εi

120
“DMWR should regulate when people can fish”
The effect of various factors on a respondent’s agreement with this regulation was analyzed using
a nominal logistic regression and an α value of 0.10. Results of this regression show that the
variables of Workshop Education, Curfew, and Fishing Frequency were statistically significant.
The R2 value for the final model equaled 0.05.
Table 10: Significance of Hypothesized Variables in Explaining Agreement with Regulation Type
Variable Type of Variable
Prob>ChiSq
Media Education Continuous 0.5180Social Education Continuous 0.1920Workshop Education Nominal 0.0149Age Nominal 0.5566CBFM Nominal 0.9052Samoan Nominal 0.2005Matai title Nominal 0.4327Curfew Nominal 0.0514Perception of Illegal Fishing
Nominal 0.1613
Fishing Frequency Nominal 0.0169Gender Nominal 0.1262
Table 11: Parameter Estimates for Final Model of Factors Affecting the Agreement with Regulation Type
Variable Parameter Estimate Prob>ChiSq Intercept -0.556859 <.0001 No Workshop Attendance 0.27157816 0.0167 No Curfew 0.06426958 0.6940 Enforced Curfew -0.4145117 0.0038 Non-Fisher -0.4144197 0.0087 Above Average Fisher 0.31927776 0.0424
Parameter estimates for log odds of disagreeing with regulation type
By eliminating the insignificant variables, the final model becomes:
(Agreement with regulation type) = a0 + a1*(Workshop)+ a2*(Curfew) + a3*(Fishing) + εi

121
“DMWR should regulate where people can fish”
The effect of various factors on a respondent’s agreement with this regulation was analyzed using
a nominal logistic regression and an α value of 0.10. Results of this regression show that the
variables of Social Education, Citizenship, Curfew, Perceptions of Illegal Fishing, and Fishing
Frequency were statistically significant. The R2 value for the final model equaled 0.10.
Table 12: Significance of Hypothesized Variables in Explaining Agreement with Regulation Type
Variable Type of Variable
Prob>ChiSq
Media Education Continuous 0.2150 Social Education Continuous 0.0053 Workshop Education Nominal 0.1262 Age Nominal 0.1539 CBFM Nominal 0.5300 Samoan Nominal 0.0464 Matai title Nominal 0.1308 Curfew Nominal 0.0507 Perception of Illegal Fishing
Nominal 0.0074
Fishing Frequency Nominal 0.0065 Gender Nominal 0.1853
Table 13: Parameter Estimates for Final Model of Factors Affecting the Agreement with Regulation Type
Variable Parameter Estimate Prob>ChiSqIntercept -1.1887547 <.0001Social Education 0.00223255 0.0150Non-Samoan 0.33234774 0.0856No Curfew 0.00609604 0.9746Enforced Curfew -0.5042282 0.00340 Perception of Illegal Fishing 0.33342925 0.0084Non-Fisher -0.5355196 0.0082Above Average Fisher 0.43983986 0.0166
Parameter estimates for log odds of disagreeing with regulation type
By eliminating the insignificant variables, the final model becomes:

122
(Agreement with regulation type) = a0 + a1*(Social)+ a2*(Citizenship) + a3*(Curfew) +
a4*(Illegal Fishing) + a4*(Fishing)+ εi
“DMWR should regulate how people fish”
The effect of various factors on a respondent’s agreement with this regulation was analyzed using
a nominal logistic regression and an α value of 0.10. Results of this regression show that the
variables of Media Education, Social Education, Workshop Education, Age, Perceptions of
Illegal Fishing, and Fishing Frequency were statistically significant. The R2 value for the final
model equaled 0.10.
Table 14: Significance of Hypothesized Variables in Explaining Agreement with Regulation Type
Variable Type of Variable
Prob>ChiSq
Media Education Continuous 0.0175Social Education Continuous 0.0035Workshop Education Nominal 0.0447Age Nominal 0.0748CBFM Nominal 0.6092Samoan Nominal 0.4750Matai title Nominal 0.6214Curfew Nominal 0.1302Perception of Illegal Fishing
Nominal 0.0129
Fishing Frequency Nominal 0.0399Gender Nominal 0.6180
Table 15: Parameter Estimates for Final Model of Factors Affecting the Agreement with Regulation Type
Variable Parameter Estimate Prob>ChiSq Intercept -1.9820988 <.0001 Media Education 0.00112444 0.0132 Social Education 0.00268027 0.0030 No Workshop Attendance 0.29366421 0.0294 Age[A] 0.50498797 0.0141 Age[B] 0.09240324 0.6656

123
Variable Parameter Estimate Prob>ChiSqAge[C] -0.2069499 0.35470 Perception of Illegal Fishing 0.35519223 0.0047Non-Fisher -0.4960379 0.0102Above Average Fisher 0.49811201 0.0051
Parameter estimates for log odds of disagreeing with regulation type
By eliminating the insignificant variables, the final model becomes:
(Agreement with regulation type) = a0 + a1*(Media) + a2*(Social)+ a3*(Workshop) + a4*(Age) +
a4*(Illegal Fishing) + a5*(Fishing)+ εi
“DMWR should regulate during spawning events”
The effect of various factors on a respondent’s agreement with this regulation was analyzed using
a nominal logistic regression and an α value of 0.10. Results of this regression show that the
variables of Social Education, Citizenship, and Curfew were statistically significant. The R2 value
for the final model equaled 0.03.
Table 16: Significance of Hypothesized Variables in Explaining Agreement with Regulation Type
Variable Type of Variable
Prob>ChiSq
Media Education Continuous 0.2489 Social Education Continuous 0.0639 Workshop Education Nominal 0.2134 Age Nominal 0.3890 CBFM Nominal 0.9455 Samoan Nominal 0.1216 Matai title Nominal 0.8440 Curfew Nominal 0.0679 Perception of Illegal Fishing
Nominal 0.1187
Fishing Frequency Nominal 0.4177 Gender Nominal 0.1338

124
Table 17: Parameter Estimates for Final Model of Factors Affecting the Agreement with Regulation Type
Variable Parameter Estimate Prob>ChiSqIntercept -1.0952107 <.0001Social Education 0.00152662 0.0801Non-Samoan 0.32514436 0.0711No Curfew -0.0870376 0.6373Enforced Curfew -0.3617181 0.0262
Parameter estimates for log odds of disagreeing with regulation type
By eliminating the insignificant variables, the final model becomes:
(Agreement with regulation type) = a0 + a1*(Social) + a2*(Citizenship)+ a3*(Curfew)+ εi
“Minors should be regulated”
The effect of various factors on a respondent’s agreement with this regulation was analyzed using
a nominal logistic regression and an α value of 0.10. Results of this regression show that the
variables of Social Education and Citizenship were statistically significant. The R2 value for the
final model equaled 0.04.
Table 18: Significance of Hypothesized Variables in Explaining Agreement with Regulation Type
Variable Type of Variable
Prob>ChiSq
Media Education Continuous 0.9816Social Education Continuous 0.0000Workshop Education Nominal 0.6040Age Nominal 0.8045CBFM Nominal 0.7256Samoan Nominal 0.0832Matai title Nominal 0.8097Curfew Nominal 0.8166Perception of Illegal Fishing
Nominal 0.2310
Fishing Frequency Nominal 0.3237Gender Nominal 0.6864
Table 19: Parameter Estimates for Final Model of Factors Affecting the Agreement with Regulation Type
Variable Parameter Estimate Prob>ChiSqIntercept -0.7078296 0.0002Social Education 0.00332951 <.0001

125
Variable Parameter Estimate Prob>ChiSq Non-Samoan 0.30033203 0.0740
Parameter estimates for log odds of disagreeing with regulation type
By eliminating the insignificant variables, the final model is as follows:
(Agreement with regulation type) = a0 + a1*(Social) + a2*(Citizenship)+ εi

126
Appendix I: Education Regression The effect of various factors on a respondent’s fishery education from social sources was
analyzed using an ordinary least squares regression and an α value of 0.10. Results of this
regression show that the variables of Age, Gender, and Curfew were statistically significant. The
R2 value for the model equaled 0.05.
Social Education-Whole Model
Table 1: Significance of Hypothesized Variables in Explaining Fishery Education from Social Sources
Variable Type of Variable Probability > FAge Nominal 0.1155
Gender Nominal 0.2132 Fishing Frequency Nominal 0.3444
Gleaner Nominal 0.4021 Matai Nominal 0.4086
Curfew Nominal 0.0965 CBFM Participation Nominal 0.3451
Social Education-Final Model
Table 2: Parameter Estimates for Final Model of Factors Explaining Fishery Education from Social Sources
Variable Parameter Estimate Probability>|t|Intercept 121.99808 <.0001 Age[A] 0.3809838 0.9734 Age[B] 27.725543 0.0160 Age[C] -14.58491 0.2081
Gender[Female] -13.00024 0.0491 Curfew[No] -3.646818 0.7193 Curfew[Yes] -19.39337 0.0282
The effect of various factors on a respondent’s fishery education from media sources was
analyzed using an ordinary least squares regression and an α value of 0.10. Results of this
regression show that no variables were statistically significant. The R2 value for the model
equaled 0.02.

127
Media Education-Whole Model Table 3: Significance of Hypothesized Variables in Explaining Fishery Education from
Media Sources
Variable Type of Variable Probability > F Age Nominal 0.2980
Gender Nominal 0.5220 Fishing Frequency Nominal 0.4594
Gleaner Nominal 0.8909 Matai Nominal 0.4389
Curfew Nominal 0.8841 CBFM Participation Nominal 0.2918
The effect of various factors on a respondent’s education from fishery workshops was analyzed
using nominal logistic regression and an α value of 0.10. Results of this regression show that Age,
Matai Status, and CBFM Participation were statistically significant. The R2 value for the model
equaled 0.08. Fishery Workshop Education-Whole Model
Table 4: Significance of Hypothesized Variables in Explaining Fishery Education from Workshops
Variable Type of Variable Probability >Chi Squared Age Nominal 0.1261
Gender Nominal 0.3701 Fishing Frequency Nominal 0.4148
Gleaner Nominal 0.3561 Matai Nominal 0.0000
Curfew Nominal 0.3060 CBFM Participation Nominal 0.0743
Fishery Workshop Education-Final Model
Table 5: Parameter Estimates for Final Model of Factors Explaining Fishery Education from Workshops
Variable Parameter Estimate Probability> Chi Squared Intercept -0.2028415 0.2743 Age[A] -0.1212406 0.5119 Age[B] -0.4023092 0.0267 Age[C] 0.44414381 0.0227
Matai[No] 0.72789257 <.0001 CBFM Participation[0] 0.34768076 0.0301
*For log odds of 0/1

128
Literature Cited Adams, T. J. H. and P. J. Dalzell (1995). "Management of Pacific Island Inshore Fisheries" Integrated Coastal Fisheries Management Project (3rd Australasian Fisheries Managers Conference). Alder, N. (1994). Have six years of public education changed attitudes and awareness? Proceedings of the seventh international coral reef symposium, Guam, University of Guam Press. Arlinghaus, R. and T. Mehner (2003). "Management preferences of urban anglers: Habitat rehabilitation versus other options." Fisheries 28(6): 10-17. Bindon, J. R., A. Knight, et al. (1997). "Social context and psychosocial influences on blood pressure among American Samoans." American Journal of Physical Anthropology 103(1): 7-18. Bunce, L., Townsley, P., Pomeroy, R., Pollnac, R. (2000). Socioeconomic Manual for Coral Reef Management, Australian Institute of Marine Science. Burger, J., W. J. Stephens, Jr., et al. (1999). "Factors in Exposure Assessment: Ethnic and Socioeconomic Differences in Fishing and Consumption of Fish Caught along the Savannah River." Risk Analysis 19(3): 427-438. Caley, M. J. and D. Schluter (1997). "The relationship between local and regional diversity." Ecology 78(1): 70-80. Census (2000). Population and Housing Profile: 2000 Census of Population and Housing. U.S. Department of Commerce. Chapman, M. D. (1987). "Women's fishing in Oceania." Human Ecology 15(3): 267-288.

129
Coutures, E. (2003). "The shoreline fishery of American Samoa, analysis of 1-year data and implementation of a new sampling protocol." Department of Marine and Wildlife Resources Report Series(102). CRAG, (2004). American Samoa- Three Year Local Action Strategies 2004-2007. Craig, P., C. Birkeland, et al. (2001). "High temperatures tolerated by a diverse assemblage of shallow-water corals in American Samoa." Coral Reefs 20: 185-189. Craig, P., G. DiDonato, et al. (2004). Status of Coral Reefs in American Samoa. Craig, P., L. Peau, et al. (2000). "Impacts of Rapid Population Growth in American Samoa: A Call for Action." CRTF, C. R. T. F.-. (2000). The National Action Plan to Conserve Coral Reefs. Dalzell, P. J., T.J. H. Adams & N.V.C. Polunin (1996). "Coastal Fisheries in the Pacific Islands." Oceanography and Marine Biology: an Annual Review 34: 395-531. DOI (1999). A Report on the State of the Islands, U.S. Department of Interior-Office of Insular Affairs. Fiske, S. J. (1992). "Socio-cultural aspects of establishing marine protected areas." Ocean & Coastal Management 18: 25-46. Fitzgerald, M., H. and A. Howard (1990). "Aspects of Social Organization in Three Samoan Communities." Pacific Studies 14(1): 31-54. Green, A. (2002). Status of coral reefs on the main volcanic islands of American Samoa: a resurvey on long-term monitoring sites. Pago Pago, American Samoa, Department of Marine and Wildlife Resources.

130
Houk, P., G. DiDonato, et al. (2005). "Assessing the Effects of Non-Point Source Pollution on American Samoa's Coral Reef Communities." Environmental Monitoring and Assessment 107: 11-27. Johannes, R. E. (1978). "Traditional Marine Conservation Methods in Oceania and their demise." Annual Review of Ecology and Systematics 9: 349-364. Lambeth, L., B. Hanchard, et al. (2001). "An Overview of the Involvement of Women in Fisheries Activities in Oceania." Lemay, M. and L. Hale (1989). Coastal resources management:A guide to public education programs and materials. West Hartford, Connecticut., Kumarian Press. McClanahan, T. R. (1994). "Kenyan coral reef lagoon fish: effects of fishing, substrate, and sea urchins." Coral Reefs 13: 231-241. McCook, L. J. (1999). "Macroalgae, nutrients, and phase shifts on coral reefs: scientific issues and management consequences for the Great Barrier Reef." Coral Reefs 18: 357-367. McDade, T. W. and C. M. Worthman (2004). "Socialization Ambiguity in Samoan Adolescents: A Model for Human Development and Stress in the Context of Culture Change." Journal of Research on Adolescence 14(1): 49-72. Mundy, C. (1996). "A Quantitative Survey of the Corals of American Samoa." Oram, R. (2005). Draft: American Samoa's Marine Protected Areas Program: a plan for meeting the territory's 20% no-take management goal. Osman, W. M. (1997). American Samoa Economic Report, Bank of Hawaii. Passfield, K., L.Blee, A. Solofa., A.Mulipola (2001). The Enhanced Capacity of the Samoa Fisheries Division to Facilitate Management of Commerical and Subsistence Fisheries. F. D. Samoa Fisheries Project, Government of Samoa.

131
Pauly, D. (1995). "Anecdotes and the shifting baseline syndrome fisheries." Trends in Ecology and Evolution 10(10). Pomeroy, R. S. (1995). "Community-based and co-management institutions for sustainable coastal fisheries management in Southeast Asia." Ocean and Coastal Management 27(3): 143-162. Ponwith, B. J. (1992). "The Pala Lagoon Subsistence Fishery." Rhoads, B. L., D. Wilson, et al. (1999). "Interaction Between Scientists and Nonscientists in Community-Based Watershed Management:Emergence of the Concept of Stream Naturalization." Concept Emergence in Watershed Management. Sauafea, F. S. and F. Curren (2000). Survey on Village Reef Fishing Problems in American Samoa, Department of Marine and Wildlife Resources. Severance, C. and F. R. (1989). "Justification and design of limited entry alternatives for offshore fisheries of American Samoa, and an examination of preferential fishing rights for native people of American Samoa within a limited entry context." Sheppard, C. (1995). "The shifting baseline syndrome." Marine Pollution Bulletin 30: 766-767. Skelton, P. A., L. J. Bell, et al. (2000). "The Status of Coral Reefs and Marine Resources of Samoa." Spurgeon, J., T. Roxburgh, et al. (2004). Economic Valuation of Coral Reefs and Adjacent Habitats in American Samoa. Tuitele, C. (2005). Personal communication. Vaitautolu, S. (2005). Personal communication.

132
Veitayaki, J. (1996). "Fisheries resource-use culture and its implications in Fiji." Culture and sustainable development in the Pacific: 116-130. Wass, R. (1984). "An Annotated Checklist of the Fishes of Samoa." Whittingham, E., J. Campell, et al. (2003). Poverty and Reefs: A Global Overview. Exeter, UK, Intergovernmental Oceanographic Commision of UNESCO. Wilkinson, C. E. (2004). Status of Coral Reefs of the World:2004 Vol. 1&2, Australian Institute of Marine Science. WPFMC (1999). The Value of the Fisheries in the Western Pacific Fishery Management Council's Area. Zann, L. P. (1999). "A new (old) approach to inshore resources management in Samoa." Ocean & Coastal Management 42: 569-590. Zeller, D., S. Booth, et al. (2005). "Reconstruction of coral reef fisheries catches in American Samoa, 1950-2002." Coral Reefs 24(3).