universiti putra malaysia thermal diffusivity …psasir.upm.edu.my/9105/1/fsas_2000_30_a.pdf ·...
TRANSCRIPT
UNIVERSITI PUTRA MALAYSIA
THERMAL DIFFUSIVITY MEASUREMENT USING PHOTOACOUSTIC AND THERMAL LENS TECHNIQUES
FANNY CHIN YEE JU
FSAS 2000 30
THERMAL DIFFUSIVITY MEASUREMENT USING PHOTOACOUSTIC AND THERMAL LENS TECHNIQUES
By
FANNY CHIN YEE Jl]
Thesis Submitted in Fulfilment of the Requirements for the Degree of Master of Science in the Faculty of Science and Environmental Studies
Universiti Putra Malaysia
May 2000
Abstract of the thesis presented to the Senate ofUniversiti Putra Malaysia in fulfilment of requirements for the degree of Master of Science
Chairman
Faculty
THERMAL DIFFUSIVITY MEASUREMENT USING PHOTOACOUSTIC AND THERMAL
LENS TECHl'.'1QUES
By
FANNY CHIN VEE JU
May 2000
Associate Professor W Mahmood Mat Yunus, Ph.D.
Science and Environmental Studies
The open photoacoustic cell (OPC) technique was used for measuring thermal
diffusivity of solid samples. It is based upon the measurement of the photoacoustic
signal as a function of the modulation frequency in the region where the thermal
diffusion length equals to the-sample thickness. The measurements were carried out
at room temperature for samples metal, alloy, semiconductor, polymer and
superconductor. The measured thermal diffusivity values for metal, semiconductor
and polymer samples are in good agreement with the values reported previously by
other researchers. The thermal diffusivity values of the AgxAuJ-x alloys decrease
from 1.48 cm2!s (pure Ag) to a minimum value at around x = 0.70 before increasing
towards the value of 1.28 cm2/s (pure Au). In AUxCu(lOO-x)07Ag(lOO-x)O.3 alloy system,
the thermal diffusivity values decrease with the increasing of the weight fraction x
and reaching a minimum at around x = 90 composition. Then, the thermal
ii
diffusivity values tend to increase to the value of 1.28 cm2/s for the pure Au
metal. For superconductor samples in the normal state, the measured thermal
diffusivity decreases with the increase of Zn content in the BbPbo.6Sr2Ca2-xZnxCu30o
system, However, the thermal diffusivity values increase with the increasing of Ba
dopant in the Bi2Pbo.6Sr2Ca2-xBaxCu30o system.
The OPC detection was also used to monitor the evaporation time of the liquid
samples. The evaporation time for 10.60 mm3 of acetone, chloroform, methanol and
ethanol samples were recorded as 236.7 s, 578 .8 s, 436.2 s and 869.2 s respectively.
The results also show that the liquid evaporation time is inversely proportional to the
laser power.
The laser beam power in the range of (2-16) m W was monitored by using OPC,
closed photoacoustic cell (CPC) and piezoelectric (PZT) detections. In each case,
the photoacoustic (PA) signals were found to be linear up to the laser power of 16
m W. In comparison, the power meter responsivity for CPC detection always higher
than OPC and followed by PZT detection.
Finally, the thermal lens technique was used to determine the thermal diffusivity of
liquid samples. The phenomenon of thermal lensing is due to the refractive index
change with temperature in a liquid medium causes by the periodic photothermal
heating. The change of the refractive index will turn the heated medium into a lens.
By measuring the time dependence of the laser intensity change after passed though
iii
the thermal lens, the thermal diffusivity of the sample can be obtained. In this work,
the measurements were carried out for various solvents, fuel, palm oils and chitosan
at different concentration. It was found that the thermal lens technique was suitable
for measuring thermal diffusivity value of liquids in the range of (9.09 x 10⁻⁴ -
12. 1 X 10⁻⁴) cm2;s.
IV
Abstrak tesis yang dikemukakan kepada Senat Universiti Putra Malaysia bagi memenuhi keperluan Ijazah Master Sains
Pengerusi
Fakulti
PENGUKURAN PEKALI RESAPAN TERMA DENGAN MENGGUNAKAN TE�FOTOAKUSTIK
DAN TEKNIK TERMA KANTA
Oleb
FANNY CHIN VEE JU
Mei2000
Prof. Madya W Mahmood Mat Yunus, Ph.D.
Sains dan Pengajian Alam Sekitar
Teknik fotoakustik sel terbuka (Ope) ditunjukkan untuk menentukan nilai pekali
resapan tenna bahan pepejal. Konsepnya adalah berdasarkan pengukuran isyarat
akustik sebagai fungsi frekuensi tennodulasi di mana jarak peresapan tenna sarna
dengan ketebalan sarnpel. Pengukuran dibuat pada suhu bilik bagi bahan-bahan
logam, aloi, semikonduktor, polimer and superkonduktor. Hasil nilai-nilai ukuran
bagi bahan-bahan logam, semikonduktor dan polimer amat menyetujui dengan nilai
yang telah dilaporkan oleh penyelidik-penyelidik lain. Nilai-nilai pekali resapan bagi
aloi AgxAuJ-x berkurang dari 1.48 cm2/s (Ag tulen) ke suatu nilai minima lebih
kurang pada x = 0.70 sebelum meningat ke 1.28 cm2/s (Au tulen). Bagi sistem aloi
AUxCU(lOO-x)O.7Ag(100-x)0.3, nilai-nilai pekali resapan berkurangan dengan penambahan
nilai nisbah berat x dan mencapai nilai minimanya lebih kurang pada x = 90.
Kemudian, nilai-nilai ini bertambah sehingga mencapai 1.28 cm2/s iaitu nilai
v
pekali resapan bagi sampel Au tulen. Bagi sampel superkonduktor pada keadaan
nonnal, nilai pekali resapan berkurangan dengan penambahan kandungan Zn pada
sistem BhPbo.6Sr2Ca2-xZnxCu30/). Akan tetapi, nilai pekali resapan bertambah
dengan penambahan kanduangan Ba pada sistem BhPbo.6Sr2CaZ-xBaxCu30S.
Teknik ope juga digunakan untuk mengukur masa pengewapan bagi bahan-bahan
cecair. Masa pengewapan untuk 10.60 mm3 acetone, chloroform, methanol dan
ethanol masing-masing dicatatkan sebagai 236.7 s, 578.8 s, 436.2 s and 869.2 s.
keputusan juga menunjukkan bahawa masa pengewapan adalah berkadar songsang
terhadap kuasa laser.
Kuasa aiur laser dalam julat (2-16) mW juga dikaji dengan menggunakan teknik
OPC, teknik fotoakustik sel tertutup (epC) dan teknik piezoelektrik (PZT).
Dalam setiap kes, isyarat akustik didapati berkadar terns dengan kuasa laser sehingga
16 mW. Secara perbandingan, kuasa tindakan bagi CPC teknik sentiasa lebih
daripada teknik ope and diikuti oleh teknik PZT.
Akhirnya, teknik kanta terma digunakan untuk menentu nilai pekali resapan tenna
bagi bahan-bahan cecair. Fenomena kanta terma adalah berdasarkan perubahan
indek biasan terhadap suhu pada suatu medium cecair akibat pemanasan fotothemal
secara berkala. Perubahan indek biasan akan mengubah medium yang telah
dipanaskan ke suatu kanta. Oleh itu, dengan mengukur perubahan keamatan laser
terhadap masa selepas menembusi kanta terma, pekali resapan terma bagi sampel
vi
cecair boleh diperolehi. Dalam kajian ini, pengukuran telah dilakukan terhadap
pelbagai pelarut, bahan api kenderaan, minyak kelapa sawit and chitosan. Teknik
kanta terma ini didapati amat sesuai untuk mengukur nilai pekali resapan terma bagi
sampel cecair dalamjulat (9.09 x 10⁻⁴ - 12.1 X 10⁻⁴) cm2/s.
VII
ACKNOWLEDGEMENTS
First and foremost, I would like to express my deepest praise to God who has
given me the strength, faith, confidence and courage to complete this project within
the time frame.
It is my pleasure to acknowledge my supervisor, Associate Professor Dr. W
Mahmood Mat Yunus for his guidance, help, advice and suggestion throughout the
duration of this project. I would also like to expand my sincere appreciation to my
co-supervisor, Professor Dr. Abdul Halim Shaari and Associate Professor Dr. Mohd
MaarofMoksin for their help and discussion during my studies.
Special thanks are also given to Professor Dr. Harnzah Mohamad and Mr.
Azhari from X-Ray Laboratory, Geology department, Universiti Kebangsaan
Malaysia for their help on the X-Ray Diffraction (XRD) analysis. I would also like
to thank Miss Azilah, Mrs. Arninah and Mr. Ho for helping me in handling the
Scanning Electron Microscope (SEM) unit.
Credit is also given to anyone, especially my family, course mates and
friends, who either directly or indirectly, have contributed in a variety of ways
towards the success of the project.
viii
I certify that an Examination Committee met on 8 May 2000 to conduct the final examination of Fanny Chin Vee Ju on her Master of Science thesis entitled "Thermal Diffusivity Measurement Using Photoacoustic and Thermal Lens Technique" in accordance with Universiti Pertanian Malaysia (Higher Degree) Act 1980 and Universiti Pertanian Malaysia (Higher Degree) Regulations 1981. The Committee recommends that the candidate be awarded the relevant degree. Members of the Examination Committee are as follows:
Azmi Bin Zakaria, Ph. D. Faculty of Science and Environmental Studies Universiti Putra Malaysia (Chairman)
W Mahmood Mat Yunus, Ph.D. Associate Professor Faculty of Science and Environmental Studies Universiti Putra Malaysia (Member)
Abdul Halim Shaari, Ph. D. Professor Faculty of Science and Environmental Studies Universiti Putra Malaysia (Member)
Mohd MaarofMoksin, Ph. D. Associate Professor Faculty of Science and Environmental Studies Universiti Putra Malaysia (Member)
. GHAZAtr MORA YIDIN, Ph. D. Pro essorlDeputy Dean of Graduate School Universiti Putra Malaysia
Date: 24 MAY 2000
ix
This thesis Submitted to the Senate of Universiti Putra Malaysia and was accepted as fulfilment of the requirement for the degree of Master of Science.
x
A.t_� KAMISlWANG, Ph. D. Associate Professor Dean of Graduate School Universiti Putra Malaysia
Date: 1 3 JUL 2COQ
I hereby declare that the thesis is based on my original work except for quotations and citations which have been duly acknowledged. I also declare that it has not been previously or concurrently submitted for any other degree at UPM or other institutions.
FANNY CHIN YEE JU
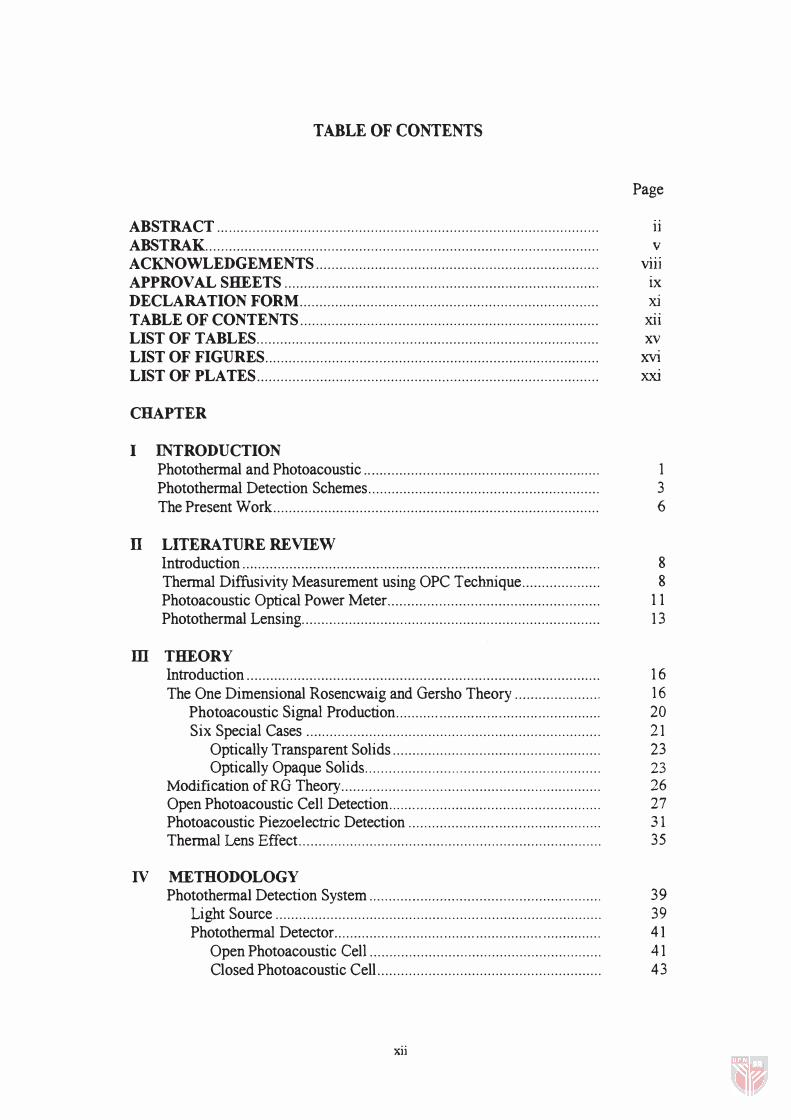
TABLE OF CONTENTS
Page
ABSTRACT ........... ...................................................................................... 11 ABSTRAK.................................................................................................... v ACKNOWLEDGEMENTS ............................... ......................................... Vlll APPROVAL SHEETS .......... ..................................................................... . IX DECLARATION FORM............................................................................ Xl TABLE OF CONTENTS............................................................................ xii LIST OF TABLES....................................................................................... xv LIST OF FIGURES..................................................................................... XVI LIST OF PLATES....................................................................................... XX]
CHAPTER
I INTRODUCTION Photothermal and Photoacoustic ......................... ................................... 1 Photothermal Detection Schemes........................................................... 3 The Present Work................................................................................... 6
II LITERATURE REVIEW Introduction ........................................................................................... 8 Thermal Diffusivity Measurement using OPC Technique.................... 8 Photoacoustic Optical Power Meter...................................................... 1 1 Photothermal Lensing............................................................................ 13
ill THEORY Introduction .......................................................................................... 1 6 The One Dimensional Rosencwaig and Gersho Theory ...... ............... . 16
Photoacoustic Signal Production........... . . . . . . . .. . . . . . . . . . . . . . . . . . . . . . . . . . . . . . . . . 20 Six Special Cases ........................................................................... 21
Optically Transparent Solids..................................................... 23 Optically Opaque Solids............................................................ 23
Modification ofRG Theory.................................................................. 26 Open Photoacoustic Cell Detection...................................................... 27 Photoacoustic Piezoelectric Detection ................................................. 31 Thermal Lens Effect............................................................................. 35
IV METHODOLOGY Photothermal Detection System ............. ................. ............................ . 39
Light Source ................................................................................... 39 Photothermal Detector.............. .............. ........ ................. ............... 41
Open Photoacoustic Cell........................................................... 41 Closed Photoacoustic Cell......................................................... 43
xii
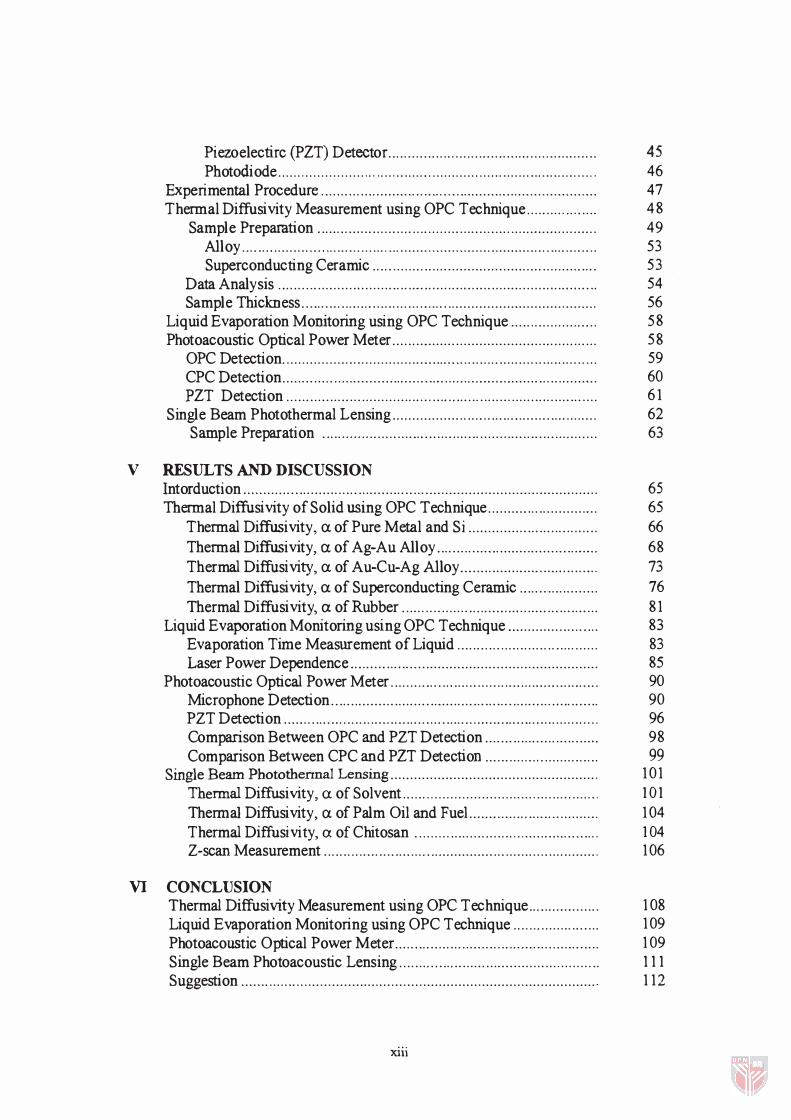
Piezoelectirc (PZT) Detector....... ..... . . ... ...... .... ..... . ... . . . . .. .. ... ... . . . 45 Photodiode . . . . . .. . . . . . . . . . . . . . . ...... . .. .. . . . .... . . . . . . . . . . .. . . . .. .. . . . .. . . . . ..... . .. . . . ... 46
Experimental Procedure... .. .. . . . . .............. ....................... ..... ................. 47 Thermal Diffusivity Measurement using OPC Technique . . . .. . . . ...... . . . . 48
Sample Preparation ....... ........ . . . .. . . .. . . .. . . . . . . .. . . .... . .. .... . . .......... . . . ..... .. 49 Alloy ........ . .. . .. .. .......... .. .. . .. . .... . . .................. . ... .......... ........ .... .. .. . . 53 Superconducting Ceramic ..... . . . . . .. . .. . . ... ........ .. ... ...... .... . . . . . .. . ...... 53
Data Analysis ... .. . . . .. . . .. . . . . ... . . . . . . .... . . ........ . .... ... ... .. . . . .... . . . . . .. .. . ..... ..... 54 Sample Thickness......... . . . .. ..... ....... .. . . .. ....... ............. .......... ....... ...... 56
Liquid Evaporation Monitoring using OPC Technique .. ...... . . . . .. .. .... . . 58 Photoacoustic Optical Power Meter... ............ .. . ................... ... .. .. .. . .. . . . 58
OPC Detection. . . . . . .. . . . . . . .. .. .. . . . . . . . . . . . . . ................ .. ...... . ... .. .. .. . ..... . .. . . .. 59 CPC Detection.... .... . .. .. . . . . ................. ....... . . . .. .......... ........... . .. . . ........ 60 PZT Detection . . .. ... . ... . . ... . .. . . .. . . . . . .. . . ..... .. .. ...... . . . . .. . ... . . . . . ...... . . ..... . . . . 61
Single Beam Photothermal Lensing................. . . .. .. ......... ..... ....... . . . ..... 62 Sample Preparation ...... .... .. .. . . . .. . . ........ . . .. . . . .... . . . . . .. .... . .... . .. . . ... . .. . . . 63
V RESULTS AND DISCUSSION Intorduction ....... . .. ............. . . ...... ...... ...... . . . ............................................ 65 Thermal Diffusivity of Solid using OPC Technique........................ ... . 65
Thermal Diffusivity, ex of Pure Metal and Si ............. ........ .... . . .. ... . 66
Thermal Diffusivity, ex of Ag-Au Alloy....... . ............... ....... ........... 68 Thermal Diffusivity, ex of Au-Cu-Ag Alloy.............. ...... ...... .... ..... 73 Thermal Diffusivity, ex of Superconducting Ceramic ........... ........ . 76 Thermal Diffusivity, ex of Rubber . . .. . . . . .. . . . . . ..... ...... .... . . ..... . ......... . . . 81
Liquid Evaporation Monitoring using OPC Technique ............. .... ...... 83 Evaporation Time Measurement of Liquid .... ... .. .. . . .. .. . . . .. . . . . . . .. . . . . . . 83 Laser Power Dependence... ........ ... ...... ........ ........ .... ....................... 85
Photoacoustic Optical Power Meter ... . . .. ............. .. . . . .. . . .... . . . ...... .......... . 90 Microphone Detection...... ........ ..... ... ......... . .. ............... ...... ...... ....... 90 PZT Detection ..... . ........ . .. .. .. . .... ......... . . . ......... . .................. ... . . . . . . . . . .. 96 Comparison Between OPC and PZT Detection.. ... ...... ..... . . ... . .. ..... 98 Comparison Between CPC and PZT Detection... ... . . . ... ... . . . . . . . . . .. .. . 99
Single Beam Photothennal Lensing..................................................... 10 1 Thermal Diffusivity, ex of Solvent .. . ... .. . . . . . . . . . . . . . . . . . . . . . . . . .. . . .. . . ... . . . . . . . 10 1 Thermal Diffusivity, ex of Palm Oil and FueL..... . .. . ...... ...... . . . . . . . ... 104 Thermal Diffusivity, ex of Chitosan . . . . . . . ...... . . .. .. . .......... .. ............... 104 Z-scan Measurement . . .. .. . . . .... .. . ...... . . ................... . .. . . .. .. . . . .. . . . .. . ....... 106
VI CONCLUSION Thermal Diffusivity Measurement using OPC Technique.... ............. . 108 Liquid Evaporation Monitoring using OPC Technique . .. . . .. . . . . . ... .... . . . 109 Photoacoustic Optical Power Meter... ........ .. .. .. . . ... . .. . . .. ........ . . .... ....... . . 109 Single Beam Photoacoustic Lensing . .. .. . .......... . . . .. . . . ...... .. . . . .. . . .. . . . . . . .... III Suggestion ....... . . . . ... . . . . ............. .... ............ ............................................ 112
xiii

BffiLIOGRAPHY .. ........................................................ ..... .. .. ............ ........ 1 13 APPENDIX A . .... .. ... . ... . .. .. .... ........... .... . . ... .. ........ . . .. . . ...... ..... .. .. .. .. . . .. ... . .. ...... 1 1 8 APPENDIX B ............ ....................................... .... , . . . . .. . . . . . .... . '" . .... . . . . . . . . . . .. .. . 121 APPENDIX C .... ........ ....... .. . .................... .. .. .. . . ... . .. . ............ .................. .. .. .. . 123 APPENDIX D ......... ..................... .... .......... ........ .... .......... .......... ............. .. ... 125 APPENDIX E ................ .. .. .. ................... ..................................................... 126 VITA............................................................................................................. 127
xiv
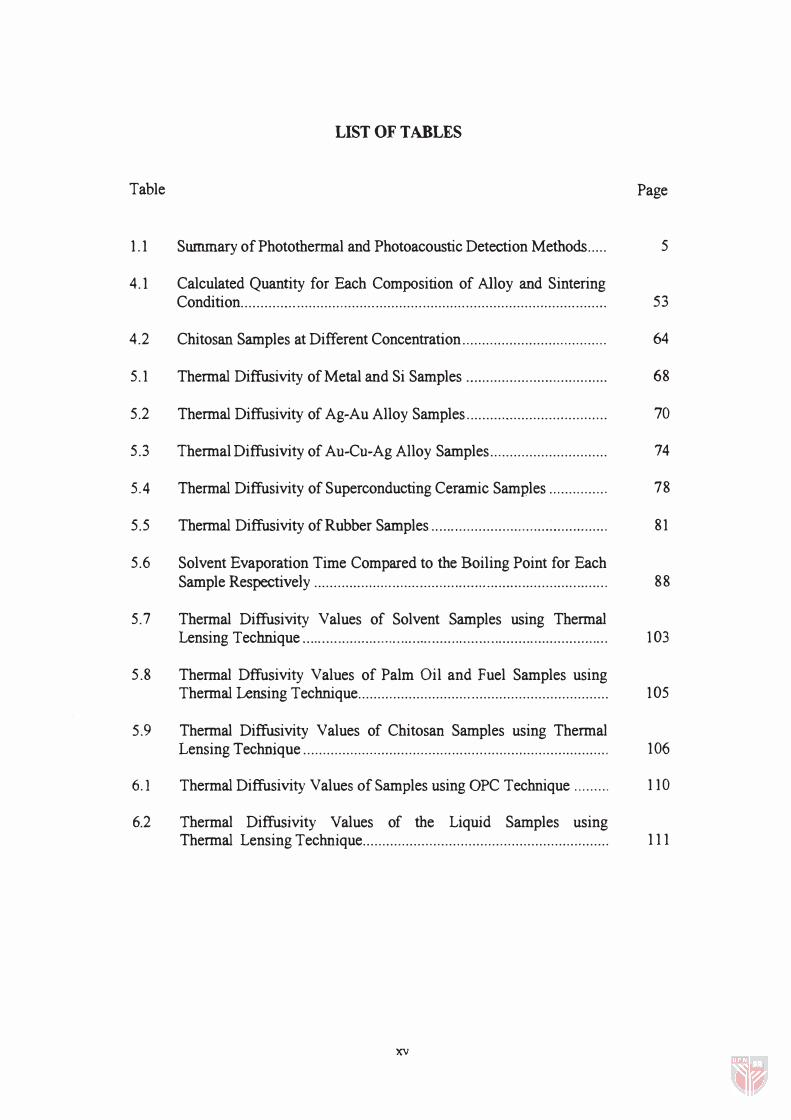
LIST OF TABLES
Table Page
1.1 Summary of Photothermal and Photoacoustic Detection Methods..... 5
4.1 Calculated Quantity for Each Composition of Alloy and Sintering Condition.............. .................... ............ ........... ............................ ..... ... 53
4.2 Chitosan Samples at Different Concentration..................................... 64
5.1 Thermal Diffusivity of Metal and Si Samples .�.................................. 68
5.2 Thermal Diffusivity of Ag�Au Alloy Samples.................................... 70
5.3 Thermal Diffusivity of Au-Cu�Ag Alloy Samples.............................. 74
5 .4 Thermal Diffusivity of Superconducting Ceramic Samples ............... 78
5.5 Thermal Diffusivity of Rubber Samples ..................... ........................ 81
5.6 Solvent Evaporation Time Compared to the Boiling Point for Each Sample Respectively ........................................ ................................... 88
5.7 Thermal Diffusivity Values of Solvent Samples using Thermal Lensing Technique . . ...... . . . . . . . . . . . . . . . . . . ....... ............... ............ .............. .... 103
5.8 Thermal Dffusivity Values of Palm Oil and Fuel Samples using Thermal Lensing Technique............................. ................................... 105
5.9 Thermal Diffusivity Values of Chitosan Samples using Thermal Lensing Technique ...................................... ... ..... ............................... . 106
6.1 Thermal Diffusivity Values of Samples using OPC Technique . ........ 110
6.2 Thermal Diffusivity Values of the Liquid Samples using Thermal Lensing Technique............................................................... 111
xv
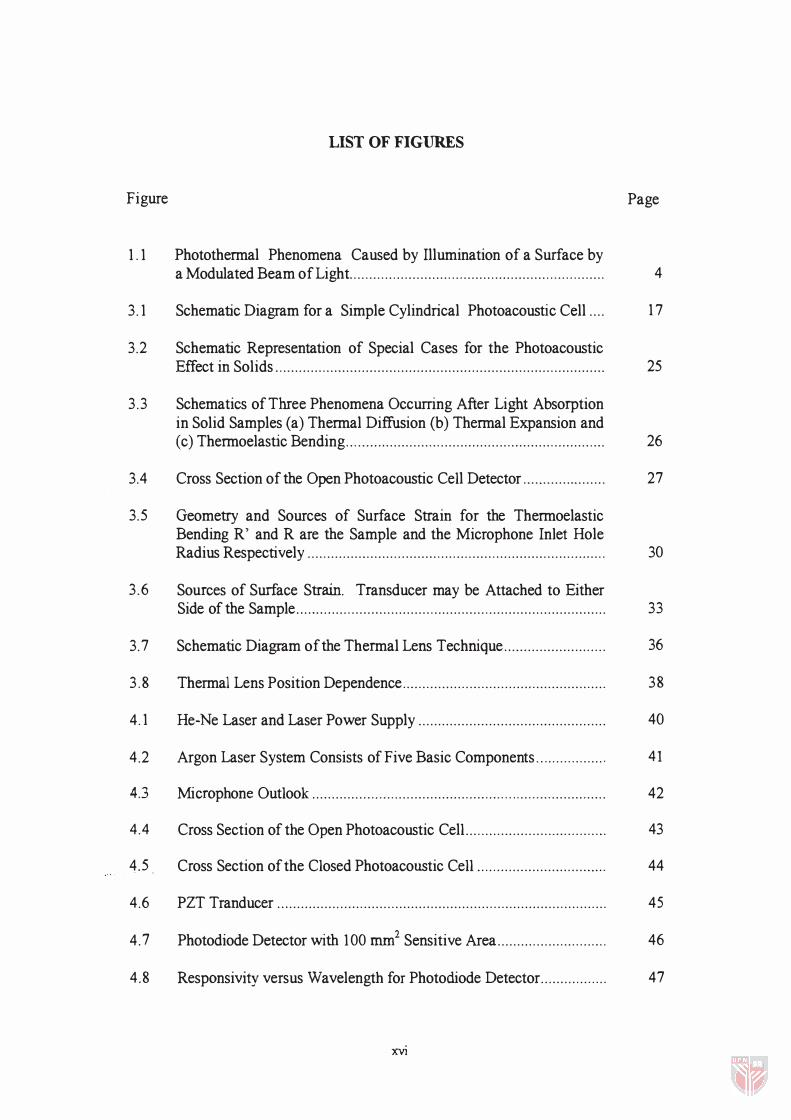
LIST OF FIGURES
Figure
1.1 Photothermal Phenomena Caused by Illumination of a Surface by
Page
a Modulated Beam of Light................................................................. 4
3.1 Schematic Diagram for a Simple Cylindrical Photoacoustic Cell .... 17
3.2 Schematic Representation of Special Cases for the Photoacoustic Effect in Solids.................................................................................... 25
3.3 Schematics of Three Phenomena Occurring After Light Absorption in Solid Samples (a) Thermal Diffusion (b) Thermal Expansion and (c) Thermoelastic Bending.................................................................. 26
3.4 Cross Section of the Open Photoacoustic Cell Detector ............ ......... 27
3.5 Geometry and Sources of Surface Strain for the Thermoelastic Bending R' and R are the Sample and the Microphone Inlet Hole Radius Respectively ............................................................................ 30
3.6 Sources of Surface Strain. Transducer may be Attached to Either Side of the Sample............................................................................... 33
3.7 Schematic Diagram of the Thermal Lens Technique.......................... 36
3.8 Thermal Lens Position Dependence.................................................... 38
4.1 He-Ne Laser and Laser Power Supply ................................................ 40
4.2 Argon Laser System Consists of Five Basic Components.................. 41
4.3 Microphone Outlook ........... ..... ....... .......................... ... ....................... 42
4.4 Cross Section of the Open Photoacoustic Cell.................................... 43
4.5. Cross Section of the Closed Photoacoustic Cell ................................. 44
4.6 PZT Tranducer .. ............. ..................................................................... 45
4.7 Photodiode Detector with 100 mm2 Sensitive Area............................ 46
4.8 Responsivity versus Wavelength for Photodiode Detector................. 47
xvi
4.9 Experimental Set-up for Thennal Diffusivity Measurement using OPC Technique ............. . . . . . ...... . . . . . . . . . . . . . . .. . . . . . . .. . . ... .. .. .. . ...... ...... . . . ........ 48
4.10 Flow Chart for Ag-Au Alloy Samples Preparation............................. 50
4.11 Pallet Mould (8nun in Diameter) ........ .. . . .. . .. .. ... . . .. .... . . ... . . .. .. .. .. . . .. . . . . . . . 51
4.12 Sintering Experimental Set-up ... .. .. .. .. ........ ......... ............ ..... ..... ..... ..... 52
4.13 PA Signal (mW) versus Frequency (Hz) for AI Sample (1.04mm). ... 55
4.14 In (PA Signal) versus In (.fi) for AI Sample (1.04 mm) .. ............... . 55
4.15 Thennal Diffusivity , a (cm2/s) versus Sample Thickness, I (cm) for BhPbo.6Sr2Ca2-xZnxCu30o (x = 0.02) Sample................................ 57
4.16 Characteristic Frequency, !c (Hz) versus l/(z2) (cm-2) for BhPbo.6Sr2Ca2-xZnxCu30o (x = 0.02) Sample .. ...... .. .... .. . . . ..... ...... ... .. . . 57
4.17 The Cross Section of the Liquid Sample Holder which is placed on the Top of the Microphone and is attached with Silicon Grease ........ 59
4.18 Experimental Set-up for the use of a OPC as a Laser Power Meter ... 60
4.19 Experimental Set-up for the use of a PZT as a Laser Power Meter ... . 61
4.20 Single Beam Photothennal Lensing Experimental Set-up.................. 63
5.1 In cPA signal) versus In (Jf) for (a) Sn (0.45 nun) and (b) Si (0.53
mm) Samples....................................................................................... 67
5.2 in (PA signal ) versus In (Jf) for Ag-Au Alloy Samples.................. 69
5.3 Thennal Diffusivity of the AgxAuJ-x Samples..................................... 70
5.4 The Relationship of the Lattice Spacing, d and the Thennal Diffusivity Values for the AgxAul-x (x = 0 .25, 0 .50 and 0.75) Samples . . . . . . . . . . . . . . . . . . . . . . . . . . . . . . . . . . . . . . . . . . . . . . . . . . . . . . . . . . . . . . . . . . . . . . . . . . . . . . . . . . . . . . . . . . . . . . . 73
5.5 In cPA signal) versus In (Jf) for AU91.60CUS.8sAg2.S1 Sample .. ... . . .... . 74
5.6 Thennal Diffusivity of the AUxCU(lOO-x)O.7Ag(100-x)O.3 (x == 58.50 ,
78.00, 83.50, 91.60 and 95.00) Samples ... ...... ... ......... .. .... .. . ............ ... 75
xvii
5.7 The Relationship of the Lattice Spacing, d and the Thermal Diffusivity Values for the AUxCll(JOO-x)O.7Ag(loO-x)0.3 (x = 58.50, 78.00,83.50, 9l.60 and 95.00) Samples ............................................ .
5.8 In (PA signal) versus In (.Jj) for (a) Bi2Pbo.6Sr2Ca2-xZnxCu30B,
x = 0.08 (0.66 mm) and (b) Bi2Pbo.6Sr2Ca2-xBaxCu30S , x = 0.08 (0.83 mm) Superconducting Ceramic Sample ................................... .
5.9 Thermal Diffusivity and Tc Values versus Concentration of Zn for BhPbo.6Sr2Ca2-xZnxCu30o Samples (x = 0.02 - 0.10) ......................... .
5.10 Thermal Diffusivity and Tc Values versus Concentration of Ba for BhPbo.6Sr2Ca2-xBaxCu30o Samples (x = 0.02 - 0.10) . . . . . . . . . . . . . . . . . . . . . . . . .
5.11 In (PA signal) versus In (.fj) for (a) ENR 25 (75%) and (b) ENR
50 (750/0) Samples .............................................................................. .
5.12 PA Signal as a Function of Frequency for Different Quantity of Distilled Water using OPC Technique .............................................. . .
5.13 P A Signal as a Function of Frequency for Different Quantity of Distilled Water using CPC Technique ............................................... .
5.14 Time Dependence of the PA Signal for 10.6 mm3 of (a) Acetone (b) Chloroform (c) Methanol and (d) Ethanol Liquid Samples at 50 Hz with the Laser Power = 17.07 mW ..................................................... .
5.15 PA Signal versus Time for Acetone Sample at Different Laser Power . . . . . . . . . . . . . . . . . . . . . . . . . . . . . . . . . . . . . . . . . . . . . . . . . . . . . . . . . . . . . . . . . . . . . . . . . . . . . . . . . . . . . . . . . . . . . . . . . . .
5.16 PA Signal versus Time for Methanol Sample at Different Laser Power .................................................................................................. .
5.17 Evaporation Time versus Laser Power for 10.6 mm3 of Acetone and Methanol Samples ....................................................................... .
5.18 Microphone Response for OPC Detection as a Function of the Modulation Frequency (Hz) ............................................................... .
5.19 Microphone Response for CPC Detection as a Function of the Modulation Frequency (Hz) ............................................................... .
5.20 Photoacoustic Signal (mV) versus Chopping Frequency (Hz) at Different Laser Power for Carbon Black Pallet (l = l.82 mm) using OPC Detection .................................................................................... .
xviii
76
77
79
79
82
84
84
87
88
89
89
91
91
93
5.21 Photoacoustic Signal (mW) versus Chopping Frequency (Hz) at Different Laser Power for Carbon Black Pallet (l = 1.82 mm) using CPC Detection............................................................................ ....... .. 93
5.22 Photoacoustic Signal (mV) versus Laser Power (mW) at Different Chopping Frequency for Carbon Black Pallet (l = 1.82 mm) using OPC Detection..................................................................................... 94
5.23 Photoacoustic Signal (mV) versus Laser Power (mW) at Different Chopping requency for Carbon Black Pallet (l = 1.82 rom) using cpe Detection..................................................................................... 94
5.24 SignalJPower (mV/mW) versus Frequency (Hz) for (a) OPC Detection and (b) CPC Detection........................................................ 95
5.25 Photoacoustic Signal (mV) versus Chopping Frequency (Hz) at Different Laser Power for (a) Brass and (b) Silver Samples using PZT Detection..................................................................................... 96
5.26 Photoacoustic Signal (mV) versus Laser Power (mW) at Different Chopping Frequency for (a) Brass and (b) Silver Samples using PZT Detection..................................................................................... 97
5.27 SignalJPower (mV/mW) versus Frequency (Hz) using PZT Detection............................................................................................. 97
5.28 Signal!Power (mV/mW) versus Frequency (Hz) using ope and PZT (brass) Detection ......................................................................... 99
5.29 SignalJPower (mV/mW) versus Frequency (Hz) using CPC and PZT (brass) Detection ................................ ........................................ 100
5.30 Plots of Thermal Lens signal as a Function of Time at (a) 20 Hz (b) 40 Hz (c) 60 Hz (d) 80 Hz (e) 110 Hz and (f) Combination of the 5 Different Frequencies.......................................................................... 102
5.31 Thermal Lens Signal versus Time for Chloroform Sample at Different Frequencies at Laser power 1.43 mW ................................. 103
5.32 Thermal Lens Signal versus Time for Diesel Sample at Different Frequencies at Laser Power 1.43 mW................................................. 104
5.33 Thermal Lens Signal versus Time for Chitosan 6g/liter Sample at Different Frequencies at Laser Power 1.43 mW................................. 105
xix
5.34 Thermal diffusivity (cm2/s) versus Concentration (gIliter) for Chitosan Samples................................................................................ 106
5.35 Thermal Lens (mV) against Position (cm) for Acetone Sample at Laser Power = 5 m W and Chopping Frequency = 60 Hz .. .. .. . . .. .. . .. . . . 107
xx
LIST OF PLATES
Plate Page
4.1 Pressing Machine . . . . . . . . .......... . . . . . . . . ........ . .. . . . . . .. . . . ....... . . . . . . . . . . . . . . . .. . . ....... 52
5.1 Surface Morphologies of the AgxAul-x Samples (a) x = 0.75 (b) x = 0.50 and (c) x = 0.25 ............................................................... 71
XXl
CHAPTER!
INTRODUCTION
Photothermal and Photoacoustic
Photothermal science is a cumulative name for a class of phenomena that
involve the generation of heat caused by the absorption of modulated optical energy.
In fact, when the optical energy is absorbed, the excited states in atoms or molecules
loose their excitation energy by a series of non-radiative transitions that result in a
general heating in the material.
The early concept of the photoacoustic effect (as cited by Favier, 1997) was
discovered by Alexander Graham Bell in 1 880 when he tried to explain the operation
of his photophone. It was named photoacoustic because the photothermal heating
effect was detected by an indirect acoustic method. He also studied the
photoacoustic effect in solids, liquids and gases where the modulated light was used
to illuminate the sample. Among the scientists who involved in studying this
studying phenomena were Rayleigh, Rontgen, Mercadier and Tyndall. Due to the
limitation of hearing tubes used as detectors in the early experiments, interest in the
field of photoacoustic died down. However, some interesting conclusions could be
made. For example, Mercadier who performed photoacoustic spectroscopic studies
on various materials, came to the conclusion that the maximum effect was found to
be produced by the red rays and by the invisible ultra red rays. Likewise, Rontgen
stated that the sounds in question are due to the bending of the plates under unequal
heating.
It was only at beginning of the 1970s that the photothermal and photoacoustic
research was rediscovered mainly due to three major factors:
1. Development of intense light sources; such as lasers and high pressure arc
lamps, such as xenon lamps.
2. Development of fast and sensitive detection equipment; such as electret
microphones and piezoelectric detectors.
3. Development of more sensitive signal processing equipment; such as
filters, phases sensitive detectors and ultimately lock-in amplifiers.
The improvements in the above three areas enabled the photoacoustic phenomena to
be explored and studied further as partly shown in the present work, and hence
higher sensitivity and greater selectivity photoacoustic spectroscopy could be
performed.
Now, further development of the photoacoustic spectroscopy techniques and
their applications become more interesting for measuring the optical properties and
thermal characterization of various materials. The attractive features of photoacoustic
spectroscopy can be listed as follows:
1 . Requires minimal sample preparation
2. Enables measurements of thermal and optical properties on highly
absorbing and scattering media
3. Non-contact and non-destructive
4. Measurements can be carried out on a broad range of material (gases,
liquids, solids, powders, gels, thin films, etc.)
5. Can be used to detennine a very wide range of absorption coefficient
magnitudes (10-3 to 10-5 m-1)
6. A range of complimentary photothermal detection methods
7. An increase in signal-to-noise ratio with data processing capability and
increasing in input light power.
Photothermal Detection Schemes
The heat generated in sample results in physical changes in and around the
sample. Figure 1.1 shows the resulting of the phenomena caused by illumination of a
surface by a modulated beam of light. Beside the change in temperature of the
sample, it's also produced infrared, acoustic waves, thermal waves, thermoelastic
waves; surface expansion, surface reflectivity modulation and refractive index
gradient in the medium in contact with the heated surface. All of these effects have
been used to probe the photothermal response of an enormous number of materials -
solids, liquids and gases.
The thermal wave detection techniques were classified into three groups i.e.
acoustic, thermal and optical. Acoustic detection techniques employ either a gas
condenser microphone for the detection of pressure variations in air or a piezoelectric
transducer for the detection of thermoelastic waves in solid media. Thermal
detection methods include the use of thermocouples, thermistors, infrared detectors