universiti putra malaysia food consumption …psasir.upm.edu.my/6250/1/fp_2008_16(1-24).pdf ·...
TRANSCRIPT
UNIVERSITI PUTRA MALAYSIA
FOOD CONSUMPTION PATTERNS AND TRENDS IN MALAYSIA
TEY YEONG SHENG.
FP 2008 16
FOOD CONSUMPTION PATTERNS AND TRENDS IN MALAYSIA
TEY YEONG SHENG
MASTER OF SCIENCE UNIVERSITI PUTRA MALAYSIA
FOOD CONSUMPTION PATTERNS AND TRENDS IN MALAYSIA
BY
TEY YEONG SHENG
Thesis Submitted to the School of Graduate Studies, Universiti Putra Malaysia, in Fulfilment of the Requirements for the Degree of Master of Science
July 2008

Dedication
My beloved parents, siblings and fiancCe-Goh Bee Ling.
Abstract of thesis presented to the Senate of Universiti Putra Malaysia in fulfilment of the requirements for the degree of Master of Science
FOOD CONSUMPTION PATTERNS AND TRENDS IN MALAYSIA
BY
TEY YEONG SHENG
July 2008
Chairman: Professor Mad Nasir Shamsudin, PhD
Faculty : Agriculture
Since the economic crisis in 1997, there has been notable success in Malaysian
economic, where Malaysians are getting wealthier and food consumption is
undergoing transitional changes. Thus, it is motivational to gain a better
understanding of food consumption patterns and trends in Malaysia. This study
intends to investigate food consumption patterns in Malaysia. This is followed by
the analyses on the effects of socio-economic factors on food consumption and is
further used to do projection for the future food consumption in Malaysia until
This study used data from the Household Expenditure Survey (HES) 200412005.
Data from the HES was obtained from 14,084 samples in Malaysia. In order to
investigate food consumption patterns in Malaysia, this study utilized the
methodology of a multi-stage demand system, incorporating demographic variables
to estimate income and price elasticities. In order to analyze the effects of socio-
economic factors on food consumption, 36 single equations of Tobit model were
estimated. With quantity of food consumed as the dependent variable, the equations
were also used to project future consumption of the 36 food items.
The estimated positive and inelastic income elasticities show that all the food items
are normal goods, except for other meat. Special attention was paid to demand for
rice, with positive income elasticity of 0.1325 concerning the question whether rice
is an inferior good in Malaysia. While mutton (0.3196), prawn (0.3745), and
processed h i t s (0.3088) recorded the highest income elasticity over other food
items in the food group respectively. On the other hand, own-price elasticity of each
food item shows negative signs, complying with law of demand. Compensated and
uncompensated own-price elasticities of rice (-0.5756 and -0.5791) were the lowest
in its food group. These results indicate that rice is a necessity and still playing its
role as staple food to Malaysians in 200412005.
The determinant. of consumption of food items are found to be generally attributed
to household income, urbanization, age of household's head, household size, and
race. Most of the equations witnessed that gender and employment status of
household's head were not significantly related to quantity of food consumed. By
taking into account of socio-economic effects, overall projection results show
increasing trends for future consumption of the food items, except for rice and other
meats.
Abstrak tesis yang dikemukakan kepada Senat Universiti Putra Malaysia sebagai memenuhi keperluan untuk ijazah Master Sains
CORAK DAN GAYA KEPENGGUNAAN MAKANAN DI MALAYSIA
Oleh
Tey Yeong Sheng
Julai 2008
Pengerusi
Fakulti
: Profesor Mad Nasir Shamsudin, PhD
: Pertanian
Semenjak krisis ekonomi yang berlaku pada tahun 1997, ekonomi Malaysia telah
mencapai kejayaan dengan penduduk-penduduk yang semakin kaya dan terdapatnya
perubahan peralihan dari segi kepenggunaan makanan. Oleh itu, corak dan gaya
kepenggunaan makanan di Malaysia perlu dikaji dengan lebih menelam. Objektif
kajian ini adalah untuk menyelidik corak kepenggunaan makanan di Malaysia. Ini
diikuti oleh analisis tentang kesan faktor sosial ekonomi ke atas kepenggunaan
makanan yang seterusnya akan digunakan dalam unjuran kepenggunaan makanan di
Malaysia sehingga tahun 2020.
Kajian ini menggunakan data dari Kajian Perbelanjaan Isi Rumah (KPIR) bagi
tahun 2004/2005. Data KPIR diperolehi daripada 14,084 sarnpel kajian di Malaysia.
Dalam melihat corak kepenggunaan makanan di Malaysia, kajian ini menggunakan
kaedah sistem permintaan pelbagai peringkat yang mengandungi penunjuk boleh
ubah dalam menganggarkan pendapatan dan kelenturan harga. Dalam menganalisis
kesan demografi ke atas pengambilan makanan, 36 persamaan Tobit telah
dianggarkan. Dengan jumlah makanan yang diambil sebagai pemboleh ubah tidak
bersandar, persamaan ini turut digunakan dalam merancang penggunaan 36 item
makanan terbabit.
Anggaran secara positif dan kenj alan pendapatan, telah menunjukkan semua item
adalah normal kecuali daging yang lain. Perhatian khas telah diberikan ke atas
permintam terhadap beras di mana keanjalan pendapatan positif 0.1325 yang telah
menunjukkan permintaan yang rendah di Malaysia. Manakala daging kambing
(0.3196), udang (0.3745), dan buah-buahan yang diproses (0.3088) telah
merekodkan kenjalan pendapatan yang tertinggi berbanding item yang lain di
dalam kumpulan yang berkaitan. Dengan kata yang lain, kenjalan harga bagi setiap
item makanan menunjukkan petunjuk yang negatif, mengikut hukum permintaan.
Harga keanjalan bagi beras adalah yang terendah di dalam kumpulannya (-0.5756
dan -0.5791). Ini menunjukkan bahawa beras masih lagi diperlukan dan memainkan
peranan yang penting sebagai makanan ruji rakyat Malaysia bagi tahun 200412005-
Penentuan pengambilan item makanan didapati telah menyumbang secara
umumnya kepada pendapatan isi rumah, urbanisasi, usia ketua isi rumah, saiz isi
rumah dan kaum. Kebanyakan daripada persamaan menyaksikan faktor jantina dan
status pekerjaan ketua isi rumah tidak berkait dengan jumlah pengambilan
makanan. Dengan mengambil kira kesan faktor demografi, keputusan keseluruhan
unjuran menunjukkan corak peningkatan dalam pengambilan makanan bagi
kesemua item makanan kecuali beras dan daging.
vii

ACKNOWLEDGEMENTS
I would like to express my sincere gratitude and appreciation to my academic
advisor and the chairman of my thesis supervisory committee, Professor Dr. Mad
Nasir Shamsudin for his intellectual support, encouragement, and enthusiasm which
made this thesis possible, and for his patience in correcting both my stylistic and
scientific errors. To Associate Professor Dr. Zainalabidin Mohamed and Dr. Amin
Mahir, my committee members, whose generous suggestions and comments were
invaluable to this thesis and to my future career. To Dr. Alias Radam, whose
suggestions were productive and fi-uitfbl to this thesis are very much appreciated.
I would like to express my heartfelt appreciation to my dearest parents and siblings
for their spiritual encouragement. I also wish to express my special gratitude to my
beloved fiancke, Goh Bee Ling who has always been my source of inspiration to
achieve higher level in my life.
. . . Vlll
I certify that an Examination Committee has met on 7 July 2008 to conduct the final examination of Tey Yeong Sheng on his Master of Science thesis entitled "Food Consumption Patterns and Trends in Malaysia" in accordance with Universiti Pertanian Malaysia (Higher Degree) Act 1980 and Universiti Pertanian Malaysia (Higher Degree) Regulation 198 1. The Committee recommends that the student be awarded the Master of Science.
Members of the Examination Committee were as follows:
Md. Ariff bin Hussien, PhD Professor Faculty of Agriculture Universiti Putra Malaysia (Chairman)
Mohd. Ghazali Mohayidin, PhD Professor Faculty of Agriculture Universiti Putra Malaysia (Internal Examiner)
Mohd. Mansor Ismail, PhD Associate Professor Faculty of Agriculture Universiti Putra Malaysia (Internal Examiner)
Abdul Harnid Jaafar, PhD Associate Professor Faculty of Economics and Business Universiti Kebangsaan Malaysia (External Examiner)
1
GHAZALI, PhD
Universiti Putra Malaysia
Date: 26 August 2008
This thesis was submitted to the Senate of Universiti Putra Malaysia and has been accepted as fulfilment of the requirement for the degree of Master of Science. The members of the Supervisory Committee were as follows:
Mad Nasir Shamsuddin, PhD Professor Faculty of Agriculture Universiti Putra Malaysia (Chairman)
Zainal Abidm Mohamed, PhD Associate Professor Faculty of Agriculture Universiti Putra Malaysia (Member)
Amin Mahir, PhD Lecturer Faculty of Agriculture Universiti Putra Malaysia (Member)
AINI IDERIS, PhD Professor and Dean School of Graduate Studies Universiti Putra Malaysia
Date: 11 September 2008
DECLARATION
I hereby declare that this thesis is based on my original work except for quotations and citations, which have been duly acknowledged. I also declare that it has not been previously or concurrently submitted for any other degree at UPM or other institutions.
Date: 23 August 2008
TABLE OF CONTENTS
Page
EDICATION 3STRACT 3STRAK 2KNOWLEGMENTS PPROVAL ECLARATION :ST OF TABLES :ST OF FIGURES :ST OF ABBREVIATIONS
CHAPTER
INTRODUCTION 1.1 Food Consumption in Malaysia 1.2 Problem Statements 1.3 Objectives 1.4 Significance of the Study 1.5 Organization of the Study 1.6 Summary of the Chapter
FOOD CONSUMPTION PATTERNS AND TRENDS 2.1 Food Expenditure Budget in Various Countries 2.2 Food Consumption Trends in Various Countries 2.3 Food Consumption Patterns in Various Counties 2.4 Food Expenditure Budget in Malaysia 2.5 Food Consumption Trends in Malaysia 2.6 Food Consumption Patterns in Malaysia 2.7 Summary of the Chapter
LITERATURE REVIEW 3.1 Previous Studies on Food Demand in Malaysia 3.2 Causes of the Changes in Food Consumption 3.3 Review of Demand Analysis Models
3.3.1 Linear Expenditure System 3.3.2 The Rotterdam Model 3.3.3 Working Leser's Model
3.3.4 Almost Ideal Demand System 3.3.5 Multi-stage Budgeting System
3.4 Review of Models for the Determinants Consumption 3.4.1 Almost Ideal Demand System 3.4.2 Ordinary Least Squares 3.4.3 Logit Model 3.4.4 Probit Model
. . . 111
iv vi viii ix xi xiv xvi xvii
3.1 3.1 3.3 3.7 3.8 3.8 3.9 3.10 3.13
of Food 3.14
xii
3.4.5 Tobit Model 3.17 Review of Models for Projection of Future Consumption 3.18 3.5.1 Single Equation Model 3.18 3.5.2 Tobit Model 3.18 Summary of the Chapter 3.19
METHODOLOGY 4.1 Theoretical Framework
4.1.1 Multi-stage Budgeting System 4.1.2 Determinants of Demand and Forecasting Model
4.2 Estimation Procedures 4.2.1 Engel Curve Analysis 4.2.2 Multi-stage Demand Analysis 4.2.3 The Effect of Demographic and Socio-economic
Factors on Food Consumption 4.2.4 Projection of Food Consumption Patterns and
Trend 4.3 Description of Household Expenditure Survey 200412005 4.4 Summary of the Chapter
RESULTS AND DISCUSSION 5.1 5.1 Descriptive Analysis 5.1 5.2 Engel Curve Analysis 5.6 5.3 Food Consumption Patterns and Comparison with Previous 5.7
Studies 5.4 Effects of Demographic and Socio-economic Factors on 5.15
Food Consumption 5.5 Projection of Food Consumption Patterns and Trends, 5.24
20 10-2020
SUMMARY AND CONCLUSION 6.1 Summary 6.2 Policy Implications 6.3 Suggestions for Future Research 6.4 Limitations of the Study 6.5 Summary of the Chapter
REFERENCES APPENDICES BIODATA OF STUDENT LIST OF PUBLICATIONS
. . . Xl l l
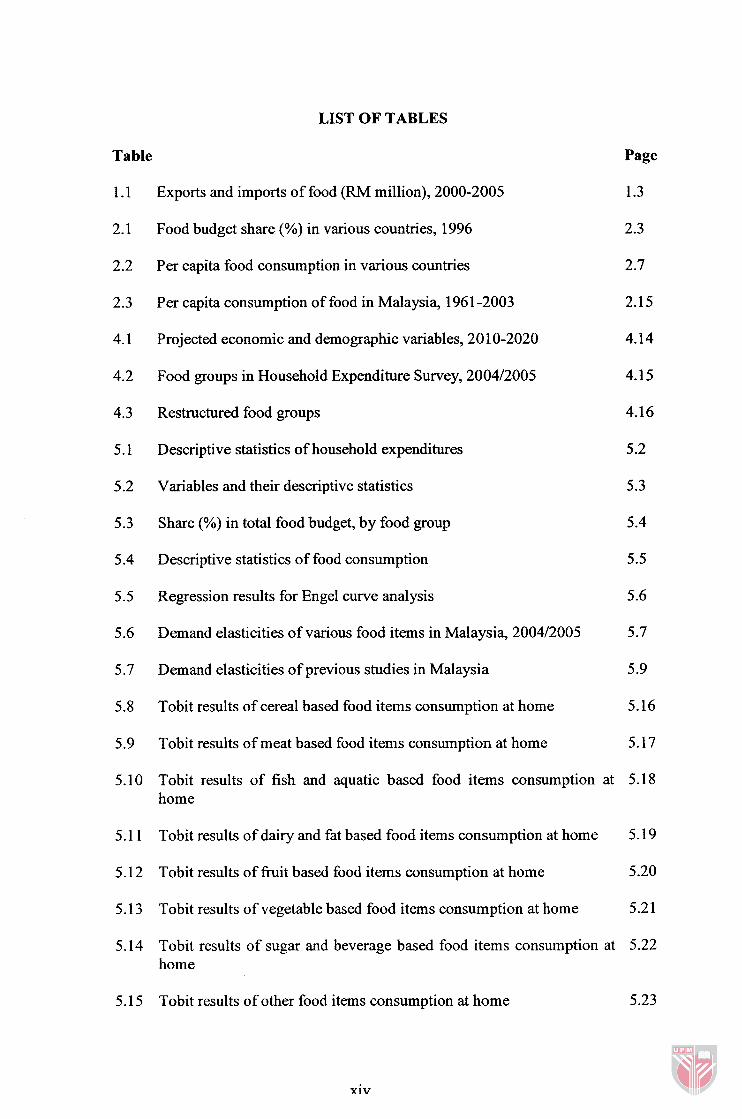
LIST OF TABLES
Table
Exports and imports of food (RM million), 2000-2005
Food budget share (%) in various countries, 1996
Per capita food consumption in various countries
Per capita consumption of food in Malaysia, 1961-2003
Projected economic and demographic variables, 20 10-2020
Food groups in Household Expenditure Survey, 200412005
Restructured food groups
Descriptive statistics of household expenditures
Variables and their descriptive statistics
Share (%) in total food budget, by food group
Descriptive statistics of food consumption
Regression results for Engel curve analysis
Demand elasticities of various food items in Malaysia, 200412005
Demand elasticities of previous studies in Malaysia
Tobit results of cereal based food items consumption at home
Tobit results of meat based food items consumption at home 5.17
Tobit results of fish and aquatic based food items consumption at 5.18 home
Tobit results of dairy and fat based food items consumption at home 5.19
Tobit results of fruit based food items consumption at home 5.20
Page
1.3
2.3
2.7
2.15
4.14
5.13 Tobit results of vegetable based food items consumption at home
5.13 Tobit results of sugar and beverage based food items consumption at 5.22 home
5.15 Tobit results of other food items consumption at home
xiv
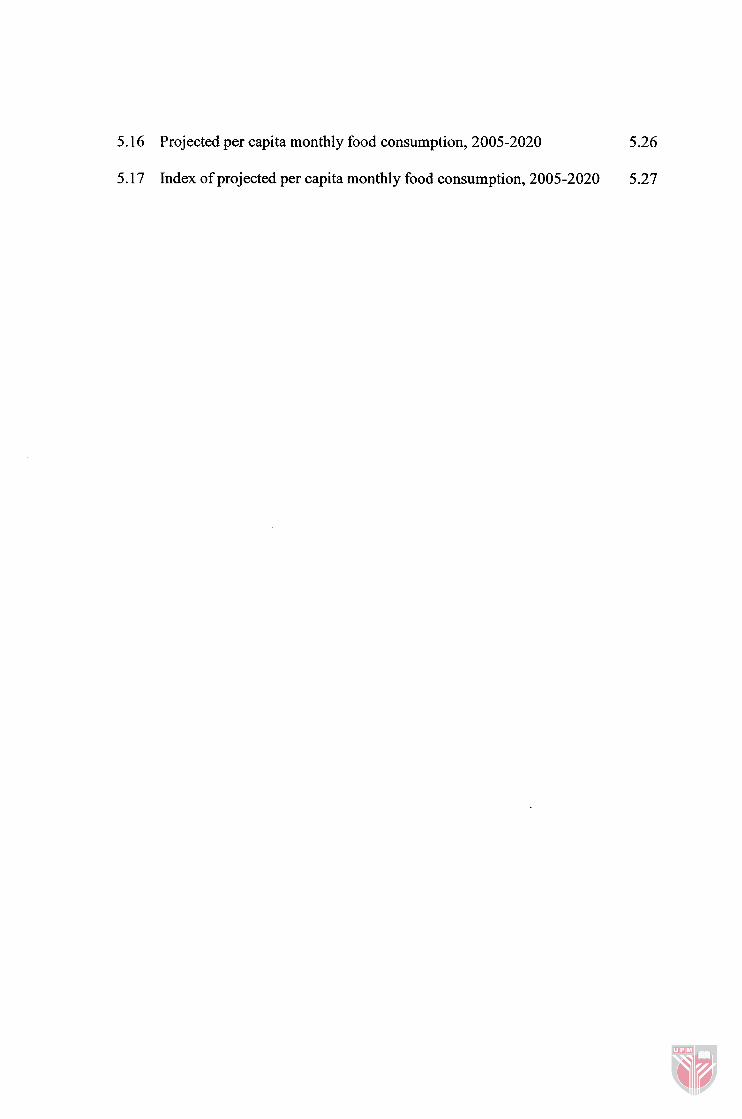
5.16 Projected per capita monthly food consumption, 2005-2020 5.26
5.17 Index of projected per capita monthly food consumption, 2005-2020 5.27
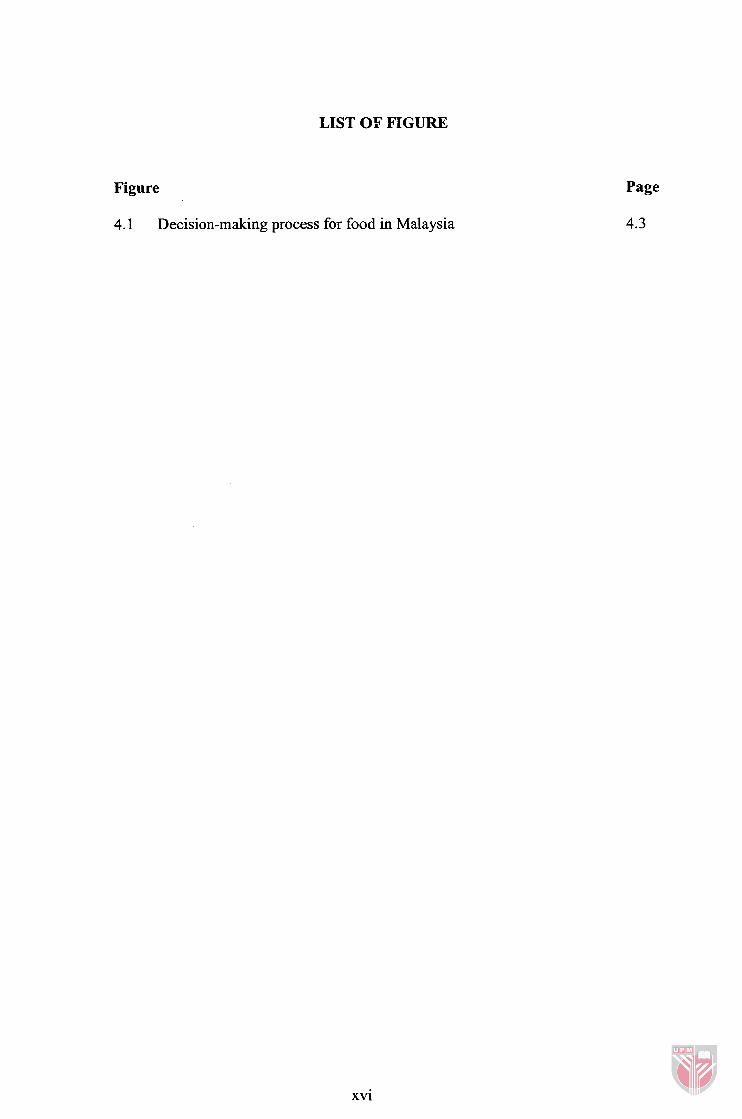
LIST OF FIGURE
Figure
4.1 Decisioil-making process for food in Malaysia
Page
4.3
xvi
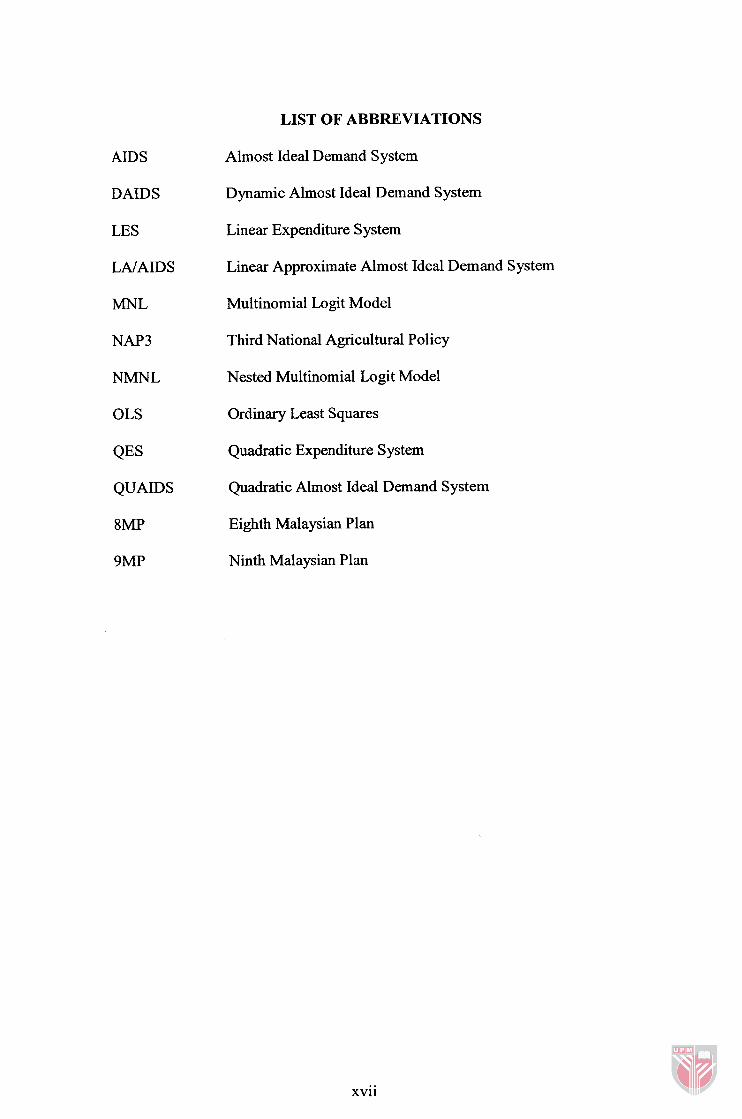
AIDS
DAIDS
LES
LAIAIDS
MNL
NAP3
NMNL
OLS
QES
QUAIDS
8MP
9MP
LIST OF ABBREVIATIONS
Almost Ideal Demand System
Dynamic Almost Ideal Demand System
Linear Expenditure System
Linear Approximate Almost Ideal Demand System
Multinomial Logit Model
Third National Agricultural Policy
Nested Multinomial Logit Model
Ordinary Least Squares
Quadratic Expenditure System
Quadratic Almost Ideal Demand System
Eighth Malaysian Plan
Ninth Malaysian Plan
xvii
CHAPTER 1
INTRODUCTION
This chapter is divided into five sections: an overview of food consumption, problem
statements, objectives, significance of this study, and organization for the other chapters.
1.1 Food Consumption in Malaysia
Food consumption trends are to illustrate the changes of per capita quantity in food
consumption over time. Food consumption patterns can be studied in two ways, namely
one based on the per capita quantity of food consumed and the other on demand
elasticities (Schaffner et al., 1998).
Changes in Malaysian food consumption have been described by Ishida et al. (2003) as
typical of those in developing countries. When per capita income of Malaysians grew
from very low levels immediately after independence, there was an increase in
consumption of the basic staple (rice). Further increase in per capita income led to
diversification in Malaysian diet. Per capita consumption of rice started to decline and
while per capita consumption of wheat started to increase in 1970's. At the same time,
the per capita consumption of the cheapest protein-rich meat, poultry started to increase
from low levels. The role of rice as the main staple food and main calorie provider was
offset even more significantly by a strong growth in per capita consumption of wheat
during rapid economic development within 1980's-2000's. Continuous increase in per
capita consumption of poultry experienced its peak in early 1990's while stronger
purchasing power has seen steady increase in per capita consumption ~f higher value
meat product, beef.
Changes of dietary of Malaysians are also reflected in the account of exports and imports
of foods in Malaysia as well. Table 1.1 shows that imports of foods totaled RM15 billion
in 2005, 46% more than in 2000. Though exports of foods are increasing, the amount is
rather small compared to the country's dependency on imports. Most of the high net
imports cannot be produced locally, for example, cereal. However, those can be locally
grown also accounted a large portion in imports.
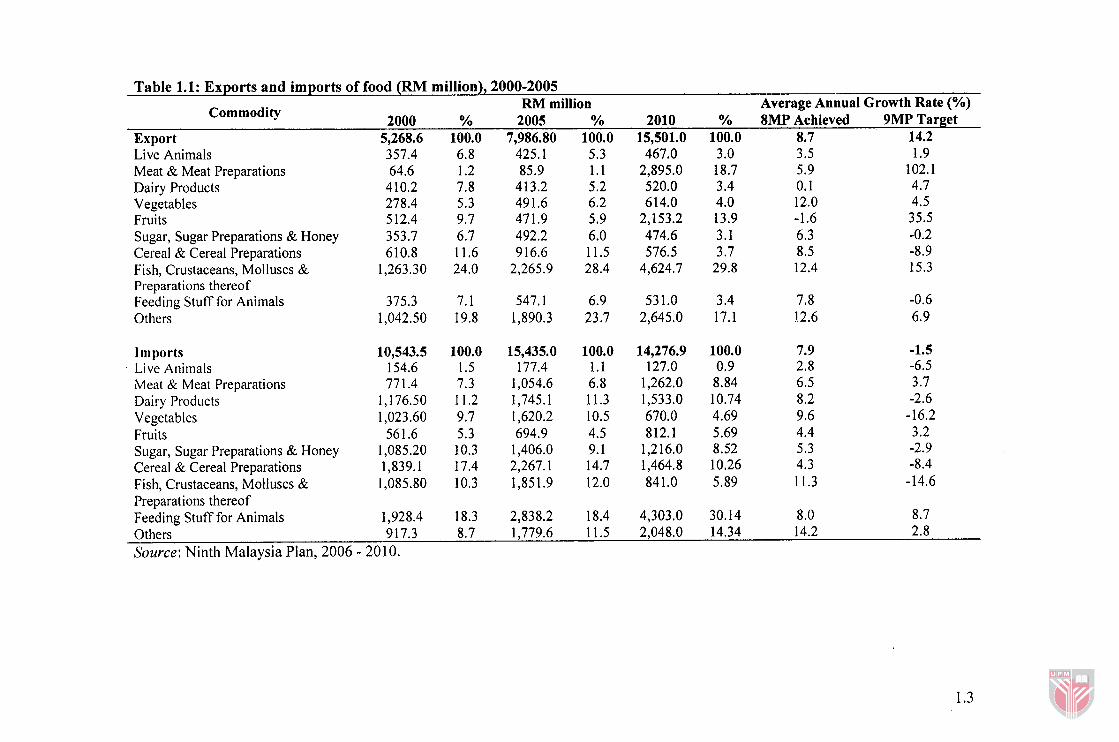
Table 1.1: Exports and imports o f food (RM million), 2000-2005 RM million Average Annual Growth Rate (%,
Commodity 2000 YO 2005 YO 2010 % 8MP Achieved 9MP Target Export 5,268.6 100.0 7,986.80 100.0 15.501.0 100.0 8.7 14.2 ~ i v e Animals Meat & Meat Preparations Dairy Products Vegetables Fruits Sugar, Sugar Preparations & Honey Cereal & Cereal Preparations Fish, Crustaceans, Molluscs & Preparations thereof Feeding Stuff for Animals Others
Imports Live Animals Meat & Meat Preparations Dairy Products Vegetables Fruits Sugar, Sugar Preparations & Honey Cereal & Cereal Preparations Fish, Crustaceans, Molluscs & Preparations thereof Feeding Stuff for Animals - Others 917.3 8.7 1,779.6 11.5 21048.0 14.34 14.2 2.8 Source: Ninth Malaysia Plan, 2006 - 2010.
1.2 Problem Statements
Ever since the crisis in 1997, Malaysian economic has been recovering and growing at
6% averagely. The higher per capita income, coupled with rapid urbanization process has
empowered changes in lifestyle, which normally refers to better living quality. These
economic and demographic changes have caused a rapid increase in demand for cereal
and meat based products. Such phenomena show that as these factors change over time,
the food consumption patterns change as well. For example, Ishida et al. (2003) obtained
different estimates of expenditure elasticities for meats over time, namely 0.34 in 1973,
0.42 in 1980, and 0.27 in 1993194.
By reviewing the current demand literatures for food in Malaysia, it is apparent that
several inadequacies arise from the lack of empirical studies on updated Malaysian food
consumption patterns especially after the economic crisis in 1997. Understanding the
changes in food patterns probably provides one of the best bases for adding value to agri-
food chain to meet the consumer needs and for appropriate policy formulation.
An obvious drawback in previous studies (Mustapha et al., 1999, 2000 and 2001;
Baharumshah and Mohamed, 1993; Mustapha, 1994; Radam et al., 2005) on food
demand in Malaysia is that they used expenditure elasticities' as the proxies for income
elasticities. Chem (2000) suggested that it is more appropriate to convert expenditure
' USDA (2008) defined expenditure elasticity as a measure of the responsiveness of demand to changes in expenditure on a bundle of similar goods. The expenditure elasticity shows how the quantity purchased changes (how sensitive it is) in response to a change in the consumer's expenditure, which is a proxy for income.
PEWUSTAKAAN SULTAN ABDUL SAlYlAO WlYMfRSlTI PIfCRA MALAYEM
elasticities into income elasticitiesii for use in projecting future demand for food. Thus,
this study is motivated to investigate the actual income elasticities rather than expenditure
elasticities.
Each economic or non-economic factor has a different impact on food consumption over
a lifetime. Changes in food consumption can be explained by price and income effects
where others can be explained by demographic characteristics. The demographic factors
such as urbanization, age and household size have been identified as other major
determinants of food consumption. For example, Chern (2000) showed that the decrease ---.--A . - - . -
in rice consumption is not due to income growth but it is because of urbanization effect,
where people consume more meat than rice as they migrate fiom rural region to urban
region. Understanding of the demographic factors that affect food consumption over time
is useful to predict what and how much people consume.
As the food supply chain is increasingly market-led, the ultimate challenge is engaged in
meeting current consumer wants. Past experience has shown the prevalence of supply-
demand mismatch for many of the food products like fish, vegetables and fruits. Though
imports are always available, the lack of an efficient marketing system and infrastructure
results in slow adjustments among domestic markets that have shortfalls in supplies. In
return, consumers are forced to pay more for the food product or seek substitute.
" USDA (2008) defined income elasticity as a measure of the responsiveness o f demand to changes in income. The income elasticity shows how the quantity purchased changes (how sensitive it is) in response to a change in the consumer's income.
Therefore, a study to project future food consumption till 2020 is essential to meet the
domestic demand in Malaysia.
1.3 Objectives
The general objective of this study is to investigate food consumption patterns and trends
in Malaysia. The specific objectives are:
a. To investigate food consumption patterns in Malaysia;
b. To determine the effects of demographic factors on the food consumption; and
c. To project the food consumption patterns and trends until 2020.
1.4 Significance of Study
The entire food industry is impacted by changes in food demand (Charlet and Henneberry,
2005). Farm organizations and Ministry of Agriculture officials are generally concerned
with matters such as adjustments in farm production to meet changing demands,
conservation, food distribution programs, the competition of imports with domestic
production, and potential export markets for surpluses. An understanding of the forces
shaping consumer demand is essential. As consumer behavior changes, many descriptive
facts about variations in consumption become outdated, food demand analysis can
improve understanding of domestic food trends by quantifying the relationship between
food demand and demographic factors. This knowledge in turn can provide crucial input
in assessing future food needs.
Government agencies are major users of data contrasting consumption trends and patterns
in Malaysia with other countries, and relating them to international economic
development. Thus, understanding the consumer behavior or the consumption patterns of
a country is crucial for government in designing its own economic plan and for other
countries in determining the market for their exports. Policy makers stay attuned to the
structural elements of food demand to improve public policies aimed at consumer well-
being.
Food marketing practitioners recognize the importance of both demographic and
economic factors as they develop and market food products. Malaysians are expected to
spend more on food in terms of quantities and qualities in future like other better
developed countries. This can be translated into opportunities for investors in the agri-
food sector. Thus, business groups take a very active interest. Indeed, they argue for
special tariff treatment or trade policies that will benefit their expansion in Malaysia.
Furthermore, a set of demographic variables can be used to classify households at various
stages of dietary transformation. For example, knowing some of the different
characteristics of households that demand for protein-rich diets can be useful in
segmenting the market.