united states and canadian stock markets
TRANSCRIPT
CFA Institute
United States and Canadian Stock MarketsAuthor(s): Bruce WhitestoneSource: Financial Analysts Journal, Vol. 16, No. 4 (Jul. - Aug., 1960), pp. 49-50Published by: CFA InstituteStable URL: http://www.jstor.org/stable/4469054 .
Accessed: 10/06/2014 14:29
Your use of the JSTOR archive indicates your acceptance of the Terms & Conditions of Use, available at .http://www.jstor.org/page/info/about/policies/terms.jsp
.JSTOR is a not-for-profit service that helps scholars, researchers, and students discover, use, and build upon a wide range ofcontent in a trusted digital archive. We use information technology and tools to increase productivity and facilitate new formsof scholarship. For more information about JSTOR, please contact [email protected].
.
CFA Institute is collaborating with JSTOR to digitize, preserve and extend access to Financial AnalystsJournal.
http://www.jstor.org
This content downloaded from 188.72.127.85 on Tue, 10 Jun 2014 14:29:01 PMAll use subject to JSTOR Terms and Conditions
United States and Canadian Stock M\arkets
by Bruce Whitestone
THE FOLLOWING STUDY briefly reviews the growth of the United States and Canadian economies, as well as two developing trends in North America as they are affecting both countries. This information is then ana- lyzed in conjunction with a comparative valuation of the two stock markets.
Canada's industrial development is strongly influ- enced by events and conditions in the United States, and our economy is a small-scale reflection of many, but not all, of the influences at work there.
Thus it is logical that the economic forecasts for Canada for 1960, based on current estimates, are very similar to those forecast for the United States.
Although the Canadian stock market recently moved down in sympathy with New York, the decline was not as severe.
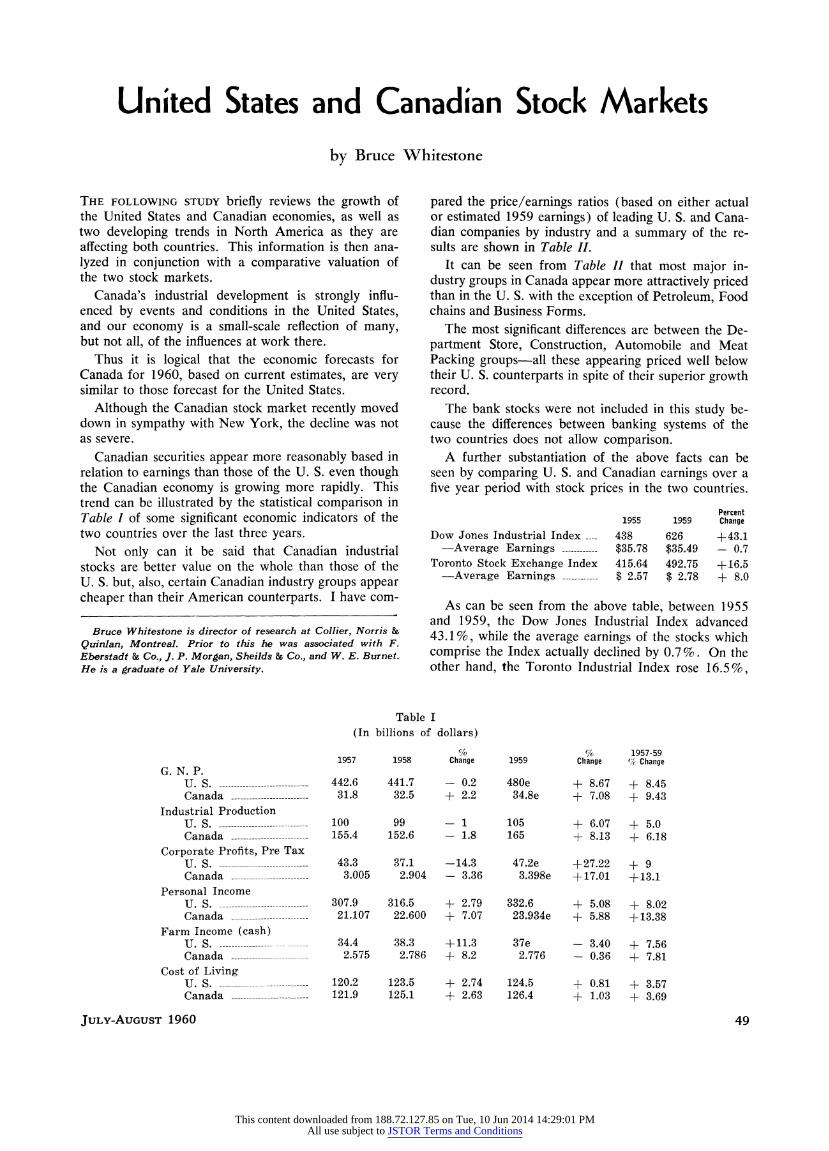
Canadian securities appear more reasonably based in relation to earnings than those of the U. S. even though the Canadian economy is growing more rapidly. This trend can be illustrated by the statistical comparison in Table I of some significant economic indicators of the two countries over the last three years.
Not only can it be said that Canadian industrial stocks are better value on the whole than those of the U. S. but, also, certain Canadian industry groups appear cheaper than their American counterparts. I have com-
pared the price/earnings ratios (based on either actual or estimated 1959 earnings) of leading U. S. and Cana- dian companies by industry and a summary of the re- sults are shown in Table II.
It can be seen from Table II that most major in- dustry groups in Canada appear more attractively priced than in the U. S. with the exception of Petroleum, Food chains and Business Forms.
The most significant differences are between the De- partment Store, Construction, Automobile and Meat Packing groups-all these appearing priced well below their U. S. counterparts in spite of their superior growth record.
The bank stocks were not included in this study be- cause the differences between banking systems of the two countries does not allow comparison.
A further substantiation of the above facts can be seen by comparing U. S. and Canadian earnings over a five year period with stock prices in the two countries.
Percent 1955 1959 Change
Dow Jones Industrial Index 438 626 +43.1 -Average Earnings - $35.78 $35.49 - 0.7
Toronto Stock Exchange Index 415.64 492.75 +:16.5 -Average Earnings - $ 2.57 $ 2.78 + 8.0
As can be seen from the above table, between 1955 and 1959, the Dow Jones Industrial Index advanced 43.1%, while the average earnings of the stocks which comprise the Index actually declined by 0.7%. On the other hand, the Toronto Industrial Index rose 16.5%,
Bruce Whitestone is director of research at Collier, Norris & Quinlan, Montreal. Prior to this he was associated with F. Eberstadt & Co., J. P. Morgan, Sheilds & Co., and W. E. Burnet. He is a graduate of Yale University.
Table I (In billions of dollars)
% %As 1957-59 1957 1955 Change 1959 Change ((/ Change
G. N. P. U. s.-442.6 441.7 - 0.2 480e + 8.67 + 8.45 Canada -31.8 32.5 + 2.2 34.8e + 7.08 + 9.43
Industrial Production U. s. - --------- 100 99 - 1 105 + 6.07 + 5.0 Canada -155.4 152.6 - 1.8 165 + 8.13 + 6.18
Corporate Profits, Pre Tax U. s. -43.3 37.1 -14.3 47.2e + 27.22 + 9 Canada - -3.005 2.904 - 3.36 3.398e +17.01 +13.1
Personal Income U. S. -307.9 316.5 + 2.79 332.6 + 5.08 + 8.02 Canada - -21.107 22.600 + 7.07 23.934e + 5.88 + 13.38
Farm Income (cash) U. s. -- 34.4 38.3 +11.3 37e - 3.40 + 7.56 Canada -- 2.575 2.786 + 8.2 2.776 - 0.36 + 7.81
Cost of Living U. S. ----------------- 120.2 123.5 + 2.74 124.5 + 0.81 + 3.57 Canada -- 121.9 125.1 + 2.63 126.4 + 1.03 + 3.69
JULY-AUGUST 1960 49
This content downloaded from 188.72.127.85 on Tue, 10 Jun 2014 14:29:01 PMAll use subject to JSTOR Terms and Conditions
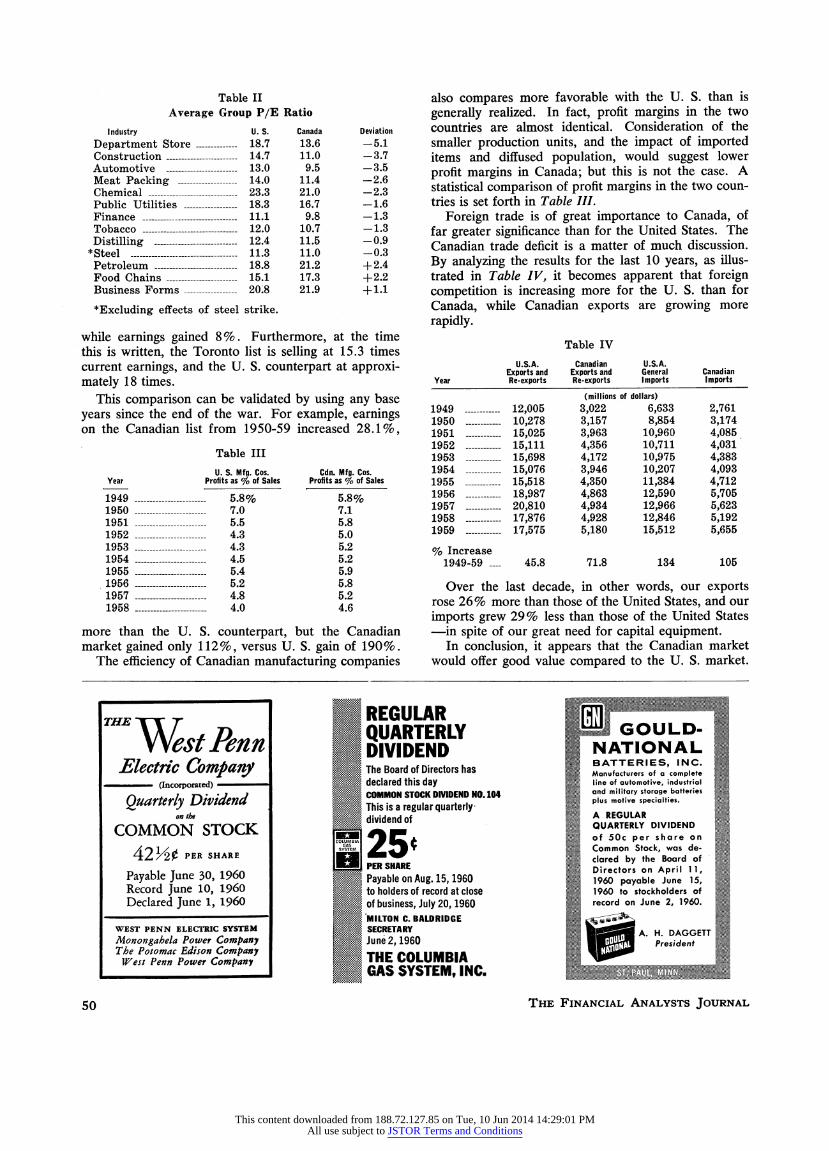
Table II Average Group P/E Ratio
Industry U. S. Canada Deviation
Department Store -18.7 13.6 -5.1 Construction -14.7 11.0 -3.7 Automotive -13.0 9.5 -3.5 Meat Packing -14.0 11.4 -2.6 Chemical -23.3 21.0 -2.3 Public Utilities -18.3 16.7 -1.6 Finance -11.1 9.8 -1.3 Tobacco -12.0 10.7 -1.3 Distilling -12.4 11.5 -0.9
*Steel -11.3 11.0 -0.3 Petroleum -18.8 21.2 + 2.4 Food Chains -15.1 17.3 +2.2 Business Forms -20.8 21.9 + 1.1
*Excluding effects of steel strike.
while earnings gained 8%. Furthermore, at the time this is written, the Toronto list is selling at 15.3 times current earnings, and the U. S. counterpart at approxi- mately 18 times.
This comparison can be validated by using any base years since the end of the war. For example, earnings on the Canadian list from 1950-59 increased 28.1%,
Table III
U. S. Mfg. Cos. Cdn. Mfg. Cos. Year Profits as % of Sales Profits as % of Sales
1949 -5.8% 5.8% 1950 -7.0 7.1 1951 -5.5 5.8 1952 -4.3 5.0 1953 -4.3 5.2 1954 -4.5 5.2 1955 -5.4 5.9 1956 -5.2 5.8 1957 -4.8 5.2 1958 -4.0 4.6
more than the U. S. counterpart, but the Canadian market gained only 112%, versus U. S. gain of 190%.
The efficiency of Canadian manufacturing companies
also compares more favorable with the U. S. than is generally realized. In fact, profit margins in the two countries are almost identical. Consideration of the smaller production units, and the impact of imported items and diffused population, would suggest lower profit margins in Canada; but this is not the case. A statistical comparison of profit margins in the two coun- tries is set forth in Table III.
Foreign trade is of great importance to Canada, of far greater significance than for the United States. The Canadian trade deficit is a matter of much discussion. By analyzing the results for the last 10 years, as illus- trated in Table IV, it becomes apparent that foreign competition is increasing more for the U. S. than for Canada, while Canadian exports are growing more rapidly.
Table IV
U.S.A. Canadian U.S.A. Exports and Exports and General Canadian
Year Re-exports Re-exports Imports Imports
(millions of dollars) 1949 - 12,005 3,022 6,633 2,761 1950 - 10,278 3,157 8,854 3,174 1951 - 15,025 3,963 10,960 4,085 1952 - 15,111 4,356 10,711 4,031 1953 - 15,698 4,172 10,975 4,383 1954 - 15,076 3,946 10,207 4,093 1955 - 15,518 4,350 11,384 4,712 1956 - 18,987 4,863 12,590 5,705 1957 - 20,810 4,934 12,966 5,623 1958 - 17,876 4,928 12,846 5,192 1959 - 17,575 5,180 15,512 5,655
% Increase 1949-59 45.8 71.8 134 105
Over the last decade, in other words, our exports rose 26% more than those of the United States, and our imports grew 29% less than those of the United States -in spite of our great need for capital equipment.
In conclusion, it appears that the Canadian market would offer good value compared to the U. S. market.
THE l REGULAR West Pe; n l ;QUARTERLY OU
vvestrenn l DIVIDEND N IONAL .lYectric C'ompany7 | The Board of Directors has Manufacturers of a complete
(Incorporated) declared this day line of automotive, industrial
COMMON STOCK DWIDEND NO. 104 and military storage batteries
Quarterly Dividend ~~~~~~This is a regular quarterly- plus motive specialties.
on the dividend of A REGULAR
COMMON STOCK O l ^ = e | QUARTERLY DIVIDEND COMMON STOCK - ~~~~~~~~~~~~of 50c per share on
42Y20 PER SHARE ~~~~~~~~~~~~~~Common Stock, was die-
42h2?PPER SHARE aSHARE clred by the Board of
Payable June 30, 1960RSHAREDirectors on April11
Payable June 30, 1960 Payable on Aug. 15, 1960 1 p June 15,
Record June 10, 1960 to holders of record at close 1960 to stockholders of
Declared June 1, 1960 of business, July 20, 1960 record on June 2, 1960.
MILTON C. BALDRIDGE i WEST PENN ELECTRIC SYSTEM SECRETARY A. H. DAGGETT
Mlonongahela Power Company June'2, 1960 President The Potomac Edison Company THE COLUMBIA
West Penn Power Compan-y GAS SYSTEM,BINC 0 TGAS SYSTE , INC,
50 THE FINANCIAL ANALYSTS JOURNAL
This content downloaded from 188.72.127.85 on Tue, 10 Jun 2014 14:29:01 PMAll use subject to JSTOR Terms and Conditions