unit 32: atomic spectra and early quantum theory · unit 32: atomic spectra and early quantum...
TRANSCRIPT

Name ______________________ Date(YY/MM/DD) ______/_________/_______ St.No. __ __ __ __ __-__ __ __ __ Section_________Group #________
UNIT 32: ATOMIC SPECTRA AND EARLY QUANTUM THEORY
Emission spectra of hydrogen and iron. (Wikimedia commons)
OBJECTIVES
1. To observe various atomic spectra with a diffraction grating spectrometer.
2. To analyse the visible spectrum of Hydrogen gas and understand how it relates to the atomic structure of the Hydrogen atom.
3. To examine some of the early experiments in the quantum nature of light that led to the beginnings of quantum mechanics.
© 2014 by S. Johnson.

SESSION ONE: ATOMIC SPECTRA
An important property of an atom is its characteristic set of energy levels. Each energy level corresponds to one of the different configurations of orbital electrons allowed by the quantum theory of atomic structure. The energy levels may be shown on an energy level diagram, such as Fig. 32.1 (drawn for a hypothetical atom).
E1
E2
E3
E4E5E∞
Incr
easi
ng E
nerg
y
Figure 32.1: Energy levels in a hypothetical atom
The lowest energy state of an atom is called the ground state (level E1 in Fig. 32.1). If an atom were totally isolated from any other interactions it would be in its ground state. An atom can be excited to higher energy states, E2, E3,... through collisions with light, electrons or other atoms. A higher energy level is the result of one or more electrons going to a higher energy orbital around the atom. Only definite, discrete levels are possible, i.e. the energy levels are “quantized”. In an excited atom, an electron can make a spontaneous transition from a higher energy orbital to one of the lower energy orbitals (See Figure 32.2). When this occurs the atom emits light in the form of a photon (a quantum of light) that has an energy equal to the difference in energy between the two levels (initial - final) :
E(photon) = ΔE = Ei - Ef (32.1)
The frequency of the light f is proportional to the energy change:
E(photon) = ΔE = hf (32.2)
where h is a constant known as Planck’s constant.
Page 32-2 Studio Physics Activity Guide SFU
© 2014 by S. Johnson.

Figure 32.2: Schematic of atomic absorption and emission of a photon.
Because the arrangement of energy levels is unique for each type of atom, the characteristic set of frequencies of light emitted by an atom when it undergoes transitions is also unique and so can be used to identify the atom. These characteristic sets of frequencies for different atoms are known as atomic spectra. In this unit we will examine several different atomic spectra.
For the following activities you will need:
• Optics Kit• spectrometer Post-its from Unit 31• 4 spectrum lamps (Hydrogen, Helium, Neon and
Mercury)
Unit 32 – Atomic Spectra and Early Quantum Theory Page 32-3Author: Sarah Johnson
© 2014 by S. Johnson. Adapted from PHYS 131 Optics lab #4

✍ Activity 32-1: Qualitative Evaluation of Atomic Spectra(a) Four spectrum lamps have been set-up for you to observe with your diffraction grating spectrometer. (You will have to reconstruct the spectrometer you built in Unit 31. If you’re having a hard time seeing the spectra with this home-made spectrometer you may switch to one of the plastic spectrometers.) The lamps have tubes which contain the following gases: Hydrogen, Mercury, Neon and Helium. The lamps have labels A-D. Based on your observations and comparisons with a chart of known atomic spectra, try to identify which gas they are. In each case, explain the reasoning behind your choice.
A:
B:
C:
D:
Page 32-4 Studio Physics Activity Guide SFU
© 2014 by S. Johnson.

The Balmer SeriesThe set of frequencies emitted by Hydrogen atoms that fall in the visible part of the electromagnetic spectrum and so can be viewed with our spectrometers are known as the Balmer series. These frequencies results from electronic transitions from higher energy orbitals to the n = 2 orbital. In the following activity you will derive a formula that can be used to calculate the wavelengths of these spectral lines.
✍ Activity 32-2: The Balmer Series - Theory(a) According to the Bohr model of the atom, the energy levels for Hydrogen are quantized according to the following formula:
€
En =−(13.6 eV )
n2n =1,2,3,...
where n is known as the principal quantum number. Using this formula and Equ. 32.1 write an expression for the energy of the photon that would be emitted if an electron makes a transition from a level with quantum number ni (initial) to a level with quantum number nf (final).
(b) Now using your result from part (a) and Equ. 32.2, write an expression for the frequency of the photon emitted.
(c) Now write an expression for the inverse wavelength of the photon, 1/λ, using the fact that: λf = c.
Unit 32 – Atomic Spectra and Early Quantum Theory Page 32-5Author: Sarah Johnson
© 2014 by S. Johnson. Adapted from PHYS 131 Optics lab #4

(d) Plug in the numerical values of Plank’s constant h and the speed of light c given below to arrive at a formula for the inverse wavelength that only depends on a numerical constant and the initial and final quantum numbers.
h = 4.136 · 10-15 eV·s c = 3.00 x 10⁸ m/s
(e) Hopefully, if all went well, you should have arrived at a formula that looks like the following:
€
1λ
= R 1n f2 −
1ni2
⎛
⎝ ⎜ ⎜
⎞
⎠ ⎟ ⎟ (32.3)
where R is known as the Rydberg constant. Write your value for the Rydberg constant below and have your instructor check your result before you continue on.
The Balmer series spectral lines are due to transitions to the nf = 2 energy level from energy levels with larger quantum numbers so one can use the following formula to determine the wavelengths of the emitted photons:
€
1λ
= R 122−1n2
⎛
⎝ ⎜
⎞
⎠ ⎟ n = 3,4,5,...
(32.4) In the next activity you will compare the predictions of this formula with the actual wavelengths you observe.
Page 32-6 Studio Physics Activity Guide SFU
© 2014 by S. Johnson.

✍ Activity 32-3: The Balmer Series - Observation(a) Record the wavelengths for the red, blue and violet lines you observe in the spectrum of the Hydrogen lamp. (You may need to use one of the plastic spectrometers if you can not see some of the lines with the spectrometer you made.)
(b) Using Equ. 32.4, determine the n values for the initial energy levels from which an electron must transition in order to create these spectral lines. Remember that the quantum numbers must be integers so you will have to round off your results to the nearest integer.
(c) Use the quantum numbers you found in part (b) and Equ. 32.4 to calculate the theoretical values for the wavelengths of these spectral lines. Fill in the table below and calculate the percent differences between your observed wavelengths and the theoretical values.
λ(obs) λ(theory) %difference
Unit 32 – Atomic Spectra and Early Quantum Theory Page 32-7Author: Sarah Johnson
© 2014 by S. Johnson. Adapted from PHYS 131 Optics lab #4

✍ Problem Solving Activity 32-4: The Lyman and Paschen Series(a) The set of spectral lines created when the electron in a Hydrogen atom makes transitions from higher orbitals to the n = 1 state is called the Lyman series. Determine using Equ. 32.3 what the largest and smallest wavelengths in this series are. What part of the electromagnetic spectrum (visible, ultraviolet, infrared, etc...) do these wavelengths fall?
(b) The set of spectral lines created when the electron in a Hydrogen atom makes transitions from higher orbitals to the n = 3 state is called the Paschen series. Determine using Equ. 32.3 what the largest and smallest wavelengths in this series are. What part of the electromagnetic spectrum (visible, ultraviolet, infrared, etc...) do these wavelengths fall?
Page 32-8 Studio Physics Activity Guide SFU
© 2014 by S. Johnson.

SESSION TWO: EARLY QUANTUM THEORY
A variety of experiments and observations made during the early 1900’s by many different scientists contributed to the introduction of Quantum Theory. It is now understood that Quantum Theory governs the behaviour of systems at very small length scales. We will examine several of these early Quantum Theory experiments.
Most physicists consider the beginning of the path to Quantum Theory to be Planck’s quantum hypothesis. In 1900 Max Planck proposed a theory that explained the shape of EM radiation curves emitted by ideal radiating objects known as blackbodies. An example of the radiation curves (plots of EM radiation intensity vs wavelength) exhibited by a blackbody at various temperatures is shown in Figure 32.3. Also shown as a dashed line is the curve that the classical (non-quantum) theory predicts. As can be seen in the figure, the classical theory does not agree with the experimental data at smaller wavelengths.
Figure 32.3: Radiation curves for an ideal blackbody at three different temperatures and the curve classical theory predicts for such a radiating object.
One notable feature of blackbody radiation curves is that the maximum intensity occurs at a wavelength, λp, whose value varies with temperature. It was found experimentally that the product of the peak wavelength, λp, and the temperature in Kelvin is a constant:
λpT = 2.90 x 10⁻³ mK (32.5)
This relationship is known as Wien’s Law.
Unit 32 – Atomic Spectra and Early Quantum Theory Page 32-9Author: Sarah Johnson
© 2014 by S. Johnson. Adapted from PHYS 131 Optics lab #4

✍ Activity 32-5: Wien’s LawUsing equation 32.5, estimate the peak wavelength for the blackbody radiation from the following. Also state in which region of the EM spectrum each occurs. (a) ice at 00 C
(b) a floodlamp at 3500 K
(c) liquid Helium at 4 K
(d) the universe at 2.73 K
Page 32-10 Studio Physics Activity Guide SFU
© 2014 by S. Johnson.

Quantized Energy and Light
Planck’s theory encompasses a radical assumption, that the energies of atomic oscillations which produce blackbody radiation are quantized. By this we mean that the energy cannot have just any value, but that the energies are multiples of a minimum value E = hf such that the allowed oscillation energies are:
E = nhf n = 1, 2, 3 ... (32.6)
where h is a quantity now known as Planck’s constant and had a value equal to:
h = 6.626 x 10⁻³⁴ Js
f is the frequency of oscillation and the integer n is referred to as a quantum number. When a physical quantity is not continuous, but rather takes on discrete values i.e. it comes in “steps” then we say that physical quantity is quantized. We might refer to the size of the energy “step” as a quantum of energy.
The Photoelectric Effect
In 1905 Albert Einstein took Planck’s idea and extended it to introduce a new theory of light. He argued that the EM radiation that is emitted by atomic oscillations is emitted in the form of packets or quanta of light. Each
Unit 32 – Atomic Spectra and Early Quantum Theory Page 32-11Author: Sarah Johnson
© 2014 by S. Johnson. Adapted from PHYS 131 Optics lab #4
quantum of light, which we now call a photon, has an energy equal to:
E = hf (32.7)
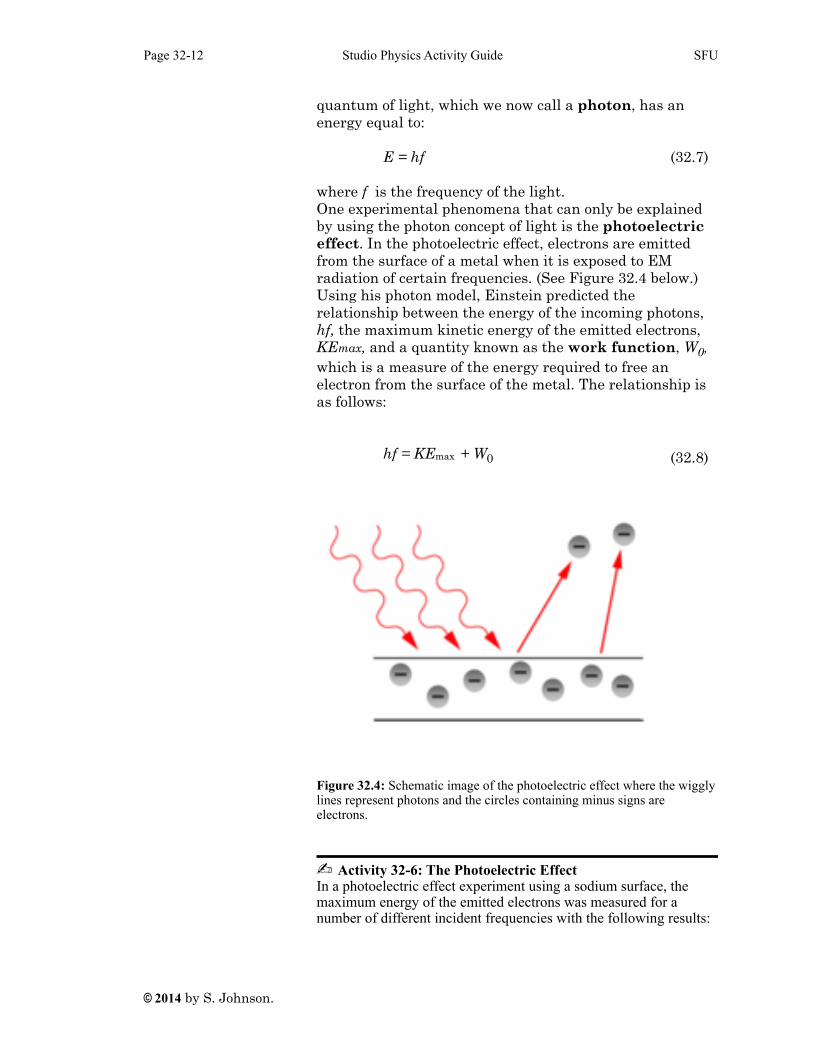
where f is the frequency of the light. One experimental phenomena that can only be explained by using the photon concept of light is the photoelectric effect. In the photoelectric effect, electrons are emitted from the surface of a metal when it is exposed to EM radiation of certain frequencies. (See Figure 32.4 below.) Using his photon model, Einstein predicted the relationship between the energy of the incoming photons, hf, the maximum kinetic energy of the emitted electrons, KEmax, and a quantity known as the work function, W0,
which is a measure of the energy required to free an electron from the surface of the metal. The relationship is as follows:
hf = KEmax + W0 (32.8)
Figure 32.4: Schematic image of the photoelectric effect where the wiggly lines represent photons and the circles containing minus signs are electrons.
✍ Activity 32-6: The Photoelectric EffectIn a photoelectric effect experiment using a sodium surface, the maximum energy of the emitted electrons was measured for a number of different incident frequencies with the following results:
Page 32-12 Studio Physics Activity Guide SFU
© 2014 by S. Johnson.
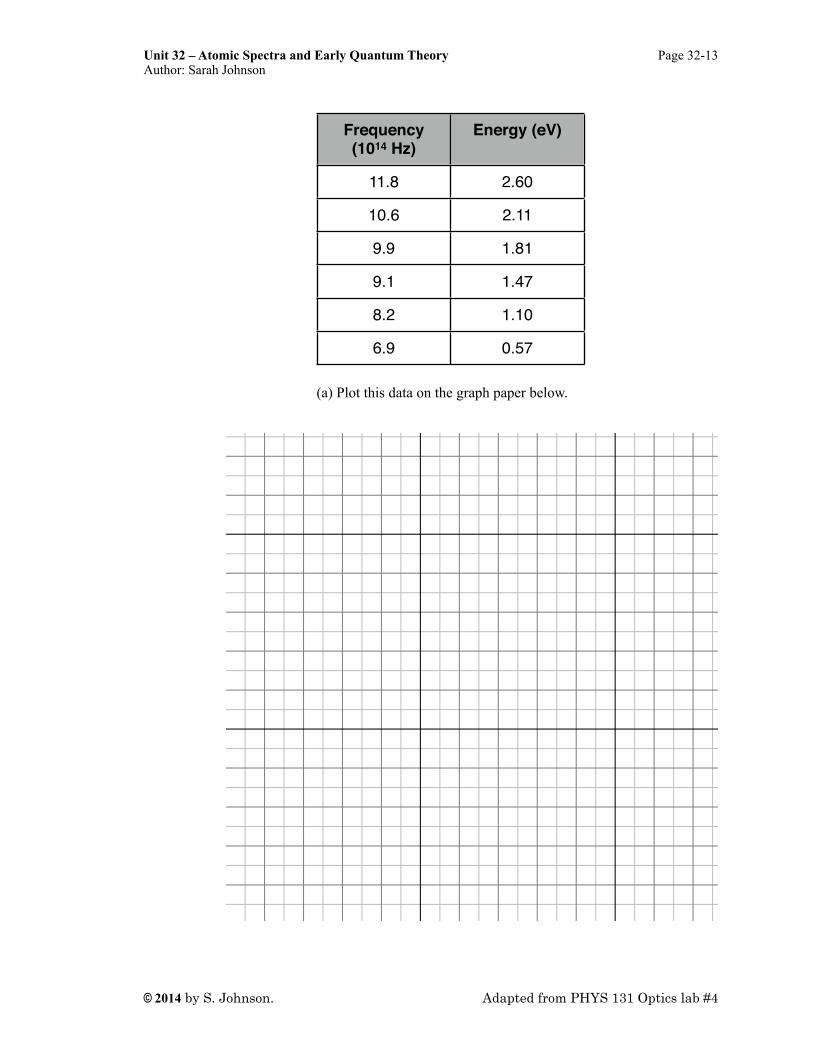
Frequency (1014 Hz)
Energy (eV)
11.8 2.60
10.6 2.11
9.9 1.81
9.1 1.47
8.2 1.10
6.9 0.57
(a) Plot this data on the graph paper below.
Unit 32 – Atomic Spectra and Early Quantum Theory Page 32-13Author: Sarah Johnson
© 2014 by S. Johnson. Adapted from PHYS 131 Optics lab #4

(b) From your graph determine a value for Planck’s constant.
(c) From your graph determine a value for the work function of the metal.
(d) Find a value for the cut-off frequency, which is the frequency of light below which no electrons will be emitted from the surface of the metal.
Page 32-14 Studio Physics Activity Guide SFU
© 2014 by S. Johnson.

The Bohr Model of the Atom
To understand the atomic spectra we studied in the first section of this Unit, we used the Bohr Model of the atom. Niels Bohr developed this semi-classical model of the atom which incorporated the work of Einstein and Planck. In particular, this model predicts that the energy states of electrons within atoms are quantized and that if an electron changes energy states a photon must either be emitted or absorbed. He called these energy states stationary states because contrary to classical theory despite being in orbit the electrons do not radiate EM waves unless they change states. Bohr’s model is described in detail in most first-year physics textbooks. We will work through some of Bohr’s derivation of this model below. As you’ll see, you will be using your knowledge of classical electromagnetism and mechanics.
Figure 32.5: Classical picture of an electron in orbit of radius r about the nucleus in a Hydrogen-like atom (only one electron).
✍ Activity 32-7: The Bohr Model(a) Imagine an electron in a circular orbit of radius r about a nucleus with a charge of q = +Ze. Write down an expression for the magnitude of the electrostatic force between the electron and the nucleus.
Unit 32 – Atomic Spectra and Early Quantum Theory Page 32-15Author: Sarah Johnson
© 2014 by S. Johnson. Adapted from PHYS 131 Optics lab #4

(b) Classically this force would produce a centripetal acceleration a = v2/r. Using this fact and the value for this force from (a) find an expression for the radius of the orbit.
(c) As you know, the potential energy of a point charge q at a distance r from another point charge q′ can be expressed as PE = qV where V = kq′/r. Write an expression for the potential energy of an electron a distance r from a nucleus with charge Ze.
(d) The total energy of the electron can be expressed as a sum of its kinetic energy KE = ½mv2 and its potential energy PE. Using the potential energy you found in (c) write an expression for the total energy E of an electron in an atom.
Page 32-16 Studio Physics Activity Guide SFU
© 2014 by S. Johnson.

(e) Now, by solving the expression you found for the radius of the orbit in (b) for mv2 show that the total energy of the electron in an atom is equal to: E = –½kZe2/r.
(f) This is where the quantum mechanics comes in. Bohr determined from examining the Balmer formula that his theory would agree with atomic spectra experiments if the only allowed orbits were those where the angular momentum L of the electron is quantized in units of h/2π :
L = mvrn = n(h/2π) n = 1,2,3 ... (32.9)
where rn is the radius of the orbit which has quantum number n. Write an expression for v in terms of m, rn, n and h.
(g) Plug your expression for v from (f) into the expression you got for r in (b) to get an expression for rn. (Remember that both r’s are quantized now.)
Unit 32 – Atomic Spectra and Early Quantum Theory Page 32-17Author: Sarah Johnson
© 2014 by S. Johnson. Adapted from PHYS 131 Optics lab #4

(h) Take your expression for rn from (g) and using the result from (e) write an expression for the quantized energy levels En . You should be able to come up with an expression for En that only contains physical constants and the quantum number n (no r or v ). Have your instructor check your result before continuing.
(i) Now plug in the values for the various constants in your expression for the quantized energy and show that the result is:
€
En = −(13.6 eV ) Z2
n2n =1,2,3…
(32.10)
Show the whole calculation for this including all of the values you plugged in and any unit conversions you did below. Have your instructor check your result before moving on.
Page 32-18 Studio Physics Activity Guide SFU
© 2014 by S. Johnson.

One of the biggest successes of Bohr’s model was that it correctly predicts the wavelengths of the Balmer lines in the Hydrogen spectrum which as we saw previously can be determined with the following formula:
€
1λ
= R 122−1n2
⎛
⎝ ⎜
⎞
⎠ ⎟ n = 3,4,5,...
(32.4)
The Bohr model, though not a full quantum mechanical model, can be used to make predictions for Hydrogen-like atoms where there is only one electron in orbit about the nucleus. The general formula for the wavelength of an emitted photon from a Hydrogen-like atom is:
€
1λ
= RZ 2 1n f
2 −1ni2
⎛
⎝ ⎜ ⎜
⎞
⎠ ⎟ ⎟ (32.11)
✍ Problem Solving Activity 32-8: Using the Bohr Model(a) An ionized helium atom (He+) makes a transition from the n = 6 state to the n = 2 state, emitting a photon. Determine the wavelength and the energy of this photon.
Unit 32 – Atomic Spectra and Early Quantum Theory Page 32-19Author: Sarah Johnson
© 2014 by S. Johnson. Adapted from PHYS 131 Optics lab #4

(b) Can the photon in (a) be absorbed by hydrogen atoms? If so, between what energy states will the electron in the hydrogen atom jump? Justify your answer. Show all of your work below.
Page 32-20 Studio Physics Activity Guide SFU
© 2014 by S. Johnson.