understanding regional climate variations : gcm validation ... · understanding regional climate...
TRANSCRIPT
Understanding Regional Climate Variations :
GCM Validation and Assessment using PWV
Robert Knuteson, Jacola Roman*,
Henry Revercomb, William Smith, David Tobin
University of Wisconsin-Madison
Space Science and Engineering Center
*Department of Atmospheric and Oceanic Sciences
CLARREO Science Definition Team Meeting
12-14 October 2011 Madison, WI
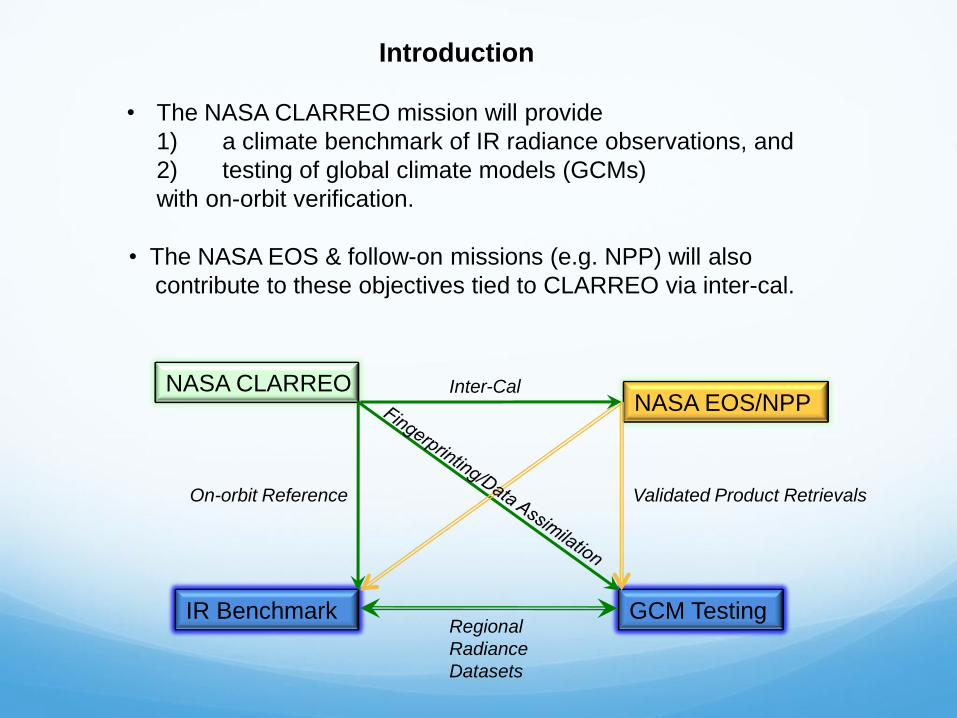
Introduction
• The NASA CLARREO mission will provide
1) a climate benchmark of IR radiance observations, and
2) testing of global climate models (GCMs)
with on-orbit verification.
IR Benchmark GCM Testing
NASA CLARREO NASA EOS/NPP
Inter-Cal
• The NASA EOS & follow-on missions (e.g. NPP) will also
contribute to these objectives tied to CLARREO via inter-cal.
Validated Product Retrievals On-orbit Reference
Regional
Radiance
Datasets
AIRS version 5
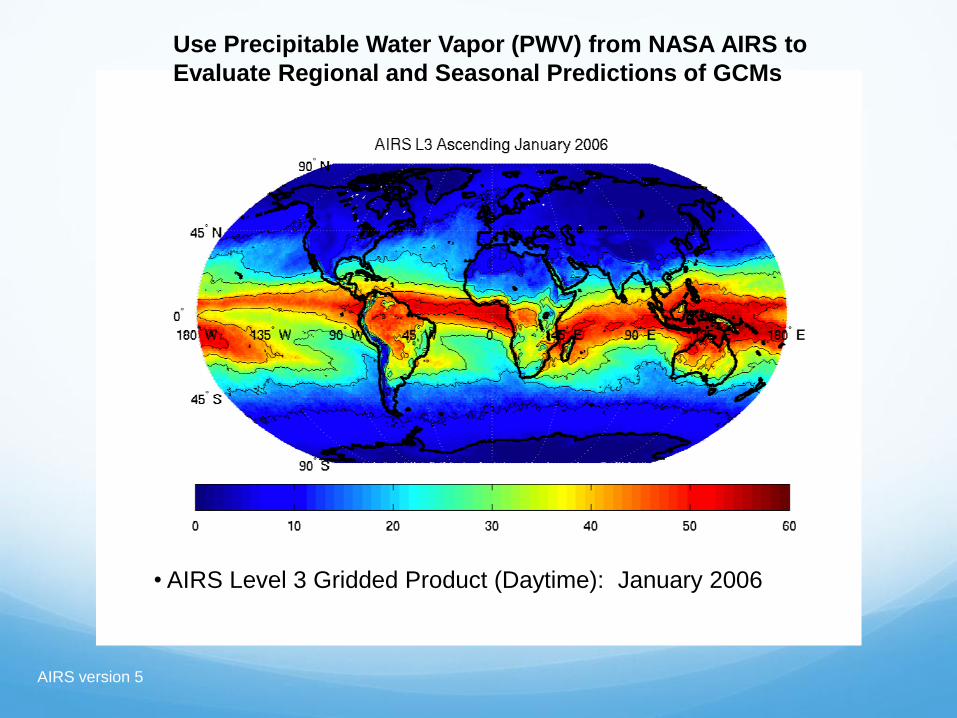
Use Precipitable Water Vapor (PWV) from NASA AIRS to
Evaluate Regional and Seasonal Predictions of GCMs
• AIRS Level 3 Gridded Product (Daytime): January 2006
AIRS version 5
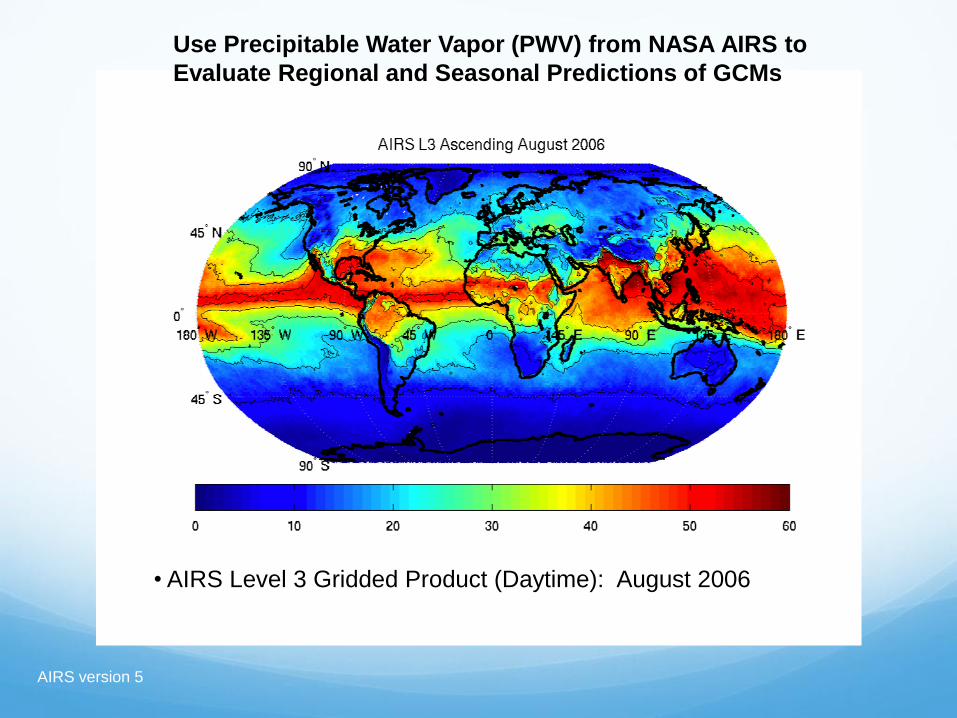
Use Precipitable Water Vapor (PWV) from NASA AIRS to
Evaluate Regional and Seasonal Predictions of GCMs
• AIRS Level 3 Gridded Product (Daytime): August 2006
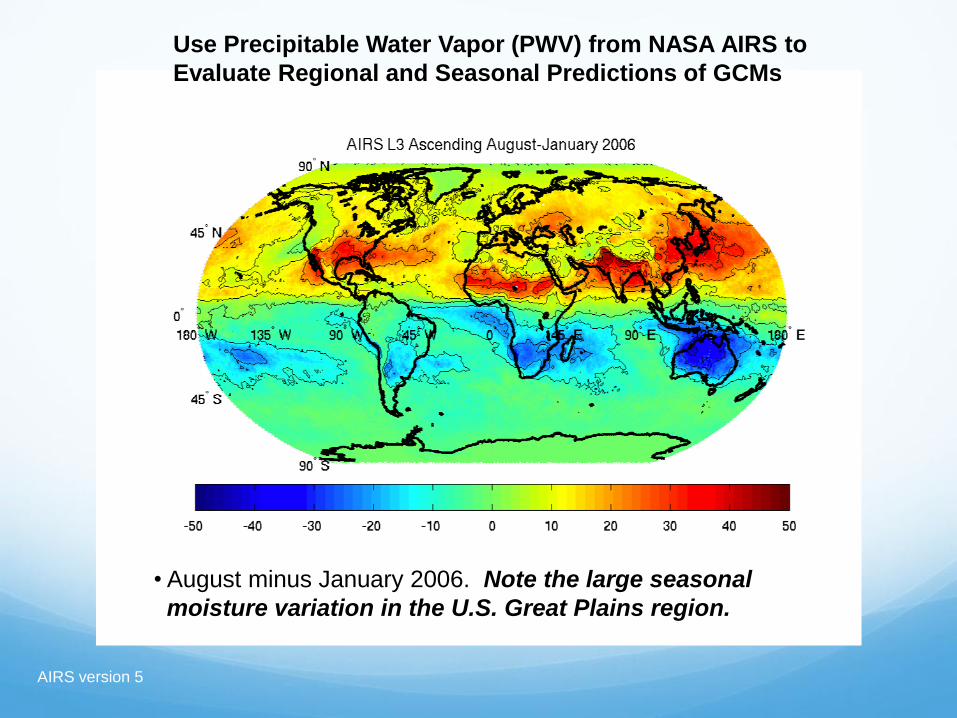
Use Precipitable Water Vapor (PWV) from NASA AIRS to
Evaluate Regional and Seasonal Predictions of GCMs
• August minus January 2006. Note the large seasonal
moisture variation in the U.S. Great Plains region.
AIRS version 5
Objectives of this Study (Jacola Roman, UW-Madison AOS Master’s Thesis)
• Investigate regional differences in total precipitable water vapor
(PWV) among Global Climate Models (GCMs)
• Separate ocean/land effects from zonal averages of PWV
• Validation using ground-based GPS and IR satellites
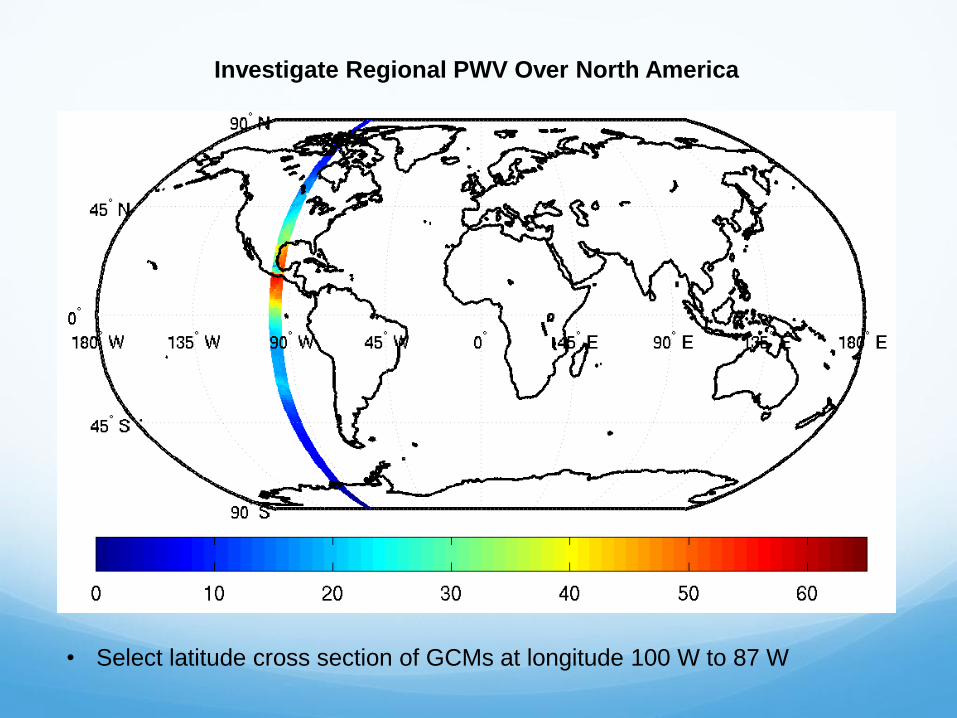
Investigate Regional PWV Over North America
• Select latitude cross section of GCMs at longitude 100 W to 87 W
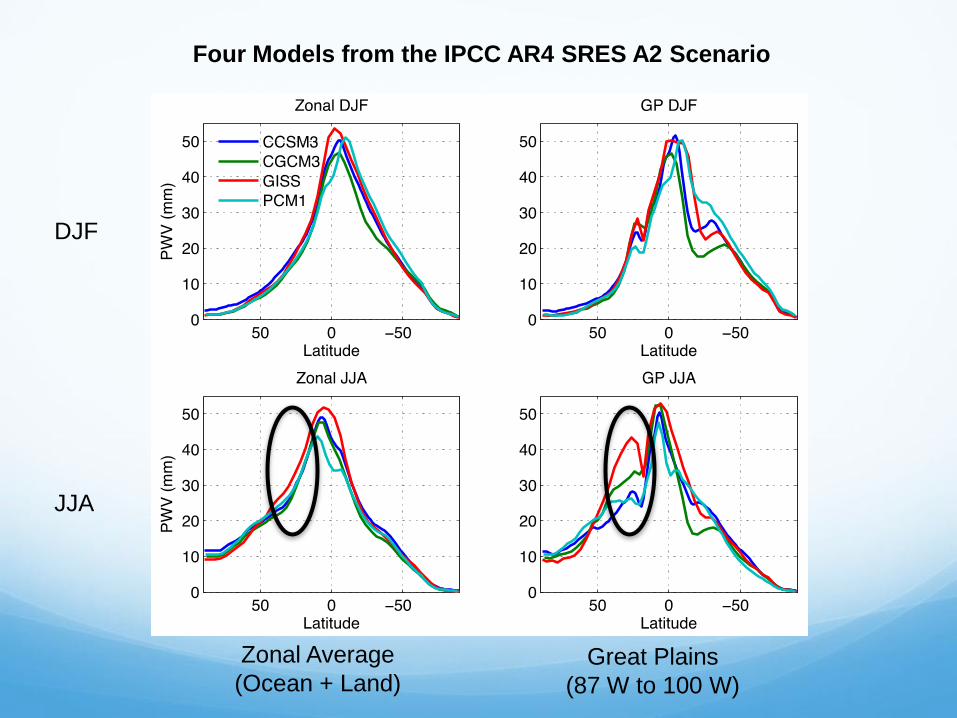
Four Models from the IPCC AR4 SRES A2 Scenario
DJF
JJA
Zonal Average
(Ocean + Land) Great Plains
(87 W to 100 W)
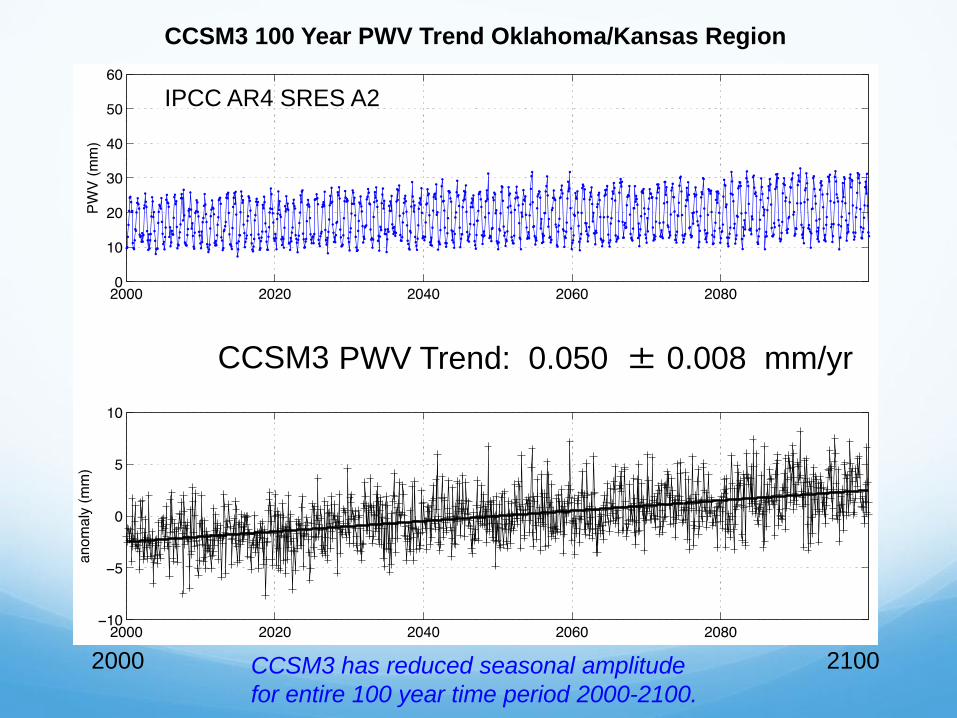
Focus on Water Vapor PWV Trend: 0.050 ± 0.008 mm/yr CCSM3
2000 2100 CCSM3 has reduced seasonal amplitude
for entire 100 year time period 2000-2100.
CCSM3 100 Year PWV Trend Oklahoma/Kansas Region
IPCC AR4 SRES A2
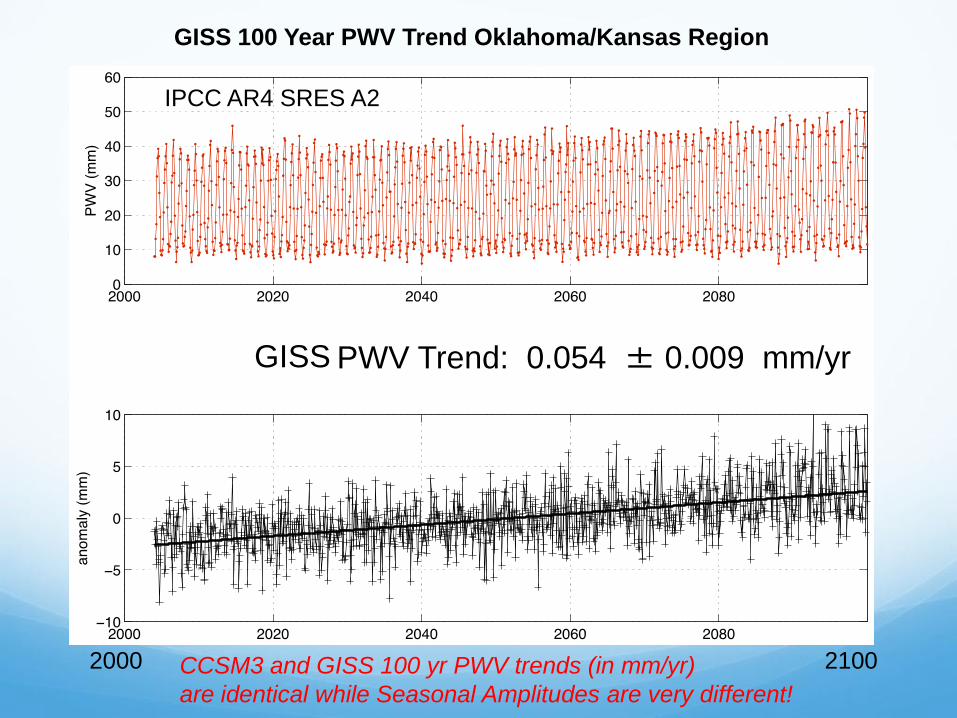
Focus on Water Vapor PWV Trend: 0.054 ± 0.009 mm/yr GISS
2000 2100 CCSM3 and GISS 100 yr PWV trends (in mm/yr)
are identical while Seasonal Amplitudes are very different!
GISS 100 Year PWV Trend Oklahoma/Kansas Region
IPCC AR4 SRES A2
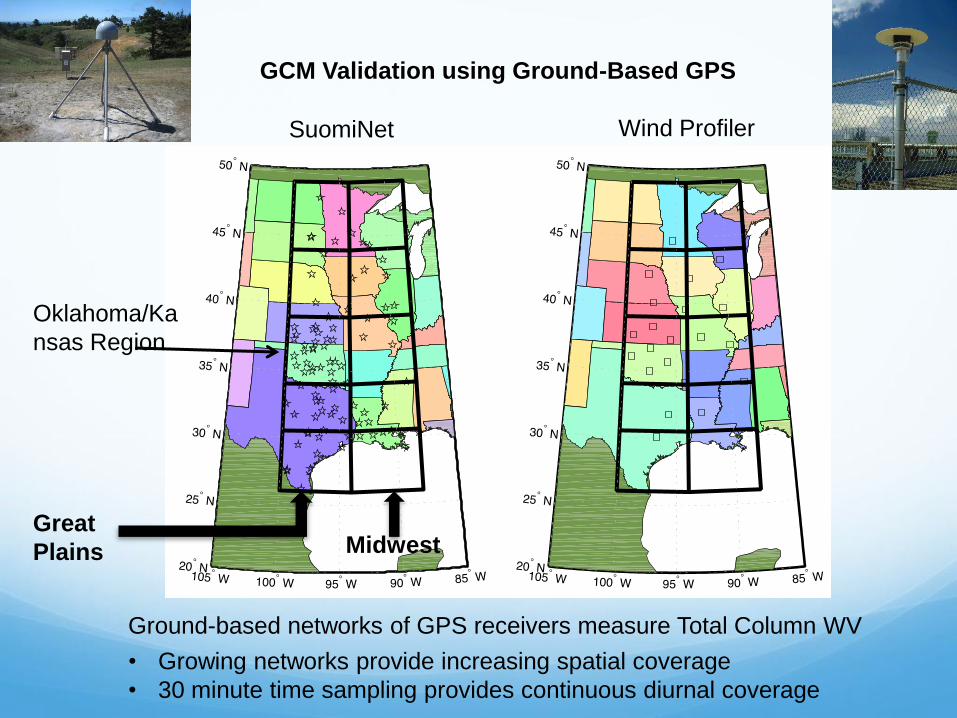
Ground-based networks of GPS receivers measure Total Column WV
GCM Validation using Ground-Based GPS
SuomiNet Wind Profiler
Midwest Great
Plains
• Growing networks provide increasing spatial coverage
• 30 minute time sampling provides continuous diurnal coverage
Oklahoma/Ka
nsas Region
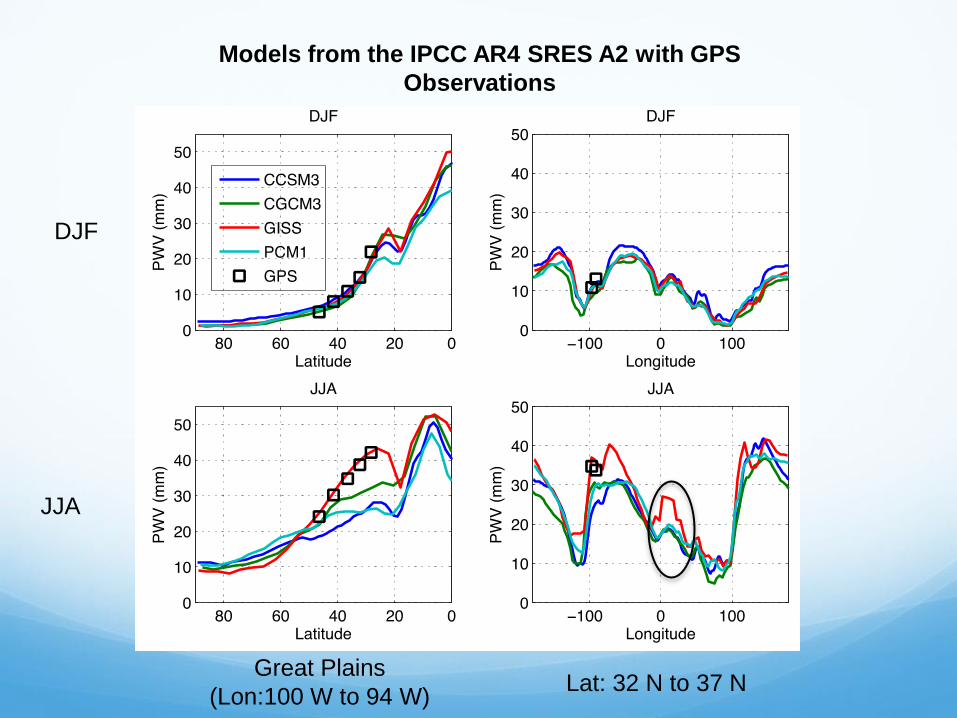
Models from the IPCC AR4 SRES A2 with GPS
Observations
DJF
JJA
Great Plains
(Lon:100 W to 94 W) Lat: 32 N to 37 N
mm/yr Trend
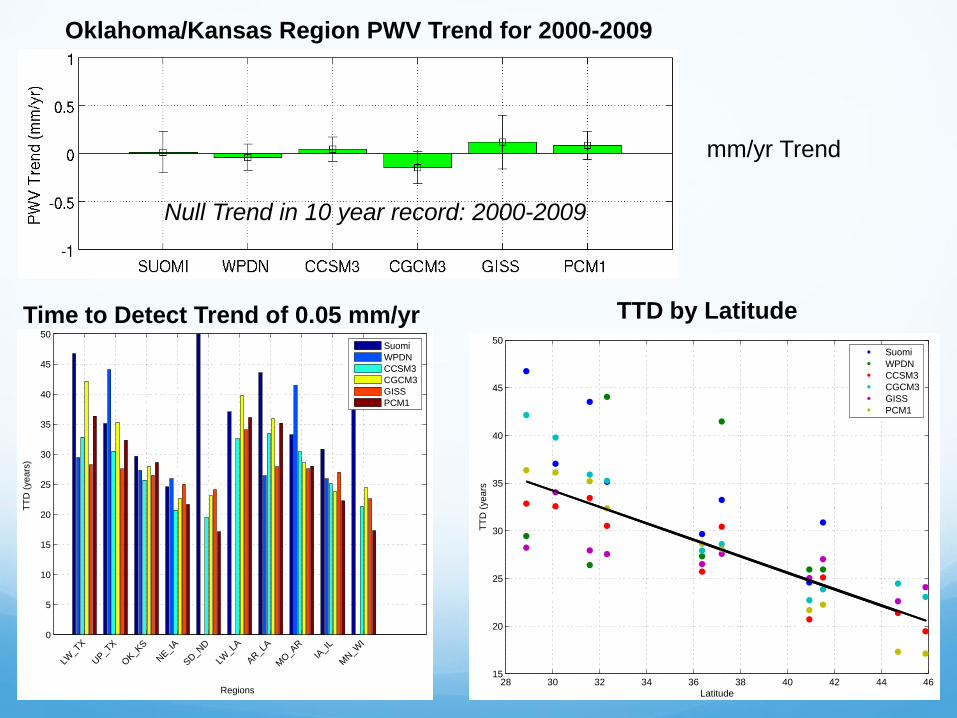
Oklahoma/Kansas Region PWV Trend for 2000-2009
Null Trend in 10 year record: 2000-2009
0
5
10
15
20
25
30
35
40
45
50
Regions
TT
D (
years
)
Time To Detect Trend
LW_T
X
UP_T
X
OK_K
S
NE_I
A
SD_N
D
LW_L
A
AR_L
A
MO_A
RIA
_IL
MN_W
I
Suomi
WPDN
CCSM3
CGCM3
GISS
PCM1
Time to Detect Trend of 0.05 mm/yr TTD by Latitude
28 30 32 34 36 38 40 42 44 4615
20
25
30
35
40
45
50
Latitude
TT
D (
yea
rs
Suomi
WPDN
CCSM3
CGCM3
GISS
PCM1
0 5 10 150
5
10
15
Mixing Ratio
He
igh
t
DJF 5 Year Mxing Ratio Mean
CCSM3
CGCM3
GISS
PCM1
Sonde
0 5 10 150
5
10
15
Mixing Ratio
He
igh
t
JJA 5 Year Mixing Ratio Mean
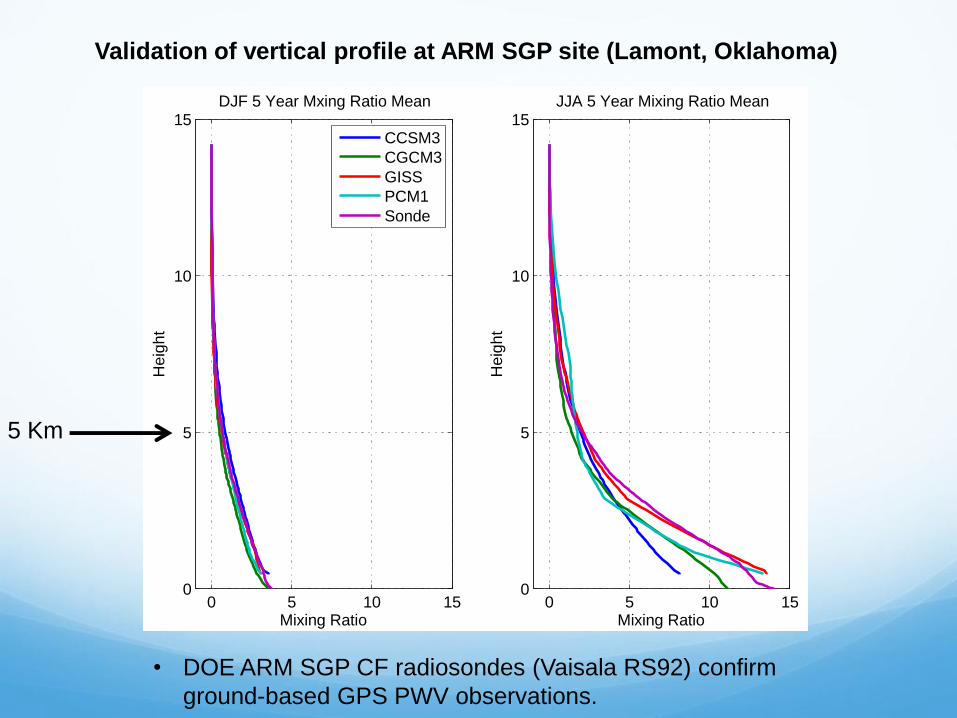
Validation of vertical profile at ARM SGP site (Lamont, Oklahoma)
• DOE ARM SGP CF radiosondes (Vaisala RS92) confirm
ground-based GPS PWV observations.
5 Km
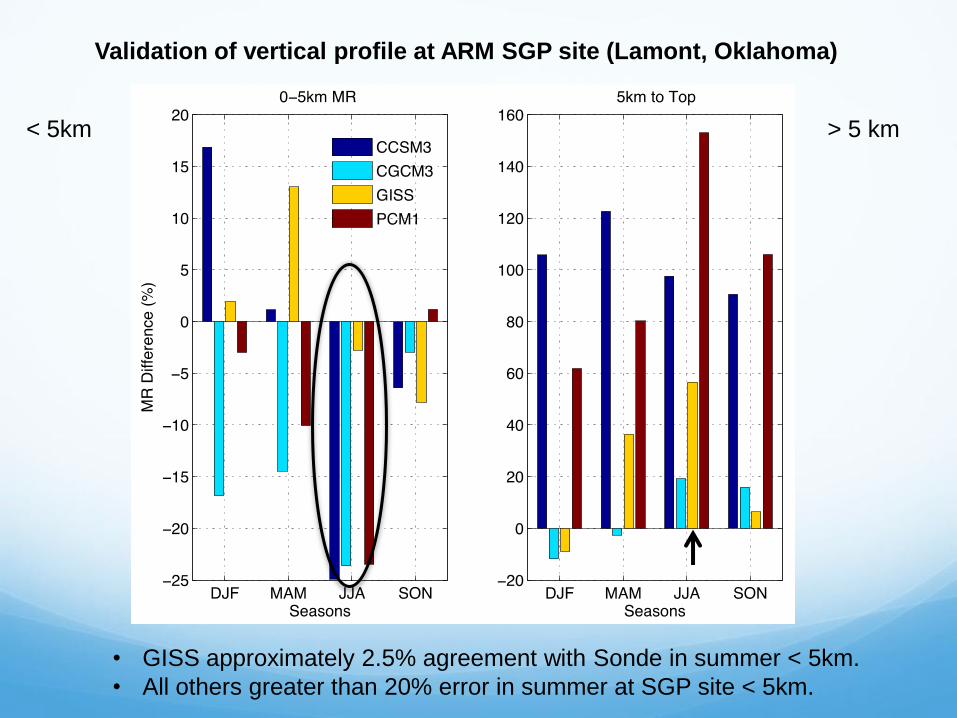
Validation of vertical profile at ARM SGP site (Lamont, Oklahoma)
• GISS approximately 2.5% agreement with Sonde in summer < 5km.
• All others greater than 20% error in summer at SGP site < 5km.
< 5km > 5 km
Validation of Regional Global Climate Model (GCM) Water Vapor Bias and
Trends Using Precipitable Water Vapor (PWV) Observations from a Network of
Global Positioning Satellite (GPS) Receivers in the U.S. Great Plains and
Midwest
Jacola A. Roman, Robert O. Knuteson, Steven A. Ackerman, David C. Tobin, and Henry
E. Revercomb
Submitted to Journal of Climate
Publication
• Subsequent slides are preliminary results from our use of AIRS L3 PWV
Preliminary Results using AIRS version 5
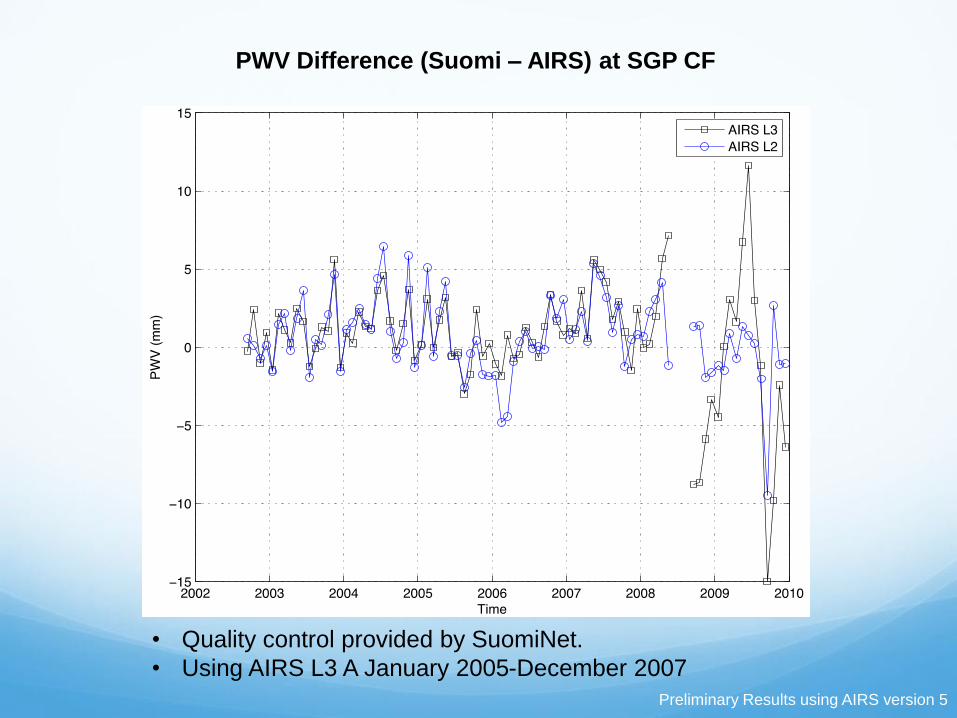
PWV Difference (Suomi – AIRS) at SGP CF
• Quality control provided by SuomiNet.
• Using AIRS L3 A January 2005-December 2007
Preliminary Results using AIRS version 5
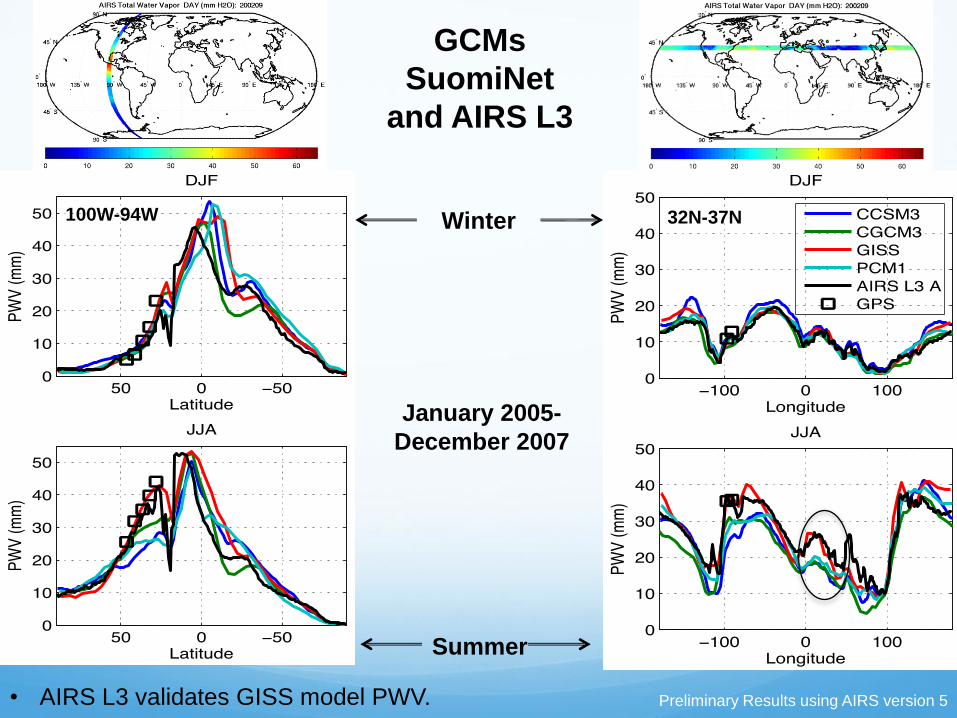
GCMs
SuomiNet
and AIRS L3
Winter
Summer
100W-94W
32N-37N
January 2005-
December 2007
• AIRS L3 validates GISS model PWV.
15 ° N
30 ° N
45 ° N
0
5
10
15
20
25
30
35
40
45
50
15 ° N
30 ° N
45 ° N
0
5
10
15
20
25
30
35
40
45
50
15 ° N
30 ° N
45 ° N
0
5
10
15
20
25
30
35
40
45
50
CGCM3
PCM1
CCSM3
GISS
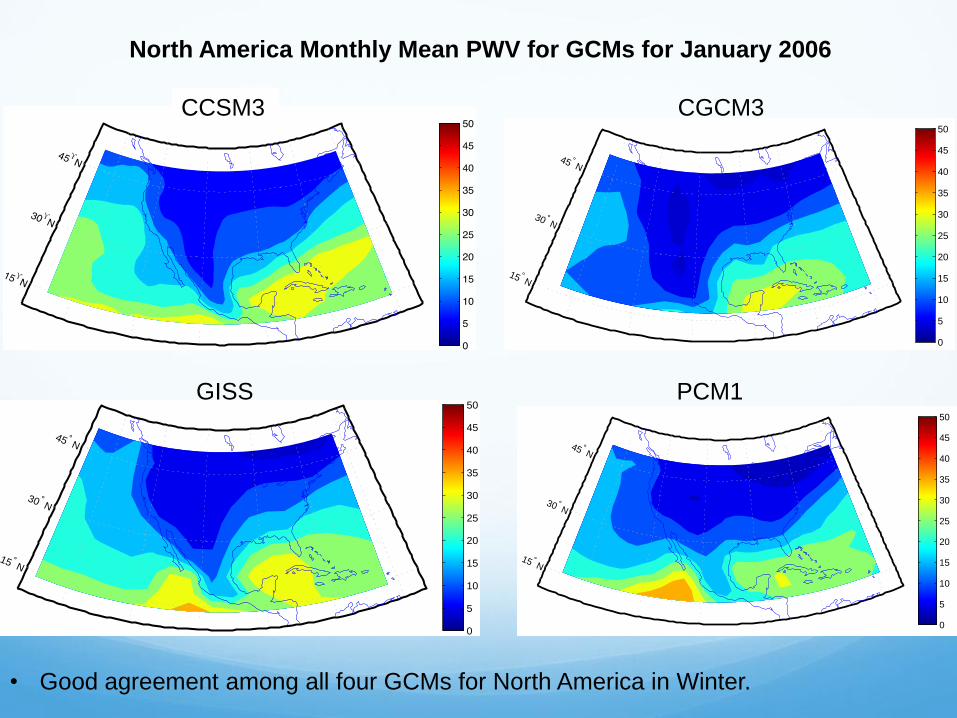
North America Monthly Mean PWV for GCMs for January 2006
• Good agreement among all four GCMs for North America in Winter.
15 ° N
30 ° N
45 ° N
0
5
10
15
20
25
30
35
40
45
50
AIRS L3
NARR
Preliminary Results using AIRS version 5
CCSM3
GISS
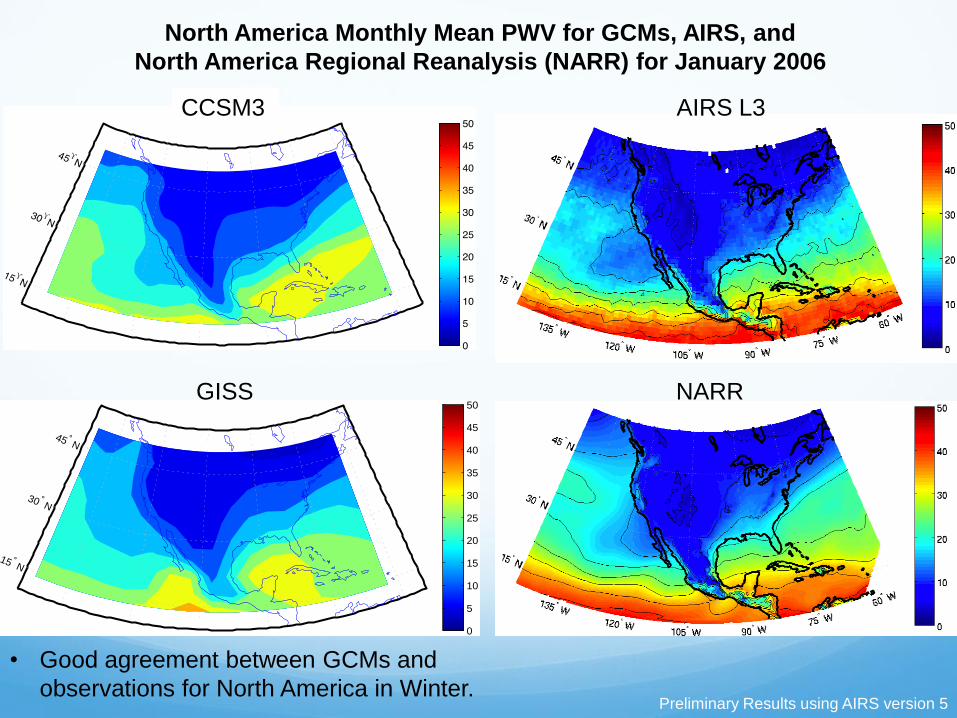
North America Monthly Mean PWV for GCMs, AIRS, and
North America Regional Reanalysis (NARR) for January 2006
• Good agreement between GCMs and
observations for North America in Winter.
15 ° N
30 ° N
45 ° N
0
5
10
15
20
25
30
35
40
45
50
15 ° N
30 ° N
45 ° N
0
5
10
15
20
25
30
35
40
45
50
15 ° N
30 ° N
45 ° N
0
5
10
15
20
25
30
35
40
45
50
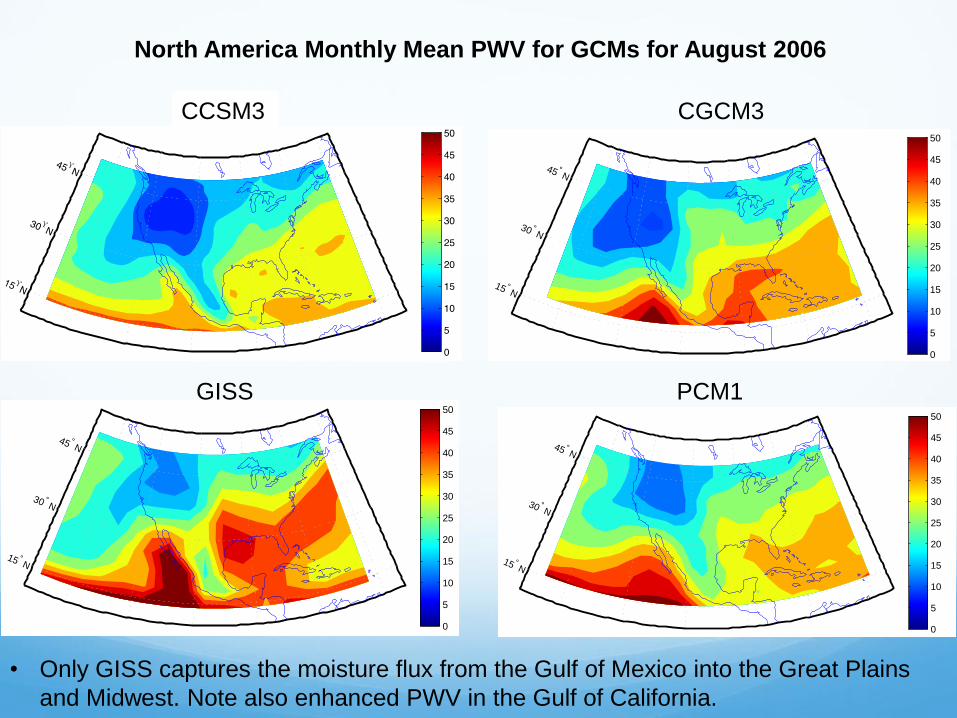
CGCM3
PCM1
CCSM3
GISS
North America Monthly Mean PWV for GCMs for August 2006
• Only GISS captures the moisture flux from the Gulf of Mexico into the Great Plains
and Midwest. Note also enhanced PWV in the Gulf of California.
15 ° N
30 ° N
45 ° N
0
5
10
15
20
25
30
35
40
45
50
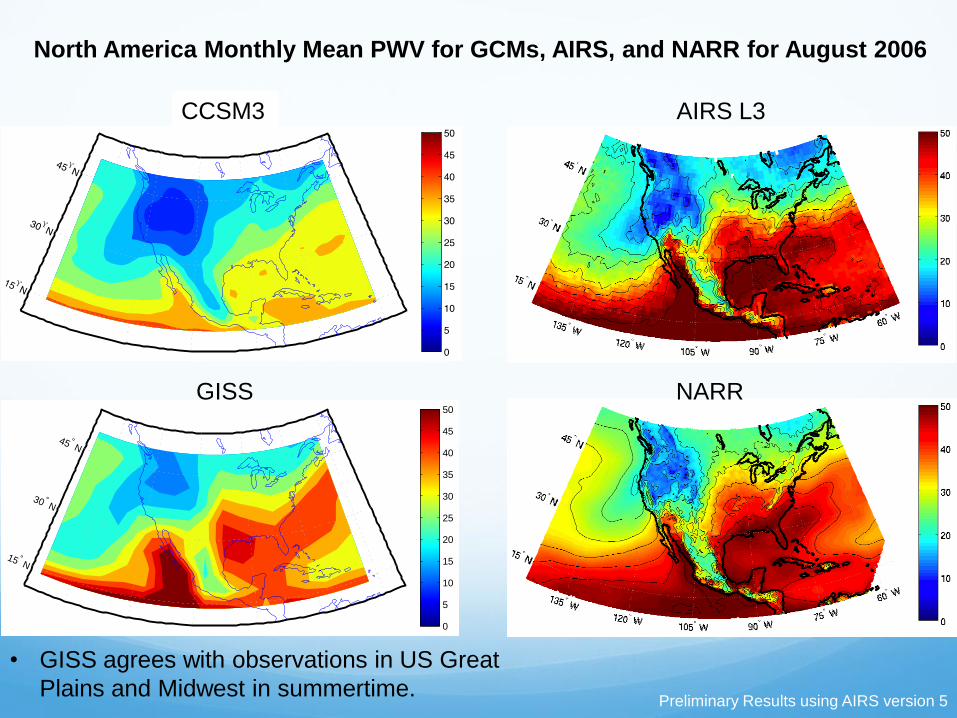
AIRS L3
NARR
Preliminary Results using AIRS version 5
CCSM3
GISS
North America Monthly Mean PWV for GCMs, AIRS, and NARR for August 2006
• GISS agrees with observations in US Great
Plains and Midwest in summertime.
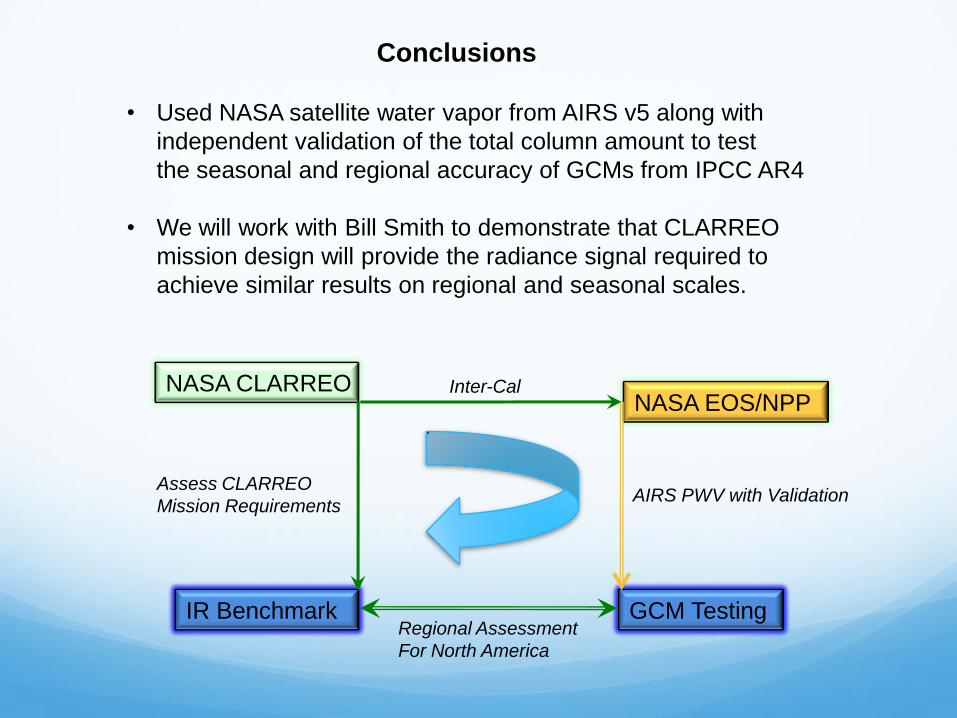
Conclusions
• Used NASA satellite water vapor from AIRS v5 along with
independent validation of the total column amount to test
the seasonal and regional accuracy of GCMs from IPCC AR4
• We will work with Bill Smith to demonstrate that CLARREO
mission design will provide the radiance signal required to
achieve similar results on regional and seasonal scales.
IR Benchmark GCM Testing
NASA CLARREO NASA EOS/NPP
Inter-Cal
AIRS PWV with Validation
Regional Assessment
For North America
Assess CLARREO
Mission Requirements