understanding florida’s stream condition index · pdf fileunderstanding florida’s...
TRANSCRIPT
Understanding Florida’s StreamCondition Index
Russ FrydenborgFDEP Bureau of Laboratories
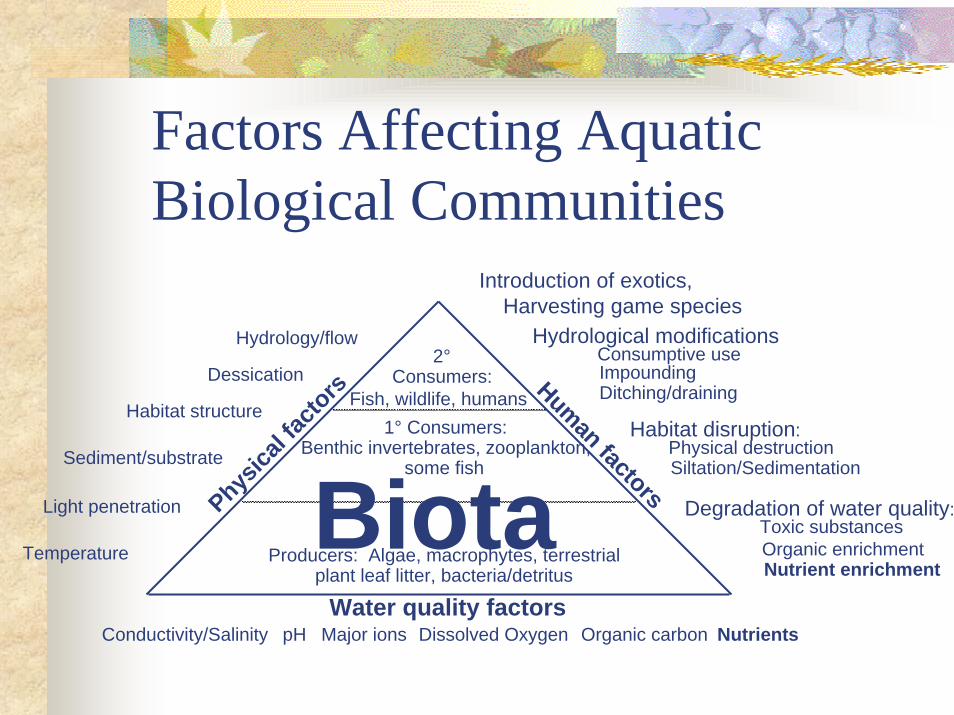
Factors Affecting AquaticBiological Communities
BiotaProducers: Algae, macrophytes, terrestrial
plant leaf litter, bacteria/detritus
1° Consumers: Benthic invertebrates, zooplankton,
some fish
2° Consumers:
Fish, wildlife, humans
Water quality factors
Physica
l facto
rs Human factors
pH Dissolved OxygenConductivity/Salinity
Light penetration
Temperature
Hydrology/flow
Habitat structure
Sediment/substrate
Nutrients
Dessication
Major ions Organic carbon
Toxic substancesOrganic enrichmentNutrient enrichment
Degradation of water quality:
Habitat disruption:Physical destructionSiltation/Sedimentation
Hydrological modifications
Ditching/drainingImpoundingConsumptive use
Introduction of exotics, Harvesting game species
Defining Ecological ExpectationsAbsent human interference, ecologicalcommunities have evolved in response to:
physical,chemical, andbio-geographic processes
Expectations are set by studying referencecondition (and its variability) in eachcommunity type.
Adverse Human FactorsHydrologic modifications
(consumptive use, impounding, ditching/draining)
Habitat disturbance(physical removal, sedimentation)
Degradation of water quality(toxic substances, nutrient and organic enrichment)
Introduction of invasive exotic taxaHarvesting biomass
Biological Integrity
• The ability of an aquatic ecosystem to support andmaintain a balanced, adaptive community oforganisms having:
• species composition,• diversity,• and functional organization
comparable to that of natural habitats within aregion.
Procedure to DevelopBiologically-Based CriteriaClassify aquatic systems into meaningful unitsSample biota across human disturbancegradient (define expectations)Select relevant biological attributes that providea reliable signal about human effects (nutrientimbalances)Extract and interpret patterns in the dataDevelop reasonable policy to protect designatedaquatic life use
Florida’s Stream Condition Index:1990’s Multimetric Approach
Established reference condition in varioussub-ecoregions
Best professional judgmentSurrounding land use, in-stream habitat
Sampled known impaired sitesPoint source discharge studies
Toxicity, low DO, poor habitat
Florida’s Stream Condition Index:1990’s Multimetric Approach (cont.)
Selected 7 metricsBox and whisker plots determineddiscrimination power
Aggregated by summing metrics5, 3, 1 point, depending on departure fromreference condition
Florida’s SCI Re-calibration
Develop human disturbance gradientTest disturbance gradient for each BioregionEvaluate metric response to disturbance gradient(new thresholds, new metrics)
Determination of metric variabilityPower analysis for trend detectionDevelop consistency with EPA Tiered AquaticLife Use Support guidance (TALUS)
To Ensure ScientificallyDefensible Metrics:
Develop criteria, independent from biology,to determine which sites are impaired byhumans vs. those that are not (the fabled “xaxis”)
Reference vs. Degraded SitesHuman Disturbance Gradient
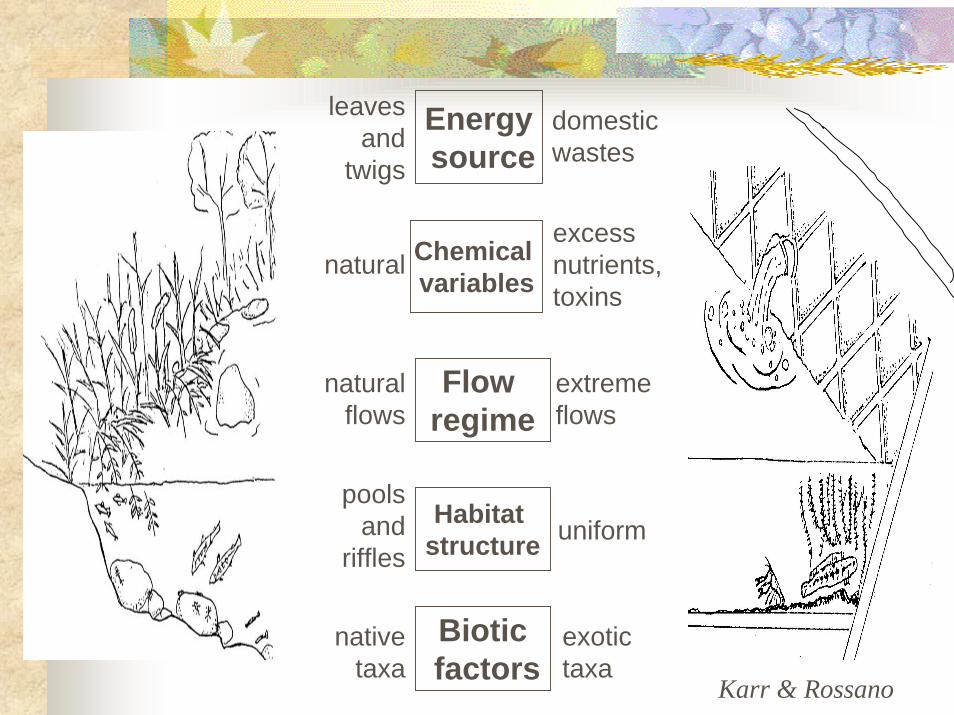
Flow regime
Energy source
Chemical variables
Habitat structure
Biotic factors
domesticwastes
leavesand
twigs
naturalexcessnutrients,toxins
naturalflows
extremeflows
poolsand
rifflesuniform
nativetaxa
exotictaxa
Karr & Rossano
Human Disturbance FactorAnalysis
Landscape levelLandscape Development Intensity Index
Habitat alterationHabitat assessment data
Hydrologic modificationHydrologic scoring process
Chemical PollutionAmmonia, etc.
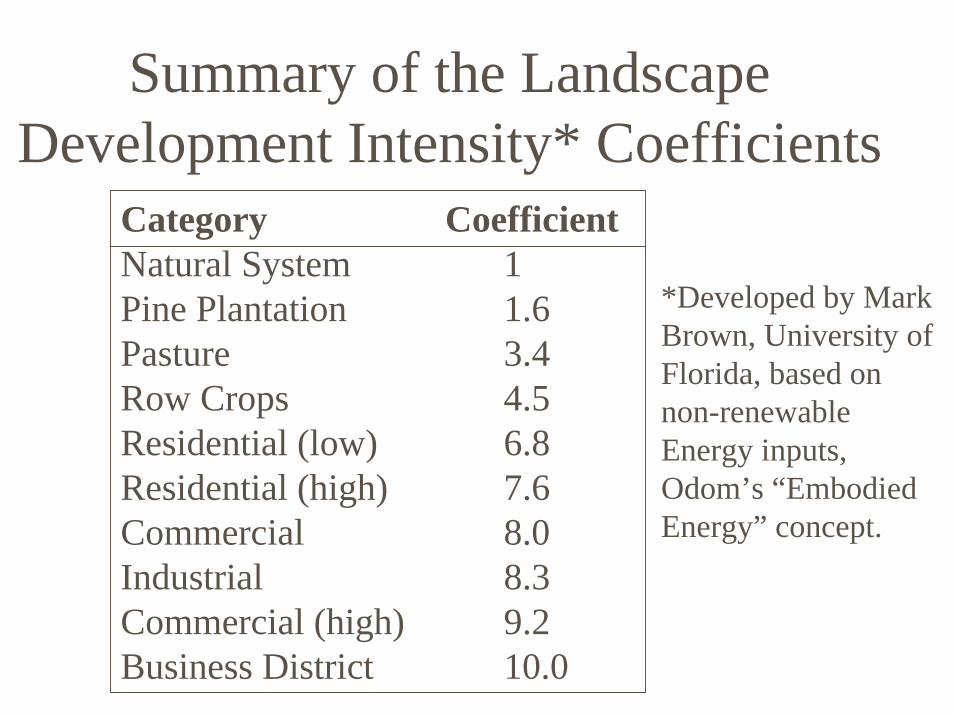
Summary of the LandscapeDevelopment Intensity* Coefficients
Category CoefficientNatural System 1Pine Plantation 1.6Pasture 3.4Row Crops 4.5Residential (low) 6.8Residential (high) 7.6Commercial 8.0Industrial 8.3Commercial (high) 9.2Business District 10.0
*Developed by MarkBrown, University ofFlorida, based onnon-renewableEnergy inputs,Odom’s “EmbodiedEnergy” concept.
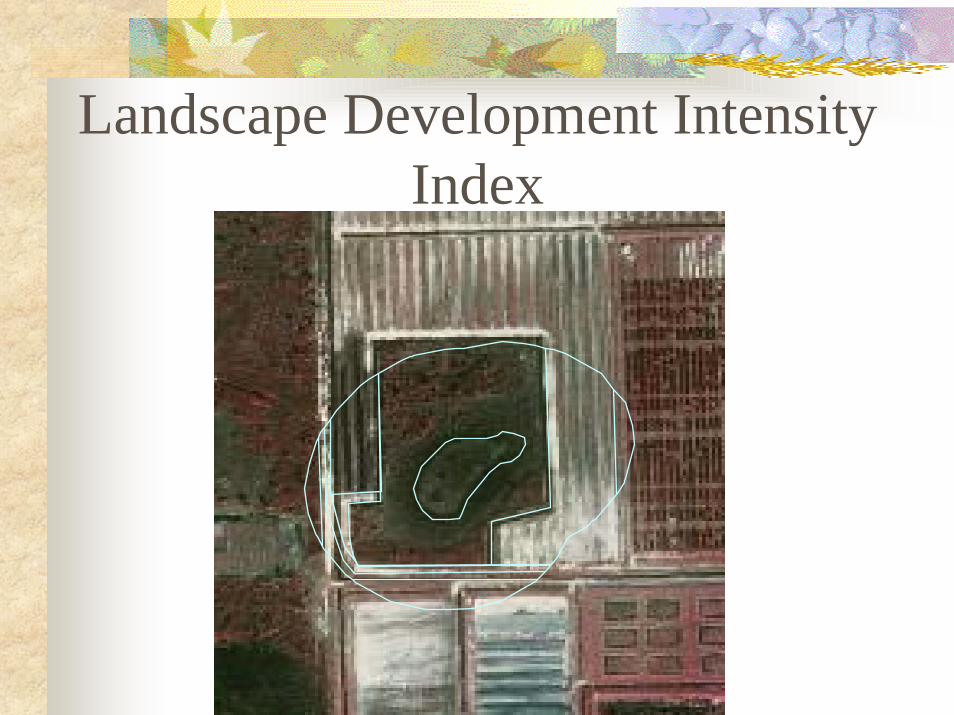
Landscape Development IntensityIndex
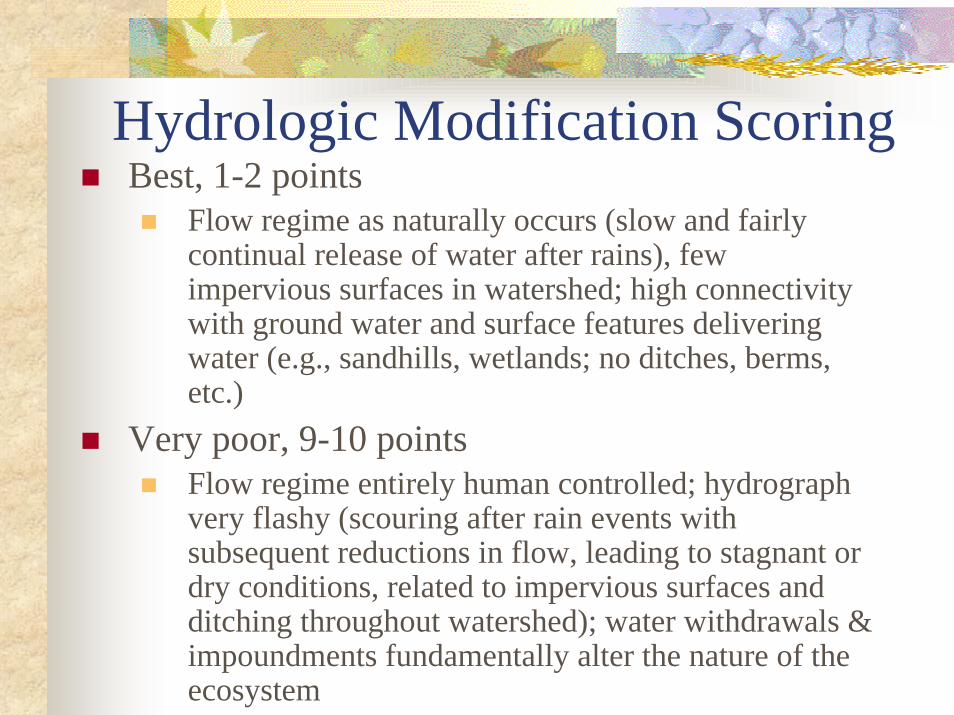
Hydrologic Modification ScoringBest, 1-2 points
Flow regime as naturally occurs (slow and fairlycontinual release of water after rains), fewimpervious surfaces in watershed; high connectivitywith ground water and surface features deliveringwater (e.g., sandhills, wetlands; no ditches, berms,etc.)
Very poor, 9-10 pointsFlow regime entirely human controlled; hydrographvery flashy (scouring after rain events withsubsequent reductions in flow, leading to stagnant ordry conditions, related to impervious surfaces andditching throughout watershed); water withdrawals &impoundments fundamentally alter the nature of theecosystem
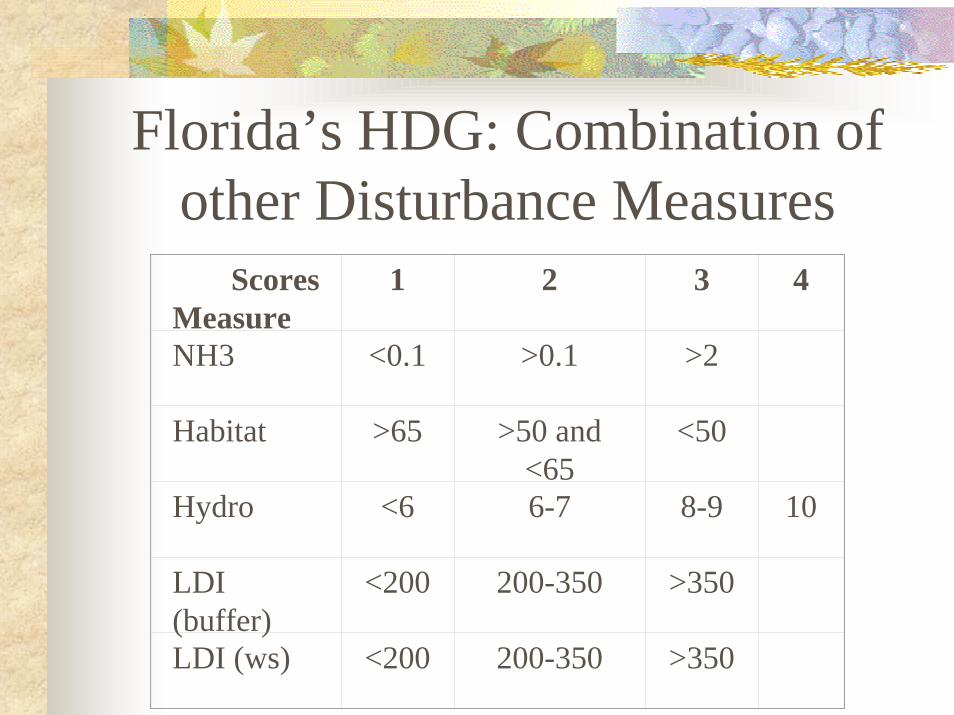
ScoresMeasure
1 2 3 4
NH3 <0.1 >0.1 >2
Habitat >65 >50 and<65
<50
Hydro <6 6-7 8-9 10
LDI(buffer)
<200 200-350 >350
LDI (ws) <200 200-350 >350
Florida’s HDG: Combination ofother Disturbance Measures
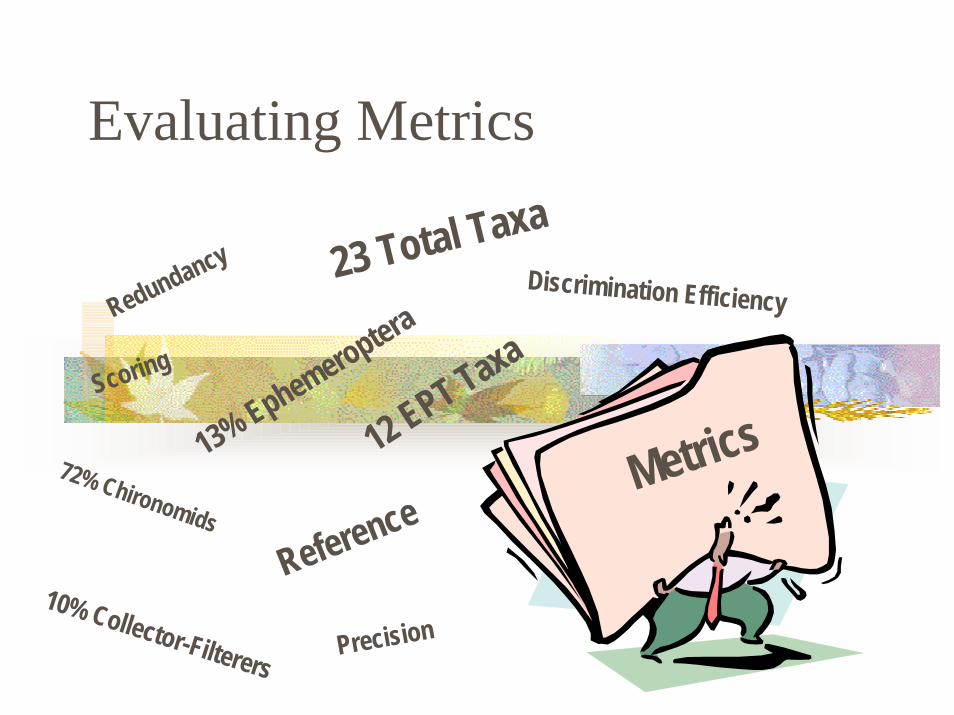
Evaluating Metrics
Metrics12 EPT Taxa
Precision
Scoring
Redundancy
72% Chironomids
23 Total TaxaDiscrimination Efficiency
10% Collector-Filterers
13% Ephemeroptera
Reference
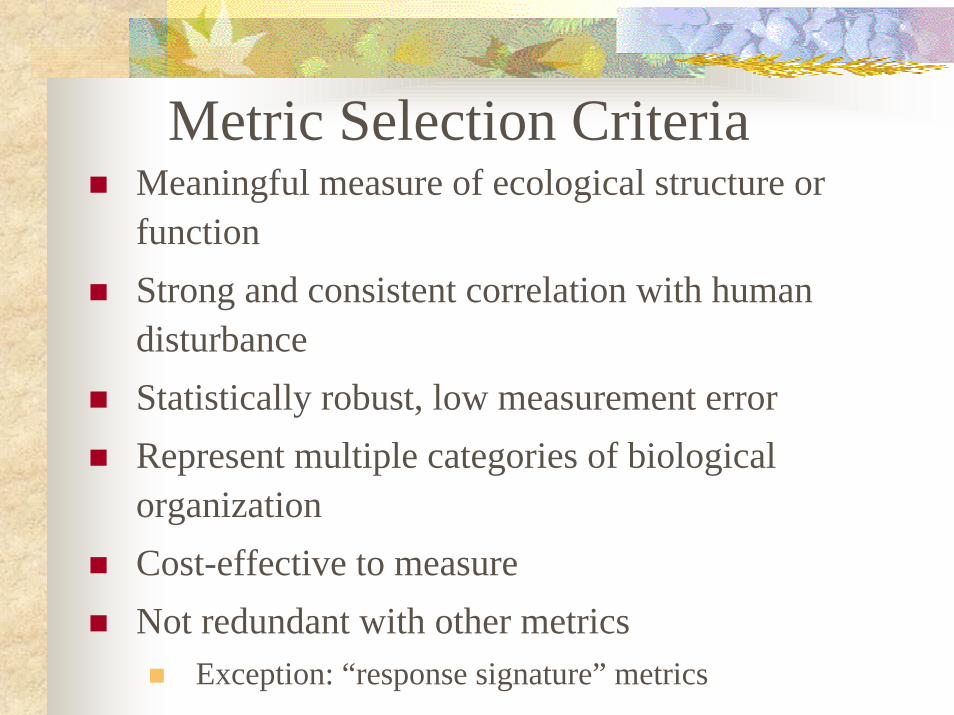
Metric Selection CriteriaMeaningful measure of ecological structure orfunctionStrong and consistent correlation with humandisturbanceStatistically robust, low measurement errorRepresent multiple categories of biologicalorganizationCost-effective to measureNot redundant with other metrics
Exception: “response signature” metrics
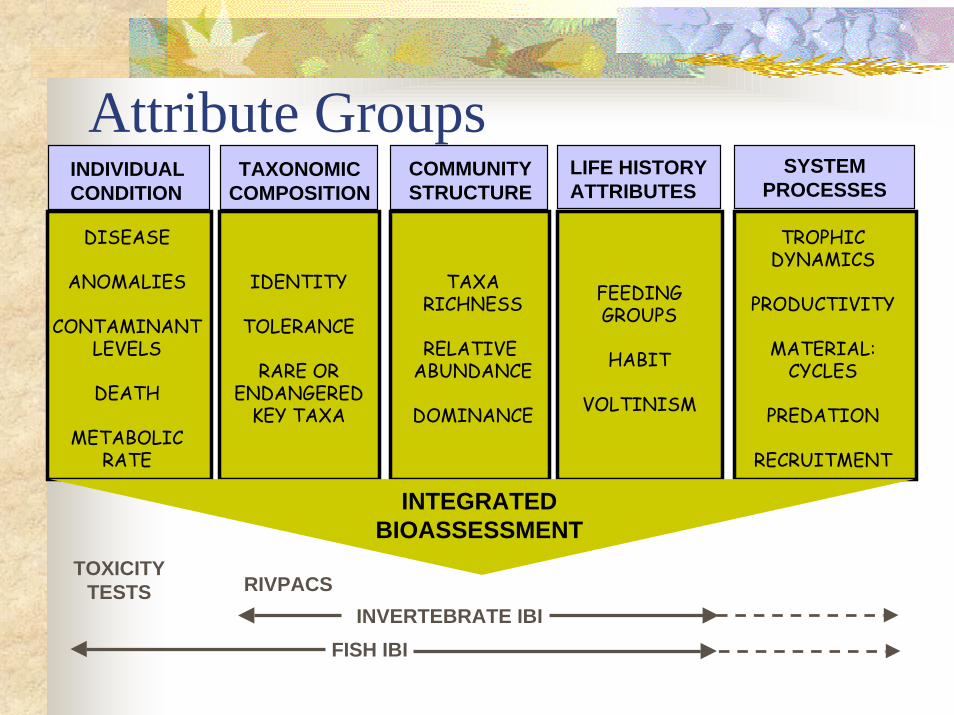
Attribute GroupsSYSTEM
PROCESSES
IDENTITY
TOLERANCE
RARE ORENDANGERED
KEY TAXA
TAXONOMICCOMPOSITION
TROPHICDYNAMICS
PRODUCTIVITY
MATERIAL:CYCLES
PREDATION
RECRUITMENT
TAXARICHNESS
RELATIVE ABUNDANCE
DOMINANCE
COMMUNITYSTRUCTURE
FEEDINGGROUPS
HABIT
VOLTINISM
INDIVIDUALCONDITION
DISEASE
ANOMALIES
CONTAMINANTLEVELS
DEATH
METABOLICRATE
TOXICITYTESTS RIVPACS
INVERTEBRATE IBIFISH IBI
INTEGRATEDBIOASSESSMENT
LIFE HISTORYATTRIBUTES
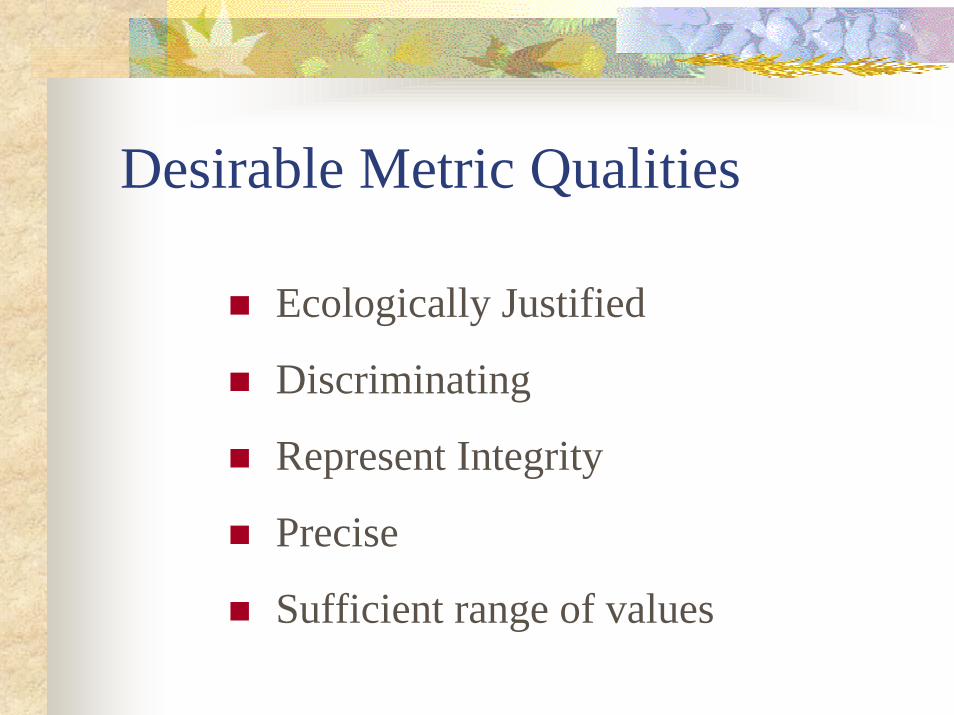
Desirable Metric Qualities
Ecologically Justified
Discriminating
Represent Integrity
Precise
Sufficient range of values
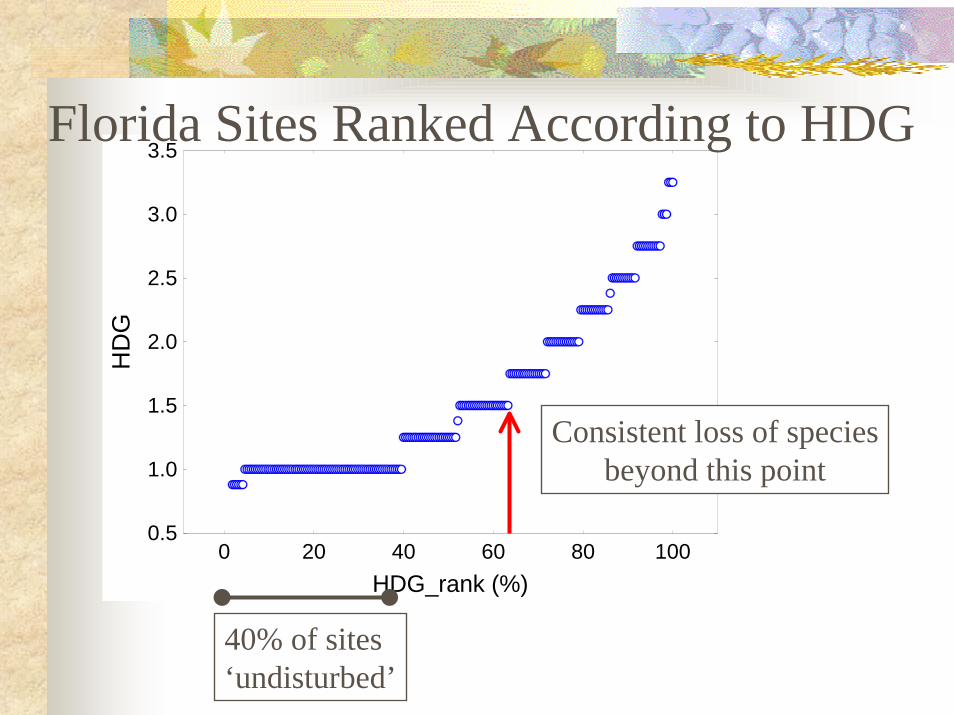
0 20 40 60 80 100HDG_rank (%)
0.5
1.0
1.5
2.0
2.5
3.0
3.5H
DG
Florida Sites Ranked According to HDG
40% of sites ‘undisturbed’
Consistent loss of speciesbeyond this point
-20 20 60 100 140 180 220HDG_rnk
-0.02
0.02
0.06
0.10
0.14
TX10
82=S
teno
nem
a sm
ithae
2
-20 20 60 100 140 180 220HDG_rnk
-0.01
0.01
0.03
0.05
0.07
TX10
79=S
teno
nem
a ex
iguu
m2
-20 20 60 100 140 180 220HDG_rnk
-0.002
0.002
0.006
0.010
0.014
0.018
0.022
TX10
78=S
teno
nem
a
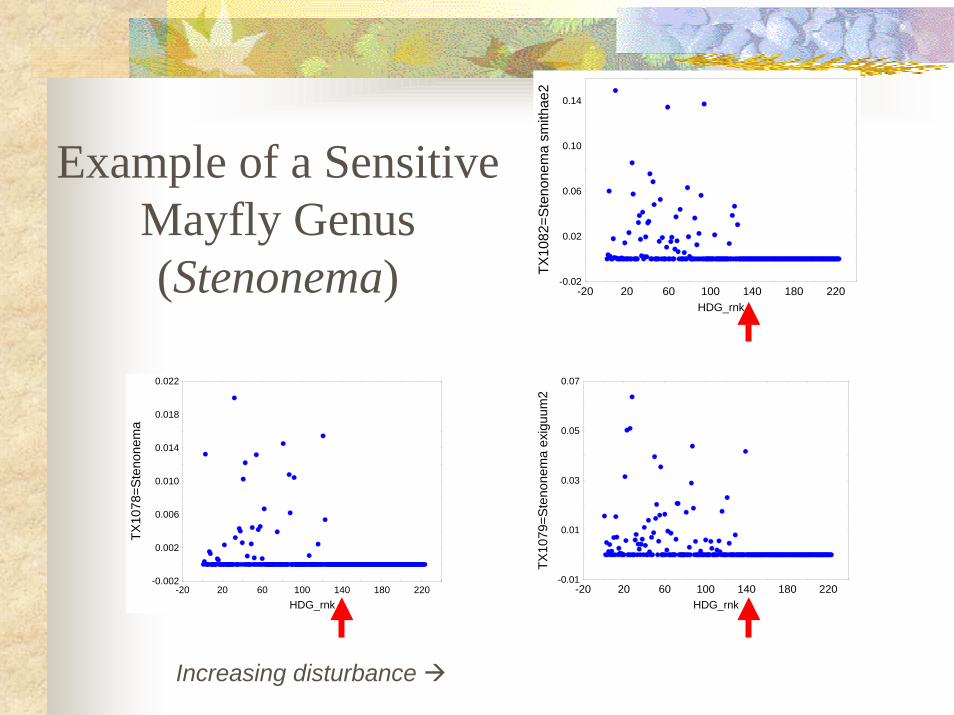
Example of a SensitiveMayfly Genus(Stenonema)
Increasing disturbance
-20 20 60 100 140 180 220
HDG_rnk
-0.02
0.00
0.02
0.04
0.06
0.08
0.10
0.12
0.14
0.16
0.18TX
216_
Cor
bicu
la fl
umin
ea
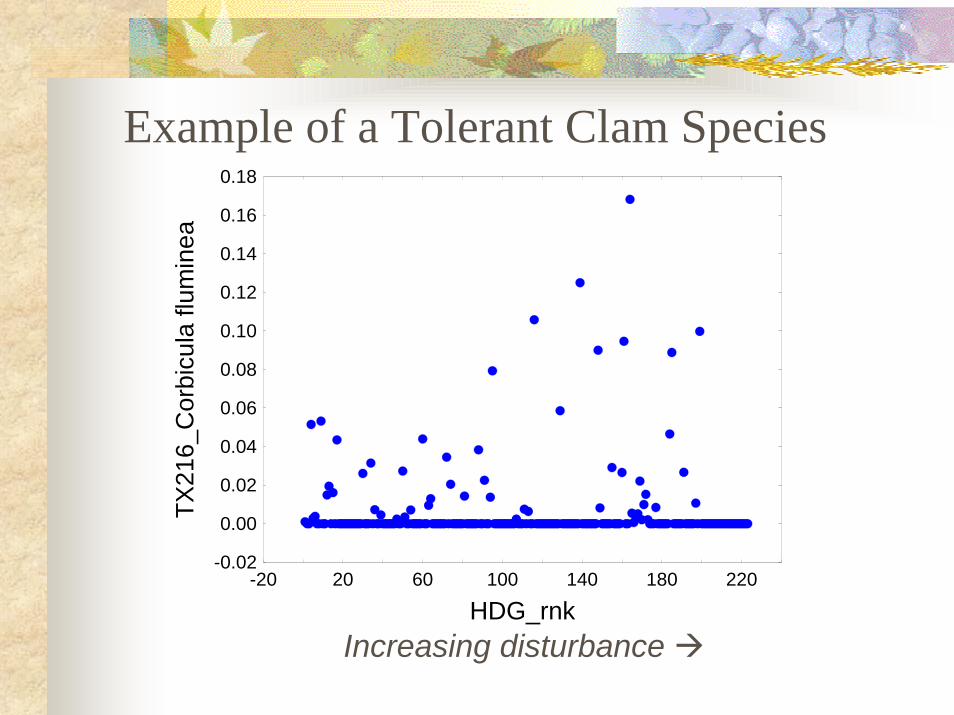
Example of a Tolerant Clam Species
Increasing disturbance
Incorporating “Integrity”Include Robust, Discriminating Metrics from
a Variety of Categories:
RichnessCompositionToleranceFeeding FunctionsHabitVoltinism
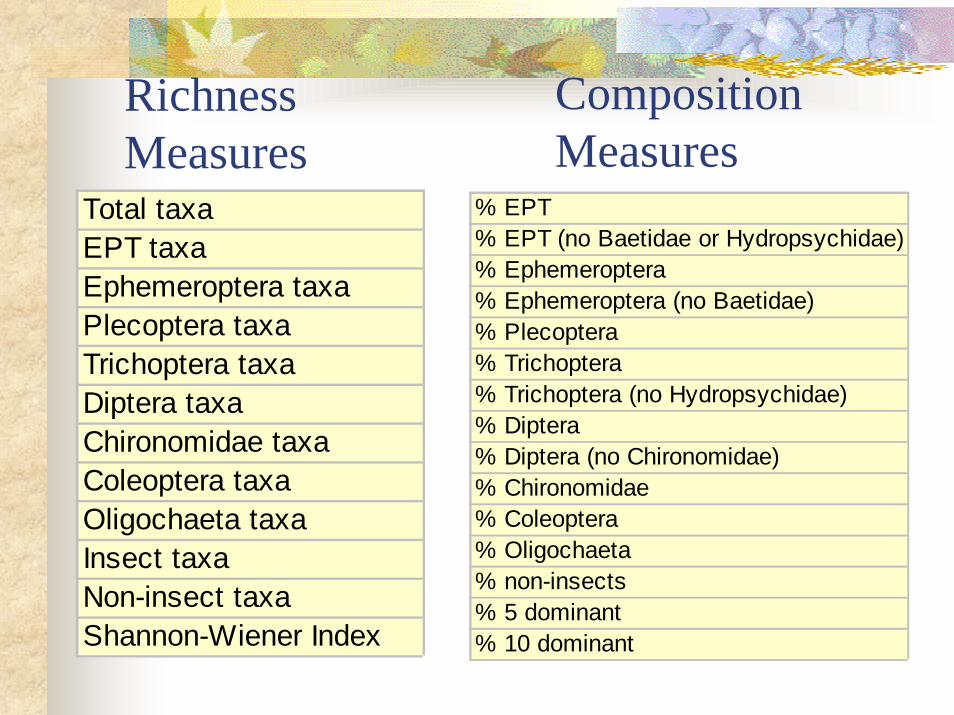
RichnessMeasures
Total taxaEPT taxaEphemeroptera taxaPlecoptera taxaTrichoptera taxaDiptera taxaChironomidae taxaColeoptera taxaOligochaeta taxaInsect taxaNon-insect taxaShannon-Wiener Index
% EPT% EPT (no Baetidae or Hydropsychidae)% Ephemeroptera% Ephemeroptera (no Baetidae)% Plecoptera% Trichoptera% Trichoptera (no Hydropsychidae)% Diptera% Diptera (no Chironomidae)% Chironomidae% Coleoptera% Oligochaeta% non-insects% 5 dominant% 10 dominant
CompositionMeasures
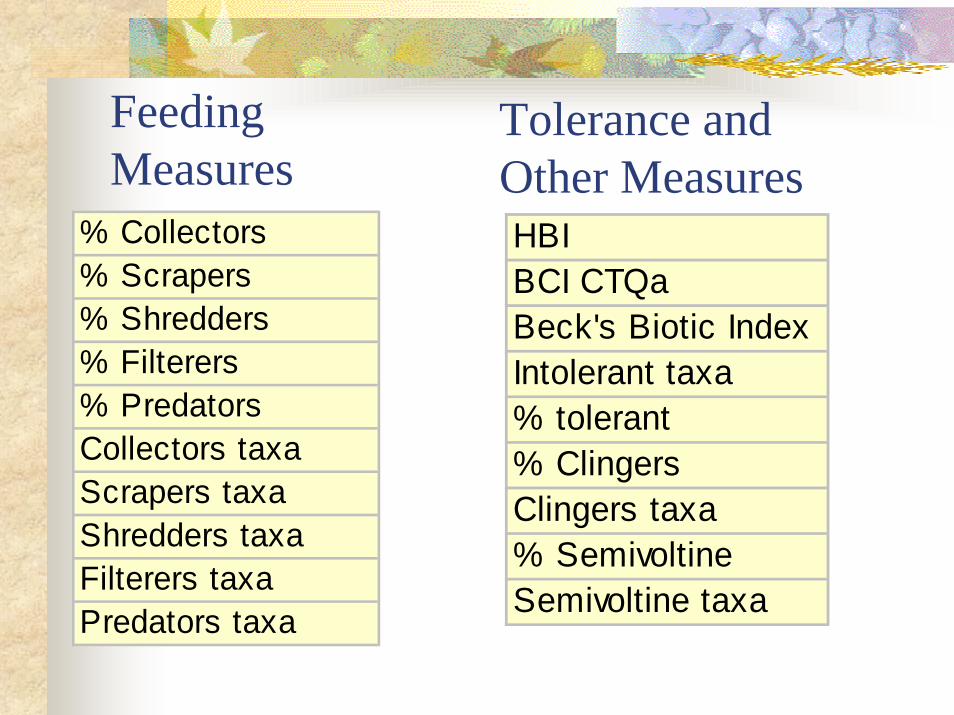
FeedingMeasures
% Collectors% Scrapers% Shredders% Filterers% PredatorsCollectors taxaScrapers taxaShredders taxaFilterers taxaPredators taxa
HBIBCI CTQaBeck's Biotic IndexIntolerant taxa% tolerant% ClingersClingers taxa% SemivoltineSemivoltine taxa
Tolerance andOther Measures
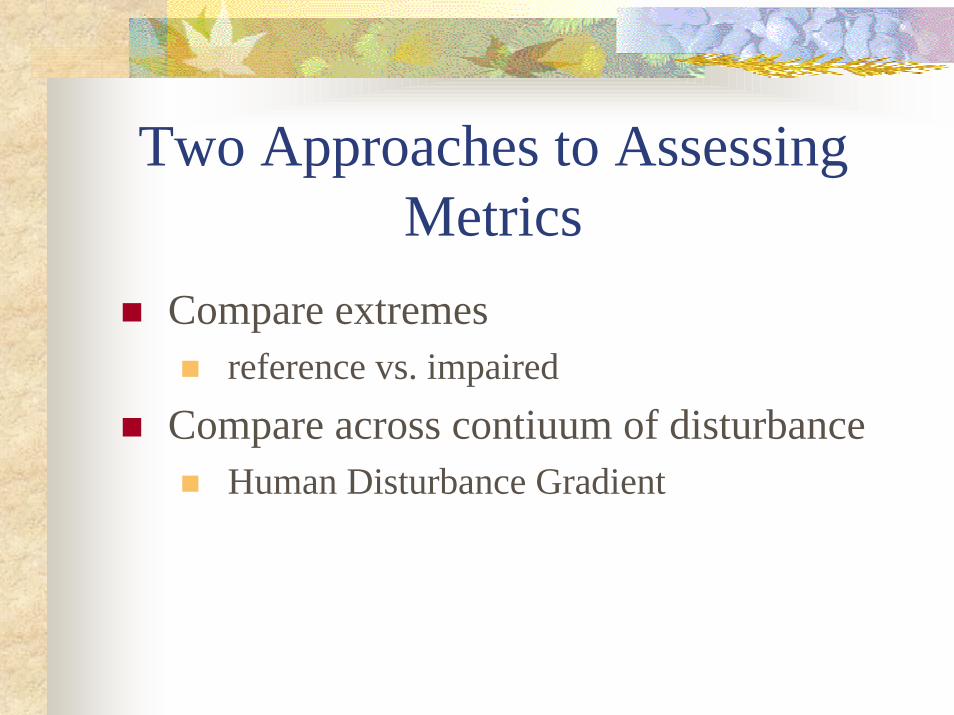
Two Approaches to AssessingMetrics
Compare extremesreference vs. impaired
Compare across contiuum of disturbanceHuman Disturbance Gradient
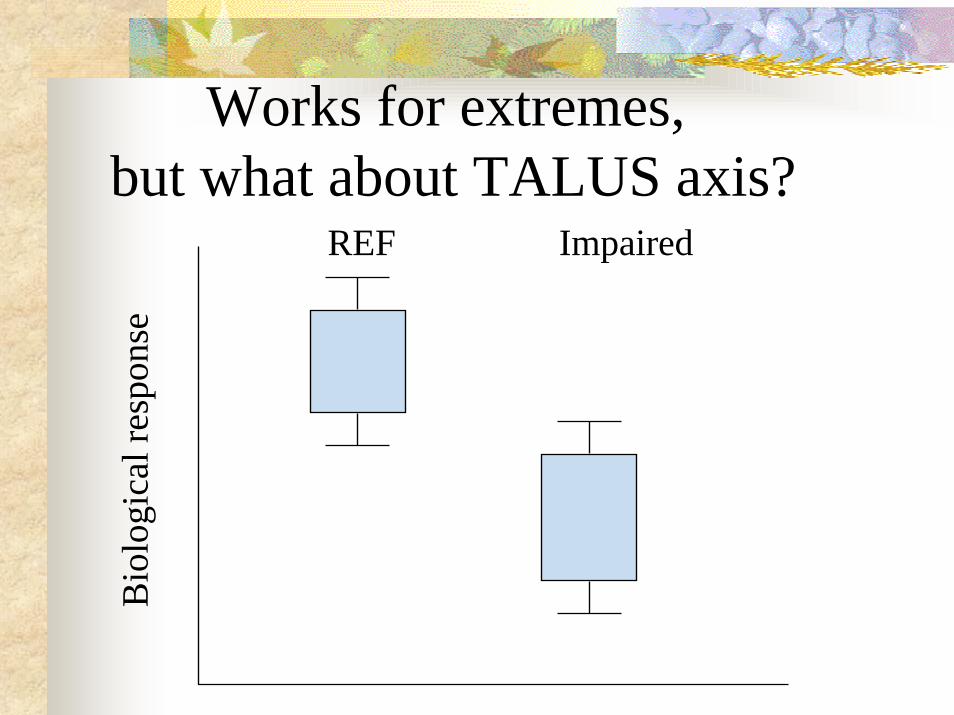
Bio
logi
cal r
espo
nse
REF Impaired
Works for extremes, but what about TALUS axis?
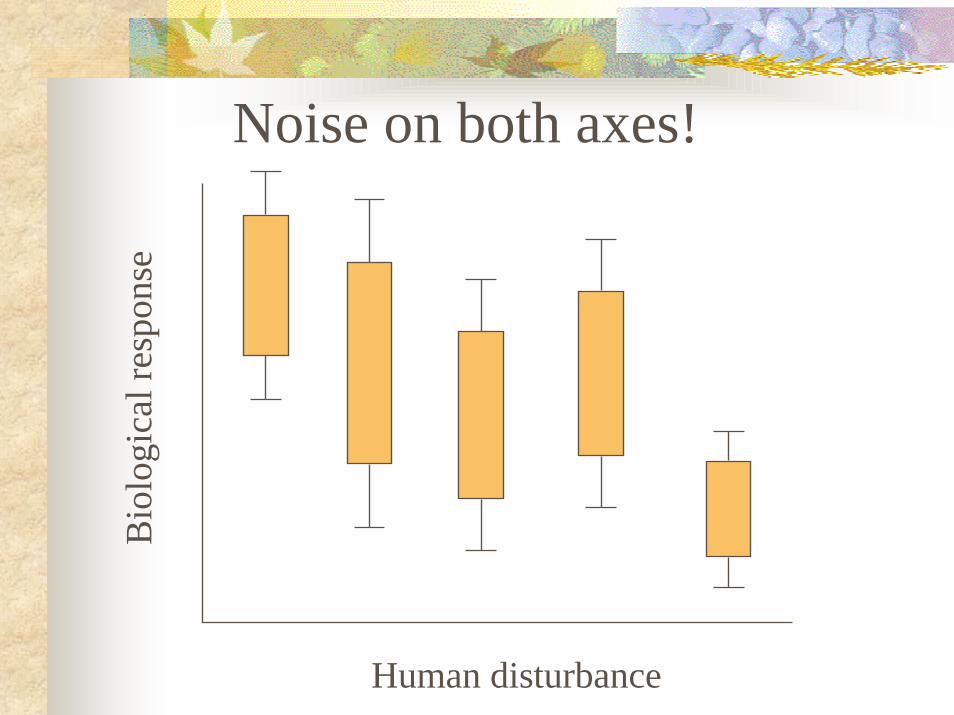
Bio
logi
cal r
espo
nse
Human disturbance
Noise on both axes!
Bio
logi
cal r
espo
nse
Human disturbance
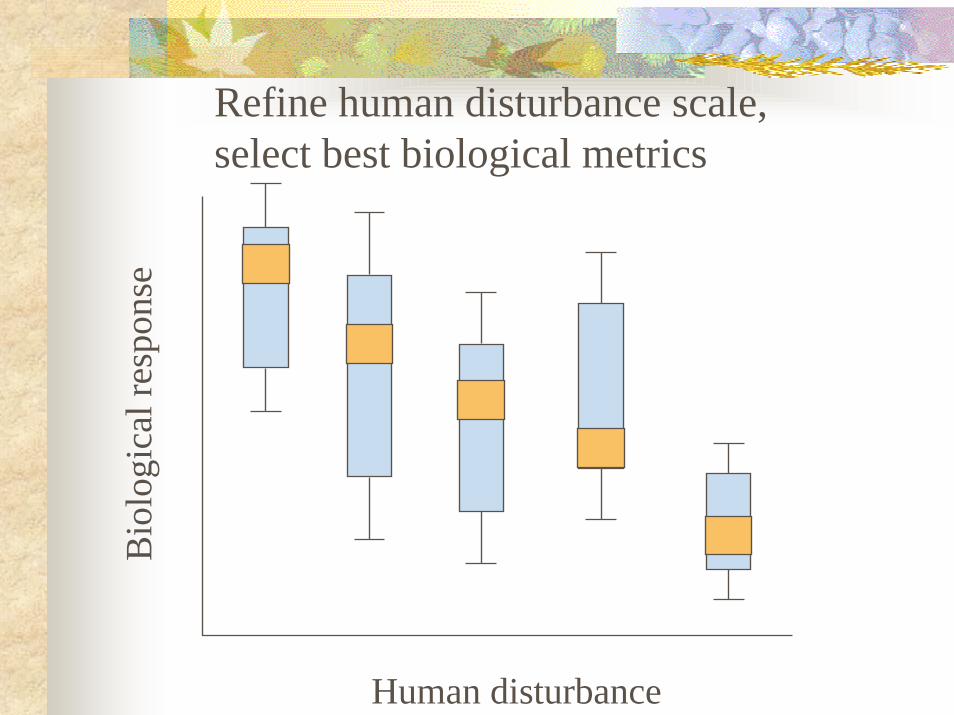
Refine human disturbance scale,select best biological metrics
Mul
timet
ric in
dex
Human disturbance gradient
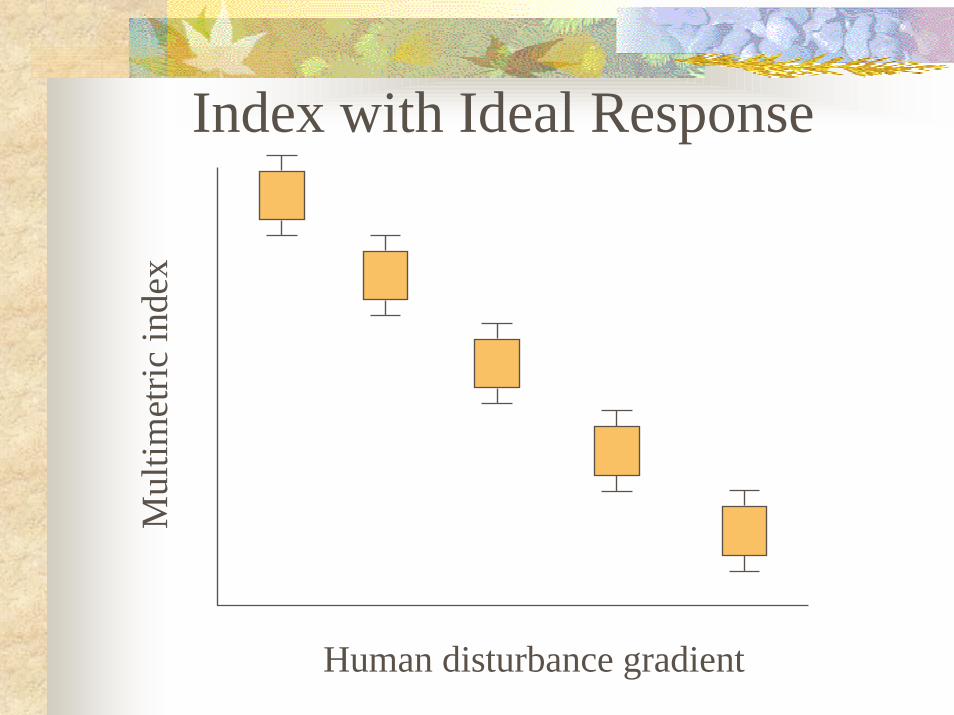
Index with Ideal Response
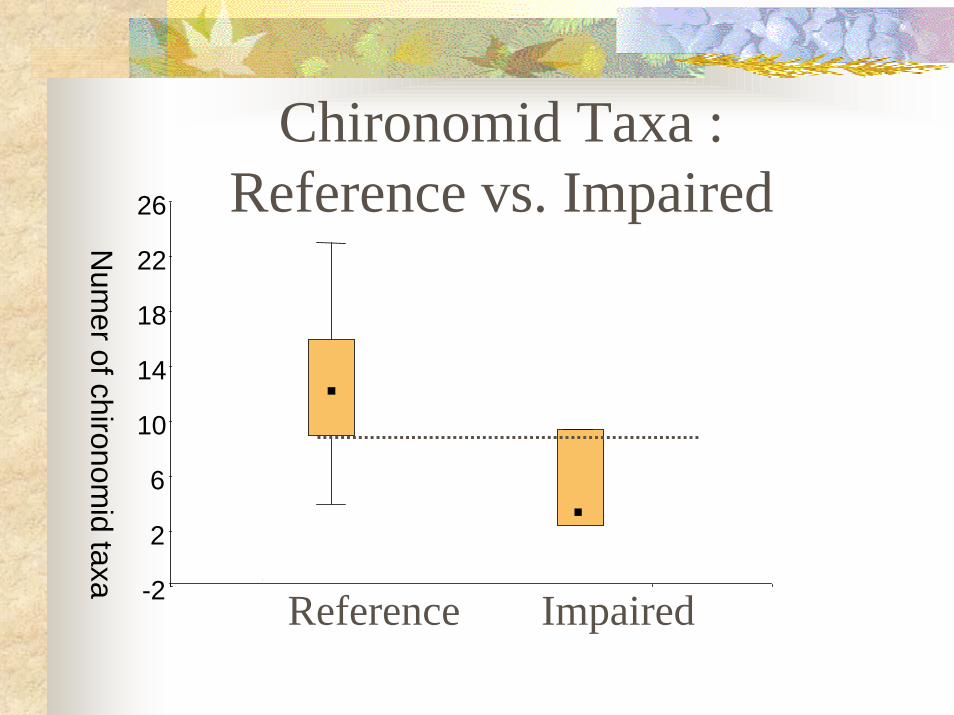
Chironomid Taxa :Reference vs. Impaired
Num
er of chironomid taxa -2
2
6
10
14
18
22
26
Reference Impaired
Num
er of chironomid taxa
-2
2
6
10
14
18
22
26
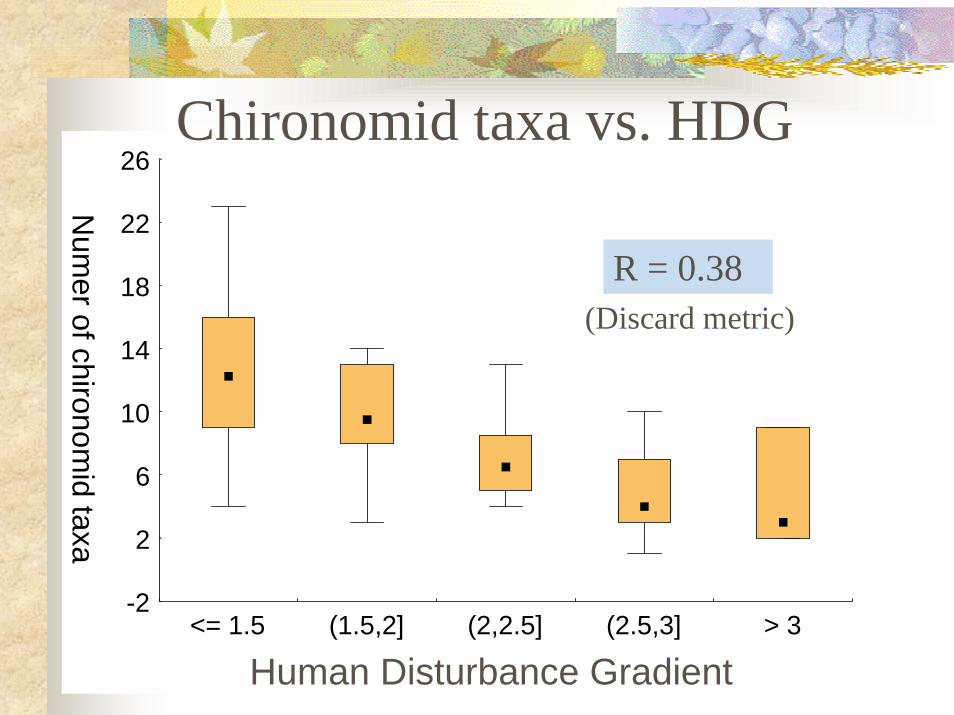
<= 1.5 (1.5,2] (2,2.5] (2.5,3] > 3
Chironomid taxa vs. HDG
R = 0.38
Human Disturbance Gradient
(Discard metric)
% D
iptera
-10
10
30
50
70
90
110
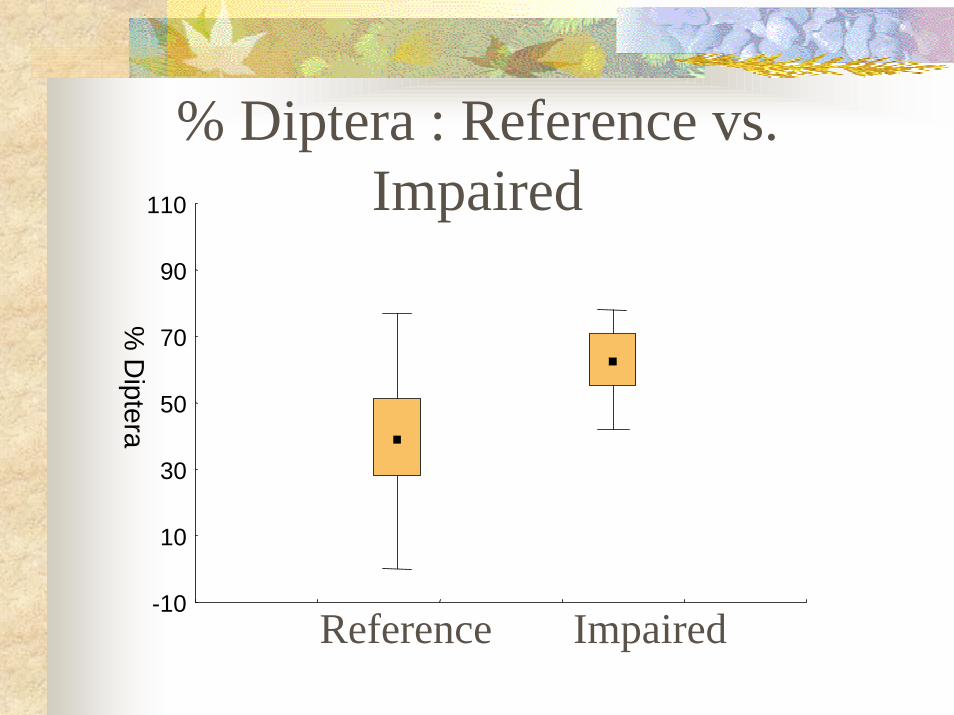
% Diptera : Reference vs.Impaired
Reference Impaired
% D
iptera
-10
10
30
50
70
90
110
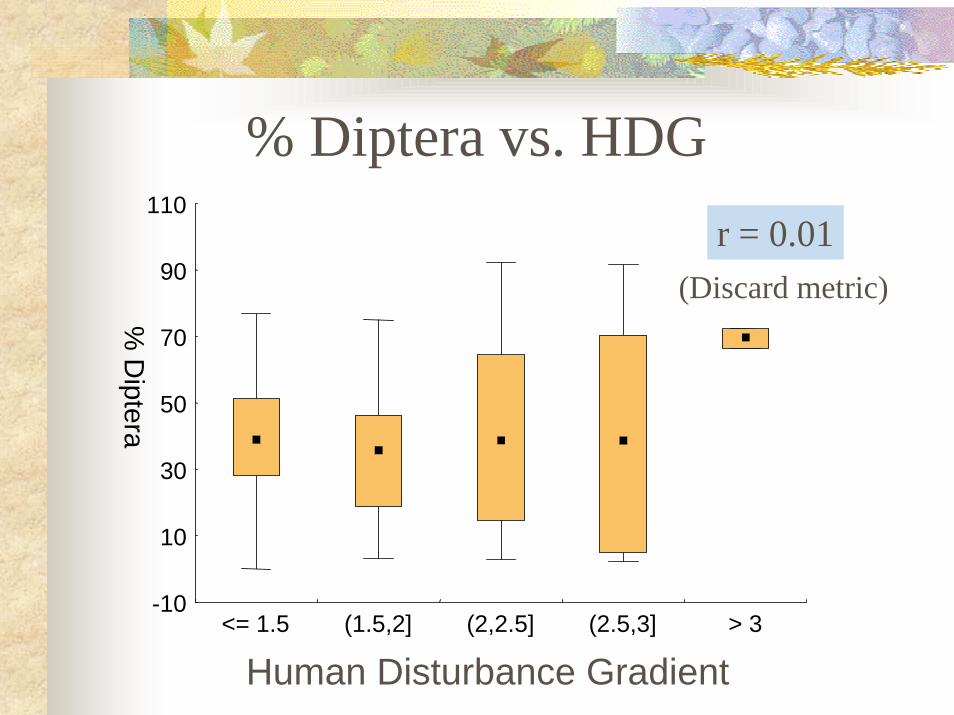
<= 1.5 (1.5,2] (2,2.5] (2.5,3] > 3
% Diptera vs. HDGr = 0.01
Human Disturbance Gradient
(Discard metric)
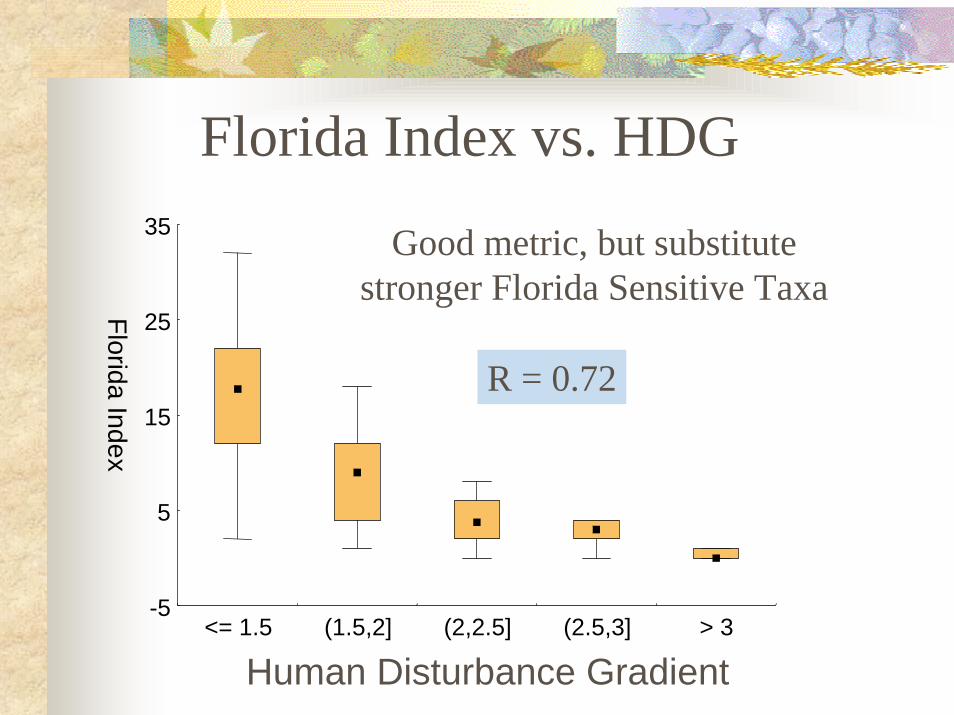
Florida Index
-5
5
15
25
35
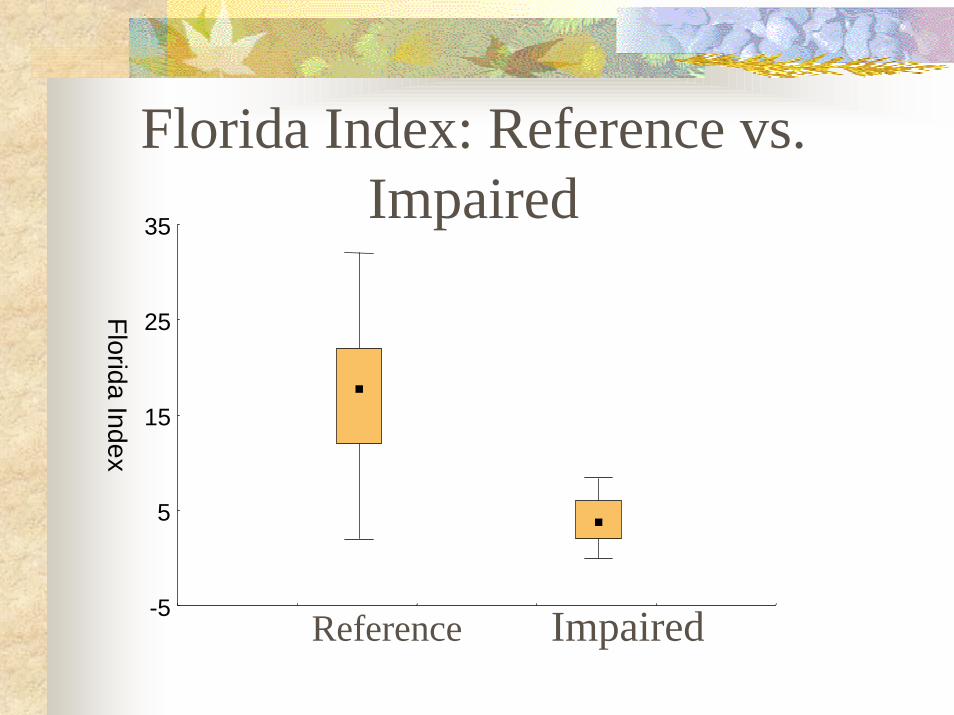
Florida Index: Reference vs.Impaired
Reference Impaired
Florida Index
-5
5
15
25
35
<= 1.5 (1.5,2] (2,2.5] (2.5,3] > 3
Florida Index vs. HDG
Human Disturbance Gradient
R = 0.72
Good metric, but substitutestronger Florida Sensitive Taxa
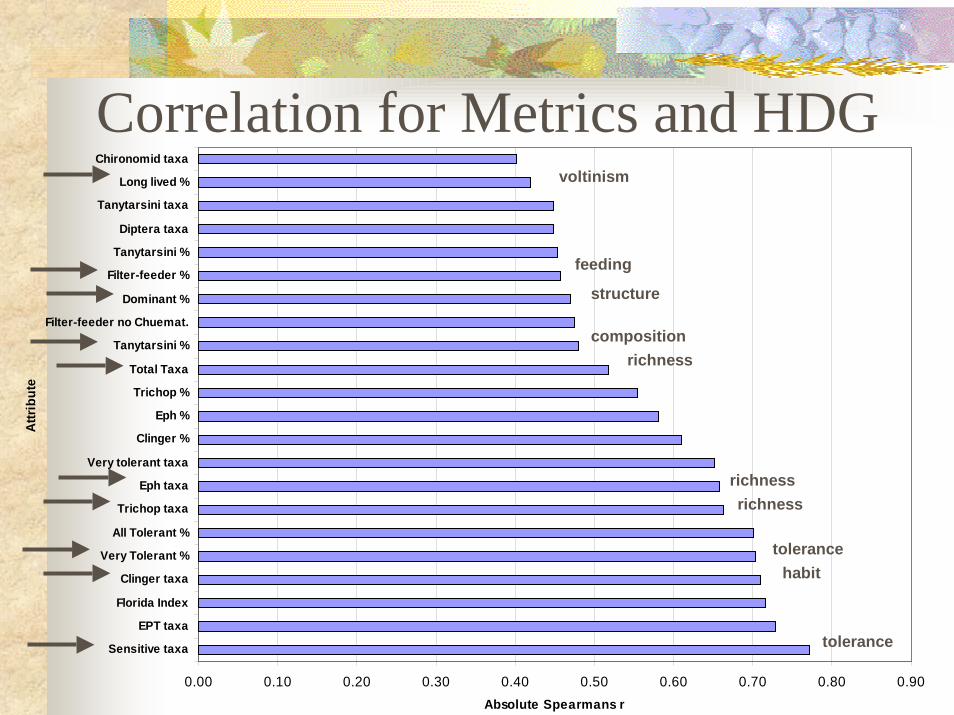
Correlation for Metrics and HDG
0.00 0.10 0.20 0.30 0.40 0.50 0.60 0.70 0.80 0.90
Sensitive taxa
EPT taxa
Florida Index
Clinger taxa
Very Tolerant %
All Tolerant %
Trichop taxa
Eph taxa
Very tolerant taxa
Clinger %
Eph %
Trichop %
Total Taxa
Tanytarsini %
Filter-feeder no Chuemat.
Dominant %
Filter-feeder %
Tanytarsini %
Diptera taxa
Tanytarsini taxa
Long lived %
Chironomid taxa
Attri
bute
Absolute Spearmans r
voltinism
feeding
structure
compositionrichness
richnessrichness
tolerance
tolerancehabit
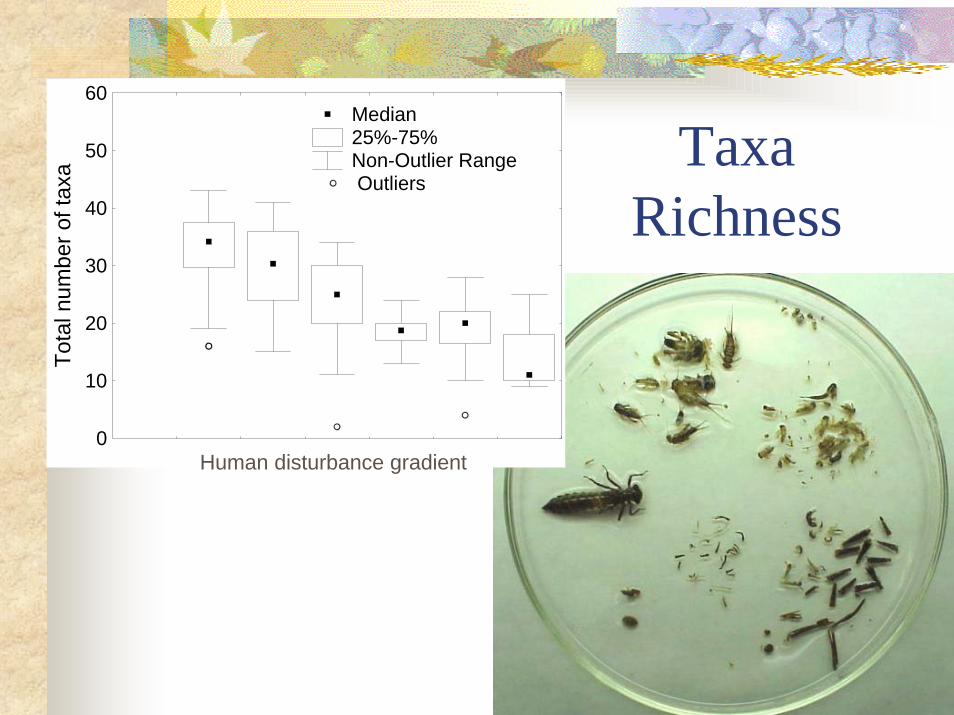
TaxaRichness
0
10
20
30
40
50
60To
tal n
umbe
r of t
axa
Median 25%-75% Non-Outlier Range
Outliers
Human disturbance gradient
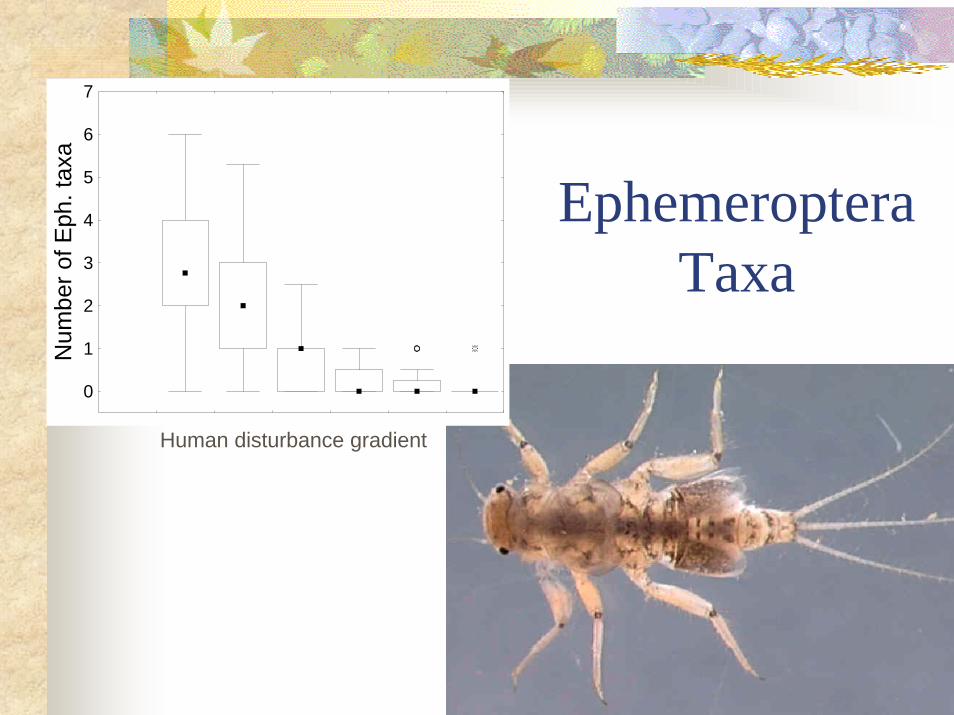
EphemeropteraTaxa
0
1
2
3
4
5
6
7N
umbe
r of E
ph. t
axa
Human disturbance gradient
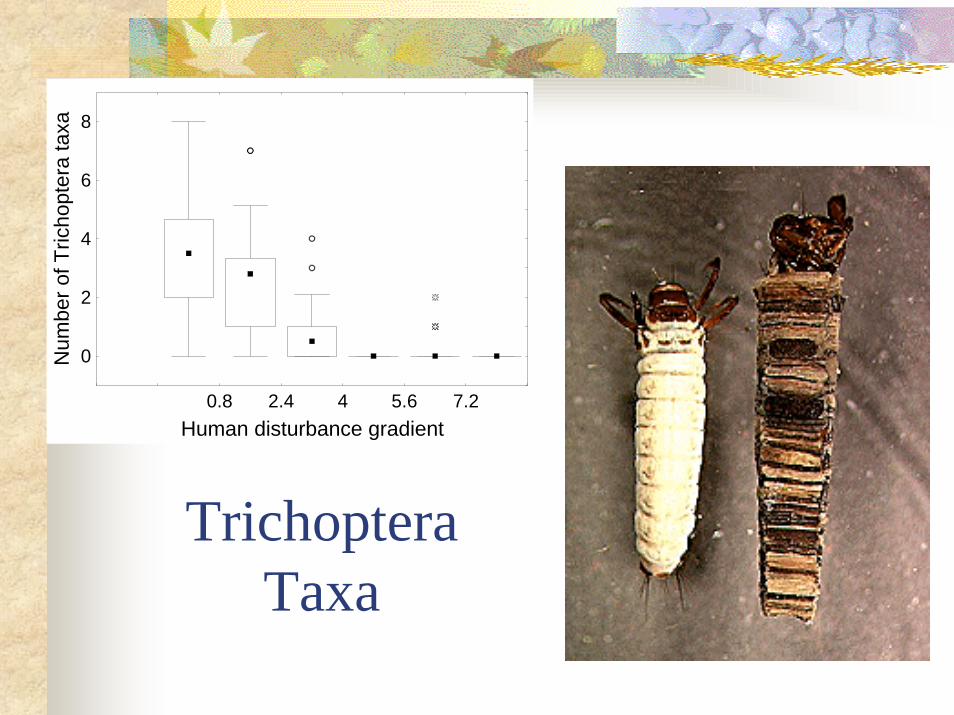
TrichopteraTaxa
0.8 2.4 4 5.6 7.2Human disturbance gradient
0
2
4
6
8
Num
ber o
f Tric
hopt
era
taxa
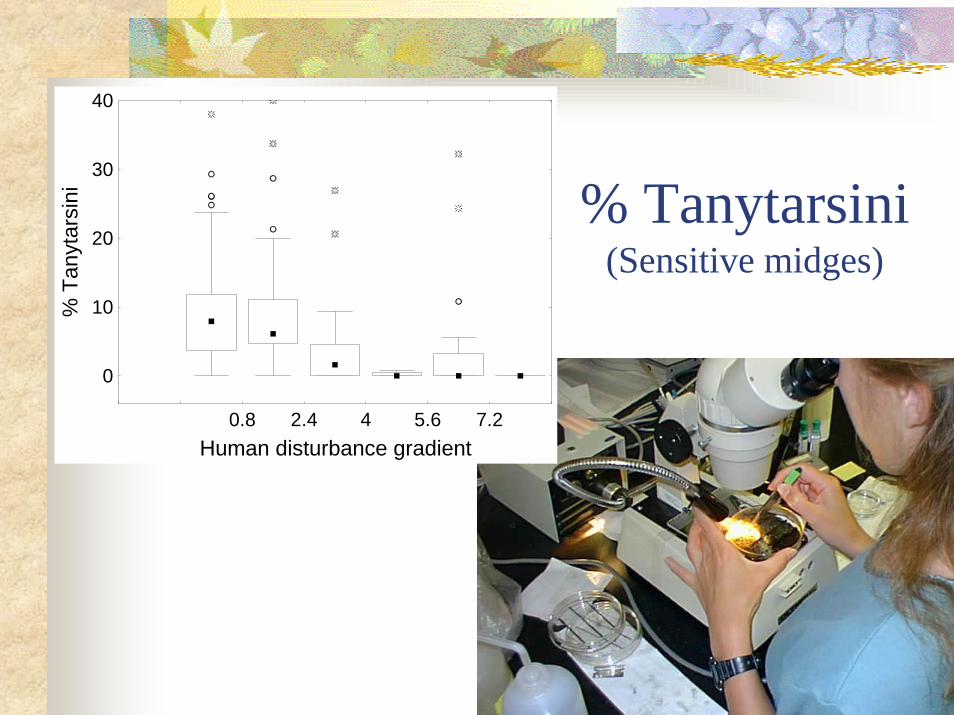
% Tanytarsini(Sensitive midges)
0.8 2.4 4 5.6 7.2Human disturbance gradient
0
10
20
30
40%
Tan
ytar
sini
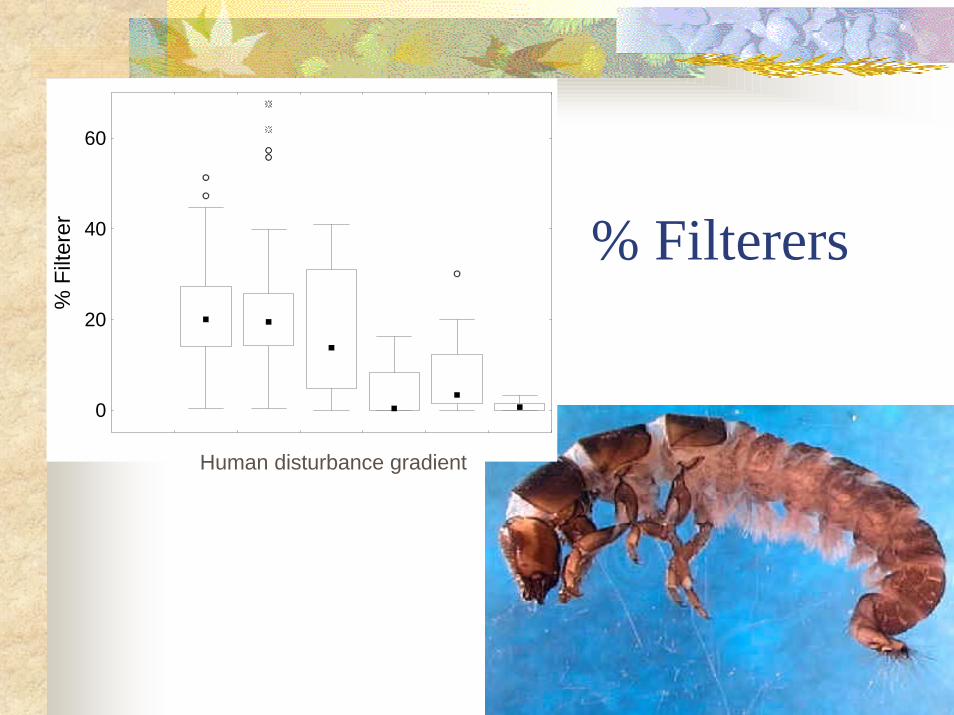
% Filterers
0
20
40
60
% F
ilter
er
Human disturbance gradient
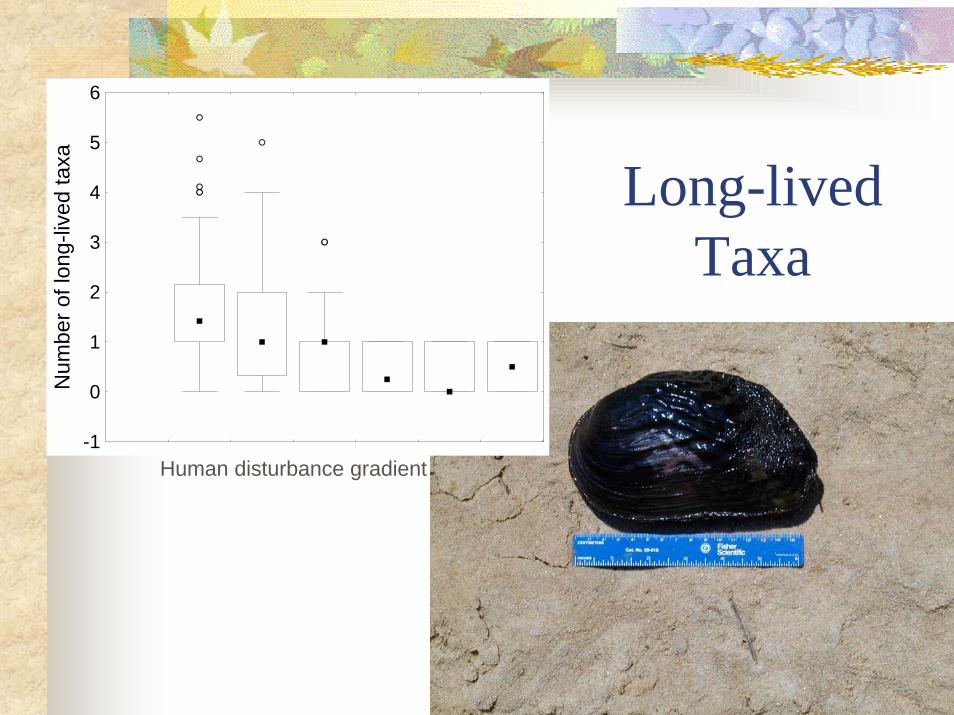
Long-livedTaxa
-1
0
1
2
3
4
5
6N
umbe
r of l
ong-
lived
taxa
Human disturbance gradient
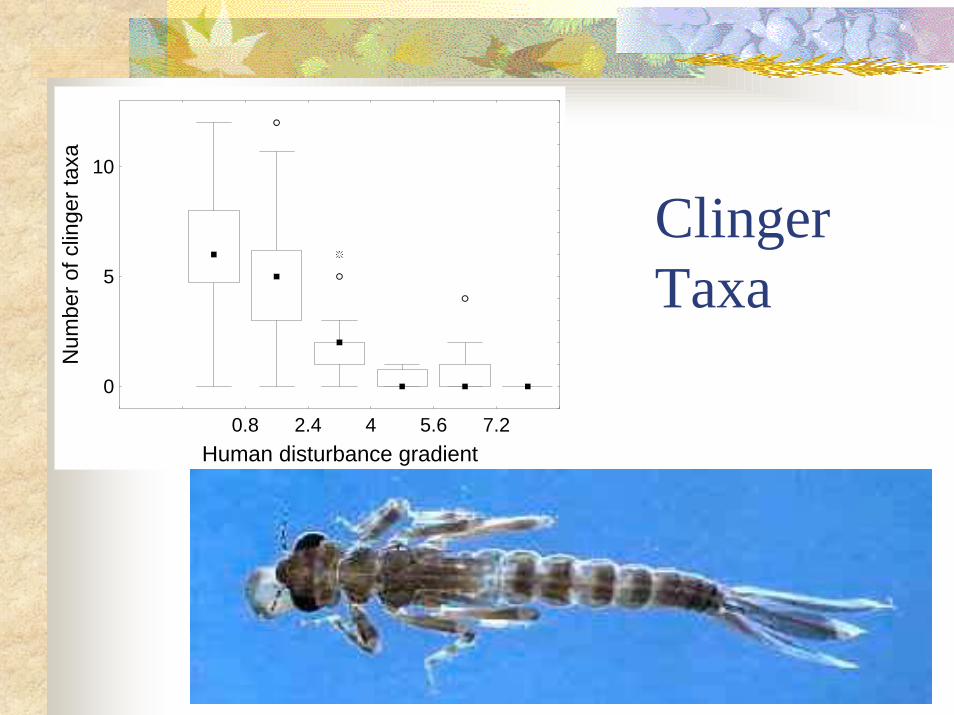
ClingerTaxa
0.8 2.4 4 5.6 7.2Human disturbance gradient
0
5
10
Num
ber o
f clin
ger t
axa
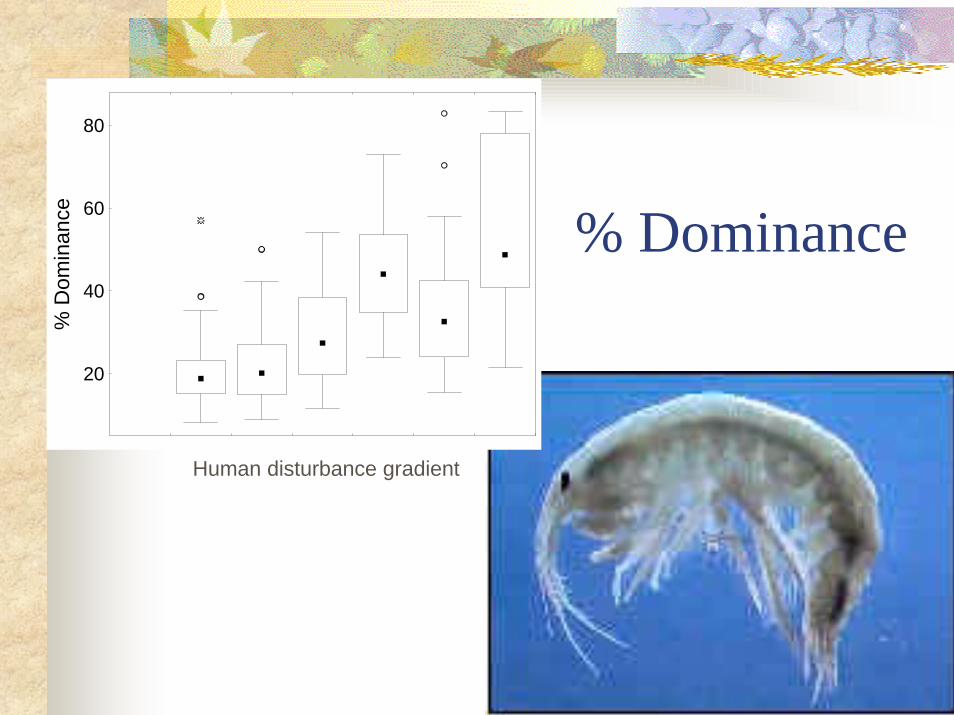
% Dominance
20
40
60
80
% D
omin
ance
Human disturbance gradient
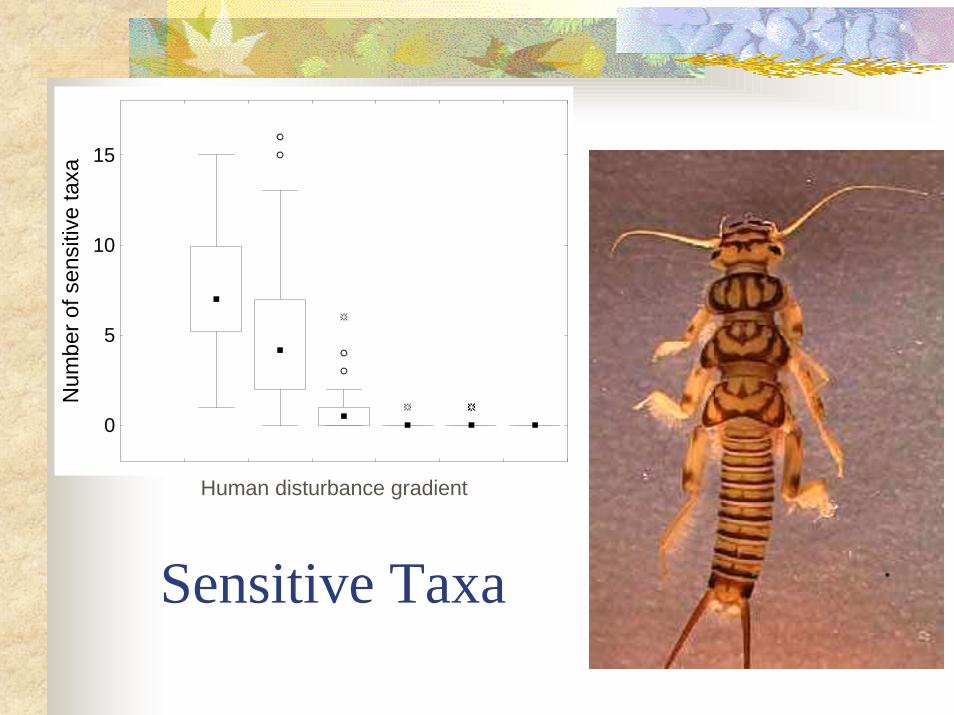
Sensitive Taxa
0
5
10
15
Num
ber o
f sen
sitiv
e ta
xa
Human disturbance gradient
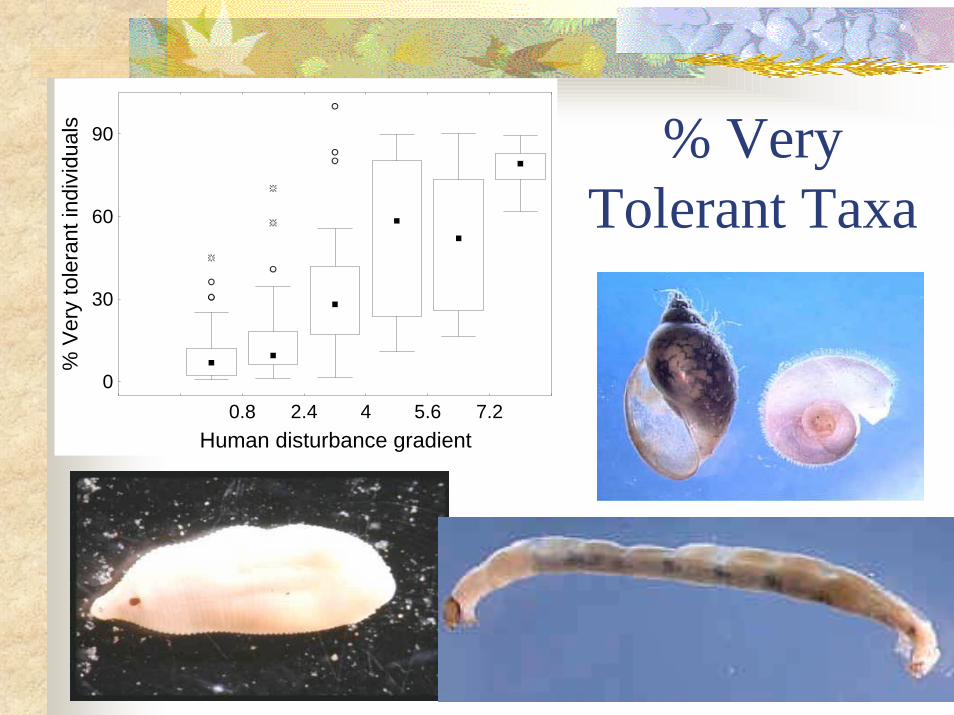
% VeryTolerant Taxa
0.8 2.4 4 5.6 7.2Human disturbance gradient
0
30
60
90
% V
ery
tole
rant
indi
vidu
als
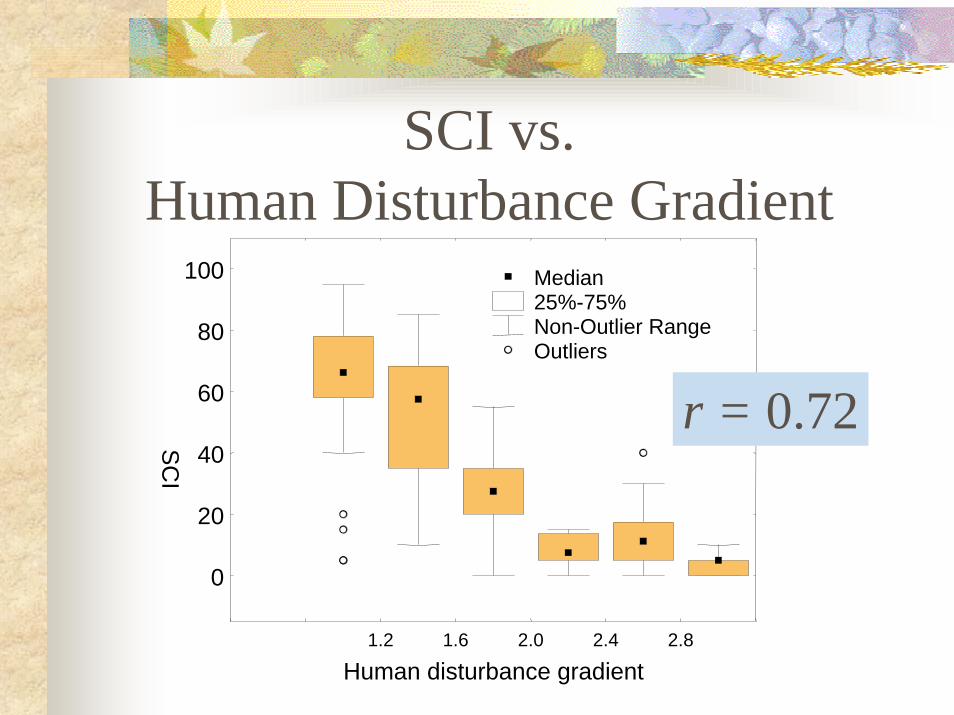
SCI vs.Human Disturbance Gradient
1.2 1.6 2.0 2.4 2.8
Human disturbance gradient
0
20
40
60
80
100
SC
I
Median 25%-75% Non-Outlier Range Outliers
r = 0.72
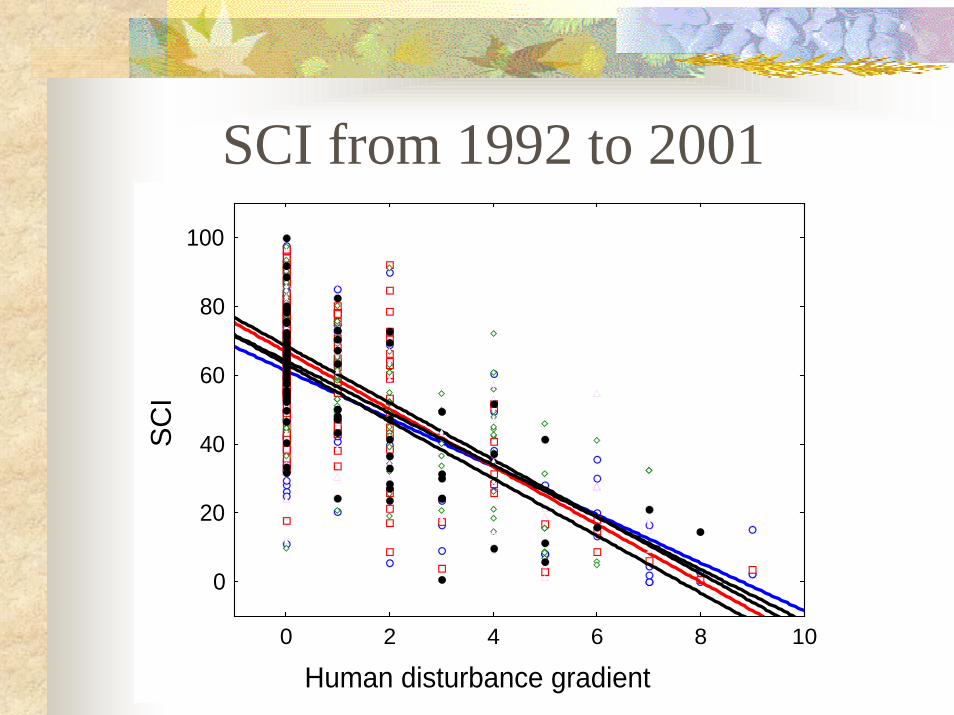
Human disturbance gradient
SC
I
0 2 4 6 8 10
0
20
40
60
80
100
SCI from 1992 to 2001
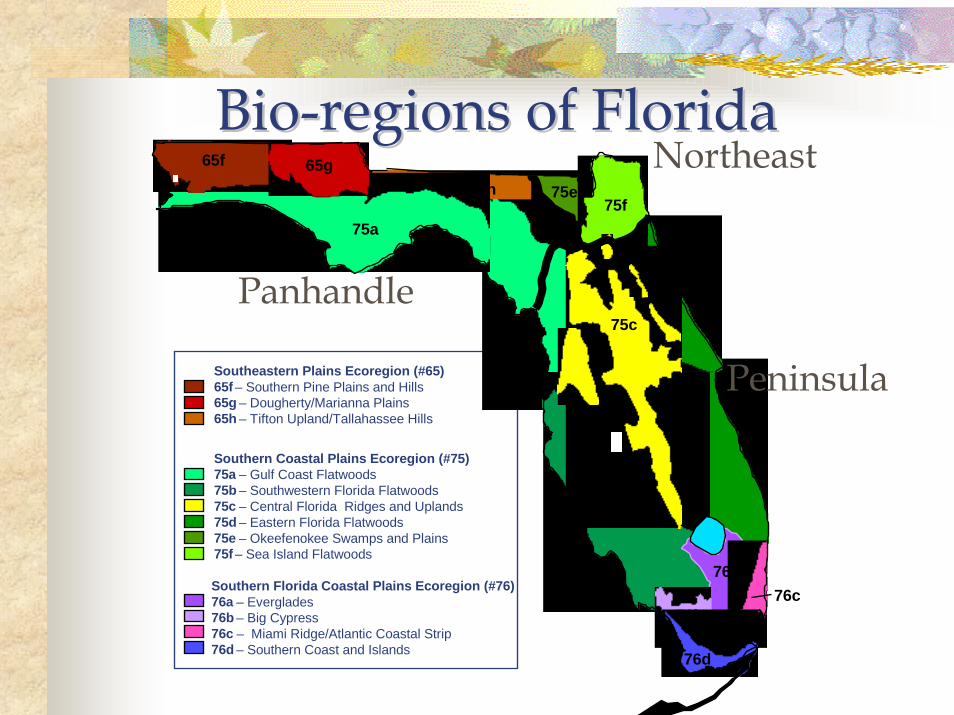
Bio-regions of FloridaBio-regions of Florida
Southeastern Plains Ecoregion (#65) 65f – Southern Pine Plains and Hills 65g – Dougherty/Marianna Plains 65h – Tifton Upland/Tallahassee Hills
Southern Coastal Plains Ecoregion (#75) 75a – Gulf Coast Flatwoods 75b – Southwestern Florida Flatwoods 75c – Central Florida Ridges and Uplands 75d – Eastern Florida Flatwoods 75e – Okeefenokee Swamps and Plains 75f – Sea Island Flatwoods
Southern Florida Coastal Plains Ecoregion (#76) 76a – Everglades 76b – Big Cypress 76c – Miami Ridge/Atlantic Coastal Strip 76d – Southern Coast and Islands
65f 65g65h 75e
75f
75c
75b
75d
76b76c
76d
75a
76a
Panhandle
Peninsula
Northeast
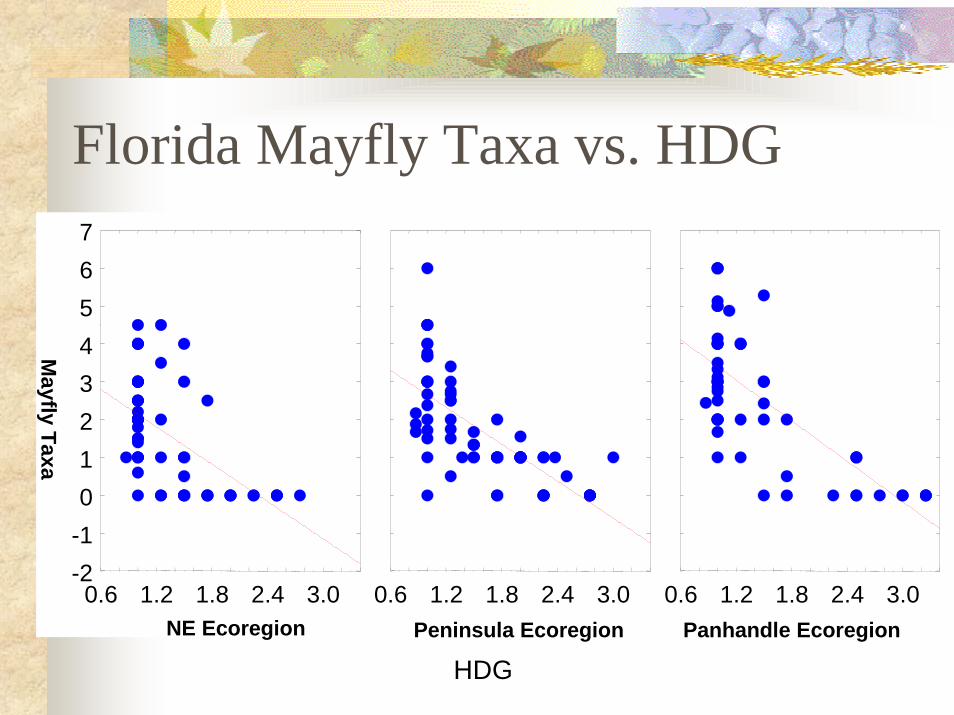
0.6 1.2 1.8 2.4 3.0-2-101234567
0.6 1.2 1.8 2.4 3.0 0.6 1.2 1.8 2.4 3.0
HDGNE Ecoregion Peninsula Ecoregion Panhandle Ecoregion
Florida Mayfly Taxa vs. HDG
Mayfly Taxa
Sensitive Taxa
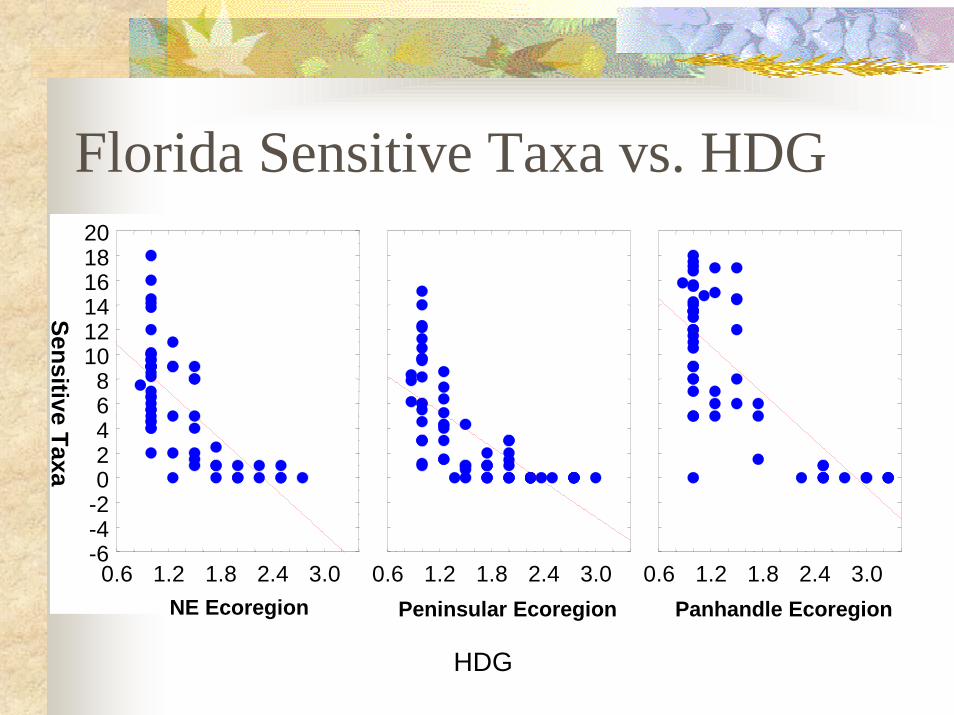
0.6 1.2 1.8 2.4 3.0-6-4-202468
101214161820
0.6 1.2 1.8 2.4 3.0 0.6 1.2 1.8 2.4 3.0
HDG
NE Ecoregion Peninsular Ecoregion Panhandle Ecoregion
Florida Sensitive Taxa vs. HDG
HDG
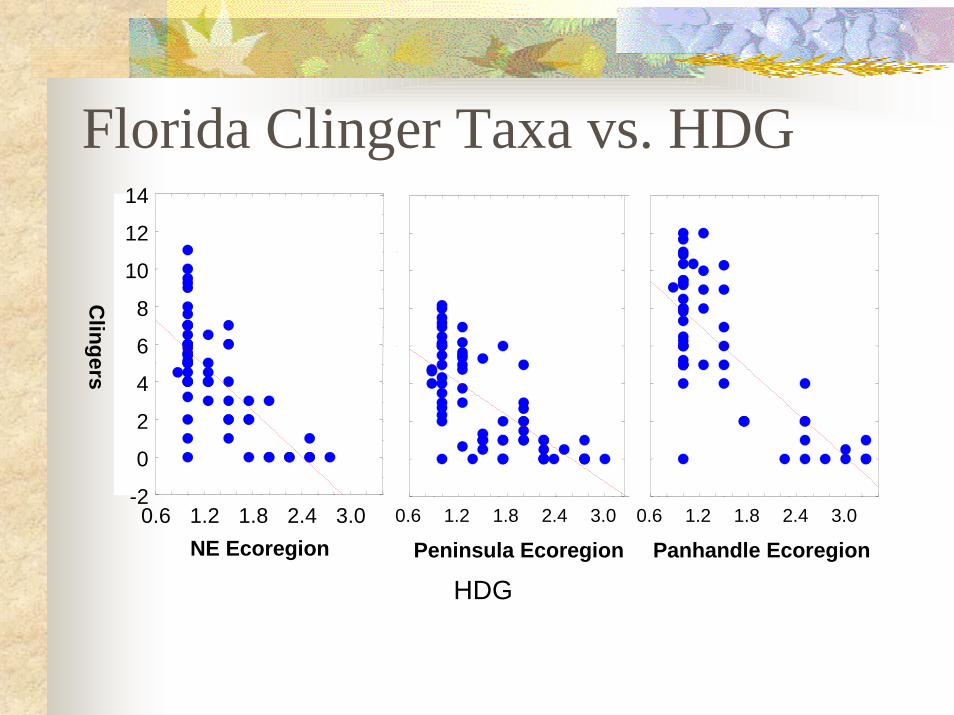
Clingers
NE Ecoregion0.6 1.2 1.8 2.4 3.0
-2
0
2
4
6
8
10
12
14
Peninsula Ecoregion0.6 1.2 1.8 2.4 3.0
Panhandle Ecoregion0.6 1.2 1.8 2.4 3.0
Florida Clinger Taxa vs. HDG
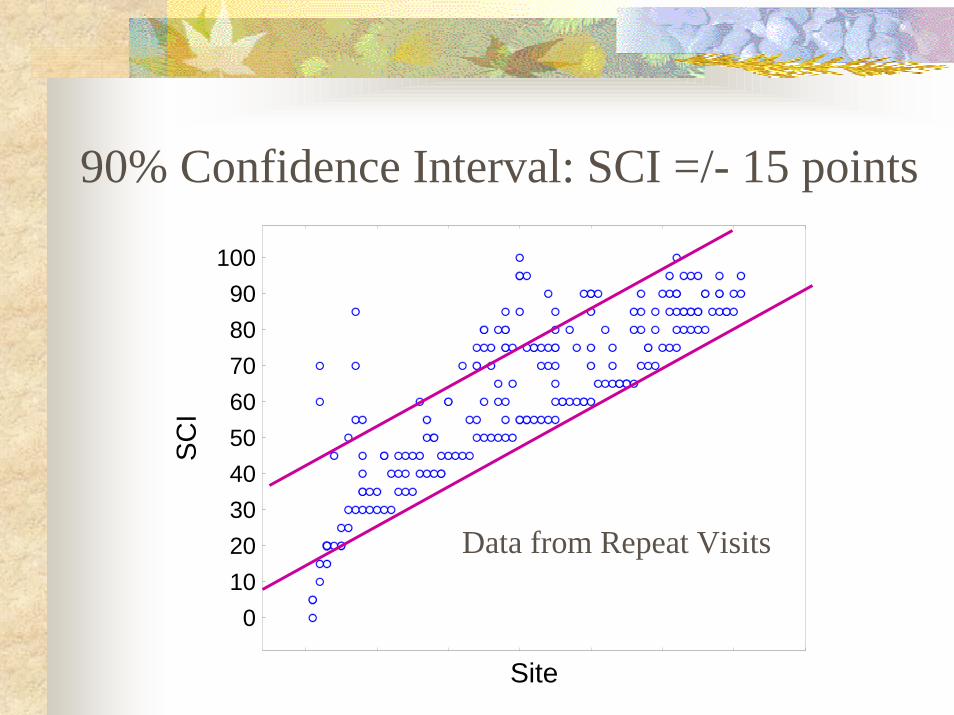
Site
0102030405060708090
100
SC
I90% Confidence Interval: SCI =/- 15 points
Data from Repeat Visits
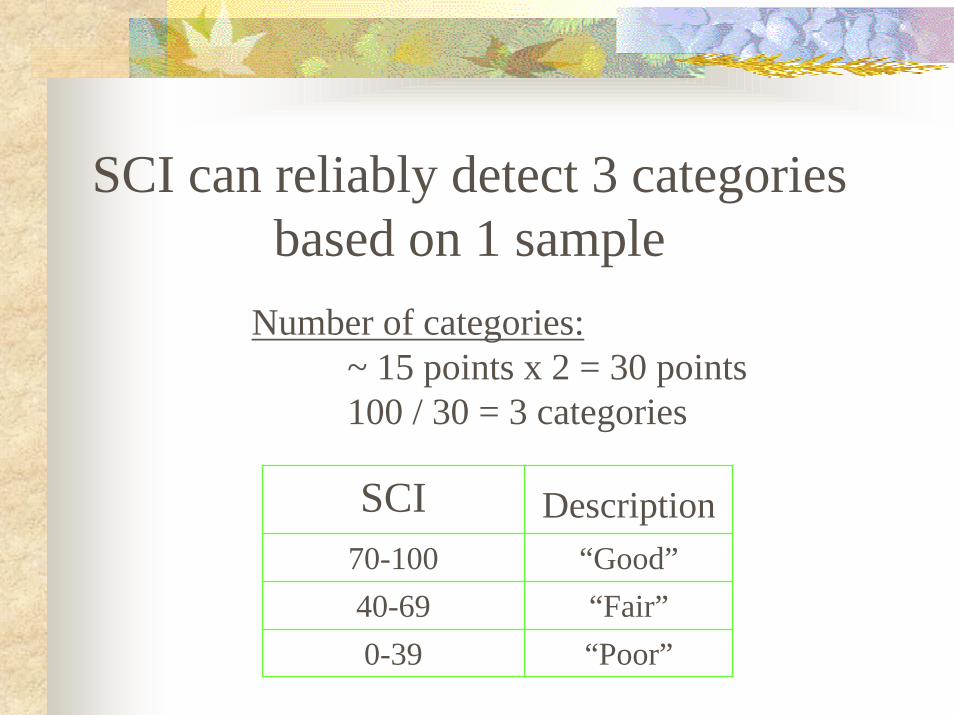
“Poor”“Fair”
“Good”DescriptionSCI
0-3940-6970-100
SCI can reliably detect 3 categoriesbased on 1 sample
Number of categories:~ 15 points x 2 = 30 points100 / 30 = 3 categories
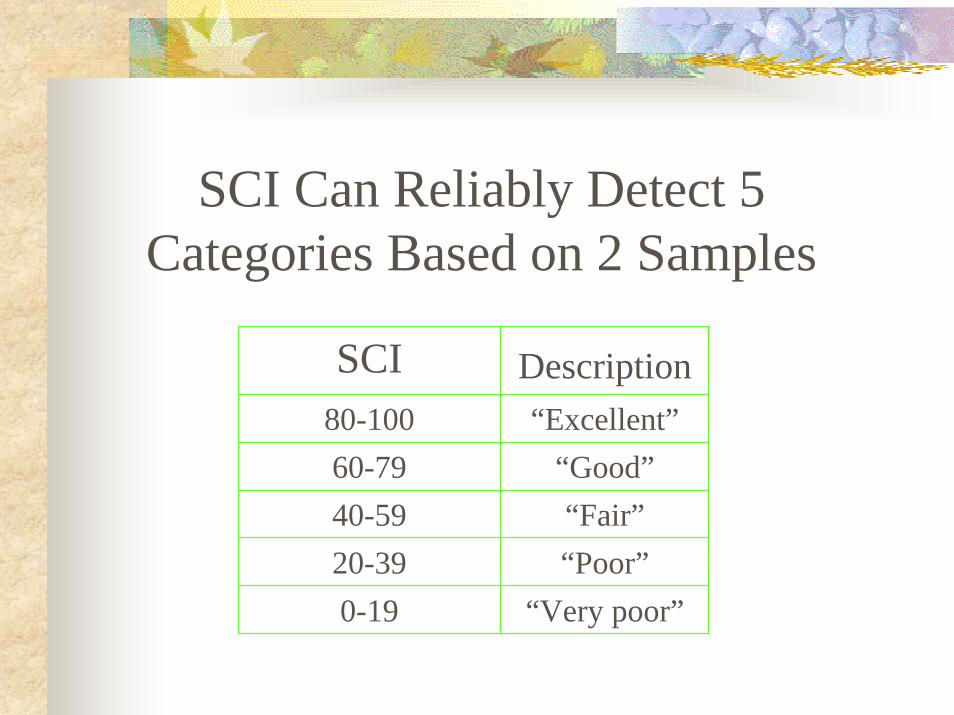
“Very poor”“Poor”“Fair”
“Good”“Excellent”
DescriptionSCI
0-1920-3940-5960-7980-100
SCI Can Reliably Detect 5Categories Based on 2 Samples
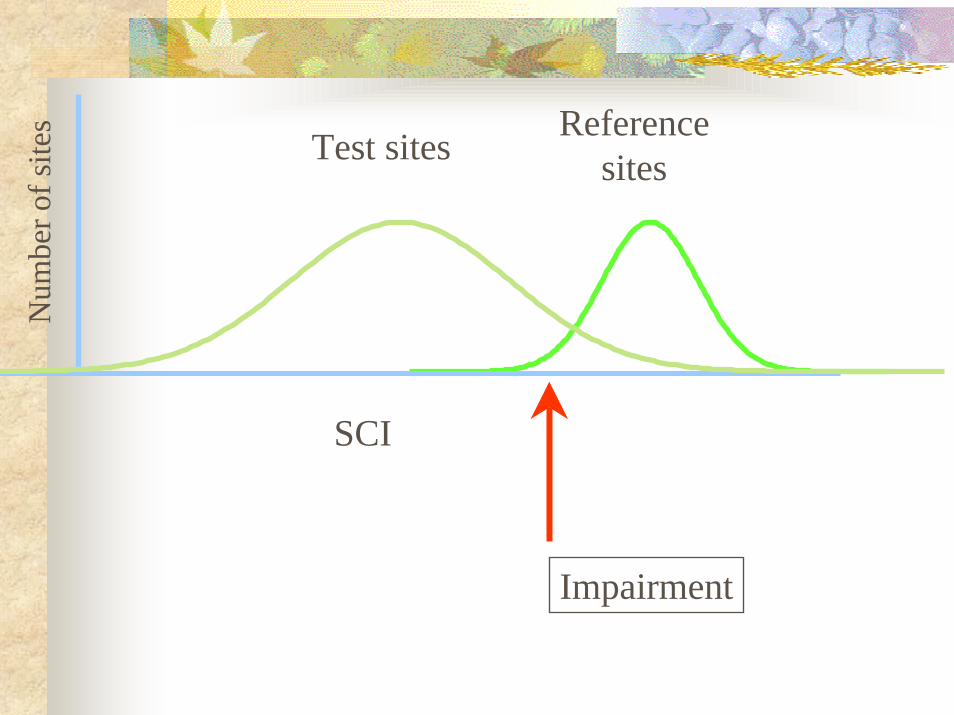
SCI
ReferencesitesTest sites
Num
ber o
f site
s
Impairment

SCI
ReferencesitesTest sites
Num
ber o
f site
s
V. Poor OutstandingGoodFairPoor
Con
ditio
n of
the
Bio
tic C
omm
unity
[Spe
cific
to E
coty
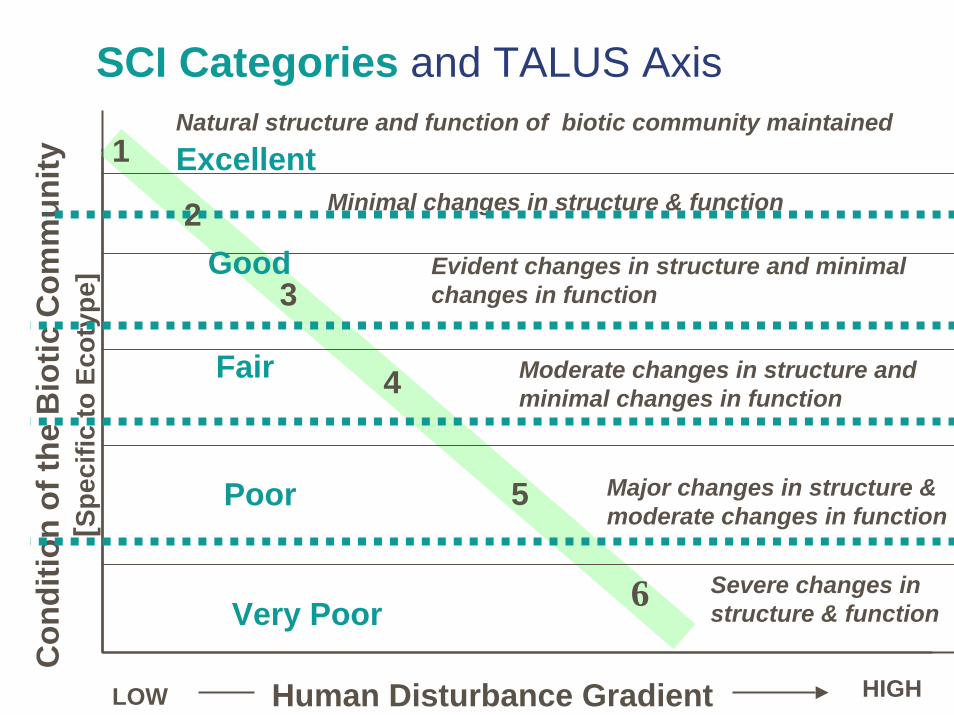
pe] Evident changes in structure and minimalchanges in function
Moderate changes in structure andminimal changes in function
Natural structure and function of biotic community maintained
Minimal changes in structure & function
Human Disturbance GradientLOW HIGH
Major changes in structure &moderate changes in function
Severe changes instructure & function
SCI Categories and TALUS Axis
3
2
1
5
4
6
Excellent
Good
Fair
Poor
Very Poor
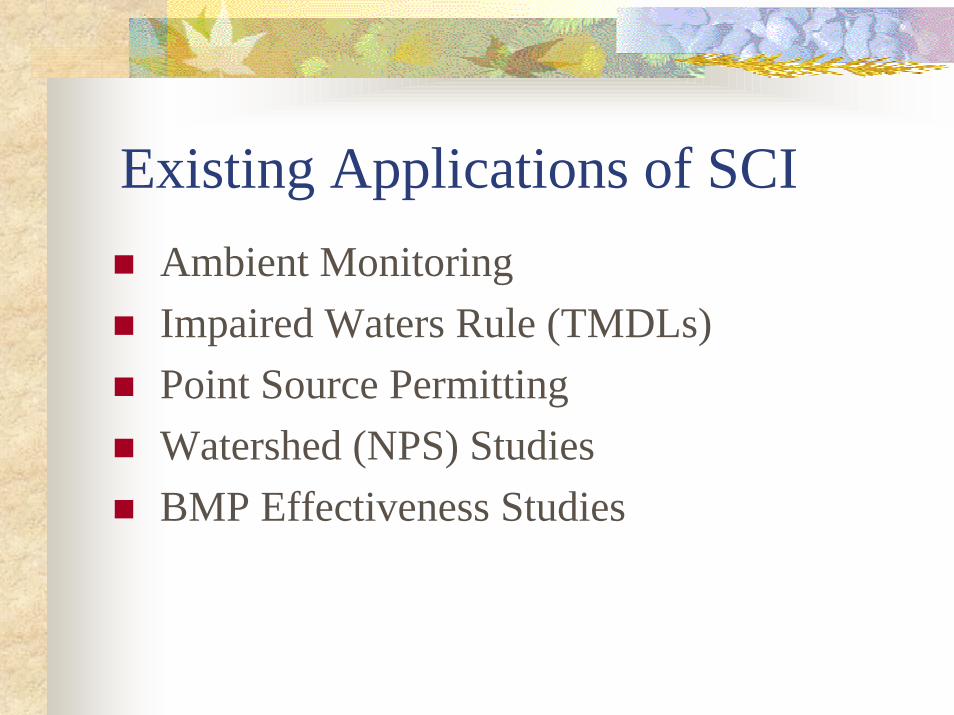
Existing Applications of SCIAmbient MonitoringImpaired Waters Rule (TMDLs)Point Source PermittingWatershed (NPS) StudiesBMP Effectiveness Studies
ConclusionsThe SCI is effective in regulatory programsDiscriminatory power of metrics
Comparing extremes identifies strong metrics,but includes some “noisy” metricsHuman Disturbance Gradient improvesmetric selection and provides an independentmeasure for comparing biological response