un weather disasters report. -...
TRANSCRIPT
1995-2015
1995-2015
humAn coStof
WeAtheRRelAteD
DISASteRS
the
list ofcontents
foreword 03
Who we are 04
executiveSummary 05
Chapter 1Weather-related disasters 1995-2015 07
Chapter 2human costs of weather-related disasters 12
Chapter 3Impacts of weather-related disasters by country 17
Chapter 4Weather-related disasters & national income 20
Chapter 5counting the economic costs of disasters 23
Acknowledgements 27
The Human Cost of Weather-Related Disasters 1995-2015 | 03
foreword
This publication provides a sober and revealing analysis of weather-related disaster trendsover a twenty year time-frame which coincides with a period which has seen the UNFramework Convention on Climate Change Conference of the Parties become anestablished high- profile annual fixture on the development calendar. The contents of thisreport underline why it is so important that a new climate change agreement emergesfrom the COP21 in Paris in December.
This would be a satisfying conclusion to a year which started off strongly with the adoptionin March of the Sendai Framework for Disaster Risk Reduction 2015-2030 which sets outpriorities for action in order to achieve a substantial reduction in disaster losses. The SendaiFramework has since been followed by agreements on development financing and theambition of the 17 Sustainable Development Goals adopted by UN Member States inSeptember.
Climate change, climate variability and weather events pose a threat to the eradication ofextreme poverty and should serve as a spur to hasten efforts not only to reduce greenhousegas emissions but also to tackle other underlying risk drivers such as unplanned urbandevelopment, vulnerable livelihoods, environmental degradation and gaps in early warnings.
The report highlights many key shortcomings in understanding the nature and true extentof disaster losses, particularly from drought despite the fact that it accounts for more than25% of all people affected by climate-related disasters.
There must be greater support to countries struggling to measure their losses so they canimprove both risk reduction efforts and overall understanding of where the focus needs tobe to reduce those very losses.
The more we understand the causes and consequences of risk generation andaccumulation, the better we will be able to adapt, mitigate and prevent in the future,whatever that future may have in store for us.
Margareta WahlstromHead of the UN Office for Disaster Risk Reduction,UN Special Representative of the Secretary-Generalfor Disaster Risk Reduction
Debarati Guha-SapirProfessor Centre for Research on the Epidemiology of DisastersInstitute of Health and SocietyUniversité Catholique de Louvain (UCL), Belgium
04 | The Human Cost of Weather-Related Disasters 1995-2015
Who we are
cReDThe Centre for Research on the Epidemiology of Disasters (CRED) is the world’s foremost agency for the study of public healthduring mass emergencies, including the epidemiology of diseases, plus the structural and socio-economic impacts of natural andtechnological disasters and human conflicts. Based since 1973 at the School of Public Health of the Université Catholique deLouvain, Belgium, CRED became in 1980 a World Health Organization (WHO) collaboration centre. Since then, CRED has workedclosely with United Nations agencies, inter-governmental and governmental institutions, non-governmental organizations (NGOs),research institutes and other universities. Disasters preparedness, mitigation and prevention for vulnerable populations have alsogained a higher profile within CRED's activities in recent years.
www.cred.be
em-DAtCRED’s Emergency Events Database (EM-DAT) contains the world’s most comprehensive data on the occurrence and effects ofmore than 21,000 technological and natural disasters from 1900 to the present day. Created with the support of the WHO andthe Belgian government, the main objective of EM-DAT is to inform humanitarian action at the national and international levelsin order to improve decision-making in disaster preparedness, provide objective data for assessing communities’ vulnerability todisasters and to help policy-makers set priorities. In 1999, a collaboration between the United States Agency for InternationalDevelopment's Office Foreign Disaster Assistance (USAID/OFDA) and CRED was initiated. Since 2014, EM-DAT also georeferencesnatural disasters, adding geographical values to numeric data which is essential for deeper analysis.
Details of EM-DAT's methodology and partner organizations can be found on our website www.emdat.be
unISDRThe UN Office for Disaster Risk Reduction was established in 1999 and serves as the focal point in the United Nations Systemfor the coordination of disaster risk reduction. It supports the implementation of the Sendai Framework for Disaster Risk Reduction2015-2030 which maps out a broad people-centered approach towards achieving a substantial reduction in disaster losses fromman-made and natural hazards and a shift in emphasis from disaster management to disaster risk management. UNISDR andpartners produce the biennial Global Assessment Report on Disaster Risk Reduction which provides evidence for the integrationof disaster risk reduction into private investment decision-making and public policy in urban, environmental, social and economicsectors. UNISDR also coordinates the Making Cities Resilient Campaign and Worldwide Initiative for Safe Schools and engageswith governments in developing national disaster loss databases.
www.unisdr.org
The Human Cost of Weather-Related Disasters 1995-2015 | 05
Weather-related disasters are becoming increasingly frequent,due largely to a sustained rise in the numbers of floods andstorms. Flooding alone accounted for 47% of all weather-related disasters (1995-2015), affecting 2.3 billion people, themajority of whom (95%) live in Asia. While less frequent thanflooding, storms were the most deadly type of weather-relateddisaster, killing more than 242,000 people in the past 21years; that is 40% of the global total for all weather-relateddisasters. The vast majority of these deaths (89%) occurred inlower-income countries, even though they experienced just26% of all storms.
Heatwaves and extreme cold were particularly deadly in termsof the numbers of lives lost in each event (405 deaths perdisaster on average). High-income countries reported that76% of weather-related disaster deaths were due to extremetemperatures, mainly heatwaves. Overall, mortality fromheatwaves helped push the average toll from weather-relateddisasters up to 99 per event in high-income countries. This issecond only to lower-middle-income countries in terms of theaverage number killed per disaster. While this ranking issubject to reporting bias (due in part to under-recording inlow-income countries) the data still demonstrate thewidespread impact of weather-related disasters on rich andpoor alike.
In total, EM-DAT recorded an average of 335 weather-relateddisasters per year between 2005 and 2014, an increase of14% from 1995-2004 and almost twice the level recorded during1985-1994. While scientists cannot calculate what percentage
of this rise is due to climate change, predictions of moreextreme weather in future almost certainly mean that we willwitness a continued upward trend in weather-related disastersin the decades ahead.
In order to plan for future risk reduction, two critical factorsmust be kept in mind: population growth will continue to putmore and more people in harm’s way, while uncontrolledbuilding on flood plains and storm-prone coastal zones willincrease human vulnerabilities to extreme weather events. Thecost of such vulnerability is already evident from mountingdeath tolls since 1995, which have risen on average despitean overall decline in the absolute and relative numbers ofpeople affected by weather-related disasters.
The true economic cost of weather related disasters is alsobleaker than EM-DAT data suggest (US$ 1,891 billion), sinceonly 35% of records include information about economiclosses; in Africa the figure is as low as 16.7%. Overall, annualeconomic losses from disasters are estimated by UNISDR atbetween US$ 250 billion and US$ 300 billion extrapolatingfrom a study of nationally-reported disaster losses.
The reporting gaps underline the need for UNISDR andpartners to continue working with governments to establishrobust and well-maintained national disaster loss databasesto improve record-keeping and accountability. Universallyacceptable loss indicators are currently under developmentto measure progress in reducing disaster losses as set out inthe Sendai Framework for Disaster Risk Reduction 2015-2030.
Over the last twenty years, the overwhelming majority (90%) of disasters have beencaused by floods, storms, heatwaves and other weather-related events. In total,6,457 weather-related disasters were recorded worldwide by EM-DAT, the foremostinternational database of such events. Over this period, weather-related disastersclaimed 606,000 lives, an average of some 30,000 per annum, with an additional4.1 billion people injured, left homeless or in need of emergency assistance.
ExecutiveSummary
These statistics and others in this report point to severalmajor conclusions:
• While better data are required to count the full human cost,EM-DAT records already demonstrate that weather-relateddisasters impact heavily on rich and poor alike.
• Economic losses from weather- and climate-related disastershave been heavily influenced by increasing exposure ofpeople and economic assets.
• Better management, mitigation and deployment of earlywarnings could save more lives in future.
• Better flood control for poorer communities at high risk ofrecurrent flooding would be another step forward. Effectivelow-cost solutions exist, including afforestation, reforestation,floodplain zoning, embankments, better warnings and resto-ration of wetlands.
• Reducing the size of drought-vulnerable populations shouldbe a global priority given the effectiveness of early warningsand the fact that one billion people have been affected overthe last twenty years.
• There is a requirement for strengthening disaster risk gover-nance to manage disaster risk with clear vision, competence,plans, guidelines and coordination across sectors.
• Public and private investment in disaster risk prevention andreduction through structural and non-structural measuresneeds to be stepped up to create disaster-resilient societies.
BOX 1
natural disasters
In order to be recorded as a naturaldisaster in EM-DAT, an event mustmeet at least one of the followingcriteria:
• Ten or more people reported killed• 100 or more people reported affected• Declaration of a state of emergency• Call for international assistance.
While EM-DAT is the mostcomprehensive disaster databaseavailable worldwide, and every effort ismade to collect and validateinformation from our sources, we areaware that certain regions, includingAfrica, tend to under-report events.
For details about the definitions usedin this report, please see:http://www.emdat.be/explanatory-notes
BOX 2
hazards versusdisasters
In this report, the term hazard refers toa severe or extreme event such as aflood, storm, cold spell or heatwaveetc. which occurs naturally anywherein the world. Hazards only becomedisasters when human lives are lostand livelihoods damaged or destroyed.Rises in the global population increasethe risk of disasters because morepeople live in harm’s way.
06 |
The Human Cost of Weather-Related Disasters 1995-2015 | 07
Chapter 1
Weather-related disasters1995-20151
Introduction
Between 1995 and 2015, EM-DAT recorded 6,457 weather-relateddisasters, which claimed a total of 606,000 lives and affected morethan 4 billion people. On average, 205 million people were affectedby such disasters each year.
Asia bore the brunt of weather-related disasters, with morefrequent events and greater numbers of people killed and affectedthan any other continent (Figure 1). This is due mainly to Asia’slarge and varied landmass, including multiple river basins, floodplains and other zones at high risk from natural hazards, plushigh population densities in disaster-prone regions. In total, 2,495weather-related disasters struck Asia between 1995 and 2015,affecting 3.7 billion people and killing a further 332,000 individuals.
In terms of countries, USA and China reported the highestnumbers of weather-related disasters during this period (Figure 1).Again, this can be attributed to their large and heterogeneouslandmasses and population concentrations.
1 Data for 2015 are only until August 2015.
08 | The Human Cost of Weather-Related Disasters 1995-2015
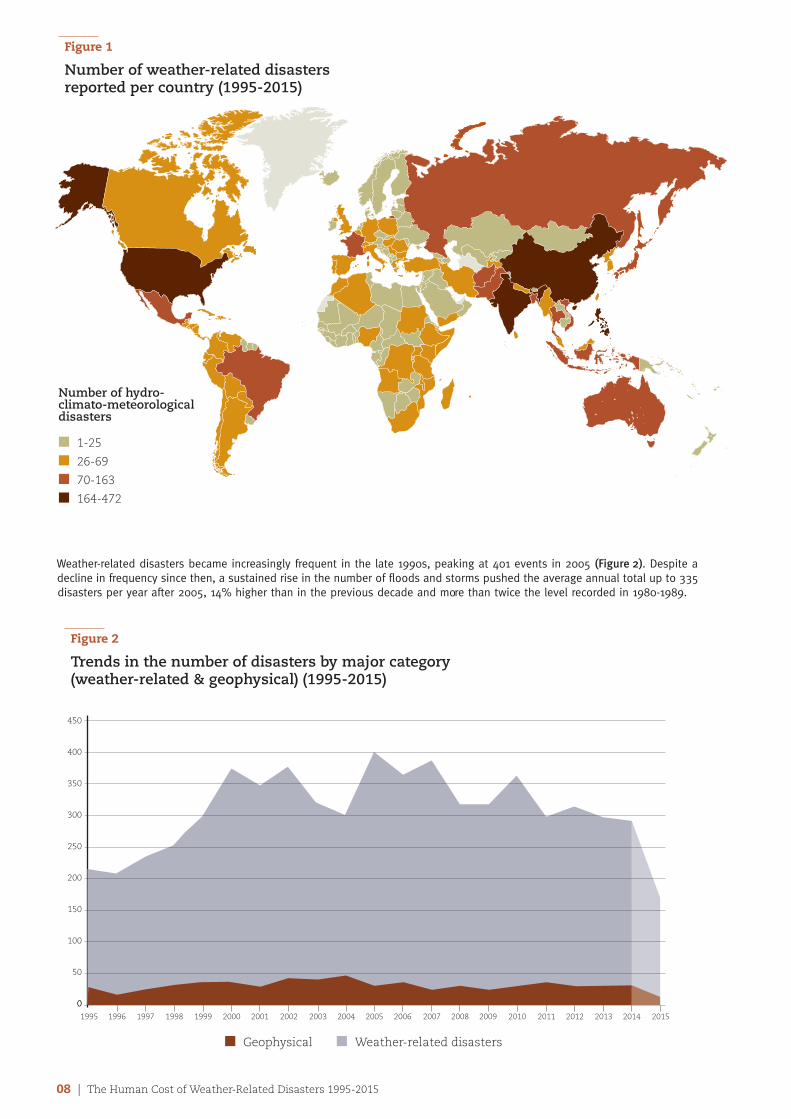
figure 1
Number of weather-related disasters reported per country (1995-2015)
Number of hydro-climato-meteorologicaldisasters
n 1-25
n 26-69
n 70-163
n 164-472
Weather-related disasters became increasingly frequent in the late 1990s, peaking at 401 events in 2005 (Figure 2). Despite adecline in frequency since then, a sustained rise in the number of floods and storms pushed the average annual total up to 335disasters per year after 2005, 14% higher than in the previous decade and more than twice the level recorded in 1980-1989.
00
50
100
150
200
250
300
350
400
450
1995 1996 1997 1998 1999 2000 2001 2002 2003 2004 2005 2006 2007 2008 2009 2010 2011 2012 2013 2014 2015
n Geophysical n Weather-related disasters
figure 2
Trends in the number of disasters by major category (weather-related & geophysical) (1995-2015)
The Human Cost of Weather-Related Disasters 1995-2015 | 09
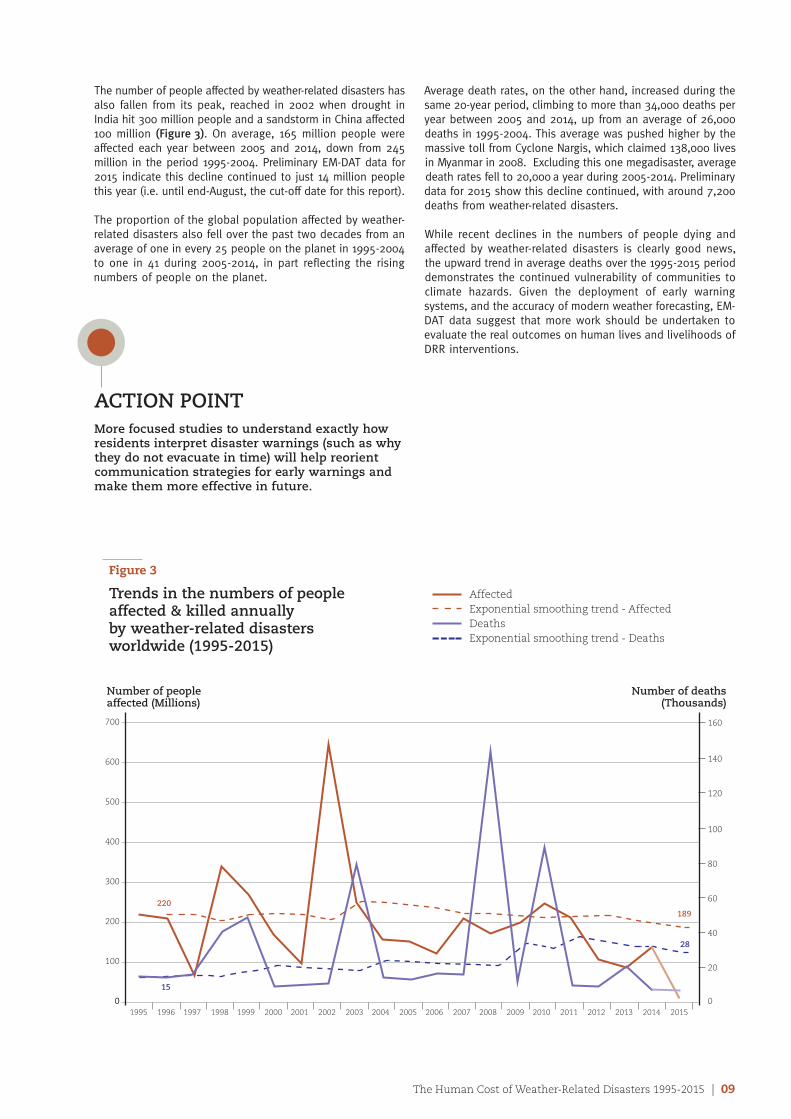
The number of people affected by weather-related disasters hasalso fallen from its peak, reached in 2002 when drought inIndia hit 300 million people and a sandstorm in China affected100 million (Figure 3). On average, 165 million people wereaffected each year between 2005 and 2014, down from 245million in the period 1995-2004. Preliminary EM-DAT data for2015 indicate this decline continued to just 14 million peoplethis year (i.e. until end-August, the cut-off date for this report).
The proportion of the global population affected by weather-related disasters also fell over the past two decades from anaverage of one in every 25 people on the planet in 1995-2004to one in 41 during 2005-2014, in part reflecting the risingnumbers of people on the planet.
Average death rates, on the other hand, increased during thesame 20-year period, climbing to more than 34,000 deaths peryear between 2005 and 2014, up from an average of 26,000deaths in 1995-2004. This average was pushed higher by themassive toll from Cyclone Nargis, which claimed 138,000 livesin Myanmar in 2008. Excluding this one megadisaster, averagedeath rates fell to 20,000 a year during 2005-2014. Preliminarydata for 2015 show this decline continued, with around 7,200deaths from weather-related disasters.
While recent declines in the numbers of people dying andaffected by weather-related disasters is clearly good news,the upward trend in average deaths over the 1995-2015 perioddemonstrates the continued vulnerability of communities toclimate hazards. Given the deployment of early warningsystems, and the accuracy of modern weather forecasting, EM-DAT data suggest that more work should be undertaken toevaluate the real outcomes on human lives and livelihoods ofDRR interventions.
ACTION POINTMore focused studies to understand exactly howresidents interpret disaster warnings (such as whythey do not evacuate in time) will help reorientcommunication strategies for early warnings andmake them more effective in future.
figure 3
Trends in the numbers of peopleaffected & killed annually by weather-related disasters worldwide (1995-2015)
00
100
200
300
400
500
600
700
0
20
1995 1996 1997 1998 1999 2000 2001 2002 2003 2004 2005 2006 2007 2008 2009 2010 2011 2012 2014 20152013
AffectedExponential smoothing trend - AffectedDeathsExponential smoothing trend - Deaths
220189
15
28
Number of peopleaffected (Millions)
Number of deaths(Thousands)
40
60
80
100
120
140
160
10 | The Human Cost of Weather-Related Disasters 1995-2015
BOX 3
The Sendai Framework: A United Nations Office for Disaster Risk ReductionPerspective
A major stocktaking exercise took place on the learning fromimplementation of the Hyogo Framework for Action 2005-2015:Building the Resilience of Nations and Communities to Disasters (HFA)starting in 2012. This was based on governments’ own self-assessments of their performance and extensive consultations withcivil society, including NGOs, the private sector, the scientificcommunity, local governments and other stakeholders. Since the HFAwas adopted, there has been a spread of a culture of disaster riskreduction across the globe manifesting itself in increased institutionaland legislative arrangements, improved preparedness and earlywarning systems, and better response. It was also found that thoughthe HFA gave detailed guidance on managing underlying risk drivers,in practice, most countries have understood and practiced disasterrisk reduction as the management of disasters. Its replacement,adopted at the Third UN World Conference on Disaster RiskReduction held in March, 2015, the Sendai Framework for DisasterRisk Reduction, clearly recognizes that disaster risk managementneeds to be about managing the risk inherent in social and economicactivity, rather than simply mainstreaming disaster risk managementto protect against external threats like natural hazards.
The Sendai Framework is a 15-year, voluntary, non-binding agreementwhich recognizes that the state has the primary role to reduce disasterrisk but that responsibility should be shared with other stakeholders,including local governments, the private sector, the scientificcommunity and NGOs. It aims for a substantial reduction in disasterlosses resulting from both man-made and natural hazards. It listspriority areas for action such as understanding disaster risk,strengthening disaster risk governance to manage disaster risk,investing in disaster risk reduction for resilience and enhancingdisaster preparedness for effective response, and to “Build BackBetter” in recovery, rehabilitation and reconstruction.
The Sendai Framework’s seven targets focus on substantial reductionsin (1) disaster mortality, (2) number of affected people, (3) directeconomic losses and (4) reducing damage to critical infrastructure anddisruption of basic services. The Sendai Framework also seeks asubstantial increase in (5) national and local disaster risk reductionstrategies by 2020, (6) enhanced cooperation to developing countries,and (7) a substantial increase in multi-hazard early warning systems,disaster risk information and assessments.
The Human Cost of Weather-Related Disasters 1995-2015 | 11
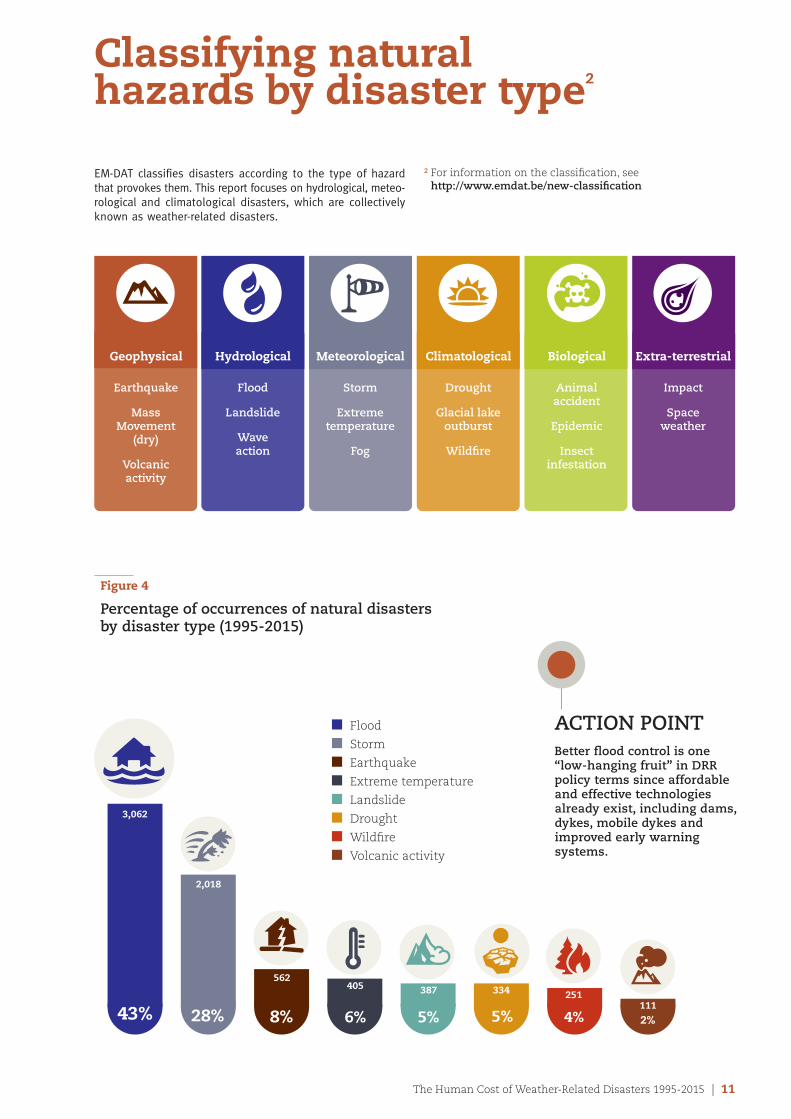
classifying natural hazards by disaster type2
EM-DAT classifies disasters according to the type of hazardthat provokes them. This report focuses on hydrological, meteo-rological and climatological disasters, which are collectivelyknown as weather-related disasters.
Geophysical
Earthquake
Mass Movement
(dry)
Volcanic activity
hydrological
Flood
Landslide
Wave action
meteorological
Storm
Extremetemperature
Fog
climatological
Drought
Glacial lakeoutburst
Wildfire
Biological
Animal accident
Epidemic
Insect infestation
extra-terrestrial
Impact
Space weather
2 For information on the classification, see http://www.emdat.be/new-classification
figure 4
Percentage of occurrences of natural disastersby disaster type (1995-2015)
43%
3,062
2,018
562405 387 334 251
11128% 8% 6% 5% 5% 4% 2%
n Flood
n Storm
n Earthquake
n Extreme temperature
n Landslide
n Drought
n Wildfire
n Volcanic activity
ACTION POINTBetter flood control is one “low-hanging fruit” in DRRpolicy terms since affordableand effective technologiesalready exist, including dams,dykes, mobile dykes andimproved early warningsystems.
12 | The Human Cost of Weather-Related Disasters 1995-2015
Chapter 2
human costs ofweather-relateddisasters
Introduction
The human cost of weather-related disasters depends onmultiple factors, including the type of hazard, its location,duration and the size and vulnerability of the population inharm’s way. EM-DAT also records basic economic impacts,including homes and infrastructure damaged and destroyed.Other costs, including repairs, rehabilitation and rebuildingexpenditure, plus lost productivity and increased poverty, areharder to quantify but nevertheless must be taken into accountwhen analyzing the overall economic burden of disasters.
The Human Cost of Weather-Related Disasters 1995-2015 | 13
figure 5
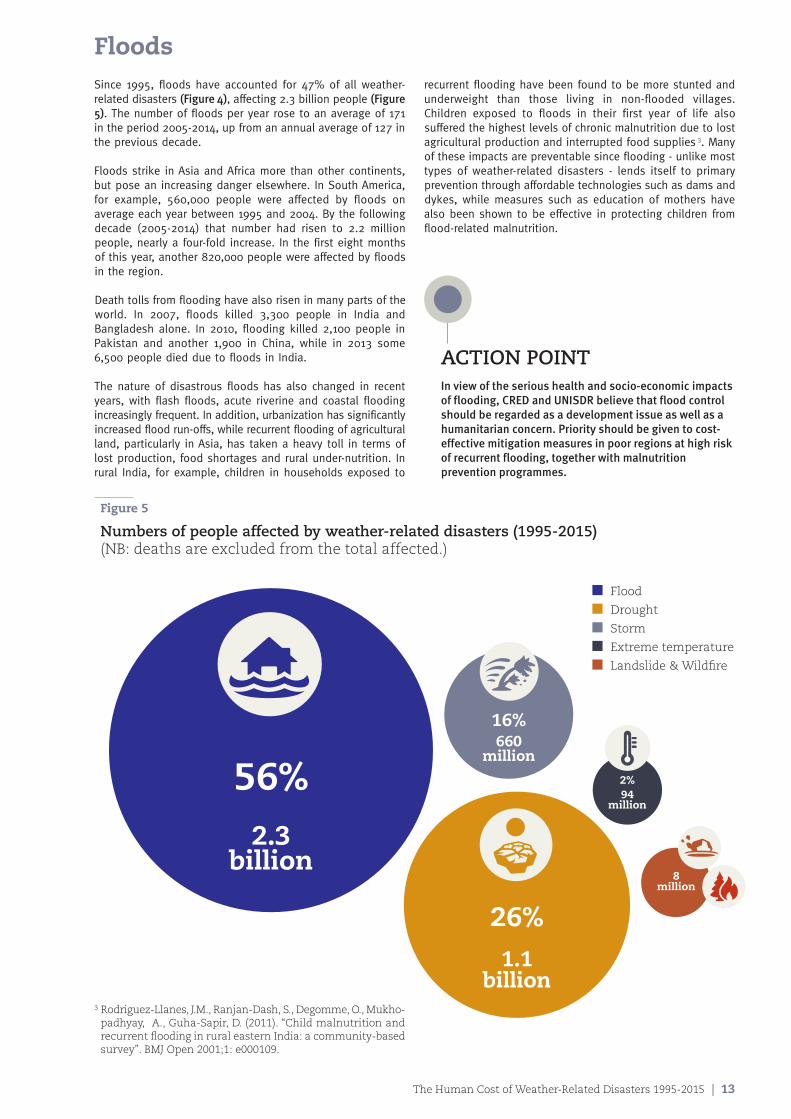
Numbers of people affected by weather-related disasters (1995-2015)(NB: deaths are excluded from the total affected.)
n Flood
n Drought
n Storm
n Extreme temperature
n Landslide & Wildfire
26%1.1
billion
56%2.3
billion
16%660
million
2%94
million
8million
floodsSince 1995, floods have accounted for 47% of all weather-related disasters (Figure 4), affecting 2.3 billion people (Figure5). The number of floods per year rose to an average of 171in the period 2005-2014, up from an annual average of 127 inthe previous decade.
Floods strike in Asia and Africa more than other continents,but pose an increasing danger elsewhere. In South America,for example, 560,000 people were affected by floods onaverage each year between 1995 and 2004. By the followingdecade (2005-2014) that number had risen to 2.2 millionpeople, nearly a four-fold increase. In the first eight monthsof this year, another 820,000 people were affected by floodsin the region.
Death tolls from flooding have also risen in many parts of theworld. In 2007, floods killed 3,300 people in India andBangladesh alone. In 2010, flooding killed 2,100 people inPakistan and another 1,900 in China, while in 2013 some6,500 people died due to floods in India.
The nature of disastrous floods has also changed in recentyears, with flash floods, acute riverine and coastal floodingincreasingly frequent. In addition, urbanization has significantlyincreased flood run-offs, while recurrent flooding of agriculturalland, particularly in Asia, has taken a heavy toll in terms oflost production, food shortages and rural under-nutrition. Inrural India, for example, children in households exposed to
recurrent flooding have been found to be more stunted andunderweight than those living in non-flooded villages.Children exposed to floods in their first year of life alsosuffered the highest levels of chronic malnutrition due to lostagricultural production and interrupted food supplies 3. Manyof these impacts are preventable since flooding - unlike mosttypes of weather-related disasters - lends itself to primaryprevention through affordable technologies such as dams anddykes, while measures such as education of mothers havealso been shown to be effective in protecting children fromflood-related malnutrition.
ACTION POINTIn view of the serious health and socio-economic impactsof flooding, CRED and UNISDR believe that flood controlshould be regarded as a development issue as well as ahumanitarian concern. Priority should be given to cost-effective mitigation measures in poor regions at high riskof recurrent flooding, together with malnutritionprevention programmes.
3 Rodriguez-Llanes, J.M., Ranjan-Dash, S., Degomme, O., Mukho-padhyay, A., Guha-Sapir, D. (2011). “Child malnutrition andrecurrent flooding in rural eastern India: a community-basedsurvey”. BMJ Open 2001;1: e000109.
14 | The Human Cost of Weather-Related Disasters 1995-2015
4%22,000
ACTION POINTMore effective deployment of storm early warningsystems could save many more lives in future, particularlyin poor rural communities at higher risk. Proven life-savingmeasures, such as cyclone shelters and wind-resistantbuildings, are also options which (according to resourcesavailable) could help protect vulnerable populations.
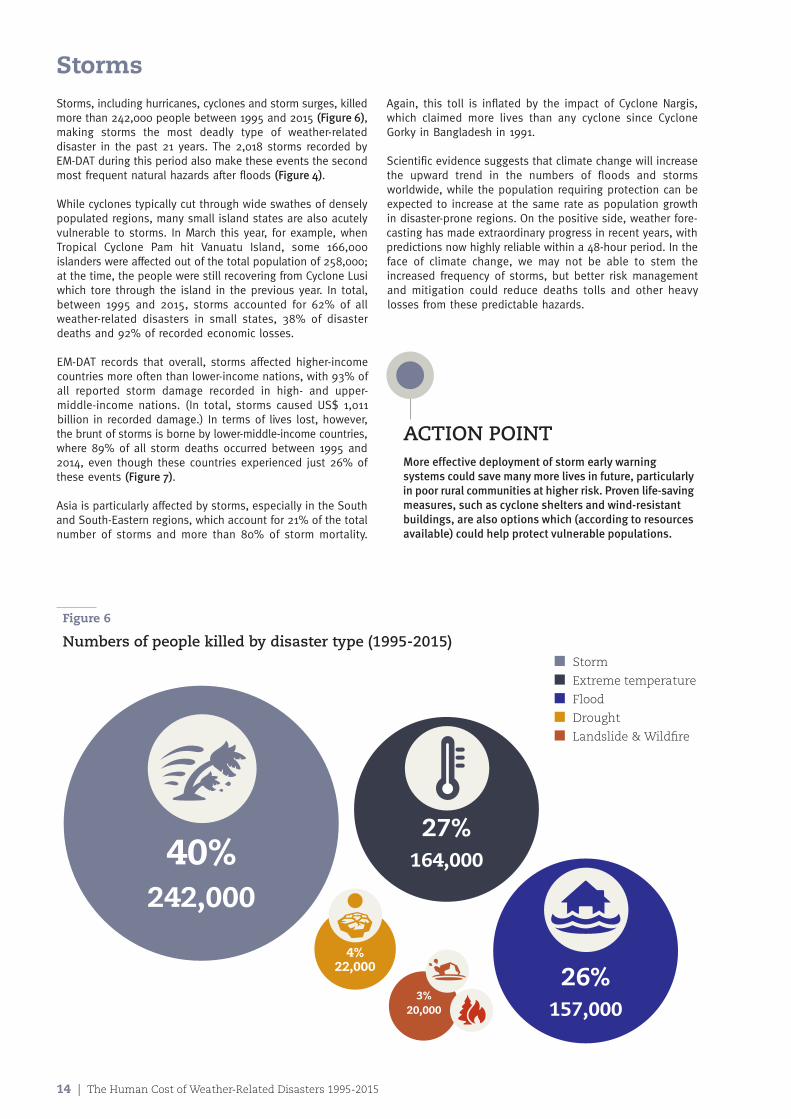
StormsStorms, including hurricanes, cyclones and storm surges, killedmore than 242,000 people between 1995 and 2015 (Figure 6),making storms the most deadly type of weather-relateddisaster in the past 21 years. The 2,018 storms recorded byEM-DAT during this period also make these events the secondmost frequent natural hazards after floods (Figure 4).
While cyclones typically cut through wide swathes of denselypopulated regions, many small island states are also acutelyvulnerable to storms. In March this year, for example, whenTropical Cyclone Pam hit Vanuatu Island, some 166,000islanders were affected out of the total population of 258,000;at the time, the people were still recovering from Cyclone Lusiwhich tore through the island in the previous year. In total,between 1995 and 2015, storms accounted for 62% of allweather-related disasters in small states, 38% of disasterdeaths and 92% of recorded economic losses.
EM-DAT records that overall, storms affected higher-incomecountries more often than lower-income nations, with 93% ofall reported storm damage recorded in high- and upper-middle-income nations. (In total, storms caused US$ 1,011billion in recorded damage.) In terms of lives lost, however,the brunt of storms is borne by lower-middle-income countries,where 89% of all storm deaths occurred between 1995 and2014, even though these countries experienced just 26% ofthese events (Figure 7).
Asia is particularly affected by storms, especially in the Southand South-Eastern regions, which account for 21% of the totalnumber of storms and more than 80% of storm mortality.
Again, this toll is inflated by the impact of Cyclone Nargis,which claimed more lives than any cyclone since CycloneGorky in Bangladesh in 1991.
Scientific evidence suggests that climate change will increasethe upward trend in the numbers of floods and stormsworldwide, while the population requiring protection can beexpected to increase at the same rate as population growthin disaster-prone regions. On the positive side, weather fore-casting has made extraordinary progress in recent years, withpredictions now highly reliable within a 48-hour period. In theface of climate change, we may not be able to stem theincreased frequency of storms, but better risk managementand mitigation could reduce deaths tolls and other heavylosses from these predictable hazards.
40%242,000
27%164,000
26%157,000
3%20,000
figure 6
Numbers of people killed by disaster type (1995-2015)n Storm
n Extreme temperature
n Flood
n Drought
n Landslide & Wildfire
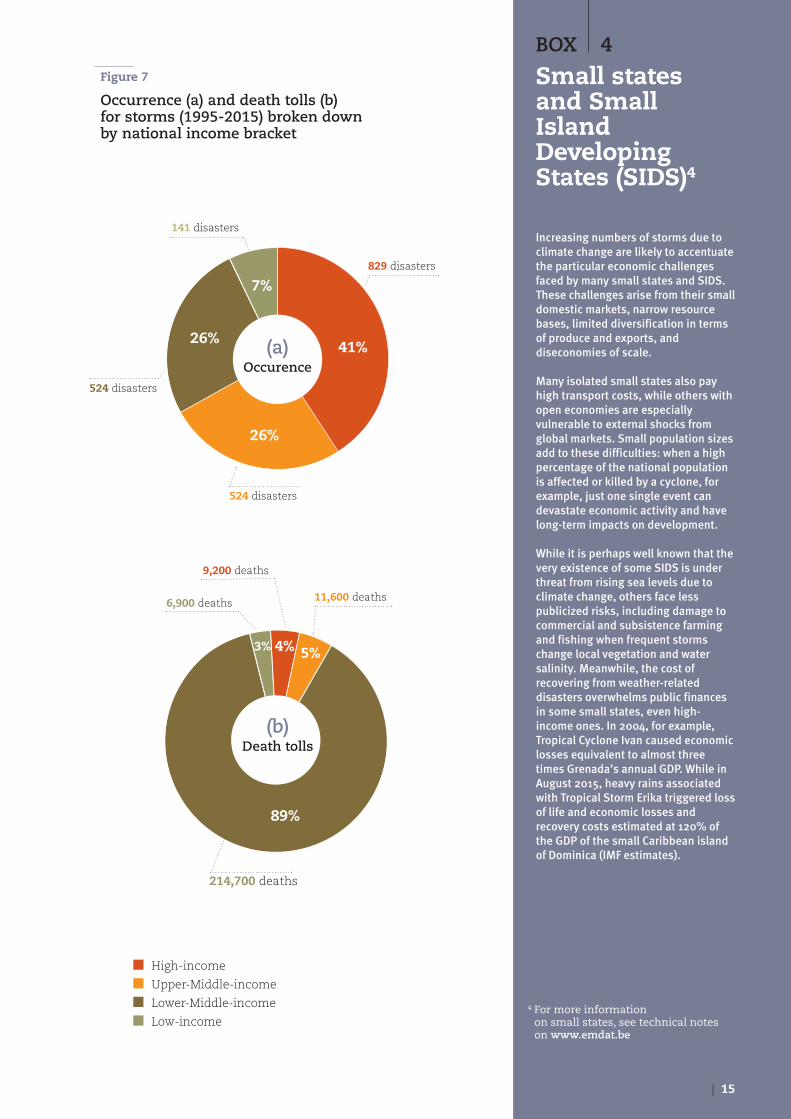
figure 7
Occurrence (a) and death tolls (b) for storms (1995-2015) broken down by national income bracket
n High-income
n Upper-Middle-income
n Lower-Middle-income
n Low-income
41%
26%
4%3% 5%
89%
26%
7%
214,700 deaths
6,900 deaths 11,600 deaths
9,200 deaths
524 disasters
141 disasters
524 disasters
829 disasters
(a)Occurence
(b)Death tolls
BOX 4
Small statesand Small Island DevelopingStates (SIDS)4
Increasing numbers of storms due toclimate change are likely to accentuatethe particular economic challengesfaced by many small states and SIDS.These challenges arise from their smalldomestic markets, narrow resourcebases, limited diversification in termsof produce and exports, anddiseconomies of scale.
Many isolated small states also payhigh transport costs, while others withopen economies are especiallyvulnerable to external shocks fromglobal markets. Small population sizesadd to these difficulties: when a highpercentage of the national populationis affected or killed by a cyclone, forexample, just one single event candevastate economic activity and havelong-term impacts on development.
While it is perhaps well known that thevery existence of some SIDS is underthreat from rising sea levels due toclimate change, others face lesspublicized risks, including damage tocommercial and subsistence farmingand fishing when frequent stormschange local vegetation and watersalinity. Meanwhile, the cost ofrecovering from weather-relateddisasters overwhelms public financesin some small states, even high-income ones. In 2004, for example,Tropical Cyclone Ivan caused economiclosses equivalent to almost threetimes Grenada’s annual GDP. While inAugust 2015, heavy rains associatedwith Tropical Storm Erika triggered lossof life and economic losses andrecovery costs estimated at 120% ofthe GDP of the small Caribbean islandof Dominica (IMF estimates).
| 15
4 For more information on small states, see technical notes on www.emdat.be
16 | The Human Cost of Weather-Related Disasters 1995-2015
DroughtDrought affects Africa more than any other continent, with EM-DAT recording 136 events there between 1995 and 2015 (some41% of the global total), including 77 droughts in East Africaalone. Droughts take a high human toll in terms of hunger,poverty and the perpetuation of under-development5. Theyare associated with widespread agricultural failures, loss oflivestock, water shortages and outbreaks of epidemic diseases.Some droughts last for years, causing extensive and long-term economic impacts, as well as displacing large sections ofthe population. Consecutive failures of seasonal rains in EastAfrica in 2005, for example, led to food insecurity for at least11 million people6.
In total, EM-DAT recorded more than one billion peopleaffected by droughts in the period 1995-2015; that is morethan a quarter of all people affected by all types of weather-related disasters worldwide (Figure 5) even though droughtaccounted for less than 5% of all natural hazards (Figure 4).
While EM-DAT data also show that just 4% of weather-relateddisaster deaths were due to drought (Figure 6), this figure israther misleading as it excludes indirect deaths from malnu-trition, disease and displacement. Such indirect deaths largely
occur after the emergency phase of a disaster is over and areoften poorly documented or not counted at all.
Both the disproportionate numbers of people affected bydrought and the scarcity of data about deaths are particularlydisturbing at a time when effective early warning systems fordrought have long been in place.
ACTION POINTReducing the size of drought-vulnerable populationsshould be a global priority over the next decade; betteraccounting systems for indirect deaths from drought arealso required; these should be linked to early warningsystems and response mechanisms in order to monitorthe impacts of drought more comprehensively.
Heatwaves, extreme cold& wildfires Between 1995 and 2015, extreme temperatures caused 27%of all deaths attributed to weather-related disasters, with theoverwhelming majority (148,000 out of 164,000 lives lost)being the result of heatwaves.
Overall, 92% of deaths from heatwaves were recorded in high-income countries, with Europe reporting the lion’s share at 90%.More than 55,000 people died during a heatwave in Russiaduring the summer of 2010, while Western and Southern Europeexperienced major heatwaves in 2003 and 2006 which killedmore than 72,000 and 3,400 people respectively. Europewitnessed a heatwave in summer 2015 as well but impacts stillneed to be evaluated. Elsewhere, India recorded 2,500 liveslost in just one month between May and June this year, andPakistan recorded 1,230 deaths from the same heatwave.
Extreme cold has taken a high toll in the Americas in recentyears, with cold waves increasingly frequent in Central andSouth America. Peru, for example, was hit by ten successivecold waves and severe winter conditions from 2003 to 2015,which cumulatively affected 5.4 million people. In the USA,21 people died in a cold wave in January 2014, which alsocaused property damage valued at US$ 2.5 billion.
While deaths from extreme heat and cold are under-reportedin some countries, EM-DAT data indicate that high-incomecountries rank second only to lower-middle-income countriesin terms of the average number of deaths per weather-relateddisaster (Figure 12 below). This is a very different pattern tothe numbers killed by earthquakes, including tsunamis, whichoverwhelmingly affect people in low-income countries7.
Wildfires are another major climatological threat in the USA,with 38 forest fires classified as disasters since 1995. Theseevents affected 108,000 Americans and cost almost US$ 11billion in recorded damage. These totals will almost certainlyrise when full figures for 2015 are available, given thatwildfires continued to rage in the USA after the August 2015cut-off point for data in this report.
It is likely that extreme wildfires will become more and morefrequent as a result of climate change as unusually hightemperatures and droughts contribute to the increasingnumbers of outbreaks8.
ACTION POINTStandardized methodologies are needed to collectcomprehensive national data on deaths from all naturalhazards. Following the adoption of the SendaiFramework, work is underway through the open-endedintergovernmental expert working group on indicatorsand terminology in relation to disaster risk reductionwhich should support making this action point a reality.
5 Below, R., Grover-kopec, E. & Dilley, M. (2007). Documenting Drought-Related Disasters: A Global Reassessment. The Journal ofEnvironment Development, 16 (3): 328-344.doi: 10.1177/1070496507306222
6 Dilley, M., Chen, R.S., Deichmann, U., Lerner-Lam, A.L., Arthur, L., Arnold, M., Agwe, J., Buys, P., Kjevstad, O., Lyon, B. & Yetman, G.(2005). “Natural Disaster Hotspots: a global risk analysis”. The World Bank, Disaster risk management series, 5.
7 Centre For Research On The Epidemiology Of Disasters – CRED (2015) “The human cost of natural disasters” – 2015: A globalperspective. CRED: Brussels.
8 W. John Calder, Dusty Parker, Cody J. Stopka, Gonzalo Jiménez-Moreno, and Bryan N. Shuman. “Medieval warming initiatedexceptionally large wildfire outbreaks in the Rocky Mountains” www.pnas.org/cgi/doi/10.1073/pnas.1500796112
The Human Cost of Weather-Related Disasters 1995-2015 | 17
Chapter 3
Impacts ofweather-related disastersby country9
Introduction
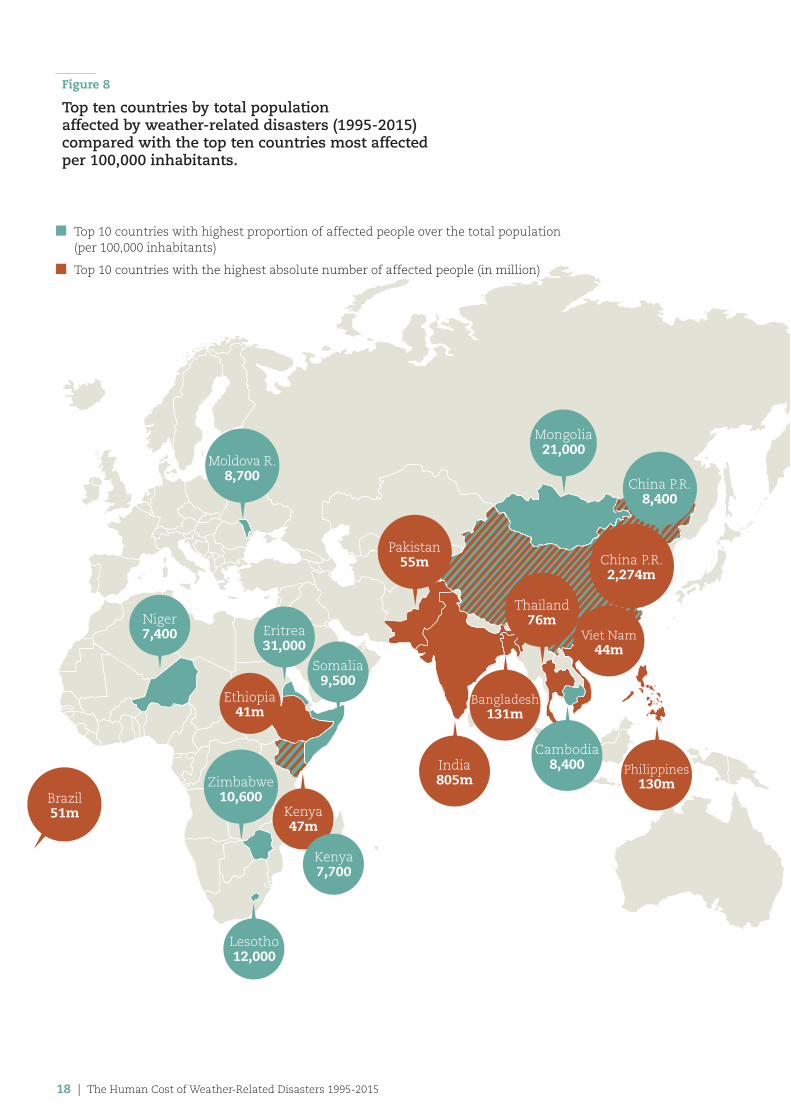
Asian population giants, China and India, dominate the league tableof countries most affected by weather-related disasters. Togetherthese two nations account for more than 3 billion disaster-affectedpeople between 1995 and 2015. That is 75% of the global total of 4.1billion people. Brazil is the only country from the Americasappearing in the top 10 list, and Kenya and Ethiopia are the onlyAfrican nations.
When the data is standardized to reflect the numbers of peopleaffected per 100,000 head of population (or the percentage of theaffected population), the global picture looks very different, however,with six of the most-affected countries now in Africa, and just threein Asia. Moldova is the only European country appearing on eitherlist, ranking sixth in the standardized league table due mainly toa storm in 2000 that affected 2.6 million people out of a totalpopulation of 3.6 million (Figure 8).
9 Small states excluded from this chapter
18 | The Human Cost of Weather-Related Disasters 1995-2015
figure 8
Top ten countries by total population affected by weather-related disasters (1995-2015) compared with the top ten countries most affected per 100,000 inhabitants.
n Top 10 countries with highest proportion of affected people over the total population (per 100,000 inhabitants)
n Top 10 countries with the highest absolute number of affected people (in million)
Eritrea31,000
Ethiopia41m
Niger7,400
Somalia9,500
Lesotho12,000
Kenya47m
Kenya7,700
Cambodia8,400India
805m
Bangladesh131m
Philippines130m
Viet Nam44m
Mongolia21,000
Zimbabwe10,600
Moldova R.8,700
Thailand76m
Pakistan55m
China P.R.8,400
China P.R.2,274m
Brazil51m
The Human Cost of Weather-Related Disasters 1995-2015 | 19
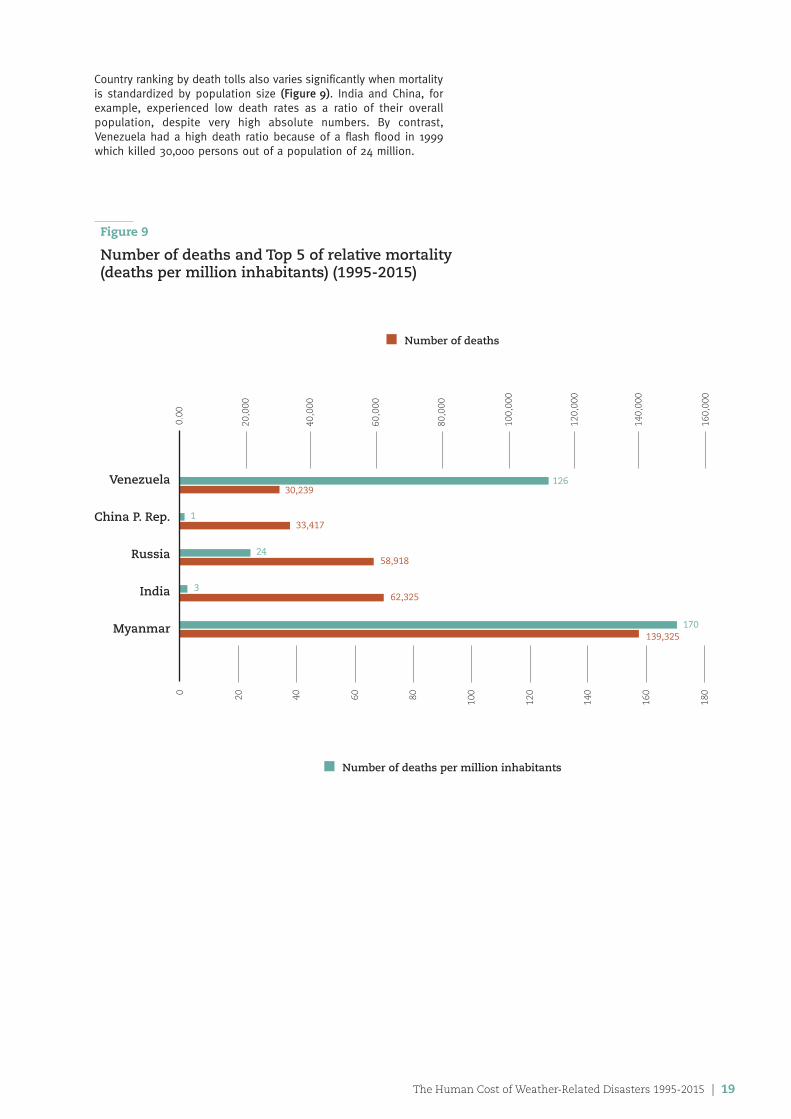
Country ranking by death tolls also varies significantly when mortalityis standardized by population size (Figure 9). India and China, forexample, experienced low death rates as a ratio of their overallpopulation, despite very high absolute numbers. By contrast,Venezuela had a high death ratio because of a flash flood in 1999which killed 30,000 persons out of a population of 24 million.
figure 9
Number of deaths and Top 5 of relative mortality (deaths per million inhabitants) (1995-2015)
n Number of deaths
n Number of deaths per million inhabitants
0.00
0 20 40 60 80 100
120
140
160
180
20,0
00
40,0
00
60,0
00
80,0
00
100,
000
120,
000
140,
000
160,
000
126
170
1
24
3
30,239
33,417
58,918
62,325
139,325
Venezuela
China P. Rep.
Russia
India
Myanmar
20 | The Human Cost of Weather-Related Disasters 1995-2015
Chapter 4
Weather-relateddisasters & national income10
Introduction
In recent years, national preparedness and more efficientresponses to disasters have significantly reduced the numbersof people dying from weather-related hazards in some countries.India, China, Indonesia, Bangladesh, Thailand and Myanmar,for example, have each made major commitments to reducedisaster losses by acting on the priorities of the HyogoFramework for Action (HFA). In Indonesia, DRR became a pillarof national development immediately after the catastrophe ofthe Indian Ocean tsunami of 2004. For India, a key trigger wasthe 1999 cyclone which claimed around 10,000 lives in OdishaState; casualties in two recent major cyclones were minimal.China has meanwhile reported that it has succeeded in keepingeconomic losses within a target of 1.5% of GDP11.
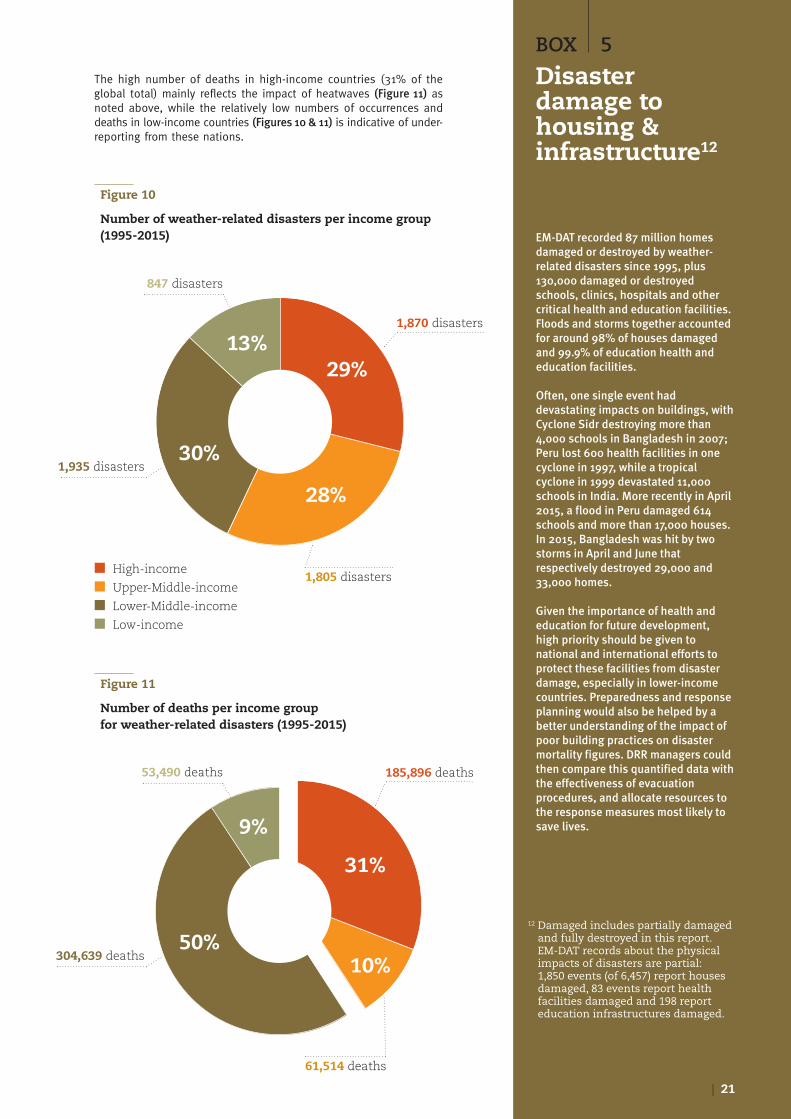
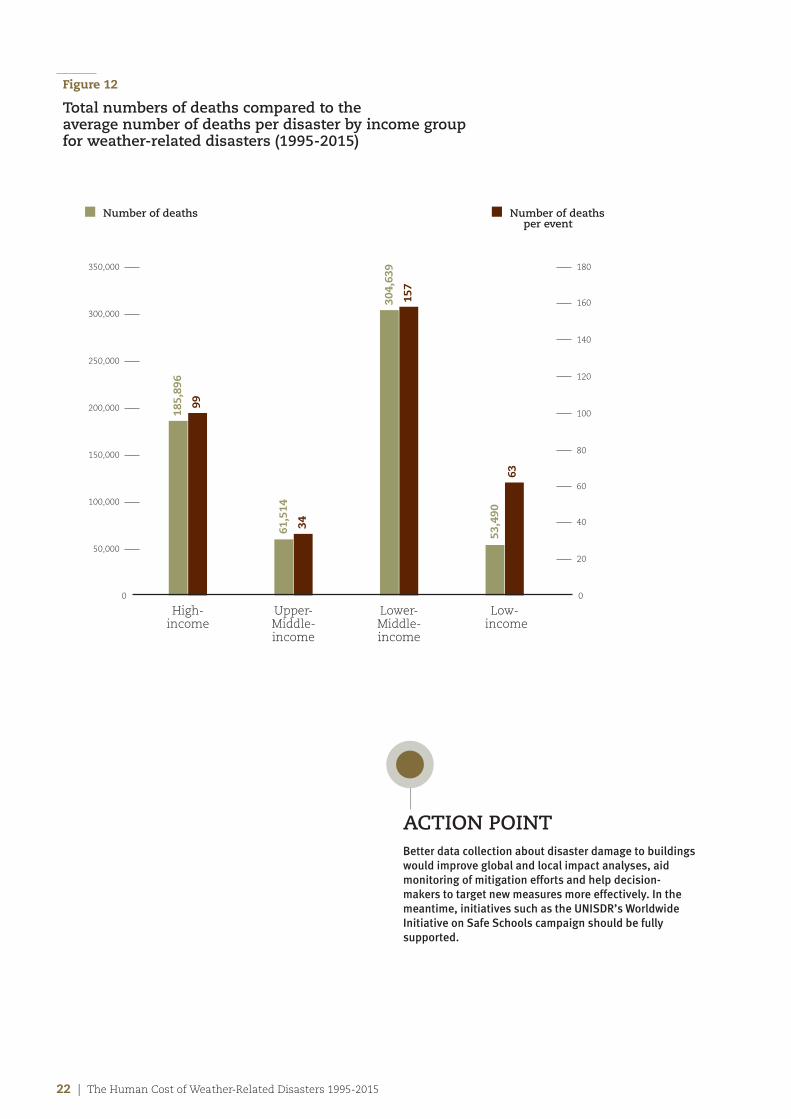
EM-DAT data show that when countries are grouped together byincome, the highest numbers of weather-related disastersoccurred in lower-middle-income countries. These nationssuffered 1,935 of all recorded events or 30% of the global total(Figure 10) at a cost of 305,000 lives lost, i.e. half of all deathsreported between 1995 and 2015 (Figure 11). The heavy loss oflife in lower-middle-income countries is also reflected in thehigh average number of deaths per disaster (157) (Figure 12).Once again, the heavy toll of Cyclone Nargis on Myanmar (alower-middle-income nation) had a major impact on thesemortality statistics.
10 Small states excluded from this chapter11 McClean D. (2014). “China celebrates the Hyogo Framework for Action”.
United Nations Office for Disaster Risk Reduction - Regional Office forAsia and Pacific (UNISDR AP). http://www.unisdr.org/archive/38302
| 21
BOX 5
Disaster damage to housing & infrastructure12
EM-DAT recorded 87 million homesdamaged or destroyed by weather-related disasters since 1995, plus130,000 damaged or destroyedschools, clinics, hospitals and othercritical health and education facilities.Floods and storms together accountedfor around 98% of houses damagedand 99.9% of education health andeducation facilities.
Often, one single event haddevastating impacts on buildings, withCyclone Sidr destroying more than4,000 schools in Bangladesh in 2007;Peru lost 600 health facilities in onecyclone in 1997, while a tropicalcyclone in 1999 devastated 11,000schools in India. More recently in April2015, a flood in Peru damaged 614schools and more than 17,000 houses.In 2015, Bangladesh was hit by twostorms in April and June thatrespectively destroyed 29,000 and33,000 homes.
Given the importance of health andeducation for future development,high priority should be given tonational and international efforts toprotect these facilities from disasterdamage, especially in lower-incomecountries. Preparedness and responseplanning would also be helped by abetter understanding of the impact ofpoor building practices on disastermortality figures. DRR managers couldthen compare this quantified data withthe effectiveness of evacuationprocedures, and allocate resources tothe response measures most likely tosave lives.
12 Damaged includes partially damagedand fully destroyed in this report. EM-DAT records about the physicalimpacts of disasters are partial: 1,850 events (of 6,457) report housesdamaged, 83 events report healthfacilities damaged and 198 reporteducation infrastructures damaged.
The high number of deaths in high-income countries (31% of theglobal total) mainly reflects the impact of heatwaves (Figure 11) asnoted above, while the relatively low numbers of occurrences anddeaths in low-income countries (Figures 10 & 11) is indicative of under-reporting from these nations.
figure 10
number of weather-related disasters per income group (1995-2015)
28%
30%
29%13%
1,935 disasters
847 disasters
1,870 disasters
1,805 disasters
figure 11
number of deaths per income group for weather-related disasters (1995-2015)
10%50%
31%
9%
304,639 deaths
53,490 deaths 185,896 deaths
61,514 deaths
n High-income
n Upper-Middle-income
n Lower-Middle-income
n Low-income
22 | The Human Cost of Weather-Related Disasters 1995-2015
figure 12
Total numbers of deaths compared to the average number of deaths per disaster by income group for weather-related disasters (1995-2015)
185,
896
99
61,5
14
34
304,
639
157
53,4
90
63
n Number of deaths n Number of deathsper event
ACTION POINTBetter data collection about disaster damage to buildingswould improve global and local impact analyses, aidmonitoring of mitigation efforts and help decision-makers to target new measures more effectively. In themeantime, initiatives such as the UNISDR’s WorldwideInitiative on Safe Schools campaign should be fullysupported.
Upper- Middle- income
Lower- Middle- income
Low- income
High- income
0
50,000
100,000
150,000
200,000
250,000
300,000
350,000
0
20
40
60
80
100
120
140
160
180
The Human Cost of Weather-Related Disasters 1995-2015 | 23
Chapter 5
counting the economic costs of disasters
Introduction
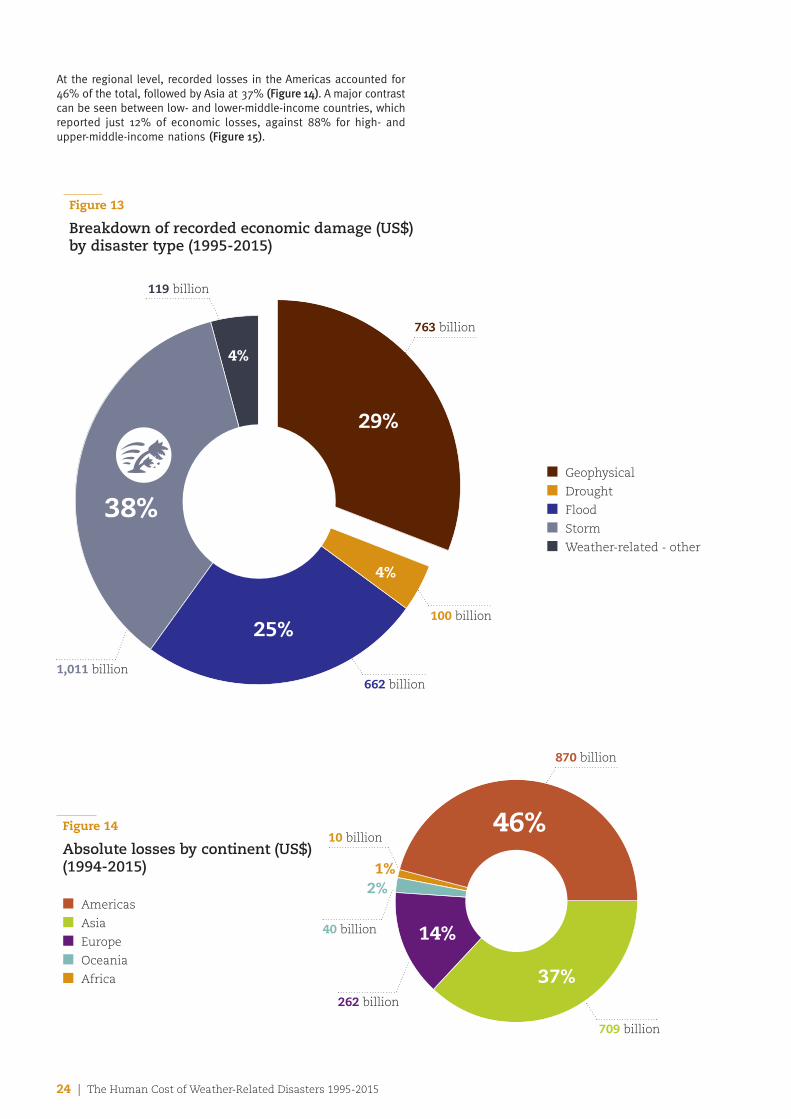
EM-DAT recorded losses totaling US$ 1,891 billion13 from weather-related disasters between 1995 and 2015, equivalent to 71% of alllosses attributed to natural hazards (figure 13). This figure is aminimum given widespread under-reporting of losses around theglobe. With this caveat, EM-DAT data show that storms cost morethan any other type of weather-related disaster in terms ofrecorded lost assets (US$ 1,011 billion), followed by floods (US$662 billion).
According to UNISDR’s 2015 Global Assessment Report on DisasterRisk Reduction14, expected annual average losses (AAL) fromearthquakes, tsunamis, tropical cyclones and river flooding arenow estimated at US$ 314 billion in the built environment alone.AAL is the amount that countries should be setting aside eachyear to cover future disaster losses; it represents an accumulatingcontingent liability. The report, based on a review of nationaldisaster loss databases, estimates that economic losses fromdisasters are now reaching an average of US$ 250 billion to US$300 billion each year.
13 All economic losses and GDP in this report are adjusted at 2014US$ value
14 UNISDR (2015). Making Development Sustainable: The Future of Disaster RiskManagement. Global Assessment Report on Disaster Risk Reduction. Geneva,Switzerland: United Nations Office for Disaster Risk Reduction (UNISDR).
24 | The Human Cost of Weather-Related Disasters 1995-2015
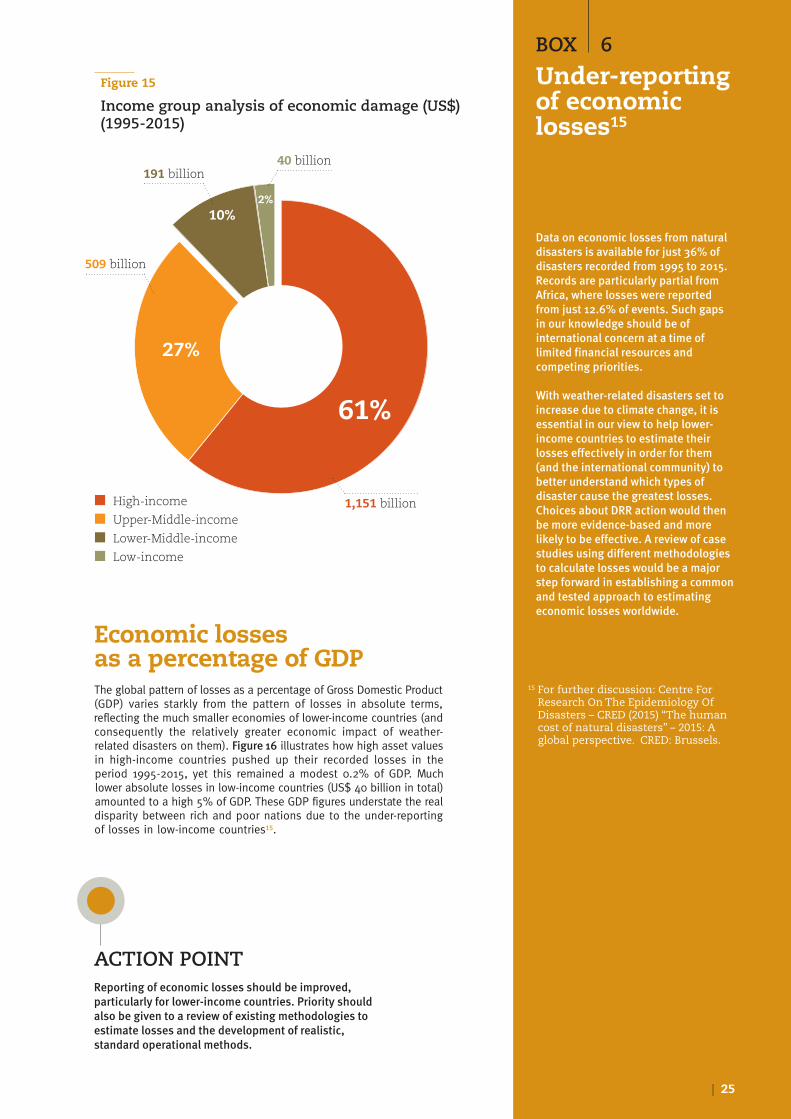
At the regional level, recorded losses in the Americas accounted for46% of the total, followed by Asia at 37% (Figure 14). A major contrastcan be seen between low- and lower-middle-income countries, whichreported just 12% of economic losses, against 88% for high- andupper-middle-income nations (Figure 15).
figure 13
Breakdown of recorded economic damage (US$)by disaster type (1995-2015)
38%
25%
29%
4%
4%
n Geophysical
n Drought
n Flood
n Storm
n Weather-related - other
763 billion
100 billion
662 billion1,011 billion
119 billion
figure 14
Absolute losses by continent (US$) (1994-2015)
46%
14%
37%
2%1%
n Americas
n Asia
n Europe
n Oceania
n Africa
870 billion
709 billion
262 billion
40 billion
10 billion
| 25
61%
10%
27%
2%
n High-income
n Upper-Middle-income
n Lower-Middle-income
n Low-income
figure 15
Income group analysis of economic damage (US$)(1995-2015)
509 billion
191 billion40 billion
1,151 billion
BOX 6
under-reportingof economiclosses15
Data on economic losses from naturaldisasters is available for just 36% ofdisasters recorded from 1995 to 2015.Records are particularly partial fromAfrica, where losses were reportedfrom just 12.6% of events. Such gapsin our knowledge should be ofinternational concern at a time oflimited financial resources andcompeting priorities.
With weather-related disasters set toincrease due to climate change, it isessential in our view to help lower-income countries to estimate theirlosses effectively in order for them(and the international community) tobetter understand which types ofdisaster cause the greatest losses.Choices about DRR action would thenbe more evidence-based and morelikely to be effective. A review of casestudies using different methodologiesto calculate losses would be a majorstep forward in establishing a commonand tested approach to estimatingeconomic losses worldwide.
15 For further discussion: Centre ForResearch On The Epidemiology OfDisasters – CRED (2015) “The humancost of natural disasters” – 2015: Aglobal perspective. CRED: Brussels.
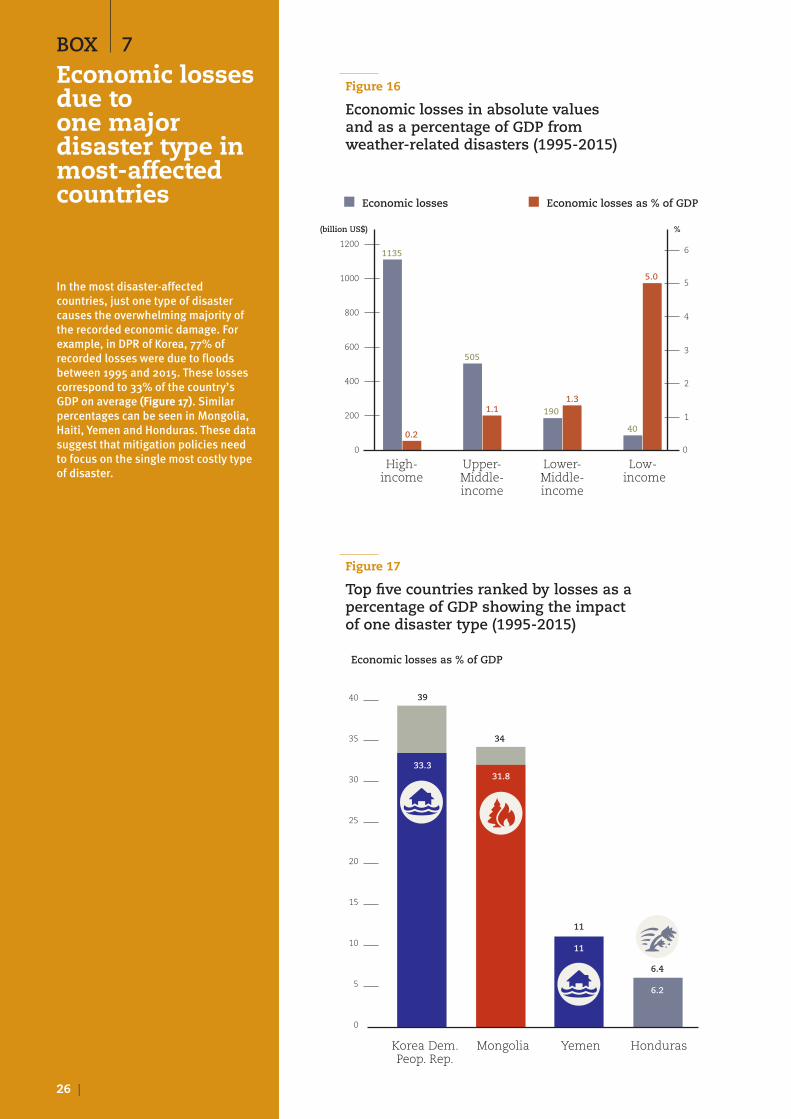
economic losses as a percentage of GDPThe global pattern of losses as a percentage of Gross Domestic Product(GDP) varies starkly from the pattern of losses in absolute terms,reflecting the much smaller economies of lower-income countries (andconsequently the relatively greater economic impact of weather-related disasters on them). Figure 16 illustrates how high asset valuesin high-income countries pushed up their recorded losses in theperiod 1995-2015, yet this remained a modest 0.2% of GDP. Muchlower absolute losses in low-income countries (US$ 40 billion in total)amounted to a high 5% of GDP. These GDP figures understate the realdisparity between rich and poor nations due to the under-reportingof losses in low-income countries15.
ACTION POINTReporting of economic losses should be improved,particularly for lower-income countries. Priority shouldalso be given to a review of existing methodologies toestimate losses and the development of realistic,standard operational methods.
BOX 7
economic lossesdue to one major disaster type inmost-affectedcountries
In the most disaster-affectedcountries, just one type of disastercauses the overwhelming majority ofthe recorded economic damage. Forexample, in DPR of Korea, 77% ofrecorded losses were due to floodsbetween 1995 and 2015. These lossescorrespond to 33% of the country’sGDP on average (Figure 17). Similarpercentages can be seen in Mongolia,Haiti, Yemen and Honduras. These datasuggest that mitigation policies needto focus on the single most costly typeof disaster.
Upper- Middle-income
Lower- Middle-income
Low- income
High- income
6
5
4
3
2
1
0
1200
1000
800
600
400
200
0
n Economic losses n Economic losses as % of GDP
figure 16
Economic losses in absolute values and as a percentage of GDP from weather-related disasters (1995-2015)
1135
0.2
1.11.3
5.0
505
190
40
(billion US$) %
Mongolia Yemen HondurasKorea Dem.Peop. Rep.
40
35
30
25
20
15
10
5
0
Economic losses as % of GDP
figure 17
Top five countries ranked by losses as apercentage of GDP showing the impact of one disaster type (1995-2015)
39
33.331.8
34
11
11
6.4
6.2
26 |
The Human Cost of Weather-Related Disasters 1995-2015 | 27
Acknowledgements
This report was made possible by the collaborative effort of many membersof the CRED team. Pascaline Wallemacq managed the production with anunfailing sense of timing, discreet pushiness and understanding of the issues.Tefera Delbiso and Regina Below contributed material from their past work andideas.
Margareta Wahlström, Denis McClean, Sarah Landelle and Brigitte Leoni helpedrefine the text and push the process through between their many pressing tasks.
The text was rewritten and edited by Rowena House in record time for which weare grateful.
Mardi did the layout and infographics with their usual flair.
None of this could be possible without the support of Université Catholiquede Louvain and the Institute of Health and Society (IRSS) which have supportedthe natural disaster research programme for over 35 years.

Contact
CRED
• Mail:Pascaline Wallemacq: [email protected] Below: [email protected]
• Phone:+32 2 764 3327
• Postal Address:School of Public HealthInstitute of Health and Society (IRSS)Université catholique de LouvainClos Chapelle-aux-Champs, Bte B1.30.151200 Brussels, BELGIUM
UNISDR
• Mail:Denis McClean: [email protected]
• Phone:+41 22 917 8897
• Postal Address:9-11 Rue de Varembé CH 1202, Geneva SWITZERLAND
design : www.m
ardi.be
We gratefully acknowledge partial support for this analysis from USAID as well as Université Catholique de Louvain (UCL).
The contents of this report remain the responsibility of the authors alone.