ultrafine and nanoparticle emissions of different biomass ... · ultrafine and nanoparticle...
TRANSCRIPT

POLITECNICO DI MILANO
Department of Civil and Environmental Engineering
Thesis of M.S degree
Ultrafine and nanoparticle emissions of different biomass
combustion appliances
Supervisor : Prof. Stefano Cernuschi
Assitant supervisor : Senem Ozgen
Peng Yu
Academic year: 2012 - 2013

2
Abstract
Biomass combustion generates large amount of fine particles, especially
nanoparticles (NP) and ultrafine particles (UFP), may influence the
environment and cause consequent adverse human health problems. The
objectives of this work were to characterize NP and UFP emitted from
different scale biomass combustion units and to assess the roles of
dilution conditions and combustion conditions in NP and UFP formation.
In this study, a vibration grate bed biomass power plant (nominal
thermal output: 15MW), a pellet boiler (nominal thermal output: 100kW)
and a closed modern fireplace (nominal thermal output: 11 kW) were
studied. The influence of dilution condition, the operation parameters such
as load of the boiler and combustion conditions were investigated. The
special designed sampling systems were used to measure the
nanoparticles and ultrafine particles. Electrical low-pressure impactor was
applied to record the real-time number concentrations and number size
distributions for all the cases. The regulated gaseous pollutants (CO, CO2,
SO2, NOx, CH4, NMHC) and relevant operation parameters such as flue
gas temperature, and oxygen content of flue gas were continuously
measured in all cases.
The results suggested that different combustion technologies lead to
very different particle emission characteristics. The total particle number
concentration of the continuous operation power plant was in the order of
106, with NP and UFP fractions accounted more than 90% and 99%,
respectively. The GMD was around 27 nm.
The pellet boiler was operated under nominal and non nominal
(reduced load) conditions. The average particle total number
concentration of this pellet boiler was around 107. There was a tendency
that the peak number concentration of particle shifted to coarser particles
when loads reduced due to worse combustion. The NP and UFP fractions
also decreased obviously with the decreasing load. The condensation of
semi volatile flue gas pollutants was associated with the NP fractions
emitted in both the boiler and the power plant.
The fireplace emitted significant amount of particles since the total
particle number concentration was in the order around 108. The emissions

3
changed phase by phase and cycle by cycle. The average fraction of NP
and UFP were respectively 59% and 75%. Correlation analysis indicated
that there was a strong statistic correlation between NP emission and
NMHC mass concentration.
Proper primary and secondary measures should be adopted to reduce
the PM emissions from biomass combustion units. The comparison
between different combustion systems suggested emissions from small
scale appliances like fireplace are significant than larger units. The
regulations of PM should also be considered not only based on mass but
also on other properties like number concentrations since the huge
adverse effects of very fine particles.
Key words: biomass combustion, nanoparticle, ultrafine particle, PM
emissions, power plant, pellet boiler, fireplace, semi volatile species,
NMHC, primary measures, secondary measures

4
Acknowledgement
This work would not been carried out without the people who helped me
and supported me all the time.
First, I would like to thank my supervisor Professor Stefano
Cernuschi, for his invaluable guidance, suggestions and support from the
beginning to the end. And I also appreciate the help from my assistant
supervisor Senem Ozgen. Her patience, kindness and constructive advice
impressed me a lot. Thank my supervisors for the time spent on my thesis,
also for answering all my questions and explaining me so patiently.
Thanks for all the data provided from the plant and laboratory.
In past two years, I had studied energy engineering in Politecnico di
Milano, I had my most meaningful two years because of all my
professors, teachers and my classmates. I learned a lot from them not only
from class but also from daily life.
My dear friends I met here, whom I spent a lot of happy time with,
especially my roommates, are those people I would like to thank for.
Without your help and support I can’t imagine how my life would be.
They make me feel so lucky.
Finally, I would like to thank my mother and father for their love,
support and understanding for all these years. No matter when and where,
I always get their encouragement and love, thanks a lot for being here
with me.
5
List of acronyms and definitions
Aerodynamic diameter (da) Diameter of a standard-density (100 kg/m3)
spherical particle having the same
gravitational settling velocity as the
observed particle
CEMS Continuous emission monitoring system
Coarse particles Particles larger than 1 micron in diameter
dp Particle diameter
DR Dilution ratio
EC Elemental carbon
ELPI Electrical low pressure impactor
ESP Electrostatic precipitator
FF Fabric filter
Fine particles Particles smaller than 1 micron in diameter
FGCS Flue gas cleaning system
FID Flame ionization detector
GMD Geometric mean diameter
GSD Geometric standard deviation
HEPA High efficiency particulate air (filter)
IPCC Intergovernmental Panel on Climate
Change
NMHC Non methane hydrocarbon
NP Nanoparticle with aerodynamic diameter
smaller than 50 nanometers
NTP Normal temperature and pressure (in this
work 273 K and 101325 Pa)
OC Organic carbon
OXYCAT catalytic oxidizer
PAH Polycyclic aromatic hydrocarbons
PM Particulate matter
PM1 aerodynamic diameter of particles smaller
than1 micron
PM2.5 aerodynamic diameter of particles smaller
than 2.5 microns
6
PM10 aerodynamic diameter of particles smaller
than 10 microns
SNCR Selective non catalytic reduction
Soot Fine particles composed of elemental
carbon
TN Total number concentration of particles
THC Total hydrocarbon
TOC Total organic carbon
TSP Total suspended particles
UFP Ultrafine particle with aerodynamic
diameter smaller than 100 nanometers
VOC Volatile organic compounds
7
Contents
1. Introduction ........................................................................................ 8
1.1 Environmental effect of particle matter ...................................... 9
1.2 Epidemiological studies of PM ................................................ 10
1.3 Regulation of PM .................................................................... 11
2. Scientific background ....................................................................... 11
2.1 Combustion technologies ......................................................... 11
2.2 PM and other gaseous emission issues .................................... 12
2.3 Control technology of PM ....................................................... 15
3. Material and methods ........................................................................ 19
3.1 Investigated combustion systems.............................................. 19
3.1.1 Woody biomass power plant .......................................... 19
3.1.2 Advanced wood pellet boiler ......................................... 20
3.1.3 Modern closed fireplace ................................................ 21
3.2 Measurement systems ............................................................. 22
3.3 Sampling ................................................................................. 26
3.3.1 . Hot sampling……………………………………………26
3.3.2 . Diluted sampling………………………………………..27
4. Results .............................................................................................. 27
4.1 Woody biomass power plant ..................................................... 28
4.1.1 Particle number concentration and size distribution ....... 29
4.1.2 Gaseous emissions and correlation with NP .................. 33
4.2 Advanced wood pellet boiler ................................................... 34
4.2.1 . Particle number concentration and size distribution……35
4.2.2 Gaseous emissions and correlation with NP .................. 40
4.3 Modern closed fireplace ........................................................... 41
4.3.1 Particle number concentration and size distribution ....... 42
4.3.2 Gaseous emissions and correlation with NP .................. 46
4.4 Comparison of different appliances .......................................... 50
5. Conclusions ...................................................................................... 51
References ............................................................................................. 55

8
1. Introduction
Biomass is one of the most important renewable energy sources widely
used around the world nowadays. Not only due to the limitation of the
availability of fossil fuels but also because it is considered as a CO2
neutral energy source. Biomass provides 14% of the global primary
energy and it ranks the fourth energy source except coal, oil and natural
gas (Demirbas, 2004).
Biomass includes any biological materials from living or recently
living organisms, such as forest by-products (wood residues), agricultural
waste (sugar cane residue) and animal husbandry residues (poultry litter).
Generally, biomass can be directly or indirectly used by thermal
conversion, chemical conversion or biochemical conversion. The
characteristics and quality of biomass fuels mainly depends on the kind of
biomass and the pretreatment technologies applied, and they vary wildly.
Compared with coal, biomass generally contains a higher volatile content
and a lower char content, which make biomass a highly reactive fuel (Van
Loo et al., 2008).
Biomass contains five main fuel elements: C, H, S, N and O. Various
trace elements such as Zn, Cd, Cu, Pb, Cr and Hg can be found in
biomass (Demibras, A., 2005), and the major ash-forming elements such
as Si, Ca, Mg, K, Na, Cl and P occur in biomass fuels (Werkelin et al.,
2005).
Combustion technology of biomass accounts for more than 90% of
the global contribution of bioenergy. With the proper design and
operation, biomass energy can be a technically efficient, economically
viable, and environmentally sustainable fuel option (Van Loo et al., 2008).
However, there are still some problems caused by burning of biomass
because it is a significant source of gaseous and particulate matter (PM)
emissions to the troposphere on a local, regional and even global scale.
First of all, the emission of CO, CH4 and Volatile organic carbon (VOC)
affect the oxidation capacity of the troposphere by reacting with OH
radicals, and emissions of nitric oxides (NOX) and VOC may alter the
photo-stationary equilibrium, then lead to the formation of ozone and
other photo oxidants in atmosphere (Koppmann et al., 2005).

9
Moreover, biomass furnaces emit relatively high quantities of
particles when compared with natural gas and light fuel oil furnaces
(Nussbaumer, T., 2001), due to the higher ash content of biomass. The
particle size distribution and number concentration of particulate matters
emitted from biomass combustion units vary from different fuels and
combustion systems (Nussbaumer, 2003). The particles which generated
during combustion process may deposit on the surfaces of boiler and
other heat exchangers, and will lead to some operational problems such as
corrosion and lower efficiency. What’s more, if there is no effective flue
gas cleaning system (FGCS) applied for biomass combustion appliances,
the significant amount of particles will be directly emitted to the ambient
air. The emission of particles would certainly change the air quality
locally even regionally. And recent studies show that there is a strong
correlation between particle concentration and human health (Peters et al.,
1997; Dockery et al., 1993; Schwartz, J., 1994).
1.1 Environmental effect of particle matter
The sources of particulate matter are both anthropogenic and natural.
Besides the significant amount of fine and ultrafine particles deriving
from natural processes, the PM emitted directly from industrial activities,
transportation, power plants, or indirectly through conversion of gaseous
precursors such as ammonia and sulfur oxides (Yinon et al., 2010 ).
Nowadays particulate matter emission becomes an important issue of
air pollution worldwide. Like most of the environmental pollutants, the
effects of PM are complex, and the characteristics of the particles
(particle size, chemical composition and structure) determine the effects.
The majority of the big amount of particles emitted due to biomass
combustion have an aerodynamic diameter smaller than 10 microns
(PM10), besides, a high percentage of fine particles which have an
aerodynamic diameter smaller than 2.5 microns (PM2.5) can be found
(Nussbaumer et al., 2002).
In addition, fine particle emissions from combustion sources have
direct effects on the climate by absorbing and scattering sunlight and their
chemical properties have a strong influence on the effects. Particles
contain elemental carbons which tend to absorb sunlight and contribute to

10
global warming. While Sulphate particles will scatter sunlight and have a
cooling effect (Shindel et al., 2009; IPCC, 2007). The complicated
chemical properties of the particles will cause numerous effects on the
climate.
1.2 Epidemiological studies of PM
The PM not only effects on the environment but also effects on human
health, and the effects were determined by the characteristics of the
particles such as particle size, chemical composition and structure as well
(Nussbaumer, 2002). The fine particles and ultrafine particles
(aerodynamic diameter da<0.1 microns) are specially concerned with
respect to human health effects (Dockery et al., 1993) because of their
ability to penetrate lungs as far as the alveolar region upon inhalation, and
this may cause cellular damage (Peters et al., 1997). The chemical
properties such as the contents of transition metals, polycyclic aromatic
hydrocarbons (PAH), organic material, elemental carbon (EC) and acidity
of the fine particles have been suggested to be the key properties related
to adverse health effects (Lighty et al, 2000; Kennedy, 2007). Moreover,
the high specific surface area of fine particles may increase the transport
of surface enriched toxic trace metals with respect to larger particles
(Wichmann et al., 2003).
Short-term and long-term exposure studies are the typical available
epidemiology studies of particulate air pollution (Braun-Fahrländer, C.,
2001). Several short-term studies suggested that there is a strong causal
relation between particulate air pollution and respiratory symptoms, lung
function, exacerbation of asthma, hospital admissions and mortality
(Dockery et al., 1994; Schwartz, J., 1994; Ostrong et al., 1998; Pope et
al., 1995; Samet et al., 1998). Cardiovascular deaths are increased with
the increased particle exposure, besides respiratory deaths.
Long-term studies showed that there is a risk of reduction of lung
function when people exposure in particulate polluted air. And some other
studies showed that there are associations between particulate air
pollution and chronic respiratory symptoms or disease.
The ultrafine particle will have larger health influence than fine
particle with the same mass based on the study. And ultrafine particles
11
due to combustion of coal and mobile sources will cause a respectively
increasing in daily mortality (Braun-Fahrländer, C., 2001).
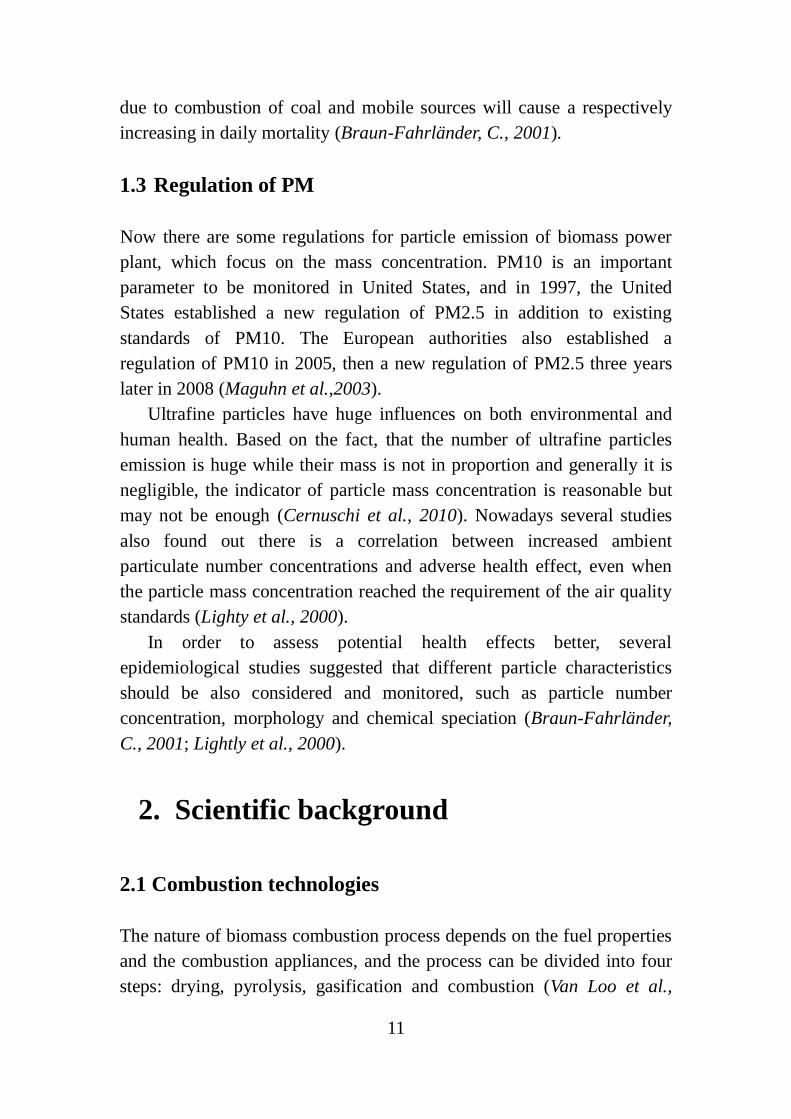
1.3 Regulation of PM
Now there are some regulations for particle emission of biomass power
plant, which focus on the mass concentration. PM10 is an important
parameter to be monitored in United States, and in 1997, the United
States established a new regulation of PM2.5 in addition to existing
standards of PM10. The European authorities also established a
regulation of PM10 in 2005, then a new regulation of PM2.5 three years
later in 2008 (Maguhn et al.,2003).
Ultrafine particles have huge influences on both environmental and
human health. Based on the fact, that the number of ultrafine particles
emission is huge while their mass is not in proportion and generally it is
negligible, the indicator of particle mass concentration is reasonable but
may not be enough (Cernuschi et al., 2010). Nowadays several studies
also found out there is a correlation between increased ambient
particulate number concentrations and adverse health effect, even when
the particle mass concentration reached the requirement of the air quality
standards (Lighty et al., 2000).
In order to assess potential health effects better, several
epidemiological studies suggested that different particle characteristics
should be also considered and monitored, such as particle number
concentration, morphology and chemical speciation (Braun-Fahrländer,
C., 2001; Lightly et al., 2000).
2. Scientific background
2.1 Combustion technologies
The nature of biomass combustion process depends on the fuel properties
and the combustion appliances, and the process can be divided into four
steps: drying, pyrolysis, gasification and combustion (Van Loo et al.,
12
2008). For different purpose and different fuel types, the different
technologies should be applied. We can divide them into different
categories based on different ways.
The appliances can be used for domestic heating, industrial and
district heating, power generation, etc. Wood stove, fireplace and wood
pellet boiler which commonly burn wood and provide domestic heat. This
kind of appliances is generally manually fuel feeding and controlling.
And the emissions of PM and other gaseous species are high because of
no FGCS equipped with. There are several techniques for industrial
utilization or power generation: fixed bed combustion, fluidized bed
combustion and pulverized fuel combustion. They are equipped with
automatic fuel feeding system, FGCS and fully operated automatically by
the control system to achieve the strict emission limits (Van Loo et al.,
2008).
Based on thermal power capacity, we can generally divide
combustion systems into the small-scale system which has a thermal
power output less than 100 kW, the medium-scale system which has a
thermal power ranged from 100 kW to 2 MW, and the large-scale system
which has a thermal power output larger than 2 MW. Small-scale biomass
combustion systems are commonly used for residential heating. Medium
or large scale combustion systems are usually applied for industrial and
district heating purpose.
2.2 PM and other gaseous emission issues
Particulate matter is a complex mixture of airborne particles and liquid
droplets which are composed of acids (such as nitrates and sulfates),
ammonium, water, elemental carbon, organic chemicals, metals and soil
(crustal) material (Nussbaumer et al., 2008). The dimensions of PM range
from few nanometers up to around hundred microns. The particles from
biomass combustion are grouped into two categories base on
aerodynamic dimensions (EPA, 2008): coarse particles which range from
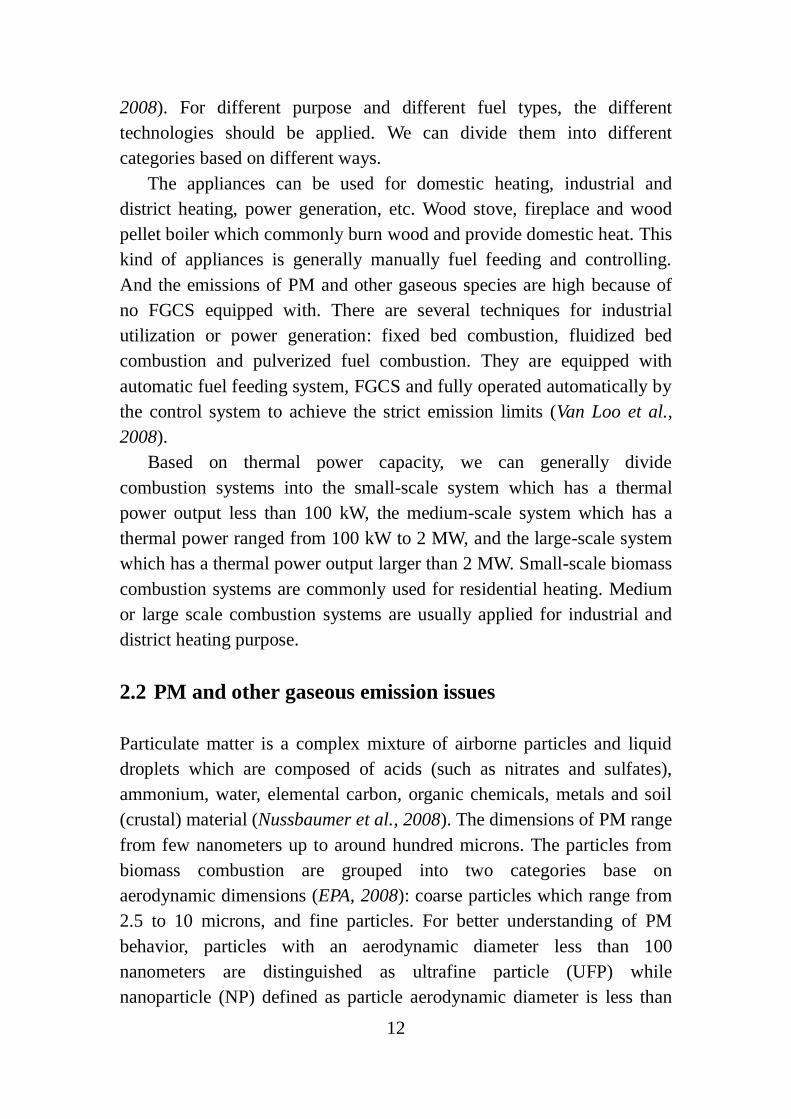
2.5 to 10 microns, and fine particles. For better understanding of PM
behavior, particles with an aerodynamic diameter less than 100
nanometers are distinguished as ultrafine particle (UFP) while
nanoparticle (NP) defined as particle aerodynamic diameter is less than
13
50 nanometers. Their dimensions are shown in figure 2.2.1.
Figure 2.2.1 Particulate matter air pollution size distribution (Brook et
al., 2004)
The physical and chemical properties of particles formed from
biomass combustion depend on several factors such as fuel properties,
combustor design, operation conditions, etc. The different appliances of
combustion systems can lead to significant variations of particle
emissions.
Particle emissions from combustion systems originate from different
sources. The primary particles which formed during combustion process
directly included coarse fly-ash and combustion aerosols. Fly-ash
(particle diameter larger than 1 micron) is the entrainment of ash particles
in the flue gas. Combustion aerosols (particle diameter less than 1 micron)
are formed multimodal.
One type of aerosol is originated from inorganic compounds, like
alkali salts (such as alkali sulphates and chlorides), which is due to the
reaction between K or Na and Cl or S released from fuel to gas phase
during combustion process, and subsequently form sub-micron particles
by nucleation and condensation process directly (Van Loo et al., 2008).
Soot (elemental carbon) is produced at high temperature in fuel rich
condition due to the incomplete combustion, and it is a kind of
combustible material. With enough reaction time and oxygen, soot can be
14
oxidized to CO and CO2 (Lighty et al., 2000). The growth mechanism of
aerosol is due to some species, which are vaporized during combustion
process, saturate and form fine particles by homogeneous or
heterogeneous nucleation. The nucleated particles undergo coagulation
and agglomeration, condensation and surface reactions. The final particle
dimension depends on the residence time of the flue gas in the
combustion system, and a longer residence time makes a bigger
opportunity for particles to coagulate and grow (Liank et al., 1993).
In addition, some particles are formed as products of reactions
between gases released in combustion process or on the surface of
previously formed particles, during diluting exhaust plume or in the
atmosphere. This type of particles is called secondary particles, and this
process is called gas-to-particle conversion. The particles formation
caused by compounds is approximately equal to the amount of initially
vaporized compounds that is in excess of equilibrium at the ambient
temperature (Lighty et al., 2000).
There are at least three modes of gas-to-particle conversion. One is
near source condensation of primary low vapor pressure organics. For
example, the long chain organic carbons condense onto smoke particles
immediately after the plume leaves the flame zone. Another one is the
production of inorganic particulate matter such as sulfate, ammomium
and nitrate, and much of the formation is from primary gas emissions of
SO2, NOx, and NH3. Last but not least, there is also the conversion of
organics, such as the reactive non methane hydrocarbon (NMHC) and
organic acids (Reid et al., 2005; Kreidenweis et al., 2001).
The growth mechanisms of secondary aerosol particles involve vapor
condensation, coagulation, agglomeration, surface reactions and
adsorption. Particle size and saturation ratio S are two important
parameters for condensation process.
( )S
PS
P T
Where P is the partial pressure of a vapor, and Ps is the saturation
pressure which changes with temperature. Generally, condensation onto
the surface of existing particles is thermodynamically favored over
nucleation, but when the S is sufficiently high for a given mixture, the
homogeneous nucleation may occur. Thus the dilution conditions such as
15
dilution temperature and dilution ratio are important for the particle
condensation.
Except for particle matter emissions, there are other gaseous
emissions generated during biomass combustion processes from
incomplete and complete combustions.
Incomplete combustion is due to the inadequate mixing of
combustion air and fuel in the combustion chamber, the overall lack of
oxygen, low combustion temperature, too short residence time, etc.
Carbon monoxide (CO), methane (CH4), non methane hydrocarbon
components (NMHC) and polycyclic aromatic hydrocarbons (PAH) are
emitted as incomplete combustion products (Van Loo et al., 2008).
Emissions from complete combustion are carbon dioxide (CO2),
nitrogen oxides (NOX), sulfur dioxide (SO2) and hydrogen chloride (HCl).
The regulations of these pollutants are applied due to their negative
influences on environment. Furthermore, NOX, SO2 and VOCs participate
in the secondary particle formation in the atmosphere (IPCC, 2007). The
real emissions of these pollutants are mainly dependent on combustion
conditions and flue gas cleaning system.
2.3 Control technology of PM
Primary measures aim to prevent or reduce the PM formation and
emission in combustion chamber. Primary measures such as pretreatment
of biomass fuel via modification of the fuel composition, the moisture
content of the fuel and the fuel size can be adopted for all the combustion
units if the benefits overweight the costs.
Besides the pretreatment of biomass, the very important concepts of
primary measures are optimization of combustion, and they will reduce
the incomplete combustion productions as well. Sufficient high
combustion temperature, long residence times, homogeneous mixture of
fuel and air when changing of fuel should be achieved to ensure a
complete combustion. Well designed combustion appliances and proper
controlled of the combustion process are common primary measures,
which are widely used in real applications (Van Loo et al., 2008).
When there are limitations for emissions, the secondary measures
downstream to remove particles from the flue gas are necessary. Cyclone

16
or multi cyclones, electrostatic precipitators (ESP), fabric filter (FF) and
other methods are available equipments to reduce the particles in the flue
gas.
Different primary measures and secondary measures are used for
varied biomass combustion systems in order to meet the regulations. The
primary consideration to choose the measures is the heat or power
capacity of the units. Technological and economical considerations are
important as well (Van Loo et al., 2008).
2.3.1 Control technology for large appliances
Automatically fuel feeding systems are applied in the big biomass
combustion units. This system allows an optimum adjustment of the fuel
flow to the actual load conditions. A well designed fuel bed and grate
systems combine with proper combustion air supply can make a
homogeneous mixture of fuel and air and a complete combustion. Air
supply strategies have turned out to be the most effective method. Low
primary air is used to control the burn rate and secondary air is used later
to complete oxide the gaseous species released from the fuel (Brunner et
al., 2009). In addition, the automatic control systems should be
programmed for simultaneous optimization of the combustion process to
minimize emissions and maximize the efficiency.
However, the studies show that the reduction potential of primary
measures will not be sufficiently effective to achieve the emissions
limitations (Gaefauf et al., 1998; Wagner et al., 2000; Wehinger et al.,
2000). Hence, secondary measures are applied for regulation of PM
emission, and multi cyclones, electrostatic precipitators and fabric filter
are commonly used devices.
Multi cyclones are economical and widely used in medium and large
scale biomass combustion systems for particle precipitation. Centrifugal
forces are used by cyclones to separate particles from flue gas, and they
have relative a good efficiency around 80% for PM10. However, the
efficiency decreases to 20% for particulates whose aerodynamic diameter
is smaller than 5 microns (Jiao et al., 2007), and efficiencies for remove
UFP and NP are close to zero. These characteristics of cyclones make the
main fraction, which under good combustion conditions, not be separated
17
from flue gas (Nussbaumer, T., 2001).
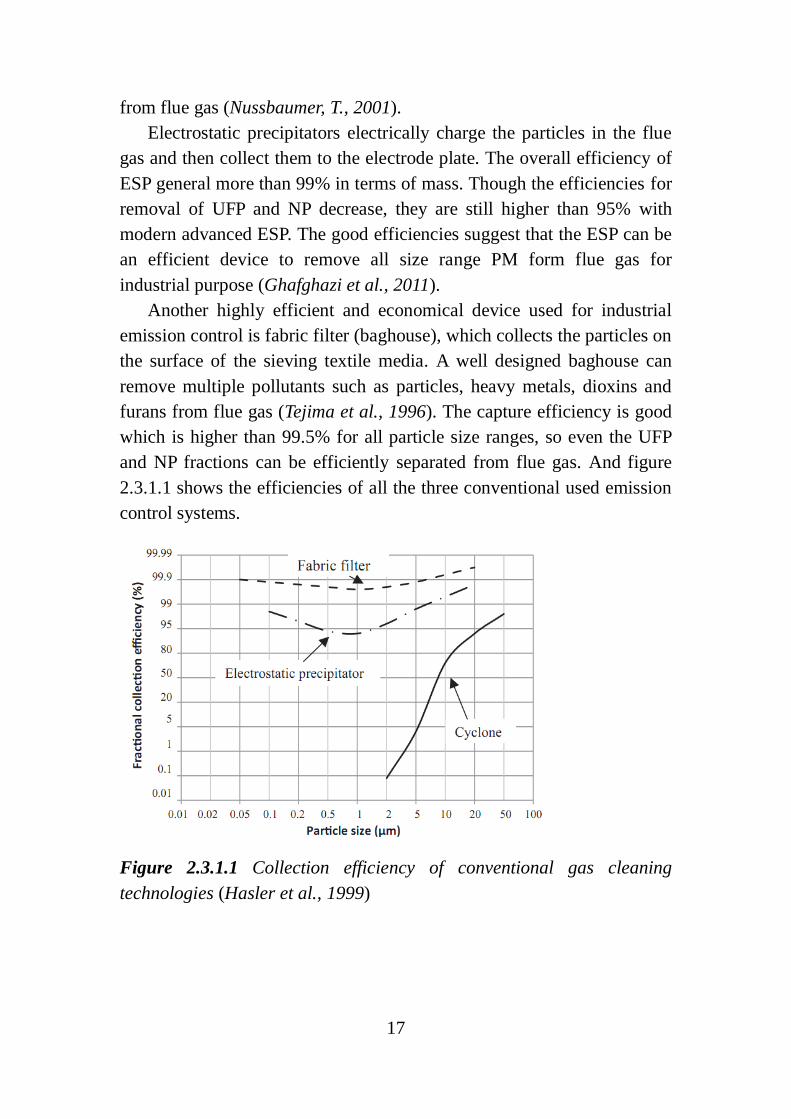
Electrostatic precipitators electrically charge the particles in the flue
gas and then collect them to the electrode plate. The overall efficiency of
ESP general more than 99% in terms of mass. Though the efficiencies for
removal of UFP and NP decrease, they are still higher than 95% with
modern advanced ESP. The good efficiencies suggest that the ESP can be
an efficient device to remove all size range PM form flue gas for
industrial purpose (Ghafghazi et al., 2011).
Another highly efficient and economical device used for industrial
emission control is fabric filter (baghouse), which collects the particles on
the surface of the sieving textile media. A well designed baghouse can
remove multiple pollutants such as particles, heavy metals, dioxins and
furans from flue gas (Tejima et al., 1996). The capture efficiency is good
which is higher than 99.5% for all particle size ranges, so even the UFP
and NP fractions can be efficiently separated from flue gas. And figure
2.3.1.1 shows the efficiencies of all the three conventional used emission
control systems.
Figure 2.3.1.1 Collection efficiency of conventional gas cleaning
technologies (Hasler et al., 1999)

18
2.3.2 Control technology for medium and small scale appliances
The primary measures for reducing the emission of PM are very
important for medium and small scale applications due to the
technological and economical considerations. Better combustion and
lower emissions are the goal of primary measures for smaller size
combustion units as well.
Automatically feeding screws are applied for modern pellet boiler to
ensure an optimum adjustment of the fuel flow to the actual load
conditions. The pellet boiler should have a well designed grate system to
guarantee a good mixture of fuel and air. Air strategies and proper air
supply can also be very efficient ways to improve the thermal efficiency
and reduce the emissions. The combustion chamber of pellet boiler can be
divided into two zones, a primary combustion zone and a secondary zone,
and the proper designed chamber dimension can optimize the combustion
process. Advance control systems also equipped with modern wood chip,
pellet boilers, which maintain the good combustion and low emissions of
the boilers (Brunner et al., 2009).
Typical batch burning devices like wood stove and fireplace are
different from other appliances. They don’t have automatic control
systems, and the user may significantly influence the emissions by using
improper fuel, implying wrong charging and ignition, etc. A basic training
for users of stoves and fireplace is necessary. And proper designs of
stoves and fireplaces such as appropriate air staging and combustion
chamber design are very useful ways to reduce the emissions (Brunner et
al., 2009).
The cyclone and multi cyclones are applied for boilers to separate
particles form flue gas, and as stated before, their efficiency of capturing
NP and UFP are not ideal. There still are significant fine particles
emissions from the boilers. What is worse, installation of FGCS for batch
burning devices is not attractive from the economical point of view, so
the stoves and fireplaces are generally not equipped with any flue gas
cleaning devices. The PM emissions could be very significant compared
with other appliances.

19
3. Material and methods
In this study, a biomass power plant, a wood pellet boiler and a fireplace
in different scales of biomass combustion systems, which firing three
different biofuels were investigated. The nominal thermal capacities were
in the range of 11 kW to 15 MW.
Due to a focus on UFP and NP fractions of total particle emissions in
these three types of appliances, the real-time sampling systems were
equipped with a specifically designed sampling line, which included
dilution systems and particle counting devices. All the measurements
were done simultaneously in the stack in the three cases.
3.1 Investigated combustion systems
3.1.1 Woody biomass power plant
The 15MW thermal output water cooled vibrating grate–firing bed, which
feeds untreated wood 20 t h-1
. The grate-firing furnace is a typical fixed
bed combustion technology, which is appropriate for biomass fuels with
high moisture content and varying size since the vibrating grates can
ensure a mixture of the fuels across the grate (Van Loo et al., 2008).
In order to achieve the requirements of air quality limits, a flue gas
cleaning system was installed in the power plant. The flue gas cleaning
system consists of a dry electrostatic precipitator (ESP), an alkaline dry
sorbent injection and a fabric filter (FF) for removal of particulate matter
(table 3.1.1.1). To remove NOX, a urea based-SNCR (Selective Non
Catalytic Reduction) was installed in the post combustion zone. Between
ESP and FF a catalytic oxidizer (OXYCAT) were installed, and no
alkaline sorbent injection when SNCR and OXYCAT units stopped
working or sampling measurements took place.
20
ESP FF
Type Dry Fabric material Glass fiber + PTFE
Number of sections 2 Filter bag number 1170
Voltage (kV) 110 dimensions of bag Φ153×4800mm
Inlet temperature (℃) 250-300 Inlet temperature (℃) 130-135
Table 3.1.1.1 The characters of particle clean units
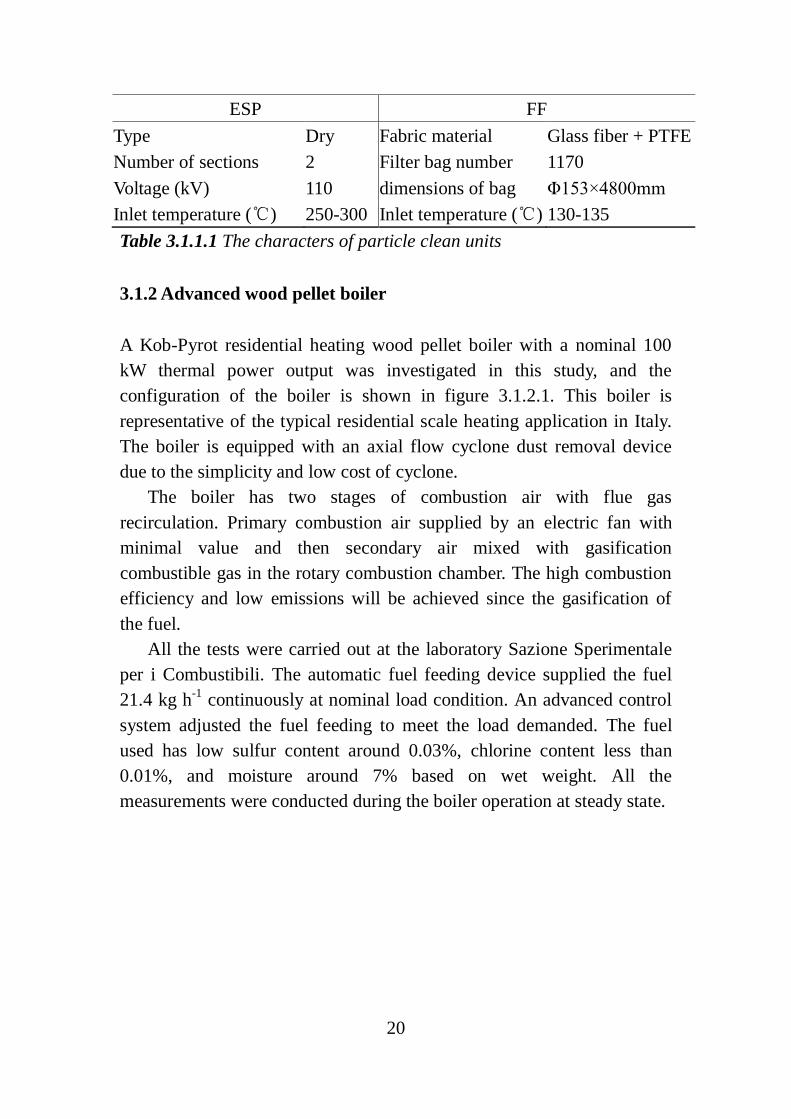
3.1.2 Advanced wood pellet boiler
A Kob-Pyrot residential heating wood pellet boiler with a nominal 100
kW thermal power output was investigated in this study, and the
configuration of the boiler is shown in figure 3.1.2.1. This boiler is
representative of the typical residential scale heating application in Italy.
The boiler is equipped with an axial flow cyclone dust removal device
due to the simplicity and low cost of cyclone.
The boiler has two stages of combustion air with flue gas
recirculation. Primary combustion air supplied by an electric fan with
minimal value and then secondary air mixed with gasification
combustible gas in the rotary combustion chamber. The high combustion
efficiency and low emissions will be achieved since the gasification of
the fuel.
All the tests were carried out at the laboratory Sazione Sperimentale
per i Combustibili. The automatic fuel feeding device supplied the fuel
21.4 kg h-1
continuously at nominal load condition. An advanced control
system adjusted the fuel feeding to meet the load demanded. The fuel
used has low sulfur content around 0.03%, chlorine content less than
0.01%, and moisture around 7% based on wet weight. All the
measurements were conducted during the boiler operation at steady state.
21
Figure 3.1.2.1 Kob-Pyrot wood pellet boiler
3.1.3 Modern closed fireplace
The modern closed fireplace with a nominal 11 kW thermal power output
was investigated in this study. The primary and secondary airs were
supplied to the fireplace by natural air convection. The boiler was
manually fed with beech wood logs, which with low moisture level less
than 10% and ash content was around 0.5% based on wet weight. This
appliance performed without any flue gas clean devices and relative
lower thermal efficiency was achieved.
The traditional small scale batch–fired systems such as fireplace, heat
stoves generally applied for domestic heating. The fuel feed in this kind
of system is not continuous and automatic, so the combustion
characteristics are dynamic changing with operation of time.
Because of the unstable combustion process, the concentrations of
pollutants are higher than the larger scale appliances. What’s more, the
flue gas cleaning system is not economically feasible for this kind of
system. The lack of any emission control device of small-scale
combustion appliances leads to pollutants emission and especially for
particulate matter issues. In winter time, the small-scale appliances are
popular around European countries, and the big amount of users may
cause problems of local air quality (Johansson et al., 2001).
22
3.2 Measurement systems
Different measurement and sampling methods have been used for particle
size distribution and number concentration. The special dilution sampling
systems was used in this study for pellet boiler based on the EPA
CTM-093 train (US-EPA, 2004). Both UFP and NP fractions from
primary and secondary condensation can be evaluation through dilution
processes of sampled flue gas.
The measurement line was assembled with a PM10 and a PM2.5
cyclone in series as pre-cut multi cyclones to collect particles with
aerodynamic diameter bigger than 2.5 microns for pellet boiler, and only
a PM2.5 pre-cut cyclone was equipped for power plant. For the purpose
of reaching the range measurable by the ELPI, a two-stage dilutor
(FPS-4000, Dekati Ltd., Finland) was equipped for diluting sampling flue
gas. The first perforated dilutor is to minimize the particle losses and the
second dilutor is an ejector type diluter. And the first diluter can be heated
with a probe heater, then dehumidified and HEPA filtered dilution air
diluted the sampling gas in a conical mixing zone. Carbon dioxide
concentrations measured before and after were used to calculate the
dilution ratio (DR). By changing the dilution temperature and dilution
ratio, we can find the influence of dilution on particle number
concentration and size distribution.
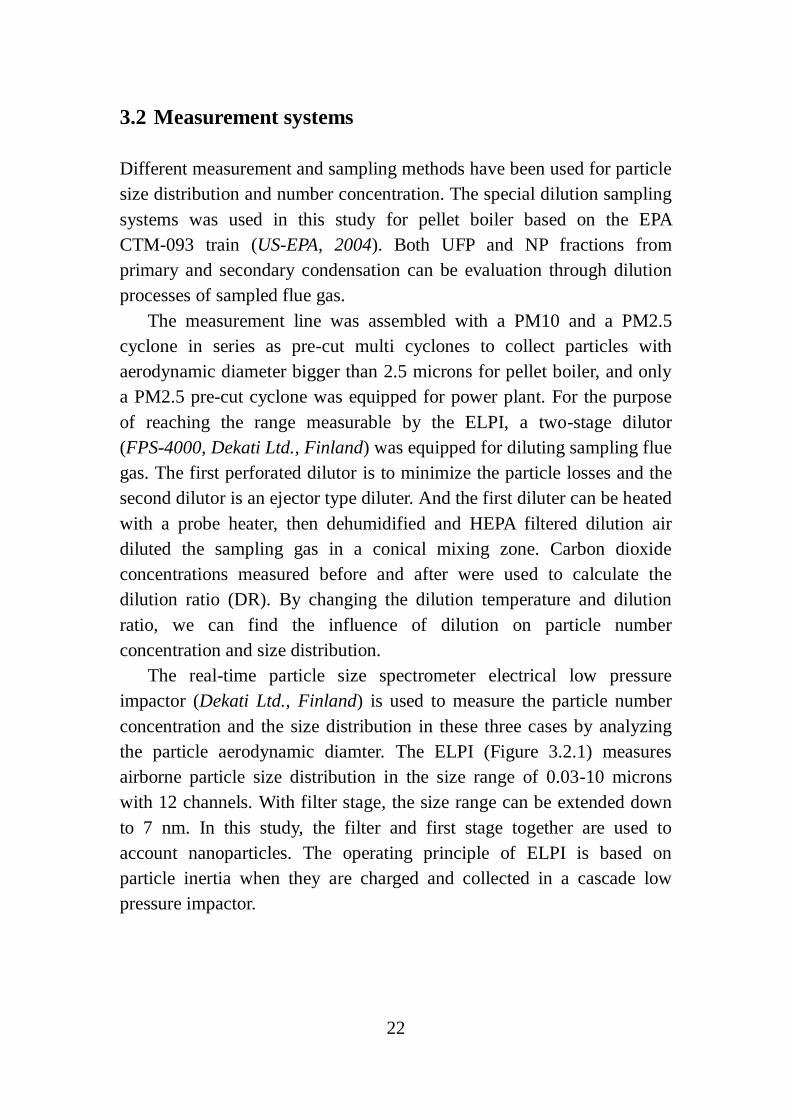
The real-time particle size spectrometer electrical low pressure
impactor (Dekati Ltd., Finland) is used to measure the particle number
concentration and the size distribution in these three cases by analyzing
the particle aerodynamic diamter. The ELPI (Figure 3.2.1) measures
airborne particle size distribution in the size range of 0.03-10 microns
with 12 channels. With filter stage, the size range can be extended down
to 7 nm. In this study, the filter and first stage together are used to
account nanoparticles. The operating principle of ELPI is based on
particle inertia when they are charged and collected in a cascade low
pressure impactor.

23
Figure 3.2.1 Structure of ELPI
The main components of ELPI are a corona charge, a low-pressure
cascade impactor and multi channel electrometer. The impactor classifies
the particle according to their aerodynamic diameter. The range Di and
geometric mean median diameter Dp of each stage are listed in table 3.2.1.
Greased aluminum foils were used on the collection plates to protect the
collection plates from fouling and prevent cleaning plates every time after
each measurement.
stage 1 2 3 4 5 6 7 8 9 10 11 12
Di (μm) 0.03 0.06 0.09 0.16 0.26 0.39 0.62 0.96 1.61 2.41 4.02 9.98
Dp (μm) 0.02 0.04 0.07 0.12 0.20 0.32 0.49 0.77 1.24 1.97 3.11 6.33
Table 3.2.1 Calibration data of ELPI
When the sample passes through a unipolar positive polarity charger,
where the particles in the sample are charged and the charged particle
were collected in specific impactor stage, it produce an electrical current,
which was recorded by the respective electrometer channel. The particle
number collected is proportional to the current value recorded by the
24
respective channel. The larger the current is, the larger number of particle
will be collected. Total particle number concentration (TN) is the sum of
each stage recorded.
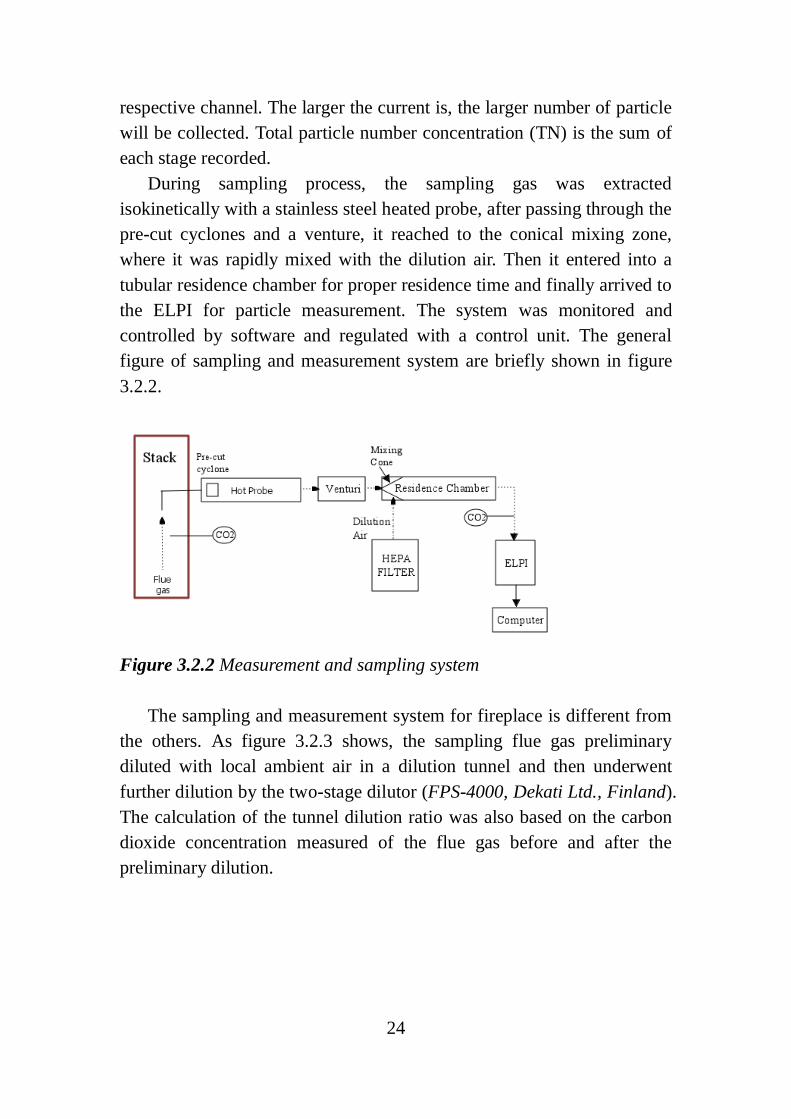
During sampling process, the sampling gas was extracted
isokinetically with a stainless steel heated probe, after passing through the
pre-cut cyclones and a venture, it reached to the conical mixing zone,
where it was rapidly mixed with the dilution air. Then it entered into a
tubular residence chamber for proper residence time and finally arrived to
the ELPI for particle measurement. The system was monitored and
controlled by software and regulated with a control unit. The general
figure of sampling and measurement system are briefly shown in figure
3.2.2.
Figure 3.2.2 Measurement and sampling system
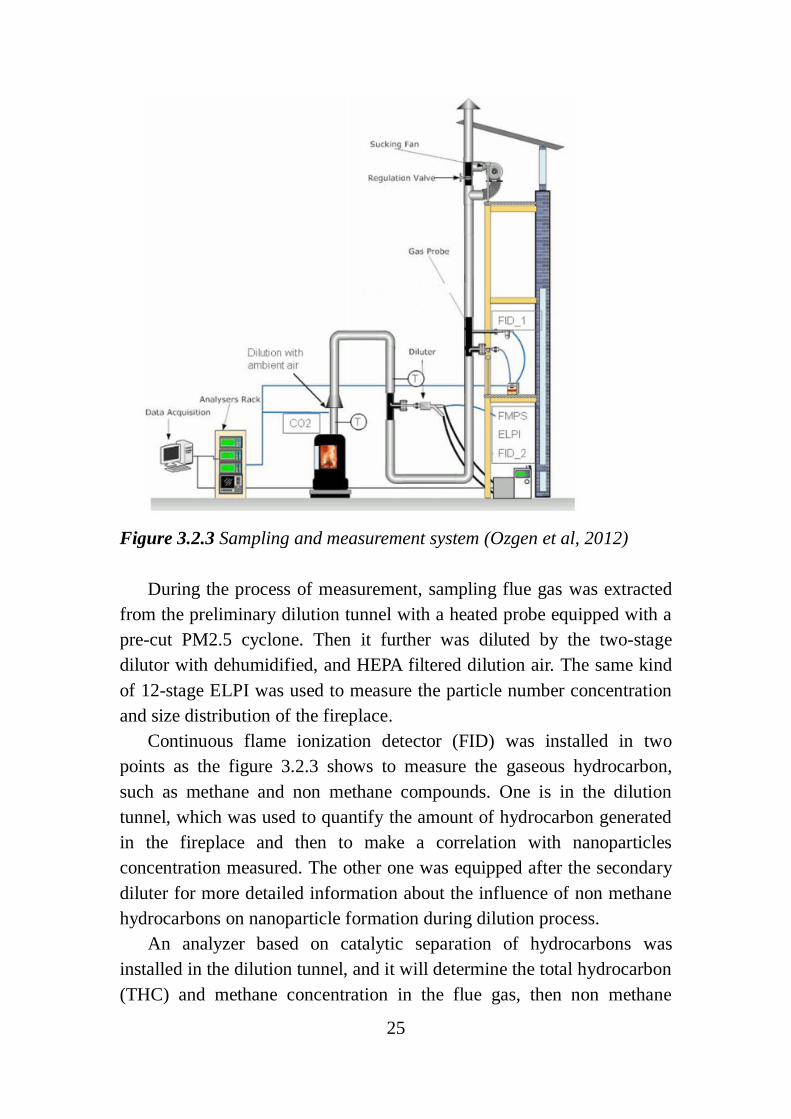
The sampling and measurement system for fireplace is different from
the others. As figure 3.2.3 shows, the sampling flue gas preliminary
diluted with local ambient air in a dilution tunnel and then underwent
further dilution by the two-stage dilutor (FPS-4000, Dekati Ltd., Finland).
The calculation of the tunnel dilution ratio was also based on the carbon
dioxide concentration measured of the flue gas before and after the
preliminary dilution.
25
Figure 3.2.3 Sampling and measurement system (Ozgen et al, 2012)
During the process of measurement, sampling flue gas was extracted
from the preliminary dilution tunnel with a heated probe equipped with a
pre-cut PM2.5 cyclone. Then it further was diluted by the two-stage
dilutor with dehumidified, and HEPA filtered dilution air. The same kind
of 12-stage ELPI was used to measure the particle number concentration
and size distribution of the fireplace.
Continuous flame ionization detector (FID) was installed in two
points as the figure 3.2.3 shows to measure the gaseous hydrocarbon,
such as methane and non methane compounds. One is in the dilution
tunnel, which was used to quantify the amount of hydrocarbon generated
in the fireplace and then to make a correlation with nanoparticles
concentration measured. The other one was equipped after the secondary
diluter for more detailed information about the influence of non methane
hydrocarbons on nanoparticle formation during dilution process.
An analyzer based on catalytic separation of hydrocarbons was
installed in the dilution tunnel, and it will determine the total hydrocarbon
(THC) and methane concentration in the flue gas, then non methane

26
hydrocarbon (NMHC) concentration can be calculated. After the FID first
determined the THC concentration of the flue gas, all the organic
compounds except methane of a portion of flue gas were directly
oxidized in a catalytic converter. Then the FID will detect the methane
concentration in the flue gas. 5 seconds time revolution was used to
measure the THC from 0 to 1000 ppm.
The other FID analyzer separated the hydrocarbons in the sampling
flue gas by the chromatographic columns equipped. The concentrations
are the integral of the chromatograms of the analyzer and the range was
from 0 to 5000 mg mn-3
with a corresponding 180 seconds for response.
3.3 Sampling
In the real world, the total emissions of PM consist both primary particles
that generated in combustion process, and secondary particles of
condensable origin, formed immediately after gas emission at stack due
to cooling by air dilution. In this study, the effects of fumes emitted into
the atmosphere which cooled and diluted by the ambient air were
evaluated. During this process, the secondary UFP and NP could generate
undergoing the nucleation and condensation processes.
The sampling flue gas diluted by cold dilution air with different DR
which named dilution sampling was applied in all these three cases. In
order to assess the amount of primary particles, another sampling method
named hot sampling also adopted when higher temperature maintained.
During hot sampling process, no condensation or only a part of
compounds may have condensed. The comparison between the different
samplings can provide useful information about the behavior of UFP and
UP emissions when flue gas was diluted under different conditions.
3.3.1 Hot sampling
Hot dilution sampling measurements were taken when all parts of
sampling system, included the ELPI, were heated before sampling, and
kept the temperature approximates to the stack gas temperature. It can
minimize the thermophoretic losses and to avoid unwanted nucleation
and condensation of semi volatile species inside the sampling line
27
(Cernuschi et al., 2009).
Hot sampling flue gas was first isokinetically extracted with the
heated probe and passed through the pre-cut cyclone, was diluted in the
first stage of dilution tunnel with heated dilution air, and finally reached
to the ELPI. Only primary particle size distribution and number
concentration can be evaluated by analyzing hot sampling.
3.3.2 Dilution sampling
Different dilution ratios (DR) were applied in order to investigate the
effects of dilution conditions on particle behavior of samples. The
dilution ratios can be divided into three ranges, low dilution, medium
dilution and high dilution.
The difference from hot sampling is that there is no need for diluted
sampling to heat all the sampling system, which dilution conducted with
preconditioned air at actual ambient temperature. This kind of sampling
evaluated not only the primary particles but also the condensable raction.
4. Results
Particle number concentration and size distribution were evaluated for all
the three different boilers investigated. Several statistical parameters were
utilized for analyzing particle number concentrations and size
distributions, such as the average, median, maximum, minimum, and
interquartile range (IOR, range between 25th and 75
th percentile), as well
as the respectively proportions of NP and UFP on total particle number
concentrations. Total number concentration (TN) in this study was
calculated as the sum of 12 stages. Box plots will be used to show the
mean, median, minimum, maxim and the interquartile range (IQR).
Nanoparticles were counted as the sum of first two stages, while ultrafine
particles were counted as the sum of first four stages. Geometric mean
diameter (GMD) and geometric standard deviation (GSD) were utilized
as indicators of particle size distribution.
Besides these, also some gaseous emissions levels such as CO2, CO,
NOX and some other flue gas parameters like flue gas temperature and O2
28
were measured at the same time to track the general characteristics of flue
gases.
The influence of different sampling conditions on NP emissions was
assessed with nonparametric statistic methods, which applied in this study
to analys the median values needed to compare whether they are similar
or not. The Mann-Whitney U test was applied for two independent
samples. It performs a two-sided rank sum test with the hypothesis that
two independent samples come from distributions with equal medians,
and returns the p-value from the test. P-value is the probability of
observing the given result. Small values of p cast doubt on the validity of
the null hypothesis at certain significance level and 5% of significance
adopted in this study. All the data programming and statistic analysis
were conducted using matlab 7.0 and SPSS v.20.
Based on the formation mechanism of particles, there could be
correlations between the amount of condensable organic compounds or
other gaseous species and the number concentration of particle as well as
their size distributions. There are several statistic methods to estimate the
dependence of variables. The commonly used Pearson product-moment
correlation coefficient is a measure of the strength of linear dependence
between two variables, and the estimation will give the r value between
+1 and -1. Another non-parametric test of statistic dependence between
two variables can be estimated by using Spearman’s rank correlation
coefficient. The value of Spearman’s rho reflects the dependence and it
ranges from +1 to -1. And when the each of the variable is a perfect
monotone function of the other the absolute value of rho is 1, while the
value of 0 means that the two variables are independent from each other.
The detailed results of each investigated combustion system are
described case by case in the following paragraphs.
4.1 Woody biomass power plant
11 tests were carried out during continuous operation at design conditions
of the biomass power plant. The durations of tests were from 2 to 14
hours, and the time interval of each particle number counting record is 1
minute.
The hot samplings as well as the dilution samplings which were

29
applied with different dilution ratio (DR) were measured. The dilution
procedure was regulated automatically: the system dilution air flow was
adjusted to achieve dilution ratios ranging from low to medium (15-40),
with the corresponding residence times in the chamber were from 2 to
0.5s. Temperature and relative humidity sensors were applied to control
the required sampling conditions. All the dilution samplings were
grouped into low dilution samplings (DR=10-20) and medium dilution
samplings (DR=20-40). Characteristics of PM in ambient air were also
measured as reference.
4.1.1 Particle number concentration and size distribution
All the data of PM was normalized to normal temperature and pressure
(NTP) condition (P=1 atm, T= 273K) and dry basis. The reference
volumetric oxygen contents O2 ref is 11%_vol. Particle number
concentrations and the main statistical parameters of corresponding size
distributions under different sampling conditions are listed in Table
4.1.1.1.
sampling
condition TN (cm
-3) Rang(cm
-3) NP (%) UFP (%)
GMD
(nm) GSD
Hot sampling 9.8×10⁵±4.2×10
5 1.7×10
5-2.7×10
6 85.2% 99.1% 29.8 1.7
Low dilution 2.3×10⁶±7.8×10
5 5.3×10
5- 5.1×10
6 92.5% 99.6% 26.5 1.5
Medium dilution 8.8×10⁵±4.0×10
5 1.2×10
5-2.7×10
6 90.7% 99.5% 27.3 1.6
Ambient air 2.0×10⁴±1.2×10
4 4.7×10
3-5.9×10
4 85.0% 97.3% 29.4 1.8
Table 4.1.1.1 Number concentration measurement results under different
sampling conditions. (TN: average number concentration ± standard
deviation; range: minimum – maximum; NP: cumulative fraction of
nanoparticles; UFP: cumulative fraction of ultrafine particles; GMD:
geometric mean diameter; GSD: geometric standard deviation).
Measurement results showed during hot sampling presented the
average TN values around 9.8×105 cm
-3 with standard deviation around
4.2×105 cm
-3. NP accounted for 85.2% while the UFP accounted for
99.1%. Sampling at the lower dilutions (DR=10-20) presented average
values of TN around 2.3×106 cm
-3 with standard deviation around

30
7.8×105 cm
-3. NP accounted for 92.5% while the UFP accounted for
99.6%. Sampling at medium dilutions (DR=20-40) presented average TN
values around 8.8×105 cm
-3 with standard deviation around 4.0×10
5 cm
-3.
NP accounted for 90.7% while the UFP accounted for 99.5%. Ambient air
condition measurement presented average TN values around 2.0×104 cm
-3
with standard deviation around 1.2×104 cm
-3. NP accounted for 85.0%
while the UFP accounted for 97.3%. The results suggest that the
statistical parameters of all the samplings, TN, NP and UFP
concentrations were at least one order of magnitude larger than the
corresponding concentrations at ambient air conditions.
The TN concentration of low dilution sampling was almost 3 times
of hot sampling. As figure 4.1.1.1 shows, the difference of UPF fractions
between the two samplings was not so big, because both of them were
larger than 99% and close to 100%. But difference of NP fractions
between the two samplings was obvious, the NP fraction increased from
85.2% to 92.5% due to low dilution condition. The result illustrates the
fact that when the flue gas diluted with cold ambient air by a low dilution
ratio, new particles formed in the dilution process. In the dilution process
of the flue gas, a decreased saturation ratio of semi volatile organic
species (such as semi volatile Polycyclic Aromatic Hydrocarbons
occurred in wood combustion) may cause the new particle formation by
homogeneous and heterogeneous condensation.
Figure 4.1.1.1 Number concentration fractions of NP and UFP under
different sampling conditions.
When flue gas diluted with increased DR, the medium dilution
0% 10% 20% 30% 40% 50% 60% 70% 80% 90%
100%
Hot sampling Low dilution Medium dilution
Ambient air
NP (%)
UFP (%)

31
sampling was obtained. The fractions of UFP and NP under medium
dilution condition decreased slightly when it was compared with low
dilution sampling. But they were still bigger than the respective fractions
of hot sampling. This result suggests that when further dilution was
applied, the partial pressure of semi volatile species decreased with the
increasing dilution ratio, and the newly formed particles reduction was
due to the changes of particle formation mechanisms. A corresponding
reduction of TN concentration occurred under medium dilution, which is
shown in figure 4.1.1.2.
Figure 4.1.1.2 TN concentration (cm-3) of particles under different
dilution conditions and in ambient air
The GMD of low dilution sampling was 26.5 nm with the
corresponding GSD around 1.5, and GMD of medium dilution was 27.3
nm with the GSD around 1.6. The hot sampling has a slightly bigger
GMD around 29.8 nm, and the corresponding GSD was 1.7. The GMD
decreased from 29.8 nm to 26.5 nm due to the finer particles formed
under cold dilutions. But GMDs of all the samplings including hot
sampling and dilution sampling which was diluted at different DRs, were
located in the NP range, and the UFP fractions accounted for more than
99% of the TN concentrations. The NP behavior was associated with the
2.0E+04
9.8E+05
2.3E+06
8.8E+05
1.00E+03
1.00E+04
1.00E+05
1.00E+06
1.00E+07
ambient air hot sampling low dilution medium dilution
TN c
on
trti
on
(cm
-3)
□IQR -maximum -●-average --median -minimum
32
TN concentration and the size distribution of the samplings.
Mann-Whitney U tests were applied to investigate the statistical
significance of the variation in NP number concentrations under the
different three sampling conditions. The results are reported in Table
4.1.1.2, showing that low dilution sampling has a significant statistic
differences from hot sampling and medium sampling (the p-value <
0.001). But the test between hot sampling and medium dilution gave a
p-value bigger than 0.05, suggesting that there is no statistically
significant difference of NP number concentration under both sampling
conditions.
Test samplings Mann-Whitney U p-value
Hot sampling-Low dilution 22826 <0.001
Low dilution-Medium dilution 23990 <0.001
Hot sampling-Medium dilution 89200 0.07
Table 4.1.1.2 Results of Mann-Whitney U tests on NP concentration
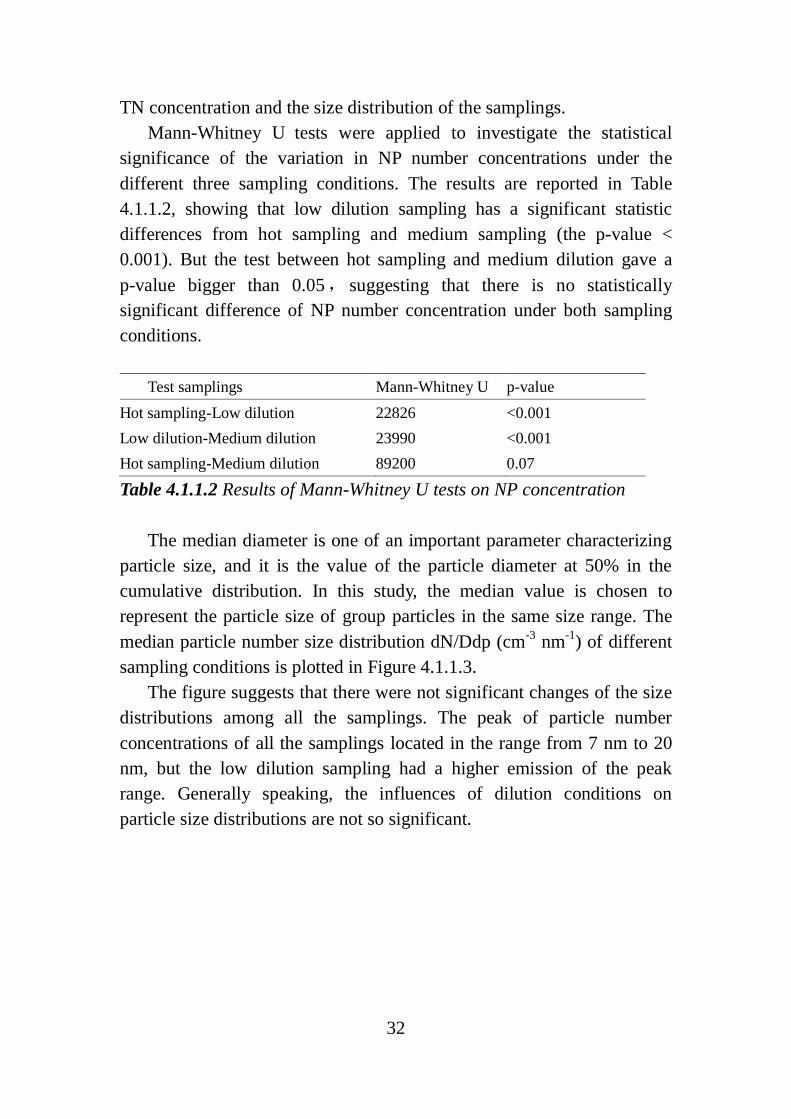
The median diameter is one of an important parameter characterizing
particle size, and it is the value of the particle diameter at 50% in the
cumulative distribution. In this study, the median value is chosen to
represent the particle size of group particles in the same size range. The
median particle number size distribution dN/Ddp (cm-3
nm-1
) of different
sampling conditions is plotted in Figure 4.1.1.3.
The figure suggests that there were not significant changes of the size
distributions among all the samplings. The peak of particle number
concentrations of all the samplings located in the range from 7 nm to 20
nm, but the low dilution sampling had a higher emission of the peak
range. Generally speaking, the influences of dilution conditions on
particle size distributions are not so significant.
33
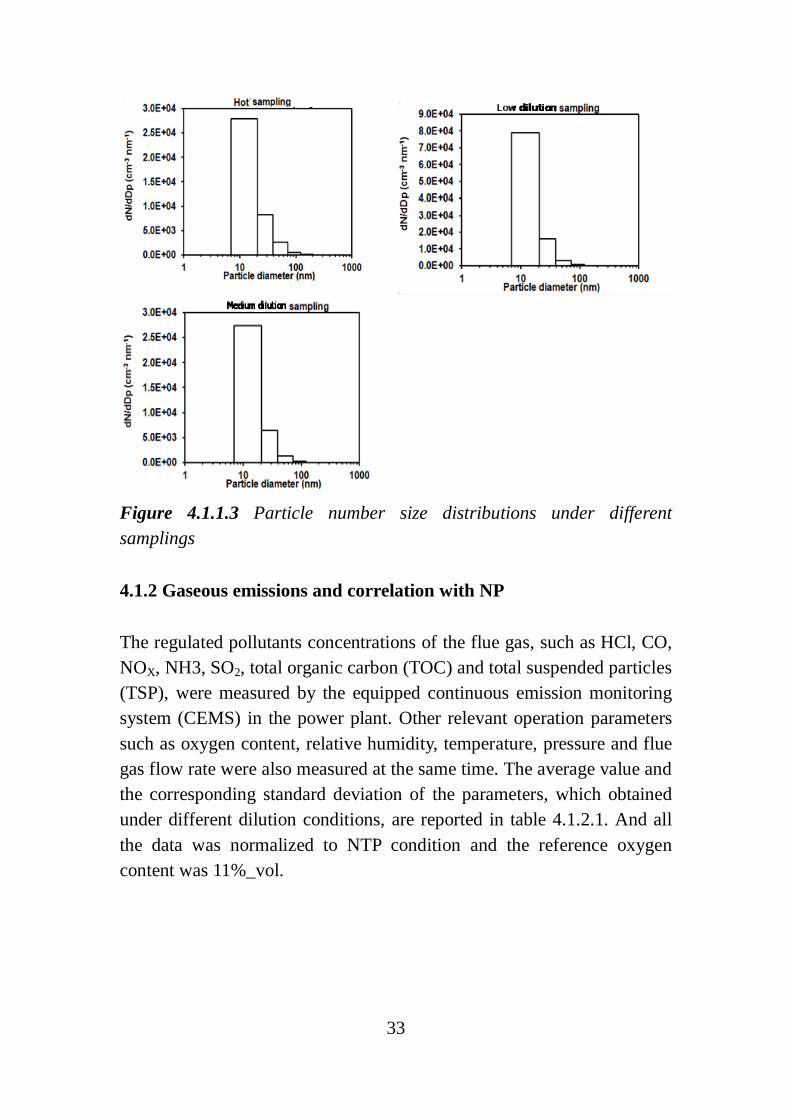
Figure 4.1.1.3 Particle number size distributions under different
samplings
4.1.2 Gaseous emissions and correlation with NP
The regulated pollutants concentrations of the flue gas, such as HCl, CO,
NOX, NH3, SO2, total organic carbon (TOC) and total suspended particles
(TSP), were measured by the equipped continuous emission monitoring
system (CEMS) in the power plant. Other relevant operation parameters
such as oxygen content, relative humidity, temperature, pressure and flue
gas flow rate were also measured at the same time. The average value and
the corresponding standard deviation of the parameters, which obtained
under different dilution conditions, are reported in table 4.1.2.1. And all
the data was normalized to NTP condition and the reference oxygen
content was 11%_vol.
34
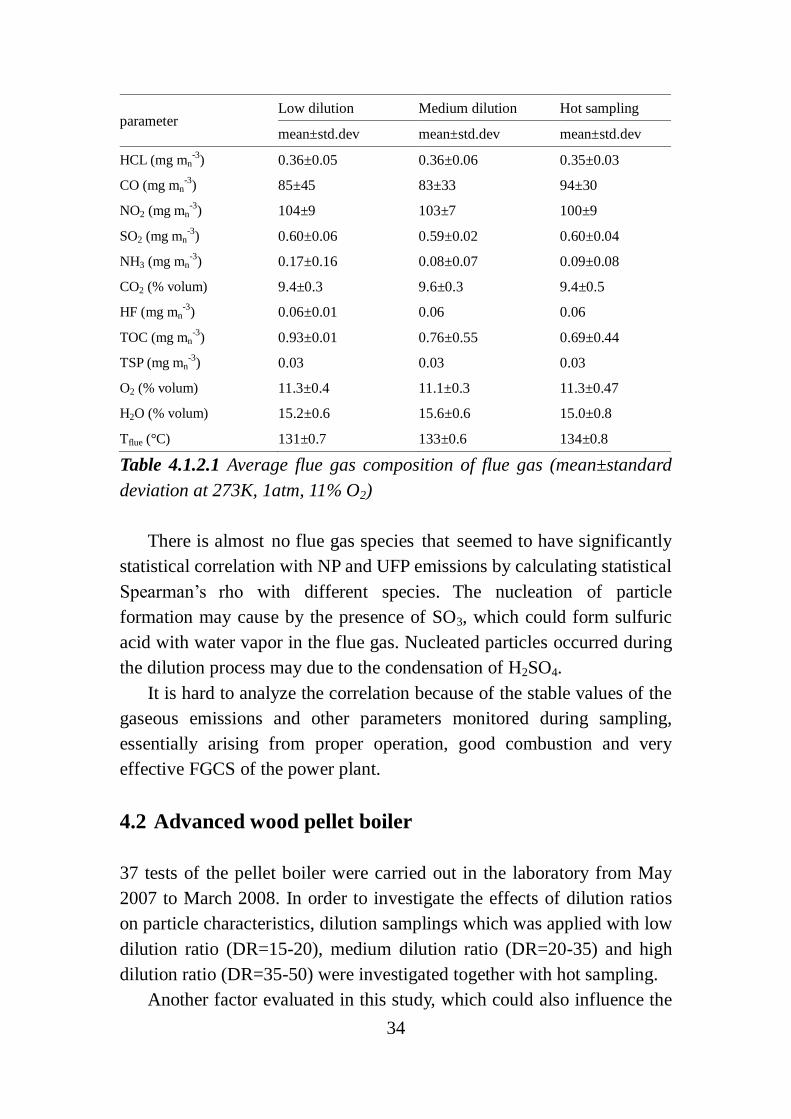
parameter Low dilution Medium dilution Hot sampling
mean±std.dev mean±std.dev mean±std.dev
HCL (mg mn-3
) 0.36±0.05 0.36±0.06 0.35±0.03
CO (mg mn-3
) 85±45 83±33 94±30
NO2 (mg mn-3
) 104±9 103±7 100±9
SO2 (mg mn-3
) 0.60±0.06 0.59±0.02 0.60±0.04
NH3 (mg mn-3
) 0.17±0.16 0.08±0.07 0.09±0.08
CO2 (% volum) 9.4±0.3 9.6±0.3 9.4±0.5
HF (mg mn-3
) 0.06±0.01 0.06 0.06
TOC (mg mn-3
) 0.93±0.01 0.76±0.55 0.69±0.44
TSP (mg mn-3
) 0.03 0.03 0.03
O2 (% volum) 11.3±0.4 11.1±0.3 11.3±0.47
H2O (% volum) 15.2±0.6 15.6±0.6 15.0±0.8
Tflue (°C) 131±0.7 133±0.6 134±0.8
Table 4.1.2.1 Average flue gas composition of flue gas (mean±standard
deviation at 273K, 1atm, 11% O2)
There is almost no flue gas species that seemed to have significantly
statistical correlation with NP and UFP emissions by calculating statistical
Spearman’s rho with different species. The nucleation of particle
formation may cause by the presence of SO3, which could form sulfuric
acid with water vapor in the flue gas. Nucleated particles occurred during
the dilution process may due to the condensation of H2SO4.
It is hard to analyze the correlation because of the stable values of the
gaseous emissions and other parameters monitored during sampling,
essentially arising from proper operation, good combustion and very
effective FGCS of the power plant.
4.2 Advanced wood pellet boiler
37 tests of the pellet boiler were carried out in the laboratory from May
2007 to March 2008. In order to investigate the effects of dilution ratios
on particle characteristics, dilution samplings which was applied with low
dilution ratio (DR=15-20), medium dilution ratio (DR=20-35) and high
dilution ratio (DR=35-50) were investigated together with hot sampling.
Another factor evaluated in this study, which could also influence the

35
characteristics of PM, is the operation method. In this study, two
operation methods were performed. Under nominal condition, the boiler
was working at design conditions with a 100% thermal output and
optimization fuel/air ratio. When reduced load condition was applied, the
boiler only had a 30% thermal load output. The boiler had an
automatically fuel feeding and control system. And it allowed a proper
reduction of combustion air supply according to the reduction of fuel
supply when the load was reduced.
4.2.1 Particle number concentration and size distribution
All the data of PM was normalized to NTP condition and dry basis. The
reference volumetric oxygen contents O2 ref is 10%_vol. Particle number
concentrations and the main statistical parameters of corresponding size
distributions under different sampling conditions and different operation
methods are summarized in Table 4.2.1.1.
Load
(%)
sampling
condition TN (cm
-3) Range(cm
-3) NP (%) UFP (%)
GMD
(nm) GSD
100%
Low
dilution 6.8×10
7±2.2×10
7 4.2×10
6-
8.4×10
8 17.4% 92.6% 81.8 1.7
Medium
dilution 6.6×10
7±1.7×10
7 6.3×10
5-2.20×10
8 19.4% 92.3% 80.2 1.7
High
dilution 7.8×10
7±1.4×10
7 3.3×10
7-1.5×10
8 27.4% 95.5% 69.2 1.8
30% Medium
dilution 3.6×10
7±1.2×10
7 2.3×10
7-2.7×10
8 0.4% 41.0% 175.4 1.6
Table 4.2.1.1 Number concentration measurement results under different
sampling conditions and loads. (TN: average number concentration ±
standard deviation; range: minimum – maximum; NP: cumulative
fraction of nanoparticles; UFP: cumulative fraction of ultrafine particles;
GMD: geometric mean diameter; GSD: geometric standard deviation).
It turned out that the particle number concentrations of hot sampling
without further dilution were too high and the values exceeded the
detection limits of ELPI. When the boiler operated at nominal condition,

36
sampling at low dilutions (DR=15-20) presented average values of TN
around 6.8×107 cm
-3 with standard deviation around 2.2×10
7 cm
-3. NP
accounted for 17.4% while the UFP accounted for 92.6%. Sampling at
medium dilutions (DR=20-35) presented average values of TN around
6.6×107 cm
-3 with standard deviation around 1.7×10
7 cm
-3. NP accounted
for 19.4% while the UFP accounted for 92.3%. Sampling at high dilutions
(DR=35-50) presented the average values of TN around 7.8×107 cm
-3
with standard deviation around 1.4×10⁷
cm-3
. NP accounted for 27.4%
while the UFP accounted for 95.5%. While the boiler operated at non
nominal conditions, the medium dilution sampling (DR=30)
measurement presented the average values of TN around 3.6×107 cm
-3
with standard deviation around 2.3×107 cm
-3. NP accounted for 0.4%
while the UFP accounted for 41.0%.
The results suggested, also as figure 4.2.1.1 shows, when boiler
operated at nominal condition, variation of dilution ratio did not influence
the TN concentrations because they were in the same order and not
significantly different from each other (TN average concentrations from
6.6×10⁷ to 7.8×10
7 cm
-3). But the fractions of NP increased from 17.4%
(low dilution) to 27.4% (high dilution). And the UFP fractions just
slightly increased from 92.3% to 95.5% with an increasing dilution ratio
from 15 to 50. The increased TN was mainly due to the contribution of
NP fraction.
The GMDs of nominal operated samplings decreased from 81.2 to
69.2 nm with an increasing dilution ratio applied. The dilution sampling
with higher dilution ratio seemed to emit finer particles. This result
suggested that the saturation vapor pressure of semi volatile (semi volatile
PAHs) species in the flue decreased with the increasing dilution ratio as
well as the decreasing temperature. The newly formed particles were due
to the homogeneous and heterogeneous condensation of semi volatile
species.

37
Figure 4.2.1.1 Fractions of NP and UFP of number concentration under
different sampling conditions and operation methods.
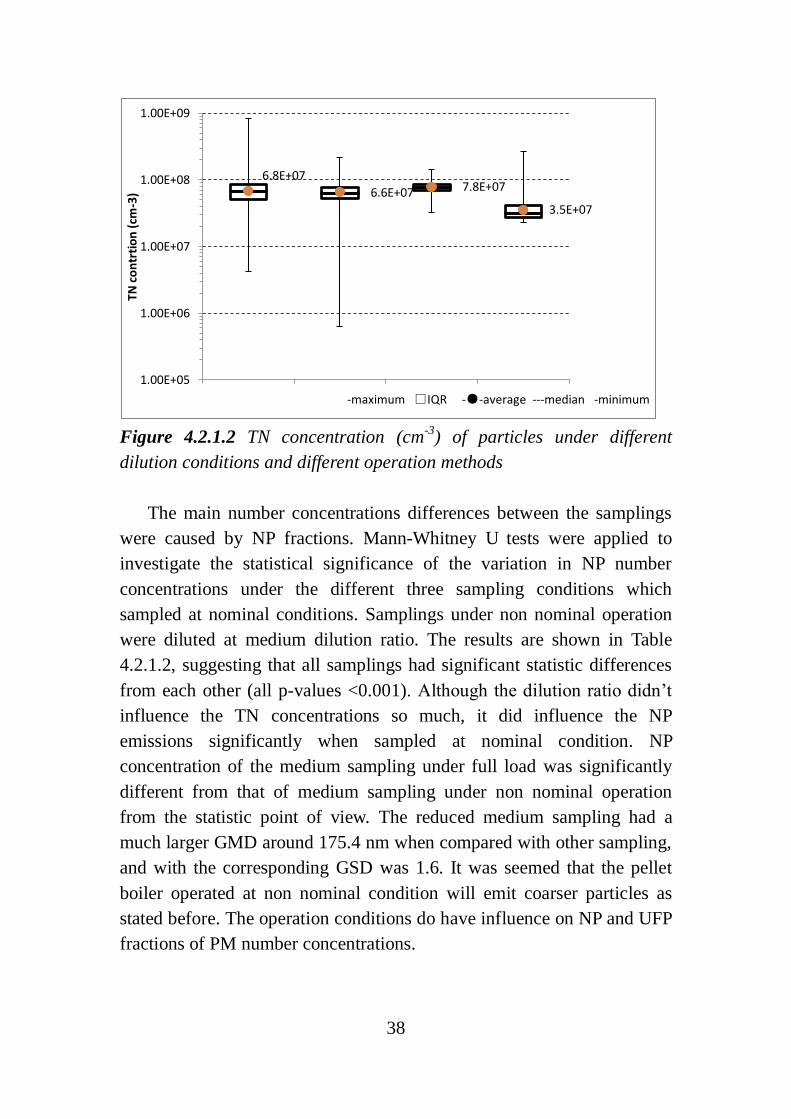
It is clear that the percentages of UFP and NP of partial load sampling
were much lower when compared with cold dilution samplings, since the
NP fraction almost 0 and that of UFP was just 41%. The figure 4.2.1.2
didn’t show significant differences between TN concentrations of the two
medium dilution samplings under different operation conditions. When
the load reduced, the control system will reduce the fuel and combustion
air supply automatically. The changing of fuel and combustion air supply
will finally lead to a worse combustion and coarser particles formation.
The presence of the significant amount of coarser particles makes it
possible for the further condensation and agglomeration of semi volatile
species on the existed surfaces of the coarser particles. And the
condensation of species on existed surfaces is favored than their
homogeneous condensation to form new particles.
0.0% 10.0% 20.0% 30.0% 40.0% 50.0% 60.0% 70.0% 80.0% 90.0%
100.0%
Low dilution
Medium dilution
High dilution
Medium dilution
nominal non nominal
NP (%)
UFP (%)
38
Figure 4.2.1.2 TN concentration (cm-3
) of particles under different
dilution conditions and different operation methods
The main number concentrations differences between the samplings
were caused by NP fractions. Mann-Whitney U tests were applied to
investigate the statistical significance of the variation in NP number
concentrations under the different three sampling conditions which
sampled at nominal conditions. Samplings under non nominal operation
were diluted at medium dilution ratio. The results are shown in Table
4.2.1.2, suggesting that all samplings had significant statistic differences
from each other (all p-values <0.001). Although the dilution ratio didn’t
influence the TN concentrations so much, it did influence the NP
emissions significantly when sampled at nominal condition. NP
concentration of the medium sampling under full load was significantly
different from that of medium sampling under non nominal operation
from the statistic point of view. The reduced medium sampling had a
much larger GMD around 175.4 nm when compared with other sampling,
and with the corresponding GSD was 1.6. It was seemed that the pellet
boiler operated at non nominal condition will emit coarser particles as
stated before. The operation conditions do have influence on NP and UFP
fractions of PM number concentrations.
6.8E+07
6.6E+07 7.8E+07
3.5E+07
1.00E+05
1.00E+06
1.00E+07
1.00E+08
1.00E+09
TN c
on
trti
on
(cm
-3)
-maximum □IQR -●-average ---median -minimum
39
Load (%) dilution ratio Mann-Whitney U p-value
100%-100% Low dilution-Medium dilution 5.7×10⁸ <0.001
100%-100% Low dilution-High dilution 5.7×10⁷ <0.001
100%-100% Medium dilution-High dilution 1.7×10⁷ <0.001
100%-30% Medium dilution-Medium dilution 4560 <0.001
Table 4.2.1.2 Results of Mann-Whitney U tests on NP concentration
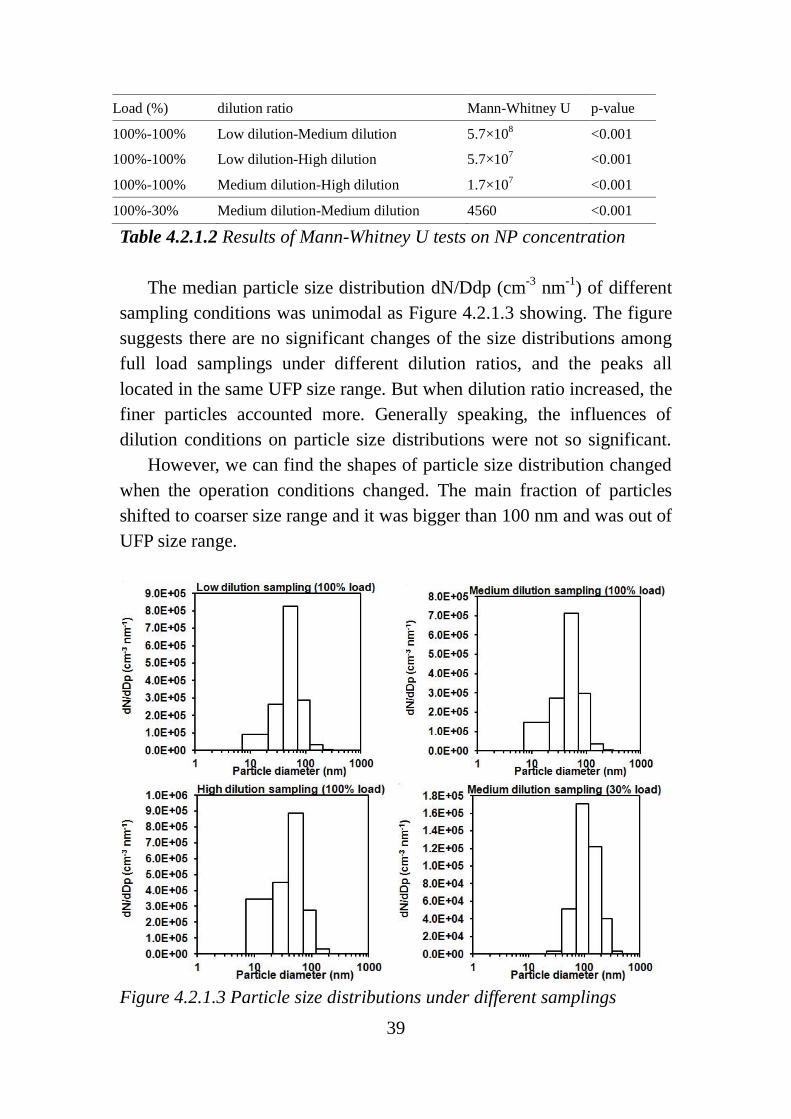
The median particle size distribution dN/Ddp (cm-3
nm-1
) of different
sampling conditions was unimodal as Figure 4.2.1.3 showing. The figure
suggests there are no significant changes of the size distributions among
full load samplings under different dilution ratios, and the peaks all
located in the same UFP size range. But when dilution ratio increased, the
finer particles accounted more. Generally speaking, the influences of
dilution conditions on particle size distributions were not so significant.
However, we can find the shapes of particle size distribution changed
when the operation conditions changed. The main fraction of particles
shifted to coarser size range and it was bigger than 100 nm and was out of
UFP size range.
Figure 4.2.1.3 Particle size distributions under different samplings
40
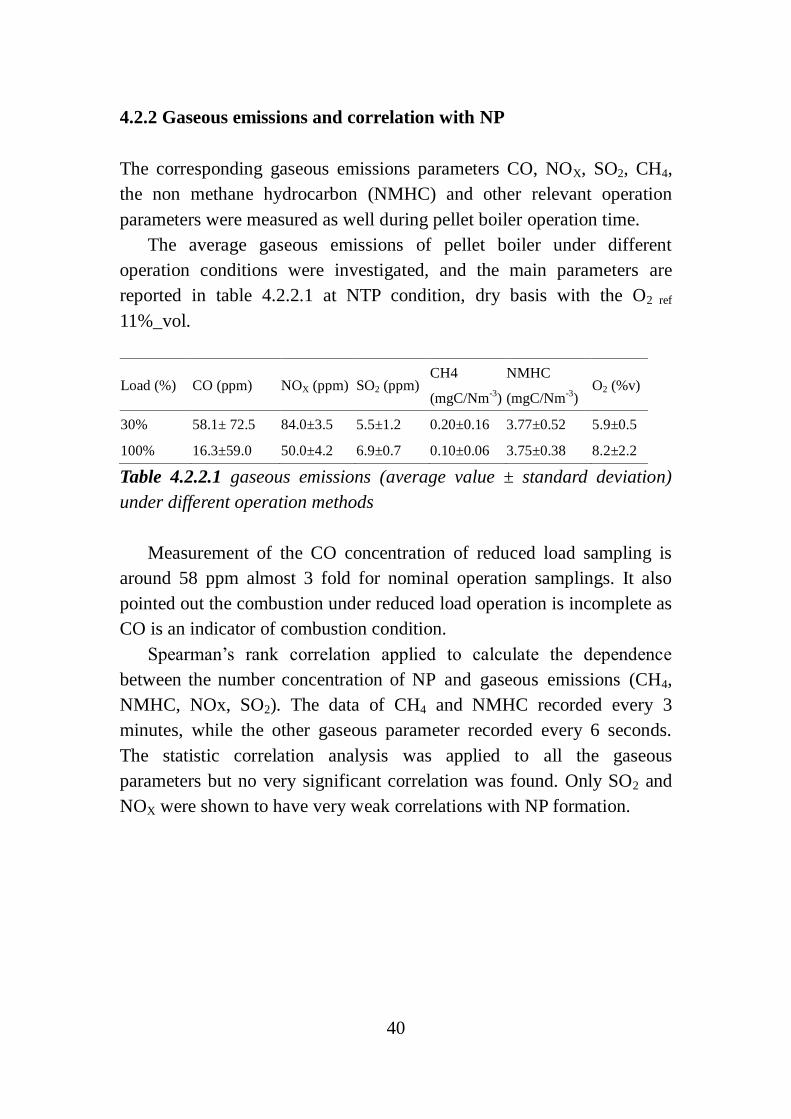
4.2.2 Gaseous emissions and correlation with NP
The corresponding gaseous emissions parameters CO, NOX, SO2, CH4,
the non methane hydrocarbon (NMHC) and other relevant operation
parameters were measured as well during pellet boiler operation time.
The average gaseous emissions of pellet boiler under different
operation conditions were investigated, and the main parameters are
reported in table 4.2.2.1 at NTP condition, dry basis with the O2 ref
11%_vol.
Load (%) CO (ppm) NOX (ppm) SO2 (ppm) CH4
(mgC/Nm-3
)
NMHC
(mgC/Nm-3
) O2 (%v)
30% 58.1± 72.5 84.0±3.5 5.5±1.2 0.20±0.16 3.77±0.52 5.9±0.5
100% 16.3±59.0 50.0±4.2 6.9±0.7 0.10±0.06 3.75±0.38 8.2±2.2
Table 4.2.2.1 gaseous emissions (average value ± standard deviation)
under different operation methods
Measurement of the CO concentration of reduced load sampling is
around 58 ppm almost 3 fold for nominal operation samplings. It also
pointed out the combustion under reduced load operation is incomplete as
CO is an indicator of combustion condition.
Spearman’s rank correlation applied to calculate the dependence
between the number concentration of NP and gaseous emissions (CH4,
NMHC, NOx, SO2). The data of CH4 and NMHC recorded every 3
minutes, while the other gaseous parameter recorded every 6 seconds.
The statistic correlation analysis was applied to all the gaseous
parameters but no very significant correlation was found. Only SO2 and
NOX were shown to have very weak correlations with NP formation.
41
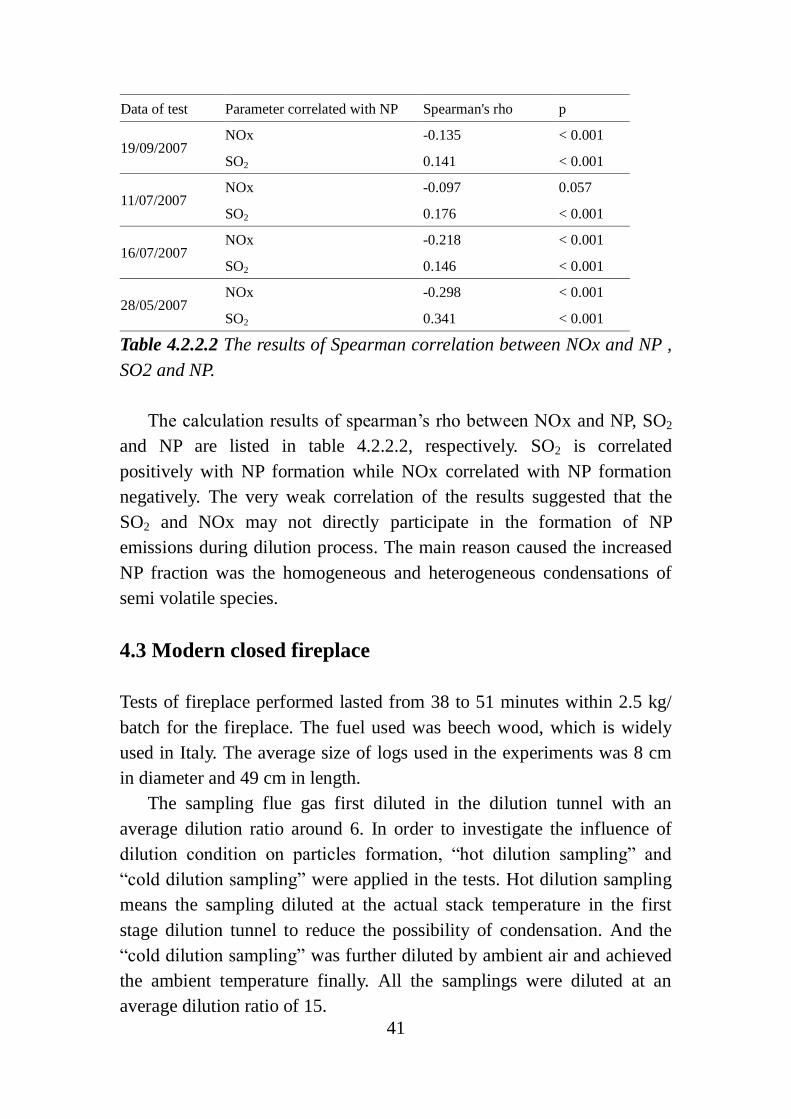
Data of test Parameter correlated with NP Spearman's rho p
19/09/2007 NOx -0.135 < 0.001
SO2 0.141 < 0.001
11/07/2007 NOx -0.097 0.057
SO2 0.176 < 0.001
16/07/2007 NOx -0.218 < 0.001
SO2 0.146 < 0.001
28/05/2007 NOx -0.298 < 0.001
SO2 0.341 < 0.001
Table 4.2.2.2 The results of Spearman correlation between NOx and NP ,
SO2 and NP.
The calculation results of spearman’s rho between NOx and NP, SO2
and NP are listed in table 4.2.2.2, respectively. SO2 is correlated
positively with NP formation while NOx correlated with NP formation
negatively. The very weak correlation of the results suggested that the
SO2 and NOx may not directly participate in the formation of NP
emissions during dilution process. The main reason caused the increased
NP fraction was the homogeneous and heterogeneous condensations of
semi volatile species.
4.3 Modern closed fireplace
Tests of fireplace performed lasted from 38 to 51 minutes within 2.5 kg/
batch for the fireplace. The fuel used was beech wood, which is widely
used in Italy. The average size of logs used in the experiments was 8 cm
in diameter and 49 cm in length.
The sampling flue gas first diluted in the dilution tunnel with an
average dilution ratio around 6. In order to investigate the influence of
dilution condition on particles formation, “hot dilution sampling” and
“cold dilution sampling” were applied in the tests. Hot dilution sampling
means the sampling diluted at the actual stack temperature in the first
stage dilution tunnel to reduce the possibility of condensation. And the
“cold dilution sampling” was further diluted by ambient air and achieved
the ambient temperature finally. All the samplings were diluted at an
average dilution ratio of 15.
42
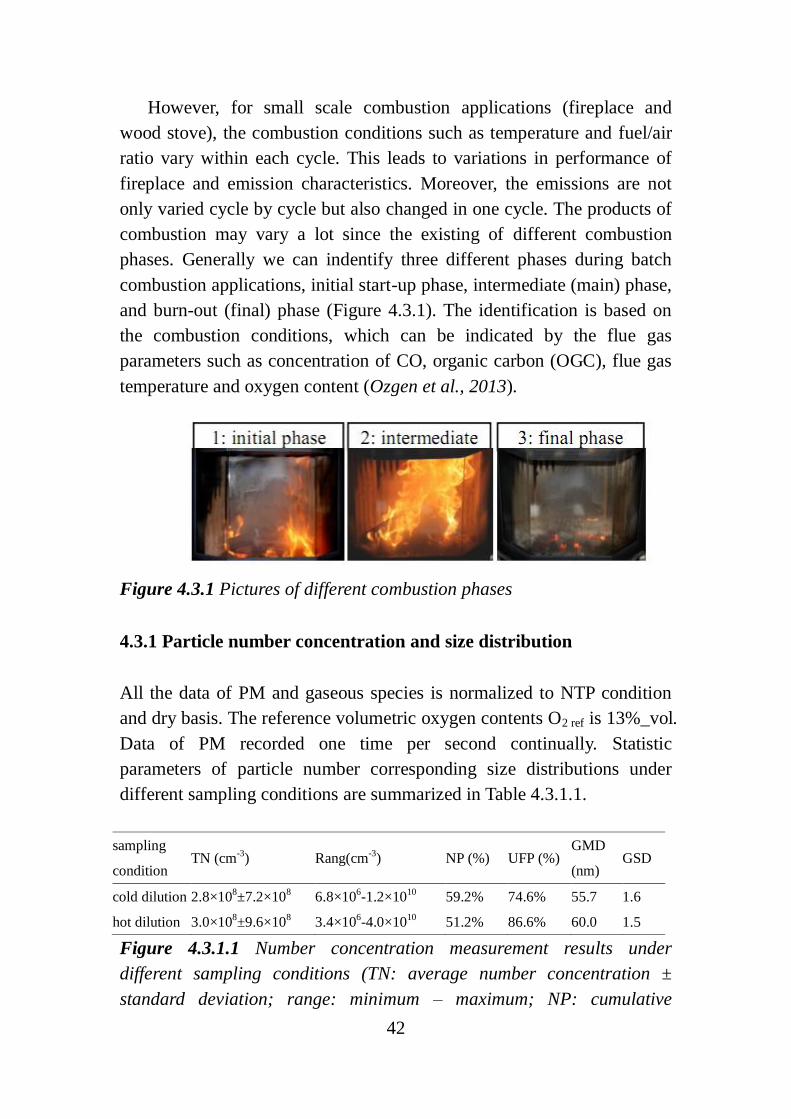
However, for small scale combustion applications (fireplace and
wood stove), the combustion conditions such as temperature and fuel/air
ratio vary within each cycle. This leads to variations in performance of
fireplace and emission characteristics. Moreover, the emissions are not
only varied cycle by cycle but also changed in one cycle. The products of
combustion may vary a lot since the existing of different combustion
phases. Generally we can indentify three different phases during batch
combustion applications, initial start-up phase, intermediate (main) phase,
and burn-out (final) phase (Figure 4.3.1). The identification is based on
the combustion conditions, which can be indicated by the flue gas
parameters such as concentration of CO, organic carbon (OGC), flue gas
temperature and oxygen content (Ozgen et al., 2013).
Figure 4.3.1 Pictures of different combustion phases
4.3.1 Particle number concentration and size distribution
All the data of PM and gaseous species is normalized to NTP condition
and dry basis. The reference volumetric oxygen contents O2 ref is 13%_vol.
Data of PM recorded one time per second continually. Statistic
parameters of particle number corresponding size distributions under
different sampling conditions are summarized in Table 4.3.1.1.
sampling
condition TN (cm
-3) Rang(cm
-3) NP (%) UFP (%)
GMD
(nm) GSD
cold dilution 2.8×10⁸±7.2×10
8 6.8×10
6-1.2×10
10 59.2% 74.6% 55.7 1.6
hot dilution 3.0×10⁸±9.6×10
8 3.4×10
6-4.0×10
10 51.2% 86.6% 60.0 1.5
Figure 4.3.1.1 Number concentration measurement results under
different sampling conditions (TN: average number concentration ±
standard deviation; range: minimum – maximum; NP: cumulative

43
fraction of nanoparticles; UFP: cumulative fraction of ultrafine particles;
GMD: geometric mean diameter; GSD: geometric standard deviation).
The results of hot dilution sampling presented the average values of
TN around 2.8×108 cm
-3 with standard deviation around 7.2×10
8 cm
-3. NP
accounted for 59.2% while the UFP accounted for 74.6%. The cold
dilution sampling presented the average value of TN around 3.0×108 cm
-3
with standard deviation around 9.6×108 cm
-3. NP accounted for 51.2%
while the UFP accounted for 86.6%.
Mann-Whitney U tests were applied to investigate the statistical
significance of the variation in NP number concentrations caused by
dilution condition. The calculation results suggested that the statistical
difference between fractions of NP is not significant (Mann-Whitney U=
18, p-value=0.289). When the flue gas first diluted preliminary in the
dilution channel, the sampling was already cooled and gas-particle
conversion took place. After enough residence time, the new formed
particles stabilized in the flue gas, and there is a limitation for nucleation
or condensation of volatile organic species in further dilution.
The median particle size distribution dN/dDp (cm-3
nm-1
) was studied
of the two different samplings. The figure 4.3.1.1 showing that there was
not significant size distribution between these two different types of
samplings. The dominant size range of total particles was located in the
first nanoparticle size range. The GMD of hot sampling was 60.0 nm
while the GMD of cold sampling decreased to 55.7 nm. The cold
sampling emitted finer particles than hot sampling.
Figure 4.3.1.2 Normalized median size distribution of different samplings
44
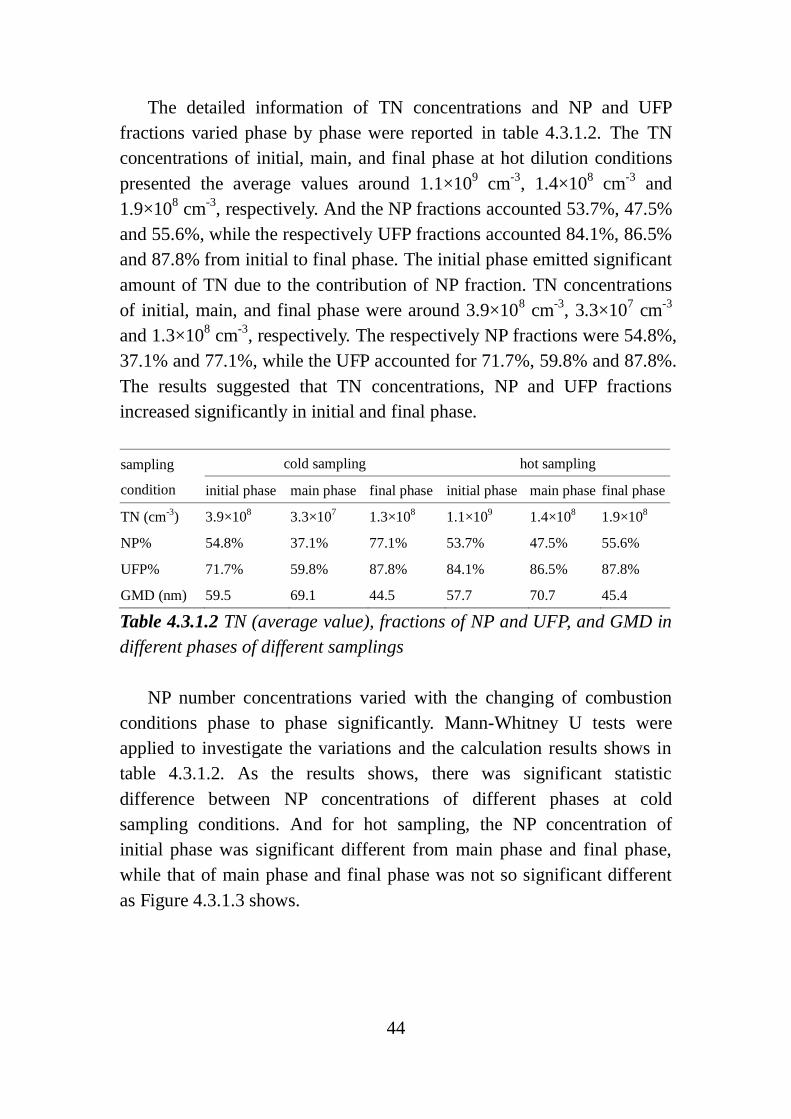
The detailed information of TN concentrations and NP and UFP
fractions varied phase by phase were reported in table 4.3.1.2. The TN
concentrations of initial, main, and final phase at hot dilution conditions
presented the average values around 1.1×109 cm
-3, 1.4×10
8 cm
-3 and
1.9×108 cm
-3, respectively. And the NP fractions accounted 53.7%, 47.5%
and 55.6%, while the respectively UFP fractions accounted 84.1%, 86.5%
and 87.8% from initial to final phase. The initial phase emitted significant
amount of TN due to the contribution of NP fraction. TN concentrations
of initial, main, and final phase were around 3.9×108 cm
-3, 3.3×10
7 cm
-3
and 1.3×108 cm
-3, respectively. The respectively NP fractions were 54.8%,
37.1% and 77.1%, while the UFP accounted for 71.7%, 59.8% and 87.8%.
The results suggested that TN concentrations, NP and UFP fractions
increased significantly in initial and final phase.
sampling
condition
cold sampling hot sampling
initial phase main phase final phase initial phase main phase final phase
TN (cm-3
) 3.9×10⁸ 3.3×10
7 1.3×10
8 1.1×10
9 1.4×10
8 1.9×10
8
NP% 54.8% 37.1% 77.1% 53.7% 47.5% 55.6%
UFP% 71.7% 59.8% 87.8% 84.1% 86.5% 87.8%
GMD (nm) 59.5 69.1 44.5 57.7 70.7 45.4
Table 4.3.1.2 TN (average value), fractions of NP and UFP, and GMD in
different phases of different samplings
NP number concentrations varied with the changing of combustion
conditions phase to phase significantly. Mann-Whitney U tests were
applied to investigate the variations and the calculation results shows in
table 4.3.1.2. As the results shows, there was significant statistic
difference between NP concentrations of different phases at cold
sampling conditions. And for hot sampling, the NP concentration of
initial phase was significant different from main phase and final phase,
while that of main phase and final phase was not so significant different
as Figure 4.3.1.3 shows.

45
sampling phase Mann-Whitney U p-value
hot sampling
initial-main 9.1×10⁷ <0.001
initial-final 6.4×10⁶ <0.001
main-final 2.6×10⁷ 0.145
cold sampling
initial-main 2.1×10⁷ <0.001
initial-final 2.7×10⁷ <0.001
main-final 5.2×10⁷ <0.001
Table 4.3.1.3 Results of Mann-Whitney U tests on NP concentration
Figure 4.3.1.3 Box plots of different combustion phases of cold and hot
samplings of NP concentration
The median size distribution dN/dDp in different phases of cold
sampling was different and are shown in figure 4.3.1.4. All the peaks of
number concentrations were located in the first nanoparticle size range,
and more nanoparticles emitted in initial and final phase. The GMD of
initial phase was 59.5 nm, which increased to 69.1 nm in main phase, and
decreased to 44.5 nm in final phase. The results suggested that finer
particles formed in initial and final phase during cold diluting.

46
Figure 4.3.1.4 Median size distribution dN/dDp in different phases of
cold sampling
4.3.2 Gaseous emissions and correlation with NP
The values of regulated flue gas parameters such as CO2, CH4, CO,
NMHC and dust were measured in real time with the time resolution 5
seconds. All the data was normalized to NTP condition in dry basis, and
the reference oxygen content is 11%_vol. Other relevant operation
parameters measured such as O2, ambient air temperature (Tamb), exhaust
gas temperature (Texh gas) and dilution tunnel temperature (Ttunnel) in actual
conditions were measured as well and are reported in table 4.3.2.1.
The two FID analyzers used in the experiments give different results
of hydrocarbon concentrations because of different technology applied.
After comparison of two groups of data, the catalytic analyzer equipped
in the dilution tunnel was selected in this study.
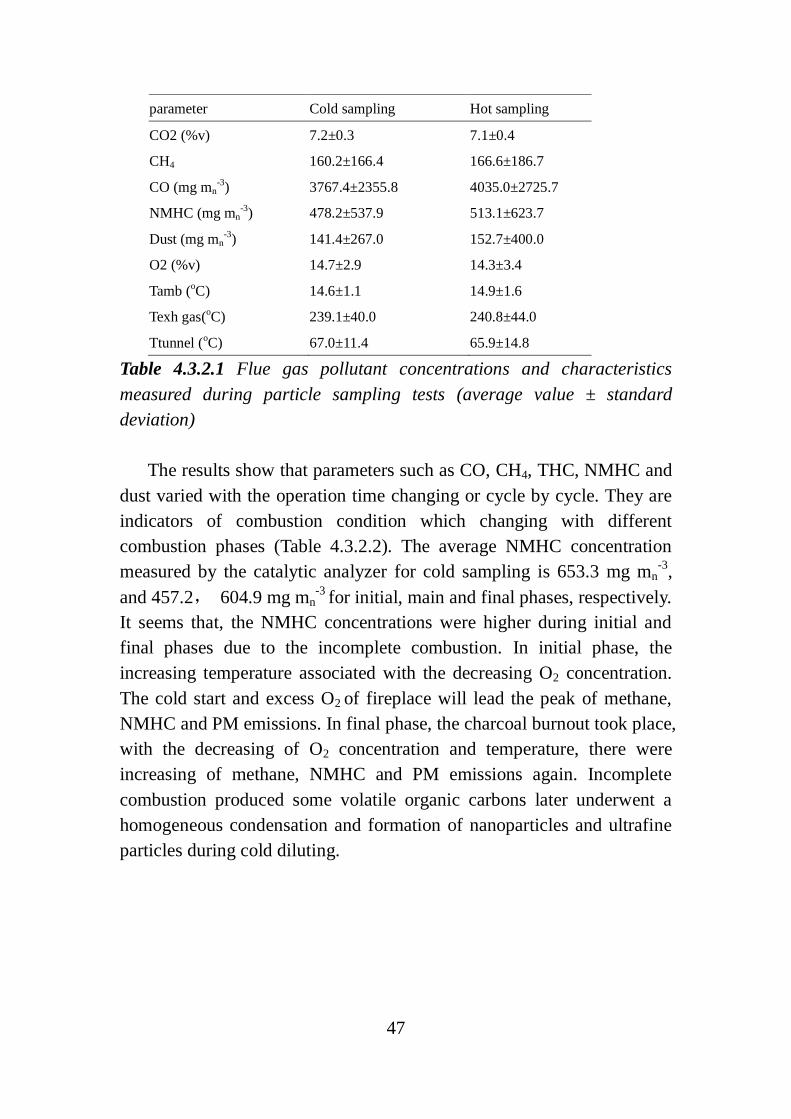
47
parameter Cold sampling Hot sampling
CO2 (%v) 7.2±0.3 7.1±0.4
CH4 160.2±166.4 166.6±186.7
CO (mg mn-3
) 3767.4±2355.8 4035.0±2725.7
NMHC (mg mn-3
) 478.2±537.9 513.1±623.7
Dust (mg mn-3
) 141.4±267.0 152.7±400.0
O2 (%v) 14.7±2.9 14.3±3.4
Tamb (oC) 14.6±1.1 14.9±1.6
Texh gas(oC) 239.1±40.0 240.8±44.0
Ttunnel (oC) 67.0±11.4 65.9±14.8
Table 4.3.2.1 Flue gas pollutant concentrations and characteristics
measured during particle sampling tests (average value ± standard
deviation)
The results show that parameters such as CO, CH4, THC, NMHC and
dust varied with the operation time changing or cycle by cycle. They are
indicators of combustion condition which changing with different
combustion phases (Table 4.3.2.2). The average NMHC concentration
measured by the catalytic analyzer for cold sampling is 653.3 mg mn-3
,
and 457.2, 604.9 mg mn-3
for initial, main and final phases, respectively.
It seems that, the NMHC concentrations were higher during initial and
final phases due to the incomplete combustion. In initial phase, the
increasing temperature associated with the decreasing O2 concentration.
The cold start and excess O2 of fireplace will lead the peak of methane,
NMHC and PM emissions. In final phase, the charcoal burnout took place,
with the decreasing of O2 concentration and temperature, there were
increasing of methane, NMHC and PM emissions again. Incomplete
combustion produced some volatile organic carbons later underwent a
homogeneous condensation and formation of nanoparticles and ultrafine
particles during cold diluting.

48
sampling cold sampling hot sampling
parameter initial phase main phase final phase initial phase main phase final phase
CH4 (mg mn-3
) 167.3 155.8 196.6 155.6 102.7 249.2
CO (mg mn-3
) 4394.3 3159.6 5688.1 4910.0 2677.9 4899.6
THC (mg mn-3
) 816.2 605.1 800.4 919.4 425.3 833.7
NMHC (mg mn-3
) 653.3 457.2 604.9 769.9 322.6 584.5
DUST (mg mn-3
) 409.9 100.8 173.5 362.8 46.3 189.0
Table 4.3.2.2 Average values of emission parameters in different phases.
A typical cold dilution sampling test was selected when the
concentration of NP number and NMHC mass concentration were
showed together in figure 4.3.2.1. Dynamic variations of NP
concentration and NMHC mass concentration can be easily found during
the burning process phase by phase. Both NP and NMHC concentrations
had the same tendency, which increased in initial phase then decreased
and became relative stable in main phase, at final phase increased again.
It proved that, the combustion characteristics will significantly influence
the characters of PM.
Figure 4.3.2.2 NMHC mass concentration, NP number concentration
change with operation time
0.0E+00
1.0E+07
2.0E+07
3.0E+07
4.0E+07
5.0E+07
6.0E+07
7.0E+07
0
200
400
600
800
1000
1200
1400
1600
1800
2000
0 500 1000 1500 2000 2500 3000
NP
co
nce
ntr
atio
n (
cm-3
)
NM
HC
mas
s co
nce
ntr
atio
n (
mg
mn
-3)
Operation time (s)
NMHC
NP
Initial main final

49
Person’s rank correlation was applied to assess the dependence
between the number concentration of NP and corresponding mass
concentration of NMHC. The different levels of dependence among
different size ranges, and it varied phase by phase of the cold sampling
(Figure 4.3.3.3). Among all the phases the coarser particles had the less or
no correlation with NMHC, and finer particles had more correlation with
NMHC, especially NP fractions. There are strong correlations between
NP fraction and NMHC concentration in all the combustion phases
(rho=0.788,p< 0.01).
Figure 4.3.2.3 Person’s rho with different phases
Generally, in initial phase, there will be a peak of NMHC emission as
figure 4.3.2.3 showing, then it goes down in main phase and at last an
increasing again in final phase. The big mass concentration may cause a
bigger saturation ratio of NMHC leads to homogenous and heterogeneous
condensation of NMHC contributes to nanoparticle and ultrafine particle
fractions. In main phase the combustion was complete and stable, more
complete combustion products emitted instead of incomplete products
(NMHC, methane, etc.), then smaller amount of NMHC associated with
the coarser particles. In final phase, emission of NMHC increased again,
finer size particles formed again due to the condensation of NMHC.
Pearson’s rho coefficients suggested that during all the phases, there
were strong correlations between NP and NMHC, UFP and NMHC
0.00
0.10
0.20
0.30
0.40
0.50
0.60
0.70
0.80
0.90
1 10 100 1000 10000
Pea
rso
n's
rh
o
Particle diameter (nm)
initial
main
final

50
respectively (Table 4.3.2.3), and the highest correlations between NP,
UFP and NMHC achieved in final phase. Average GMD of initial phase
was 59.5 nm then increased to 69.1 nm in main phase. GMD of final
phase was 44.5 nm, and the finest size suggesting that homogeneous
condensation process of NMHC released in final phase associated with
the NP formation. Coarser particles emitted in main phase may due to
better combustion conditions and less NMHC emissions. Generally
speaking, secondary particle formation was associated with the emission
of NMHC by both homogeneous and heterogeneous condensations.
Phase Pearson rho_NP Person rho_UFP
cold_initial 0.78 0.77
cold_main 0.68 0.74
cold_final 0.79 0.80
Table 4.3.2.3 Person’s rho of NP and UFP during different phases of cold
sampling
4.4 Comparison of different appliances
Different characteristics of particles emission characters of the three
different typical applications were summarized in table 4.4.1. For large
scale power plant, there could be a significant big faction of NP around
90% and more than 99% of TN was UFP. The average GMD was less
than 30 nm and located in nanoparticle size range. The average TN
concentration measured was in the order around 106.
For pellet boiler, the average TN was in the order around 108, and the
NP fraction was around from 18% to 28% with the increasing dilution
ratio, and the UFP fraction was around 93% when it sampled under
nominal load operation. There was a significant reduction of NP and UFP
fractions when the load of boiler reduced from 100% to 30%. The
average GMD was around 81 nm for nominal load condition and
increased to 175 nm when load reduced to 30%.
The combustion condition of fireplace was not continuous, so the NP
and UFP fractions were changing phase to phase. The average value of
NP fraction was more than 59% and more than 75% was UFP. TN was in
the order of 108, with the average GMD 56 nm.
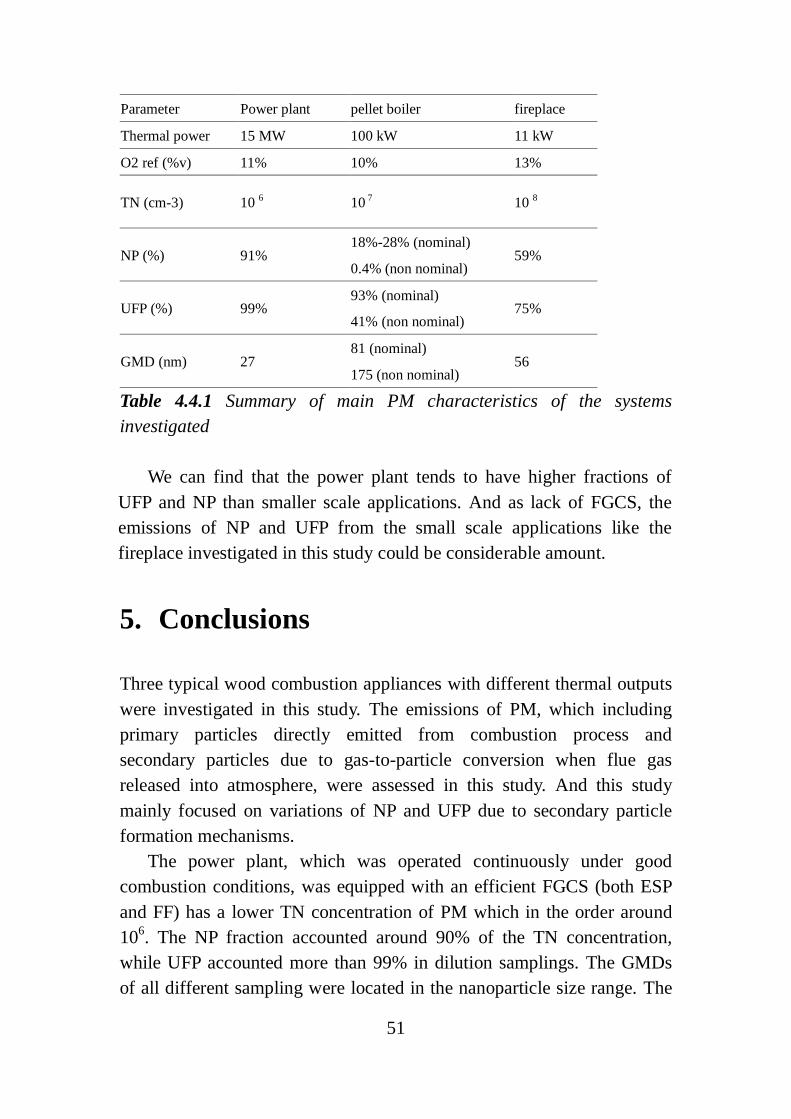
51
Parameter Power plant pellet boiler fireplace
Thermal power 15 MW 100 kW 11 kW
O2 ref (%v) 11% 10% 13%
TN (cm-3) 10 6 10
7 10
8
NP (%) 91% 18%-28% (nominal)
59% 0.4% (non nominal)
UFP (%) 99% 93% (nominal)
75% 41% (non nominal)
GMD (nm) 27 81 (nominal)
56 175 (non nominal)
Table 4.4.1 Summary of main PM characteristics of the systems
investigated
We can find that the power plant tends to have higher fractions of
UFP and NP than smaller scale applications. And as lack of FGCS, the
emissions of NP and UFP from the small scale applications like the
fireplace investigated in this study could be considerable amount.
5. Conclusions
Three typical wood combustion appliances with different thermal outputs
were investigated in this study. The emissions of PM, which including
primary particles directly emitted from combustion process and
secondary particles due to gas-to-particle conversion when flue gas
released into atmosphere, were assessed in this study. And this study
mainly focused on variations of NP and UFP due to secondary particle
formation mechanisms.
The power plant, which was operated continuously under good
combustion conditions, was equipped with an efficient FGCS (both ESP
and FF) has a lower TN concentration of PM which in the order around
106. The NP fraction accounted around 90% of the TN concentration,
while UFP accounted more than 99% in dilution samplings. The GMDs
of all different sampling were located in the nanoparticle size range. The
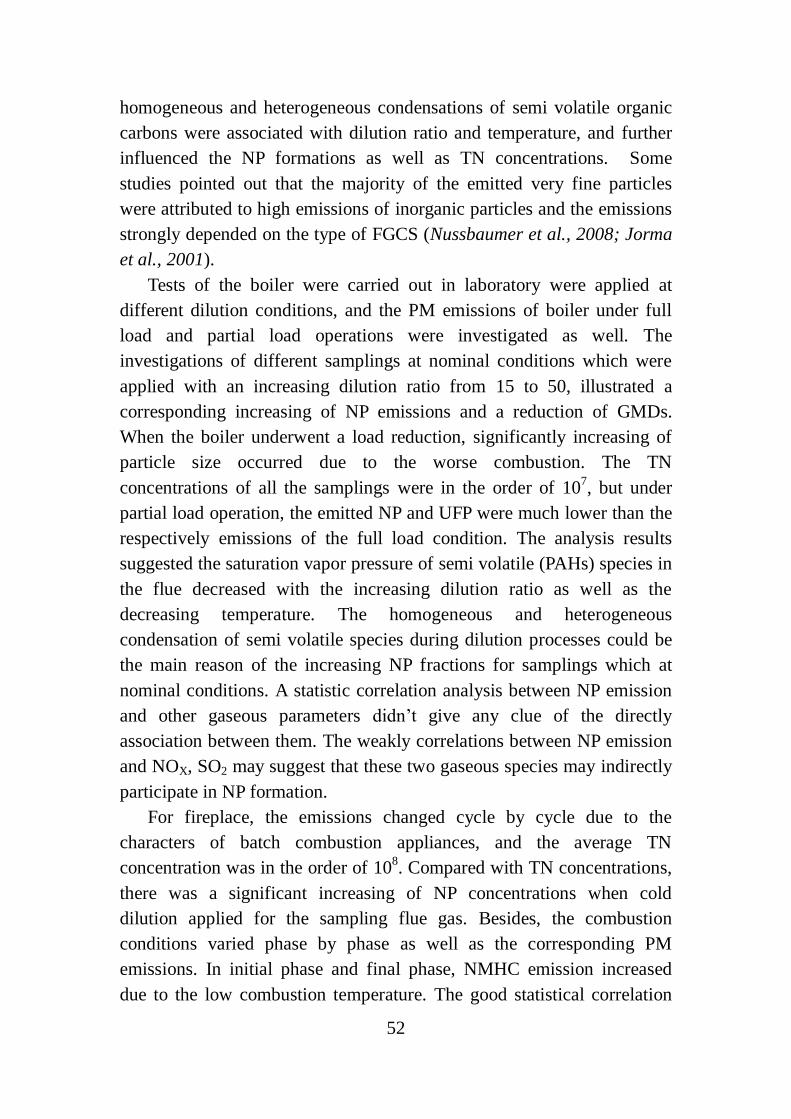
52
homogeneous and heterogeneous condensations of semi volatile organic
carbons were associated with dilution ratio and temperature, and further
influenced the NP formations as well as TN concentrations. Some
studies pointed out that the majority of the emitted very fine particles
were attributed to high emissions of inorganic particles and the emissions
strongly depended on the type of FGCS (Nussbaumer et al., 2008; Jorma
et al., 2001).
Tests of the boiler were carried out in laboratory were applied at
different dilution conditions, and the PM emissions of boiler under full
load and partial load operations were investigated as well. The
investigations of different samplings at nominal conditions which were
applied with an increasing dilution ratio from 15 to 50, illustrated a
corresponding increasing of NP emissions and a reduction of GMDs.
When the boiler underwent a load reduction, significantly increasing of
particle size occurred due to the worse combustion. The TN
concentrations of all the samplings were in the order of 107, but under
partial load operation, the emitted NP and UFP were much lower than the
respectively emissions of the full load condition. The analysis results
suggested the saturation vapor pressure of semi volatile (PAHs) species in
the flue decreased with the increasing dilution ratio as well as the
decreasing temperature. The homogeneous and heterogeneous
condensation of semi volatile species during dilution processes could be
the main reason of the increasing NP fractions for samplings which at
nominal conditions. A statistic correlation analysis between NP emission
and other gaseous parameters didn’t give any clue of the directly
association between them. The weakly correlations between NP emission
and NOX, SO2 may suggest that these two gaseous species may indirectly
participate in NP formation.
For fireplace, the emissions changed cycle by cycle due to the
characters of batch combustion appliances, and the average TN
concentration was in the order of 108. Compared with TN concentrations,
there was a significant increasing of NP concentrations when cold
dilution applied for the sampling flue gas. Besides, the combustion
conditions varied phase by phase as well as the corresponding PM
emissions. In initial phase and final phase, NMHC emission increased
due to the low combustion temperature. The good statistical correlation
53
Pearson’s rho coefficients suggests that the homogeneous and
heterogeneous condensation of NMHC contributed to the formation of
NP and UFP fractions. What’s more, the NP emissions of initial phase
were significantly higher than other phases, especially big amount of
emission will occur due to cold start.
There were big variances of PM and other gaseous emissions between
different scales of applications, which due to the applied combustion
techniques, fuel feeding systems, operation principle, flue gas cleaning
systems, fuel quality, etc. The proper primary and secondary measures
should be adopted for the combustion systems.
The main factors which determine PM emissions are the local
emission standards, and the advanced particle removal devices such as
ESP and FF can be effective to move the primary particles. Excessive PM
emissions were found in wood boilers operated without heat storage tank.
Heat storage tank installation could be a useful way to avoid the high PM
emissions due to partial load operation (Nussbaumer et al., 2008). The
advanced control system which could optimize the adjustment of fuel/air
ratio and load demand simultaneously is effective to reduce PM
formation. The emissions of fireplace were significant compared with
larger scale appliances. The performances of initial and final phases of
fireplace should be paid more attention, especially the worst initial phase.
Besides the well designs of combustion chamber and air supply, the
proper training of users is necessary. There is study suggests that ignition
of the wood from the top end instead of the traditional method that
ignition of the wood from the bottom, enable better combustion during
the whole batch (Nussbaumer et al., 2008).
In this study, different dilution ratios were applied to investigate the
very fine secondary particles formation during flue gas plume and
released into atmosphere. However, in real world, the processes of PM
formation, diffusion, transportation and further conversion take place in
the atmosphere, so it is very hard to get more detailed information of the
complex NP and UFP formation processes. And the aged flue gas is
different from newly flue gas on physical properties and chemical
properties. More deep study and advanced measuring technologies are
needed for future study in this field.
Now we already know why we should control finer particles

54
emissions, but how to regulate the emission is still a question. And the
application of effective measurements and methods to reduce the
emissions is a challenge with the growing use of biomass in near future.
Especially, the small scale domestic heating applications are unregular
fed manually and there are fluctuations in combustion process. The
complete combustion should be obtained to reduce the possibilities for
the condensation of the NHMC.
55
References
Braun-Fahrländer, C. Health effects of aerosols: What is the
epidemiological evidence? Aerosols from Biomass Combustion,
International Energy Agency and Swiss Federal Office of Energy (2001),
Zurich, Verenum press Zurich, ISBN 3-908705-00-2,pp. 11-18.
Brook, R.D.; Franklin, B.; Cascio, W.; Hong, Y.; Howard, G.; Lipsett, M.;
Luepker, R.; Mittleman, M.; Samet, J.; Smith, S.C.; Tager, I. Air Pollution
and Cardiovascular Disease: A Statement for Healthcare Professionals
From the Expert Panel on Population and Prevention Science of the
American Heart Association. Circulation 2004, 109, 2655-2671.
Cernuschi, S.; Consonni, S; Giugliano, M. Emissions of Fine and
Ultrafine Particles from stationary combustion plants, Final Summary.
Ultrafine Particles from Combustion Processes , 26 October 2010.
Cernuschi, S.; Giugliano, M.; Lonati, G.; Ozgen, S.; Ripamonti, G.;
Tardivo, R.; Consonni, S., 2009. Emissions of ultrafine and nanoparticles
from WTE (waste to energy) plants.
Demirbas, A. Combustion Characteristics of Different Biomass Fuels,
Progress in Energy and Combustion Science (2004), 30, pp. 219-230
Demirbas, A. Potential applications of renewable energy sources, biomass
combustion problems in boiler power systems and combustion related
environmental issues. Progress in Energy and Combustion Science (2005),
31,171-192.
Dockery, D.W.; Pope, C.A.; Xu, X.; Spengler, J.D.; Ware, J.H.; Fy, M.E.;
Ferris, B.G.; Speizer, F.E An association between air pollution and
mortality in six US cities. The Newing England Journal of
Medicine(1993), 329 (24), 1753-1759.
EPA: What is PM: www.epa.gov/NE/airquality/pm-what-is.html, 2008.
56
Gaeguaf, C.; Wieser, U. Biomass Burner with Low Emissions of
Particulates. Biomass for Energy and Industry. 10th
European Conference
and Technology Exhibition, June 8-11, 1998, Wurzburg, Germany.
Ghafghazi, S.; Sowlati, T.; Sokhansanj, S.; Bi, X.; Melin, S. Particulate
matter emissions from combustion of wood in district heating
applications. Renewable and Sustainable Energy Reviews (2011), 15,,
3019-3028.
Hasler, P.; Nussbaumer, T. Gas cleaning for IC engine applications from
fixed bed biomass gasificaion. Biomass and Bioenergy (1999), 16,
385-395.
IPCC (2007) Climate Change 2007: The Physical Science Basis,
Intergovernmental panel on climate change. Cambrige, U.K., Cambridge
University Press.
Jiao, J.; Zheng , Y. A multi-region model for determining the cyclone
efficiency. Separation and Purification Technology (2007). 53:266-273.
Johansson, L.; Tullin, C.; Leckner, B. Particulate emissions from
small-scale biomass combustion, Seminar on aerosols from biomass
combustion. Proceedings, Zurich, June 27, 2001.
Jokiniemi, J. K.; Lind, T.; Hokkinen, J. Modelling and experimental
results on aerosol formation, deposition and emissions in fluidized bed
combustion of biomass. Seminar on aerosols from biomass combustion,
Proceedings, Zurich, June 27, 2001.
Kennedy, I.M. The health effects of combustion generated aerosols.
Proceedings of the Combustion Institute (2007). 31, 2757-2770.
Koppmann, R.; von Czapiewski, K.; Reid, J.S. A review of biomass
burning emissions, part I: gaseous emissions of carbon monoxide,
methane, volatile organic compounds, and nitrogen containing
57
compounds. Atmospheric Chemistry and Physics Discussions (2005), 5,
10455-10516.
Kreidenweis, S.M.; Remer, L.A.; Bruintjes, R., Dubovik, O. Smoke
aerosol from biomass burning in Mexico: Hygroscopic smoke model, J.
Geophys. Res.(2001), 106, 4831-4844.
Lighty, J.S.; Veranth, J.; Sarofim, A. Combustion aerosols: Factors
governing their size and composition and implications to human health.
Journal of the Air & Waste Management Association (2000), 50,
1565-1618.
Liank, W.P.; Wendt, J.O.L., Toxic metals emissions from incinerators:
Mechanism and control. Prog. Energy Combust (1993). Sci. Vol. 19.
Maguhn, J.; Karg, E.; Kettrup, A.; Zimmermann, R. On-line analysis of
the size distribution of fine and ultrafine aerosol particles in flue and
stack gas of a municipal waste incineration plant: effect of dynamic
process control measures and emission reduction devices. Environ Sci
Technol (2003), 37, 4761-4770.
Nussbaumer, T., 2001. Relevance of aerosols for the air quality in
Swizerland. Aerosols from biomass combustion, International Seminar at
27 June 2001 in Zurich by IEA bioenergy Task 32 and Swiss Federal
Office of Energy, Verenum, Zurich. ISBN: 3-908705-00-2.
Nussbaumer, T., Aerosols from biomass combustion—overview on
activities in IEA Bioenergy Task 32. Proceedings of the 12the European
Biomass Conference 2002. Biomass for Energy, Industry and Climate
Protection, Amsterdam, The Nertherlands , vol. 2, pp. 917-921.
Nussbaumer, T. Combustion and co-combustion of biomass:
fundamentals, technologies, and primary measures for emission reduction.
Energy & Fuels (2003), 17:1510-1521.
Nussbaumer, T.; Czasch, C.; Klippel, N.; Johansson, L.; Tullin, C.

58
Particulate Emissions from Biomass Combustion in IEA Countries:
Survey on Measurements and Emission Factors, International Energy
Agency (IEA) Bioenergy Task 32 and Swiss Federal Office of Energy
(SFOE), Zurich, 2008, ISBN 3-908705-18-5 , www.ieabcc.nl,
www.verenum.ch.
Ostro, B.; Lipsett, M. & Das, R. Particulate matter and asthma: a
quantitative assessment of the current evidence. Appl Occup Environ Hyg
(1998), 13/6, 453460.
Ozgen, S.; Cernuschi, S.; Giugliano, M.; Lonati, G. Ultrafine and
nanoparticle emissions from residential-scale heating appliances. 14th
ETH-Conference on Combustion Generated Nanoparticles, 1-4 August
2010 Zurich, Switzerland.
Ozgen, S.; Cernuschi, S.; Giugliano, M.; Signorini, S. Nanoparticle
emissions from a woody biomass power plant (15MW). 20th European
Biomass Conference and Exhibition, 18-22 June 2012, Milan, Italy.
Ozgen, S.; Hugony, F.; Morreale, C.; Signorini, S.; Cernuschi, S.;
Maggioni, A.; Migliavacca, G.; Marengo, S.; Giugliano, M. Nanoparticle
and non methane hydrocarbon emissions from a modern closed fireplace.
20th European Biomass Conference and Exhibition, 18-22 June, Milan,
Italy.
Ozgen, S.; Cernuschi, S.; Giugliano, M. Experimental evaluation of
particle number emissions from wood combustion in a closed fireplace.
Original Research Article Biomass and Bioenergy (2013), Volume 50,
March 2013, 65-74.
Peters. A.; Wichmann, H.E; Tuch, T.; Heinrich, J. & Heyder, J.
Respiratory effects are associated with the number of ultrafine particles.
Am J Respir Crit Care Med (1997), 155, 1376-1383.
Pope, C.A., 3rd, Bates, D.V. & Raizenne, M.E. Health effects of
particulate air pollution: time for reassessment? Environ Health Perspect

59
(1995), 103, 472-480.
Reid, J.S.; Koppmann, R.; Eck, T.F.; Eleuterio, D.P. A review of biomass
burning emissions part II: intensive physical properties of biomass
burning particles. Atoms. Chem. Phys. (2005), 799-835.
Reid, J.S.; Hobbs, P.V.; Ferek, R.J., Blake, D.R.; Martins, J.V.; Dunlap,
M.R.; Liousse, C. Physical, chemical and optical properties of regional
hazes dominated by smoke in Brazil, J. Geophys. Res.(1998), 103,
32059-32080.
Samet, J.; Zeger, S.; Kelsall, J. & Xu, J. Particulate air pollution and
mortality: the particle epidemiology evaluation project. Appl Occup
Environ Hyg (1998), 13/6. 364-369.
Schwartz, J. Air pollution and daily mortality: a review and meta analysis.
Envrion Respecially (1994), 64, 36-52.
Shindell, D.; Faluvegi, G. Climate response to regional radiative forcing
during the twentieth century. Nature Geosci (2009), 2, 294-300.
Tejima, H.; Nakagawa, I.; Shinoda, T.; Maeda, I. PCDDs/PCDFs
reduction by good combustion technology and fabric filter with/without
activated carbon injection. Chemosphere (1996), 32, 169-175.
Tissari, J.; Hytonen, K.; Sippula, O.; Jokiniemi, J. The effects of
operating conditions on emissions from masonry heaters and sauna stoves.
Biomass Bioenergy (2009), 33, 513-520.
US EPA Conditional Test Method (CTM) 039 measurement of PM2.5 and
PM10 emissions by dilution sampling (constant sampling rate
procedures). CTM-039, July, 2004.
Van Loo, S.; Koppejan, J. The handbook of biomass combustion and
co-firing (2008). London, Sterling, VA: Earthscan, 2008.

60
Wagner, D.; Hasler, P. Kleinschnizelfeuerung mit optimiertem
Verbrennungskonzept und Kompaktwarmetauscher. 4.
Holzenergie-Symposium, 16.10.00, Bundesamt fur Energie, 2000,
103-122.
Wehinger, F.; Kob, S. Pyrot: Automatische Holzfeuerung mit
Rotationsgeblase. 4. Holzenergie-Symposium, 16.10.00, Bundesamt fur
Energie, 2000, 123-138.
Werkelin, J.; Skrifvars, B.; Hupa, M. Ash-forming elements in four
Scandinavian wood species. Part 1:Summer harvest. Biomass and
Bioenergy (2005), 29, 451-466.
Wichmann, H.E.; Peters, A. Epidemiological evidence of the effects of
ultrafine particle exposure. In Ultrafine Particles in the Atmosphere
(2003), Brown LM, Collings N, Harrison RM, Maynard AD, Maynard RL
(eds.), Imperial College Press, London, p. 247.
Yinon, L.; Themelis, N.J.; McNeill, V.F. Ultrafine particles from WTE
and other combustion sources. Proceedings of the 18the Annual North
American Waste-to-Energy Conference. Orlandao, USA, 2010.