ukraine slide package for a foreign investor - utu slide... · ukraine slide package for a foreign...
TRANSCRIPT
Ukraine slide package for a foreign investor
Elisa AroAugust 2015
www.utu.fi/pei
Contents
1. General information 3
2. Economic development 11
3. Political scene 18
4. Prosperity and consumption 22
5. External economic relations 27
6. Additional information 33
The information in this document is complied from a variety of sources.The Pan-European Institute assumes no responsibility for the completeness or accuracy of the information.
3
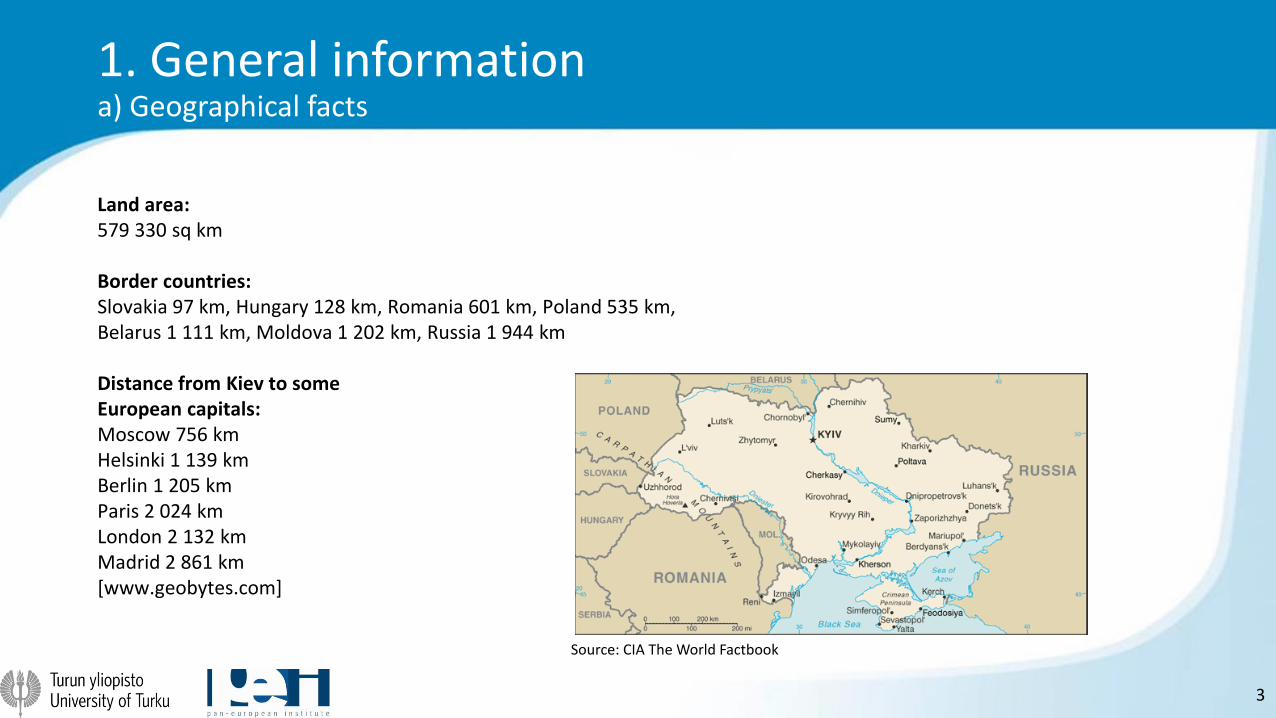
Source: CIA The World Factbook
1. General informationa) Geographical facts
Land area:579 330 sq km
Border countries:Slovakia 97 km, Hungary 128 km, Romania 601 km, Poland 535 km, Belarus 1 111 km, Moldova 1 202 km, Russia 1 944 km
Distance from Kiev to someEuropean capitals:Moscow 756 kmHelsinki 1 139 kmBerlin 1 205 kmParis 2 024 kmLondon 2 132 kmMadrid 2 861 km [www.geobytes.com]
4
1. General informationb) Administrative divisions and territorial constitution
•24 Provinces (”oblasts” in Ukrainian):
Cherkasy, Chernihiv, Chernivtsi, Dnipropetrovsk, Donetsk, Ivano-Frankivsk, Kharkiv, Kherson, Khmelnytskiy, Kyiv, Kirovohrad, Luhansk, Lviv, Mykolayiv, Odesa, Poltava, Rivne, Sumy, Ternopil, Vinnytsya, Volyn, Zakarpattya, Zaporizhya, Zhytomyr
•1 Autonomous Republic:
Autonomous Republic of Crimea
• 2 Municipalities:
City of Kyiv, City of Sevastopol
Note: The status of the Autonomous Republic of Crimea and the municipality of Sevastopol in Ukraine remain unclear due to the current political situation. Plenty of countries do not recognize Russia's annexation of Ukraine's Autonomous Republic of Crimea and the municipality of Sevastopol nor their redesignation as the Republic of Crimea and the Federal City of Sevastopol.
Sources: CIA The World Factbook; State Statistics Service of Ukraine
5
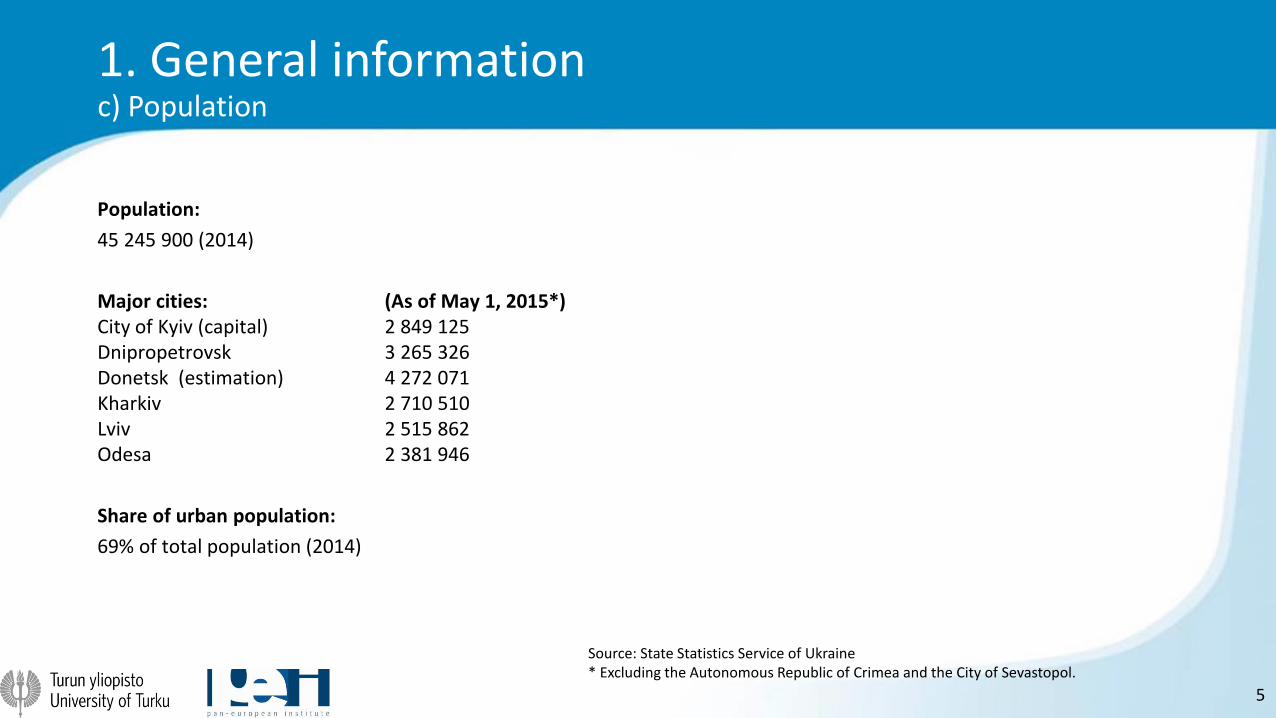
1. General informationc) Population
Population:
45 245 900 (2014)
Major cities: (As of May 1, 2015*)City of Kyiv (capital) 2 849 125Dnipropetrovsk 3 265 326Donetsk (estimation) 4 272 071Kharkiv 2 710 510Lviv 2 515 862Odesa 2 381 946
Share of urban population:
69% of total population (2014)
Source: State Statistics Service of Ukraine* Excluding the Autonomous Republic of Crimea and the City of Sevastopol.
6
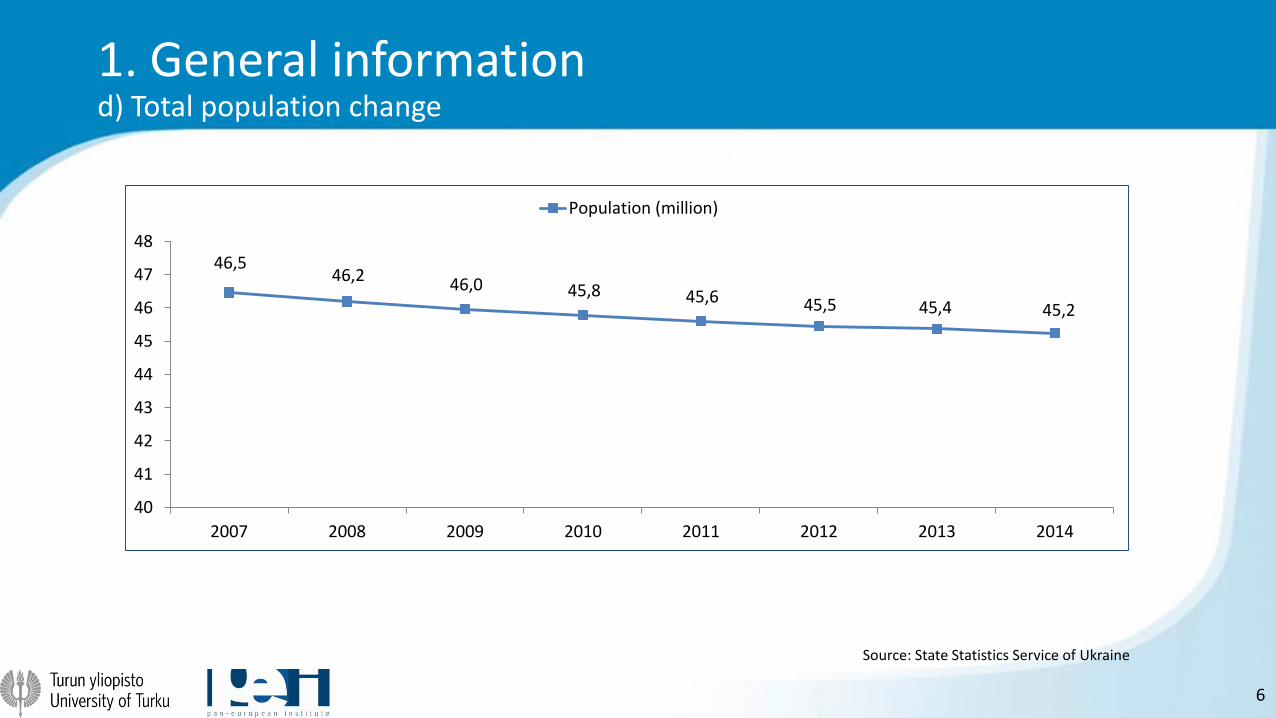
1. General informationd) Total population change
Source: State Statistics Service of Ukraine
46,546,2 46,0 45,8 45,6 45,5 45,4 45,2
40
41
42
43
44
45
46
47
48
2007 2008 2009 2010 2011 2012 2013 2014
Population (million)
7
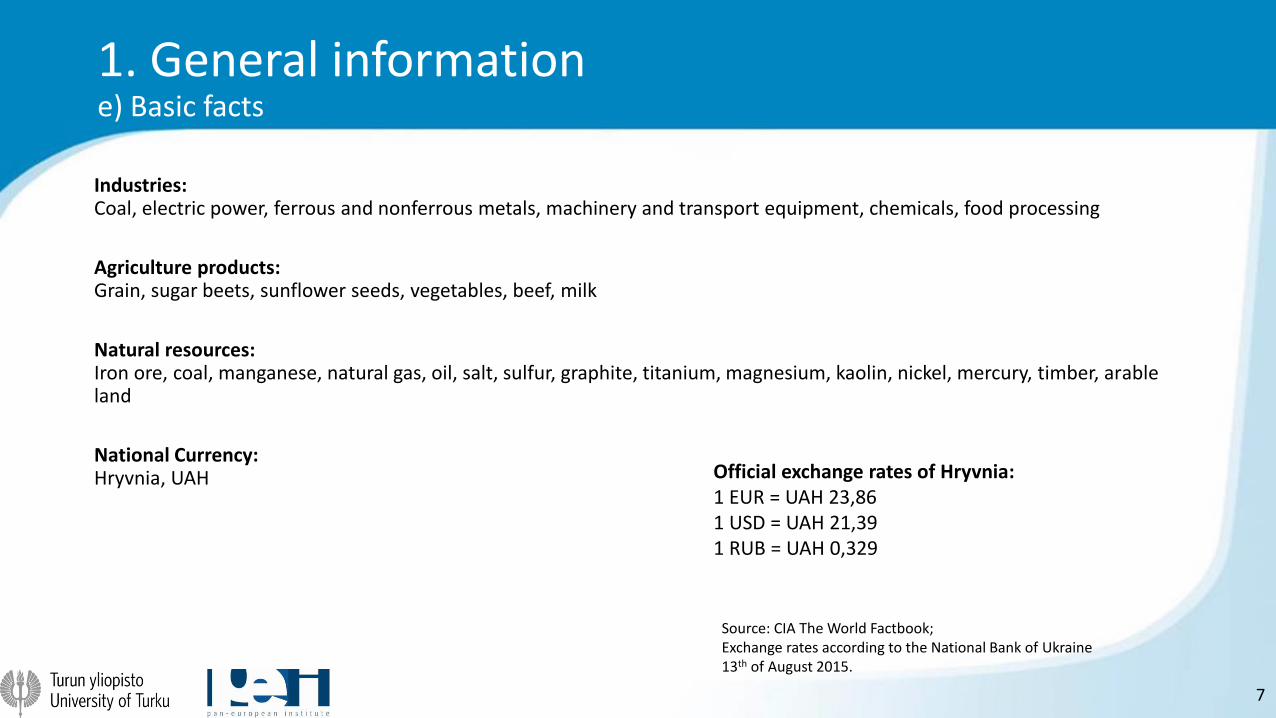
1. General informatione) Basic facts
Industries:Coal, electric power, ferrous and nonferrous metals, machinery and transport equipment, chemicals, food processing
Agriculture products:Grain, sugar beets, sunflower seeds, vegetables, beef, milk
Natural resources:Iron ore, coal, manganese, natural gas, oil, salt, sulfur, graphite, titanium, magnesium, kaolin, nickel, mercury, timber, arable land
National Currency:Hryvnia, UAH Official exchange rates of Hryvnia:
1 EUR = UAH 23,861 USD = UAH 21,391 RUB = UAH 0,329
Source: CIA The World Factbook; Exchange rates according to the National Bank of Ukraine13th of August 2015.
8
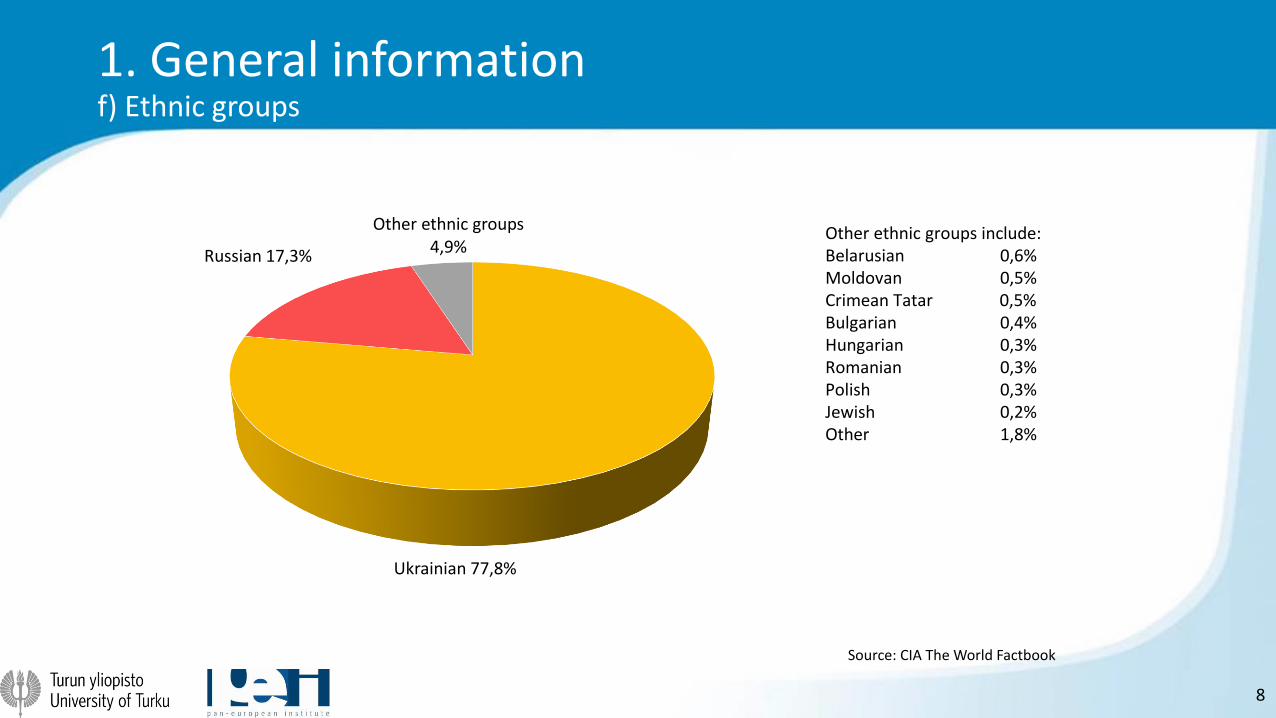
1. General informationf) Ethnic groups
Source: CIA The World Factbook
Ukrainian 77,8%
Russian 17,3%
Other ethnic groups 4,9%
Other ethnic groups include:Belarusian 0,6%Moldovan 0,5%Crimean Tatar 0,5%Bulgarian 0,4%Hungarian 0,3%Romanian 0,3%Polish 0,3%Jewish 0,2%Other 1,8%
9
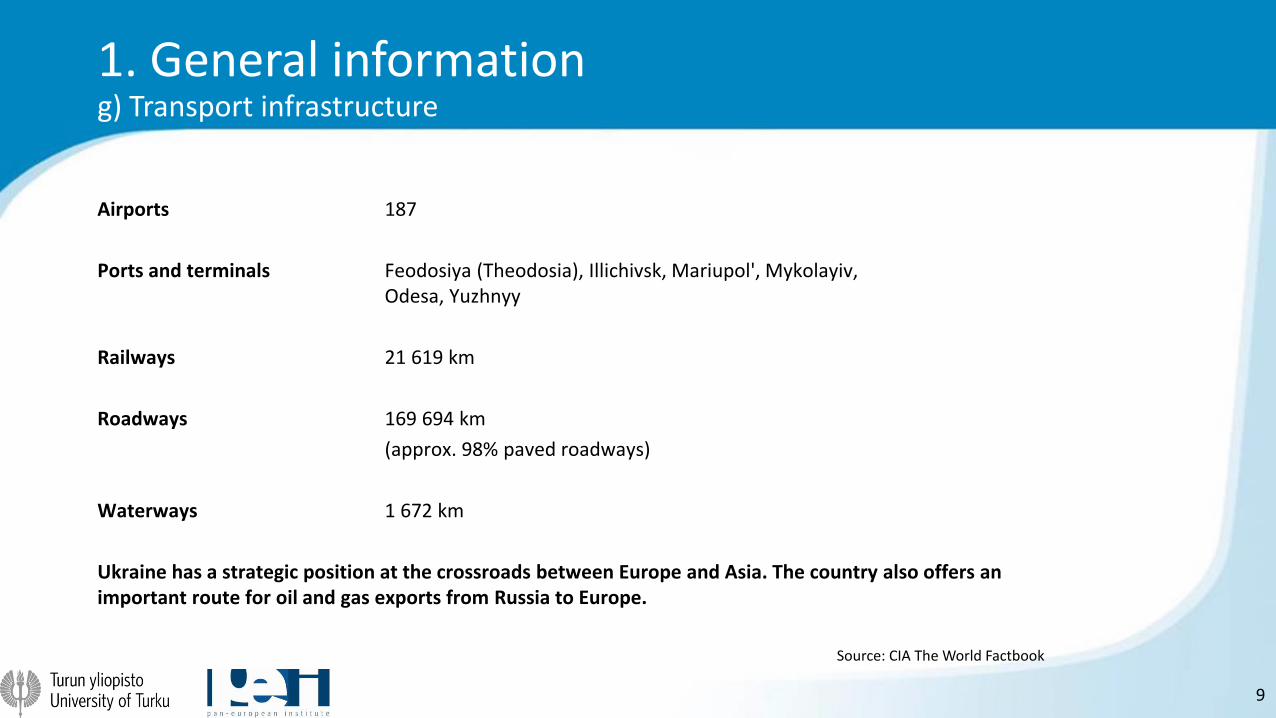
1. General informationg) Transport infrastructure
Airports 187
Ports and terminals Feodosiya (Theodosia), Illichivsk, Mariupol', Mykolayiv, Odesa, Yuzhnyy
Railways 21 619 km
Roadways 169 694 km
(approx. 98% paved roadways)
Waterways 1 672 km
Ukraine has a strategic position at the crossroads between Europe and Asia. The country also offers an important route for oil and gas exports from Russia to Europe.
Source: CIA The World Factbook
10
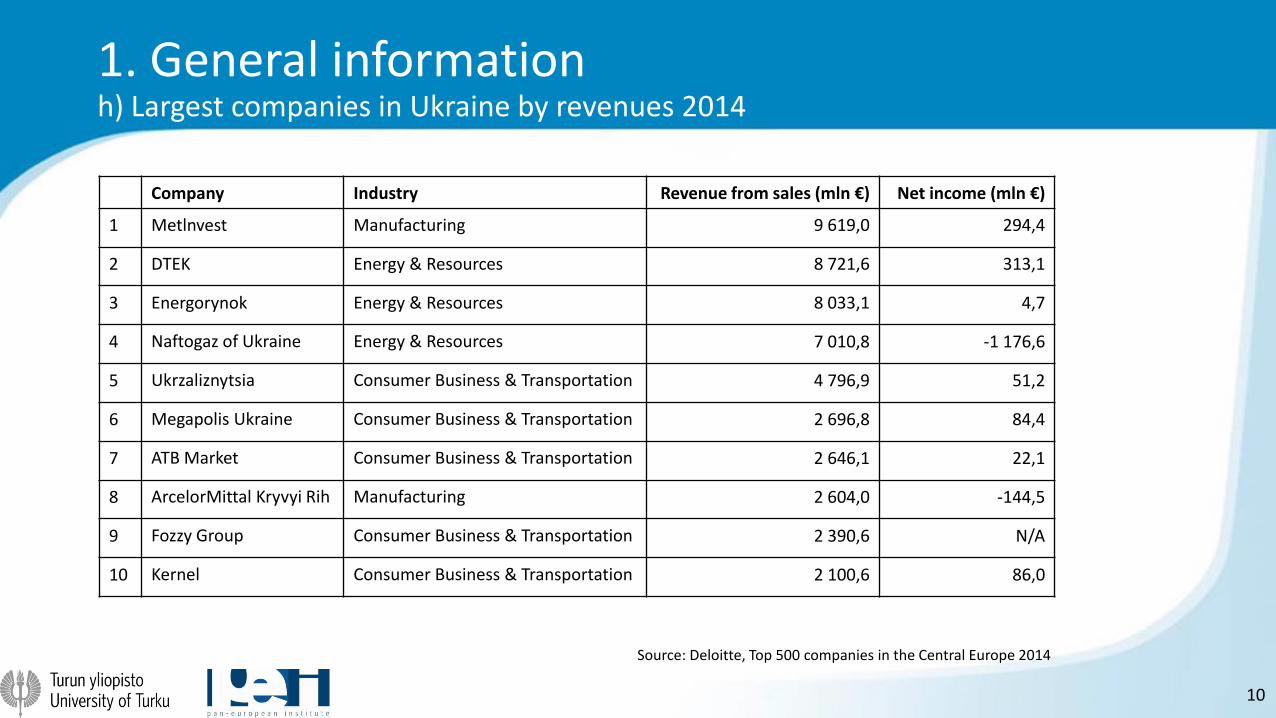
1. General informationh) Largest companies in Ukraine by revenues 2014
Company Industry Revenue from sales (mln €) Net income (mln €)
1 Metlnvest Manufacturing 9 619,0 294,4
2 DTEK Energy & Resources 8 721,6 313,1
3 Energorynok Energy & Resources 8 033,1 4,7
4 Naftogaz of Ukraine Energy & Resources 7 010,8 -1 176,6
5 Ukrzaliznytsia Consumer Business & Transportation 4 796,9 51,2
6 Megapolis Ukraine Consumer Business & Transportation 2 696,8 84,4
7 ATB Market Consumer Business & Transportation 2 646,1 22,1
8 ArcelorMittal Kryvyi Rih Manufacturing 2 604,0 -144,5
9 Fozzy Group Consumer Business & Transportation 2 390,6 N/A
10 Kernel Consumer Business & Transportation 2 100,6 86,0
Source: Deloitte, Top 500 companies in the Central Europe 2014
11
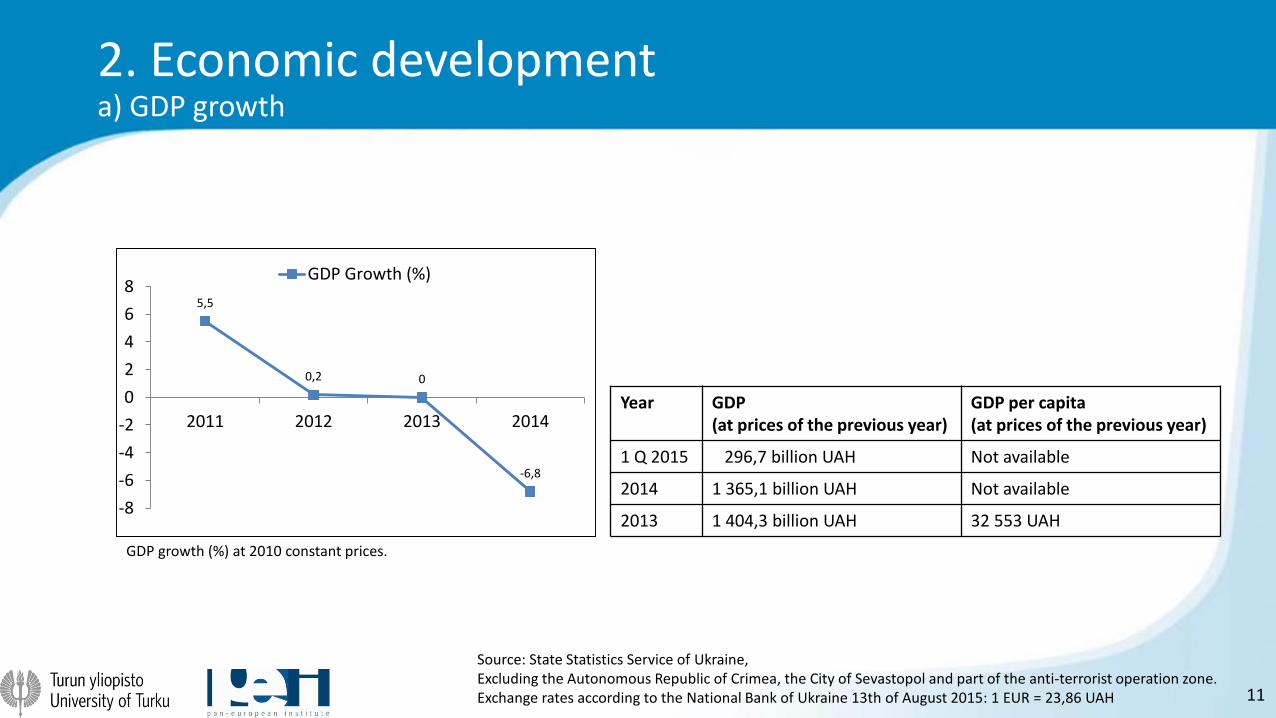
2. Economic developmenta) GDP growth
Year GDP (at prices of the previous year)
GDP per capita (at prices of the previous year)
1 Q 2015 296,7 billion UAH Not available
2014 1 365,1 billion UAH Not available
2013 1 404,3 billion UAH 32 553 UAH
Source: State Statistics Service of Ukraine,Excluding the Autonomous Republic of Crimea, the City of Sevastopol and part of the anti-terrorist operation zone.Exchange rates according to the National Bank of Ukraine 13th of August 2015: 1 EUR = 23,86 UAH
5,5
0,2 0
-6,8
-8
-6
-4
-2
0
2
4
6
8
2011 2012 2013 2014
GDP Growth (%)
GDP growth (%) at 2010 constant prices.
12
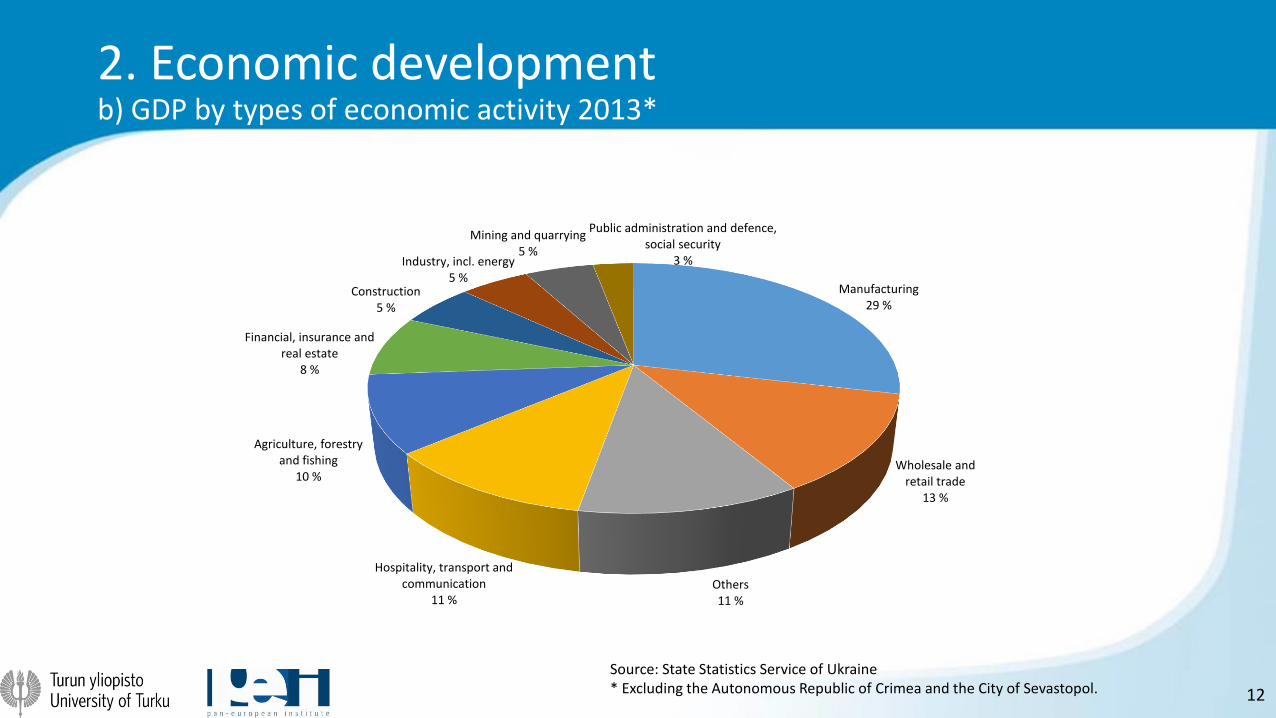
2. Economic developmentb) GDP by types of economic activity 2013*
Source: State Statistics Service of Ukraine* Excluding the Autonomous Republic of Crimea and the City of Sevastopol.
Manufacturing29 %
Wholesale and retail trade
13 %
Others11 %
Hospitality, transport and communication
11 %
Agriculture, forestryand fishing
10 %
Financial, insurance and real estate
8 %
Construction5 %
Industry, incl. energy5 %
Mining and quarrying5 %
Public administration and defence, social security
3 %
13
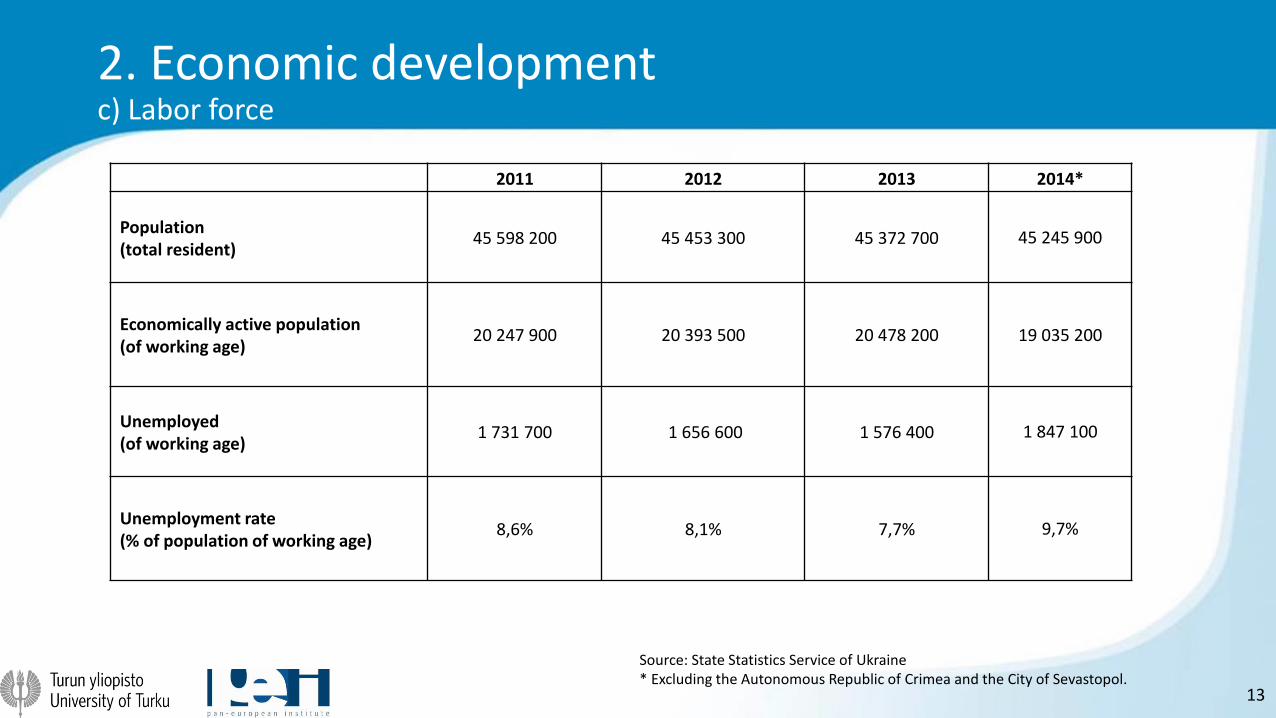
2. Economic developmentc) Labor force
Source: State Statistics Service of Ukraine* Excluding the Autonomous Republic of Crimea and the City of Sevastopol.
2011 2012 2013 2014*
Population(total resident)
45 598 200 45 453 300 45 372 700 45 245 900
Economically active population(of working age)
20 247 900 20 393 500 20 478 200 19 035 200
Unemployed(of working age)
1 731 700 1 656 600 1 576 400 1 847 100
Unemployment rate(% of population of working age)
8,6% 8,1% 7,7% 9,7%
14
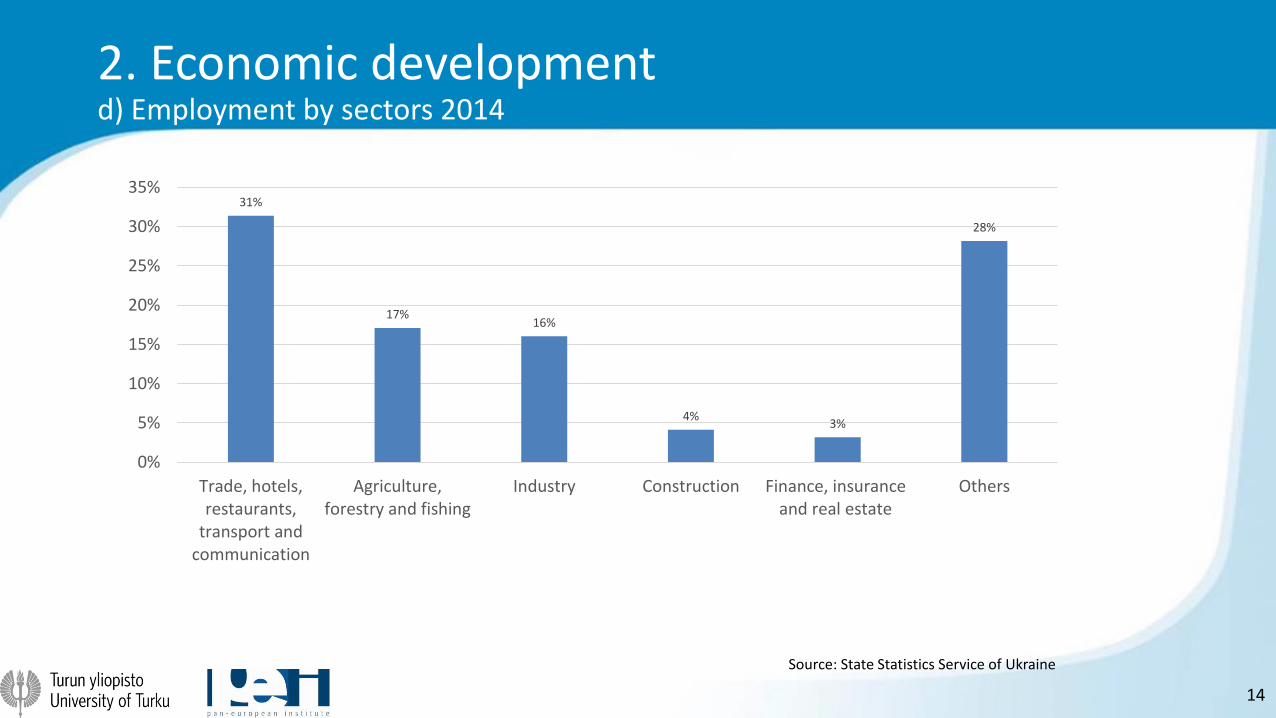
2. Economic developmentd) Employment by sectors 2014
Source: State Statistics Service of Ukraine
31%
17%16%
4%3%
28%
0%
5%
10%
15%
20%
25%
30%
35%
Trade, hotels,restaurants,
transport andcommunication
Agriculture,forestry and fishing
Industry Construction Finance, insuranceand real estate
Others
15
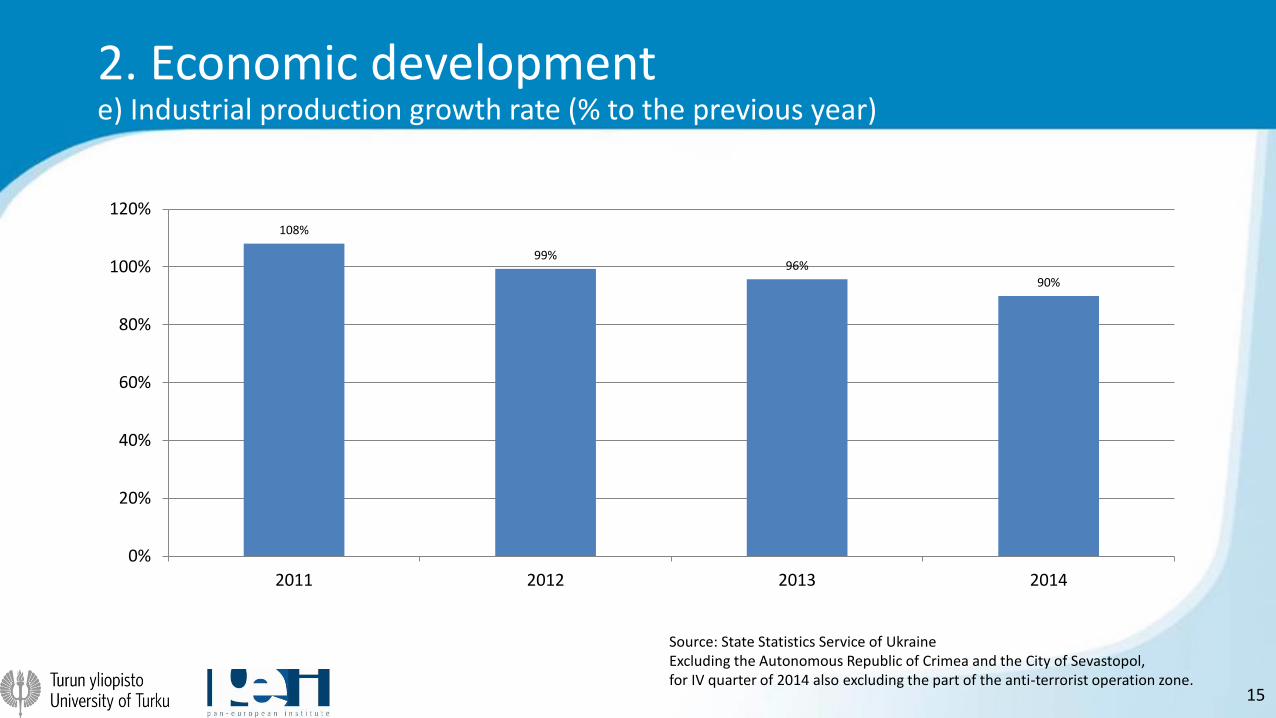
2. Economic developmente) Industrial production growth rate (% to the previous year)
Source: State Statistics Service of UkraineExcluding the Autonomous Republic of Crimea and the City of Sevastopol, for IV quarter of 2014 also excluding the part of the anti-terrorist operation zone.
108%
99%96%
90%
0%
20%
40%
60%
80%
100%
120%
2011 2012 2013 2014
16
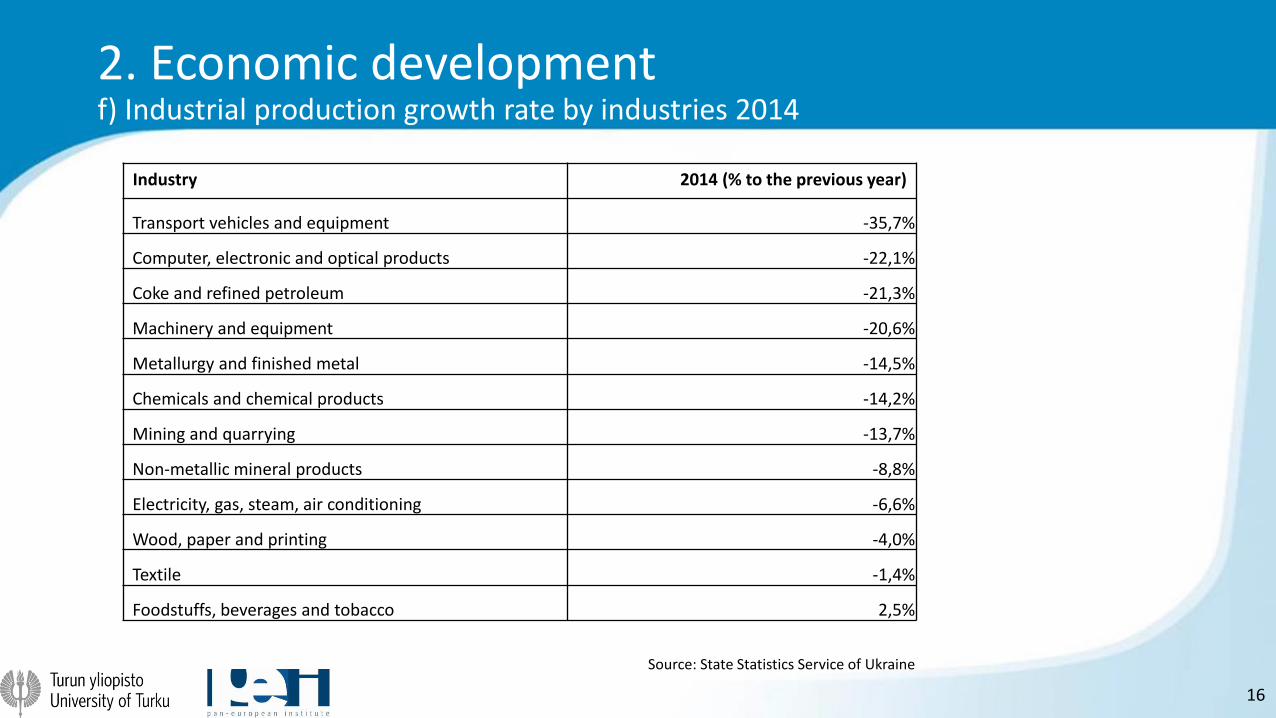
2. Economic developmentf) Industrial production growth rate by industries 2014
Industry 2014 (% to the previous year)
Transport vehicles and equipment -35,7%
Computer, electronic and optical products -22,1%
Coke and refined petroleum -21,3%
Machinery and equipment -20,6%
Metallurgy and finished metal -14,5%
Chemicals and chemical products -14,2%
Mining and quarrying -13,7%
Non-metallic mineral products -8,8%
Electricity, gas, steam, air conditioning -6,6%
Wood, paper and printing -4,0%
Textile -1,4%
Foodstuffs, beverages and tobacco 2,5%
Source: State Statistics Service of Ukraine
17
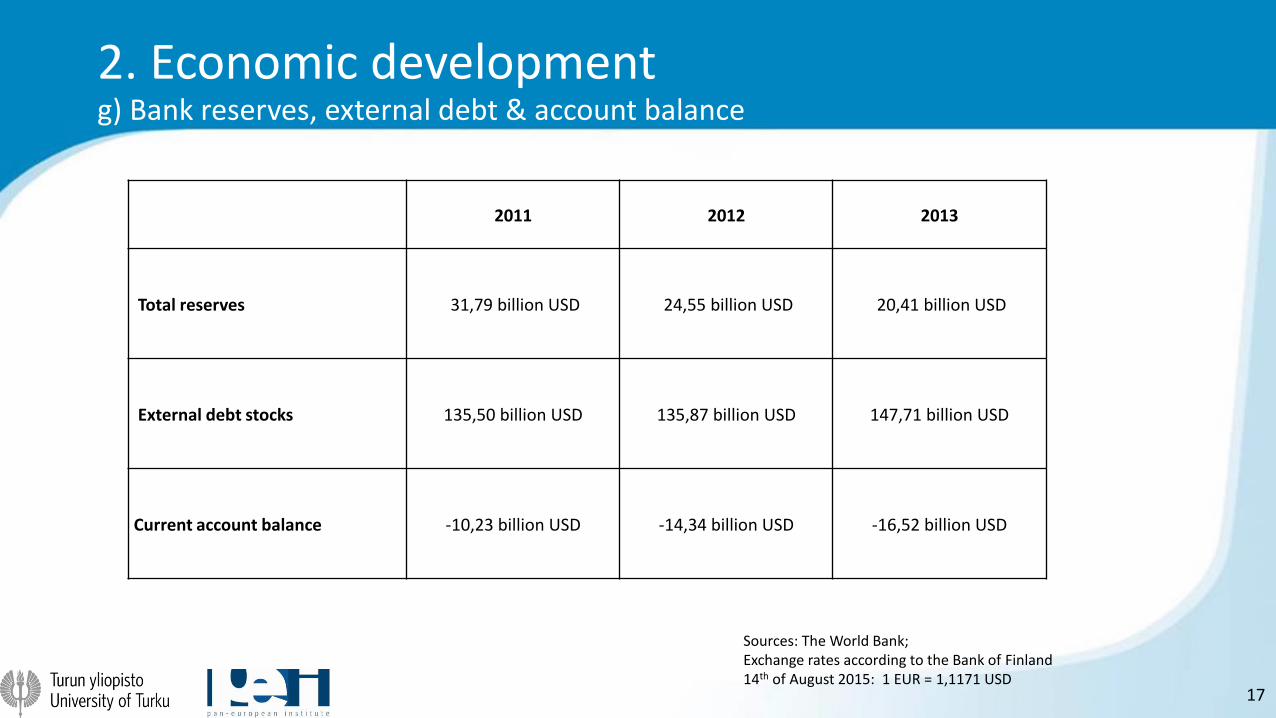
2. Economic developmentg) Bank reserves, external debt & account balance
2011 2012 2013
Total reserves 31,79 billion USD 24,55 billion USD 20,41 billion USD
External debt stocks 135,50 billion USD 135,87 billion USD 147,71 billion USD
Current account balance -10,23 billion USD -14,34 billion USD -16,52 billion USD
Sources: The World Bank;Exchange rates according to the Bank of Finland14th of August 2015: 1 EUR = 1,1171 USD
18
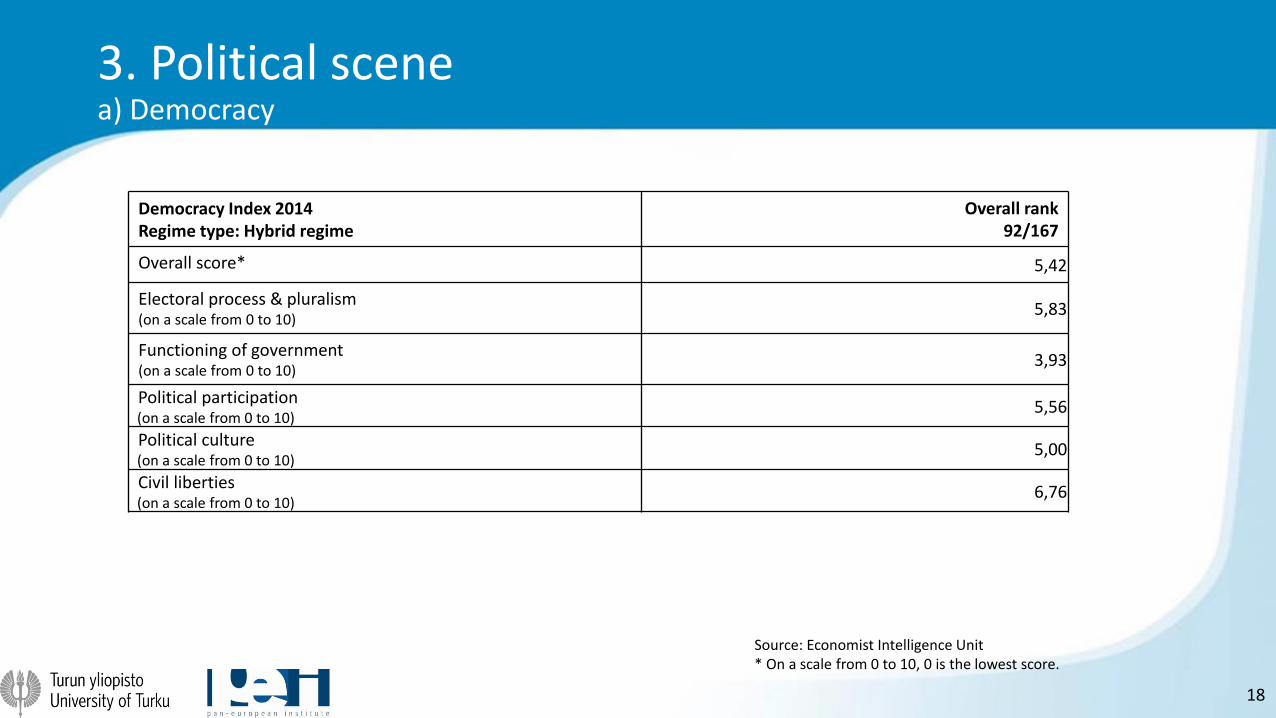
3. Political scenea) Democracy
Democracy Index 2014Regime type: Hybrid regime
Overall rank 92/167
Overall score* 5,42
Electoral process & pluralism(on a scale from 0 to 10)
5,83
Functioning of government(on a scale from 0 to 10)
3,93
Political participation(on a scale from 0 to 10)
5,56
Political culture(on a scale from 0 to 10)
5,00
Civil liberties(on a scale from 0 to 10)
6,76
Source: Economist Intelligence Unit* On a scale from 0 to 10, 0 is the lowest score.
19
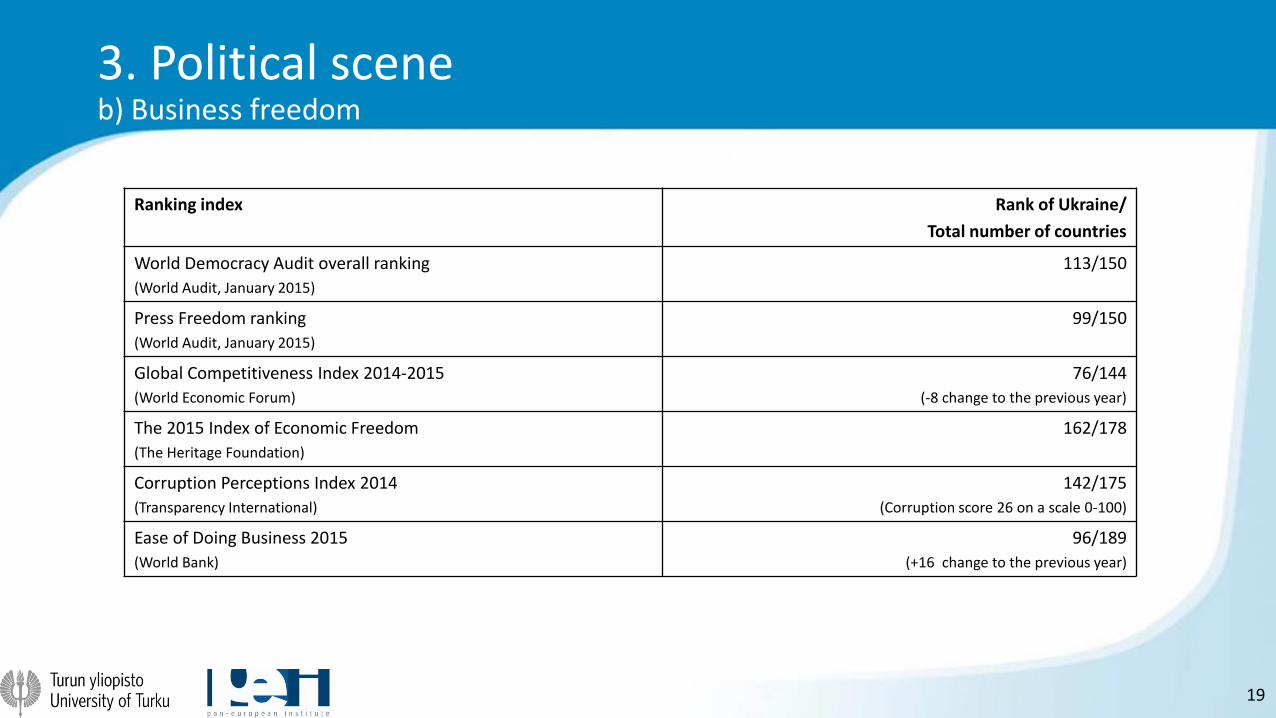
3. Political sceneb) Business freedom
Ranking index Rank of Ukraine/
Total number of countries
World Democracy Audit overall ranking
(World Audit, January 2015)
113/150
Press Freedom ranking
(World Audit, January 2015)
99/150
Global Competitiveness Index 2014-2015
(World Economic Forum)
76/144
(-8 change to the previous year)
The 2015 Index of Economic Freedom
(The Heritage Foundation)
162/178
Corruption Perceptions Index 2014
(Transparency International)
142/175
(Corruption score 26 on a scale 0-100)
Ease of Doing Business 2015
(World Bank)
96/189
(+16 change to the previous year)
20
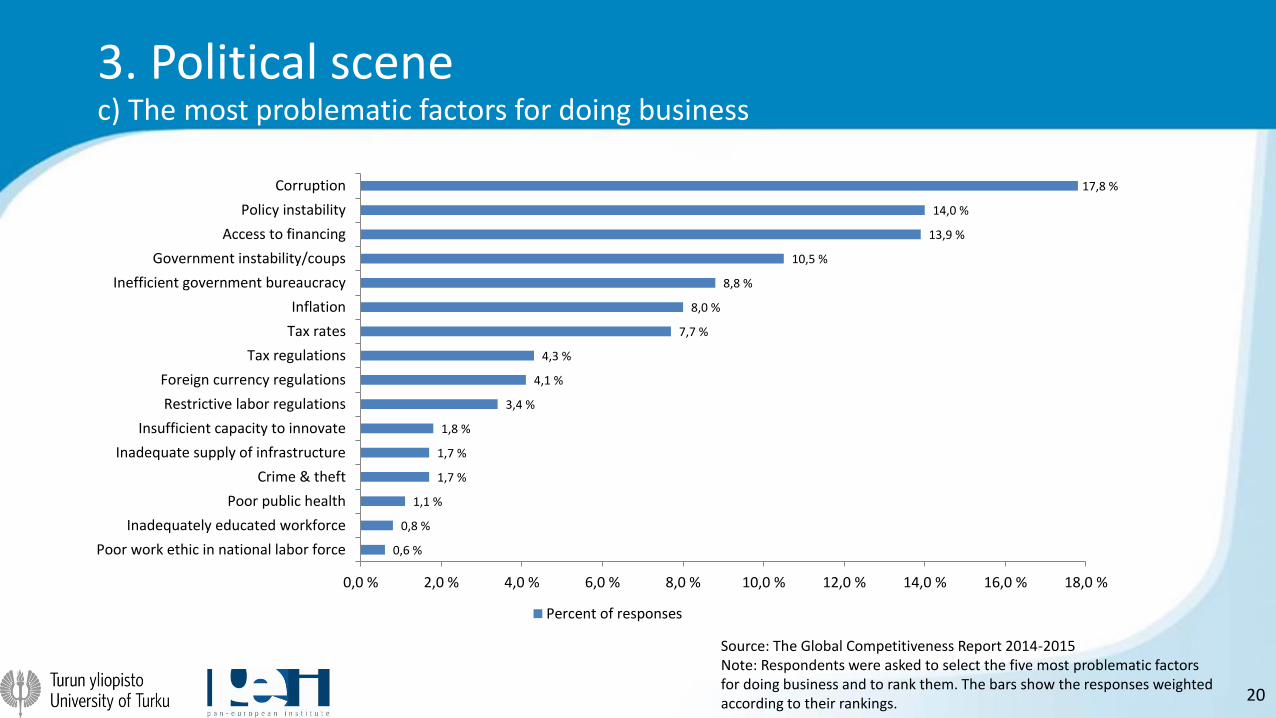
3. Political scenec) The most problematic factors for doing business
Source: The Global Competitiveness Report 2014-2015Note: Respondents were asked to select the five most problematic factors for doing business and to rank them. The bars show the responses weighted according to their rankings.
0,6 %
0,8 %
1,1 %
1,7 %
1,7 %
1,8 %
3,4 %
4,1 %
4,3 %
7,7 %
8,0 %
8,8 %
10,5 %
13,9 %
14,0 %
17,8 %
0,0 % 2,0 % 4,0 % 6,0 % 8,0 % 10,0 % 12,0 % 14,0 % 16,0 % 18,0 %
Poor work ethic in national labor force
Inadequately educated workforce
Poor public health
Crime & theft
Inadequate supply of infrastructure
Insufficient capacity to innovate
Restrictive labor regulations
Foreign currency regulations
Tax regulations
Tax rates
Inflation
Inefficient government bureaucracy
Government instability/coups
Access to financing
Policy instability
Corruption
Percent of responses
21
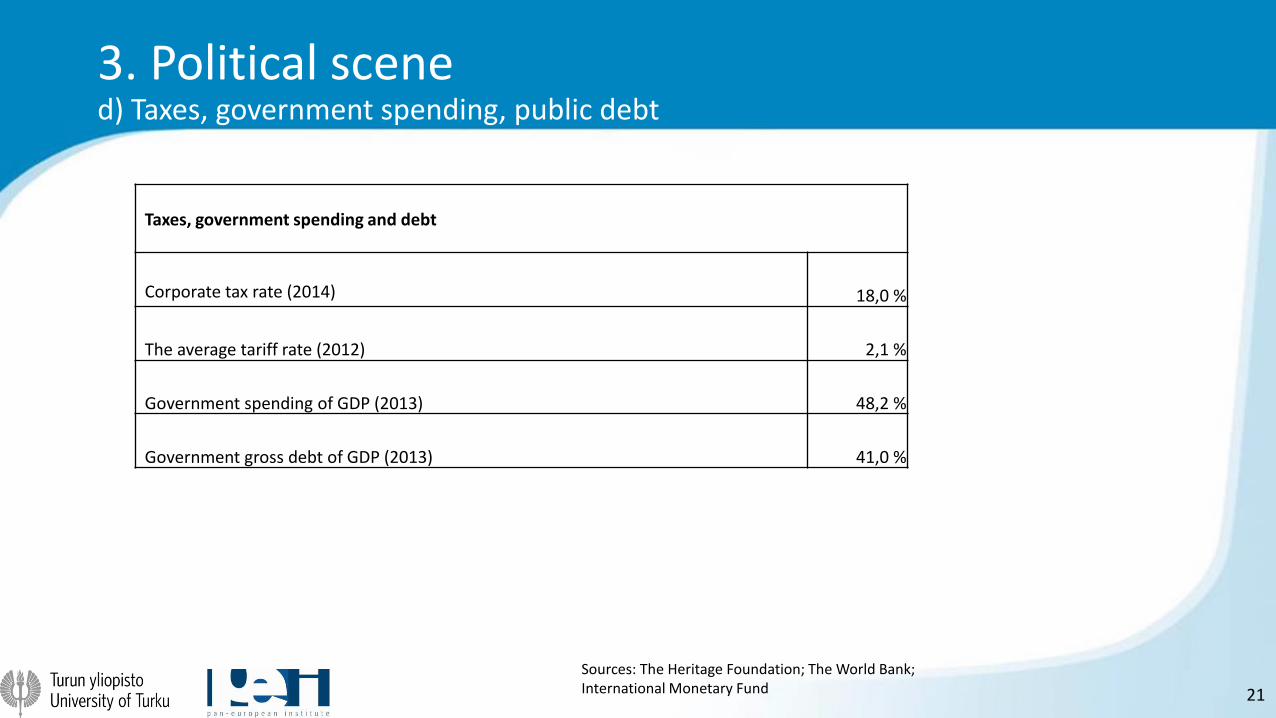
3. Political scened) Taxes, government spending, public debt
Sources: The Heritage Foundation; The World Bank; International Monetary Fund
Taxes, government spending and debt
Corporate tax rate (2014) 18,0 %
The average tariff rate (2012) 2,1 %
Government spending of GDP (2013) 48,2 %
Government gross debt of GDP (2013) 41,0 %
22
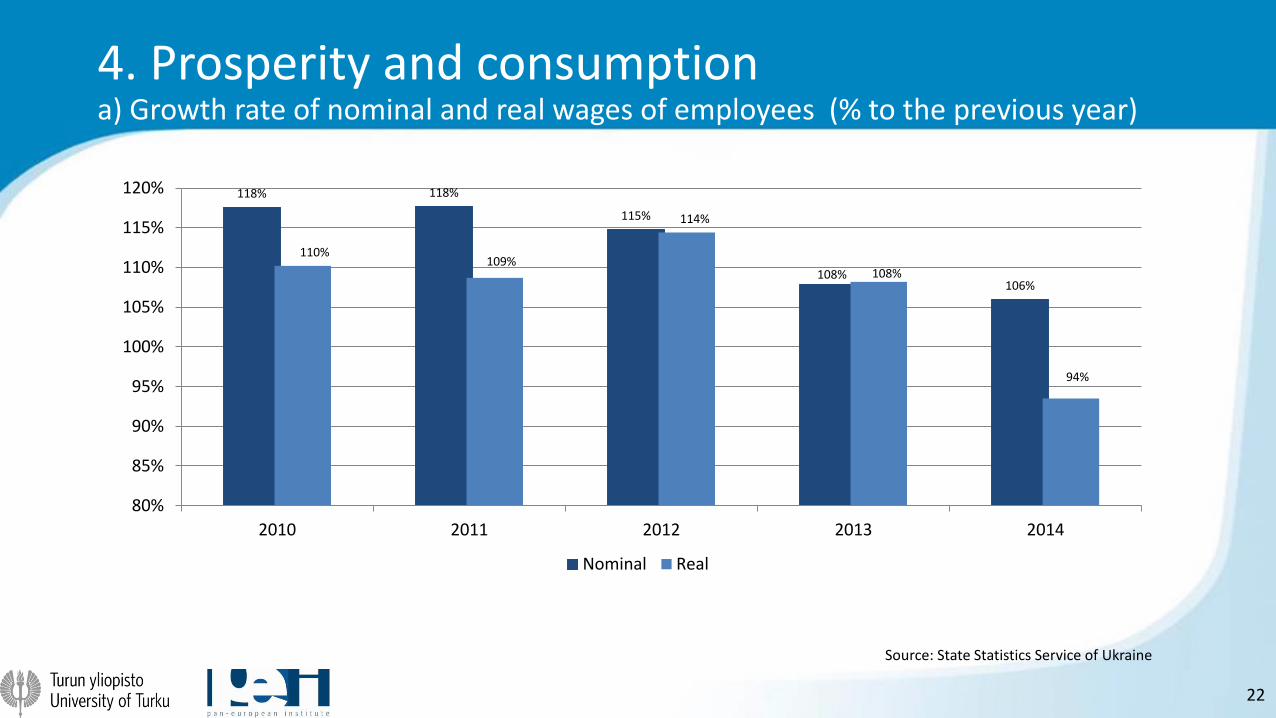
4. Prosperity and consumptiona) Growth rate of nominal and real wages of employees (% to the previous year)
Source: State Statistics Service of Ukraine
118% 118%
115%
108%106%
110%109%
114%
108%
94%
80%
85%
90%
95%
100%
105%
110%
115%
120%
2010 2011 2012 2013 2014
Nominal Real
23
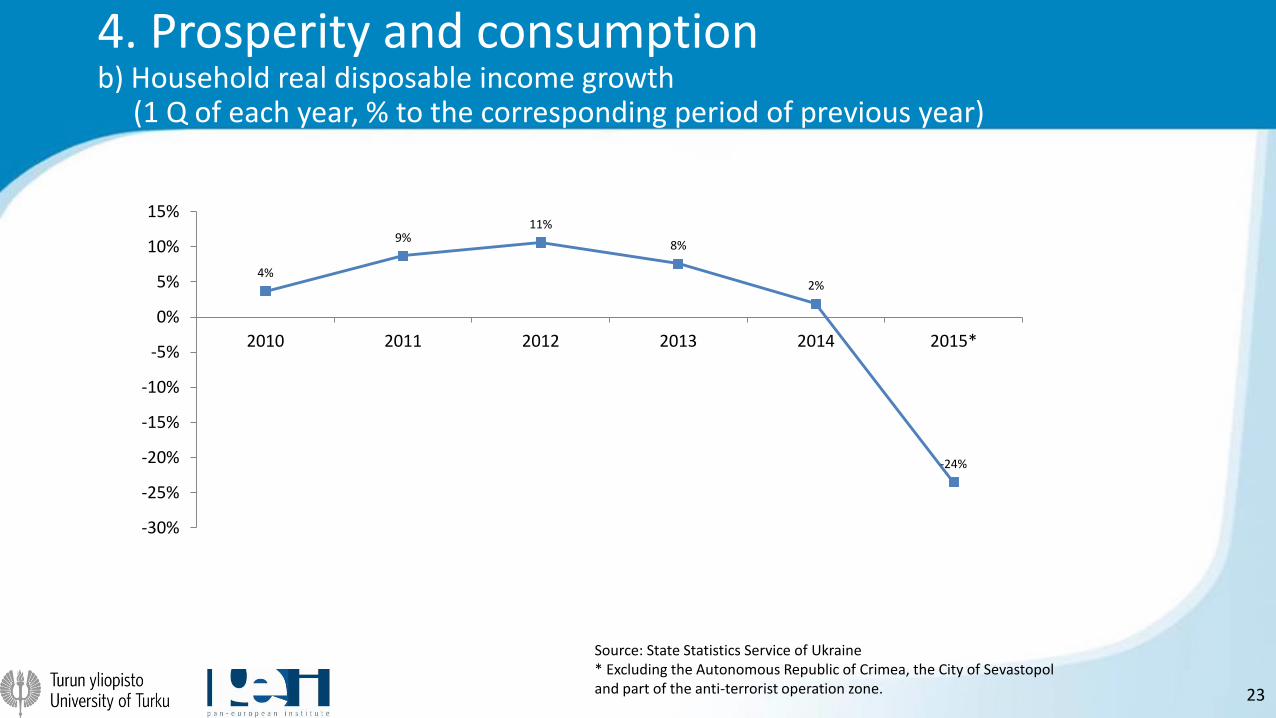
4. Prosperity and consumptionb) Household real disposable income growth
(1 Q of each year, % to the corresponding period of previous year)
Source: State Statistics Service of Ukraine* Excluding the Autonomous Republic of Crimea, the City of Sevastopol and part of the anti-terrorist operation zone.
4%
9%11%
8%
2%
-24%
-30%
-25%
-20%
-15%
-10%
-5%
0%
5%
10%
15%
2010 2011 2012 2013 2014 2015*
24
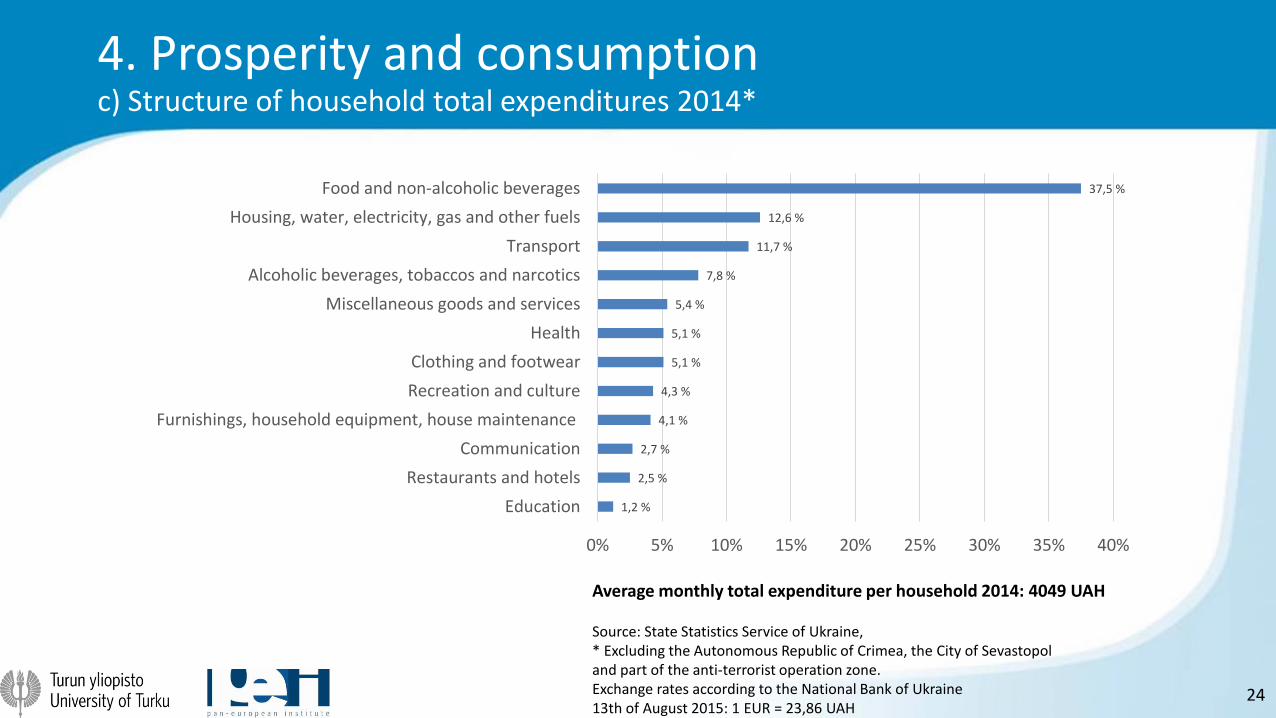
4. Prosperity and consumptionc) Structure of household total expenditures 2014*
Source: State Statistics Service of Ukraine, * Excluding the Autonomous Republic of Crimea, the City of Sevastopoland part of the anti-terrorist operation zone.Exchange rates according to the National Bank of Ukraine13th of August 2015: 1 EUR = 23,86 UAH
Average monthly total expenditure per household 2014: 4049 UAH
1,2 %
2,5 %
2,7 %
4,1 %
4,3 %
5,1 %
5,1 %
5,4 %
7,8 %
11,7 %
12,6 %
37,5 %
0% 5% 10% 15% 20% 25% 30% 35% 40%
Education
Restaurants and hotels
Communication
Furnishings, household equipment, house maintenance
Recreation and culture
Clothing and footwear
Health
Miscellaneous goods and services
Alcoholic beverages, tobaccos and narcotics
Transport
Housing, water, electricity, gas and other fuels
Food and non-alcoholic beverages
25
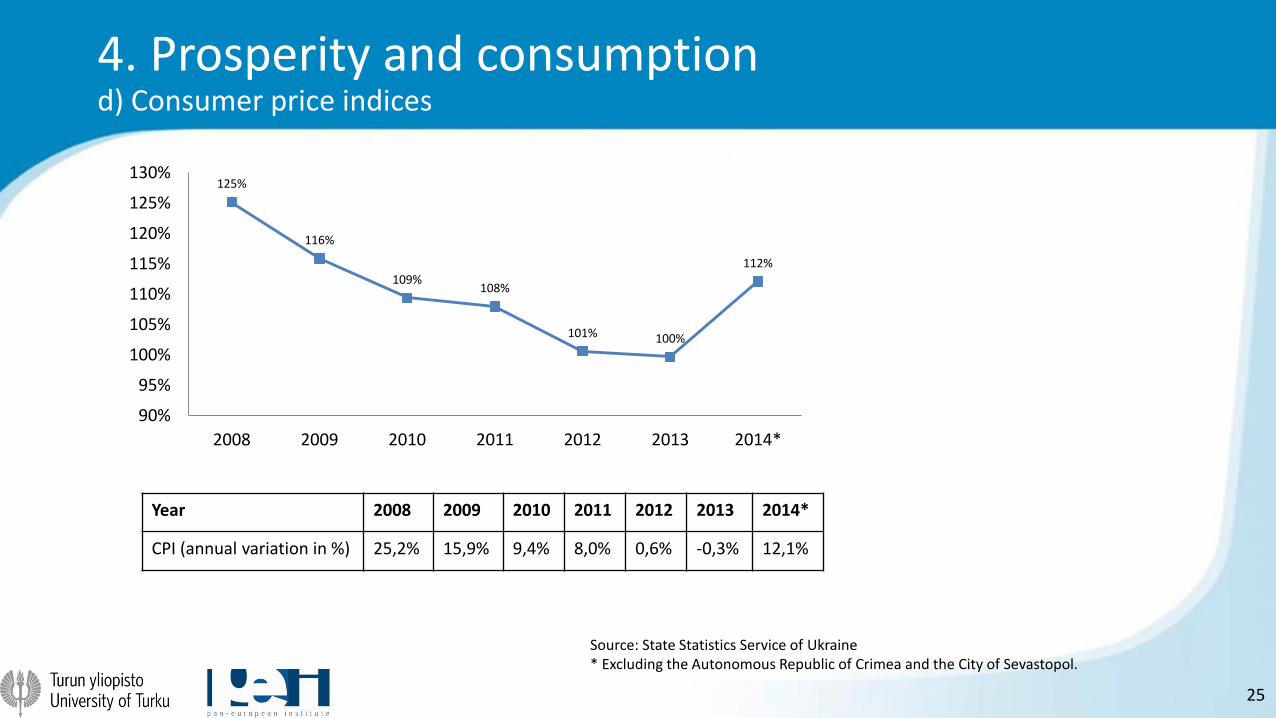
4. Prosperity and consumptiond) Consumer price indices
Source: State Statistics Service of Ukraine* Excluding the Autonomous Republic of Crimea and the City of Sevastopol.
Year 2008 2009 2010 2011 2012 2013 2014*
CPI (annual variation in %) 25,2% 15,9% 9,4% 8,0% 0,6% -0,3% 12,1%
125%
116%
109%108%
101% 100%
112%
90%
95%
100%
105%
110%
115%
120%
125%
130%
2008 2009 2010 2011 2012 2013 2014*
26
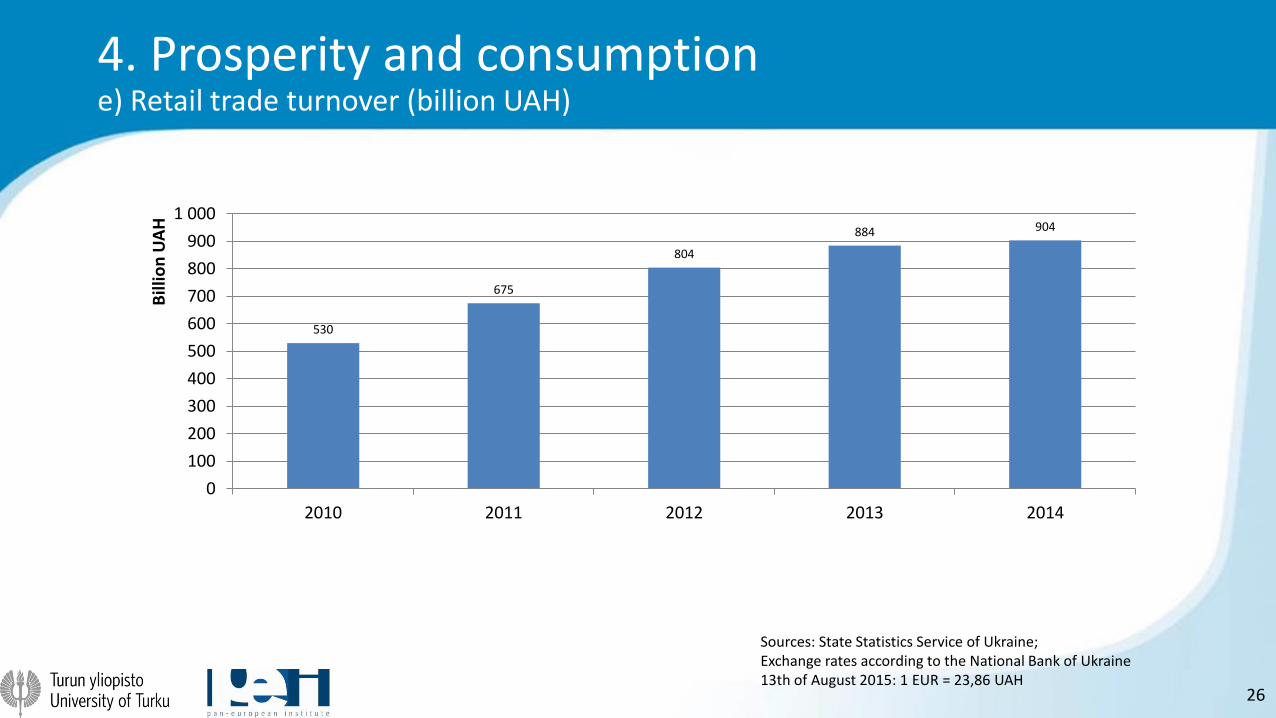
4. Prosperity and consumptione) Retail trade turnover (billion UAH)
Sources: State Statistics Service of Ukraine;Exchange rates according to the National Bank of Ukraine13th of August 2015: 1 EUR = 23,86 UAH
530
675
804
884 904
0
100
200
300
400
500
600
700
800
900
1 000
2010 2011 2012 2013 2014
Bill
ion
UA
H
27
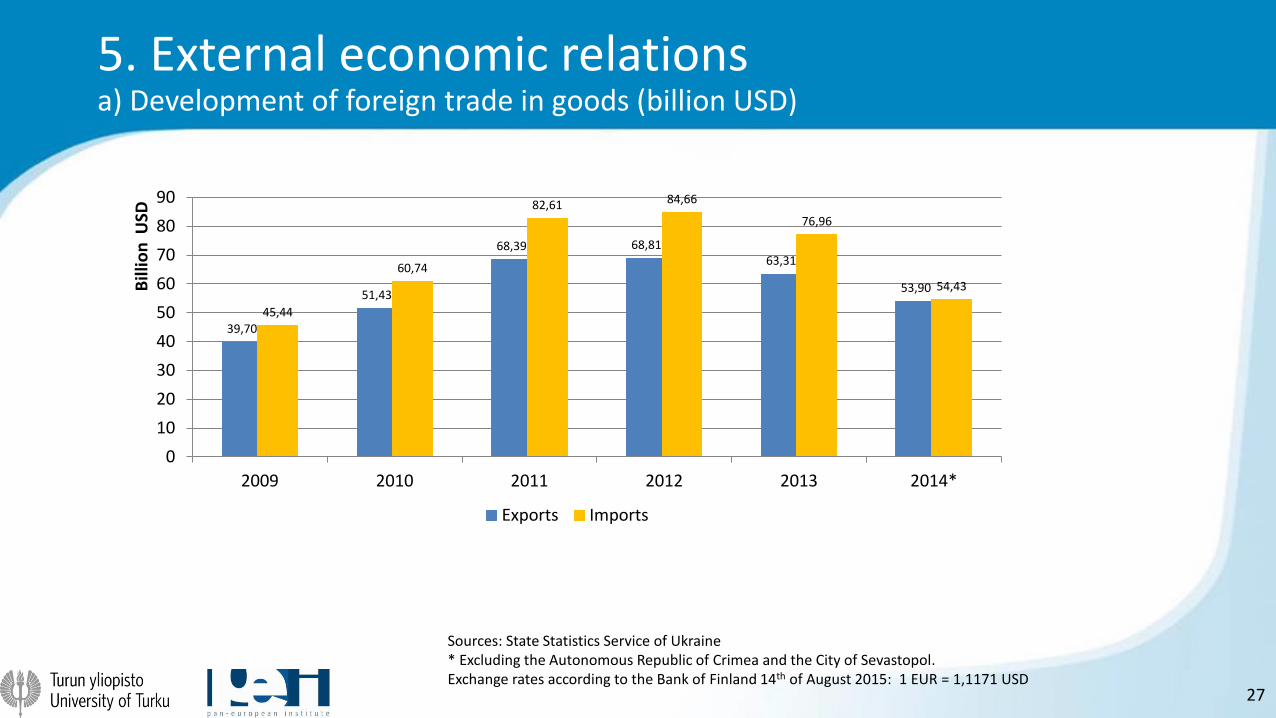
5. External economic relationsa) Development of foreign trade in goods (billion USD)
Sources: State Statistics Service of Ukraine* Excluding the Autonomous Republic of Crimea and the City of Sevastopol.Exchange rates according to the Bank of Finland 14th of August 2015: 1 EUR = 1,1171 USD
39,70
51,43
68,39 68,8163,31
53,90
45,44
60,74
82,61 84,66
76,96
54,43
0
10
20
30
40
50
60
70
80
90
2009 2010 2011 2012 2013 2014*
Bill
ion
USD
Exports Imports
28
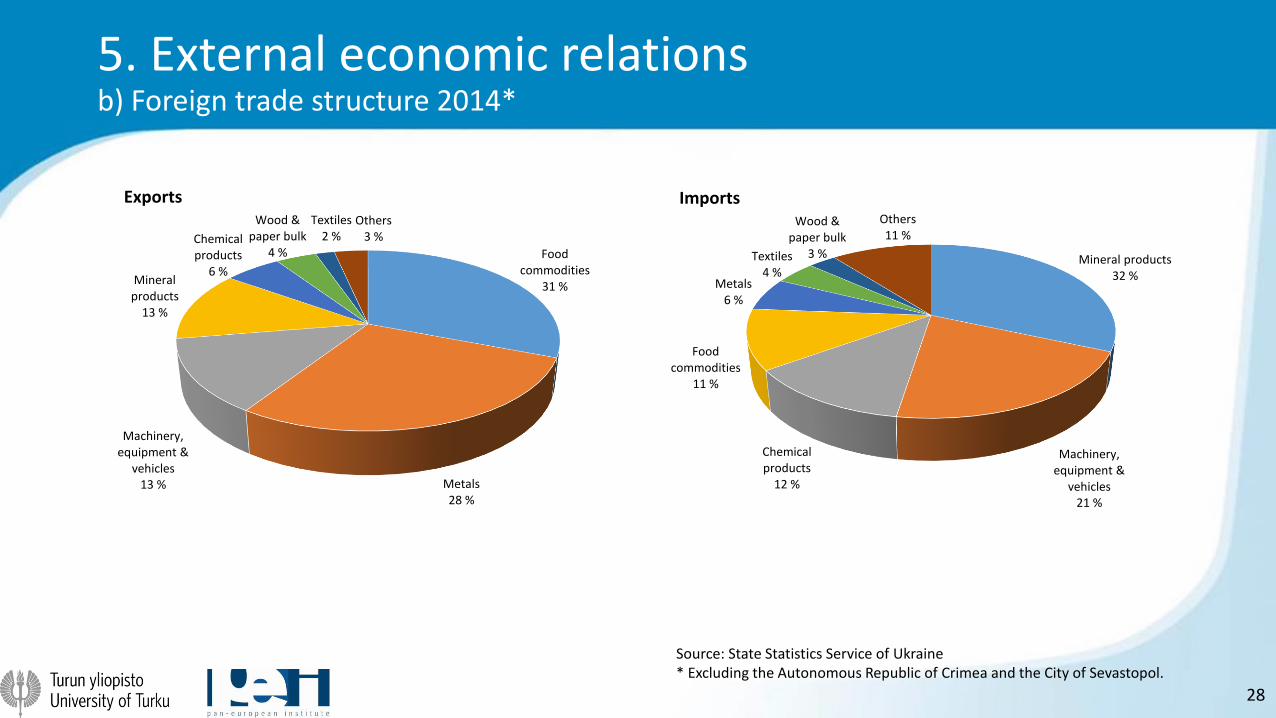
5. External economic relationsb) Foreign trade structure 2014*
Source: State Statistics Service of Ukraine* Excluding the Autonomous Republic of Crimea and the City of Sevastopol.
Food commodities
31 %
Metals28 %
Machinery, equipment &
vehicles13 %
Mineral products
13 %
Chemical products
6 %
Wood & paper bulk
4 %
Textiles 2 %
Others3 %
Exports
Mineral products 32 %
Machinery, equipment &
vehicles21 %
Chemical products
12 %
Food commodities
11 %
Metals6 %
Textiles 4 %
Wood & paper bulk
3 %
Others11 %
Imports
29
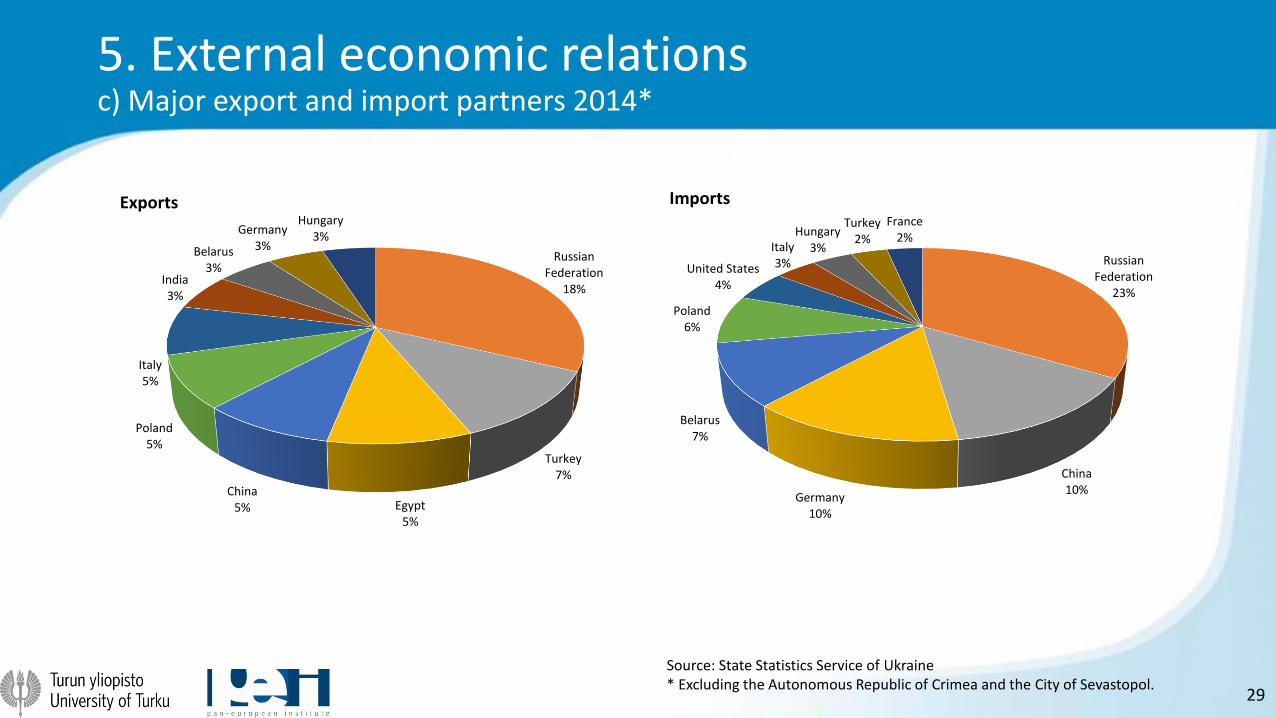
5. External economic relationsc) Major export and import partners 2014*
Source: State Statistics Service of Ukraine* Excluding the Autonomous Republic of Crimea and the City of Sevastopol.
Russian Federation
18%
Turkey7%
Egypt5%
China5%
Poland5%
Italy5%
India3%
Belarus3%
Germany3%
Hungary3%
Exports
Russian Federation
23%
China10%
Germany10%
Belarus7%
Poland6%
United States4%
Italy3%
Hungary3%
Turkey2%
France2%
Imports
30
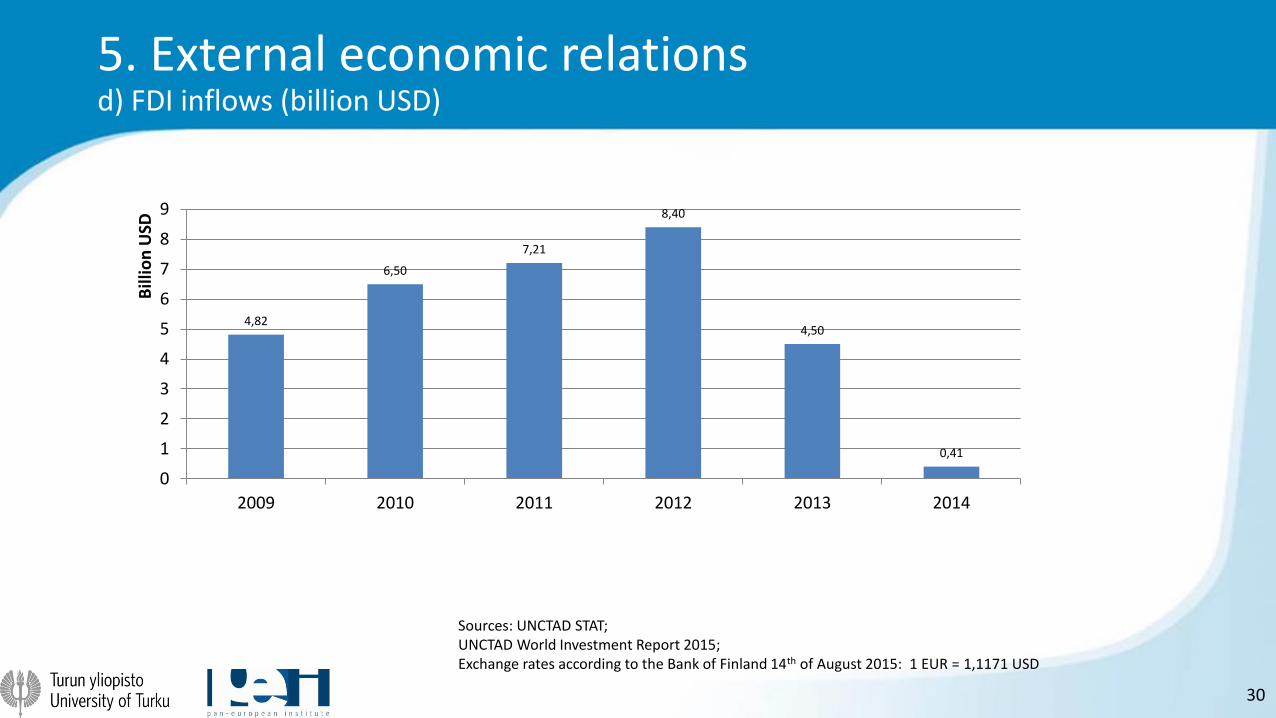
5. External economic relationsd) FDI inflows (billion USD)
Sources: UNCTAD STAT; UNCTAD World Investment Report 2015;Exchange rates according to the Bank of Finland 14th of August 2015: 1 EUR = 1,1171 USD
4,82
6,50
7,21
8,40
4,50
0,41
0
1
2
3
4
5
6
7
8
9
2009 2010 2011 2012 2013 2014
Bill
ion
USD
31
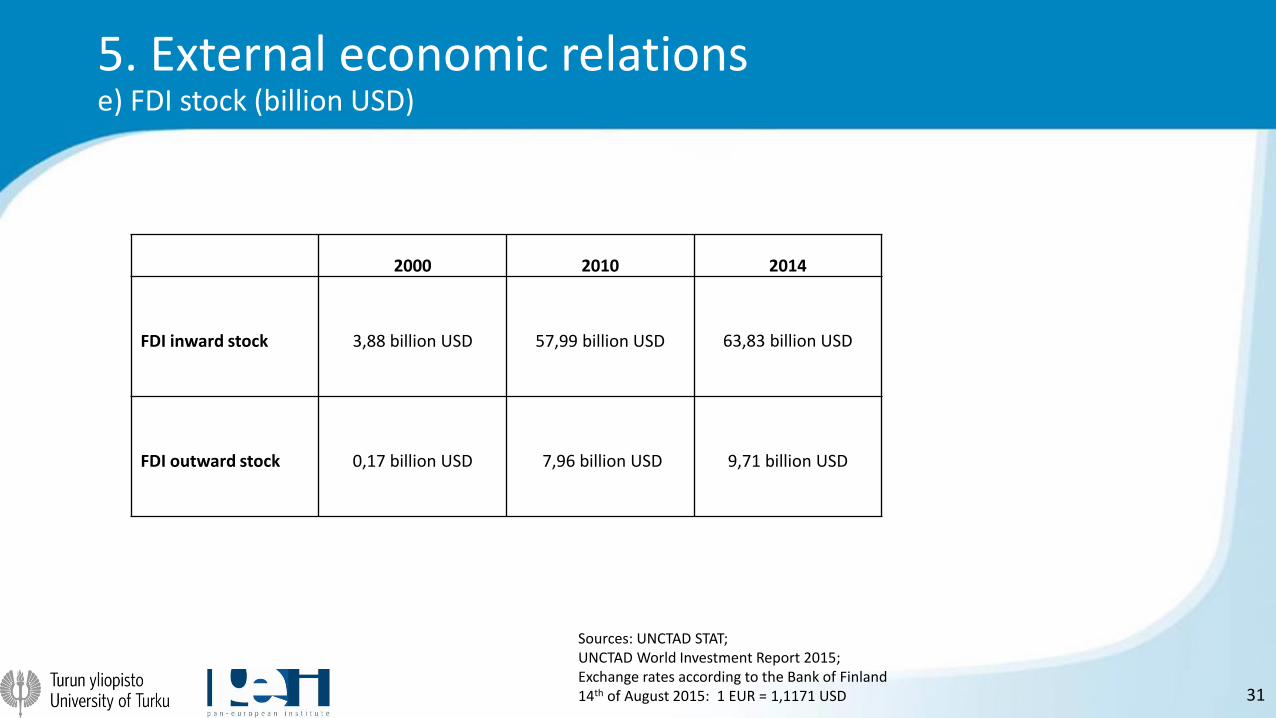
5. External economic relationse) FDI stock (billion USD)
Sources: UNCTAD STAT; UNCTAD World Investment Report 2015;Exchange rates according to the Bank of Finland 14th of August 2015: 1 EUR = 1,1171 USD
2000 2010 2014
FDI inward stock 3,88 billion USD 57,99 billion USD 63,83 billion USD
FDI outward stock 0,17 billion USD 7,96 billion USD 9,71 billion USD
32
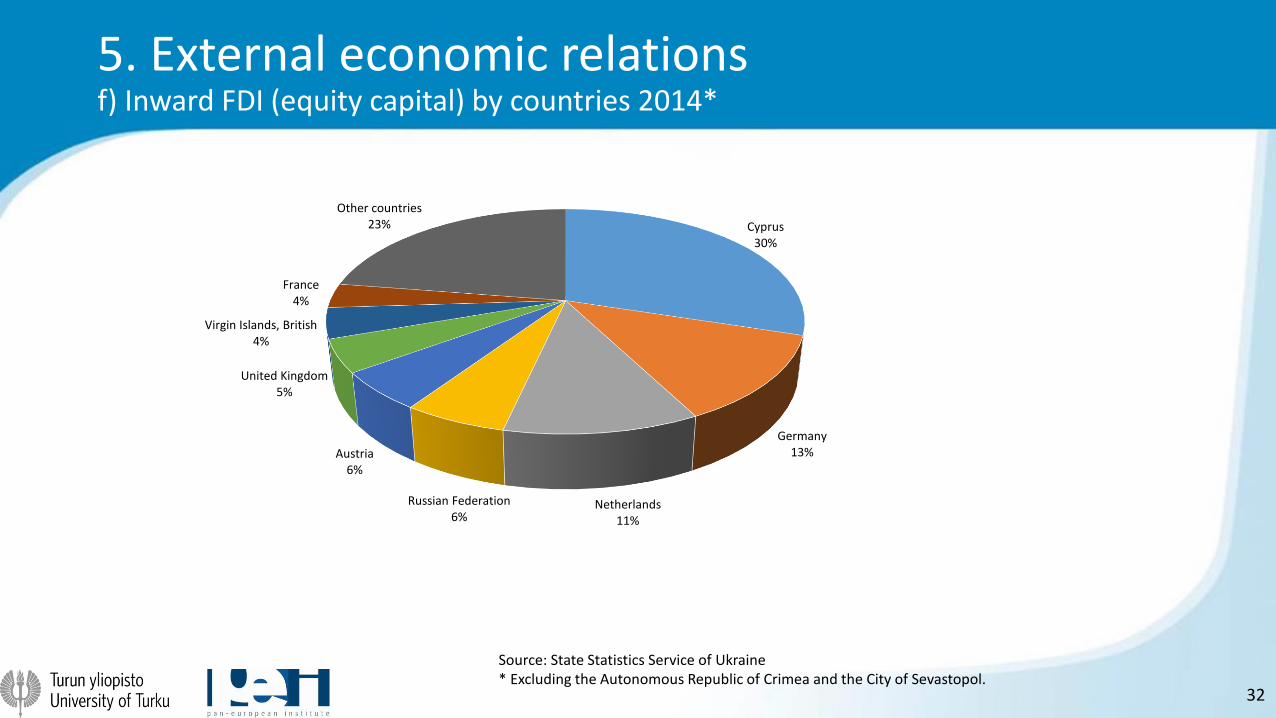
5. External economic relationsf) Inward FDI (equity capital) by countries 2014*
Source: State Statistics Service of Ukraine* Excluding the Autonomous Republic of Crimea and the City of Sevastopol.
Cyprus30%
Germany13%
Netherlands11%
Russian Federation6%
Austria6%
United Kingdom5%
Virgin Islands, British4%
France4%
Other countries23%
33
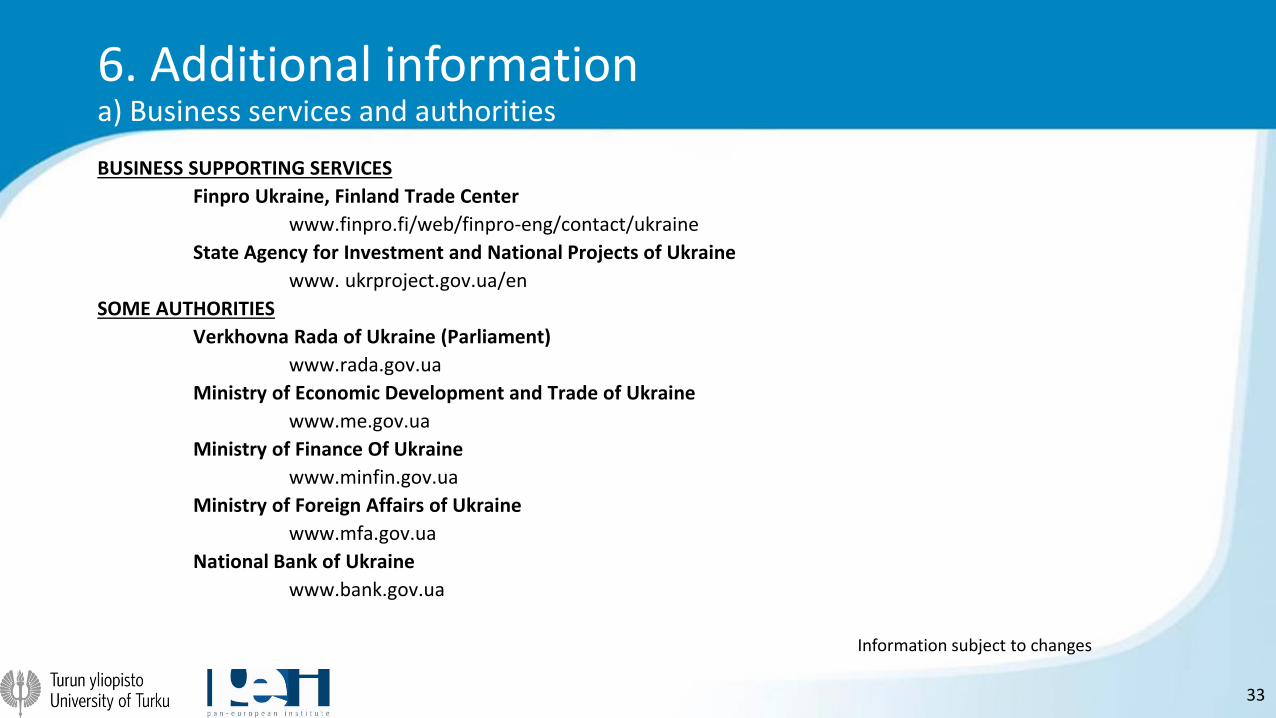
6. Additional informationa) Business services and authorities
BUSINESS SUPPORTING SERVICES
Finpro Ukraine, Finland Trade Center
www.finpro.fi/web/finpro-eng/contact/ukraine
State Agency for Investment and National Projects of Ukraine
www. ukrproject.gov.ua/en
SOME AUTHORITIES
Verkhovna Rada of Ukraine (Parliament)
www.rada.gov.ua
Ministry of Economic Development and Trade of Ukraine
www.me.gov.ua
Ministry of Finance Of Ukraine
www.minfin.gov.ua
Ministry of Foreign Affairs of Ukraine
www.mfa.gov.ua
National Bank of Ukraine
www.bank.gov.ua
Information subject to changes
34
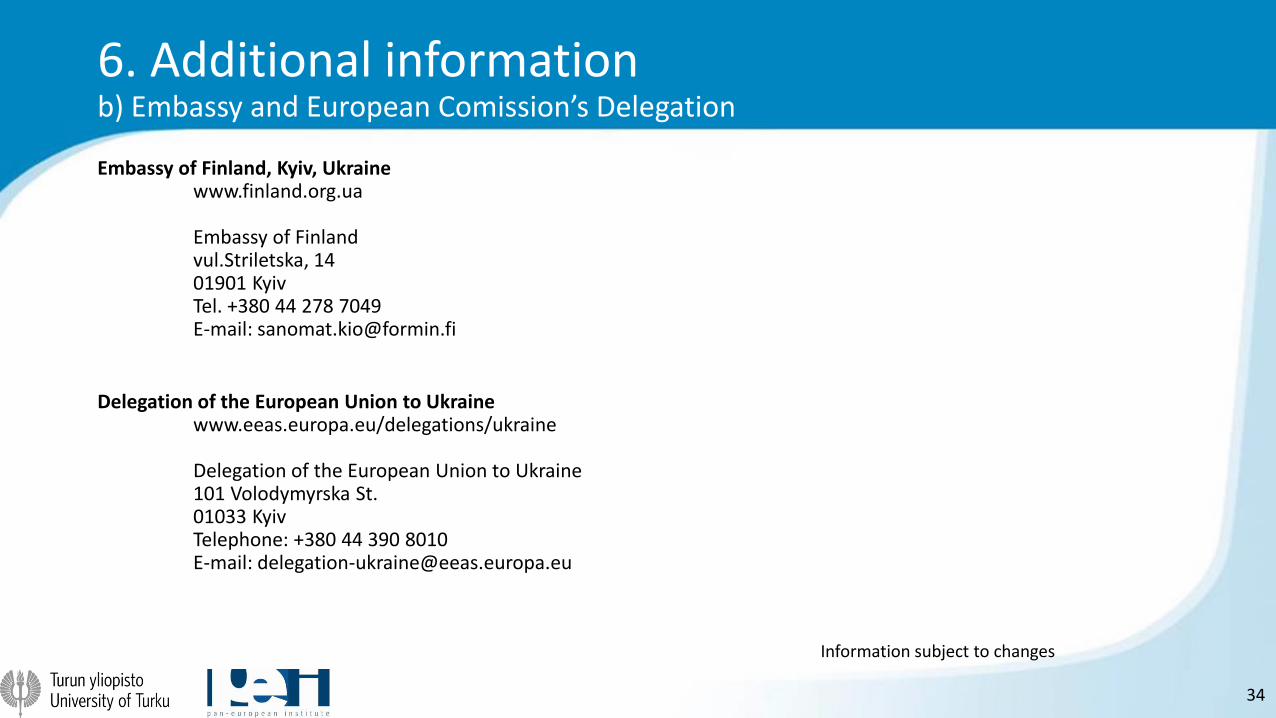
6. Additional informationb) Embassy and European Comission’s Delegation
Embassy of Finland, Kyiv, Ukrainewww.finland.org.ua
Embassy of Finlandvul.Striletska, 1401901 KyivTel. +380 44 278 7049E-mail: [email protected]
Delegation of the European Union to Ukrainewww.eeas.europa.eu/delegations/ukraine
Delegation of the European Union to Ukraine101 Volodymyrska St. 01033 KyivTelephone: +380 44 390 8010E-mail: [email protected]
Information subject to changes
35
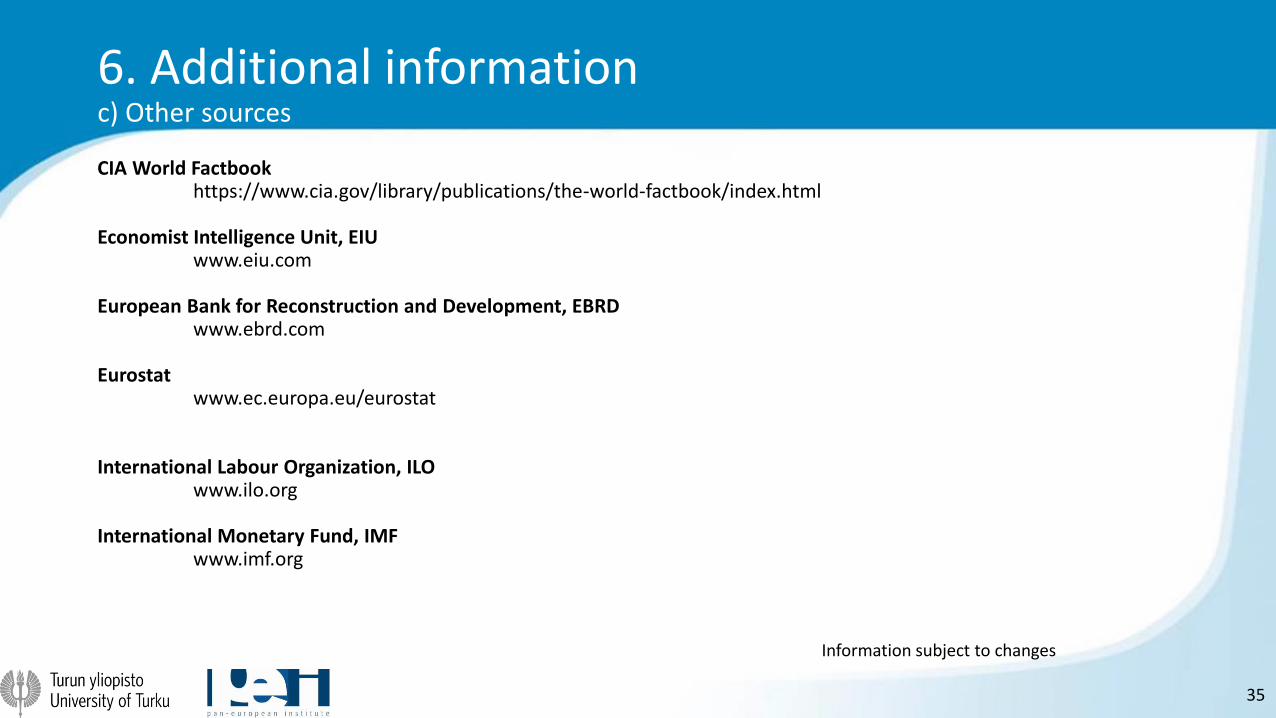
6. Additional informationc) Other sources
CIA World Factbookhttps://www.cia.gov/library/publications/the-world-factbook/index.html
Economist Intelligence Unit, EIUwww.eiu.com
European Bank for Reconstruction and Development, EBRDwww.ebrd.com
Eurostatwww.ec.europa.eu/eurostat
International Labour Organization, ILOwww.ilo.org
International Monetary Fund, IMFwww.imf.org
Information subject to changes
36
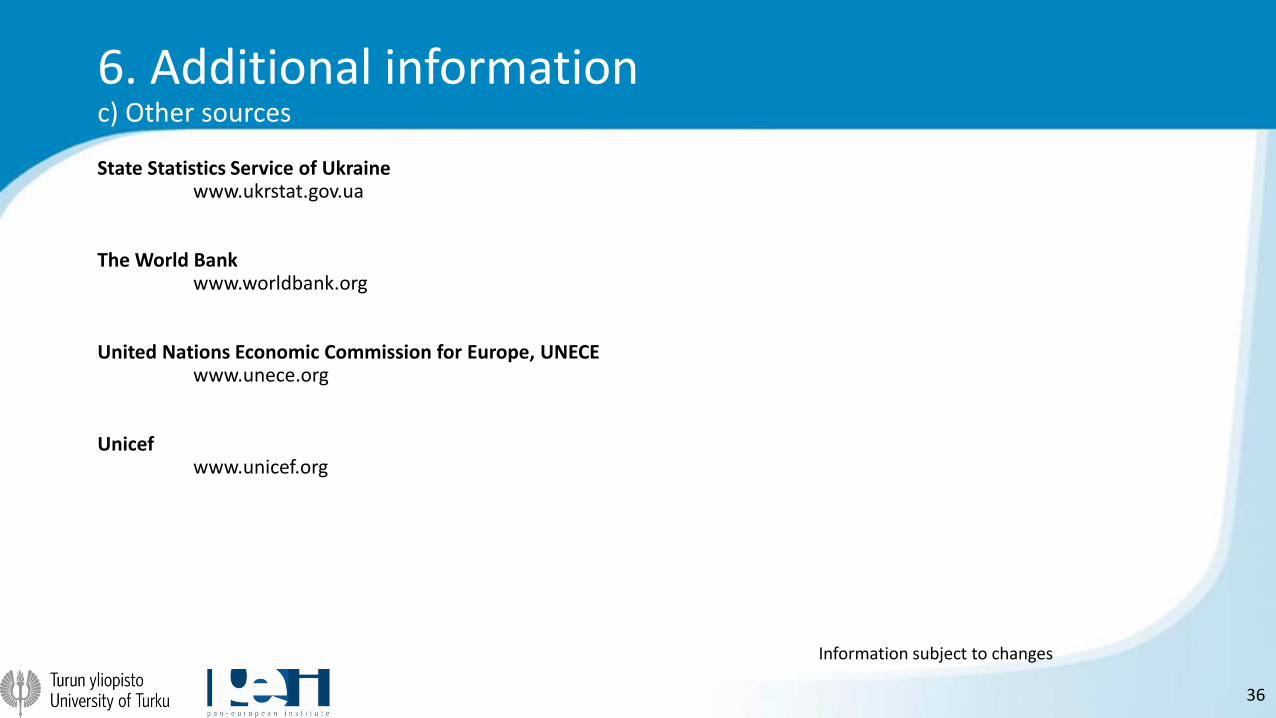
6. Additional informationc) Other sources
State Statistics Service of Ukrainewww.ukrstat.gov.ua
The World Bankwww.worldbank.org
United Nations Economic Commission for Europe, UNECEwww.unece.org
Unicefwww.unicef.org
Information subject to changes