ubs global financial services conference - morgan · pdf fileagenda • business overview...
TRANSCRIPT

This slide is part of a presentation by Morgan Stanley and is intended to be viewed as part of that presentation. The presentation is based on information generally available to the public and does not contain any material, non-public information. No representation is made that it is accurate or complete. The presentation has been prepared solely for informational purposes, is neither an offer to sell nor the solicitation of an offer to buy any security or instrument and has not been updated since it was originally presented.
UBS Global Financial Services Conference
James P. Gorman, Co-President
Colm Kelleher, Chief Financial Officer
May 13, 2008
2This slide is part of a presentation by Morgan Stanley and is intended to be viewed as part of that presentation. The presentation is based on information generally available to the public and does not contain any material, non-public information. No representation is made that it is accurate or complete. The presentation has been prepared solely for informational purposes, is neither an offer to sell nor the solicitation of an offer to buy any security or instrument and has not been updated since it was originally presented.
Notice
The information provided herein may include certain non-GAAP financial measures. The reconciliation of such measures to the comparable GAAP figures are included in the Company’s Annual Reports on Form 10-K, Quarterly Reports on Form 10-Q and Current Reports on Form 8-K, including any amendments thereto, which are available on www.morganstanley.com.
This presentation may contain forward-looking statements. You are cautioned not to place undue reliance on forward-looking statements, which speak only as of the date on which they are made, which reflect management’s current estimates, projections, expectations or beliefs and which are subject to risks and uncertainties that may cause actual results to differ materially. For a discussion of risks and uncertainties that may affect the future results of the Company, please see “Forward-Looking Statements” immediately preceding Part I, Item 1, “Competition” and “Regulation” in Part I, Item 1, “Risk Factors” in Part I, Item 1A, “Legal Proceedings” in Part I, Item 3, “Management’s Discussion and Analysis of Financial Condition and Results of Operations” in Part II, Item 7 and “Quantitative and Qualitative Disclosures About Market Risk”in Part II, Item 7A of the Company’s Annual Report on Form 10-K for the fiscal year ended November 30, 2007, the Company’s Quarterly Report on Form 10-Q for the fiscal quarter ended February 29, 2008 and Current Reports on Form 8-K.

James P. GormanCo-President

Agenda
• Business Overview
− Accelerating Global Wealth Management
− Redefining Asset Management
− Refocusing Institutional Securities
• Market Environment and Outlook

5This slide is part of a presentation by Morgan Stanley and is intended to be viewed as part of that presentation. The presentation is based on information generally available to the public and does not contain any material, non-public information. No representation is made that it is accurate or complete. The presentation has been prepared solely for informational purposes, is neither an offer to sell nor the solicitation of an offer to buy any security or instrument and has not been updated since it was originally presented.
Business Overview – Strategic Priorities
• Refocusing the business
• Disciplined operating approach
• Market share opportunities
• Investing strategically
− Commodities
− Emerging markets
− Prime Brokerage
• Accelerating growth
• Weak competitive landscape
• Growing flows and Financial Advisors
• Low capital usage
• Redefining the business
• Taking action for growth
− Leverage Alternatives
− Enhance product offering
− Investing in Non-U.S. markets
− Building Private Equityand Infrastructureproduct platforms
Institutional SecuritiesGlobal Wealth Management Asset Management

6This slide is part of a presentation by Morgan Stanley and is intended to be viewed as part of that presentation. The presentation is based on information generally available to the public and does not contain any material, non-public information. No representation is made that it is accurate or complete. The presentation has been prepared solely for informational purposes, is neither an offer to sell nor the solicitation of an offer to buy any security or instrument and has not been updated since it was originally presented.
Business Overview
20072006
Institutional Securities Global Wealth Management Asset Management
70%18%
12%
1Q 2008
Net Revenue Composition (1)
57%
24%
19%
74%19%
7%
Source: Morgan Stanley SEC Filings
(1) Net revenue composition excludes Intersegment Eliminations of ($236MM) in 2006, ($241MM) in 2007 and ($40MM) in 1Q 2008.

7This slide is part of a presentation by Morgan Stanley and is intended to be viewed as part of that presentation. The presentation is based on information generally available to the public and does not contain any material, non-public information. No representation is made that it is accurate or complete. The presentation has been prepared solely for informational purposes, is neither an offer to sell nor the solicitation of an offer to buy any security or instrument and has not been updated since it was originally presented.
Growth Stages
Asset Management
Global Wealth
Management
Stage One
Restructure then stabilize
Increase flows
Improve FinancialAdvisory productivity
Product investments
Build Alternatives foundation
Seed new products
Re-enter Private Equity
Build out Infrastructure
Stage Two
Improve margins
Organic growth
Expand internationally
Enhance technology /operations
Continue to attract talent
Generate flows
• Restructure CoreAsset Management
• Leverage Alternativesstrong performance
Stage Three
• Growth throughacquisition
• Competitive PBT margin
• Competitive fund flows
• Competitive PBT margin

8This slide is part of a presentation by Morgan Stanley and is intended to be viewed as part of that presentation. The presentation is based on information generally available to the public and does not contain any material, non-public information. No representation is made that it is accurate or complete. The presentation has been prepared solely for informational purposes, is neither an offer to sell nor the solicitation of an offer to buy any security or instrument and has not been updated since it was originally presented.
Global Wealth Management – Metrics that Matter
Revenue Growth
Pre-Tax Margin
1st / 2nd Quintile Turnover
Net New Money
Fee-Based Assets
Client Assets in $1MM+ households
Deposit Sweep
Revenue per Financial Advisor
Assets per Financial Advisor
2005
8%
8%
11%
$(2.7)Bn
27%
64%
$1.7Bn
$502K
$65MM
Original 3-Year Aspiration
10%+
20%+
<5%
$25 – 30Bn
35%+
75%
$25Bn+
$700K+
$95MM+
2007
20%
17%
6%
$40Bn
27%
72%
$26.2Bn
$811K
$90MM
(1)
(2)
(1) 1Q08
6%
16%
6%
$11.4Bn
26%
71%
$33.4Bn
$761K
$85MM
(1)
(3)
Source: Company SEC Filings and Earnings Releases
(1) Metrics either quarterly or annual, as applicable.(2) 2005 Pre-Tax Margin excludes $198MM in September 11th related insurance recoveries.(3) Excludes corporate / other assets.
9This slide is part of a presentation by Morgan Stanley and is intended to be viewed as part of that presentation. The presentation is based on information generally available to the public and does not contain any material, non-public information. No representation is made that it is accurate or complete. The presentation has been prepared solely for informational purposes, is neither an offer to sell nor the solicitation of an offer to buy any security or instrument and has not been updated since it was originally presented.
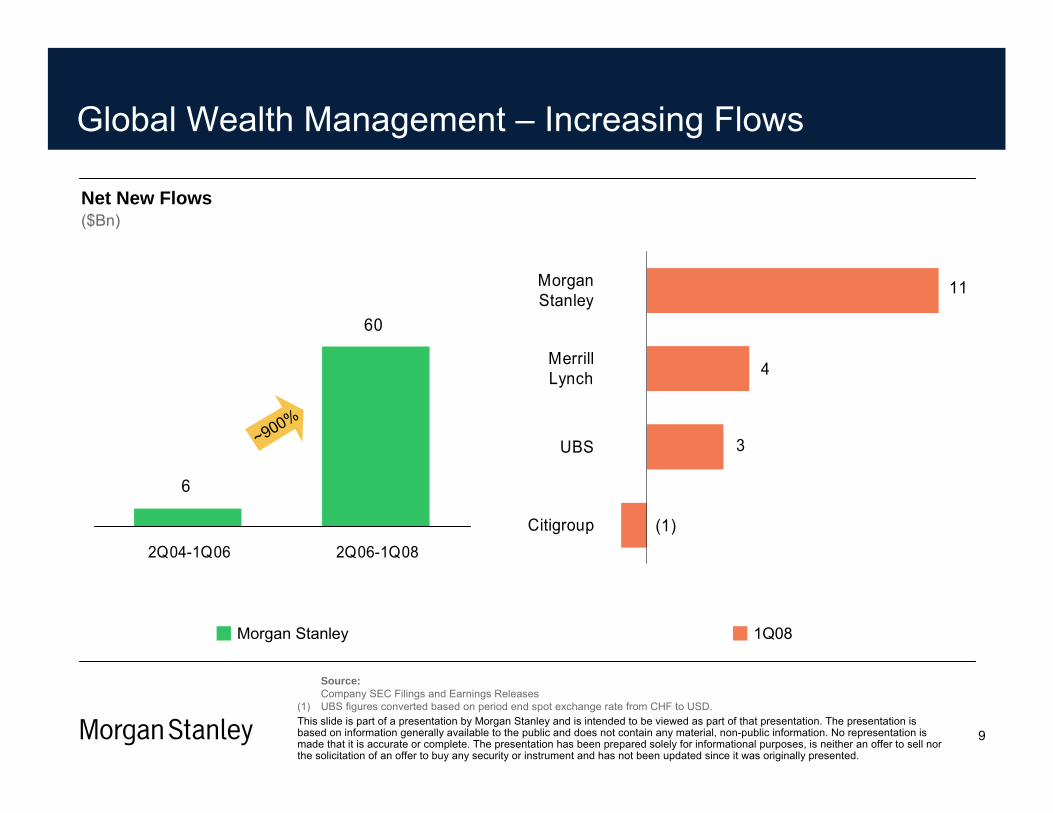
Global Wealth Management – Increasing Flows
Source: Company SEC Filings and Earnings Releases
(1) UBS figures converted based on period end spot exchange rate from CHF to USD.
60
6
2Q04-1Q06 2Q06-1Q08
($Bn)Net New Flows
Morgan Stanley
~900%
11
4
3
(1)Citigroup
UBS
MerrillLynch
MorganStanley
1Q08

10This slide is part of a presentation by Morgan Stanley and is intended to be viewed as part of that presentation. The presentation is based on information generally available to the public and does not contain any material, non-public information. No representation is made that it is accurate or complete. The presentation has been prepared solely for informational purposes, is neither an offer to sell nor the solicitation of an offer to buy any security or instrument and has not been updated since it was originally presented.
Global Wealth Management – Accelerating Growth
1. Product Investments
2. Expense Discipline
3. Technology / Operations
4. Geographic Focus
5. Talent
– Banking, Alternatives, Insurance, Retirement, Structured, FX, Deposits
– Project Prioritization– Rationalize Support Structure
– Improved Client Access and Reporting– Tools for Financial Advisors– Automated Management Reporting
– Latin America, India, China, Middle East– U.S. Major Metropolitan Markets
– “Firm of Choice” for $1 million Producers
11This slide is part of a presentation by Morgan Stanley and is intended to be viewed as part of that presentation. The presentation is based on information generally available to the public and does not contain any material, non-public information. No representation is made that it is accurate or complete. The presentation has been prepared solely for informational purposes, is neither an offer to sell nor the solicitation of an offer to buy any security or instrument and has not been updated since it was originally presented.
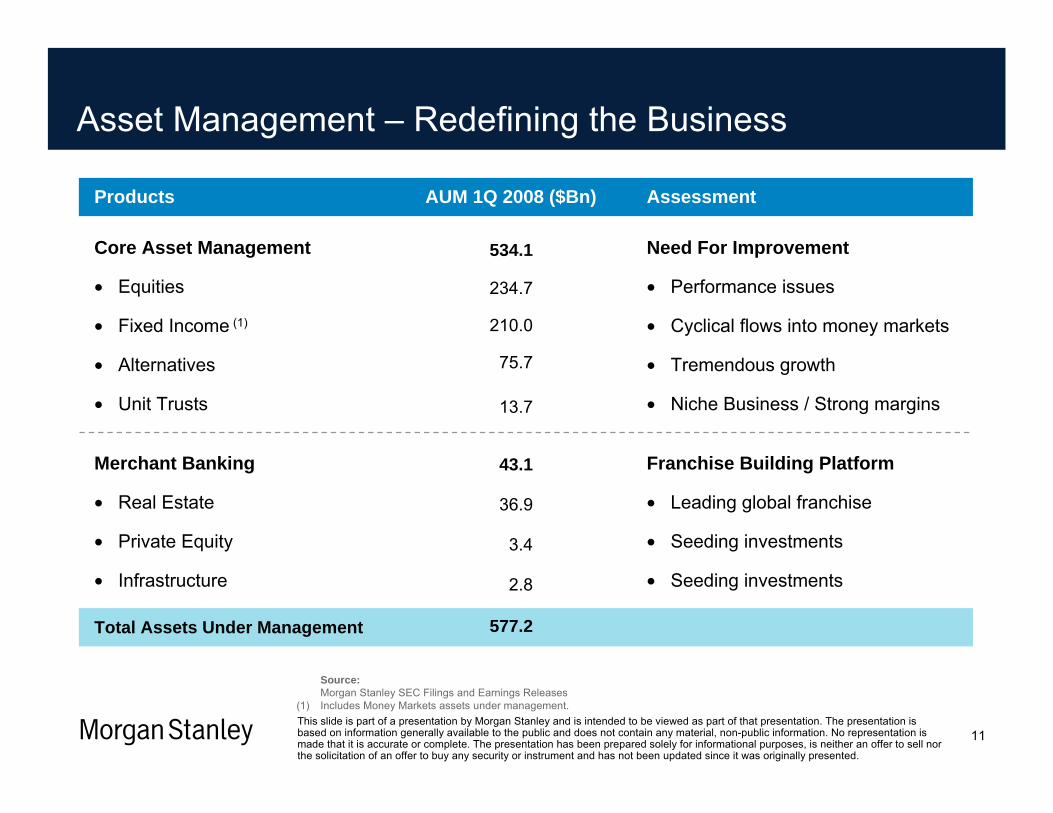
Asset Management – Redefining the Business
Assessment
Need For Improvement
• Performance issues
• Cyclical flows into money markets
• Tremendous growth
• Niche Business / Strong margins
Franchise Building Platform
• Leading global franchise
• Seeding investments
• Seeding investments
AUM 1Q 2008 ($Bn)
75.7
210.0
234.7
534.1
13.7
577.2
2.8
3.4
36.9
43.1
Products
Core Asset Management
• Equities
• Fixed Income (1)
• Alternatives
• Unit Trusts
Total Assets Under Management
Merchant Banking
• Real Estate
• Private Equity
• Infrastructure
Source: Morgan Stanley SEC Filings and Earnings Releases
(1) Includes Money Markets assets under management.

12This slide is part of a presentation by Morgan Stanley and is intended to be viewed as part of that presentation. The presentation is based on information generally available to the public and does not contain any material, non-public information. No representation is made that it is accurate or complete. The presentation has been prepared solely for informational purposes, is neither an offer to sell nor the solicitation of an offer to buy any security or instrument and has not been updated since it was originally presented.
Asset Management – Redefining the Business
Need For Improvement
• Performance issues
• Cyclical flows into money markets
Expanding internationally
Need For Improvement
• Rebuilding reputation and business
• Cyclical flows into money markets
Significant Growth
Need For Improvement
AssessmentDistribution Channels
Retail
• Retail
• Retail Money Markets
Intermediary
Institutional
• Institutional
• Institutional Money Markets
Non – U.S.
Share of Minority Interest Assets
Total Assets Under Management
AUM 1Q 2008 ($Bn)
64.0
33.3
145.9
179.3
7.0
123.4
75.7
127.8
199.1
577.2
Source: Morgan Stanley SEC Filings and Earnings Releases

13This slide is part of a presentation by Morgan Stanley and is intended to be viewed as part of that presentation. The presentation is based on information generally available to the public and does not contain any material, non-public information. No representation is made that it is accurate or complete. The presentation has been prepared solely for informational purposes, is neither an offer to sell nor the solicitation of an offer to buy any security or instrument and has not been updated since it was originally presented.
Asset Management – Revenues
1Q07Revenues
PrincipalInvestments
PrincipalTrading
Interest /Dividends
InvestmentBanking
Commissions Other Mgt. DistAdmin Fees
1Q08Revenues
Asset Management Net Revenues – 1Q 2008 vs. 1Q 2007($MM)
1,368
(733)
(179) (20) (5) (2)
3777 543
Source: Morgan Stanley SEC Filings and Earnings Releases
(1) Includes SIV losses.
(1)

14This slide is part of a presentation by Morgan Stanley and is intended to be viewed as part of that presentation. The presentation is based on information generally available to the public and does not contain any material, non-public information. No representation is made that it is accurate or complete. The presentation has been prepared solely for informational purposes, is neither an offer to sell nor the solicitation of an offer to buy any security or instrument and has not been updated since it was originally presented.
Equity Unit Trusts Alternatives Fixed Income
Core Asset Management – Flows
Source: Morgan Stanley SEC Filings and Earnings Releases
(1) U.S.(2) Americas.(3) Americas Morgan Stanley and Van Kampen brands.(4) Europe and Asia.
1Q 2008 Net Flows – $6.1Bn($Bn)
Institutional MMkt
Retail MMkt
Institutional (1)
Retail (3)
Intermediary (2)
Non-U.S. (4)
8.9
4.4
(0.3)
(6.9)

15This slide is part of a presentation by Morgan Stanley and is intended to be viewed as part of that presentation. The presentation is based on information generally available to the public and does not contain any material, non-public information. No representation is made that it is accurate or complete. The presentation has been prepared solely for informational purposes, is neither an offer to sell nor the solicitation of an offer to buy any security or instrument and has not been updated since it was originally presented.
Asset Management – Current Focus and Priorities
• Expense discipline
• Rationalize fund offerings
• Re-focus on performance across all core products
• Leverage investments in Lansdowne, Avenue and Traxis
• Successfully closed $4 billion Infrastructure fund
• Raise Private Equity fund
• Raise Morgan Stanley Real Estate Fund (MSREF) VII
• Restructure management team to reflect current priorities
Source: Morgan Stanley Press Releases

Colm KelleherChief Financial Officer

17This slide is part of a presentation by Morgan Stanley and is intended to be viewed as part of that presentation. The presentation is based on information generally available to the public and does not contain any material, non-public information. No representation is made that it is accurate or complete. The presentation has been prepared solely for informational purposes, is neither an offer to sell nor the solicitation of an offer to buy any security or instrument and has not been updated since it was originally presented.
Institutional Securities – Refocusing the Business
($MM)Net Revenue
(1)Fixed Income Equity Investment Banking Other Inst.Securities
5,462 5,567 6,3469,003
1,805
3,591 4,0674,810
6,281
8,6583,329
2,096
980
947
1,598
2,545
(592)
2,959
3,394
5,538
4,228
400
152
99
2003 2004 2005 2006 2007 1Q08
21,110
11,301
12,993
15,49716,149
6,213
Source: Morgan Stanley SEC Filings and Earnings Releases
(1) Represents combined revenues from Fixed Income Sales and Trading and Other Sales and Trading. Other Sales and Trading primarilyincludes net losses from mark-to-market loans and closed and pipeline commitments, results related to Investment Banking and other activities. Prior to 2005, excludes net revenues associated with corporate lending activities and certain other adjustments.

18This slide is part of a presentation by Morgan Stanley and is intended to be viewed as part of that presentation. The presentation is based on information generally available to the public and does not contain any material, non-public information. No representation is made that it is accurate or complete. The presentation has been prepared solely for informational purposes, is neither an offer to sell nor the solicitation of an offer to buy any security or instrument and has not been updated since it was originally presented.
Institutional Securities – Strategic Priorities
Investments
• Continue to aggressively grow in emerging markets
• Build upon growth initiatives in equity derivatives
• Continue global expansion of prime brokerage
• Opportunistically build out commodities business
• Technology to enhance capital allocation and evaluation of trading opportunities
Opportunities
• Reallocate capital and human resources to areas of growth
• Help clients restructure risk positions
• Take advantage of trading opportunities created by market dislocations
• Provide solutions to clients’ asset / liability mismatch challenges
• Maximize the Firm’s relationship network

19This slide is part of a presentation by Morgan Stanley and is intended to be viewed as part of that presentation. The presentation is based on information generally available to the public and does not contain any material, non-public information. No representation is made that it is accurate or complete. The presentation has been prepared solely for informational purposes, is neither an offer to sell nor the solicitation of an offer to buy any security or instrument and has not been updated since it was originally presented.
Market Environment
● High leverage
● Securitization growth
● Expansion of derivatives
● Insurance by monolines
● De-leveraging
● Lack of liquidity
● Asset price deterioration
● Capital constrained
● Asset downgrades
● Recognize losses
● Raise capital
● Extend loans
● Asset dispositions
● Leverage equilibrium
Pre-Crisis Credit Crisis Resolution

20This slide is part of a presentation by Morgan Stanley and is intended to be viewed as part of that presentation. The presentation is based on information generally available to the public and does not contain any material, non-public information. No representation is made that it is accurate or complete. The presentation has been prepared solely for informational purposes, is neither an offer to sell nor the solicitation of an offer to buy any security or instrument and has not been updated since it was originally presented.
● Risk adjusted return on capital
● Temporarily suspended share buyback program
● CIC Investment
● Reduced re-financing risk
● Strengthened liquidity position at the parent level
● Reduced both gross and adjusted leveraged ratios during 1Q 2008
Operating Discipline
Three Key Tenets
Capital Liquidity Balance Sheet

21This slide is part of a presentation by Morgan Stanley and is intended to be viewed as part of that presentation. The presentation is based on information generally available to the public and does not contain any material, non-public information. No representation is made that it is accurate or complete. The presentation has been prepared solely for informational purposes, is neither an offer to sell nor the solicitation of an offer to buy any security or instrument and has not been updated since it was originally presented.
Active Capital Management
747899
1,1211,045 1,091
637566638482410
2004 2005 2006 2007 1Q08
Total Assets($Bn)
Adjusted Assets
Adjusted Leverage Ratio(2)
17.6x14.2x 16.4x 17.3x
Gross Leverage Ratio(1)
32.6x25.9x 30.5x 30.5x
16.0x
27.4x
Source: Morgan Stanley SEC Filings and Earnings Releases
(1) Gross leverage ratio equals total assets divided by tangible shareholders’ equity.(2) Adjusted leverage ratio equals adjusted total assets divided by tangible shareholders’ equity.

22This slide is part of a presentation by Morgan Stanley and is intended to be viewed as part of that presentation. The presentation is based on information generally available to the public and does not contain any material, non-public information. No representation is made that it is accurate or complete. The presentation has been prepared solely for informational purposes, is neither an offer to sell nor the solicitation of an offer to buy any security or instrument and has not been updated since it was originally presented.
Liquidity
Source: Morgan Stanley SEC Filings and Earnings Conference Call
Average Liquidity Reserve per Quarter($Bn)
46 3849
64 71
30
44
56
52
68
93
120 123
6
52
1Q07 2Q07 3Q07 4Q07 1Q08
Parent Bank and Other Subsidiaries

23This slide is part of a presentation by Morgan Stanley and is intended to be viewed as part of that presentation. The presentation is based on information generally available to the public and does not contain any material, non-public information. No representation is made that it is accurate or complete. The presentation has been prepared solely for informational purposes, is neither an offer to sell nor the solicitation of an offer to buy any security or instrument and has not been updated since it was originally presented.
Market Developments
• Credit markets to remain challenged for at least several more quarters
• Challenging implications for Broker-Dealer model− More active Fed and regulatory environment− Intensified focus on leverage, capital and liquidity− ROEs likely to be constrained
• Market environment also suggests the re-examination of− Greater diversification, both globally and through the businesses,
particularly wealth and asset management− Greater scale to improve margins given stickier expenses and investment
required to support global growth
23

24This slide is part of a presentation by Morgan Stanley and is intended to be viewed as part of that presentation. The presentation is based on information generally available to the public and does not contain any material, non-public information. No representation is made that it is accurate or complete. The presentation has been prepared solely for informational purposes, is neither an offer to sell nor the solicitation of an offer to buy any security or instrument and has not been updated since it was originally presented.
Market Outlook
• Balance sheet de-leveraging
• Industry de-risking
• Regulatory evolution
• Credit markets to remain challenged
• Transparency of exposures industry-wide

This slide is part of a presentation by Morgan Stanley and is intended to be viewed as part of that presentation. The presentation is based on information generally available to the public and does not contain any material, non-public information. No representation is made that it is accurate or complete. The presentation has been prepared solely for informational purposes, is neither an offer to sell nor the solicitation of an offer to buy any security or instrument and has not been updated since it was originally presented.
UBS Global Financial Services Conference
James P. Gorman, Co-President
Colm Kelleher, Chief Financial Officer
May 13, 2008