ubai esidential maret eport ubai esidential maret eport · dubai house price timeline sales price...
TRANSCRIPT
© Property Monitor 2018 | propertymonitor.ae 32
Dubai Residential Market Report Dubai Residential Market Report
The UAE’s only real estate data source offered by accredited property professionals
Property Monitor is the UAE’s only real estate intelligence platform offered by RICS accredited property professionals, Cavendish Maxwell. It gives us great pleasure to be working alongside Cityscape as their official data partner for the 17th edition of Cityscape Global.
Our data and intelligence service is aimed at increasing transparency in the UAE marketplace. Agencies, developers, banks and consultancies can access real-time data, across multiple data points, and expert intelligence in order to make more informed decisions, based on actual transactions, valuations and trends.
Property Monitor offers users the ability to search up-to-date residential sales and leasing transactions, off-plan sales, commercial transactions, valuation data as well as our professional opinion on achievable prices, across all major areas of Dubai and Abu Dhabi.
CONTENTSFOREWORD
House Price Timeline
Price Performance
Rent Performance
Q4 2018 - Q1 2019 Upcoming Supply
Residential Sales Overview
Property Monitor Residential Survey
Methodology
4
6
8
10
12
13
14
2
© Property Monitor 2018 | propertymonitor.ae 54
Dubai Residential Market Report Dubai Residential Market Report
The UAE’s only real estate data source offered by accredited property professionals
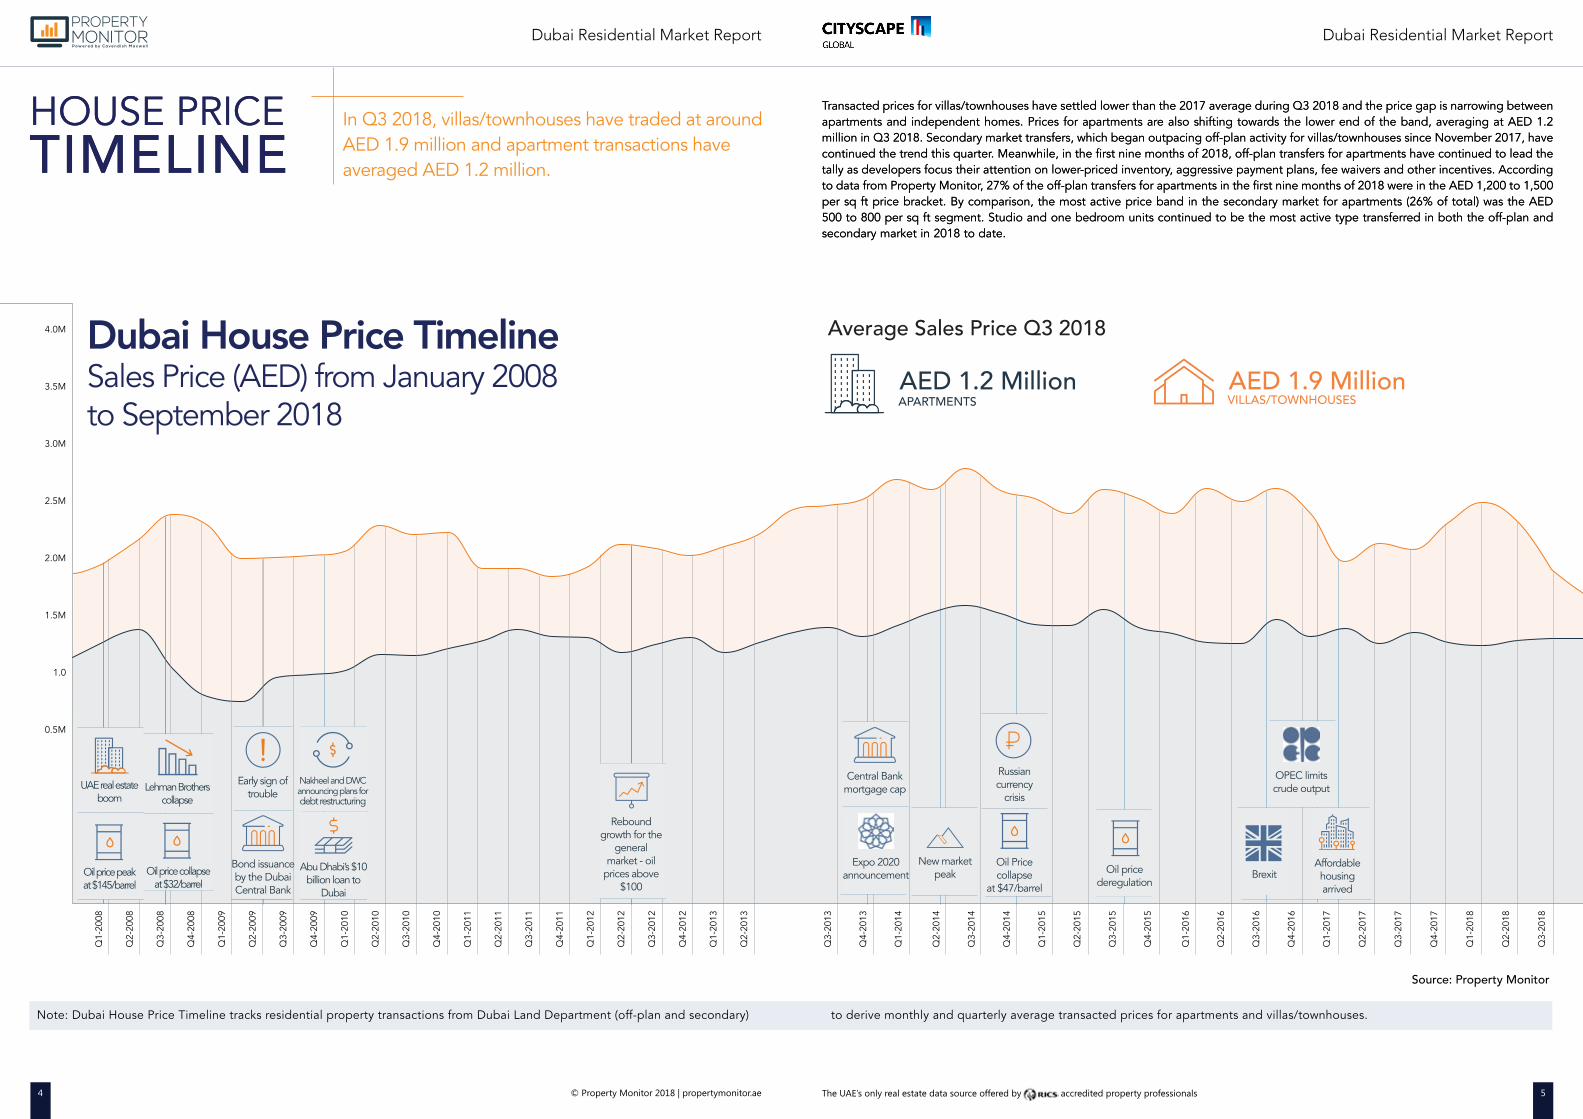
In Q3 2018, villas/townhouses have traded at around AED 1.9 million and apartment transactions have averaged AED 1.2 million.
Dubai House Price TimelineSales Price (AED) from January 2008to September 2018
VILLAS/TOWNHOUSESAED 1.9 Million
Average Sales Price Q3 2018
APARTMENTSAED 1.2 Million
Transacted prices for villas/townhouses have settled lower than the 2017 average during Q3 2018 and the price gap is narrowing between apartments and independent homes. Prices for apartments are also shifting towards the lower end of the band, averaging at AED 1.2 million in Q3 2018. Secondary market transfers, which began outpacing off-plan activity for villas/townhouses since November 2017, have continued the trend this quarter. Meanwhile, in the first nine months of 2018, off-plan transfers for apartments have continued to lead the tally as developers focus their attention on lower-priced inventory, aggressive payment plans, fee waivers and other incentives. According to data from Property Monitor, 27% of the off-plan transfers for apartments in the first nine months of 2018 were in the AED 1,200 to 1,500 per sq ft price bracket. By comparison, the most active price band in the secondary market for apartments (26% of total) was the AED 500 to 800 per sq ft segment. Studio and one bedroom units continued to be the most active type transferred in both the off-plan and secondary market in 2018 to date.
Source: Property Monitor
HOUSE PRICETIMELINE
Transacted prices for villas/townhouses have settled lower than the 2017 average during Q3 2018 and the price gap is narrowing between apartments and independent homes. Prices for apartments are also shifting towards the lower end of the band, averaging at AED 1.2 million in Q3 2018. Secondary market transfers, which began outpacing off-plan activity for villas/townhouses since November 2017, have continued the trend this quarter. Meanwhile, in the first nine months of 2018, off-plan transfers for apartments have continued to lead the tally as developers focus their attention on lower-priced inventory, aggressive payment plans, fee waivers and other incentives. According to data from Property Monitor, 27% of the off-plan transfers for apartments in the first nine months of 2018 were in the AED 1,200 to 1,500 per sq ft price bracket. By comparison, the most active price band in the secondary market for apartments (26% of total) was the AED 500 to 800 per sq ft segment. Studio and one bedroom units continued to be the most active type transferred in both the off-plan and secondary market in 2018 to date.
HOUSE PRICETIMELINE
Note: Dubai House Price Timeline tracks residential property transactions from Dubai Land Department (off-plan and secondary) to derive monthly and quarterly average transacted prices for apartments and villas/townhouses.
Q1-
2008
Q2-
2008
Q3-
2008
Q4-
2008
Q1-
2009
Q2-
2009
Q3-
2009
Q4-
2009
Q1-
2010
Q2-
2010
Q3-
2010
Q4-
2010
Q1-
2011
Q2-
2011
Q3-
2011
Q4-
2011
Q1-
2012
Q2-
2012
Q3-
2012
Q4-
2012
Q1-
2013
Q2-
2013
Q3-
2013
Q4-
2013
Q1-
2014
Q2-
2014
Q3-
2014
Q4-
2014
Q1-
2015
Q2-
2015
Q3-
2015
Q4-
2015
Q1-
2016
Q2-
2016
Q3-
2016
Q4-
2016
Q1-
2017
Q2-
2017
Q3-
2017
Q4-
2017
Q1-
2018
Q2-
2018
Q3-
2018
Oil Price collapse
at $47/barrel
Oil pricederegulation
New market peak
Russian currency
crisis
OPEC limitscrude output
BrexitAffordablehousingarrived
Central Bankmortgage cap
Expo 2020announcement
Rebound growth for the
generalmarket - oil
prices above $100
Nakheel and DWCannouncing plans fordebt restructuring
Abu Dhabi’s $10 billion loan to
Dubai
Early sign oftrouble
Bond issuanceby the DubaiCentral Bank
Lehman Brotherscollapse
Oil price collapseat $32/barrel
UAE real estate boom
Oil price peakat $145/barrel
4.0M
3.5M
3.0M
2.5M
2.0M
1.5M
1.0
0.5M
© Property Monitor 2018 | propertymonitor.ae 76
Dubai Residential Market Report Dubai Residential Market Report
The UAE’s only real estate data source offered by accredited property professionals
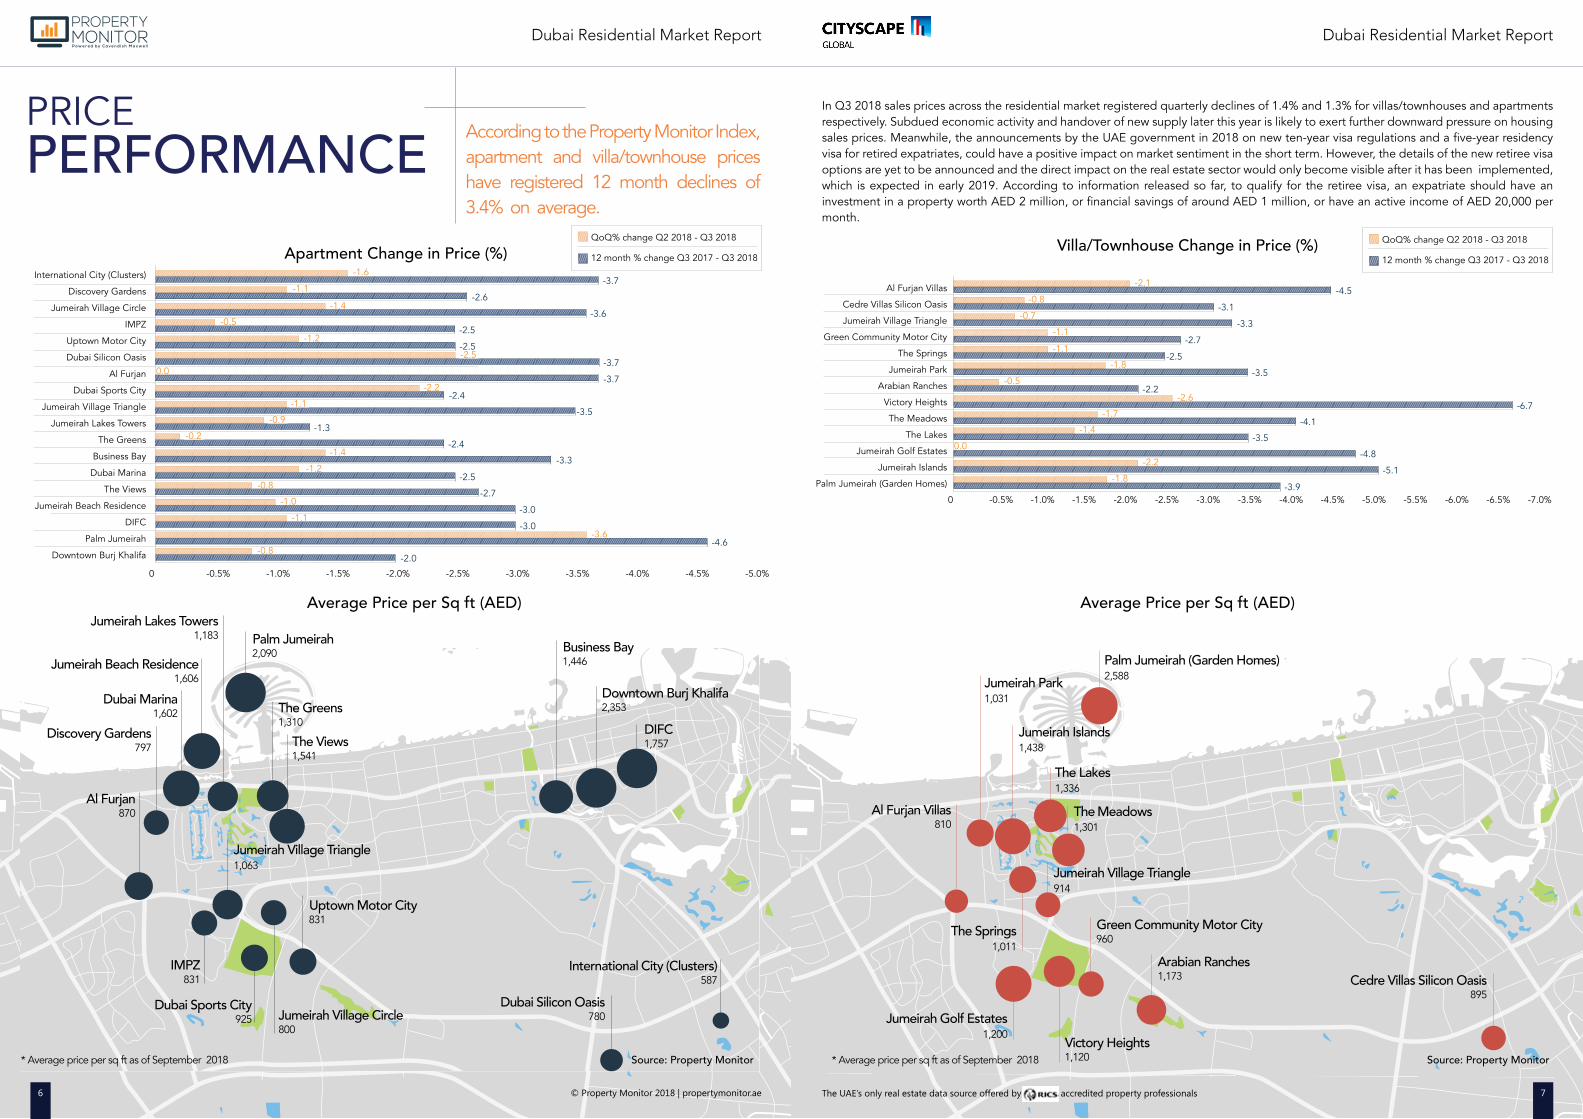
PRICEPERFORMANCE According to the Property Monitor Index,
apartment and villa/townhouse prices have registered 12 month declines of 3.4% on average.
Palm Jumeirah
The Views
Jumeirah Village Circle
Uptown Motor City
The GreensDIFC
International City (Clusters)
Dubai Silicon OasisDubai Sports City
IMPZ
Jumeirah Village Triangle
Al Furjan
Discovery Gardens
Dubai Marina
Jumeirah Beach Residence
Jumeirah Lakes Towers
Downtown Burj Khalifa
Business Bay2,090
1,541
800
831
1,310
1,757
587
780925
831
1,063
870
797
1,602
1,606
1,183
2,353
1,446
International City (Clusters)
Discovery Gardens
Jumeirah Village Circle
IMPZ
Uptown Motor City
Dubai Silicon Oasis
Al Furjan
Dubai Sports City
Jumeirah Village Triangle
Jumeirah Lakes Towers
The Greens
Business Bay
Dubai Marina
The Views
Jumeirah Beach Residence
DIFC
Palm Jumeirah
Downtown Burj Khalifa
0 -0.5% -1.0% -1.5% -2.0% -2.5% -3.0% -3.5% -4.0% -4.5% -5.0%
-1.6
-1.1
-3.6
-3.7
-2.6
-3.0
-3.6
-1.3
-2.5
-4.6
-2.0
-2.5
-2.7
-3.5
-3.7
-3.0
-1.1
-1.1
-0.9
-0.2
-2.5
-2.5
Apartment Change in Price (%)
Average Price per Sq ft (AED)
Source: Property Monitor
-3.7
-1.4
* Average price per sq ft as of September 2018
-2.4
QoQ% change Q2 2018 - Q3 2018
12 month % change Q3 2017 - Q3 2018
6
-3.3
-2.4
-2.1
-0.7
-0.8-4.5
-3.1
-3.3
-3.5
-2.5
-4.8
-3.9
-3.5
-1.7
-2.6
-1.4
0.0
-1.8
-1.8
Average Price per Sq ft (AED)
-1.1
-2.2
-6.7
In Q3 2018 sales prices across the residential market registered quarterly declines of 1.4% and 1.3% for villas/townhouses and apartments respectively. Subdued economic activity and handover of new supply later this year is likely to exert further downward pressure on housing sales prices. Meanwhile, the announcements by the UAE government in 2018 on new ten-year visa regulations and a five-year residency visa for retired expatriates, could have a positive impact on market sentiment in the short term. However, the details of the new retiree visa options are yet to be announced and the direct impact on the real estate sector would only become visible after it has been implemented, which is expected in early 2019. According to information released so far, to qualify for the retiree visa, an expatriate should have an investment in a property worth AED 2 million, or financial savings of around AED 1 million, or have an active income of AED 20,000 per month.
Green Community Motor City
Arabian Ranches
Victory Heights
Cedre Villas Silicon Oasis
Jumeirah Village Triangle
The Springs
Jumeirah Golf Estates
The Meadows
The Lakes
Jumeirah Park
Jumeirah Islands
Palm Jumeirah (Garden Homes)
Al Furjan Villas
960
1,173
1,120
895
914
1,011
1,200
1,301
1,336
1,031
1,438
2,588
810
-2.2
Villa/Townhouse Change in Price (%)
* Average price per sq ft as of September 2018 Source: Property Monitor
Al Furjan Villas
Cedre Villas Silicon Oasis
Jumeirah Village Triangle
Green Community Motor City
The Springs
Jumeirah Park
Arabian Ranches
Victory Heights
The Meadows
The Lakes
Jumeirah Golf Estates
Jumeirah Islands
Palm Jumeirah (Garden Homes)
-1.1
-0.5
-2.7
0 -0.5% -1.0% -1.5% -2.0% -2.5% -3.0% -3.5% -4.0% -4.5% -5.0% -5.5% -6.0% -6.5% -7.0%
7
-4.1
-5.1
QoQ% change Q2 2018 - Q3 2018
12 month % change Q3 2017 - Q3 2018
-0.8
-1.0
-0.8
-2.2
0.0
-1.2
-0.5
-1.4
-1.2
The UAE’s only real estate data source offered by accredited property professionals© Property Monitor 2018 | propertymonitor.ae
© Property Monitor 2018 | propertymonitor.ae 98
Dubai Residential Market Report Dubai Residential Market Report
The UAE’s only real estate data source offered by accredited property professionals
The SpringsJumeirahPark
Dubai MarinaThe Lakes
Al Furjan Villas
Jumeirah Golf Estates
Jumeirah Beach ResidenceThe Greens
The Views
Discovery Gardens
AED 129,906
AED 127,036
AED 96,627
AED 105,000
AED 70,615
AED 71,750
Villa/TownhouseApartment
AED 37,000
AED 53,000
AED 120,627
AED 90,100
AED 64,860
-5.1
AED 115,000
AED 70,000
AED 58,558
-7.7
AED 392,600
AED 189,000
AED 272,650
AED 177,320
AED 146,500
-4.0
-7.9
The MeadowsAED 267,720
AED 210,000
AED 175,560
-5.3
AED 58,640
AED 78,355
AED 99,255
Jumeirah Lakes Towers -6.3
AED 309,000
AED 250,000
AED 244,530
-6.4
AED 171,080
AED 153,240
-5.8
AED 179,200
AED 215,000
AED 230,000
-5.9
JumeirahIslands
AED 260,000
AED 348,800
-4.6Studio Rent 3 BR Rent
1 BR Rent 4 BR Rent
2 BR Rent 5 BR Rent
12 month % change 12 month % change
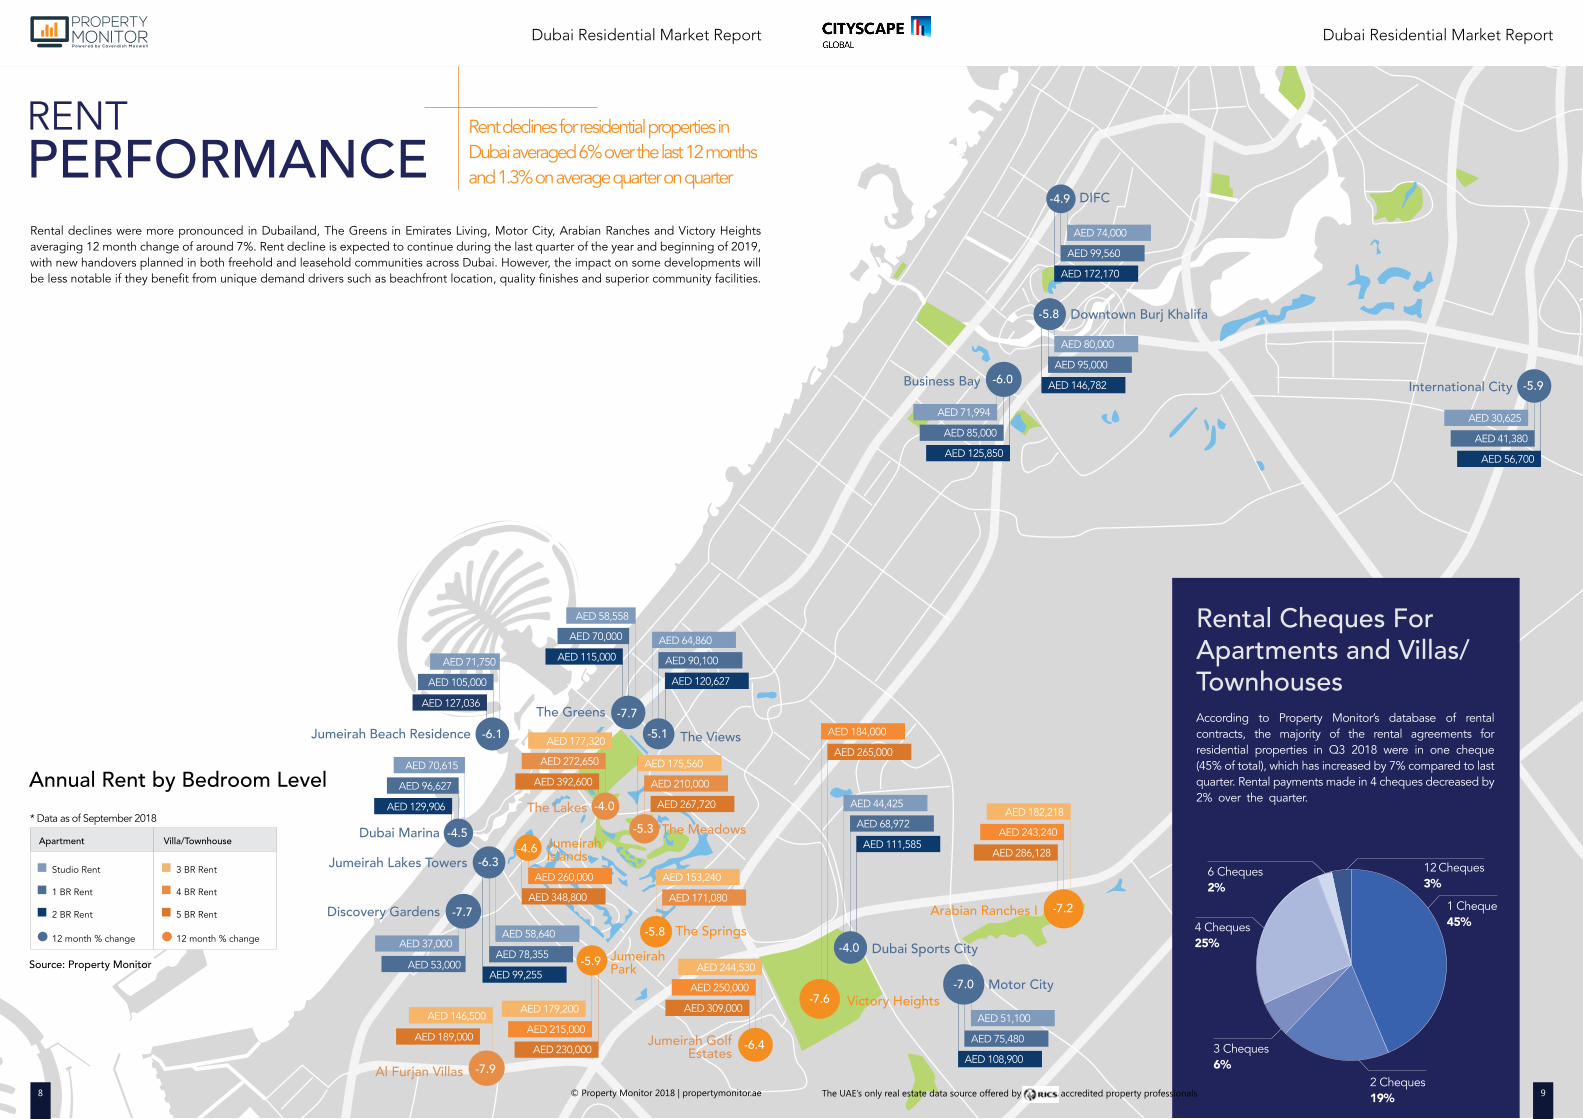
Rental declines were more pronounced in Dubailand, The Greens in Emirates Living, Motor City, Arabian Ranches and Victory Heights averaging 12 month change of around 7%. Rent decline is expected to continue during the last quarter of the year and beginning of 2019, with new handovers planned in both freehold and leasehold communities across Dubai. However, the impact on some developments will be less notable if they benefit from unique demand drivers such as beachfront location, quality finishes and superior community facilities.
* Data as of September 2018
Source: Property Monitor
8
Annual Rent by Bedroom Level
AED 74,000
AED 99,560
AED 172,170
Victory Heights
Arabian Ranches I
International CityBusiness Bay
Dubai Sports City
Downtown Burj Khalifa
Motor City
DIFC-4.9
AED 30,625
AED 111,585
AED 265,000
AED 71,994
AED 41,380
AED 68,972
AED 184,000
AED 85,000
AED 56,700
AED 44,425
AED 125,850
AED 80,000
AED 95,000
AED 146,782
AED 51,100
AED 75,480
AED 108,900
-5.8
-7.0
-5.9
-7.6
-4.0
-6.0
AED 286,128
AED 243,240
AED 182,218
-7.2
9
According to Property Monitor’s database of rental contracts, the majority of the rental agreements for residential properties in Q3 2018 were in one cheque (45% of total), which has increased by 7% compared to last quarter. Rental payments made in 4 cheques decreased by 2% over the quarter.
Rental Cheques For Apartments and Villas/Townhouses
1 Cheque45%
2 Cheques19%
3 Cheques6%
4 Cheques25%
6 Cheques2%
12 Cheques3%
The UAE’s only real estate data source offered by accredited property professionals© Property Monitor 2018 | propertymonitor.ae
RENTPERFORMANCE
Rent declines for residential properties inDubai averaged 6% over the last 12 monthsand 1.3% on average quarter on quarter
-7.7
-4.5
-6.1
© Property Monitor 2018 | propertymonitor.ae 1110
Dubai Residential Market Report Dubai Residential Market Report
The UAE’s only real estate data source offered by accredited property professionals
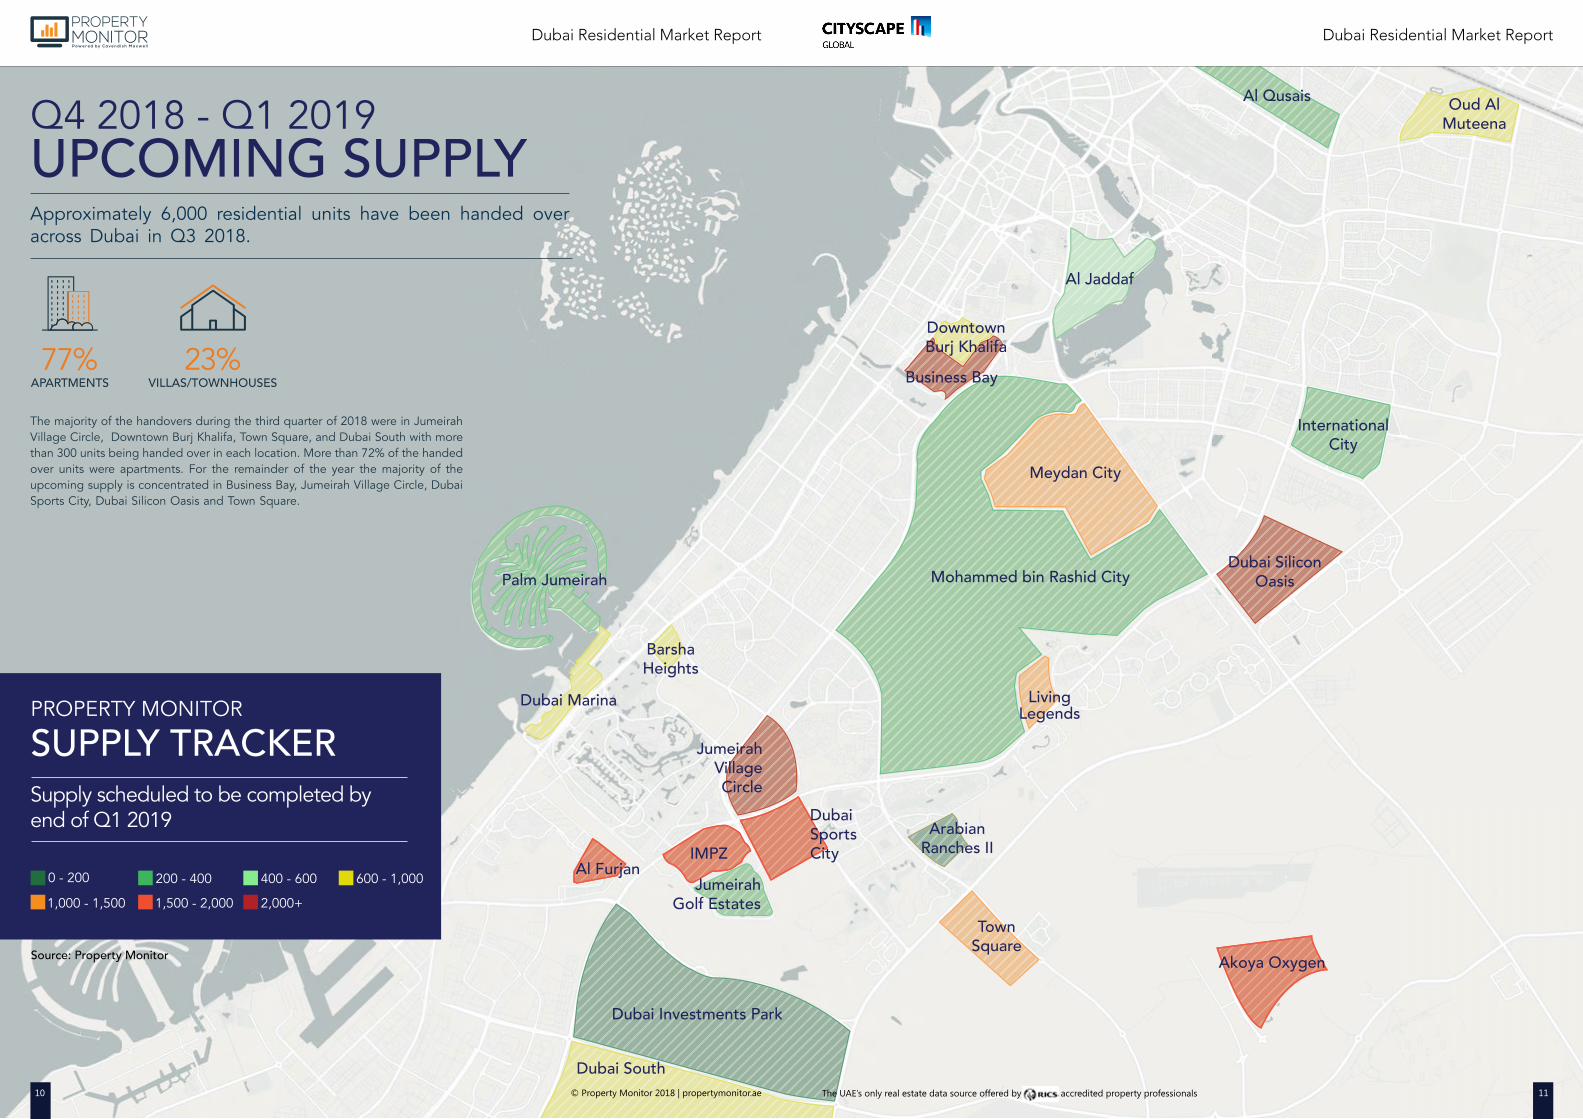
Q4 2018 - Q1 2019UPCOMING SUPPLY
VILLAS/TOWNHOUSES23%
APARTMENTS77%
Approximately 6,000 residential units have been handed over across Dubai in Q3 2018.
The majority of the handovers during the third quarter of 2018 were in Jumeirah Village Circle, Downtown Burj Khalifa, Town Square, and Dubai South with more than 300 units being handed over in each location. More than 72% of the handed over units were apartments. For the remainder of the year the majority of the upcoming supply is concentrated in Business Bay, Jumeirah Village Circle, Dubai Sports City, Dubai Silicon Oasis and Town Square.
© Property Monitor 2018 | propertymonitor.ae10
PROPERTY MONITOR
SUPPLY TRACKERSupply scheduled to be completed by end of Q1 2019
0 - 200 200 - 400 400 - 600 600 - 1,000
1,000 - 1,500 1,500 - 2,000 2,000+Jumeirah
Golf Estates
JumeirahVillageCircle
Dubai Investments Park
Dubai South
Al Furjan
Barsha Heights
Dubai Marina
Palm Jumeirah
Source: Property Monitor
11
Mohammed bin Rashid City
Akoya Oxygen
Dubai SiliconOasis
International City
Al Jaddaf
Al Qusais Oud Al Muteena
Meydan City
Arabian Ranches II
TownSquare
Living Legends
Dubai Sports CityIMPZ
Business Bay
DowntownBurj Khalifa
The UAE’s only real estate data source offered by accredited property professionals
© Property Monitor 2018 | propertymonitor.ae 1312
Dubai Residential Market Report Dubai Residential Market Report
The UAE’s only real estate data source offered by accredited property professionals
100
90
80
70
60
50
40
30
20
10
0
No.
of T
rans
fers
RESIDENTIAL SALESOVERVIEW
Wad
i Al S
afa
Dub
ai S
outh
Moh
amm
ed B
in
Rash
id C
ity
100
90
80
70
60
50
40
30
20
10
0
No.
of T
rans
fers
Emira
tes
Livi
ng
Vill
a N
ova
Ako
yaO
xyge
n
Al F
urja
n
Tow
n Sq
uare
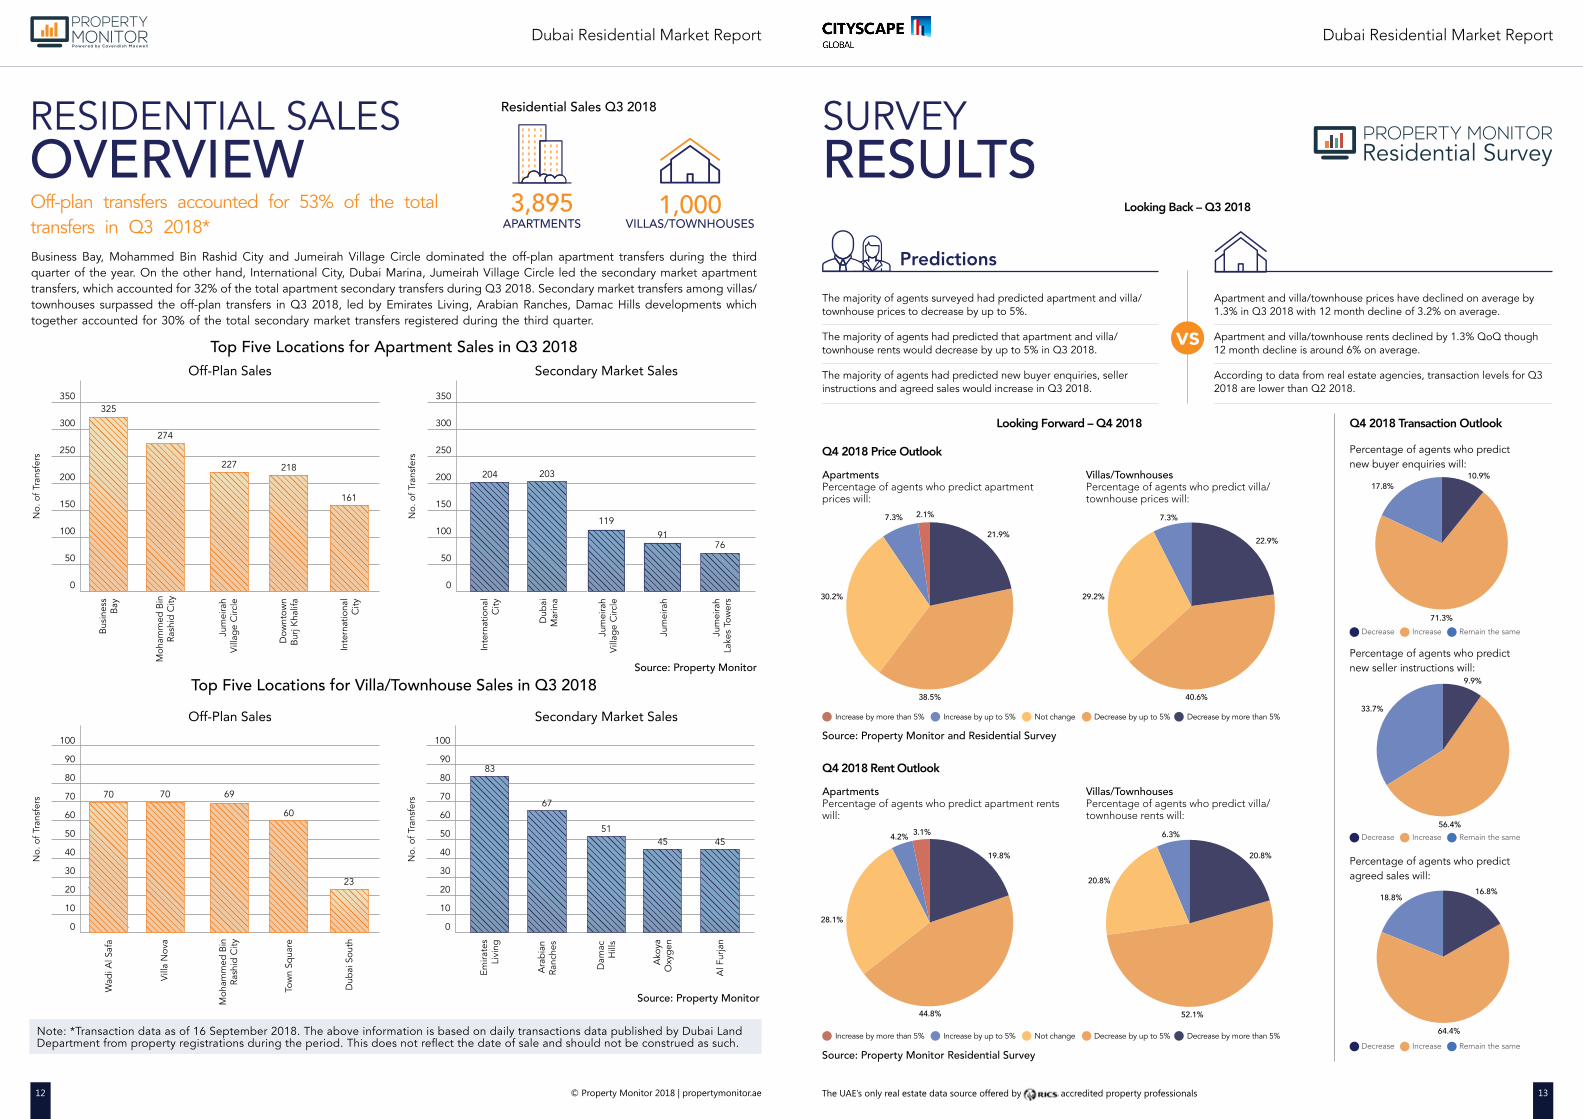
Business Bay, Mohammed Bin Rashid City and Jumeirah Village Circle dominated the off-plan apartment transfers during the third quarter of the year. On the other hand, International City, Dubai Marina, Jumeirah Village Circle led the secondary market apartment transfers, which accounted for 32% of the total apartment secondary transfers during Q3 2018. Secondary market transfers among villas/townhouses surpassed the off-plan transfers in Q3 2018, led by Emirates Living, Arabian Ranches, Damac Hills developments which together accounted for 30% of the total secondary market transfers registered during the third quarter.
VILLAS/TOWNHOUSES1,000
Off-Plan Sales
Secondary Market Sales
Secondary Market Sales
APARTMENTS3,895
Top Five Locations for Apartment Sales in Q3 2018
Residential Sales Q3 2018
Top Five Locations for Villa/Townhouse Sales in Q3 2018Source: Property Monitor
Source: Property Monitor
No.
of T
rans
fers
Off-Plan Sales
350
300
250
200
150
100
50
0
Bus
ines
sB
ay
Dow
ntow
nB
urj K
halif
a
Jum
eira
hV
illag
e C
ircle
325
274
227 218
161
70 70 69
60
23
83
67
5145 45
No.
of T
rans
fers
Inte
rnat
iona
lC
ity
350
300
250
200
150
100
50
0
Jum
eira
hV
illag
e C
ircle
Jum
eira
h
Jum
eira
hLa
kes
Tow
ers
204 203
11991
76D
ubai
M
arin
a
Off-plan transfers accounted for 53% of the total transfers in Q3 2018*
Ara
bian
Ranc
hes
Dam
acH
ills
Note: *Transaction data as of 16 September 2018. The above information is based on daily transactions data published by Dubai Land Department from property registrations during the period. This does not reflect the date of sale and should not be construed as such.
SURVEYRESULTS
vsThe majority of agents surveyed had predicted apartment and villa/townhouse prices to decrease by up to 5%.
Apartment and villa/townhouse prices have declined on average by1.3% in Q3 2018 with 12 month decline of 3.2% on average.
The majority of agents had predicted that apartment and villa/townhouse rents would decrease by up to 5% in Q3 2018.
Apartment and villa/townhouse rents declined by 1.3% QoQ though12 month decline is around 6% on average.
The majority of agents had predicted new buyer enquiries, seller instructions and agreed sales would increase in Q3 2018.
According to data from real estate agencies, transaction levels for Q32018 are lower than Q2 2018.
Predictions
Q4 2018 Price Outlook
Looking Forward – Q4 2018
Looking Back – Q3 2018
Q4 2018 Rent Outlook
ApartmentsPercentage of agents who predict apartment prices will:
ApartmentsPercentage of agents who predict apartment rents will:
Villas/TownhousesPercentage of agents who predict villa/townhouse prices will:
Villas/TownhousesPercentage of agents who predict villa/townhouse rents will:
Increase by more than 5% Increase by up to 5% Not change Decrease by up to 5% Decrease by more than 5%
Increase by more than 5% Increase by up to 5% Not change Decrease by up to 5% Decrease by more than 5%
Source: Property Monitor and Residential Survey
Source: Property Monitor Residential Survey
21.9%
30.2%
2.1%
38.5%
7.3%
3.1%
28.1%
44.8%
19.8%
4.2%
22.9%
29.2%
40.6%
7.3%
20.8%
20.8%
52.1%
6.3%
Q4 2018 Transaction Outlook
Percentage of agents who predict new buyer enquiries will:
Percentage of agents who predict new seller instructions will:
Percentage of agents who predict agreed sales will:
Decrease Increase Remain the same
Decrease Increase Remain the same
Decrease Increase Remain the same
17.8%10.9%
33.7%
56.4%
9.9%
16.8%
64.4%
18.8%
71.3%
Moh
amm
ed B
in
Rash
id C
ity
Inte
rnat
iona
lC
ity

© Property Monitor 2018 | propertymonitor.ae 1514
Dubai Residential Market Report Dubai Residential Market Report
The UAE’s only real estate data source offered by accredited property professionals
METHODOLOGYSale prices and rents are derived from Property Monitor (www.propertymonitor.ae), a real estate intelligence platform established by Cavendish Maxwell in 2014. Property Monitor provides real-time, market-wide transactional data and trends. Working with governments, agencies, banks, developers and corporate investors, it provides deeper insight into real estate advisory, investment, and lending activities. The average sales price per sq ft is based on the Property Monitor Index which incorporates signed contracts, registered transactions, valuations and listings verified by Cavendish Maxwell’s market leading valuation department.
Property Monitor Residential Survey is a quarterly study of agent opinion designed to identify residential market sentiment. This research highlights how new enquiries, leasing activity and transactions, among other metrics, change from quarter to quarter with agent predictions compared to actual real market performance.
Supply projections for residential projects are based on the Property Monitor Supply Tracker which tracks supply in real time, regular tracking of construction projects, new launches and delays. This is achieved through site inspections as well as regular feedback from developers, contractors, Cavendish Maxwell’s building consultancy team and related government entities.
Disclaimer:The information and analysis contained in this report has been obtained from a variety of sources generally regarded to be reliable and assumptions which are considered reasonable, and which were current at the time of undertaking market research, but no representation is made as to their accuracy or completeness. We reserve the right to vary our methodology and to edit or discontinue the indices at any time, for regulatory or other reasons.
The report and analysis does not purport to represent a formal valuation of any property interest and must not be construed as such. Such analysis including forward looking statements are opinions and estimates only and are based on a wide range of variables which may not be capable of being determined with accuracy. Variation in any one of these variables can have a material impact on the analysis and we draw your attention to this. Property Monitor does not accept any liability in negligence or otherwise for any loss or damage suffered by any party resulting from reliance on this report.
OUR PRODUCTS
PEOPLE
Jay Grant MSc IRRV (Hons) MRICSFounder and Chairman
Nigel Armstrong FMAATChief Executive Officer
Moe AbeidatChief Technology OfficerProperty Monitor
Sofia Underabi MRICS AAPIPartnerHead of Residential Valuation
Manika Dhama BA (Hons), MBAAssociate PartnerStrategic Consulting and Research
Andrew Love MA (Hons) MRICSPartnerHead of Investment and Commercial Agency
MarketData
PropertyMonitor Index
MarketStatistics
HeatMaps
Project andSupply Tracker
Service Feeindex
Agent Tools and Custom Reports
Bank Portfolio Review
Area Risk Matrix
ValuationTracker
Automated Valuation Model
(AVM)
Application Programming Interface (API)
Dubai
2205 Marina PlazaDubai MarinaP.O. Box 118624DubaiUnited Arab Emirates
T: +971 4 453 9525 E: [email protected]
Abu Dhabi
605 West Tower, Abu Dhabi MallTourist Club AreaP.O. Box 126609Abu DhabiUnited Arab Emirates
T: +971 2 448 4677E: [email protected]
Partners
Find us on
Muscat
Villa 836, Way 3012Al SaroojP.O. Box 3438MuscatSultanate of Oman
T: +968 99 445 917E: [email protected]
propertymonitor.ae
Property-Monitor